Using Steel Slag for Dissolved Phosphorus Removal: Insights from a Designed Flow-Through Laboratory Experimental Structure


1
Key Laboratory of Vegetation Restoration and Management of Degraded Ecosystems, South China Botanical Garden, Chinese Academy of Sciences, Guangzhou 510650, China
2
National Soil Erosion Research Laboratory, USDA-ARS, West Lafayette, IN 47906, USA
*
Author to whom correspondence should be addressed.
Water 2020, 12(5), 1236; https://doi.org/10.3390/w12051236
Submission received: 19 March 2020
/
Revised: 21 April 2020
/
Accepted: 22 April 2020
/
Published: 26 April 2020
(This article belongs to the Special Issue Advances and Challenges in Improving Water Quality with Phosphorus Removal Structures: Scaling Up to the Field)
Abstract
:Steel slag, a byproduct of the steel making process, has been adopted as a material to reduce non-point phosphorus (P) losses from agricultural land. Although substantial studies have been conducted on characterizing P removed by steel slag, few data are available on the removal of P under different conditions of P input, slag mass, and retention time (RT). The objective of this study was to investigate P removal efficiency as impacted by slag mass and RT at different physical locations through a horizontal steel slag column. Downstream slag segments were more efficient at removing P than upstream segments because they were exposed to more favorable conditions for calcium phosphate precipitation, specifically higher Ca2+ concentrations and pH. These results showed that P is removed in a moving front as Ca2+ and slag pH buffer capacity are consumed. In agreement with the calcium phosphate precipitation mechanism shown in previous studies, an increase in RT increased P removal, resulting in an estimated removal capacity of 61 mg kg−1 at a RT of 30 min. Results emphasized the importance of designing field scale structures with sufficient RT to accommodate the formation of calcium phosphate.
1. Introduction
Eutrophication is characterized by dissolved nutrient enrichment that stimulates the growth of aquatic plants and algae, which may cause issues such as oxygen depletion, drinking water shortages, and fishery and recreational water degradation [1,2]. Eutrophication is partly caused by increases in nitrogen and phosphorus (P) inputs, which are required nutrients for plant and algae growth [3]. Phosphorus is a primary limiting constituent, particularly in the dissolved reactive form, which is readily assimilated in aquatic ecosystems. Dissolved reactive P has been shown to be a major contributor to the re-eutrophication of Lake Erie, where an annual average of 2792 Mg dissolved P was deposited between 2009 and 2013 [4]. The source of the P is derived from both point and non-point sources discharged into surface water bodies. Dolan and Chapra [5] reported that approximately 70% of total P comes from non-point sources, mostly from surface runoff and tile drainage from agricultural lands. Thus, non-point sources of P have been identified as the main source of dissolved P and deserves great consideration for improving agricultural water quality.
One potential management strategy to reduce P export from agricultural fields is to remove dissolved P in surface runoff through use of sorption materials. Phosphorus sorption materials (PSMs) have a quick and strong ability to remove P from water. These PSMs are often byproducts of industrial or natural origin, such as steel slag [6], drinking water and mine drainage residuals [7], fly ash [8], bauxite waste [9], Fe oxides [10], and gypsum [11], which are rich in calcium, aluminum, or iron. The main mechanism for removing P is through adsorption onto metal oxides and oxyhydroxides, and precipitation as calcium phosphates, thus transforming dissolved P into an insoluble state [12,13,14]. A P removal structure constructed with PSMs is considered an engineering technology for reducing P loss. Types of P removal structure include modular boxes, buried beds and ditch filters, which have proven to be an effective practice for reducing dissolved P in surface runoff [6,15]. The type of P removal mechanism can influence the design of a P removal structure, due to the speed and efficiency of the various reactions. Specifically, this is manifested in the necessary retention time (RT) and PSM mass required for a structure.
Tile drainage is a common management practice implemented on agricultural lands with poorly drained or high subsurface water tables. Tiles or pipes buried below the soil surface are designed to remove excess water in the plant root zone, thereby leading to suitable condition for growing crops, management, and harvest operations. King et al. [16] estimated that approximately 1.8–2.8 × 10⁵ km2 of cropland are tile drained in the US Midwest. Although substantial improvements in crop productivity have resulted from tile drainage, it has also caused adverse environmental impacts. On one hand, tile drainage can reduce surface runoff and soil erosion, and consequently minimizes P loss in runoff. On the other hand, artificially drained water through the tiles may increase total drainage yield from a watershed. Numerous studies in the midwest of the US have investigated the proportion of tile drainage water in total watershed discharge. It has been estimated that 42–86% of stream water in agricultural watersheds comes from tile drainage [16]. Similarly, Williams et al. [17] investigated the contribution of tile drainage to total discharge in the Upper Big Walnut Creek watershed at NE Indiana and found that the proportion of discharge by tile drainage reached 47%. Since a large amount of watershed discharge is attributed to tile drainage, it is conceivable that a substantial portion of dissolved P is exported via tile drainage.
Traditionally, surface runoff is regarded as the principal pathway for the transport of P from agricultural lands [18]. However, Smith et al. [19] found that 25–80% of the dissolved P was loaded by tile drainage from agricultural fields in the St. Joseph River watershed in northeast Indiana. Moreover, Ruark et al. [20] reported that tile drainage contributed 16–58% of the dissolved P export in Wisconsin. Gentry et al. [21] also investigated dissolved P transport from agricultural lands to streams in the tile-drained Big Pitch watershed of the Sangamos River in east-central Illinois. Thus, tile drains represent a potential interception point with regards to reducing dissolved P loads.
Flow-through experiments have emerged as an important and common technique to evaluate PSMs in reducing P loads to surface water [7]. Field and laboratory flow-through experiments demonstrated that steel slag possesses an appreciable capacity to reduce P [15,22,23,24]. As an alternative to a single segment flow-through setup, this study proposed a multisegmented flow-through experimental design to investigate P and steel slag interactions, throughout the length of the slag bed. The objectives of this study were (i) to assess the P removal efficiency impacted by slag mass and RT, and (ii) investigate changes in P and Ca concentrations and pH, as water moves through a horizontal slag column. An improved understanding of these objectives will provide additional insights into how slag is able to remove dissolved P from flowing water, thus improving our ability to design more effective P removal structures in the field.
2. Materials and Methods
2.1. Experimental Equipment Description
This experiment was conducted at the Agricultural Research Service, National Soil Erosion Research Laboratory, located in West Lafayette, Indiana, US. In this study, electric arc furnace (EAF) steel slag was used as the PSM and obtained from Edw. Levy Company, Dearborn, MI (US). Steel slag, a byproduct of steel making, is produced during the separation of the molten steel from impurities in steel-making furnaces. These impurities consist of carbon as gaseous carbon monoxide, and liquid oxides of silicon and manganese, which combine with lime (CaO) to form the solid steel slag. The principal components of steel slag are limestone (CaO content: 28–55%) and silica (SiO2 content: 12–34%). Many applications utilizing the physical and chemical characteristics of steel slag have been developed to use in a broad range of fields. In this study, the experimental steel slag was equilibrated in deionized (DI) water for 24 h with the subsequent solution analyzed via inductively coupled plasma optical emission spectroscopy (ICP-OES, Optima 8300, Perkin Elmer, USA) to determine the solubility of several elements using standard wavelengths specified by the manufacturer. The results showed that the concentration of Ca, Si, Al, K, and Zn were 32.95, 20.82, 0.34, 0.29, and 0.02 mg L−1, respectively. Previous studies have shown that EAF steel slag does not release trace metals to solution at appreciable concentrations [22,24,25]. Since un-sieved steel slag would decrease the hydraulic conductivity in flow-through experiments [15], air-dried steel slag was sieved at 5–8 mm and prepared for the study.
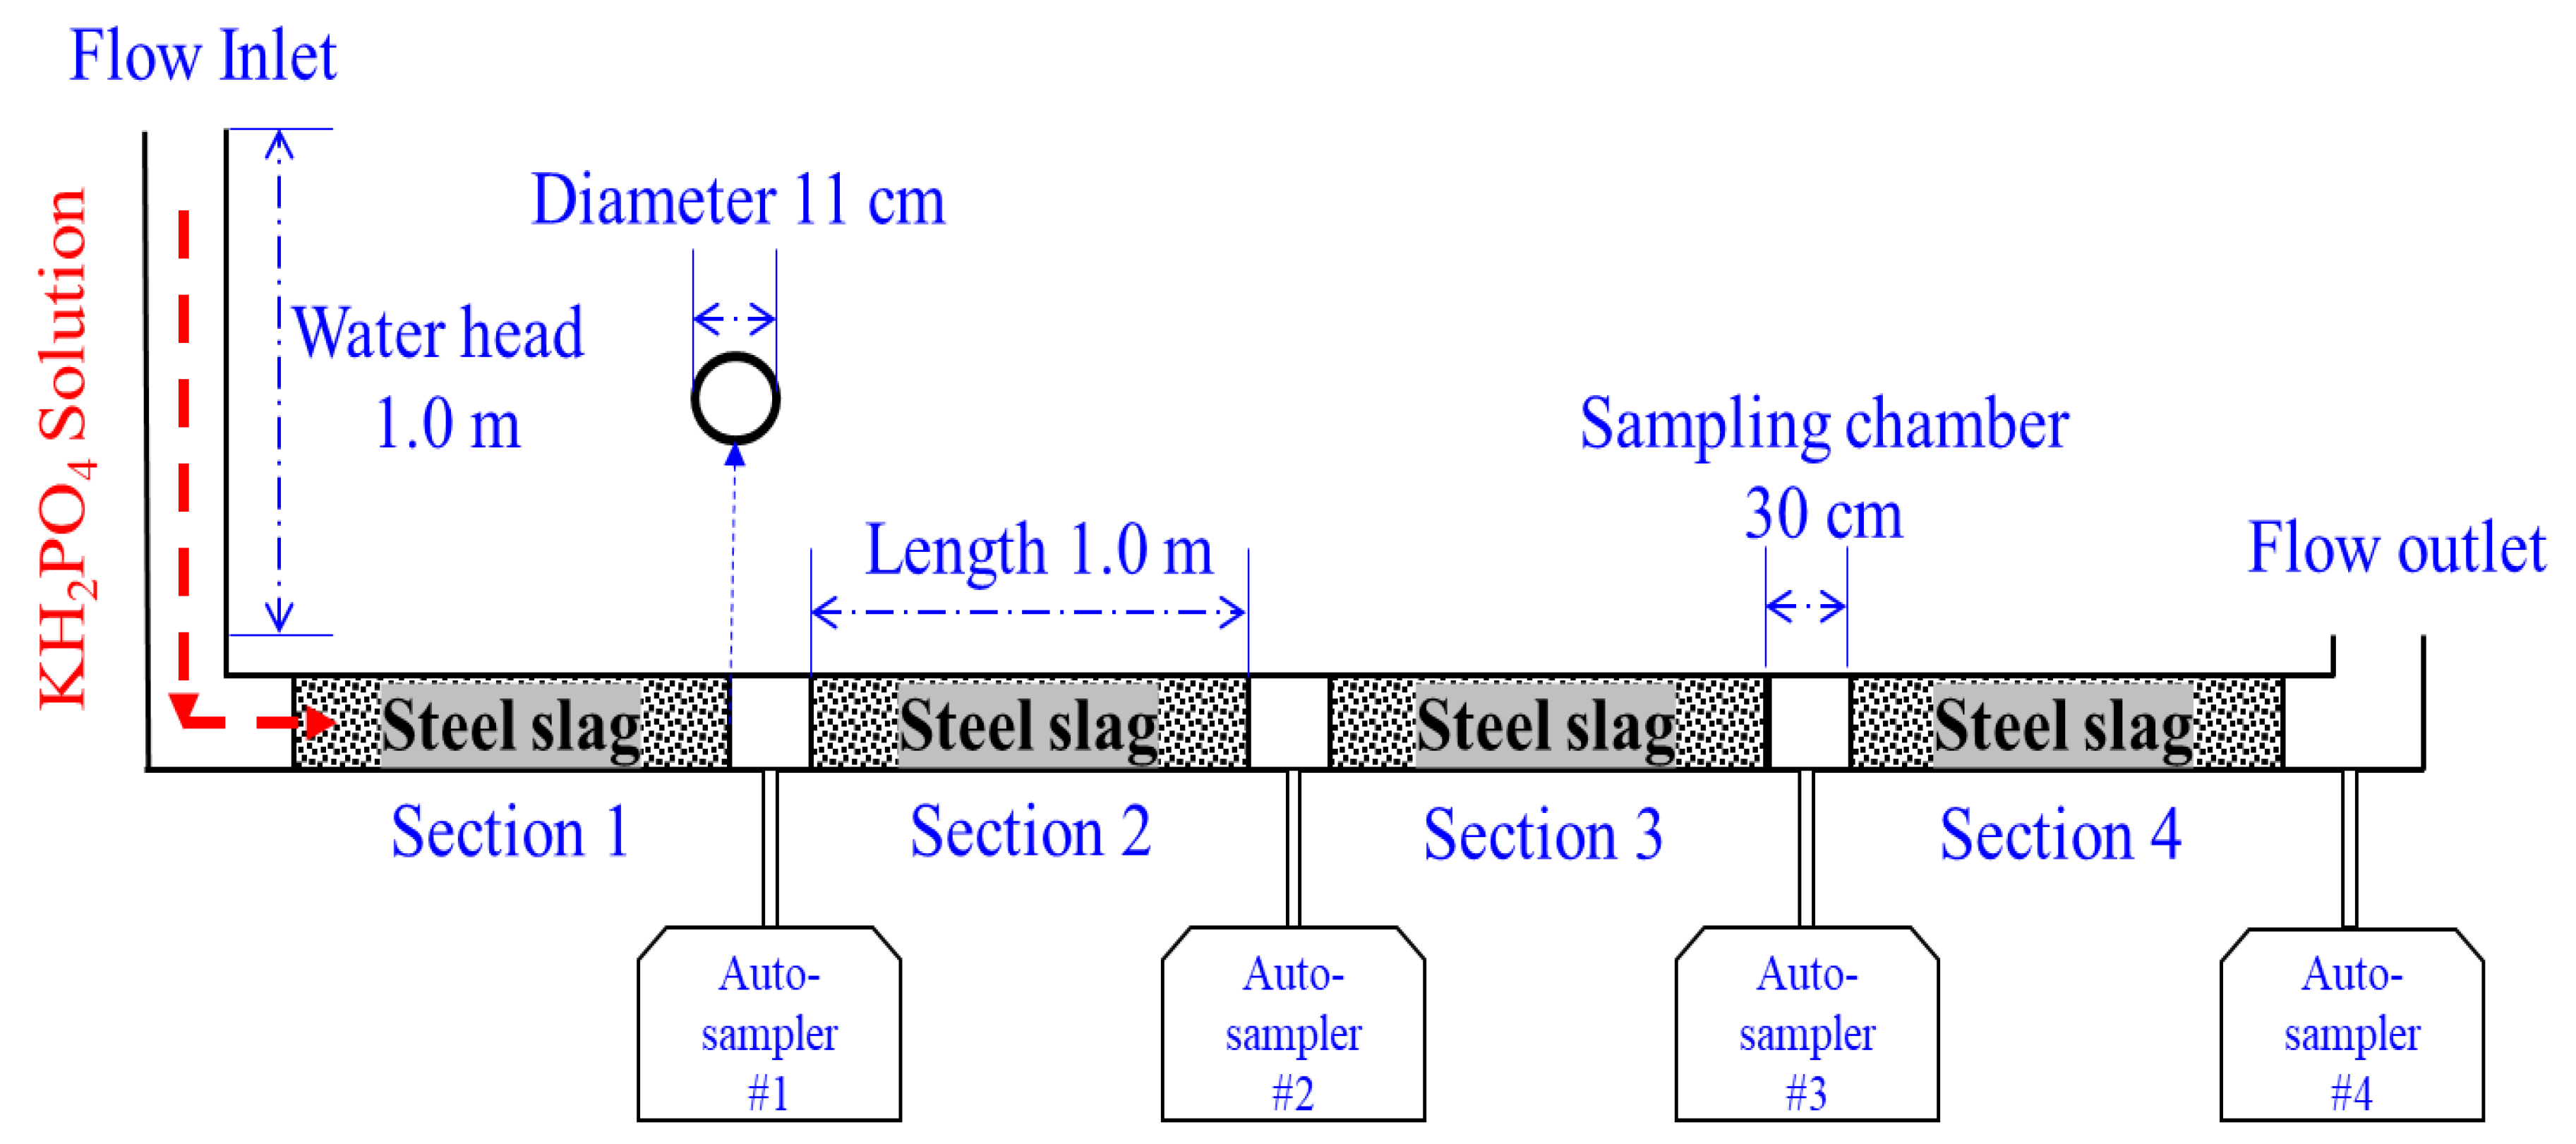
To better understand the process of dissolved P removal by steel slag, this experiment was conducted using multisegmented flow-through columns constructed with PVC pipes. This setting included four filter segments (S1, S2, S3, and S4), sampling chambers, autosamplers, water tank, pump, and plastic connection pipes. Each flow-through segment consisted of 1 m long and 11 cm diameter pipe. To retain the steel slag in the 1 m pipe segment, a steel mesh (<2 mm) was attached to the inflow side, and a perforated cap was installed at the discharge side. A 30 cm long segment was used for connecting each 1 m segment and also served as the sampling chamber (Figure 1). At the end of each 1 m test segment, an autosampler was used to collect water samples for laboratory analysis. At the end of this 4-segment flow column, drainage occurred through a vertical pipe to ensure a submerged condition for the steel slag during the flow-through experiment (Figure 1). The flow inlet segment was a 1 m vertical PVC pipe with an overflow pipe to keep a constant water head and a stable flow rate (Figure 1). The excess water at the flow inlet drained back to the water tank.
2.2. Flow-Through Experiments
2.2.1. Preparation
Fifteen kilograms of steel slag was packed into each segment. Before starting the flow-through experiment, a flow test was conducted for each 1-m segment to avoid interference from porosity differences on flow rate. It was assumed equal porosity in each segment when there were no significant differences in the flow rate among each single segment. Afterwards, four segments were connected and prepared for the flow-through experiment.
2.2.2. Sampling and Measurement
In this study, the P concentration and load are referred to as dissolved P (PO43−-P). The inflow P solution was prepared by adding potassium dihydrogen phosphate (KH2PO4) to DI water and thoroughly mixing the solution in the water tank. Two target P inflow concentrations were examined (2.5 and 5.0 mg L−1) and labeled as Pconc.0. All flow-through experiments were duplicated for each P concentration. To ensure all segments reached an equilibrium state, the flow-through experiment was conducted for 2 h. The inflow P solution was collected every 30 min from a valve at the inlet and was used to measure the initial P concentration and pH. The autosampler was programmed to take a composite sample every 6 min, consisting of three subsamples collected at 2nd, 4th, and 6th minute mark. After each 2 h experiment, all samples were divided into two parts. One part for pH measurement and the other was immediately filtered through a 0.45 μm nylon filter (Waltham, Thermo Fisher Scientific, US) using a syringe, for subsequent elemental analysis. Ten milliliters were poured into an acid-washed bottle. Then, samples were acidified with concentrated nitric acid (HNO3) for preservation. All the acidified samples were stored in a 4 °C cooler. Consider that formation of calcium phosphate is the dominant P removal mechanism for slag [26,27,28,29]:
Ca2+ + H2PO4− + 2H2O ←→ CaHPO4 (brushite) + H+
Thus, all samples were analyzed for P (wavelength: 213.617 nm) and Ca2+ (wavelength: 317.933 nm) concentration by ICP-OES.
2.2.3. Flow Rate Measurement
The discharge flow rate was measured every 30 min using a bucket and stopwatch during the 2 h flow-through experiment. The results showed that the flow discharge rate was 0.13 L s−1 under the condition of 1.0 m high water head inflow solution. In addition, the RT represents the time required for the solution water to pass through a filter segment. Thus, the RT can be calculated based on the flow rate, segment volume, and steel slag porosity in each segment, as shown in Table 1.
2.3. Data Analysis
The P loading into each segment is a function of the P concentration (mg L−1) and volume of water (L) treated. With the 4-segment design and sample collection at the end/beginning of each flow segment, a wide range of testing scenarios can be achieved in a single run, i.e., single (S1, S2, S3, and S4), double (S1 + S2, S2 + S3, and S3 + S4), triple (S1 + S2 + S3 and S2 + S3 + S4), and quadruple (S1 + S2 + S3 + S4) segments. Accordingly, Table 1 shows the filter length, steel slag mass and RT in each scenario. Consequently, one flow-through run contains ten testing scenarios on how steel slag may affect P transport.
With the known inflow and outflow P concentrations and flow rate for each testing segment, the P added to a filter segment at each time interval was calculated by integrating the tested inflow P concentration with the flow volume. The P load after treatment by a segment at each time interval was calculated by integrating the tested outflow P concentration with the flow volume. The P (mg kg−1) added to the structure was calculated using the inflow P concentration, flow rate, time interval and steel slag mass. Phosphorus removal and efficiency can be calculated according to a simple mass balance:
where Q (L min−1) is the flow rate; M (kg) is the mass of the steel slag in a scenario; Pconc.In and Pconc.Out (mg L−1) are the inflow and outflow P concentration; Prem.(mg kg−1) and Prem.(%) is the dissolved P removal expressed in terms of slag mass or percentage of inflow P over a certain flow interval time. To present the relationship between the total input P (mg kg−1) and P removal (mg kg−1) or P removal efficiency (%), we used the exponential model [30,31]:
where TPrem. (mg kg−1) is the amount of total P removed for any given value of TPadd (mg kg−1), which is the total P input expressed per unit mass of steel slag. Prem.MAX (mg kg−1) is the estimated maximum P retention capacity. TPrem. (%) is the P removal efficiency for a given value of TPadd. The variables a, b, and k are constants. The regression model was constructed using SPSS (Statistics Package for Social Science) [32]. The corresponding figures were developed using Sigma Plot 10.0 [33].
3. Results and Discussion
3.1. Dynamic Changes of Phosphorus Removal by Steel Slag
Figure 2a and b shows the changes in P concentrations after flowing through each filter segment (Table 2) under various inflow conditions. The P concentration drastically increased during the first 15 min before coming to a steady concentration for the remaining period, as also observed by Hua et al. [34] and Yin et al. [35] using steel slag via column experiments. Meanwhile, the discrete removal also decreased with time (i.e., P loading) and varied as a function of the segment length (i.e., slag mass; Figure 3). The discrete P removal efficiency for a single segment was between 15% and 92%, with an average of 33% P removed under the 2.5 mg L−1 inflow. For an initial P concentration of 5.0 mg L−1, the P removal efficiency varied in the range of 9% to 85%, with an average of 24% P reduced in a single segment. In general, the 5 mg L−1 inflow P concentration had overall lower removal efficiency for any given time compared to the 2.5 mg L−1 concentration, due to the fact that the higher inflow P concentration loaded twice the amount of P to the slag. However, when normalized for slag mass, the P removal efficiency was similar for the two different inflow P concentrations.
Phosphorus removal for the second, third, and fourth segment was initially low before increasing to much higher levels, unlike the first segment (Figure 3). This was due to the fact that initially, the P concentration entering into the second, third, and fourth segments were very low as they came from output of the first, second, and third segments, respectively (Figure 2), while the first segment received a constant inflow concentration of either 2.5 or 5 mg L−1. Based on the thermodynamic equilibrium shown in Reaction 1, a lesser P concentration has less chemical potential for precipitating calcium phosphate. Notice that reaction 1 involves protons, such that an increase in protons (i.e., decrease in pH) will push the reaction to the left and prevent calcium phosphate precipitation. Reaction 1 also illustrates the fact that precipitation of calcium phosphate will depress the pH by producing protons. Clearly, a decrease in soluble calcium and P will reduce the potential for calcium phosphate to precipitate. In all cases, P removal decreases with time and P loading (Figure 3) because soluble Ca is being depleted and pH is decreasing (Equation (1); Figure 2c–f). Electric arc furnace steel slag is an appreciable source of soluble calcium with total and water soluble concentrations of large particles (i.e., what was used in the current study) ranging from 160 to 340 g kg−1 and 250 to 5000 mg kg−1, respectively [22,25,31].
The differences in Ca2+ and pH between the segments explain the differences in P removal, specifically the observation that P removal efficiency increased with segment number. For example, notice that pH and Ca2+ increase with segment, i.e., the previous segment depleted more Ca2+ and depressed pH more than the downstream segment, meaning better conditions for calcium phosphate precipitation occurred in the downstream segments (Figure 2c–f) as Ca2+ flowed out of each segment and contributes to the P removal in the following segment. Downstream segments not only accumulated Ca2+ from the previous segment, but also consumed less Ca2+ because the lower dissolved P concentration flowing into them required less Ca2+ for calcium phosphate precipitation compared to upstream segments that received higher input dissolved P concentrations. Keep in mind that slag had a finite ability to provide soluble Ca and buffer the pH to a high level, and therefore P removal will correspond to the remaining soluble Ca and elevated pH that can be provided as Ca and pH are diminished with further P removal (Reaction 1, Figure 2 and Figure 3, and Table 2). These results are also supported by McGrath et al. [36], who reported that a decreased P removal was accompanied by a lower pH and Ca2+ concentration in solution.
Similarly, Figure 4 and Table 1 illustrates cumulative P removed (CPrem) as a function of cumulative P added (CPadd) for individual segments and a combination of several segments. The slope of each line quantifies the ability of each segment scenario to remove dissolved P; the larger the slope, the greater the amount of CPrem for any given CPadd value. Notice that among each individual segment (Table 1), the slope value (i.e., k value) increased in the order of segment 1 < 2 < 3 < 4, indicating a greater ability to remove dissolved P. As previously discussed, the greater ability of the downstream segments to remove dissolved P when normalized on a cumulate per mass basis compared to upstream segments is due to the higher solution pH and Ca2+ levels that flow into the downstream segments (Figure 2c–f and Table 2). Figure 4 shows the same phenomenon for any number of segments; in every case, the downstream segments possessed greater slopes and therefore were more efficient in P removal compared to the upstream segments.
In this regard, these results clearly revealed that P removal in slag proceeds as a “front” as P-rich water flows through the slag columns, in the same manner that Ca2+ and pH are depleted in that same moving front. Eventually with continued loading, the entire slag column will become equilibrated and contain similar concentrations of solution P, Ca2+, and pH.
3.2. Total P Removal under Varied Steel Slag Mass and Phosphorus Input
Although the initial influent P concentrations were 2.5 and 5.0 mg L−1, the average influent P concentration of each segment ranged from 0.9 to 4.9 mg L−1. The RTs were 33, 66, 99, and 132 s, corresponding to the single, double, triple, and quadruple segments, respectively (Table 1 and Figure 1). Retention time was proportionally increased with the filter mass due to a greater total pore volume.
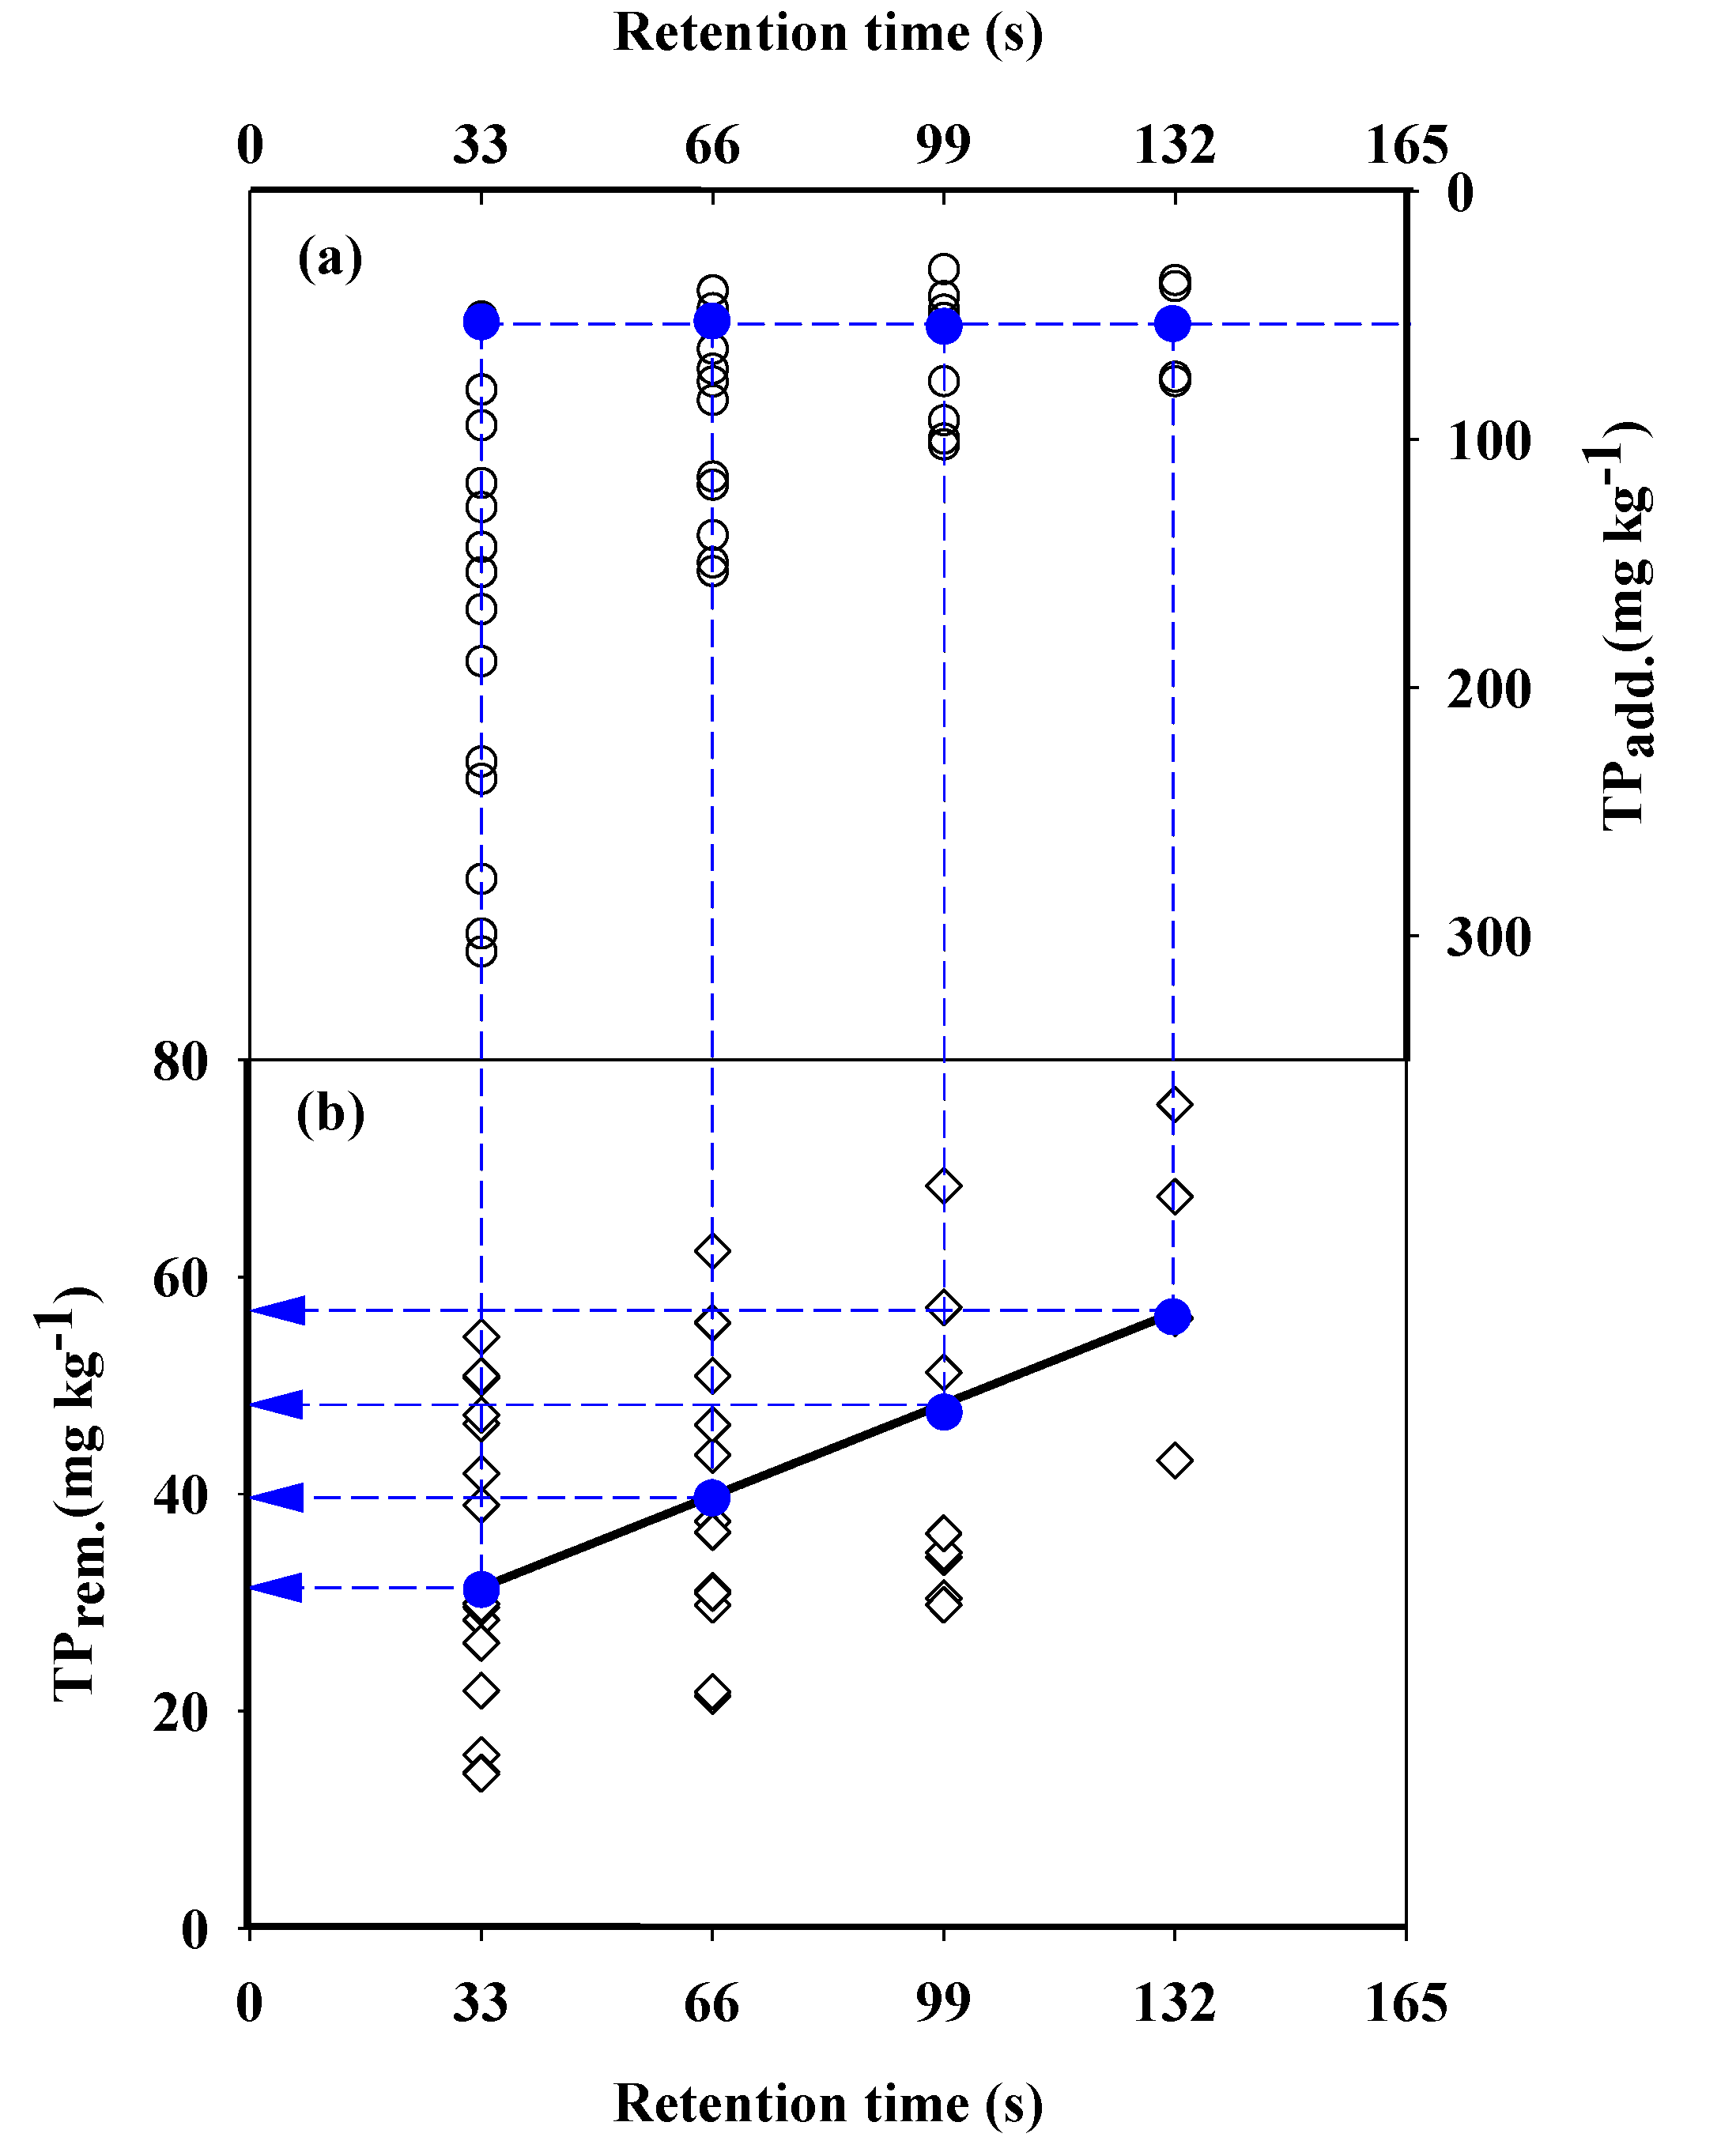
With regard to the impact of RT, Figure 5 allows for comparison since the P removal resulting from combination of different segments was normalized as a function of slag mass (i.e., TPadd in units of mg kg−1). For example, while each individual segment possessed the same RT of 33 seconds, a combination of segments would increase the RT accordingly (Table 1). However, since an increasing number of segments also possess an increasing mass (Table 1), it is necessary to first normalize P addition and P removal based on slag mass. Obviously, a larger slag mass, such as two segments (30 kg), will remove more P than any single segment (15 kg), and normalization for slag mass allows for a true comparison of RT. For example, at an inflow P concentration of 5 mg L−1, total addition of 50 mg P kg−1 slag results in cumulative P removal of 58, 49, 40, and 32 mg kg−1 for quadruple, triple, double, and single segments, respectively (Figure 5), representing RT of 132, 99, 66, and 33 s. In general, P removal increased with increased RT (i.e., segment length normalized for slag mass). These findings are consistent with the results reported by Yin et al. [35], who stated that an enhanced RT could achieve a higher P removal under flow-through conditions. Additionally, Barca et al. [37] concluded that the limited availability of Ca2+ released from a smaller amount of steel slag and shorter RT caused a lower P removal efficiency, as observed in the scenarios with the single or double segments in this study. Consequently, these results affirm those of Stoner et al. [7] and Penn et al. [31] that a longer RT will increase dissolved P removal in electric arc furnace steel slag. The increased P removal with increasing RT is a consequence of the P sorption mechanism, which in this case is calcium phosphate precipitation.
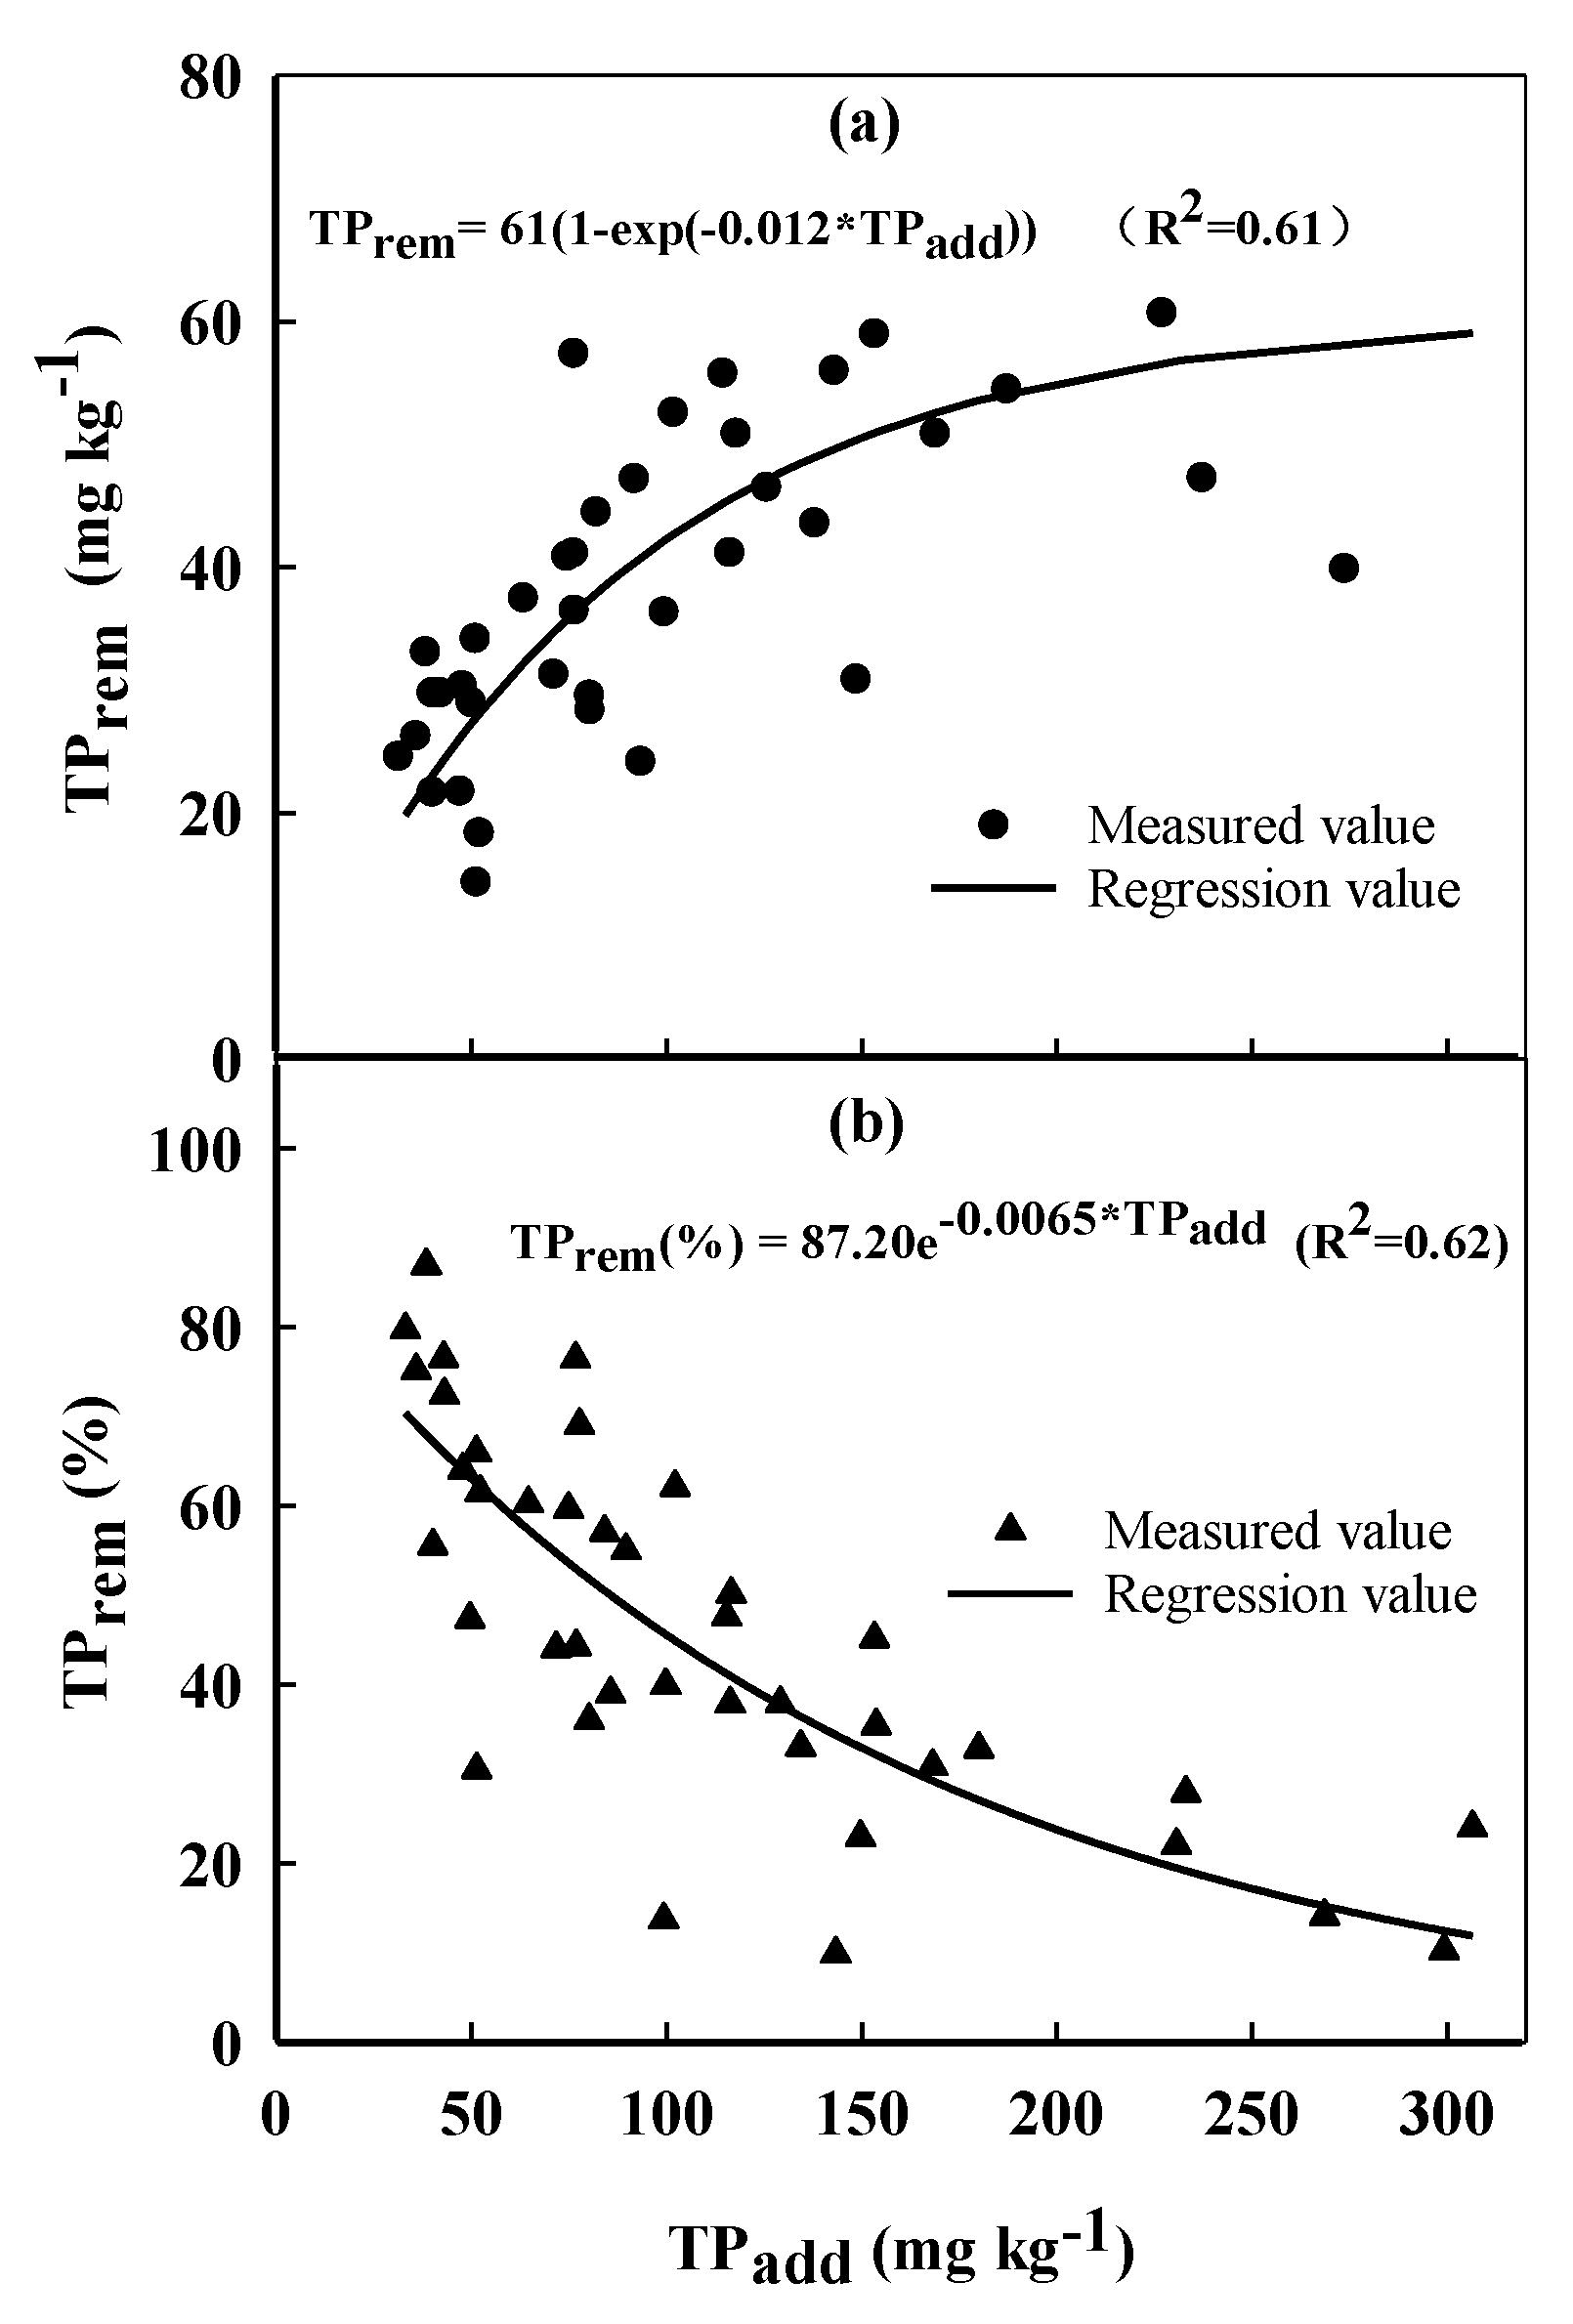
In addition, P removal capacity is a fundamental factor for designing P removal structures, which was 60 mg kg−1 in this study (via Equation (4)), as shown in Figure 6a. In comparison, Table 3 summarizes previously reported P removal capacity of steel slag under the conditions indicated for each study such as inflow P concentrations, RT, and laboratory vs. field scale. Generally, the tested steel slag mass, RT, and experimental methods varied widely. Even with the variation in scale, inflow P concentrations, and variations between the slag materials itself, Table 3 supports our results in that longer RTs promote greater P removal. For treating non-point drainage water, structures with a relatively short RT are necessary due to the high flow rates and need to limit the footprint of the structures. Therefore, the results of the current study, along with Penn et al. [31], Penn et al. [22], and Klimeski et al. [30] illustrate that under a short RT (i.e., less than 30 min), P removal is expected to be in the range of 20–60 mg kg−1, depending on the characteristics of the slag material and inflow P concentrations. Penn et al. [15] illustrated that P removal among different slag materials will vary dramatically based on their ability to buffer pH to a high level and supply soluble Ca, as well as the RT and inflow P concentration chosen to be employed. Therefore, further study is needed to optimize the relationship between the removal efficiency, RT, steel slag mass, and its costs for designing a P removal structure.
Figure 6 shows the relationship between the total added P and P removal for all segment lengths. Each point represents the ratio of the total removed to the total added P during a 2 h flow-through experiment. The solid line shows the exponential relationship derived from the experimental data. Knowing the P loading via tile drainage water in a specific agricultural field and the desired lifetime for a structure, one can determine the steel slag mass needed to achieve a desired P removal goal [15,38]. For example, Algoazany et al. [39] investigated dissolved P transport through tile drains from an intensively tile-drained field in the Little Vermilion River watershed, eastern Illinois, USA. The average annual P load was 160, and 116 g P ha−1 y−1 from two agricultural fields with an area of 4.86 and 3.34 ha, respectively, from 1994 to 2000. For a hypothetical P removal structure constructed with the same slag utilized and a 50% P removal goal of the 5-y load, the estimated required steel slag mass is 45 and 22 Mg for these two fields, respectively. Thus, these results provide information for designing a filter unit for a specific tile-drained field site with a given P loading mass, and desired structure lifetime and removal efficiency.
4. Conclusions
This study was conducted to investigate P removal using a steel slag filter test column separated into four segments in order to further elucidate the process of P removal. As expected, P concentration decreased with filter segment length due to contact with an increasing mass of slag, which provided less opportunity for downstream segments to remove P. Similarly, Ca2+ and pH decreased with further exposure to P in all segments, and were greater in downstream segments compared to upstream segments, illustrating how Ca2+ was consumed and H+ was produced with precipitation of calcium phosphate. Downstream slag segments were more efficient at removing P than upstream segments because they were exposed to more favorable conditions for calcium phosphate precipitation, specifically higher Ca2+ concentrations and pH. These results showed that P was removed in a moving front as Ca2+ and slag pH buffer capacity were consumed. When P input and removal was normalized for mass of slag, an increase in RT increased P removal, concomitant with the calcium phosphate precipitation mechanism shown in previous studies. The estimated removal capacity of the steel slag was 61 mg kg−1, which was similar to previous studies conducted on slag samples with a similar RT (less than 30 min) and particle size (>5 mm). Results emphasize the importance of designing field scale structures with sufficient RT to accommodate the formation of calcium phosphate.
Author Contributions
Conceptualization, C.-h.H. and L.W.; methodology, S.L. and L.W.; formal analysis, L.W.; writing—original draft preparation, L.W.; writing—review and editing, C.-h.H., C.P. and J.Y.; supervision, C.-h.H., and C.P.; project administration, C.-h.H.; funding acquisition, C.-h.H. All authors have read and agreed to the published version of the manuscript.
Funding
This research was funded by National Soil Erosion Research Laboratory-USDA.
Acknowledgments
We thank Crumley Amber, Hofmann Brenda, Graef Rhonda and McAfee Scott for their help during the flow through experiments and laboratory analysis.
Conflicts of Interest
The authors declare no conflict of interest.
References
- Smith, V.H.; Schindler, D.W. Eutrophication science: Where do we go from here? Trends Ecol. Evol. 2009, 24, 201–207. [Google Scholar] [CrossRef]
- Schindler, D.W. Recent advances in the understanding and management of eutrophication. Limnol. Oceanogr. 2006, 51, 356–363. [Google Scholar] [CrossRef] [Green Version]
- Bennett, E.; Carpenter, S.; Caraco, N. Human impact on erodable phosphorus and eutrophication: A global perspective. BioScience 2001, 51, 227–234. [Google Scholar] [CrossRef]
- Maccoux, M.J.; Dove, A.; Backus, S.M.; Dolan, D.M. Total and soluble reactive phosphorus loadings to Lake Erie. J. Great Lakes Res. 2016, 42, 1151–1165. [Google Scholar] [CrossRef] [Green Version]
- Dolan, D.M.; Chapra, S.C. Great Lakes total phosphorus revisited: 1. Loading analysis and update (1994–2008). J. Great Lakes Res. 2012, 38, 730–740. [Google Scholar] [CrossRef]
- Penn, C.J.; Bryant, R.B.; Kleinman, P.J.A.; Allen, A.L. Removing dissolved phosphorus from drainage ditch water with phosphorus spring materials. J. Soil Water Conserv. 2007, 62, 269–276. [Google Scholar]
- Stoner, D.; Penn, C.J.; McGrath, J.; Warren, J. Phosphorus Removal with By-Products in a Flow-Through Setting. J. Environ. Qual. 2012, 41, 654–663. [Google Scholar] [CrossRef]
- Gustafsson, J.P.; Renman, A.; Renman, G.; Poll, K. Phosphate removal by mineral-based sorbents used in filters for small-scale wastewater treatment. Water Res. 2008, 42, 189–197. [Google Scholar] [CrossRef] [Green Version]
- Hedstrom, A. Reactive filter systems for small scale wastewater treatment: A literature review. Vatten 2006, 62, 253–263. [Google Scholar]
- Lyngsie, G.; Borggaard, O.; Hansen, H.C.B. A three-step test of phosphate sorption efficiency of potential agricultural drainage filter materials. Water Res. 2014, 51, 256–265. [Google Scholar] [CrossRef]
- Feyereisen, G.W.; Francesconi, W.; Smith, D.R.; Papiernik, S.K.; Krueger, E.S.; Wente, C.D. Effect of Replacing Surface Inlets with Blind or Gravel Inlets on Sediment and Phosphorus Subsurface Drainage Losses. J. Environ. Qual. 2015, 44, 594–604. [Google Scholar] [CrossRef] [PubMed]
- Shilton, A.; Chen, L.; Elemetri, I.; Pratt, C.; Pratt, S. Active slag filters: Rapid assessment of phosphorus removal efficiency from effluent as a function of retention time. Environ. Technol. 2013, 34, 195–200. [Google Scholar] [CrossRef]
- Penn, C.J.; Bryant, R.B.; Callahan, M.P.; McGrath, J. Use of Industrial By-products to Sorb and Retain Phosphorus. Commun. Soil Sci. Plant Anal. 2011, 42, 633–644. [Google Scholar] [CrossRef]
- Pratt, C.; Shilton, A.; Pratt, S.; Haverkamp, R.G.; Bolan, N. Phosphorus Removal Mechanisms in Active Slag Filters Treating Waste Stabilization Pond Effluent. Environ. Sci. Technol. 2007, 41, 3296–3301. [Google Scholar] [CrossRef]
- Penn, C.J.; Bowen, J.; McGrath, J.; Nairn, R.W.; Fox, G.; Brown, G.; Wilson, S.; Gill, C. Evaluation of a universal flow-through model for predicting and designing phosphorus removal structures. Chemosphere 2016, 151, 345–355. [Google Scholar] [CrossRef] [PubMed] [Green Version]
- King, K.W.; Williams, M.R.; Fausey, N.R. Contributions of systematic tile drainage to watershed-scale phosphorus transport. J. Environ. Qual. 2015, 44, 486–494. [Google Scholar] [CrossRef]
- Williams, M.R.; King, K.W.; Fausey, N.R. Contribution of tile drains to basin discharge and nitrogen export in a headwater agricultural watershed Agric. Water Manag. 2015, 158, 42–50. [Google Scholar] [CrossRef]
- Dougherty, W.J.; Fleming, N.K.; Cox, J.W.; Chittleborough, D.J. Phosphorus Transfer in Surface Runoff from Intensive Pasture Systems at Various Scales. J. Environ. Qual. 2004, 33, 1973–1988. [Google Scholar] [CrossRef]
- Smith, D.R.; Francesconi, W.; Livingston, S.J.; Huang, C.-H. Phosphorus losses from monitored fields with conservation practices in the Lake Erie Basin, USA. Ambio 2015, 44, S319–S331. [Google Scholar] [CrossRef] [Green Version]
- Ruark, M.; Madison, A.; Cooley, E.; Stuntebeck, T.; Komiskey, M. Phosphorus loss from tile drains: Should we be concerned? In Proceedings of the 2012 Wisconsin Crop Management Conference, Madison, WI, USA, 10–12 January 2012; Volume 51, pp. 9–14. Available online: https://extension.soils.wisc.edu/wp-content/uploads/sites/68/2014/02/2012_wcmc_proc.pdf (accessed on 17 December 2018).
- Gentry, L.E.; David, M.B.; Royer, T.V.; Mitchell, C.A.; Starks, K.M. Phosphorus Transport Pathways to Streams in Tile-Drained Agricultural Watersheds. J. Environ. Qual. 2007, 36, 408–415. [Google Scholar] [CrossRef] [Green Version]
- Penn, C.J.; McGrath, J.; Rounds, E.; Fox, G.; Heeren, D. Trapping Phosphorus in Runoff with a Phosphorus Removal Structure. J. Environ. Qual. 2012, 41, 672–679. [Google Scholar] [CrossRef] [PubMed] [Green Version]
- Barca, C.; Gérente, C.; Meyer, D.; Chazarenc, F.; Andrès, Y. Phosphate removal from synthetic and real wastewater using steel slags produced in Europe. Water Res. 2012, 46, 2376–2384. [Google Scholar] [CrossRef] [PubMed]
- Penn, C.; Livingston, S.; Shedekar, V.; King, K.; Williams, M. Performance of Field-Scale Phosphorus Removal Structures Utilizing Steel Slag for Treatment of Subsurface Drainage. Water 2020, 12, 443. [Google Scholar] [CrossRef] [Green Version]
- Penn, C.J.; Bowen, J.M. Design and Construction of Phosphorus Removal Structures for Improving Water Quality; Springer: Berlin/Heidelberg, Germany, 2018; pp. 91–94. [Google Scholar]
- Claveau-Mallet, D.; Wallace, S.; Comeau, Y. Removal of phosphorus, fluoride and metals from a gypsum mining leachate using steel slag filters. Water Res. 2013, 47, 1512–1520. [Google Scholar] [CrossRef] [PubMed]
- Drizo, A.; Comeau, Y.; Forget, C.; Chapuis, R.P. Phosphorus Saturation Potential: A Parameter for Estimating the Longevity of Constructed Wetland Systems. Environ. Sci. Technol. 2002, 36, 4642–4648. [Google Scholar] [CrossRef] [PubMed]
- Bowden, L.I.; Johnson, K.L.; Jarvis, A.; Robinson, H.; Ghazireh, N.; Younger, P. The use of basic oxygen steel furnace slag (bos) as a high surface area media for the removal of iron from circum neutral mine water. J. Am. Soc. Min. Reclam. 2006, 2006, 234–246. [Google Scholar] [CrossRef] [Green Version]
- Eveborn, D.; Gustafsson, J.P.; Hesterberg, D.; Hillier, S. XANES Speciation of P in Environmental Samples: An Assessment of Filter Media for on-Site Wastewater Treatment. Environ. Sci. Technol. 2009, 43, 6515–6521. [Google Scholar] [CrossRef] [Green Version]
- Klimeski, A.; Uusitalo, R.; Turtola, E. Variations in phosphorus retention by a solid material while scaling up its application. Environ. Technol. Innov. 2015, 4, 285–298. [Google Scholar] [CrossRef]
- Penn, C.J.; McGrath, J. Predicting Phosphorus Sorption onto Steel Slag Using a Flow-through approach with Application to a Pilot Scale System. J. Water Resour. Prot. 2011, 3, 235–244. [Google Scholar] [CrossRef] [Green Version]
- IBM. IBM SPSS Statistics for Windows, Version 19.0; IBM Corporation: Armonk, NY, USA, 2010. [Google Scholar]
- Systat Sigma Plot. Version 10.0; Systat Software Inc.: San Jose, CA, USA, 2008. [Google Scholar]
- Hua, G.; Salo, M.W.; Schmit, C.G.; Hay, C.H. Nitrate and phosphate removal from agricultural subsurface drainage using laboratory woodchip bioreactors and recycled steel byproduct filters. Water Res. 2016, 102, 180–189. [Google Scholar] [CrossRef]
- Yin, H.; Yan, X.; Gu, X. Evaluation of thermally-modified calcium-rich attapulgite as a low-cost substrate for rapid phosphorus removal in constructed wetlands. Water Res. 2017, 115, 329–338. [Google Scholar] [CrossRef] [PubMed]
- McGrath, J.; Penn, C.J.; Coale, F.J. A modelling approach to the design of in-situ agricultural drainage filters. Soil Use Manag. 2012, 29, 155–161. [Google Scholar] [CrossRef]
- Barca, C.; Meyer, D.; Liira, M.; Drissen, P.; Comeau, Y.; Andrès, Y.; Chazarenc, F. Steel slag filters to upgrade phosphorus removal in small wastewater treatment plants: Removal mechanisms and performance. Ecol. Eng. 2014, 68, 214–222. [Google Scholar] [CrossRef]
- Penn, C.; Chagas, I.; Klimeski, A.; Lyngsie, G. A Review of Phosphorus Removal Structures: How to Assess and Compare Their Performance. Water 2017, 9, 583. [Google Scholar] [CrossRef]
- Algoazany, A.S.; Kalita, P.K.; Czapar, G.F.; Mitchell, J.K. Phosphorus Transport through Subsurface Drainage and Surface Runoff from a Flat Watershed in East Central Illinois, USA. J. Environ. Qual. 2007, 36, 681–693. [Google Scholar] [CrossRef]
Figure 1.
Schematic diagram of the multisegmented flow-through equipment in this study.

Figure 2.
Phosphorus (P; (a,b)), calcium (Ca; (c,d)) concentrations, and pH (e,f) with time after treatment by each slag segment during the 2 h flow-through test. Figures (a,c,e) are for the inflow P treatment of 2.5 mg L−1 and (b,d,f) are for 5.0 mg P L−1. The green line indicates inflow P concentrations.

Figure 3.
Discrete phosphorus (P) removal with time, among each slag segment during the 2 h flow-through test, expressed as both mg P removed kg−1 slag (c,d) and percentage (a,b). Figures (a,c) are for the inflow P treatment of 2.5 mg L−1, while (b,d) are 5.0 mg L−1.
Figure 3.
Discrete phosphorus (P) removal with time, among each slag segment during the 2 h flow-through test, expressed as both mg P removed kg−1 slag (c,d) and percentage (a,b). Figures (a,c) are for the inflow P treatment of 2.5 mg L−1, while (b,d) are 5.0 mg L−1.

Figure 4.
Cumulative phosphorus (P) removal (CPrem) expressed as a function of cumulative P added (CPadd) for each individual slag segment and combination of successive segments. (a–d) are the single, double, triple, and quadruple segments for the inflow P treatment of 2.5 mg L−1, respectively. (e–h) are the single, double, triple, and quadruple segments for the inflow P treatment of 5.0 mg L−1, respectively.

Figure 5.
(a) Total phosphorus (P) added (TPadd) and (b) corresponding total P removed (TPrem), as a function of retention time when considering all segment lengths. Blue circles indicate TPadd and corresponding TPrem when a TPadd 50 mg kg−1, as described in the text.
Figure 5.
(a) Total phosphorus (P) added (TPadd) and (b) corresponding total P removed (TPrem), as a function of retention time when considering all segment lengths. Blue circles indicate TPadd and corresponding TPrem when a TPadd 50 mg kg−1, as described in the text.

Figure 6.
Predicted and measured total phosphorus (P) removal (TPrem) as a function of total P added to the slag, expressed as a function of slag mass (a) and as a percentage (b).
Figure 6.
Predicted and measured total phosphorus (P) removal (TPrem) as a function of total P added to the slag, expressed as a function of slag mass (a) and as a percentage (b).


Table 1.
Summary of steel slag mass, retention time (RT), and filter length condition, and the relationship between CPrem and CPadd for each scenario. CPrem: cumulative removed P, mgkg−1; CPadd: cumulative added P, mg kg−1; k: slope; b: intercept.
Table 1.
Summary of steel slag mass, retention time (RT), and filter length condition, and the relationship between CPrem and CPadd for each scenario. CPrem: cumulative removed P, mgkg−1; CPadd: cumulative added P, mg kg−1; k: slope; b: intercept.
| Scenario | Filter Segment | Filter Length (m) | Steel Slag Mass (kg) | RT (s) | Inflow P = 2.5 mg L−1 (CPrem = k*CPadd+b) | Inflow P = 5.0 mg L−1 (CPrem = k*CPadd+b) | ||||
|---|---|---|---|---|---|---|---|---|---|---|
| k | b | R2 | k | b | R2 | |||||
| Single | S1 | 1.0 | 15 | 33 | 0.20 | 8.53 | 0.99 | 0.11 | 16.95 | 0.98 |
| S2 | 0.26 | 3.34 | 0.98 | 0.18 | 8.37 | 0.95 | ||||
| S3 | 0.37 | 0.50 | 0.99 | 0.24 | 3.02 | 0.99 | ||||
| S4 | 0.45 | 0.04 | 0.99 | 0.33 | −0.78 | 0.99 | ||||
| Double | S1 + S2 | 2.0 | 30 | 66 | 0.41 | 4.81 | 0.99 | 0.27 | 1.11 | 0.97 |
| S2 + S3 | 0.53 | 1.30 | 0.99 | 0.38 | 4.39 | 0.98 | ||||
| S3 + S4 | 0.65 | −0.07 | 0.99 | 0.49 | 0.49 | 0.99 | ||||
| Triple | S1 + S2 + S3 | 3.0 | 45 | 99 | 0.63 | 2.18 | 0.99 | 0.45 | 6.38 | 0.98 |
| S2 + S3 + S4 | 0.74 | 0.33 | 0.99 | 0.59 | 1.68 | 0.99 | ||||
| Quadruple | S1 + S2 + S3 + S4 | 4.0 | 60 | 132 | 0.80 | 0.79 | 0.99 | 0.64 | 2.25 | 0.99 |
Table 2.
The range and mean concentrations of phosphorus (P) and calcium (Ca2+) and pH of treated water from each segment described in Table 1.
Table 2.
The range and mean concentrations of phosphorus (P) and calcium (Ca2+) and pH of treated water from each segment described in Table 1.
| Filter Segment | Inflow | 2.5 mg L−1 | 5.0 mg L−1 | ||||
|---|---|---|---|---|---|---|---|
| Outflow | P (mg L−1) | Ca2+ (mg L−1) | pH | P (mg L−1) | Ca2+ (mg L−1) | pH | |
| S1 | Range | 0–2.3 | 5.1–50.4 | 7.6–10.2 | 0.5–4.9 | 3.8–50.5 | 7.3–10.6 |
| Mean | 1.8 | 7.7 | 8.8 | 4.1 | 8.1 | 8.0 | |
| S2 | Range | 0–1.6 | 8.6–53.2 | 8.0–10.7 | 0.4–4.4 | 7.5–57.7 | 7.9–10.9 |
| Mean | 1.3 | 13.1 | 9.5 | 3.3 | 11.3 | 9.3 | |
| S3 | Range | 1.0–1.2 | 10.9–74.4 | 7.9–10.8 | 0.4–3.8 | 7.9–50.1 | 7.4–10.8 |
| Mean | 0.8 | 16.5 | 9.7 | 2.5 | 12.7 | 8.7 | |
| S4 | Range | 0–0.7 | 14.4–63.4 | 8.2–10.6 | 0.4–2.7 | 5.0–37.1 | 7.8–10.8 |
| Mean | 0.5 | 21.1 | 9.7 | 1.7 | 12.3 | 9.1 | |
Table 3.
Summary of phosphorus (P) removal by slag, among several studies conducted under a variety of experimental conditions.
Table 3.
Summary of phosphorus (P) removal by slag, among several studies conducted under a variety of experimental conditions.
| Steel Slag Mass (kg) | P conc. (mg L−1) | RT | Flow Rate (ml min−1) | P Removal (mg kg−1) | Experiment Type | References |
|---|---|---|---|---|---|---|
| 2.1 | 0–10 | 2.4–9.5 h | 2.5–10 | 3700 | Laboratory Flow-through | Hua et al. [34] |
| 18.3 | 20 | 24 h | 2.1–2.8 | 2200 | Laboratory Flow-through | Drizo et al. [27] |
| 20 | 0.05–5.3 | 5–24 min | 333–1167 | 3200 | Laboratory Flow-through | Klimeski et al. [30] |
| 45.36 | 10 | 24 h | 20 | 910 | Laboratory Flow-through | Barca et al. [37] |
| 45.36 | 10 | 24 h | 26.7 | 810 | Laboratory Flow-through | |
| 60 | 0.84–4.87 | 0.5–2 min | 7800 | 61 | Laboratory Flow-through | Current study |
| 454 | 0.11–0.60 | 10 min | 0.4–6.4 | 59 | Laboratory Flow-through | Penn et al. [31] |
| 2712 | 0.50 | 19.3 min | 29.8 | 25.9 | Field Flow-through | Penn et al. [22] |
| 7000 | 0.05–0.25 | 10 min–50 h | 600–180,000 | 60 | Field Flow-through | Klimeski et al. [30] |
© 2020 by the authors. Licensee MDPI, Basel, Switzerland. This article is an open access article distributed under the terms and conditions of the Creative Commons Attribution (CC BY) license (http://creativecommons.org/licenses/by/4.0/).
Share and Cite
MDPI and ACS Style
Wang, L.; Penn, C.; Huang, C.-h.; Livingston, S.; Yan, J. Using Steel Slag for Dissolved Phosphorus Removal: Insights from a Designed Flow-Through Laboratory Experimental Structure. Water 2020, 12, 1236. https://doi.org/10.3390/w12051236
AMA Style
Wang L, Penn C, Huang C-h, Livingston S, Yan J. Using Steel Slag for Dissolved Phosphorus Removal: Insights from a Designed Flow-Through Laboratory Experimental Structure. Water. 2020; 12(5):1236. https://doi.org/10.3390/w12051236
Chicago/Turabian StyleWang, Linhua, Chad Penn, Chi-hua Huang, Stan Livingston, and Junhua Yan. 2020. "Using Steel Slag for Dissolved Phosphorus Removal: Insights from a Designed Flow-Through Laboratory Experimental Structure" Water 12, no. 5: 1236. https://doi.org/10.3390/w12051236
Note that from the first issue of 2016, this journal uses article numbers instead of page numbers. See further details here.