A Borehole-Based Approach for Seawater Intrusion in Heterogeneous Coastal Aquifers, Eastern Part of Jeju Island, Korea


1
Groundwater Research Center, Korea Institute of Geoscience and Mineral Resources, Daejeon 34132, Korea
2
Department of Petroleum Resources Technology, University of Science & Technology, Daejeon 34113, Korea
*
Author to whom correspondence should be addressed.
Water 2020, 12(2), 609; https://doi.org/10.3390/w12020609
Submission received: 16 January 2020
/
Revised: 20 February 2020
/
Accepted: 21 February 2020
/
Published: 24 February 2020
(This article belongs to the Section Hydrology)
Abstract
:Understanding the basaltic aquifer system and seawater intrusion on the volcanic island of Jeju, Korea, has received significant attention over the years, and various methodologies have been suggested in the contributions. Nevertheless, it is still difficult to effectively characterize groundwater systems due to the long period of volcanic activity and the lithological variability of basalt. In this study, geophysical well logging in seawater intrusion monitoring boreholes detected a sudden decrease of electrical conductivity within the saltwater zone in the eastern part of Jeju Island. This anomalous condition cannot be explained by the Ghyben-Herzberg model, which has historically been considered as the basic groundwater model of Jeju Island. This paper focuses on fine-scale temporal and spatial variability of groundwater flow using electrical conductivity and temperature logs and borehole temperature monitoring by a thermal line sensor. On the basis of the results, we evaluate an alternative model to replace the traditional conceptual model in the eastern part of Jeju Island. It is revealed that the area consists of heterogeneous aquifer systems, and the behavior of freshwater and saltwater is understood by temperature monitoring over the entire depth of boreholes. Coastal aquifers flow through two or more independent channels with weak vertical connections. In addition, seawater intrusion does not occur continuously in the vertical direction from the bottom depth, but instead occurs through these multilayered aquifers. In particular, the multilayered aquifers that are responsible for flow pathway, as well as the freshwater–saltwater interface form mainly at lithological boundaries. Our preliminary conceptual model is expected to be improved and revised by various measurements of hydrodynamic parameters such as flowmeter or packer test.
1. Introduction
Most volcanic islands, to a large extent, depend on coastal aquifers for their water supply because surface water is rarely available due to the high permeability of basalts. However, in coastal areas, the seawater intrusion phenomenon is becoming more serious due to the disruption of natural hydrological conditions by climate change, rising sea level, and intensive groundwater extraction [1]. Therefore, establishing appropriate strategies for groundwater utilization and sustainability has become a major concern on volcanic islands. Seawater intrusion and basaltic aquifers have received significant attention from many researchers around the world [2,3,4]. Various methodologies have been suggested in the contributions that use innovative hydrogeological, geophysical, and geochemical monitoring for field scale characterization [5,6,7]. Nevertheless, it is very difficult to effectively characterize groundwater systems because of the unique geological features of basalt on a volcanic island. Basalts are mostly composed of basaltic lava flows that are either permeable or have low permeable hydraulic conductivity, and this lithological variability makes hydrogeological characterization difficult [8,9]. Therefore, until recently, many studies have highlighted the need for high-resolution studies in volcanic aquifers. Lachassagne et al. [10] presented a high-resolution conceptual model for complex basaltic volcanic islands to solve applied geology and hydrogeology problems.
Geophysical well loggings were originally developed and extended in sedimentary environments, particularly for petroleum exploration, but their role has progressively expanded in oceanic and continental basalts with vast improvements in downhole instrumentation technology through the Deep Sea Drilling Project (DSDP) and its successor, the Ocean Drilling Program (ODP). Basalt stratigraphy has been the main issue in recent years because basalt sequences can host large aquifers. Helm-Clark et al. [11] reviewed the utility of borehole geophysical tools for determining stratigraphic features of continental basalts. Broglia and Ellis [12] attempted to distinguish and quantify the effects of hydrous alteration minerals on the responses of thermal neutron porosity logs recorded for basaltic rocks during the ODP. Boldreel [13] divided a column of subaerially extruded basalt into detailed lithological and stratigraphic units using various wireline loggings. These studies mainly dealt with establishing stratigraphic correlations in large-scale areas, such as basalt flows of the Deccan Traps, which extend over 100 km [14]. Some works have been devoted to deriving a valid set of interpretive rules for logging basalts. Calibrations and oxide-closure models have been devised for geochemical logging in oceanic basalts as well as other crystalline rocks [15]. Well logging techniques have contributed to the characterization and identification of the nuclear and electrical signatures of basalt formations [16]. A few studies have reported on groundwater flow and hydrodynamic flow systems in basalt areas. In groundwater studies, temperature has been used as a natural tracer in a wide array of applications, and temperature profiles measured in open boreholes have offered important information on groundwater flow and origin [17,18,19,20,21,22]. Until recently, various approaches were introduced to overcome small temperature differences for flow characterization [23,24]. Pehme et al. [25,26] combined high-temperature resolution data with active heating using active line sensor (ALS) to identify ambient flow through fractures. Wellbore and groundwater temperature could be used to identify and interpret important features of the basaltic aquifer, including thickness, flow direction, and potential geothermal anomalies [27,28]. In spite of the many efforts to apply wireline logging to basalt, its application is still limited, because most conventional geophysical tools were originally designed and calibrated for sedimentary rock conditions. Because the texture and composition of most basalts are fairly uniform, it is not easy to discriminate their variations. In addition, log responses of basalt vary depending on whether the logging conditions are saturated or unsaturated [29].
Jeju Island is a volcanic island located 140 km south of the Korean Peninsula. To improve the sustainable development and management of groundwater, much research has tried to identify the hydrogeological features of the island [30,31]. There have been many attempts to investigate the groundwater flow system using conventional methods. However, conventional pumping and packer tests cannot obtain sufficient information on the regional groundwater system of a volcanic island because the transmissivities are often too high to cause remarkable drawdown. Additionally, over the years, seawater intrusion has received much attention which has resulted in several studies [32,33,34,35]. Kim et al. [36] tried to observe the tidal effect on groundwater–seawater flow in a coastal aquifer using various field study techniques, including monitoring the fluctuations of groundwater and tide levels, electrical conductivity and temperature logging, and two-dimensional heat-pulse flowmeter tests. In addition, the transport of saltwater by tidal variations has been quantified based on temporal variations in electrical conductivity and temperature with depth [37]. In particular, Lee et al. [38] suggested the possibility of conduit flow through the estimation of tidal efficiency and hydraulic diffusivity in eastern areas.
The groundwater management model of Jeju Island has been defined following the Ghyben-Herzberg (G-H) principle. The spatial distribution of fresh and salt groundwater in a coastal aquifer basically comprises a freshwater body overlying a saltwater wedge on land and salt groundwater below the sea floor. Many prior studies have assumed that the system of coastal aquifers on a volcanic island took the form of a simple leaky aquifer or one-layered aquifer based on the G-H model [39,40,41]. However, the heterogeneity of geological structures on volcanic islands such as Jeju Island makes the groundwater system complex. Furthermore, in many coastal settings, aquifer systems consist of layered sequences with varying hydraulic properties, which are frequently caused by successive lava flows on volcanic islands. Repeated measurement of salinity profiles reported freshwater lens thickness and freshwater long-term changes in Hawaii, and the thickest was 262 m. Moreover, water level and the G-H principle may not be reliable indicators of the amount of freshwater in a coastal aquifer [42].
The monitoring of seawater intrusion in boreholes has been managed by Jeju Special Self-Governing Province, since it was established in 2001, and some interesting phenomena have been discovered in the eastern part of the island. From electrical conductivity logging, a sudden decrease of electrical conductivity was observed at the depth within the saltwater zone. This anomalous condition could not be explained by the G-H model, which has historically been considered as the basic groundwater model of Jeju Island. Accordingly, careful examination is needed to reconsider the existing seawater intrusion model of the island. This paper looks at fine-scale temporal and spatial variability of groundwater flow using electrical conductivity and temperature logs and borehole temperature monitoring by a thermal line sensor. The main aim is to estimate the behavior of the basaltic aquifer, and then to propose a conceptual model of seawater intrusion on the eastern coast of Jeju Island.
2. Materials and Methods
Jeju Island was formed by repeated volcanic eruptions, therefore, its geology has been controlled by lava features generally divided into pahoehoe and aa lava [43,44,45]. The basaltic rocks contain interflow structures (notably clinker layers) that are permeable with a high porosity [46]. The dominant features of basalt are primarily its texture and composition. Its internal stratigraphy, aquifer boundaries, and alteration features are critical, and basalt stratigraphy and aquifer behavior in particular have attracted attention as key parameters to characterize coastal aquifers. If appropriate well logging approaches are chosen to measure these properties, we can answer various questions relevant to groundwater management in basalt regions. Along with geophysical well logging, borehole temperature monitoring enhances our understanding of coastal aquifer characteristics. Nevertheless, during temperature monitoring in a basalt area, special consideration should be given to mounting sensors at proper depths, because the vertical distribution of temperature in a borehole is likely to change with the characteristics of the coastal aquifer, tidal fluctuation, and seasonal variation. Moreover, Shin et al. [47] revealed that, in the eastern coast area of Jeju, some freshwater–saltwater interfaces were thickly distributed, instead of having a sharp interface. This result indicates that temperature needs to be recorded simultaneously for the entire depth of a borehole in order to gain insight into how coastal aquifers behave in these environments. However, simultaneous measurement of temperature over the entire borehole has been limited by conventional methods that use only one or a few sensors. Although some attempts have been made to provide simultaneous temperature readings by binding multiple sensors together, restrictions on thickness have always been problematic, and it is difficult to technically control simultaneous measurements. In this study, we overcame these limitations to provide temperature measurements covering the full depth of boreholes.
2.1. Seawater Intrusion Monitoring System of Jeju Island
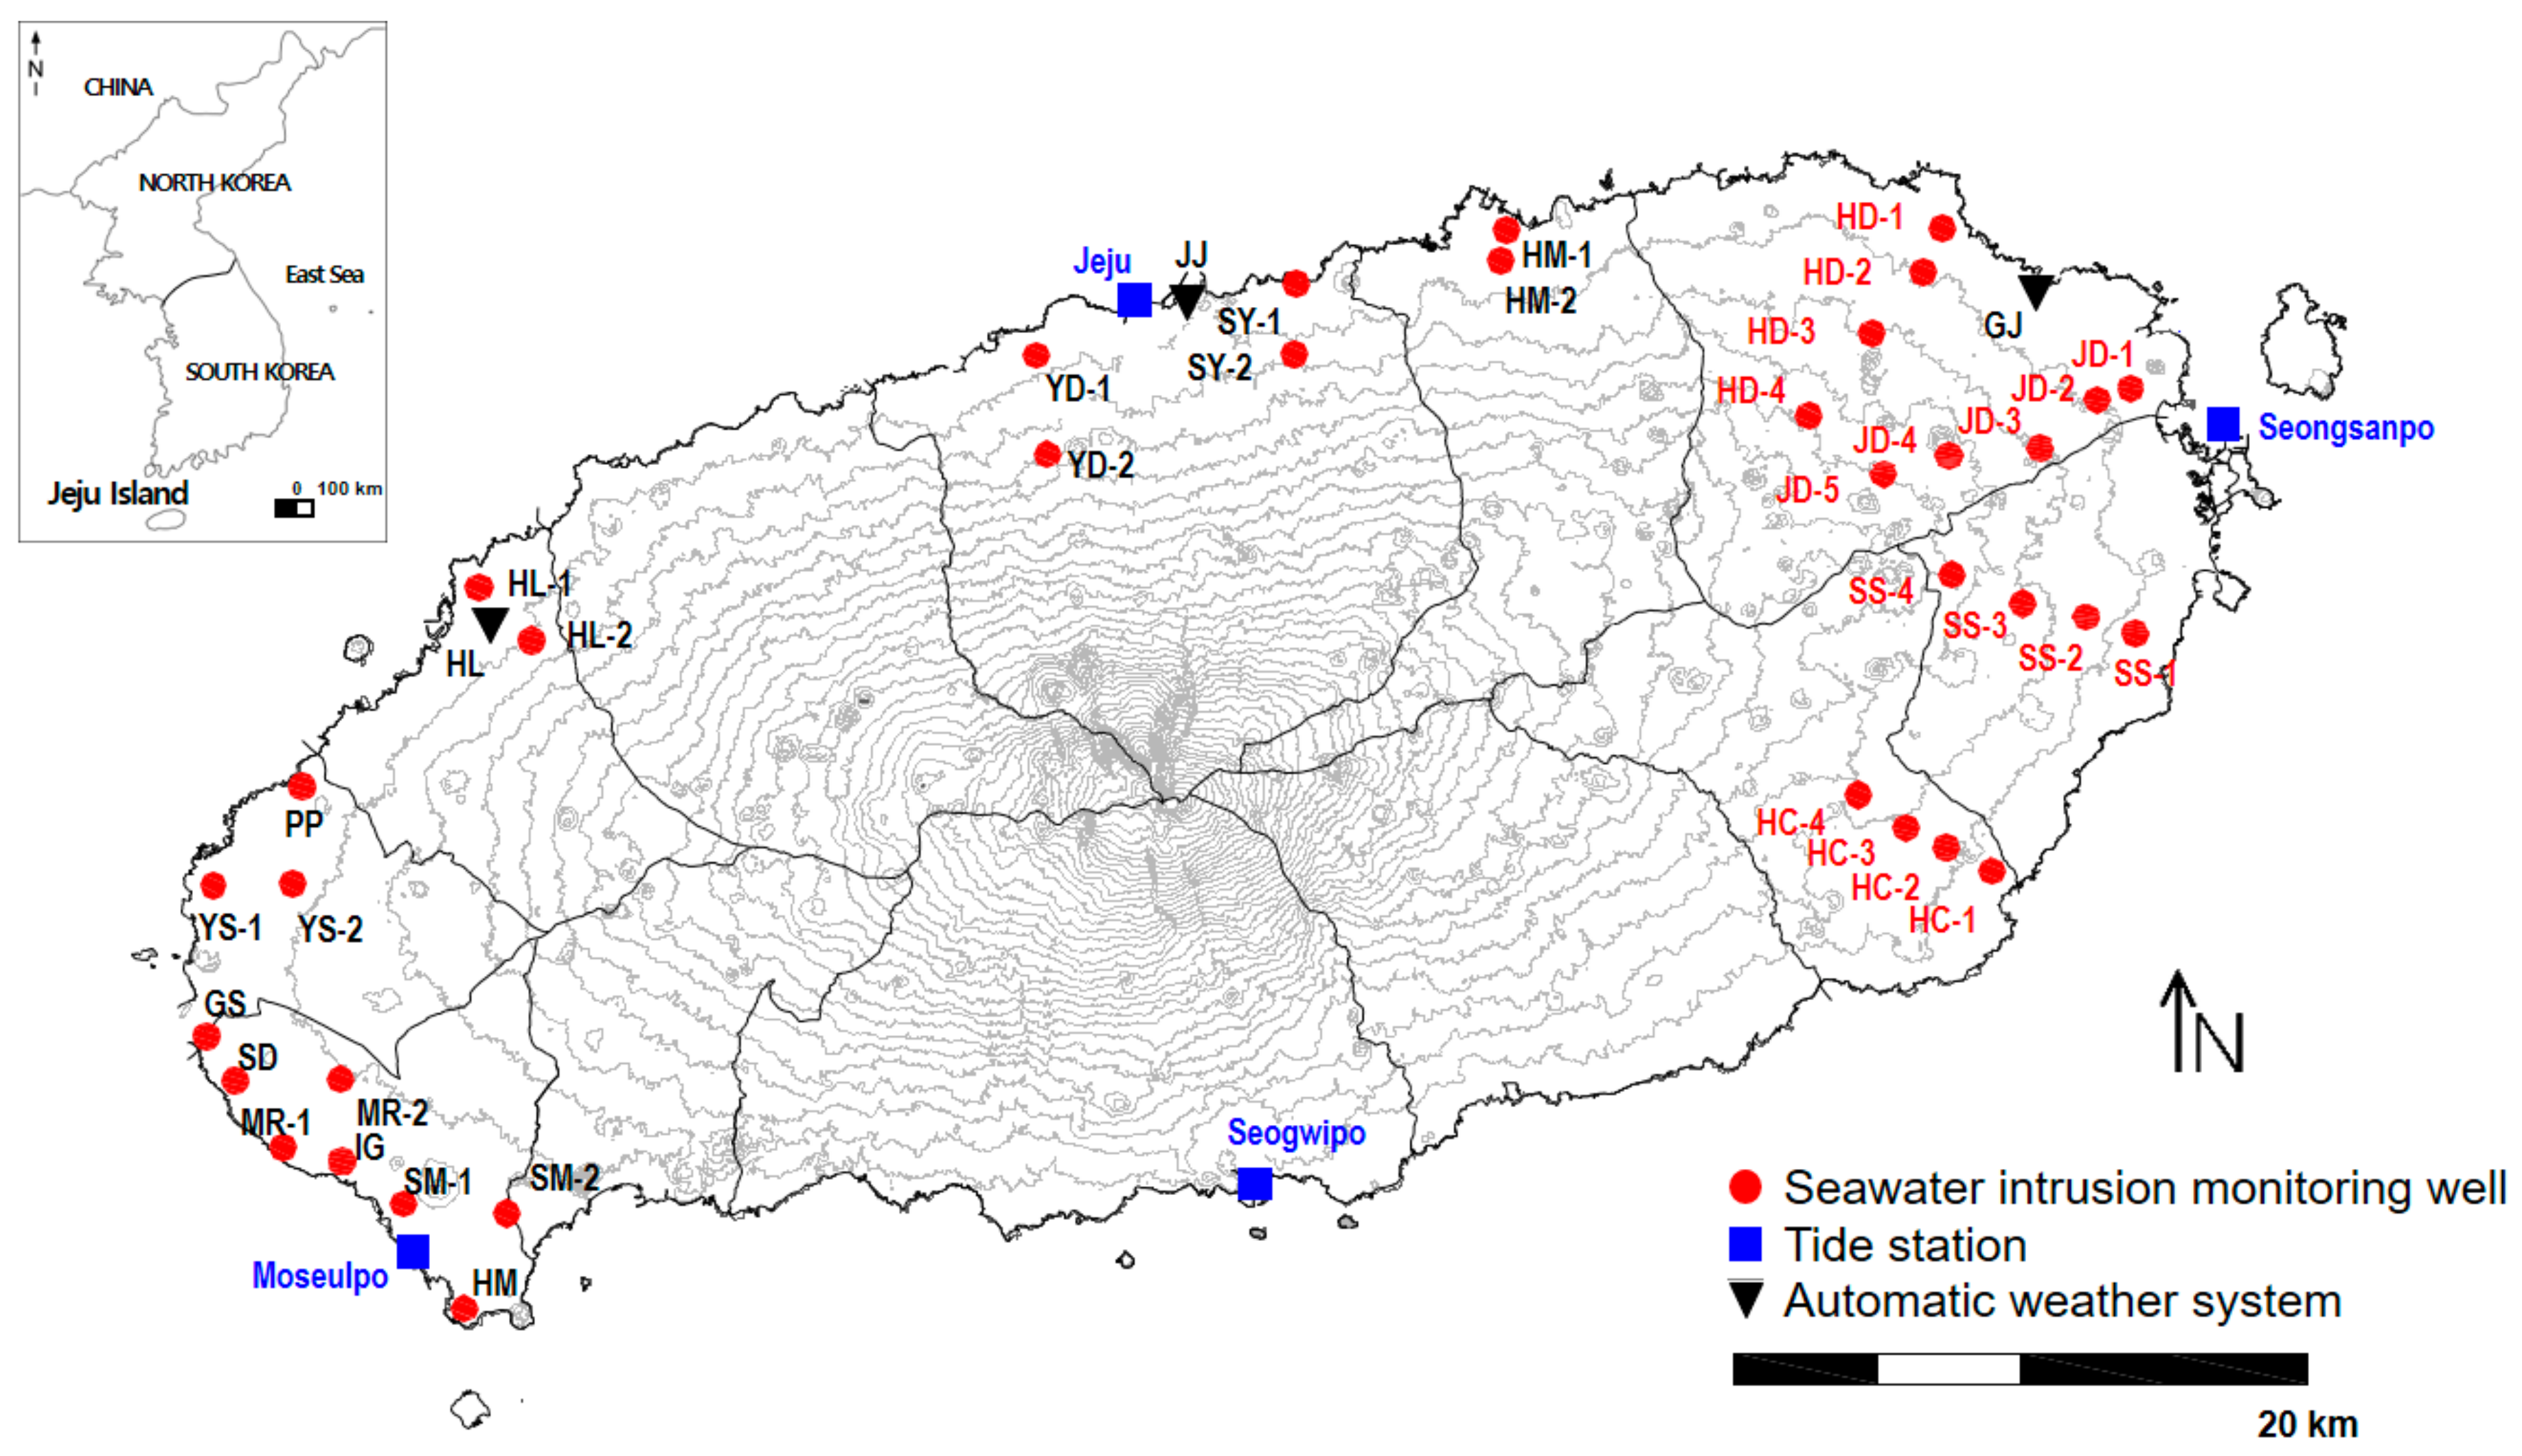
In order to understand the mechanisms of seawater intrusion, monitoring wells were installed around the coastal area of Jeju Island. The monitoring wells were drilled to a depth of approximately 150 m below sea level. All boreholes are cased with steel and grouted with cement to 50 m depth from ground, and fully screened until the bottom of drilling depth. Maintaining a regular distance between each well, generally four or five wells, but in some cases only two or three wells, were placed along a straight line in each district (Figure 1). Groundwater level, electrical conductivity, and temperature were measured by automatic equipment at one-hour intervals to investigate the temporal variation. The main objectives of a seawater intrusion monitoring system are to understand groundwater occurrence, the change of the freshwater–saltwater interface, and the influences of tidal fluctuations and seasonal rainfall.
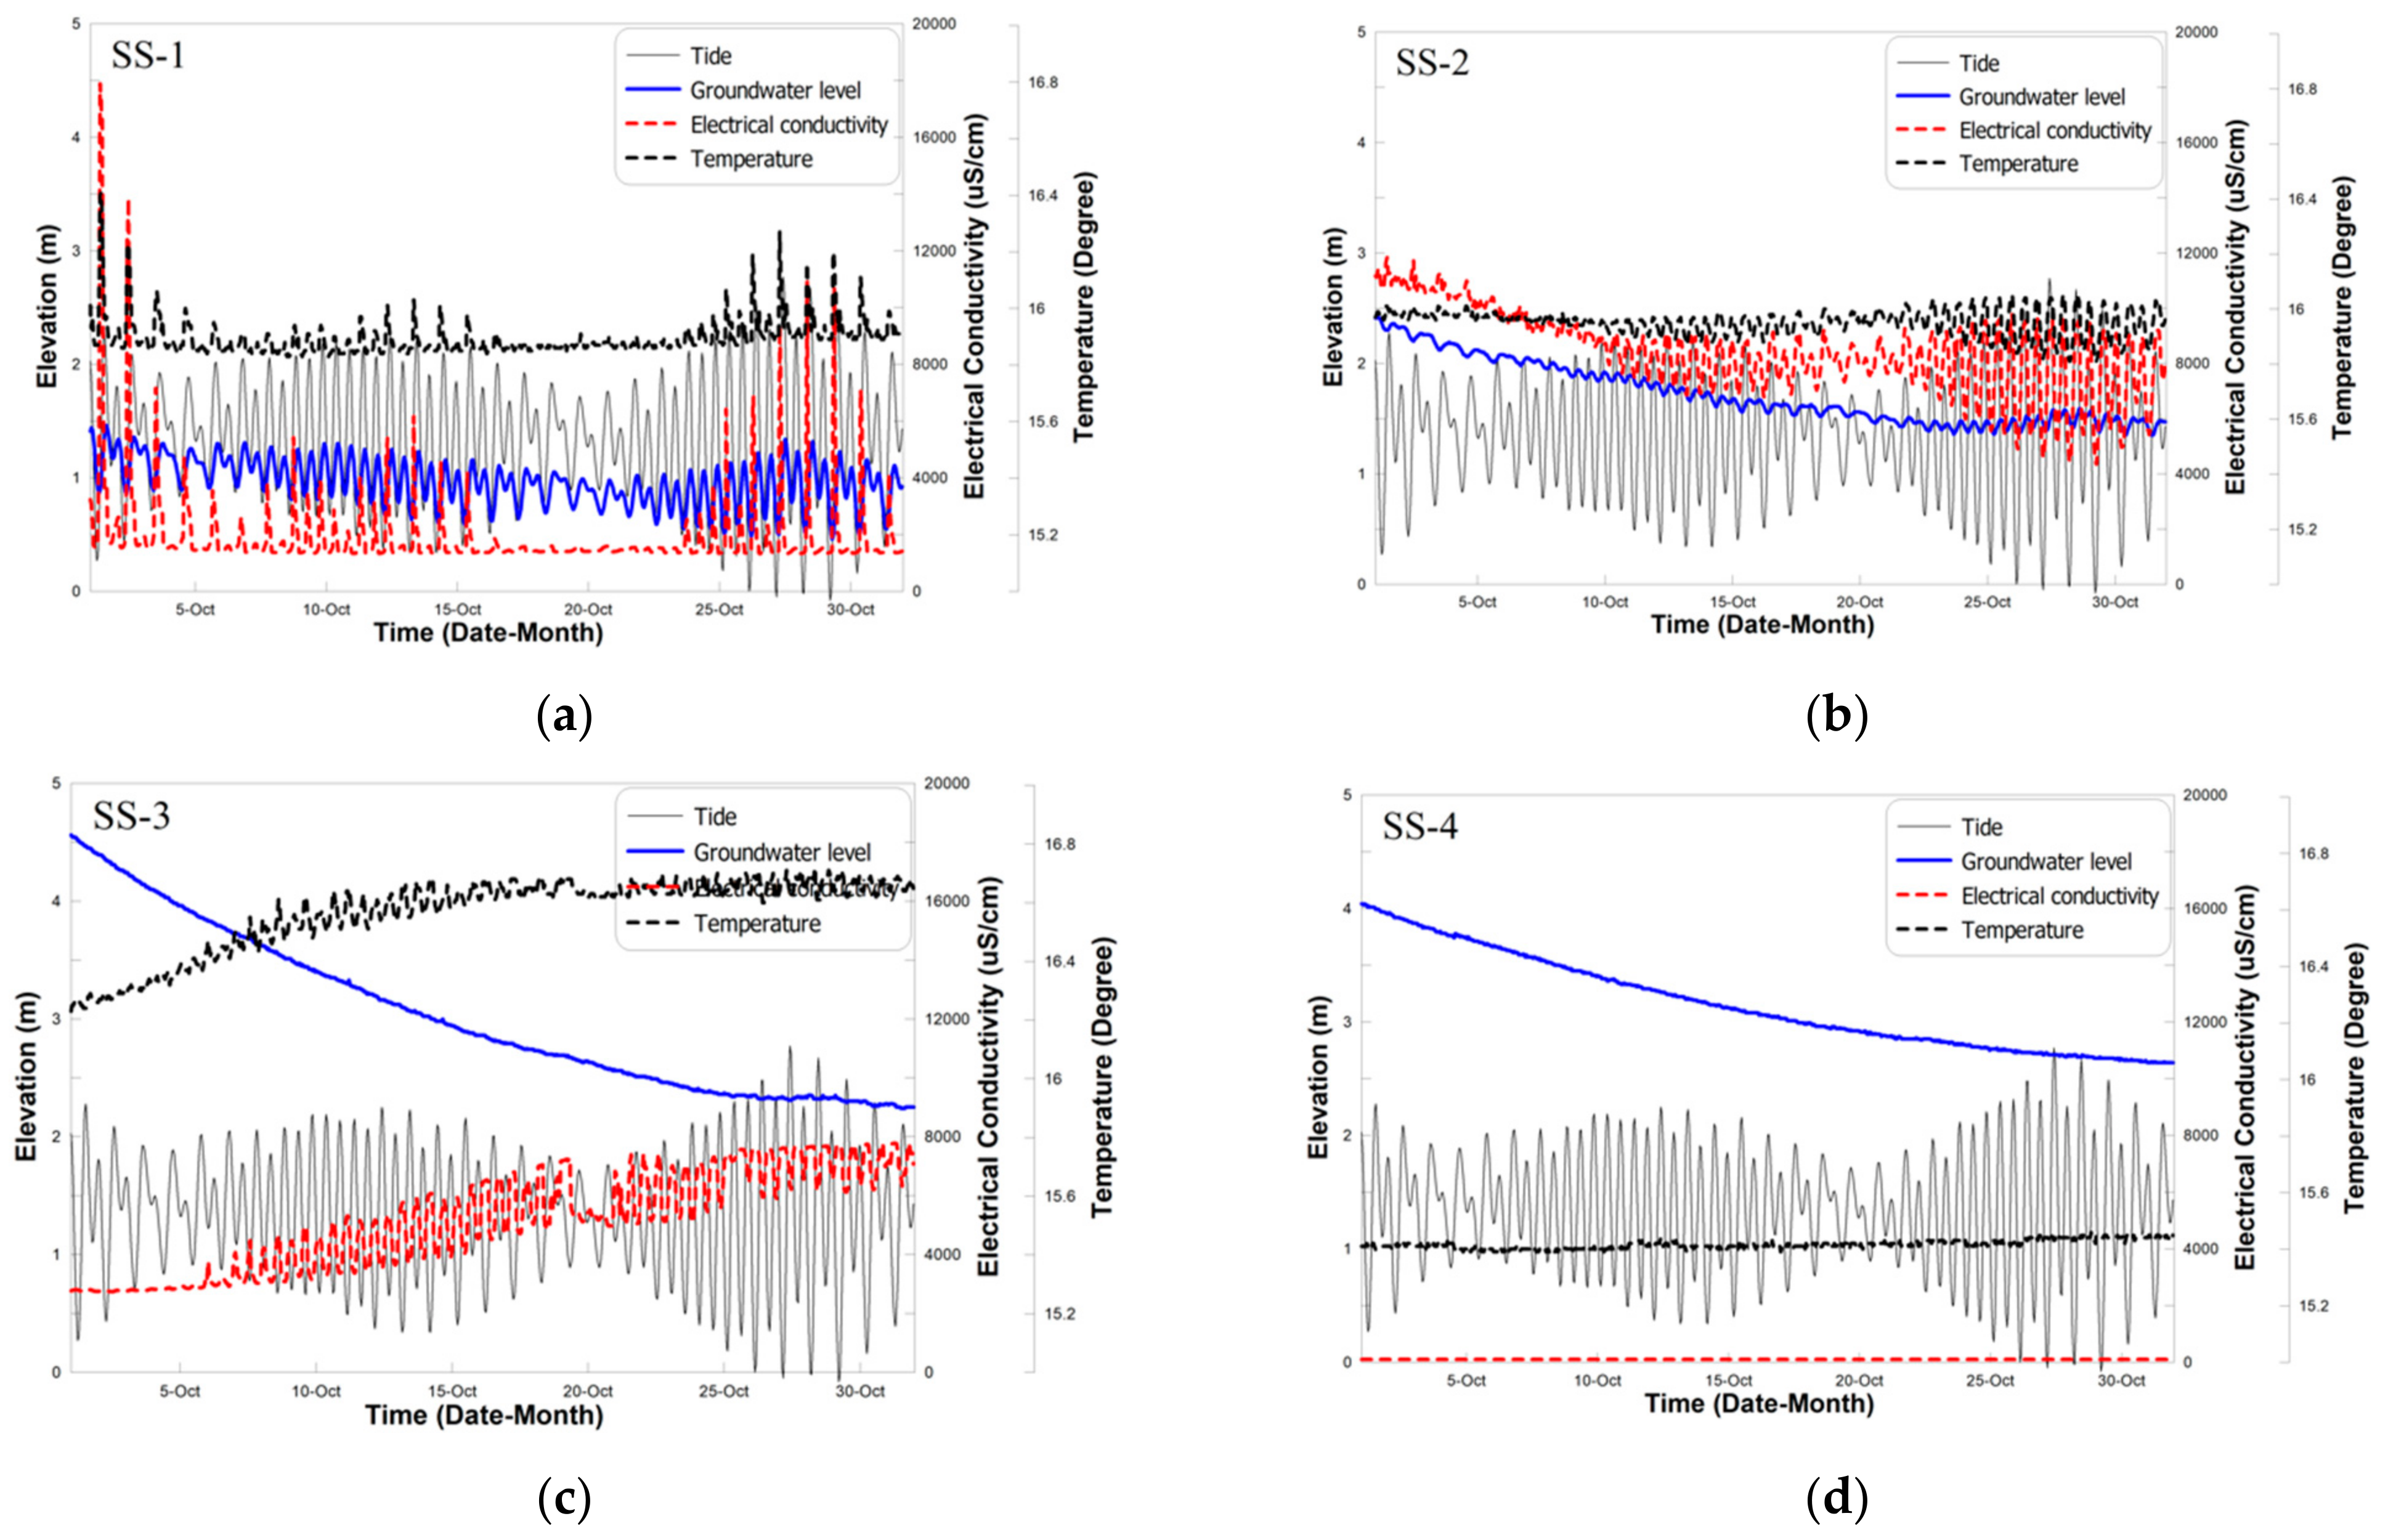
On Jeju Island, four tide stations exist to measure ocean tidal fluctuations. Tide level data from Seongsanpo tide station were used for the analysis because the target boreholes were located on the eastern part of the island. The eastern part is divided into four districts (Handong (HD1-4), Jongdal (JD1-5), Susan (SS1-4), and Hacheon (HC1-4)), and the details of seawater intrusion monitoring boreholes are given in Table 1. Time-series data of tide level, groundwater level, electrical conductivity, and temperature at boreholes SS-1, SS-2, SS-3, and SS-4 are illustrated in Figure 2. For a period of one month, the data were measured at one-hour intervals. In coastal areas, the periodic rise and fall of ocean tides produces sinusoidal groundwater level fluctuations in adjacent aquifers [48]. The tide level fluctuates between 0 and 3 meters, and the groundwater level, electrical conductivity, and temperature are influenced by tidal fluctuation.
Boreholes located closer to the coast were more strongly influenced by tidal fluctuations. According to the time-series data observed at the four seawater intrusion monitoring wells, borehole SS-4, which was located 8.1 km from the coastline, was not influenced by the tides. In addition, electrical conductivity and temperature were more responsive to tidal fluctuation than to groundwater level. Similar results were observed in other districts. A relationship between tide level and the measured parameters was apparent at boreholes HD-1, JD-1, and HC-1, which were located near the coastline, and tended to weaken with increasing distance from the coastline. No relationship was observed at boreholes HD-4, JD-4, HC-3, and HC-4, implying that the tidal effect reached up to about 6 km from the east coast.
2.2. Geophysical Well Logging
Under natural conditions, the seaward movement of freshwater prevents saltwater from intruding into coastal aquifers, and the interface between freshwater and saltwater is maintained near the coast or far below the land surface because of the density difference. Depending on the degree of seawater intrusion and aquifer properties, this interface can be sharp or a transition zone in which freshwater and saltwater mix. Borehole temperature logs employ resistance thermometers and give continuous temperature readings. Temperature logging is the most widely used detection method for aquifer thickness in regions where deep exploration wells penetrate the effective base of the aquifer. These logs provide useful information about the large-scale horizontal and vertical movements of groundwater [49,50]. Fluid electrical conductivity logs are records of the capacity of the borehole fluid that enters the probe to transmit an electric current. These logs allow for the determination of the general quality of well water and evaluation of the hydrological properties of fractures, fracture zones, or other permeable layers intersecting a borehole. Furthermore, under a wide range of conditions, these logs are used to trace the movement of groundwater in permeable layers by injecting water of constant salinity that is different from that of the formation water [51]. In seawater intrusion monitoring wells, temperature and electrical conductivity logging enabled us to delineate the freshwater–saltwater interfaces and how they changed with depth. The classification of water quality of coastal groundwater, which is freshwater, mixed water, and saltwater, is expressed by total dissolved solid (TDS). It is known that freshwater has a TDS concentration of less than 1000 mg/L, implying the upper limit of freshwater for suitability for human consumption [52]. In our analysis, the standard for defining the freshwater–saltwater interface was followed using the Hwang’s relationship between the groundwater electrical conductivity and total dissolved solids from the hydrochemical analysis of groundwater samples [53]:
where Eq_NaCl is the equivalent NaCl concentration (ppm) and Rw is the pore water resistivity (Ωm), at 25 °C.
where TDS is total dissolved solid (ppm) and EC is electrical conductivity (μS/cm), at 25 °C.
The classification of coastal groundwater is expressed in Table 2.
2.3. Borehole Temperature Monitoring
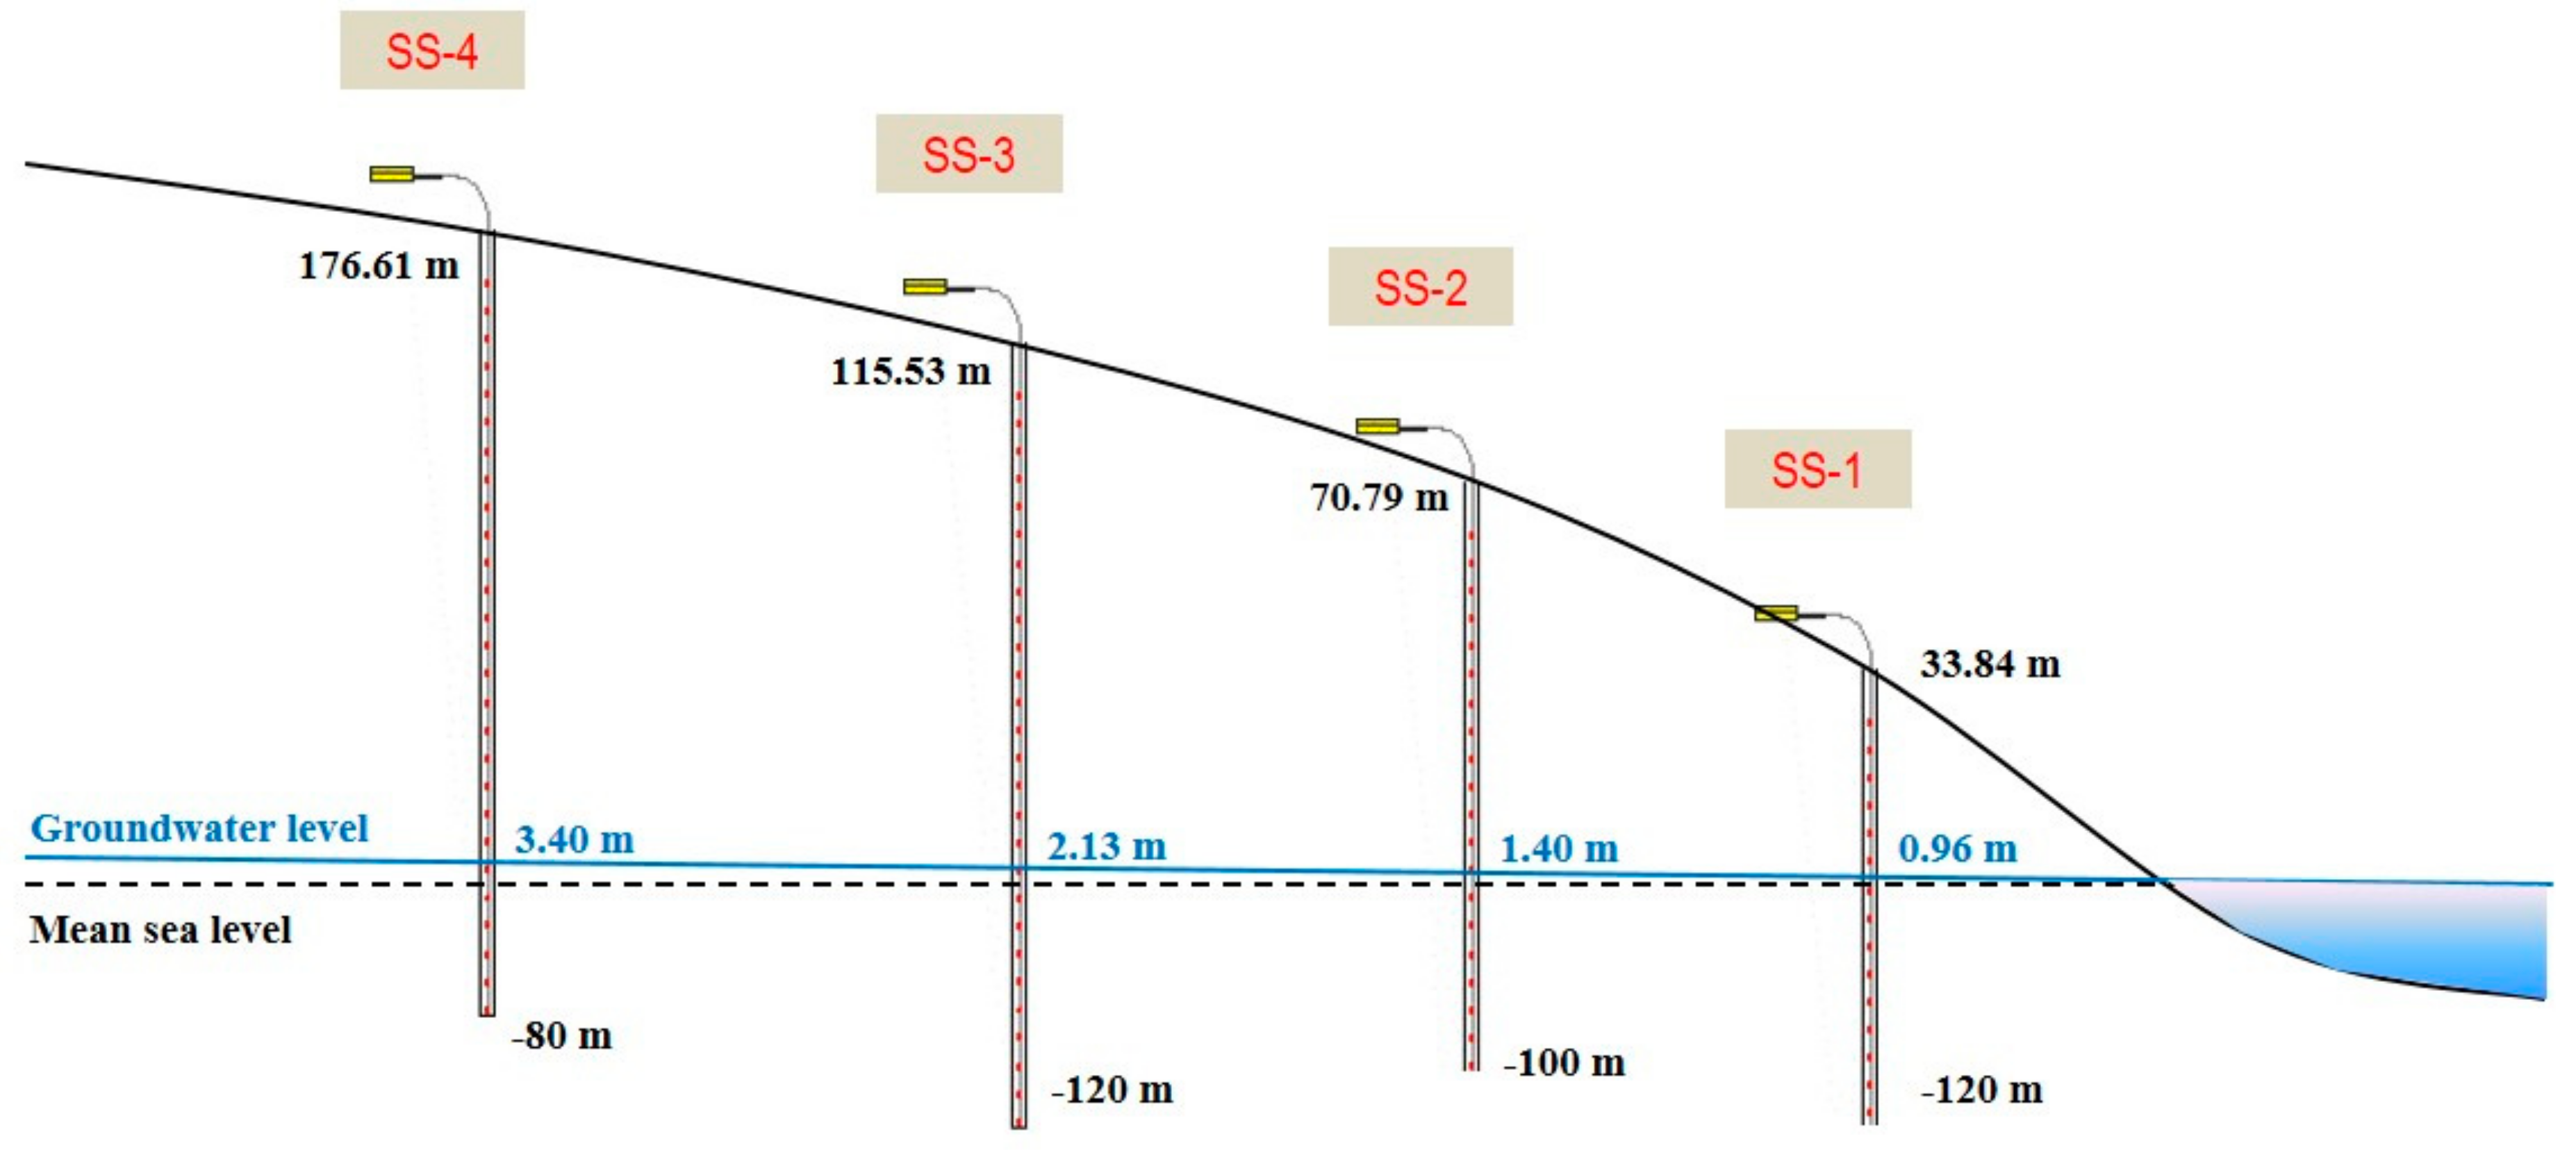
To investigate the groundwater variation in monitoring wells, temperature monitoring was performed using a thermal line sensor (SOAM Consultant Co., Daejeon, Korea) which allowed for much finer spatial and temporal resolution. The key point of thermal line sensors is that temperature can be measured simultaneously at multiple depths and locations with only one cable. The thermal line sensor system is completely free from thickness limitations because the thickness of the cable is constant regardless of the number of sensors. Therefore, it can be used in small spaces such as boreholes. The thermal line sensor system consists of a weatherproof and lightweight monitoring device, the cable embedded with temperature sensors, and software for controlling measurement parameters. One of the advantages of the system is its user-oriented interface. The location (spacing) and number of sensors, as well as the length of cable were all variable, thus the cable was manufactured to the specifications suitable for each measuring environment. With no limit to the number of sensors, the diameter of the cable was less than 10 mm. The measurement range of the temperature sensors was from −55 to 125 °C, the accuracy was ± 0.5 °C, and the resolution was 0.0625 °C. This system showed outstanding performance as compared with conventional temperature logging tools. The detailed specifications of the monitoring system are listed in Table 3.
An additional advantage of the thermal line sensor is the ability to make continuous measurements in time and to simultaneously monitor fine-scale temporal and spatial variability of groundwater flow. As compared with existing single sensor-based equipment, the thermal line sensor measures temperature over long periods of time without the need for an onsite operator and does not alter groundwater levels or flow patterns. When temperature measurements are taken in a deep borehole, temperature sensors can malfunction due to high pressure. To prevent errors caused by high pressure, the sensors are protected by an aluminium or stainless steel case. Another problem with using multiple sensors is that the measurements can differ because the sensors differ in accuracy. This problem is very serious if it becomes necessary to measure fine-scale variation for detecting groundwater flow. Our thermal line sensor enhanced its accuracy by making a calibration based on measurements taken in a thermo-hygrostat. Recently, the system has been applied in a wide range of fields as a tool for rapid and accurate temperature measurement.
3. Results
3.1. Evaluation of Seawater Intrusion in the Eastern Part of Jeju Island
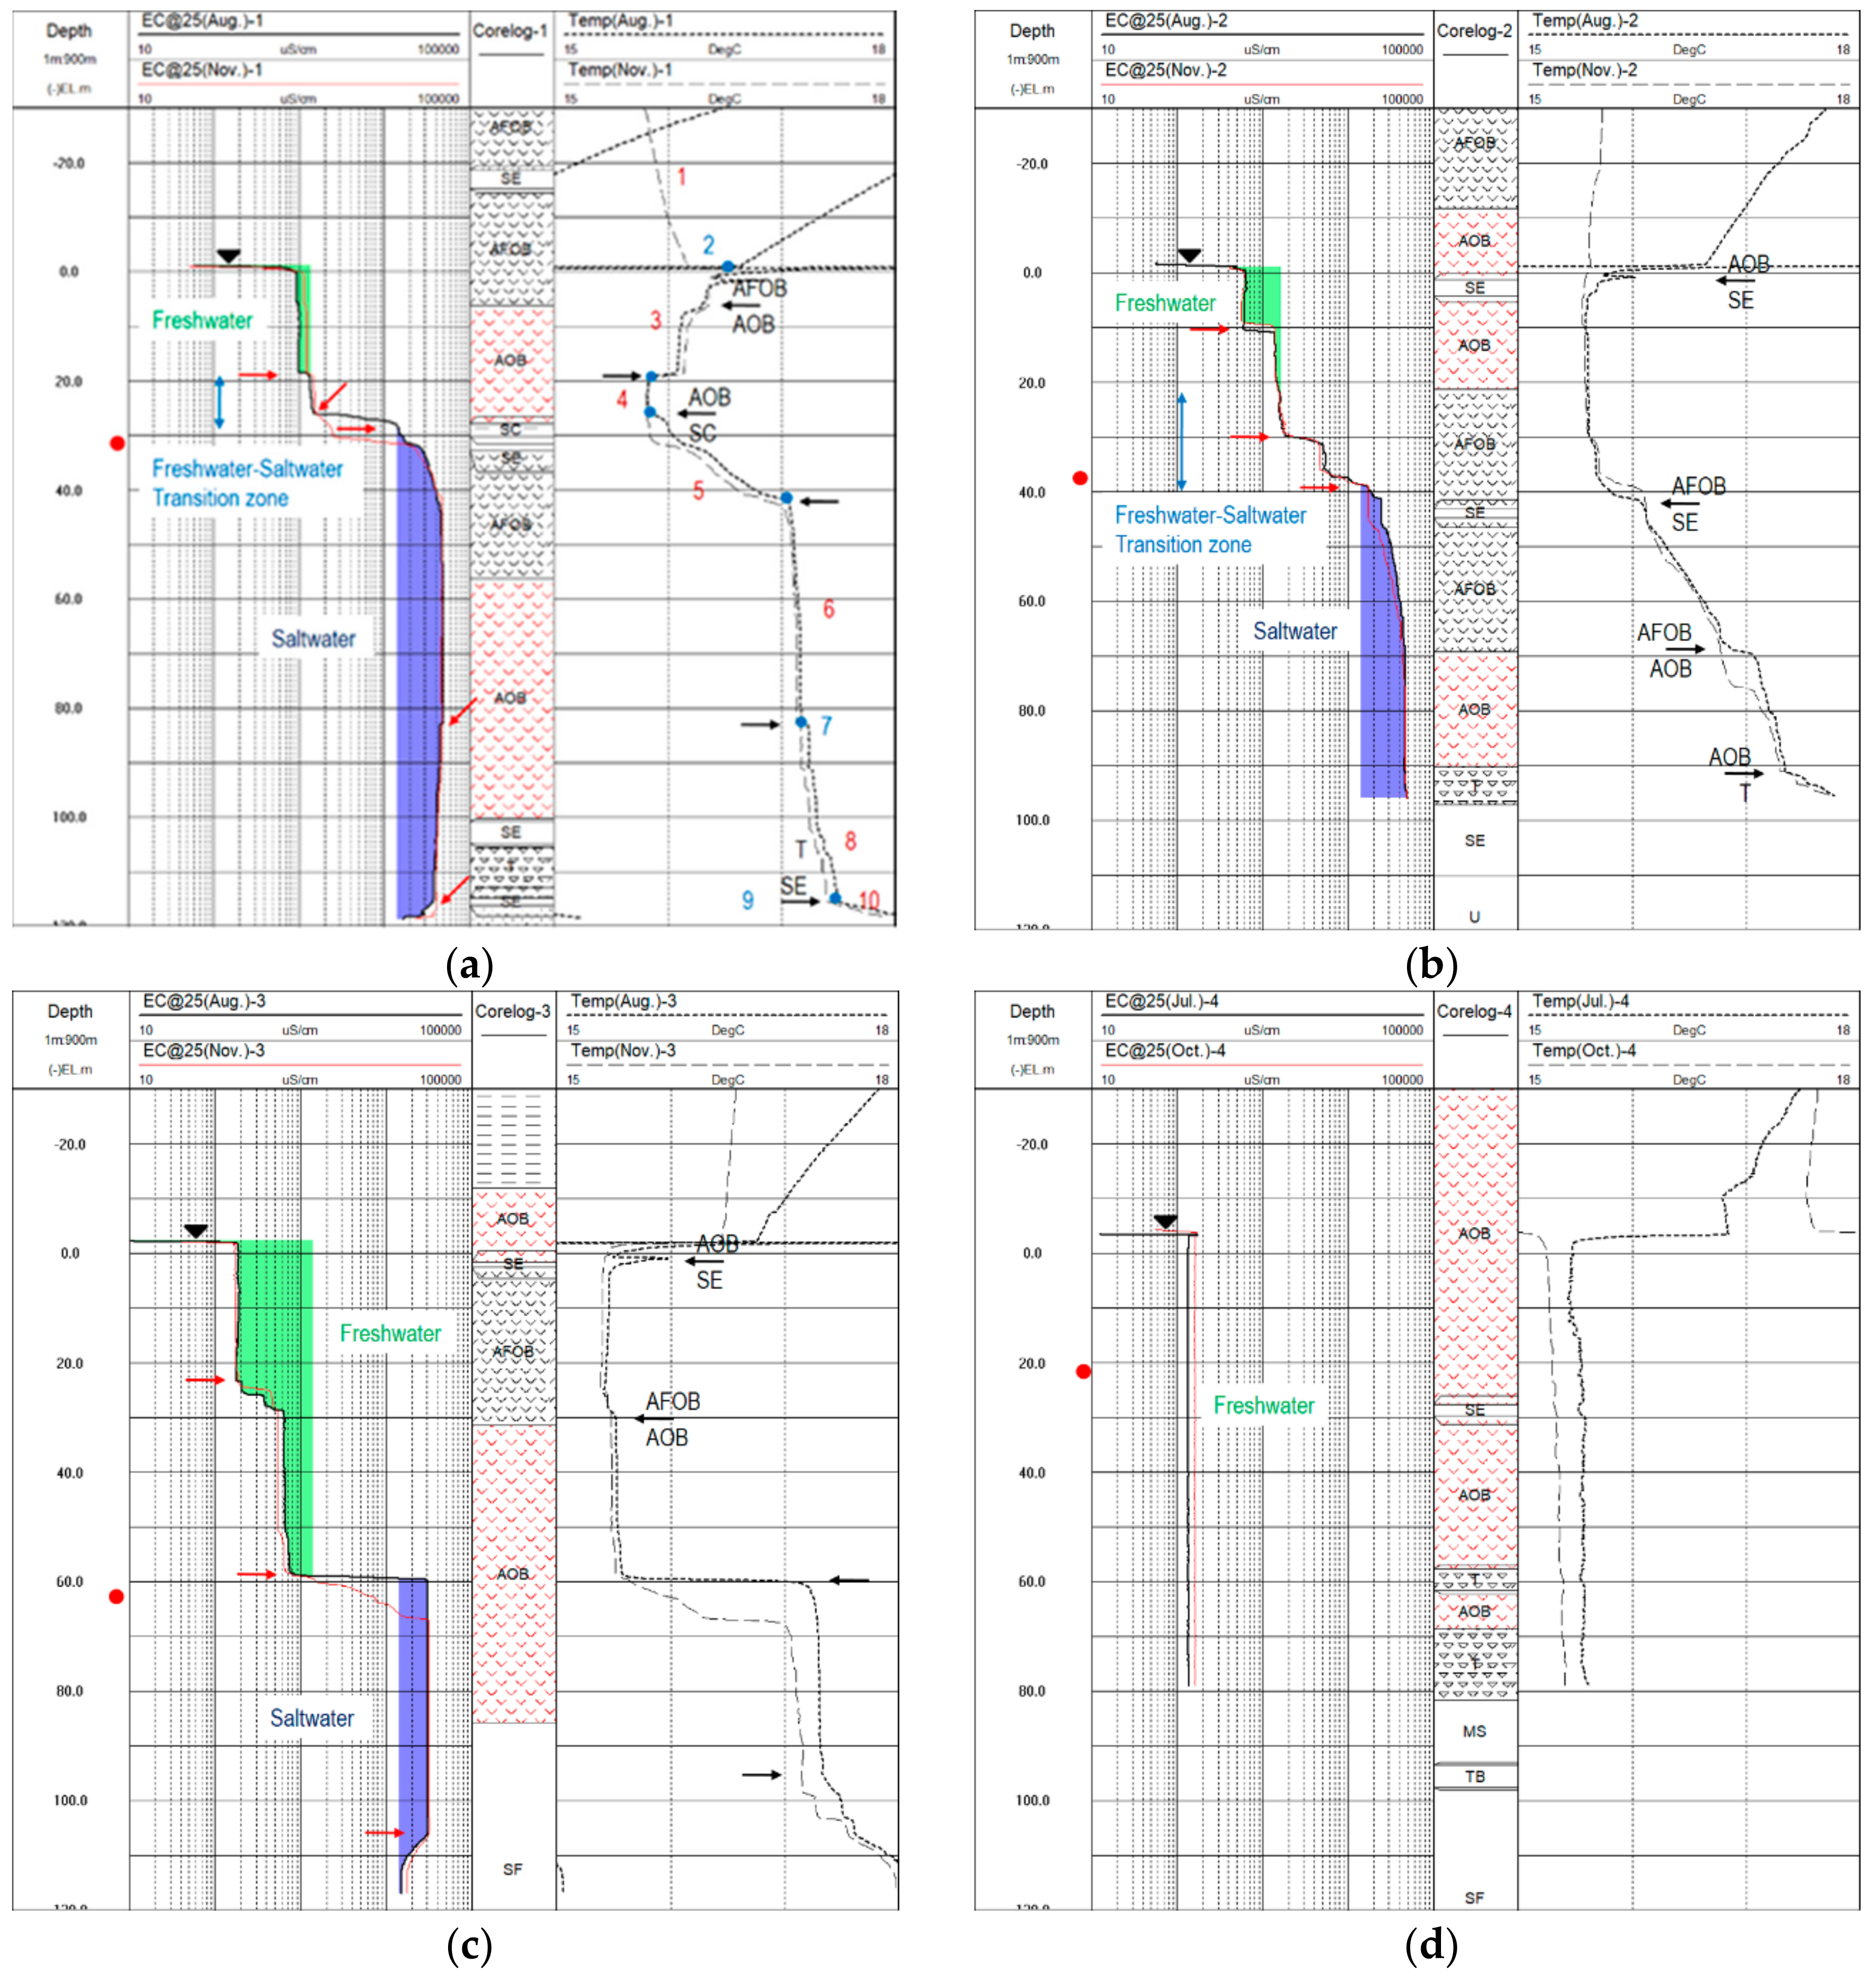
Under the ambient conditions, the distributions of coastal groundwater and freshwater–saltwater interfaces were delineated using electrical conductivity and temperature logging in monitoring wells on the eastern part of Jeju Island. Figure 3 shows electrical conductivity, core, and temperature log profiles for Susan district obtained during August and November. The subsurface lithology is mostly composed of acicular feldspar basalt, augite olivine basalt, a sedimentary layer, Seogwipo formation, tuff, and the U formation. Indices marked on the corelog for lithology identification are defined in Table 4. It was reported that main aquifers were identified as clinker and fracture zones existed in acicular feldspar basalt, augite olivine basalt, trachybasalt, and interfaces of lava flow, as well as hyaloclastite [54]. Hydrovolcanic tuffs of the Seogwipo formation underlying the basaltic rocks contain consolidated or semi-consolidated sedimentary rocks [55]. Borehole SS-1 showed a distinct tendency for the electrical conductivity of borehole fluid to increase with depth. The values of electrical conductivity were around 1000 μS/cm to a depth of −18 m amsl below groundwater level, and then started to increase drastically from the depth of −28 m amsl, and finally exceeded 40,000 μS/cm in the saltwater zone. The brackish water formed between −18 and −28 m amsl, and the transition zone was about 10 m thick. This transition zone became about 5 m thick in the dry season (November). Three outstanding variations of electrical conductivity were observed. One variation was a sharp increase at the depth of −28 m amsl, and the other variations were decreases at depths of −82 m amsl and −115 m amsl. These points lie on lithological boundaries (between augite olivine basalt and scoria and between tuff and the sedimentary layer).
Deep exploration wells, such as seawater intrusion monitoring wells on Jeju Island, that reach depths sufficient to completely penetrate the aquifer can provide information on aquifer thickness. The inflection point in the temperature gradient beneath the relatively isothermal section can be used to identify the effective of the aquifer, and the depth at which the regional conductive geothermal gradient is unaffected by the movement of cool aquifer waters. In temperature logs, the conductive gradient in the vadose zone was characterized by a linear increase in temperature between the average temperature at the surface and aquifer water at the groundwater table (identified as 1 on the temperature log in Figure 3a). The groundwater table formed at a depth of 1 m amsl (identified as 2 in Figure 3a), and a gradual decrease of temperature was observed at 3 on the temperature log in Figure 3a. The temperature gradually decreased in the freshwater zone and began to increase from the interface between freshwater and saltwater. There was an increase or decrease in temperature wherever the electrical conductivity changed (at 3, 5, and 8 in Figure 3a) and 4 and 6 (Figure 3a) indicate an isothermal temperature gradient zone. In this zone, the borehole fluids move vertically, and therefore they overcome the high geothermal gradient and control the temperature to depths at which borehole fluids cease to flow effectively. Analyzing changes in electrical conductivity and temperature logs, we estimate that aquifers exist at depths of −40 and −80 m amsl, repectively. Below the depth (at 7 in Figure 3a), conductive processes predominate and the ambient geothermal gradient is expressed (marked as 8 in Figure 3a). In general, the temperature profile corresponded well to the change of electrical conductivity; moreover, it represented the remarkable observed variation. Such dramatic variations in temperature mean that groundwater flow (or seawater intrusion) depends on many aquifers in this area. In addition, changes of temperature mostly occurred at lithological boundaries (arrows on the temperature logs).
At borehole SS-2, electrical conductivity increased slowly, and a thick transition zone formed between the depths of −20 and −40 m amsl (Figure 3b). Unlike borehole SS-1, the profiles presented step-like increases in electrical conductivity, indicating that this transition zone can have different hydraulic properties from the surrounding layers. It has been documented that step-like increases in electrical conductivity and temperature are observed with sudden changes over the boundaries of a fracture or aquifer zone [56]. There was little seasonal variation in electrical conductivity. Electrical conductivity of borehole SS-3 showed evidence of a sharp interface at the depth of −60 m amsl and reached up to 30,000 μS/cm in the saltwater zone (Figure 3c). Note that, as in borehole SS-1, there was a sudden decrease of electrical conductivity below the depth of −105 m amsl, which is thought to be part of the saltwater zone. No distinct variation of electrical conductivity was detected at borehole SS-4, thus, this area belongs to the freshwater zone according to the electrical conductivity values (Figure 3d). The vertical profiles of electrical conductivity represent patterns typical of a freshwater–saltwater interface. These patterns, generally, are divided into three classes: sharp interface, transition zone, and a combination of the two. In Susan district, the interface between freshwater and saltwater at boreholes SS-1 and SS-2 had a transition zone, and SS-3 had a sharp interface. The freshwater body gradually thickened in boreholes located farther inland. The transition zone thickened from SS-1 to SS-2, and finally to SS-3. Borehole SS-4 had a low electrical conductivity concentration of 150 μS/cm. On the basis of these findings, the toe of the freshwater–saltwater interface was placed between boreholes SS-3 and SS-4 in this district.
3.2. Characterization of the Behavior of Freshwater and Saltwater Using Borehole Temperature Monitoring
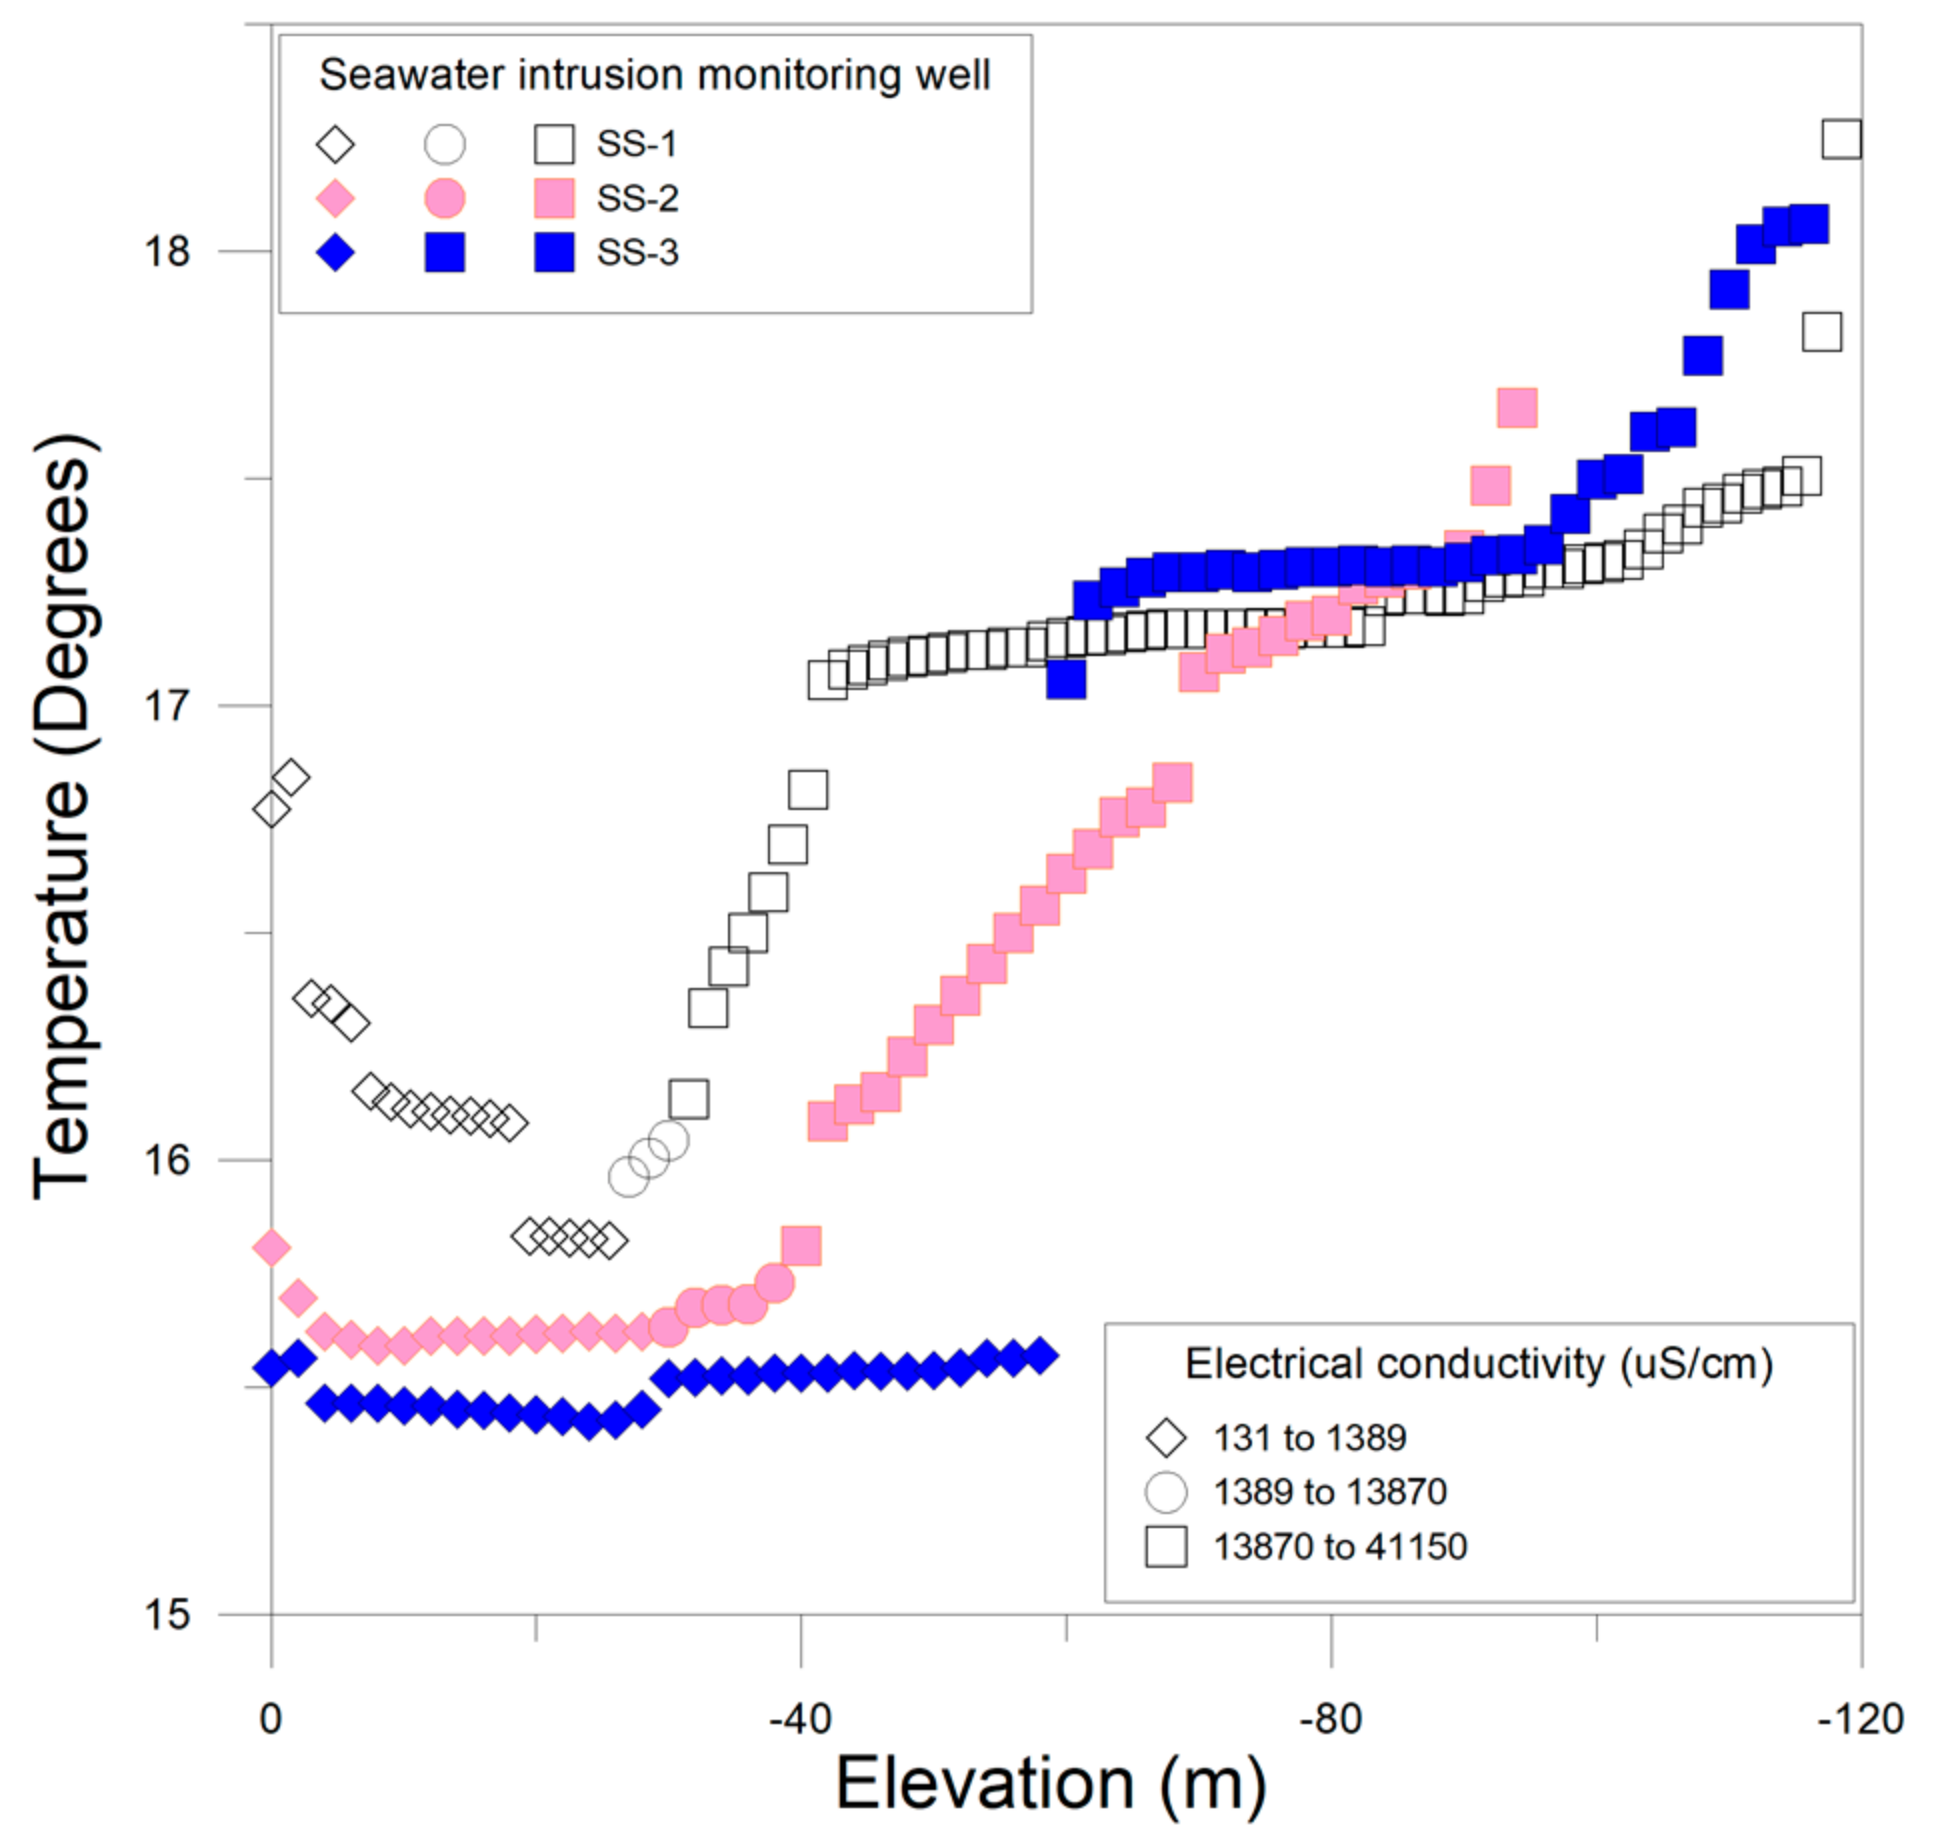
To further understand the freshwater and saltwater flow pattern in a heterogeneous coastal aquifer, temperature monitoring using thermal line sensors was undertaken based on variations in coastal aquifer temperature. Although electrical conductivity has been the most commonly used variable and provides valuable information for addressing seawater intrusion problems, temperature can also give a better understanding of the hydrological dynamics of a coastal aquifer. In addition, as reviewed above, layered sequences and heterogeneous aquifer systems in the eastern part of Jeju Island, probably caused by successive lava flows and sea level change, have led us to monitor the spatial and temporal variations of temperature over the entire depth. Groundwater temperature is usually controlled by depth, and groundwater in different aquifers has different temperatures [57]. Figure 4 gives temperature readings for boreholes SS-1, SS-2, and SS-3 based on electrical conductivity and temperature logs. It shows the variations of coastal aquifers that contain fresh, brackish, and saltwater. In boreholes located farther inland, the temperature in the freshwater zone showed a tendency to decrease, and the bottom depth of the freshwater zone was lowered. It is commonly observed that the low temperature of volcanic aquifers suggests a recharge at high elevation [58]. Therefore, freshwater is cooler than saltwater in the boreholes, creating the contrast required when using thermal line sensors, and therefore the temperature difference can be used as a natural tracer for characterizing coastal aquifers.
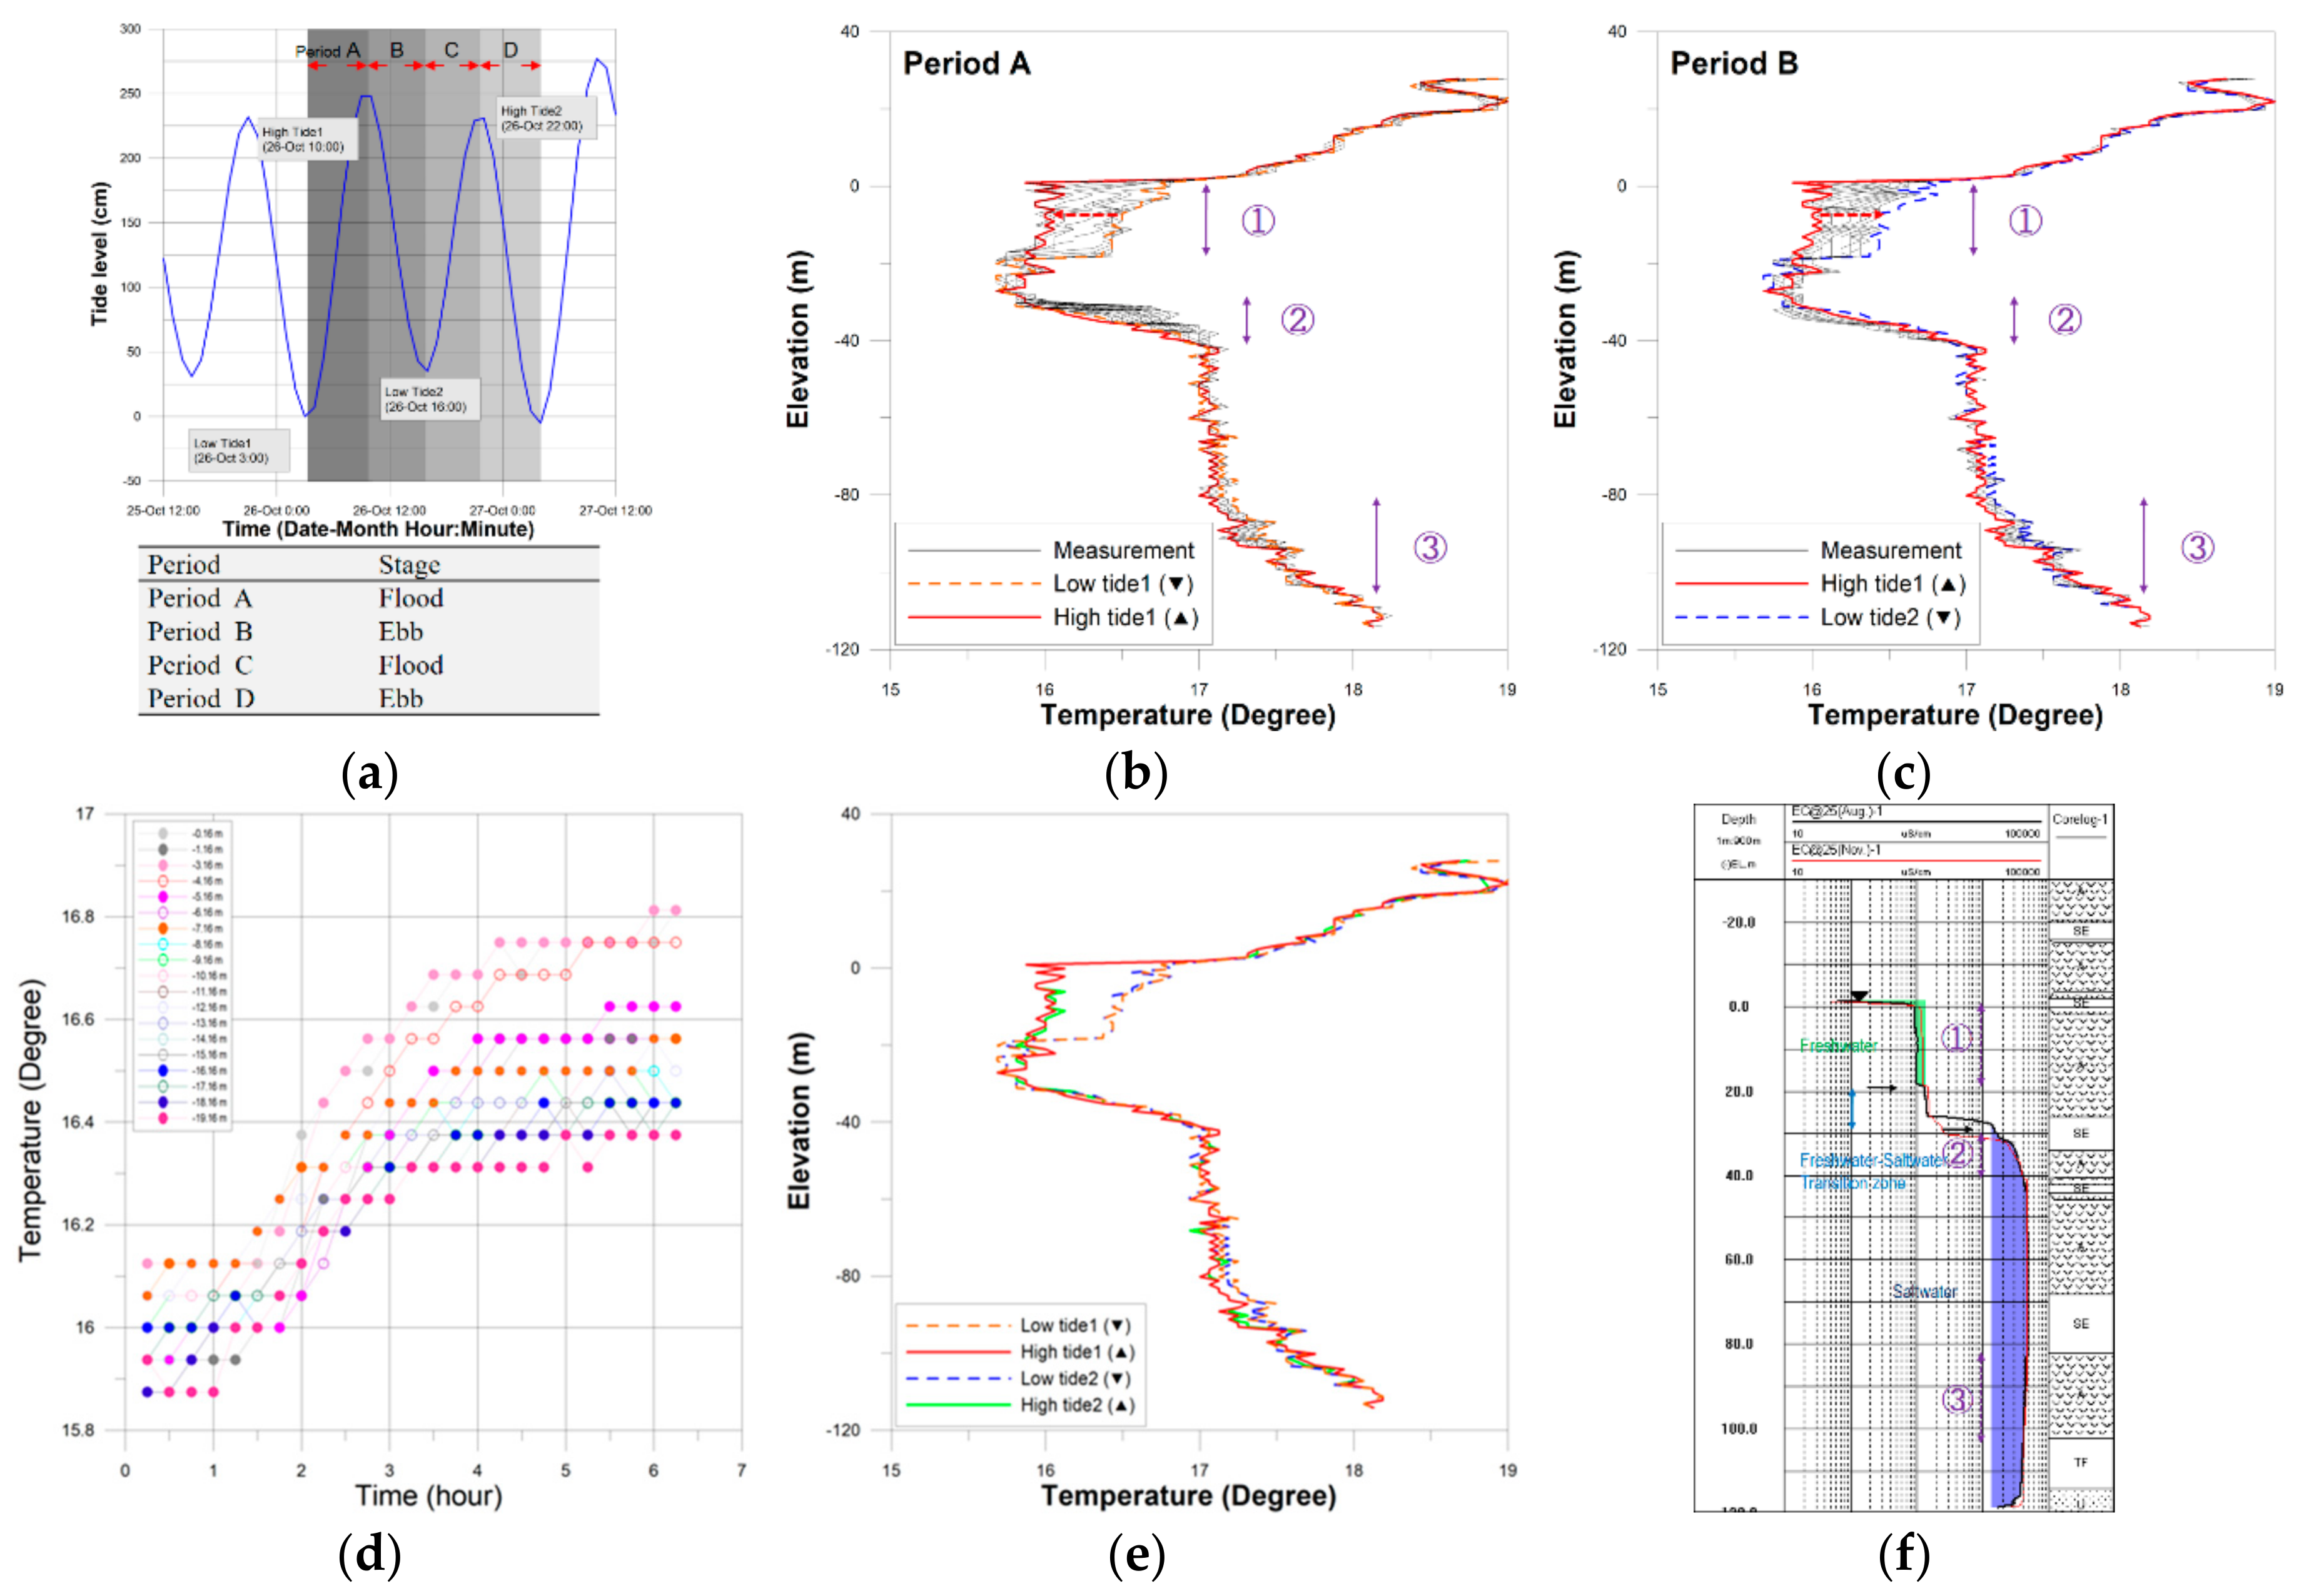
A schematic diagram of temperature monitoring using the thermal line sensor system is shown in Figure 5. Four systems were installed in boreholes SS-1, SS-2, SS-3, and SS-4. The cable was inserted down to the bottom of the boreholes so that measurements could be taken along the entire depth. A small weight was mounted to the thermal line sensor cable to keep the sensors in their target positions. The sensors were spaced 1 m apart, and temperature measurements were taken every 15 min over a period of one month. The measurement settings for the boreholes are summarized in Table 5. Tide level data for the same period were obtained from the Seongsanpo tide station (Figure 1). Figure 6a shows the tidal fluctuations, and the tide cycle for one day is divided into four periods. Period A indicates the flood stage from low tide to high tide, and Period B indicates the ebb from high tide to low tide. Periods C and D likewise indicate flood and ebb, respectively. The main purpose of this classification of the tide cycle is to identify short-term variations of heterogeneous aquifer systems.
The temporal variations of temperature associated with tidal fluctuations were profiled at borehole SS-1. Tide level fluctuations during the measurement period are displayed in Figure 6a, and the maximum difference from low tide to high tide was about 2.5 m. During Period A, the temperature was 16.7 °C at the water surface, decreasing with depth, reaching 15.8 °C at −30 m amsl (Figure 6b). Beginning at the freshwater–saltwater interface, the temperature started to increase up to 18 °C. This temperature reading given by the thermal line sensor corresponded well with that of geophysical well logs, as displayed in Figure 3a. The freshwater temperatures were 1.5 to 2.5 °C cooler than the saltwater temperatures during the measurement period. Therefore, there were sudden temperature increases at the freshwater–saltwater interface. Several abrupt variations in temperature were evident in the upper and lower zones of the monitoring well. The initial temperature gradually dropped with depth from 0 to −20 m amsl (identified as 1) at flood stage (time goes by from Low tide1 to High tide2). It is thought that the freshwater flows toward the coast at this stage, because the temperature of inland freshwater is much lower than that of freshwater near the coast. Although the variation range is not wide, a similar phenomenon was observed from −80 to −100 m amsl (identified as 3). Meanwhile, as reviewed in the temperature logs, isothermal temperature sections were also investigated at depths from −40 to −80 m amsl. This depth serves as the main aquifers, and seawater intrusion occurs especially in the aquifer considering the high electrical conductivity concentration in this area (Figure 6f).
During Period B, the same situations appeared inversely (Figure 6c). In Zone 1, the temperature gradually started to increase after 90 min during ebb tide (Figure 6d). This monitored temporal increase of temperature implied that freshwater flow inland was taking place. The temperature profile in all four periods showed no significant change of the freshwater–saltwater interface due to tidal fluctuations (Figure 6e). In addition, the absolute values of temperature at the two high tides (or low tides) clearly demonstrated the influence of tidal fluctuations on vertically heterogeneous coastal aquifers. Consequently, it was verified that the freshwater and saltwater moved alternately in opposite directions of tidal fluctuations through the main aquifers.
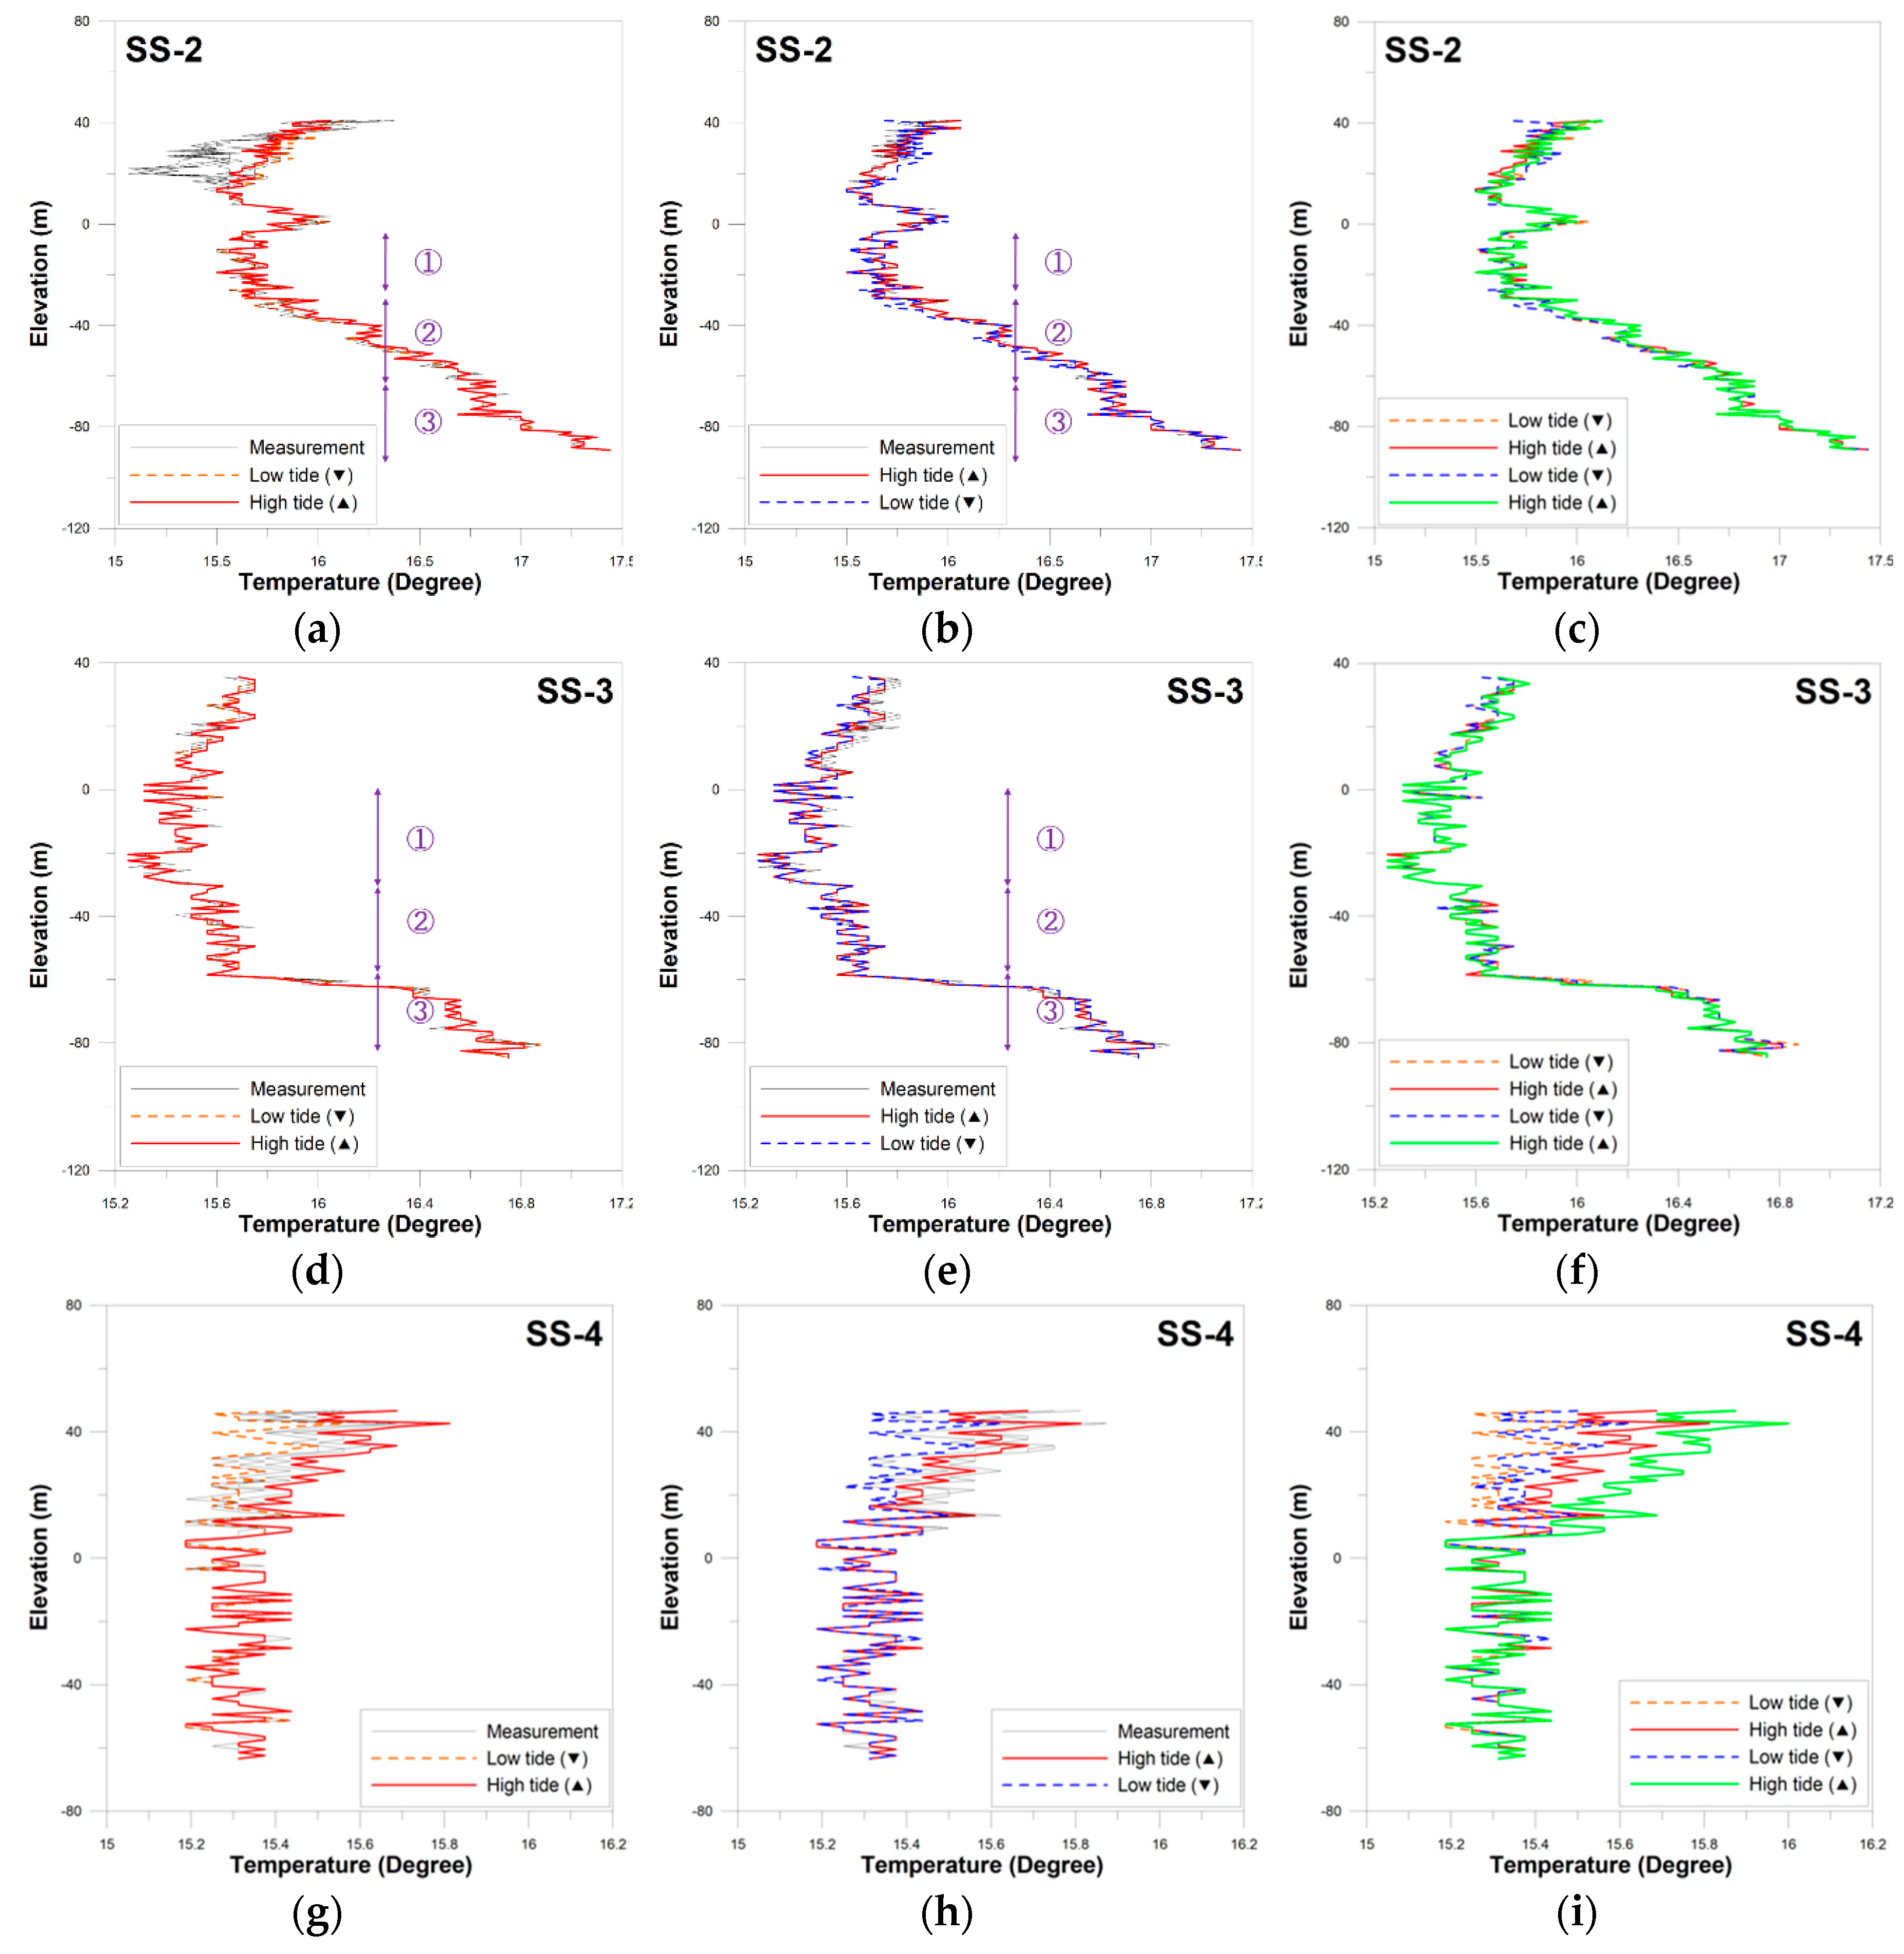
For borehole SS-2 (Figure 7a–c), the freshwater and saltwater zones did not show temperature variations caused by tidal fluctuations. However, there was a small but detectable variation in the transition zone, located at depths from −32 to −62 m amsl. Temperature variations indicated that the flow was directed inland during high tide (Period A) and toward the coast during low tide (Period B). At boreholes SS-3 and SS-4, there were no temporal variations of temperature caused by tidal effects. Increased temperature was found exactly in the interface between freshwater and saltwater (Figure 7d–i).
3.3. Conceptual Model of Heterogeneous Coastal Aquifer System
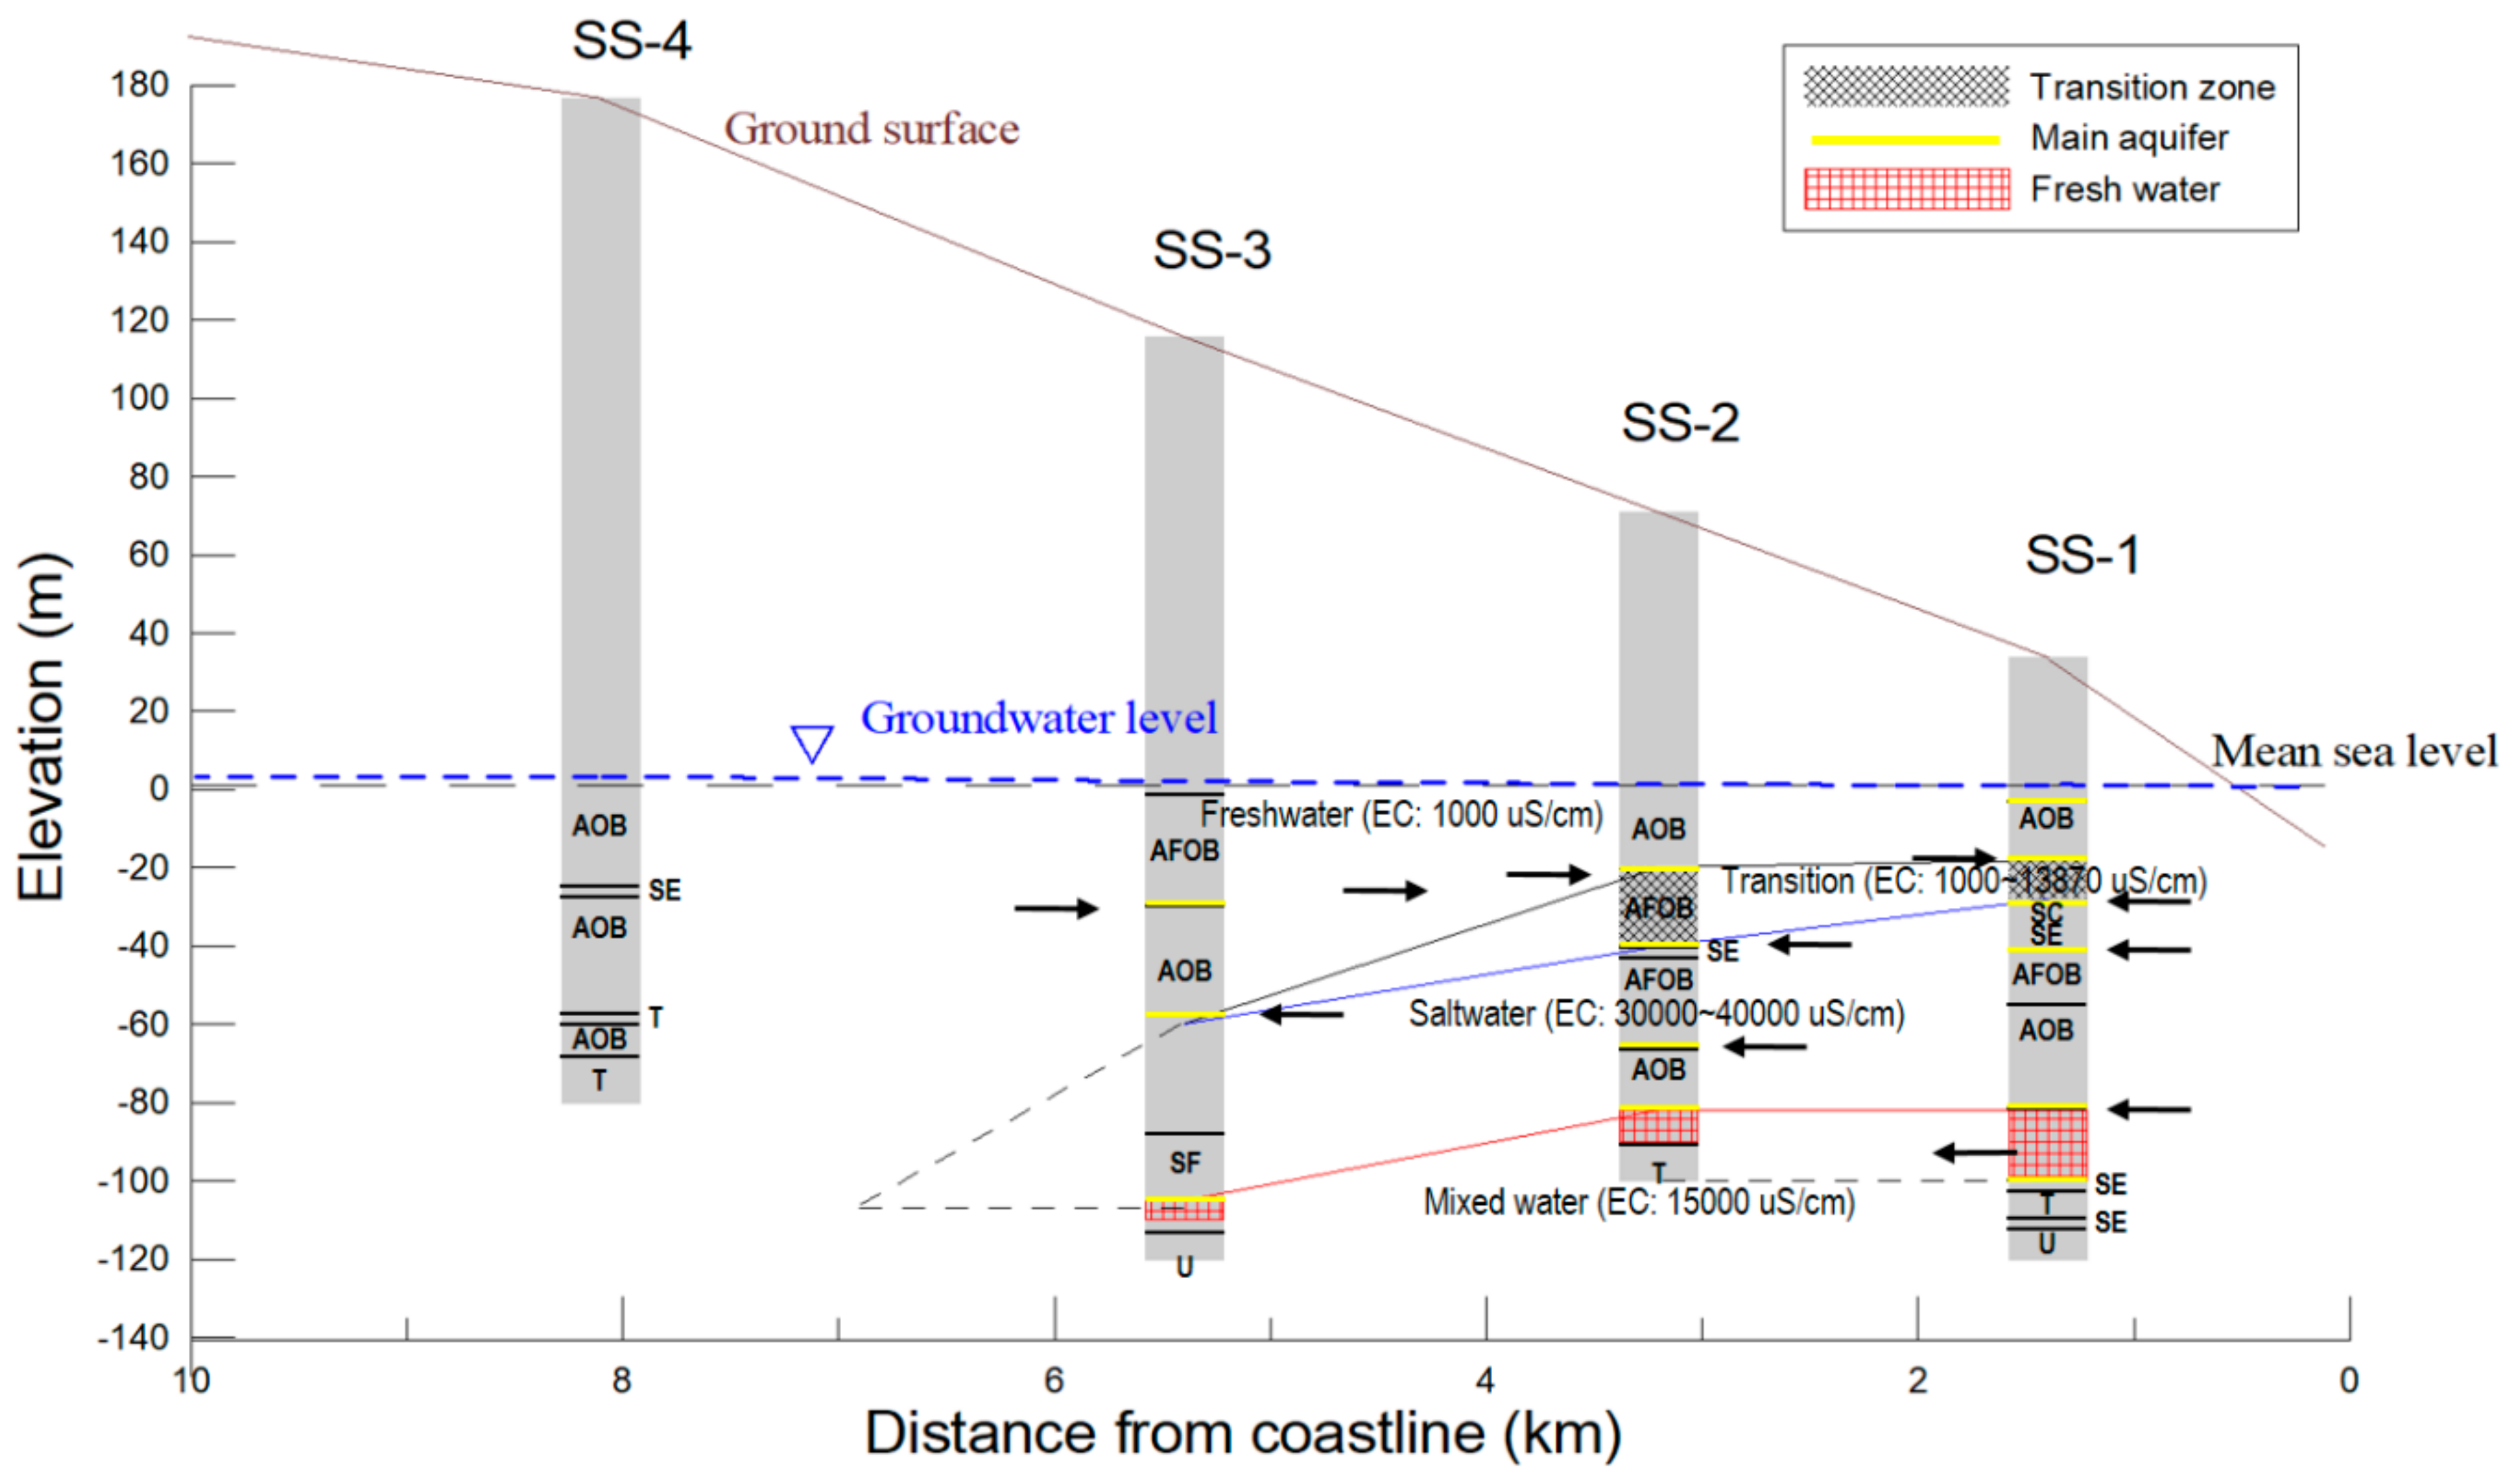
The conceptual model of the heterogeneous coastal aquifer system was suggested by interpreting the data resulting from geophysical well logging and borehole temperature monitoring at the seawater intrusion monitoring wells (Figure 8). At borehole SS-1, the closest borehole to the coast, interfaces between freshwater and saltwater form at –18 and −28 m amsl, and the transition zone is about 10 m thick. These interfaces occur at the boundaries of augite olivine basalt and scoria. Although the interface is governed by seasonal variation, there is no noticeable change with tidal fluctuation. At borehole SS-2, a thick transition zone forms between −20 and −40 m amsl. There is little variation in the saltwater–freshwater interface due to seasonal variation. At borehole SS-3, a sharp interface appears at the depth of −60 m amsl. Borehole SS-4 is located within the freshwater zone. The freshwater body gradually thickens as it moves inland, and the transition zone thickens up to 3.2 km inland from the coast, and finally disappears at less than 5.4 km inland from the coast. The toe of the freshwater–saltwater interface is located between 5.4 and 8.1 km inland from the coast. A low electrical conductivity zone exists below the depths of −82 m amsl (SS-1) and −105 m amsl (SS-3). Multilayered aquifers are expressed by solid yellow lines in each borehole. The behavior of freshwater and saltwater under flood conditions is denoted by arrows. As the sea level rises, seawater tends to move inland and flow through the main aquifer between −40 to −82 m amsl beneath the transition zone. As seawater intrudes farther inland, freshwater in the upper part of the borehole moves in the opposite direction. Consequently, freshwater–saltwater interfaces and aquifers mostly form the geological boundaries, implying that coastal aquifers flow through the boundaries between volcanic formations.
4. Discussion
There have been many attempts to identify groundwater flow systems and seawater intrusion for Jeju Island. These efforts have usually been based on the G-H model, which is accepted as the groundwater management model of the island. However, decreased electrical conductivity has been observed at the bottom depths of boreholes in the coastal area. This phenomenon could not be explained by the traditional conceptual model. The reduction in electrical conductivity implies that seawater intrusion does not occur continuously in the vertical direction. In addition, according to the G-H principle, the vertical thickness of the freshwater body below sea level is 40 times the height of the groundwater level above sea level. However, in the eastern parts of Jeju Island, the thickness ratio of the groundwater level and the freshwater body was approximately 1:29 at borehole SS-1 (with height of groundwater level above sea level of 0.96 m and thickness of the freshwater body below sea level of 28 m, including the transition zone, as shown in Figure 3a and Figure 8). The thickness of the freshwater body appeared to be thinner than theory would predict.
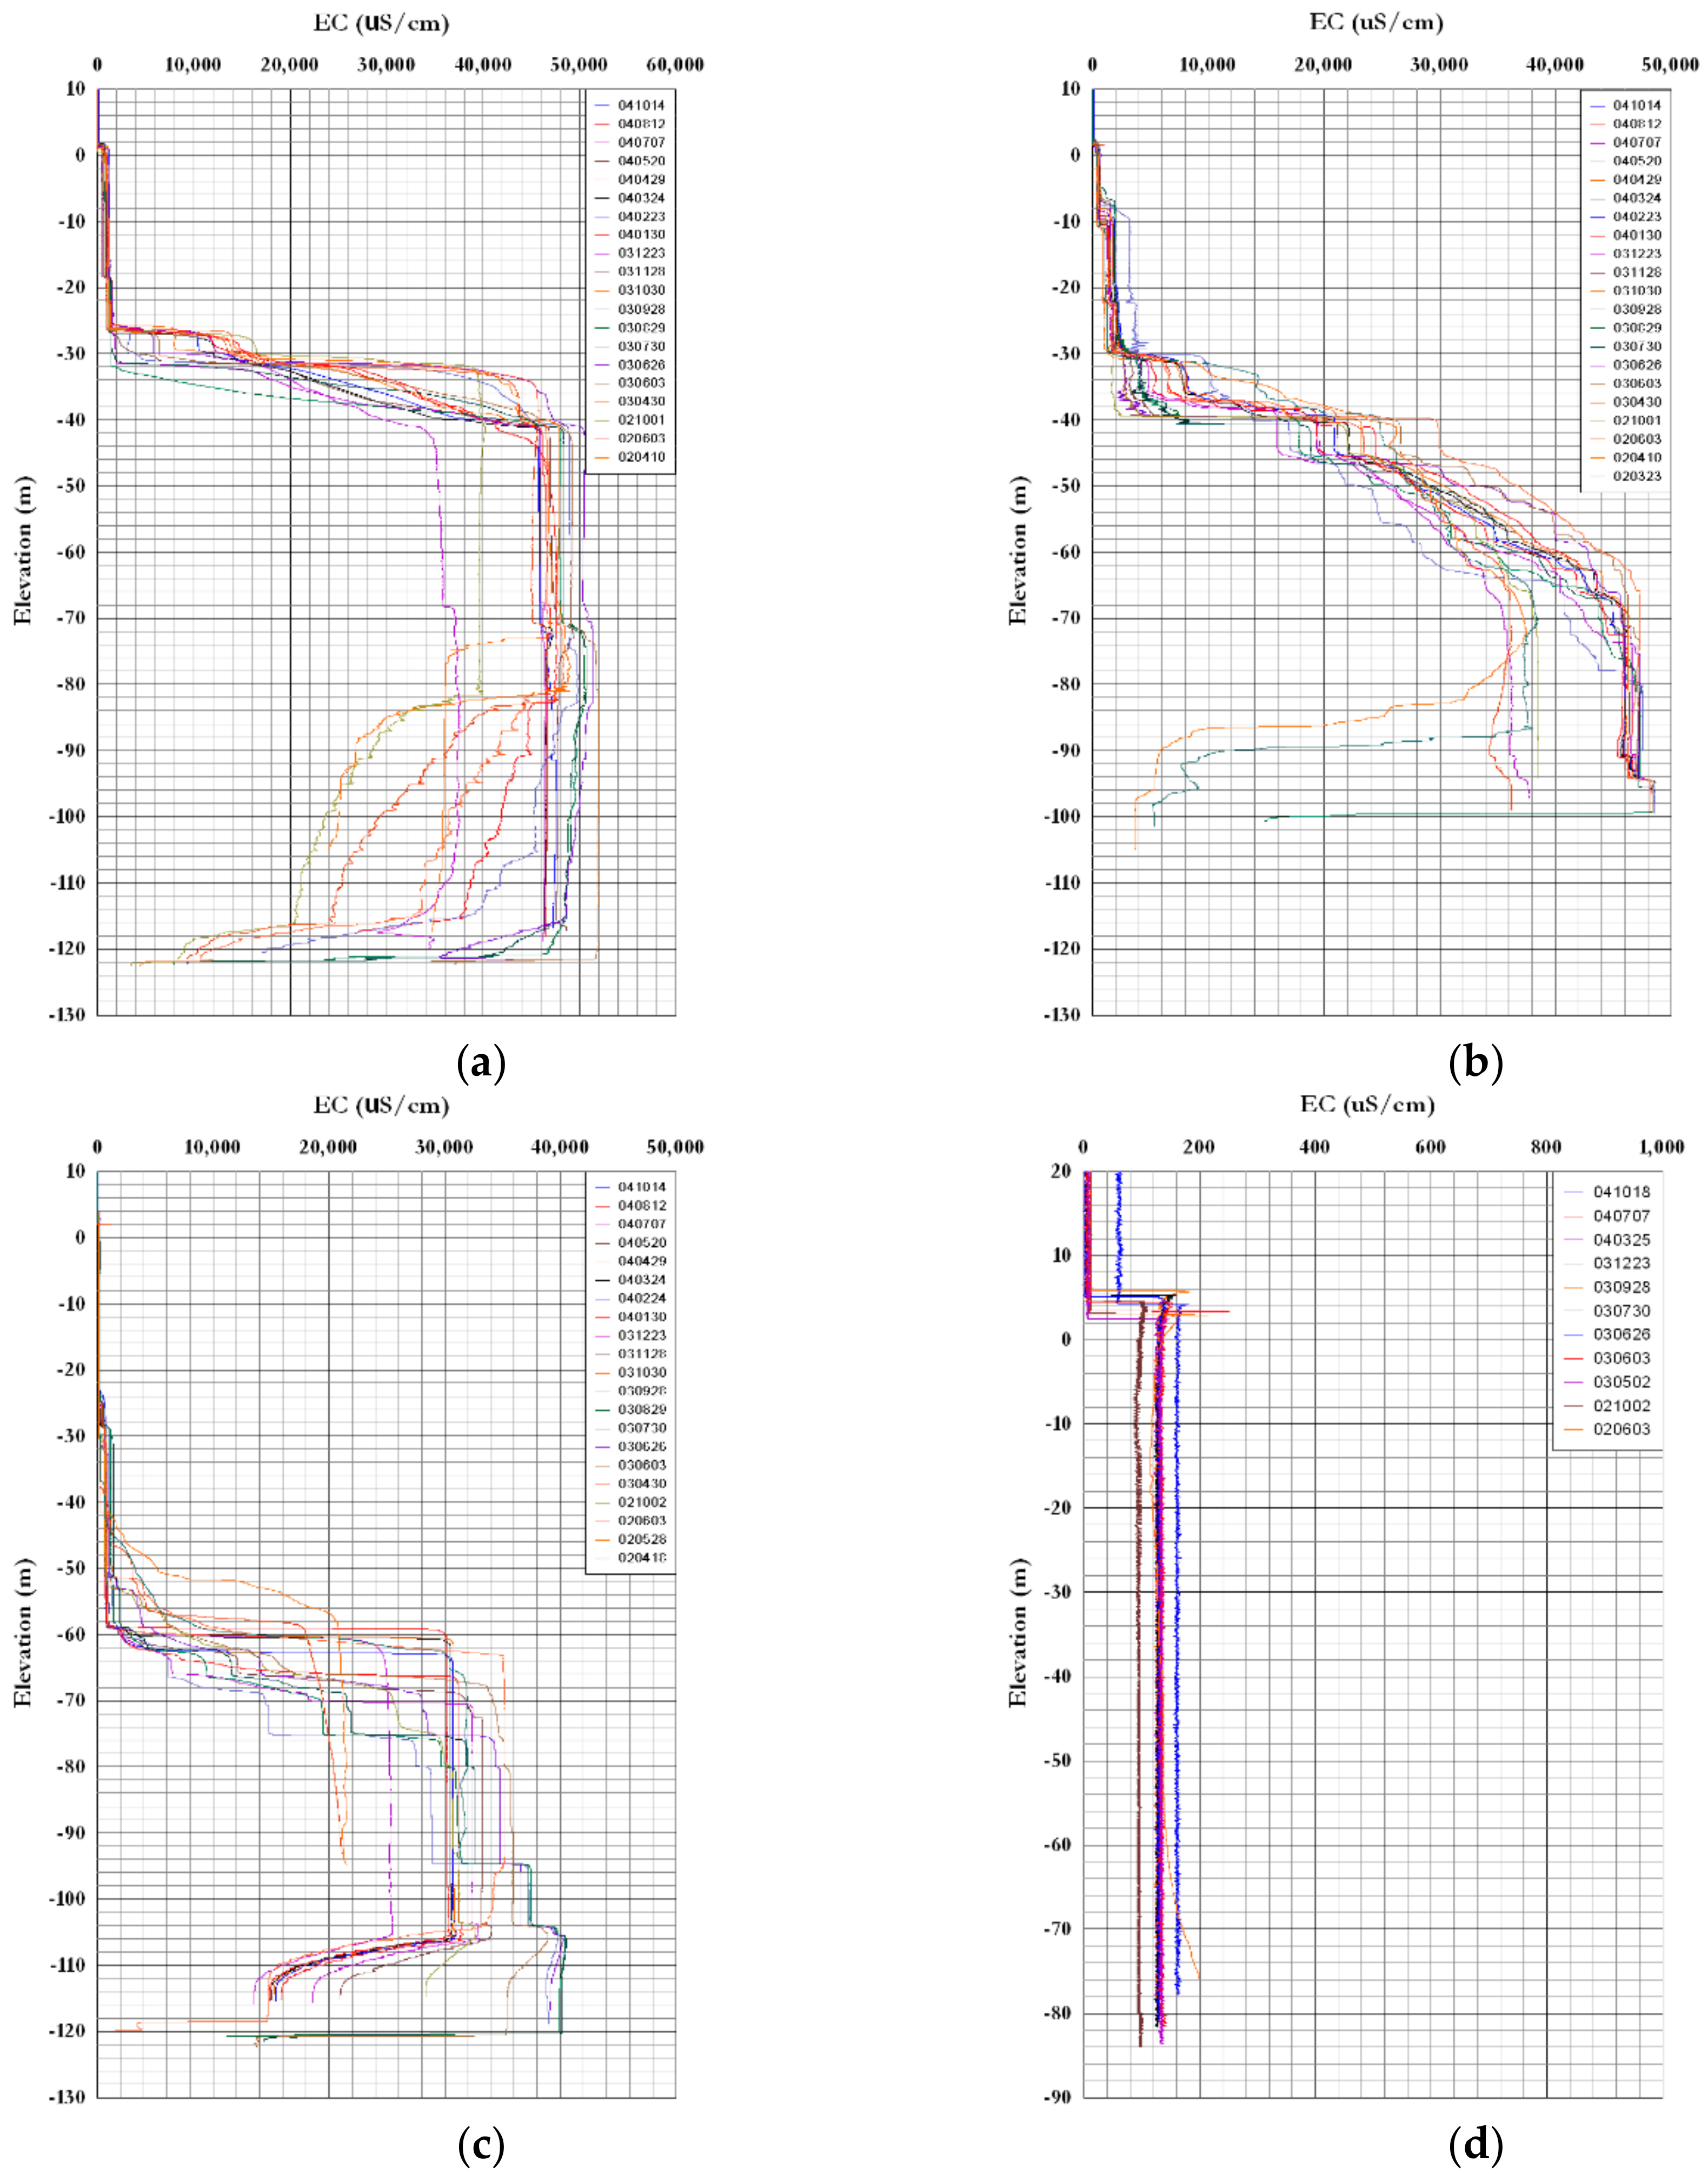
Figure 9 shows the electrical conductivity logs obtained by the Institute of Environmental Resource Research, Jeju Special Self-Governing Province, between 2002 and 2004. All boreholes except SS-4 exhibited decreased electrical conductivity at certain depths, and as time went on, these low electrical conductivity values gradually increased again. Drilling boreholes in the coastal area can break the natural hydrological balance such that seawater flows down through the boreholes due to the density difference between freshwater and saltwater. However, the recent electrical conductivity logs show that decreased electrical conductivity at the bottom depths remains in some areas. This result indicates that some flows exist to prevent dense saltwater from flowing down.
Considering these phenomena, a conceptual model of seawater intrusion was proposed based on the interpretation of geophysical well logging and borehole temperature monitoring data (Figure 10). Seawater intrusion occurs through multilayered aquifers, such as the boundaries between volcanic formations, and it presents a possibility that the groundwater in relatively high-altitude areas flows through the channel at deeper depth and discharges into the ocean. This interpretation closely parallels the results concerning submarine groundwater discharge (SGD) in Jeju Island reviewed by many researchers [59,60,61]. We particularly emphasize the fact that in the current conditions of ambient monitoring, natural vertical flows can occur in the wells and alter the real natural thermal and electrical conductivity of the aquifers. Our preliminary conceptual model is expected to be improved and revised by various measurements of hydrodynamic parameters, such as flowmeter test during pumping or packer test.
5. Conclusions
A wide array of methodological approaches has been devoted to optimizing groundwater management strategies in coastal aquifers of Jeju Island. However, careful consideration should be given to issues of relationships between volcanic aquifer and lithological characteristics. This paper deals with borehole geophysical methods involving the distribution and behavior of freshwater and saltwater. Physical properties such as electrical conductivity and temperature are more responsive to tidal fluctuation than to groundwater level from automatic equipment at seawater intrusion monitoring wells. Geophysical well logging, especially electrical conductivity and temperature logs, delineated freshwater–saltwater interfaces with depth and effectively distinguished between the zones of freshwater and saltwater. Variations in electrical conductivity and temperature were found at the lithological boundary, implying that well logs are a very effective method to understand the complicated subsurface systems caused by successive lava flows. Moreover, based on the dramatic variations in temperature observed, groundwater flow or seawater intrusion can depend on many aquifers in this area.
The sudden decrease of electrical conductivity at the bottom depths created the need for an alternative model to replace the traditional conceptual model. Temperature monitoring using a thermal line sensor system enabled us to characterize the variability of coastal aquifers at high temporal and spatial resolution. After the measurement stage was divided into four periods based on tide level fluctuations, variations in temperature were monitored over the entire depth. The area consisted of heterogeneous aquifer systems, and the behaviors of freshwater and saltwater were identified by temperature monitoring during four periods. On the basis of the interpretation of geophysical well logging and temperature monitoring data, a conceptual model of seawater intrusion was proposed. Coastal aquifers flow through two or more channels with weak vertical connections. In addition, seawater intrusion does not occur continuously in the vertical direction from the bottom depth, but instead occurs through these aquifers, in particular, the multilayered channels that are responsible for the main aquifer as well as the freshwater–saltwater interface formed mainly at lithological boundaries. This finding indicates that the characteristics of coastal aquifers depend on the geological structures present in basalt areas.
Consequently, geophysical well logging and borehole temperature monitoring could enhance our knowledge of subsurface structures of basalt and interactions of freshwater and saltwater in coastal areas. This approach is expected to contribute to a much wider range of investigations of volcanic islands.
Author Contributions
Conceptualization, methodology, investigation, analysis, manuscript writing, review, and editing, J.S. and S.H. All authors have read and agreed to the published version of the manuscript.
Funding
This research was supported by a grant from the Regional Development Research Program funded by the Ministry of Land, Infrastructure and Transport of Korean government (20RDRP-B076272-07) and the Korea Environment Industry & Technology Institute (KEITI) through the Subsurface Environment Management (SEM) Project, funded by the Korea Ministry of Environment (MOE) (2018002440004).
Acknowledgments
Authors sincerely appreciate reviewers’ detailed comments and suggestions, which helped us to improve this article.
Conflicts of Interest
The authors declare no conflict of interest.
References
- Polemio, M.; Walraevens, K. Recent research results on groundwater resources and saltwater intrusion in a changing environment. Water 2019, 11, 1118. [Google Scholar] [CrossRef] [Green Version]
- Barlow, P.M.; Reichard, E.G. Saltwater intrusion in coastal regions of North America. Hydrogeol. J. 2010, 18, 247–260. [Google Scholar] [CrossRef]
- Custodio, E. Coastal aquifers of Europe: an overview. Hydrogeol. J. 2010, 18, 269–280. [Google Scholar] [CrossRef]
- Werner, A.D. A review of seawater intrusion and its management in Australia. Hydrogeol. J. 2010, 18, 281–285. [Google Scholar] [CrossRef]
- Cruz, J.V.; Coutinho, R.; Pacheco, D.; Cymbron, R.; Antunes, P.; Freire, P.; Mendes, S. Groundwater salinization in the Azores archipelago (Portugal). Environ. Earth Sci. 2011, 62, 1273–1285. [Google Scholar] [CrossRef]
- Golshan, M.; Colombani, N.; Mastrocicco, M. Assessing aquifer salinization with multiple techniques along the southern Caspian Sea shore (Iran). Water 2018, 10, 348. [Google Scholar] [CrossRef] [Green Version]
- Herrera, C.; Custodio, E. Conceptual hydrogeological model of volcanic Easter Island (Chile) after chemical and isotopic surveys. Hydrogeol. J. 2008, 16, 1329–1348. [Google Scholar] [CrossRef]
- Charlier, J.B.; Lachassagne, P.; Ladouche, B.; Cattan, P.; Moussa, R.; Voltz, M. Structure and hydrogeological functioning of an insular tropical humid andesitic volcanic watershed: a multi-disciplinary experimental approach. J. Hydrol. 2011, 398, 155–170. [Google Scholar] [CrossRef]
- Lachassagne, P.; Leonardi, V.; Vittecoq, B.; Henriot, A. Interpretation of the piezometric fluctuations and precursors associated with November 29, 2007, magnitude 7.4 earthquake in Martinique (Lesser Antilles). Comptes Rendus Geosci. 2011, 343, 760–776. [Google Scholar] [CrossRef]
- Lachassagne, P.; Aunay, B.; Frissant, N.; Guilbert, M.; Malard, A. High-resolution conceptual hydrogeological model of complex basaltic volcanic islands. A Mayotte, Comoros, case study. Terra Nova 2014, 26, 307–321. [Google Scholar] [CrossRef]
- Helm-Clark, C.M.; Rodgers, D.W.; Smith, R.P. Borehole geophysical techniques to define stratigraphy, alteration and aquifers in basalt. J. Appl. Geophys. 2004, 55, 3–38. [Google Scholar] [CrossRef]
- Broglia, C.; Ellis, D. Effect of alteration, formation absorption, and standoff on the response of the thermal neutron porosity log in gabbros and basalts: examples from Deep Sea Drilling Project-Ocean Drilling Program sites. J. Geophys. Res. 1990, 95, 9171–9188. [Google Scholar] [CrossRef]
- Boldreel, L.O. Wire-line log-based stratigraphy of flood basalts from the Lopra-1/1A well, Faroe Islands. Geol. Surv. Den. Greenl. 2006, 9, 7–22. [Google Scholar]
- Versey, H.R.; Singh, B.K. Groundwater in Deccan basalts of the Betwa basin, India. J. Hydrol. 1982, 58, 279–306. [Google Scholar] [CrossRef]
- Anderson, R.N.; Alt, J.C.; Malpas, J.; Lovell, M.A.; Harvey, P.K.; Pratson, E.L. Geochemical well logging in basalts: The Palisades sill and the oceanic crust of hole 504B. J. Geophys. Res. 1990, 95, 9265–9292. [Google Scholar] [CrossRef]
- Asfahani, J. Basalt characterization by means of nuclear and electrical well logging techniques. Case study form Southern Syria. Appl. Radiat. Isotopes 2011, 69, 641–647. [Google Scholar] [CrossRef]
- Constantz, J.; Thomas, C.L.; Zellweger, G. Influence of diurnal variations in stream temperature on streamflow loss and groundwater recharge. Water Resour. Res. 1994, 30, 3253–3264. [Google Scholar] [CrossRef]
- Becker, M.W.; Georgian, T.; Ambrose, H.; Siniscalchi, J.; Fredrick, K. Estimating flow and flux of groundwater discharge using water temperature and velocity. J. Hydrol. 2004, 296, 221–233. [Google Scholar] [CrossRef]
- Anderson, M.P. Heat as a ground water tracer. Ground Water 2005, 43, 951–968. [Google Scholar] [CrossRef]
- Fairley, J.P.; Nicholson, K.N. Imaging lateral groundwater flow in the shallow subsurface using stochastic temperature fields. J. Hydrol. 2006, 321, 276–285. [Google Scholar] [CrossRef]
- Drury, M.J.; Jessop, A.M.; Lewis, T.J. The detection of groundwater flow by precise temperature measurements in boreholes. Geothermics 1984, 13, 163–174. [Google Scholar] [CrossRef]
- Sorey, M.L. Measurement of vertical groundwater velocity from temperature profiles in wells. Water Resour. Res. 1971, 7, 963–970. [Google Scholar] [CrossRef]
- Barton, C.A.; Zoback, M.D.; Moos, D. Fluid flow along potentially active faults in crystalline rock. Geology 1995, 23, 683–686. [Google Scholar] [CrossRef]
- Greenhouse, J.P.; Pehme, P.E. Monitoring the temperature in a sleeved borehole: Implications for fracture detection. In Proceedings of the 55th Canadian Geotechnical and 3rd Joint IAH-CNC and CGS Ground Water Specialty Conferences, Niagara Falls, ON, Canada, 20–23 October 2002. [Google Scholar]
- Pehme, P.E.; Parker, B.L.; Cherry, J.A.; Blohm, D. Detailed measurement of the magnitude and orientation of thermal gradients in lined boreholes for characterizing groundwater flow in fractured rock. J. Hydrol. 2014, 513, 101–114. [Google Scholar] [CrossRef]
- Pehme, P.E.; Parker, B.L.; Cherry, J.A.; Molson, J.W.; Greenhouse, J.P. Enhanced detection of hydraulically active fractures by temperature profiling in lined heated bedrock boreholes. J. Hydrol. 2013, 484, 1–15. [Google Scholar] [CrossRef]
- McLing, T.L.; Smith, R.P.; Smith, R.W.; Blackwell, D.D.; Roback, R.C.; Sondrup, A.J. Wellbore and groundwater temperature distribution eastern Snake River Plain, Idaho: Implications for groundwater flow and geothermal potential. J. Volcanol. Geothem. Res. 2016, 320, 144–155. [Google Scholar] [CrossRef]
- Smith, R.P. Geologic setting of the Snake River Plain aquifer and vadose zone. Vadose Zone J. 2004, 3, 47–58. [Google Scholar] [CrossRef]
- Helm-Clark, C.M.; Smith, R.P.; Rodgers, D.W.; Knutson, C.F. Neutron log measurement of moisture in unsaturated basalt: Progress and problems. Vadose Zone J. 2004, 3, 485–492. [Google Scholar] [CrossRef]
- Hahn, J.; Lee, Y.; Kim, N.; Hahn, C.; Lee, S. The groundwater resources and sustainable yield of Cheju volcanic island, Korea. Environ. Geol. 1997, 33, 43–53. [Google Scholar] [CrossRef]
- Hamm, S.Y.; Cheong, J.Y.; Jang, S.; Jung, C.Y.; Kim, B.S. Relationship between transmissivity and specific capacity in the volcanic aquifers of Jeju Island, Korea. J. Hydrol. 2005, 310, 111–121. [Google Scholar] [CrossRef]
- Lee, K. On the hydrodynamic balance of fresh and salt waters in the Cheju Island. J. Geol. Soc. Korea 1992, 28, 649–664. [Google Scholar]
- Youn, J.S.; Kim, G.P.; Jung, C.Y. A hydrogeological study on high saline groundwater of Handong-ri in the eastern part of Jeju Island, Korea. J. Geol. Soc. Korea 2003, 39, 115–131. [Google Scholar]
- Choi, S.H.; Kim, Y.K.; Lee, D.Y. Sea water intrusion in the coastal area of Cheju volcanic Island, Korea. J. Korea Inst. Min. Geol. 1991, 24, 319–327. [Google Scholar]
- Kim, Y.; Lee, K.S.; Koh, D.C.; Lee, D.H.; Lee, S.G.; Park, W.B.; Koh, G.W.; Woo, N.C. Hydrogeochemical and isotopic evidence of groundwater salinization in a coastal aquifer: a case study in Jeju volcanic island, Korea. J. Hydrogeol. 2003, 270, 282–294. [Google Scholar] [CrossRef]
- Kim, K.Y.; Seong, H.; Kim, T.; Park, K.H.; Woo, N.C.; Park, Y.S.; Koh, G.W.; Park, W.B. Tidal effects on variations of fresh-saltwater interface and groundwater flow in a multilayered coastal aquifer on a volcanic island (Jeju Island, Korea). J. Hydrol. 2006, 330, 525–542. [Google Scholar] [CrossRef]
- Kim, K.Y.; Chon, C.M.; Park, K.H.; Park, Y.S.; Woo, N.C. Multi-depth monitoring of electrical conductivity and temperature of groundwater at a multilayered coastal aquifer: Jeju Island, Korea. Hydrol. Process. 2008, 22, 3724–3733. [Google Scholar] [CrossRef]
- Lee, B.J.; Koo, M.H.; Park, Y.S.; Koh, G.W.; Park, K.H. Hydraulic diffusivity and possibility of conduit-flow of groundwater in eastern part of Jeju island. J. Geol. Soc. Korea 2006, 42, 439–454. [Google Scholar]
- Jiao, J.J.; Tang, Z. An analytical solution of groundwater response to tidal fluctuation in a leaky confined aquifer. Water Resour. Res. 1999, 35, 747–751. [Google Scholar] [CrossRef] [Green Version]
- Kim, K.H.; Shin, J.Y.; Koh, E.H.; Koh, G.W.; Lee, K.K. Sea level rise around Jeju Island due to global warming and movement of groundwater/seawater interface in the eastern part of Jeju Island. J. Soil Groundw. Environ. 2009, 14, 68–79. [Google Scholar]
- Booh, S.A.; Jeong, G.C. Saline water intrusion into fresh groundwater aquifer of eastern area, the Cheju Island. J. Eng. Geol. 2000, 10, 115–130. [Google Scholar]
- Rotzoll, K.; Oki, D.S.; El-Kadi, A.I. Changes of freshwater-lens thickness in basaltic island aquifers overlain by thick coastal sediments. Hydrogeol. J. 2010, 18, 1425–1436. [Google Scholar] [CrossRef]
- Koh, C.S.; Yoon, S.H.; Hong, J.G.; Jeong, J.O.; Kim, J.J. Stratigraphic analysis of the drilling core in Woljong-ri coastal area, Jeju Island. J. Geol. Soc. Korea 2019, 55, 1–20. [Google Scholar] [CrossRef]
- Park, K.H.; Ahn, J.S.; Kee, W.S.; Park, W.B. Guidebook for a Geological Tour of Jeju Island, 2nd ed.; Korea Institute of Geoscience and Mineral Resources; Jeju Development Institute: Daejeon, Korea, 2006; pp. 15–27. [Google Scholar]
- Jeong, J.O.; Yoon, S.H.; Koh, G.W.; Joe, Y.J.; Hong, J.G.; Kim, J.J. Mineralogical and sedimentological characteristics of the U formation underlying the volcanic strata in Jeju Island, Korea. J. Geol. Soc. Korea 2016, 52, 389–403. [Google Scholar] [CrossRef]
- Koh, D.C.; Chae, G.T.; Yoon, Y.Y.; Kang, B.R.; Koh, G.W.; Park, K.H. Baseline geochemical characteristics of groundwater in the mountainous area of Jeju Island, South Korea: implications for degree of mineralization and nitrate contamination. J. Hydrol. 2009, 376, 81–93. [Google Scholar] [CrossRef]
- Shin, J.; Hwang, S.; Lee, S.; Koh, D.C.; Kim, Y. Characterization of groundwater salinization in the eastern coastal aquifers of Jeju Island, Korea. In Proceedings of the General Assembly 2019 of the European Geosciences Union (EGU), Vienna, Austria, 7–12 April 2019; European Geosciences Union: Vienna, Austria, 2019. [Google Scholar]
- Series, M.E. Determining the mean hydraulic gradient of ground water affected by tidal fluctuations. Ground Water 1991, 29, 549–555. [Google Scholar] [CrossRef]
- Brott, C.A.; Blackwell, D.D.; Ziagos, J.P. Thermal and tectonic implications of heat flow in the eastern Snake River Plain, Idaho. J. Geophys. Res. 1981, 86, 11709–11734. [Google Scholar] [CrossRef]
- Blackwell, D.D. Regional implications of heat flow of the Snake River Plain, northwestern United States. Tectonophysics 1989, 164, 323–343. [Google Scholar] [CrossRef]
- Doughty, C.; Tsang, C.F.; Hatanaka, K.; Yabuuchi, S.; Kurikami, H. Application of direct-fitting, mass integral, and multirate methods to analysis of flowing fluid electric conductivity logs from Horonobe, Japan. Water Resour. Res. 2008, 44, 1–19. [Google Scholar] [CrossRef] [Green Version]
- Fetter, C.W. Applied Hydrogeology, 3rd ed.; Macmillan College Publishing Company: New York, NY, USA, 1994. [Google Scholar]
- Hwang, S.; Park, K.G.; Shin, J.; Lee, S.K. Relationship between the groundwater resistivity and NaCl equivalent salinity in western and southern coastal areas, Korea. Geophys. Geophys. Explor. 2007, 10, 361–368. [Google Scholar]
- Kim, B.S.; Hamm, S.Y.; Lee, C.M.; Ok, S.I.; Cha, E.J.; Ko, Y.S. Features of regional hydrogeology and groundwater distribution of volcanic rocks in Jeju Island. J. Geol. Soc. Korea 2011, 47, 263–276. [Google Scholar]
- Sohn, Y.K.; Park, J.B.; Khin, B.K.; Park, K.H.; Koh, G.W. Stratigraphy, petrochemistry and Quaternary depositional record of the Songaksan tuff ring, Jeju Island, Korea. J. Volcanol. Geothem. Res. 2002, 119, 1–20. [Google Scholar] [CrossRef]
- Cook, P.G.; Love, A.J.; Dighton, J.C. Inferring ground water flow in fractured rock from dissolved radon. Ground Water 1999, 37, 606–610. [Google Scholar] [CrossRef]
- Izbicki, J.A.; Borchers, J.W.; Leighton, D.A.; Kulongoski, J.; Fields, L.; Galloway, D.L.; Michel, R.L. Hydrogeology and Geochemistry of Aquifers Underlying the San Lorenzo and San Leandro Areas of the East Bay Plain, Alameda County, California; Water-Resources Investigations Report 02-4259; U.S. Geological Survey: Sacramento, CA, USA, 2003.
- Toulier, A.; Baud, B.; Montety, V.; Lachassagne, P.; Leonardi, V.; Pistre, S.; Dautria, J.M.; Hendrayana, H.; Fajar, M.H.; Satrya Muhammad, A.; et al. Multidisciplinary study with quantitative analysis of isotopic data for the assessment of recharge and functioning of volcanic aquifers: Case of Bromo-Tengger volcano, Indonesia. J. Hydrol. 2019, 26, 1–30. [Google Scholar] [CrossRef]
- Kim, G.; Lee, K.K. Large submarine groundwater discharge (SGD) from a volcanic island. Geophys. Res. Lett. 2003, 30, 1–4. [Google Scholar] [CrossRef]
- Baek, S.G.; Park, M.E. Exploration and verification of submarine groundwater discharge on Jeju Island by remotely sensed based water quality analysis. Econ. Environ. Geol. 2005, 38, 395–409. [Google Scholar]
- Kim, G.; Hwang, D.W.; Ryu, J.W.; Lee, Y.W. Environmental and ecological consequences of submarine groundwater discharge in the coastal areas of the Korea peninsula. Sea 2005, 10, 204–212. [Google Scholar]
Figure 1.
Locations of seawater intrusion monitoring wells, tide stations, and automatic weather systems on Jeju Island.
Figure 1.
Locations of seawater intrusion monitoring wells, tide stations, and automatic weather systems on Jeju Island.

Figure 2.
Temporal variation of ocean tide level, groundwater level, electrical conductivity, and temperature in seawater intrusion monitoring wells. Boreholes (a) SS-1; (b) SS-2; (c) SS-3; and (d) SS-4.
Figure 2.
Temporal variation of ocean tide level, groundwater level, electrical conductivity, and temperature in seawater intrusion monitoring wells. Boreholes (a) SS-1; (b) SS-2; (c) SS-3; and (d) SS-4.

Figure 3.
Profiles of electrical conductivity, geology, and temperature at boreholes for Susan district. (a) SS-1; (b) SS-2; (c) SS-3; and (d) SS-4. The red circle expresses monitoring sensor’s location in each borehole. Red and black arrows indicate the variation of electrical conductivity and temperature, respectively.

Figure 4.
Temperature variations of coastal aquifers in Susan district.

Figure 5.
Schematic diagram of temperature monitoring using thermal line sensor system.

Figure 6.
Temperature monitoring results with thermal line sensor in borehole SS-1. (a) Tide level; (b) temperature during Period A; (c) temperature during Period B; (d) temperature in Zone 1 during Period B; (e) temperature profiles at high and low tides; (f) electrical conductivity logs.
Figure 6.
Temperature monitoring results with thermal line sensor in borehole SS-1. (a) Tide level; (b) temperature during Period A; (c) temperature during Period B; (d) temperature in Zone 1 during Period B; (e) temperature profiles at high and low tides; (f) electrical conductivity logs.

Figure 7.
Temperature monitoring results with thermal line sensor in boreholes SS-2, 3, and 4. (a) SS-2 temperature during Period A; (b) SS-2 temperature during Period B; (c) SS-2 temperature at high and low tides; (d) SS-3 temperature during Period A; (e) SS-3 temperature during Period B; (f) SS-3 temperature at high and low tides; (g) SS-4 temperature during Period A; (h) SS-4 temperature during Period B; (i) SS-4 temperature at high and low tides.

Figure 8.
Conceptual model of heterogeneous coastal aquifer system proposed from the data interpretation of geophysical well logging and borehole temperature monitoring. Solid black and blue lines indicate the bottom of the freshwater body and transition zone, respectively. Solid red line represents the decrease of electrical conductivity. Arrows denote the coastal aquifer groundwater flow during flooding.

Figure 9.
Periodic electrical conductivity logs from 2002 to 2004 (Institute of Environmental Resource Research, Jeju Special Self-Governing Province). Boreholes (a) SS-1; (b) SS-2; (c) SS-3; and (d) SS-4.
Figure 9.
Periodic electrical conductivity logs from 2002 to 2004 (Institute of Environmental Resource Research, Jeju Special Self-Governing Province). Boreholes (a) SS-1; (b) SS-2; (c) SS-3; and (d) SS-4.

Figure 10.
Conceptual model of seawater intrusion on the eastern coast of Jeju Island.


Table 1.
Details of seawater intrusion monitoring wells in the eastern part of Jeju Island. EL. m, means above mean sea level (amsl).
Table 1.
Details of seawater intrusion monitoring wells in the eastern part of Jeju Island. EL. m, means above mean sea level (amsl).
| District | Borehole | Elevation (EL. m) | Distance from Coastline (km) | Drilling Depth (EL. m) | Sensor Depth (EL. m) |
|---|---|---|---|---|---|
| Handong | HD-1 | 15.38 | 0.9 | −159.62 | −39.15 |
| HD-2 | 42.73 | 2.5 | −159.67 | −35.03 | |
| HD-3 | 112.89 | 5.2 | −149.11 | −67.57 | |
| HD-4 | 190.99 | 8.8 | −179.01 | −20.87 | |
| Jongdal | JD-1 | 14.48 | 1.7 | −141.52 | −37.36 |
| JD-2 | 52.79 | 2.9 | −147.21 | −51.13 | |
| JD-3 | 100.47 | 5.5 | −151.53 | −63.65 | |
| JD-4 | 167.55 | 8.4 | −162.45 | −58.68 | |
| JD-5 | 201.36 | 10.8 | −206.61 | −48.19 | |
| Susan | SS-1 | 33.84 | 1.4 | −117.16 | −30.68 |
| SS-2 | 70.79 | 3.2 | −125.10 | −37.63 | |
| SS-3 | 115.53 | 5.4 | −151.47 | −63.38 | |
| SS-4 | 176.61 | 8.1 | −146.39 | −21.47 | |
| Hacheon | HC-1 | 25.78 | 0.8 | −110.22 | −51.73 |
| HC-2 | 58.88 | 2.4 | −121.12 | −59.82 | |
| HC-3 | 87.45 | 4.0 | −98.55 | −46.90 | |
| HC-4 | 117.99 | 6.1 | −112.01 | −31.63 |
Table 2.
Classification of water based on total dissolved solids [52], range of specific electrical conductivity, and NaCl equivalent salinity [53].
| Class | Total Dissolved Solid (ppm) | Specific Electrical Conductivity 1 (μS/cm) | NaCl Equivalent Salinity (ppm) |
|---|---|---|---|
| Fresh | 0–1000 | 0–1389 | 0–676 |
| Brackish | 1000–10,000 | 1389–13,870 | 676–8504 |
| Salt | 10,000–100,000 | 13,870–138,696 | 8504–106,885 |
1 Fluid electrical conductivity values are compensated by a standard temperature of 25 °C.
Table 3.
Technical specifications of borehole temperature monitoring system.
| Monitoring Device | |
| Memory | 1 or 2 Mb |
| Interface | RS232C or RS485 |
| Number of connected control units | Up to 32 units with RS485 port |
| Operating temperature | −20 to 50 °C |
| Power supply | Rechargeable NiMH 12 V, 2700 mAh |
| AC adapter | 15 V, 1.6 A (operational and recharging power) |
| Thermal Line Sensor | |
| Measurement range | −55 to 125 °C |
| Accuracy | ±0.5 °C |
| Resolution | 0.0625 °C |
| Sensor spacing | Variable (>10 cm) |
| Cable diameter | 8 mm |
| Sensor module diameter | 15 mm |
| Cable length | Up to 300 m |
Table 4.
Indices of lithology.
| Lithology | Index |
|---|---|
| Acicular feldspar basalt | AFOB |
| Augite olivine basalt | AOB |
| Sediment | SE |
| Scoria | SC |
| Trachybasalt | TB |
| Mudstone | MS |
| Seogwipo formation | SF |
| Tuff | T |
| U formation | U |
Table 5.
Measurement settings for temperature monitoring using thermal line sensor system.
| Measurement Parameter | SS-1 | SS-2 | SS-3 | SS-4 |
|---|---|---|---|---|
| Time (min) | 15 | 15 | 15 | 15 |
| Spacing (m) | 1 | 1 | 1 | 1 |
| Points | 150 | 130 | 120 | 110 |
© 2020 by the authors. Licensee MDPI, Basel, Switzerland. This article is an open access article distributed under the terms and conditions of the Creative Commons Attribution (CC BY) license (http://creativecommons.org/licenses/by/4.0/).
Share and Cite
MDPI and ACS Style
Shin, J.; Hwang, S. A Borehole-Based Approach for Seawater Intrusion in Heterogeneous Coastal Aquifers, Eastern Part of Jeju Island, Korea. Water 2020, 12, 609. https://doi.org/10.3390/w12020609
AMA Style
Shin J, Hwang S. A Borehole-Based Approach for Seawater Intrusion in Heterogeneous Coastal Aquifers, Eastern Part of Jeju Island, Korea. Water. 2020; 12(2):609. https://doi.org/10.3390/w12020609
Chicago/Turabian StyleShin, Jehyun, and Seho Hwang. 2020. "A Borehole-Based Approach for Seawater Intrusion in Heterogeneous Coastal Aquifers, Eastern Part of Jeju Island, Korea" Water 12, no. 2: 609. https://doi.org/10.3390/w12020609
Note that from the first issue of 2016, this journal uses article numbers instead of page numbers. See further details here.