Nutrient Recovery from Anaerobically Treated Blackwater and Improving Its Effluent Quality through Microalgae Biomass Production

1
Faculty of Environmental Sciences and Natural Resource Management (MINA), Norwegian University of Life Sciences (NMBU), P.O. Box 5003, NO-1432 Ås, Norway
2
Faculty of Science and Technology, Norwegian University of Life Sciences (NMBU), P.O. Box 5003, NO-1432 Ås, Norway
3
Norwegian Institute of Bioeconomy Research (NIBIO), P.O. Box 115, NO-1431 Ås, Norway
*
Author to whom correspondence should be addressed.
Water 2020, 12(2), 592; https://doi.org/10.3390/w12020592
Submission received: 27 December 2019
/
Revised: 4 February 2020
/
Accepted: 18 February 2020
/
Published: 21 February 2020
(This article belongs to the Special Issue Hybrid Systems Using Different Technologies for Wastewater Treatment and Reuse)
Abstract
:The blackwater stream of domestic wastewater contains energy and the majority of nutrients that can contribute to a circular economy. Hygienically safe and odor-free nutrient solution produced from anaerobically treated source-separated blackwater through an integrated post-treatment unit can be used as a source of liquid fertilizer. However, the high water content in the liquid fertilizer represents a storage or transportation challenge when utilized on agricultural areas, which are often situated far from the urban areas. Integration of microalgae into treated source-separated blackwater (BW) has been shown to effectively assimilate and recover phosphorus (P) and nitrogen (N) in the form of green biomass to be used as slow release biofertilizer and hence close the nutrient loop. With this objective, a lab-scale flat panel photobioreactor was used to cultivate Chlorella sorokiniana strain NIVA CHL 176 in a chemostat mode of operation. The growth of C. sorokiniana on treated source-separated blackwater as a substrate was monitored by measuring dry biomass concentration at a dilution rate of 1.38 d−1, temperature of 37 °C and pH of 7. The results indicate that the N and P recovery rates of C. sorokiniana were 99 mg N L−1d−1 and 8 mg P L−1d−1 for 10% treated BW and reached 213 mg N L−1d−1 and 35 mg P L−1d−1, respectively when using 20% treated BW as a substrate. The corresponding biomass yield on light, N and P on the 20% treated BW substrate were 0.37 g (mol photon)−1, 9.1 g g−1 and 54.1 g g−1, respectively, and up to 99% of N and P were removed from the blackwater.
1. Introduction
There is an increasing interest in biogas production from organic wastes, wastewater sludge and animal waste using anaerobic digestion (AD). Recent studies have also shown the use of AD for the treatment of source-separated domestic blackwater [1,2,3,4,5]. The effluent of an AD reactor is rich in nutrients, particularly N and P. Without proper treatment, excess nitrogen and phosphorus in discharged AD effluents can lead to downstream eutrophication and ecosystem damage. The increasing amount of AD effluent and the need for its appropriate disposal presents a challenge for biogas plants. This would be a serious problem if the direct use of AD effluents as fertilizer in agriculture is not permitted, or even if permitted, the large agricultural area required may not be available in the near vicinity of biogas plants and often result in long transportation distances [6]. Hence, storage, transportation and application of the nutrient solution for use in agricultural fields becomes a challenge. It should also be noted that, as compared to the typical agricultural, municipal, and industrial wastewater, AD effluents have relatively low levels of carbon. Most of the organic carbon is converted to methane and microbial biomass during the anaerobic digestion [7] but high concentrations of dissolved nutrients mainly ammonium nitrogen and orthophosphate are retained in the effluent. Hence, the removal of nitrogen from such effluent, with a very low carbon/nitrogen (C/N) ratio, can often be limited in conventional wastewater plants (WWTPs) because organic carbon is a limiting factor for denitrification [8]. Innovative bacterial nitrogen removal pathways such as shortcut nitrification/denitrification [9,10,11], simultaneous nitrification/denitrification [12,13,14], and the nitritation-anammox process [8,15,16] can remove nitrogen with low or zero dosage of organic carbon sources [17]. These processes, however, do not allow N recovery as a resource.
The core principles of a circular (bio)economy are based on the recycling and re-use of resources towards sustainable approaches, which require a holistic resource utilization and protection of the ecosystems. Using AD effluents as a resource and combining AD effluent treatment with the production of microalgae-based bioproducts can overcome several of the major challenges. The need for nutrients for the production of bioproducts from microalgae on the one hand and the threats from the release of AD effluents, on the other hand, open up opportunities for combined solutions. For a sustainable production of microalgae, the value of anaerobically digested effluent as a low-cost nutrient supplement has been evaluated in a number of studies [18,19] and was found to be promising. At the same time, converting the nutrients from AD effluents into microalgae biomass results in an improved effluent quality fulfilling the permitted concentrations of N and P for the safe discharge into the environment. The recovery of nitrogen through microalgae biomass could also enhance the environmental quality by reducing the nitrous oxide (N2O) emission. Nitrous oxide is a major greenhouse gas (GHG) with a global warming potential of about 300 times that of CO2 over a 100-year time period [20]. Similarly, the challenges in domestic wastewater treatment can be addressed through the integration of a source-separation sanitation system with AD and nutrient recovery technologies. Through this integration of a source-separated sanitation system with AD and nutrient recovery technologies the local recovery of N and P can be optimized, the need for mineral fertilizer and the associated or indirect energy and transportation costs reduced, and the risk of environmental impact minimized. To overcome the challenge posed by storage and transportation, the locally treated and hygienized nutrient solution recovered from the source-separated blackwater need to be up-concentrated in smaller volumes.
The use of a wide range of microalgae such as Chlorella, Scenedesmus, Phormidium, Botryococcus, Chlamydomonas and Spirulina for treating domestic wastewater has been reported and effectiveness of this method was found to be encouraging [21,22,23,24]. Only very few studies have shown the feasibility of using microalgae to recover nutrients from concentrated urine or source-separated blackwater [25,26]. Moreover, the nitrogen in the AD effluent is mainly in the form of ammonium [27]. Dilution of the AD effluent is usually needed before feeding to algae in order to avoid the potential ammonium inhibition of algal growth [28]. In addition, as there is a significant amount of bacteria in the AD effluent, proper pretreatment, such as filtration and autoclaving, may be necessary to prevent the contamination of algae production systems [7]. Chlorella sorokiniana was used in this study to evaluate the opportunities and challenges of using microalgae as an option for nutrient recovery from source-separated and anaerobically treated blackwater. This study also aims to assess the nutrient removal efficiency of C. sorokiniana and its potential to improve effluent quality. Biomass concentration, productivity, and biomass yield on light, N and P were studied in a chemostat mode of operation.
2. Materials and Methods
2.1. Culture Media and Strain
Anaerobically digested, post-treated (after filtration and ultraviolet (UV) treatment), and hygienized blackwater effluent [29] was used as a substrate for a continuous microalgae culture. The nutrient concentrations of the treated blackwater and a defined medium used for microalgae cultivation are shown in Table 1. The defined medium contained the following ingredients: NaNO3 (1.5 g L−1), MgSO4·7H2O (0.1 g L−1), KH2PO4 (0.05 g L−1), K2HPO4 (0.1 g L−1), NaHCO3 (0.084 g L−1), CaCl2·2H2O (0.05 g L−1) and 1 mL L−1 of Hutner’s trace elements [30].
Ammonium nitrogen was the main form of N in the treated blackwater (Table 1). Nitrite and nitrate concentrations in the treated blackwater were negligible at the start of this experiment. However, increased nitrite and nitrate concentrations have been registered later due to the installation of a membrane bioreactor after the sludge blanket anaerobic baffled reactor to remove dissolved methane but the ammonium nitrogen still represented more than 80 % of the inorganic N. Similarly, about 85% of the P in the effluent of the anaerobic reactor was orthophosphate. Although, NH4-N and PO4-P have been the main forms of N and P, the N in treated blackwater is taken as the sum of NH4-N, NO3-N and NO2-N. After diluting the treated blackwater, the concentrations of Mg and other micronutrients were low in the treated blackwater treatment [29], so that these nutrients were supplemented to avoid limiting the growth of C. sorokiniana. The NH4:PO4 ratio in the treated blackwater ranges from 11 to 14 which is close to the required Redfield ratio of 16:1 N:P ratio usually reported for phytoplankton [31]. In the defined medium NO3-N as NaNO3 and PO4-P as KH2PO4 and K2HPO4 were used as a source of N and P, respectively.
Chlorella sorokiniana strain NIVA CHL 176, obtained from the Norwegian Culture Collection of Algae (NORCCA) [32] is a eukaryotic, unicellular microalga with spherical cells of 5–10 μm diameter [33]. Chlorella sorokiniana was selected because of its high maximal specific growth rate of 0.27 h−1 and its tolerance to high irradiance, high temperature and high CO2 concentrations [34].
2.2. Photobioreactor (PBR) Set-Up and Culture Conditions
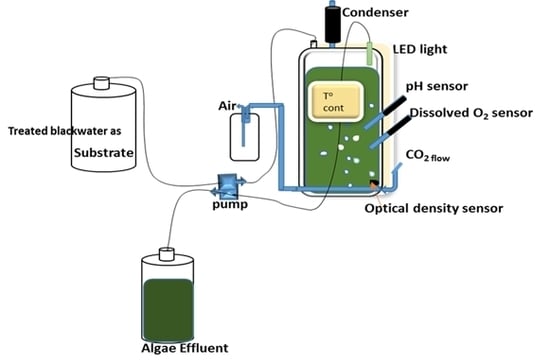
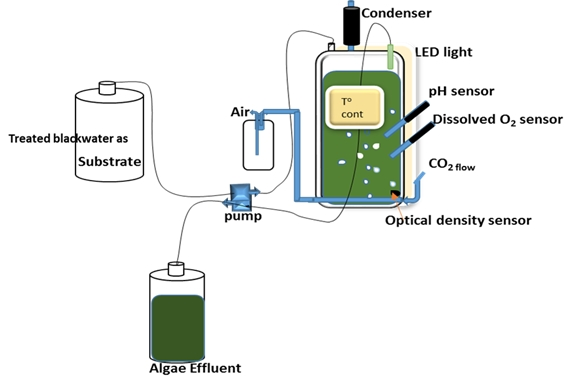
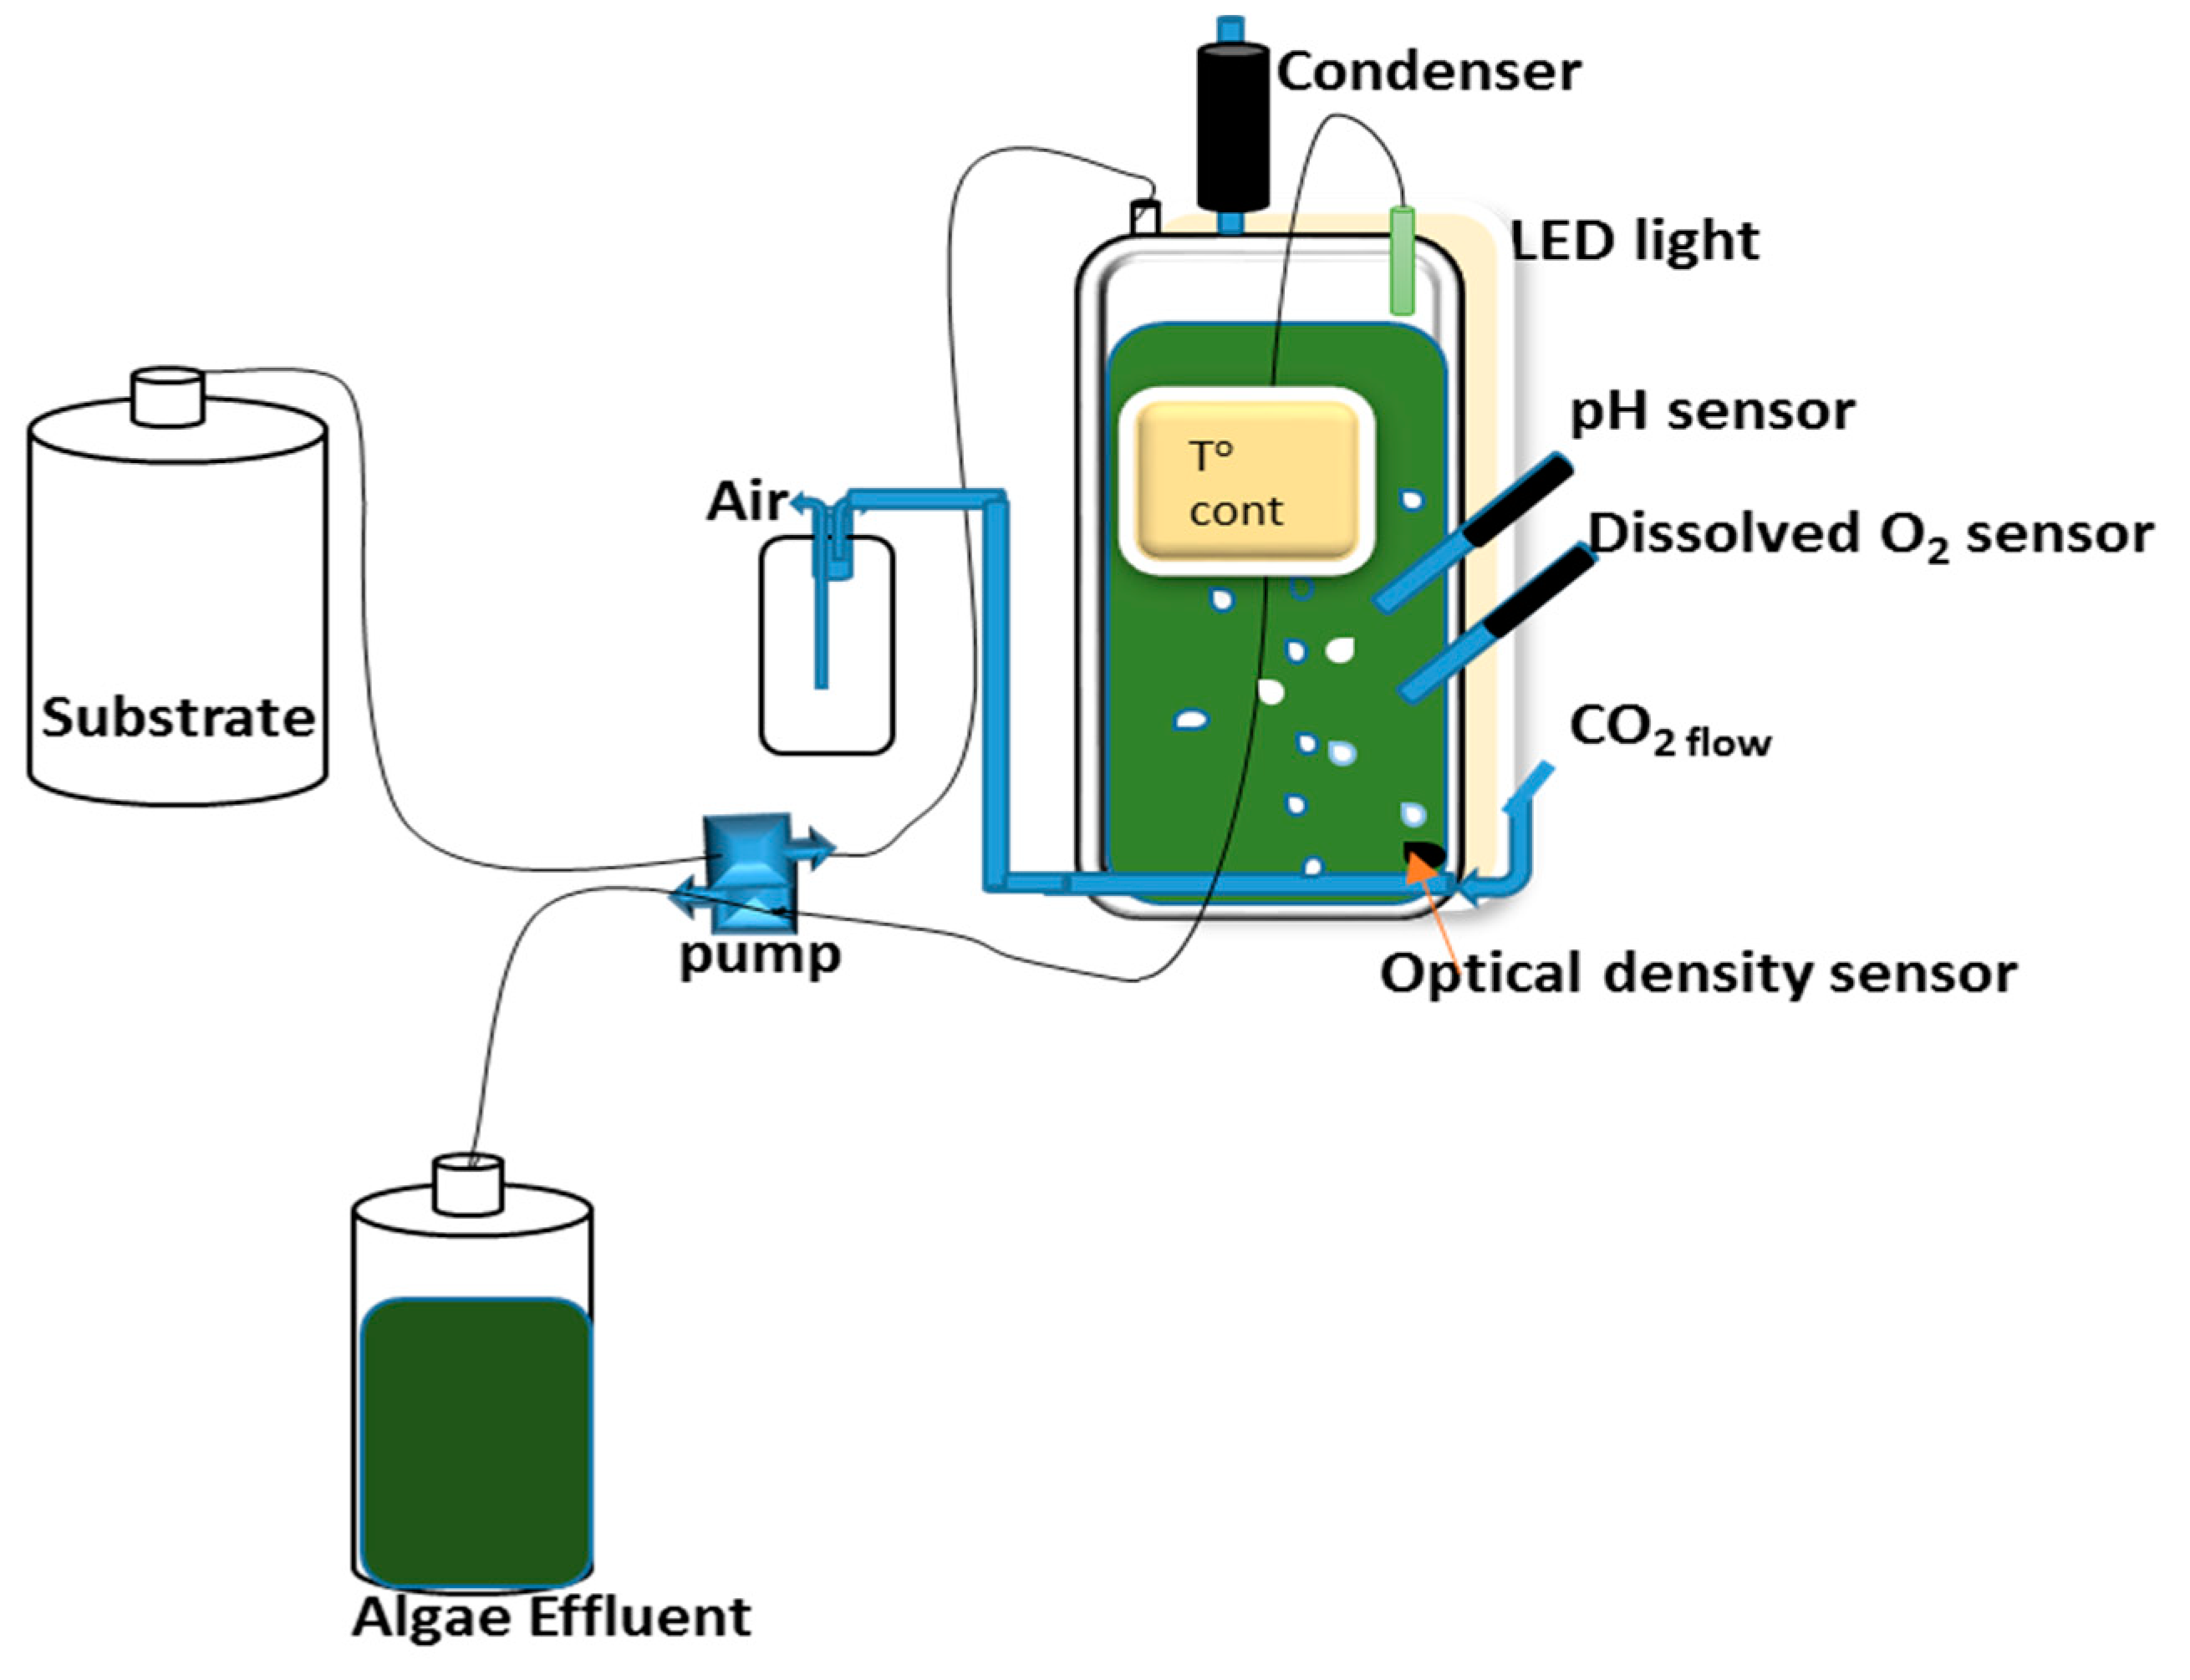
Two flat panel photobioreactors (PBR) with outer dimensions of 240 × 360 × 40 mm (W × H × D) and respective inner dimensions of 180 × 300 × 30 mm, resulting in culture chamber volumes of 1.6 L and light paths of 30 mm [35] were continuously illuminated by light-emitting diode (LED) panels on illuminated surface areas of 0.054 m2 with an average light intensity of 1450 μmol photons m−2 s−1. The culture volumes were kept at 1.3 L. The photobioreactor systems were equipped with a control system for controlling and logging of multiple parameters such as temperature, pH, optical density (OD), and dissolved oxygen (DO) as described in Skjånes et al. [35] (Figure 1). The continuous culture was operated as a chemostat with the temperature controlled at 37 ± 0.1 °C and the pH at 7.0 ± 0.5 by intermittent addition of CO2 (0.1 L min−1). The culture was mixed by aeration with compressed air at a flow rate of 2 L min−1. After the chemostat stabilized with the defined medium at a dilution rate of 1.38 d−1, the medium was replaced by 10% and 20% treated blackwater, respectively, as a hygienized nutrient solution from anaerobically digested blackwater effluent [30] and operated with the same dilution rate of 1.38 d−1. For optimizing the nutrient uptake MgSO4·7H2O (0.1 g L−1), KH2PO4/K2HPO4, NaHCO3 (0.084 g L−1), CaCl2·2H2O (0.05 g L−1) and 1 mL L−1 Hutner’s trace elements [29] were added in some of the experiments (see results).
2.3. Nutrient Analysis and Algae Growth Determination
Samples of the substrate and the culture were taken once a day. NH4-N, NO2-N, NO3-N, and PO4-P were analyzed using the Hach-Lange kits LCK 303, LCK 339, LCK 342, and LCK 348/350, respectively, on a DR-3900 spectrophotometer. The growth of Chlorella sorokiniana was monitored by optical density (OD) and dry biomass concentration (X) but only dry biomass concentration was used during this manuscript. For dry biomass determination, 2 ml of well-mixed undiluted samples were taken in 2 ml tubes and centrifuged at 15,000 rpm for 2 min. The supernatant decanted and the biomass was dried at 105 °C overnight. The volumetric Pv (g L−1 d−1) and areal PA (g m−2 d−1) biomass productivity refer to the amount of biomass produced (dry biomass concentration X) at a defined flow rate per unit volume (area) per day and was calculated with Equation 1, respectively:
X = dry biomass concentration (g L−1), Q = flow rate (L d−1), V = culture volume in photobioreactor (L), and A is illuminated surface area (m2).
Nitrogen removal efficiency Nreff (N as the sum of NH4-N, NO2-N and NO3-N) and phosphorous removal efficiency Preff as, PO4-P (from the substrate were calculated as follows:
and
where Ni is the influent nitrogen concentration of the substrate (mg N L−1), Ne is effluent nitrogen concentration (mg N L−1), Pi is influent phosphorus concentration of the substrate (mg P L−1), Pe is effluent phosphorus concentration (mg P L−1). (Ni-Ne) and (Pi-Pe) is the change in influent and effluent N (ΔN) and P (ΔP) concentrations, respectively.
The biomass yield on substrate YX/S is defined as the ratio of the amount of biomass produced to the amount of substrate consumed (g biomass per g substrate). The biomass yield on the substrate for N as YX/N (g g −1) and for P as YX/P (g g −1) was then calculated as:
and
The nitrogen removal rate Nr (mg N L−1 d−1, as the sum of NH4-N, NO2-N and NO3-N) and the phosphorus removal rate Pr (mg P L−1 d−1, as PO4-P) were calculated according to Equations (6) and (7) [36]:
and
The efficiency of light utilization YX/Ph (g (mol photons)−1) of C. sorokiniana is expressed as biomass yield on light energy in grams of dry matter per mol of photosynthetically active radiation (PAR) photons supplied during steady state. YX/Ph (g (mol photons)−1) was calculated according to Equation 8 by dividing the total amount of biomass produced per day by the total amount of light irradiated to the photobioreactor, as described by Cuaresma et al. [37]:
where Ch is the culture volume harvested during one day (L d−1), X is dry biomass concentration measured (g L−1), PFD is the photon flux density (mol photons m−2 s−1) and A is illuminated surface area (m2).
The nutrient removal yield in relation to the used amount of light YNr/Ph (mg N (mol photons)−1 and YPr/Ph (mg P (mol photons)−1 by the 24 h average PAR LED light illuminated at the surface area of the PBR is calculated according to Equations 9 and 10 [38].
and
2.4. Statistical Analysis
The basic features of the data set were described using descriptive statistics and average and standard deviation (±) are reported. Wherever necessary, unstacked one way analysis of variance (ANOVA) was used to measure the variation between treatments. An alpha level of 0.05 used to determine statistical significance for the analyses.
3. Results
3.1. Biomass Productivity and Nutrient Removal with a Defined Medium
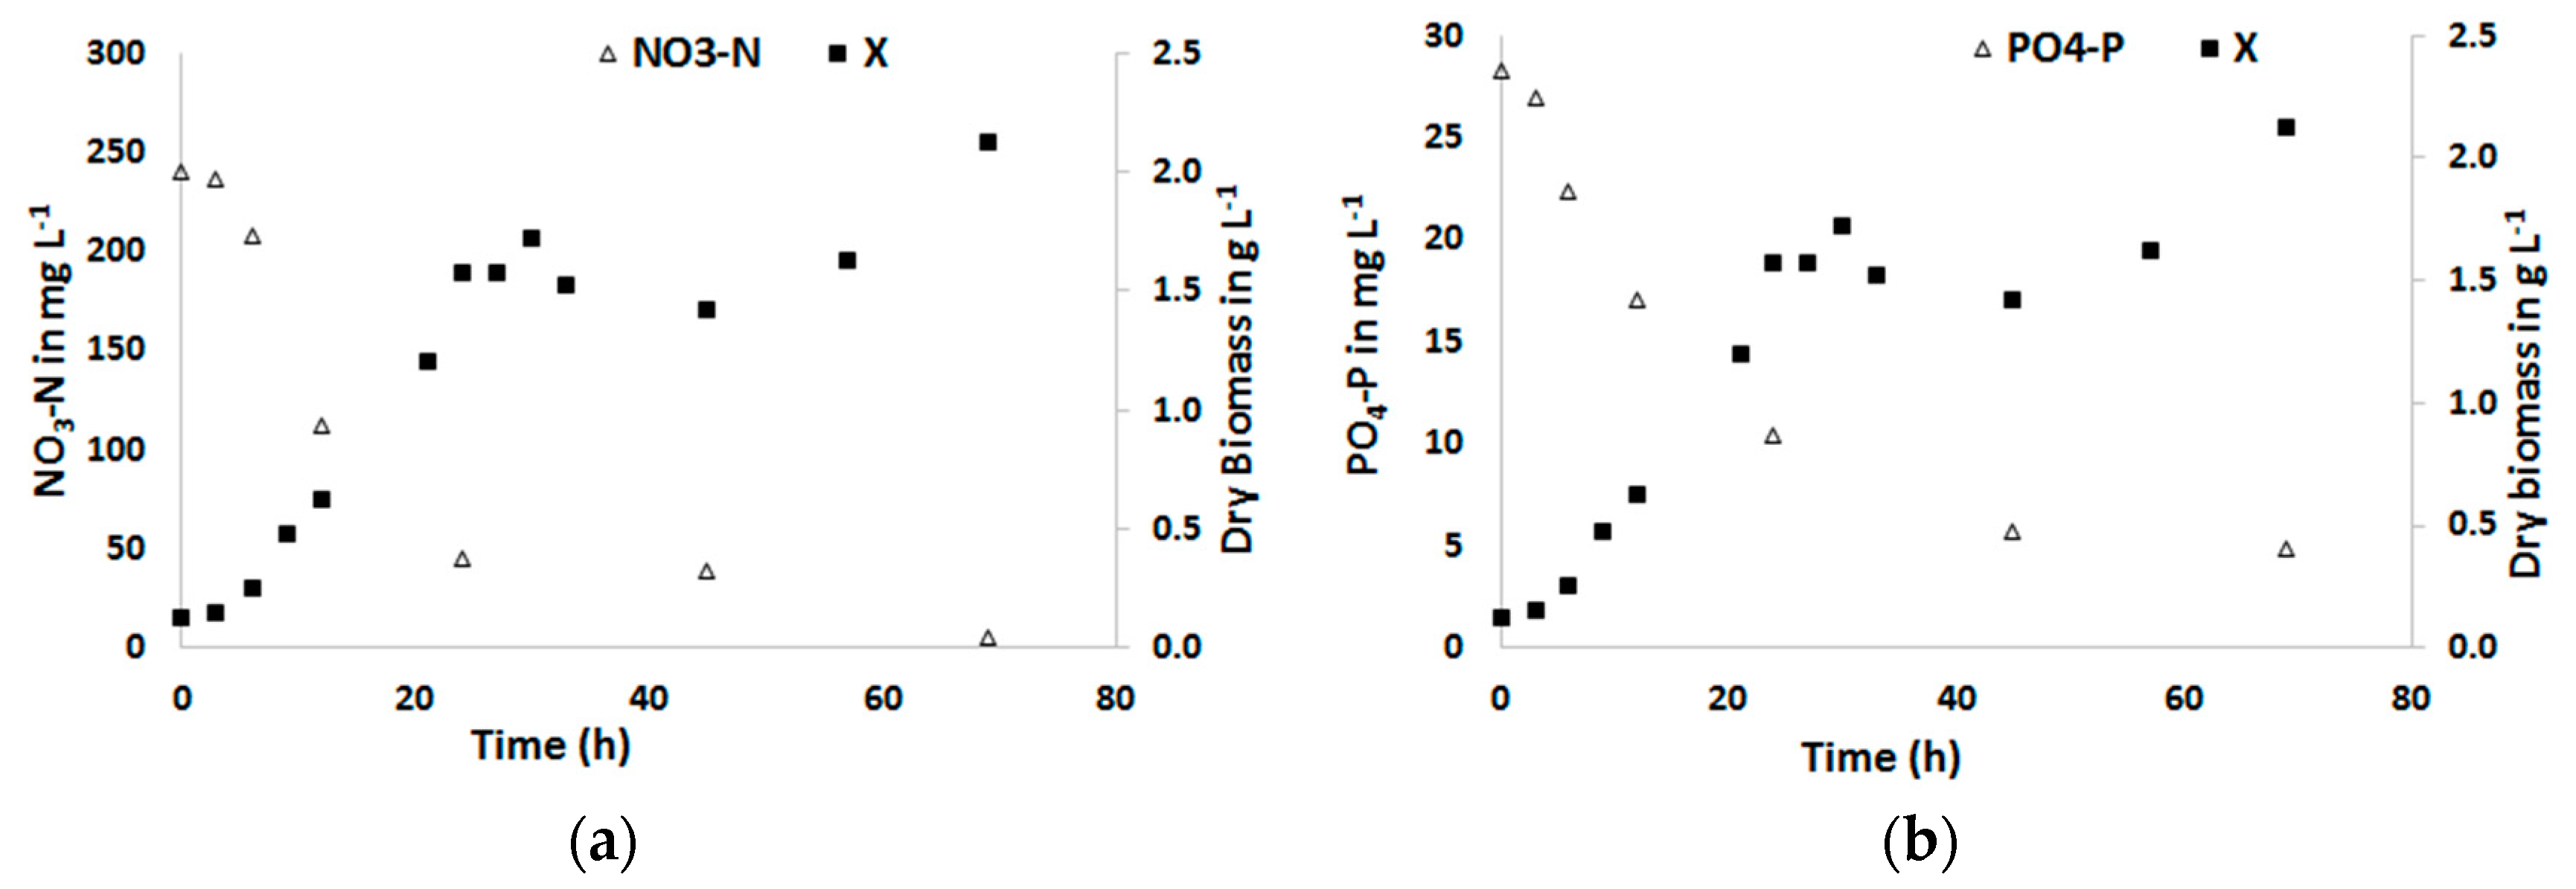
Figure 2 displays the dry biomass concentrations X of Chlorella sorokiniana as grown in the defined medium and the effluent concentration of N as NO3−N, and P as PO4−P. The N:P ratio of the defined medium was 8.7 which is by far less than the Redfield ratio of 16:1 for planktons [31]. The results indicate that the growth of C. sorokiniana started immediately without a clear lagging phase and the dry biomass concentration stabilized after reaching ca. 1.7 g L−1 from an initial concentration of 0.12 g L−1 in about 30 h. The average biomass concentration during steady state was 1.58 ± 0.21 g L−1.The average biomass production rate or volumetric productivity at steady state was on average 2.17 ± 0.245 g L−1 d−1, which corresponds to an aerial productivity of 52.2 g m−2 d−1. The average biomass yield of C. sorokiniana on light during this period was 0.42 ± 0.05 g dry weight (mol photons)−1. Comparable results have been reported in other studies as well [26].
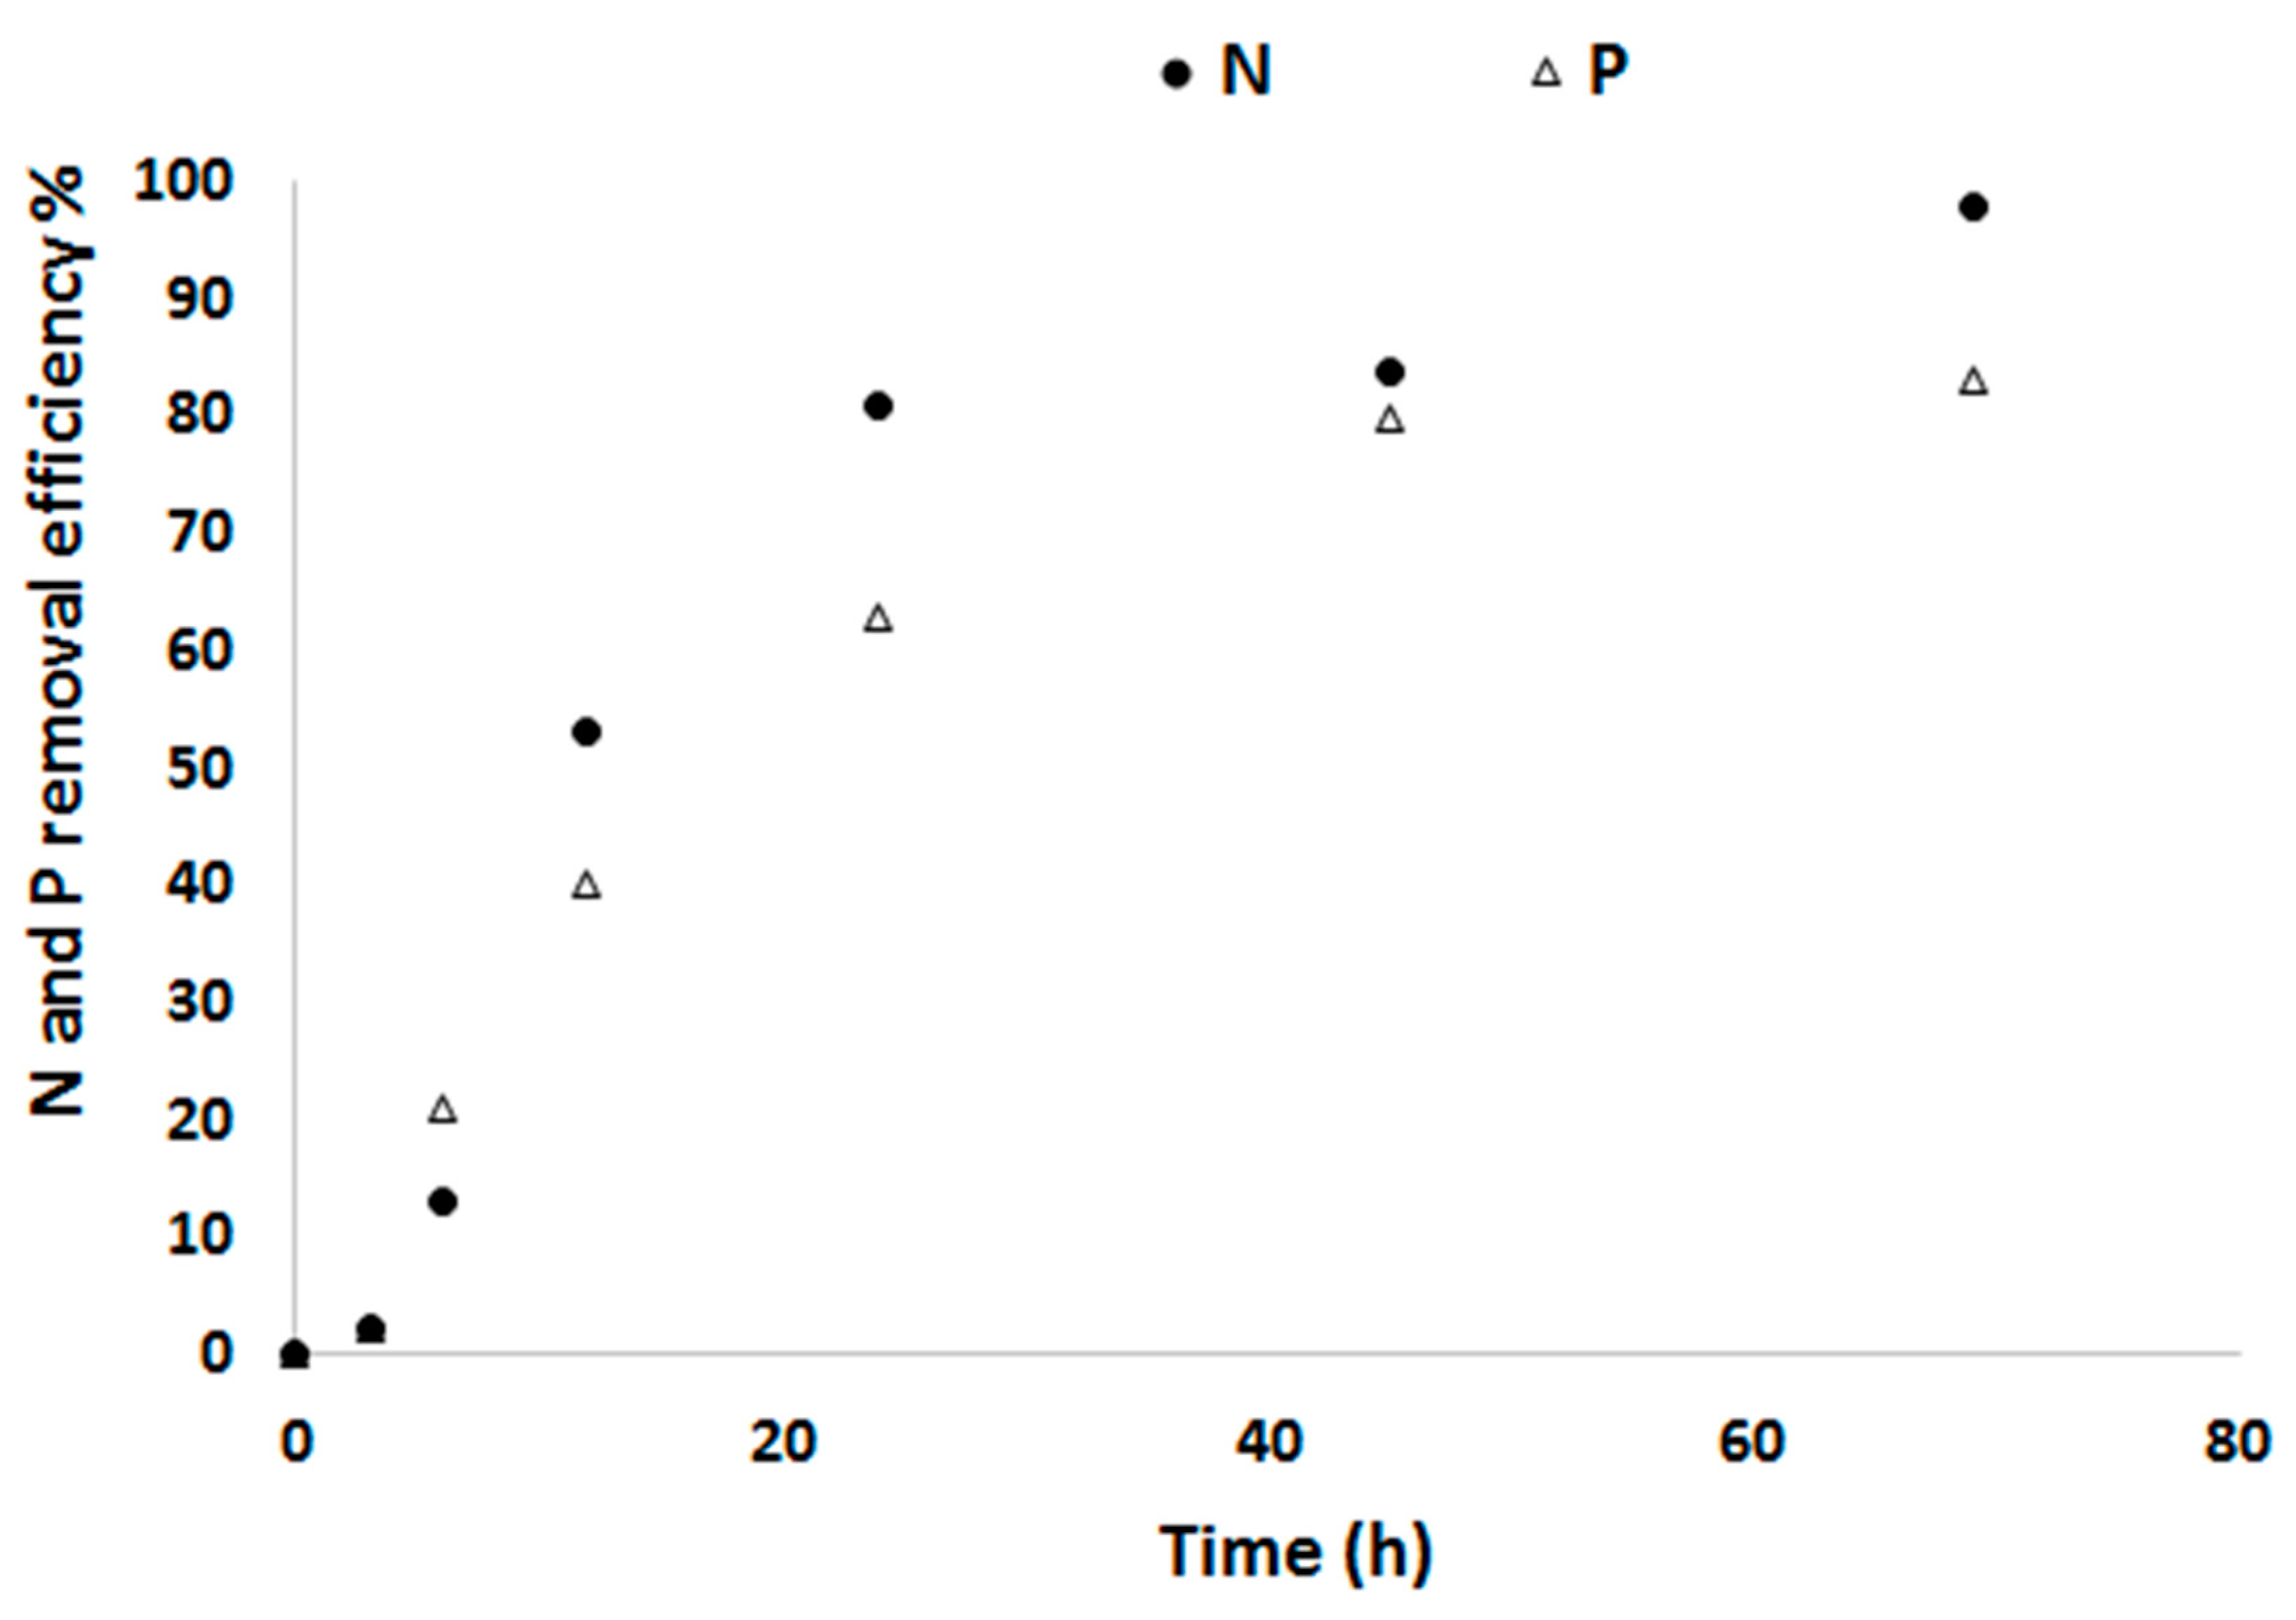
The change in N and P concentration between the influent and effluent was assumed to be taken up by the algae for their biomass production. Within 24 h 81 % of the N as NO3−N and 63 % of P as PO4−P in the defined medium as a substrate is converted into biomass. At the 70th h, 98 % of N and 83 % of P was removed (Figure 3). At steady-state, the average N removal rate Nr was 291.14 ± 29.8 mg L−1 d−1 and the N removal yield in relation to the used amount of light YNr/Ph was 55.95 mg N mol photons−1. Similarly, the average P removal rate Pr over this same period was 29.5 ± 4.1 mg L−1 d−1 and the P removal yield in relation to the used amount of light YPr/Ph was 5.67 mg P mol photons−1.
3.2. Biomass Productivity and Nutrient Removal with Treated Blackwater as a Substrate
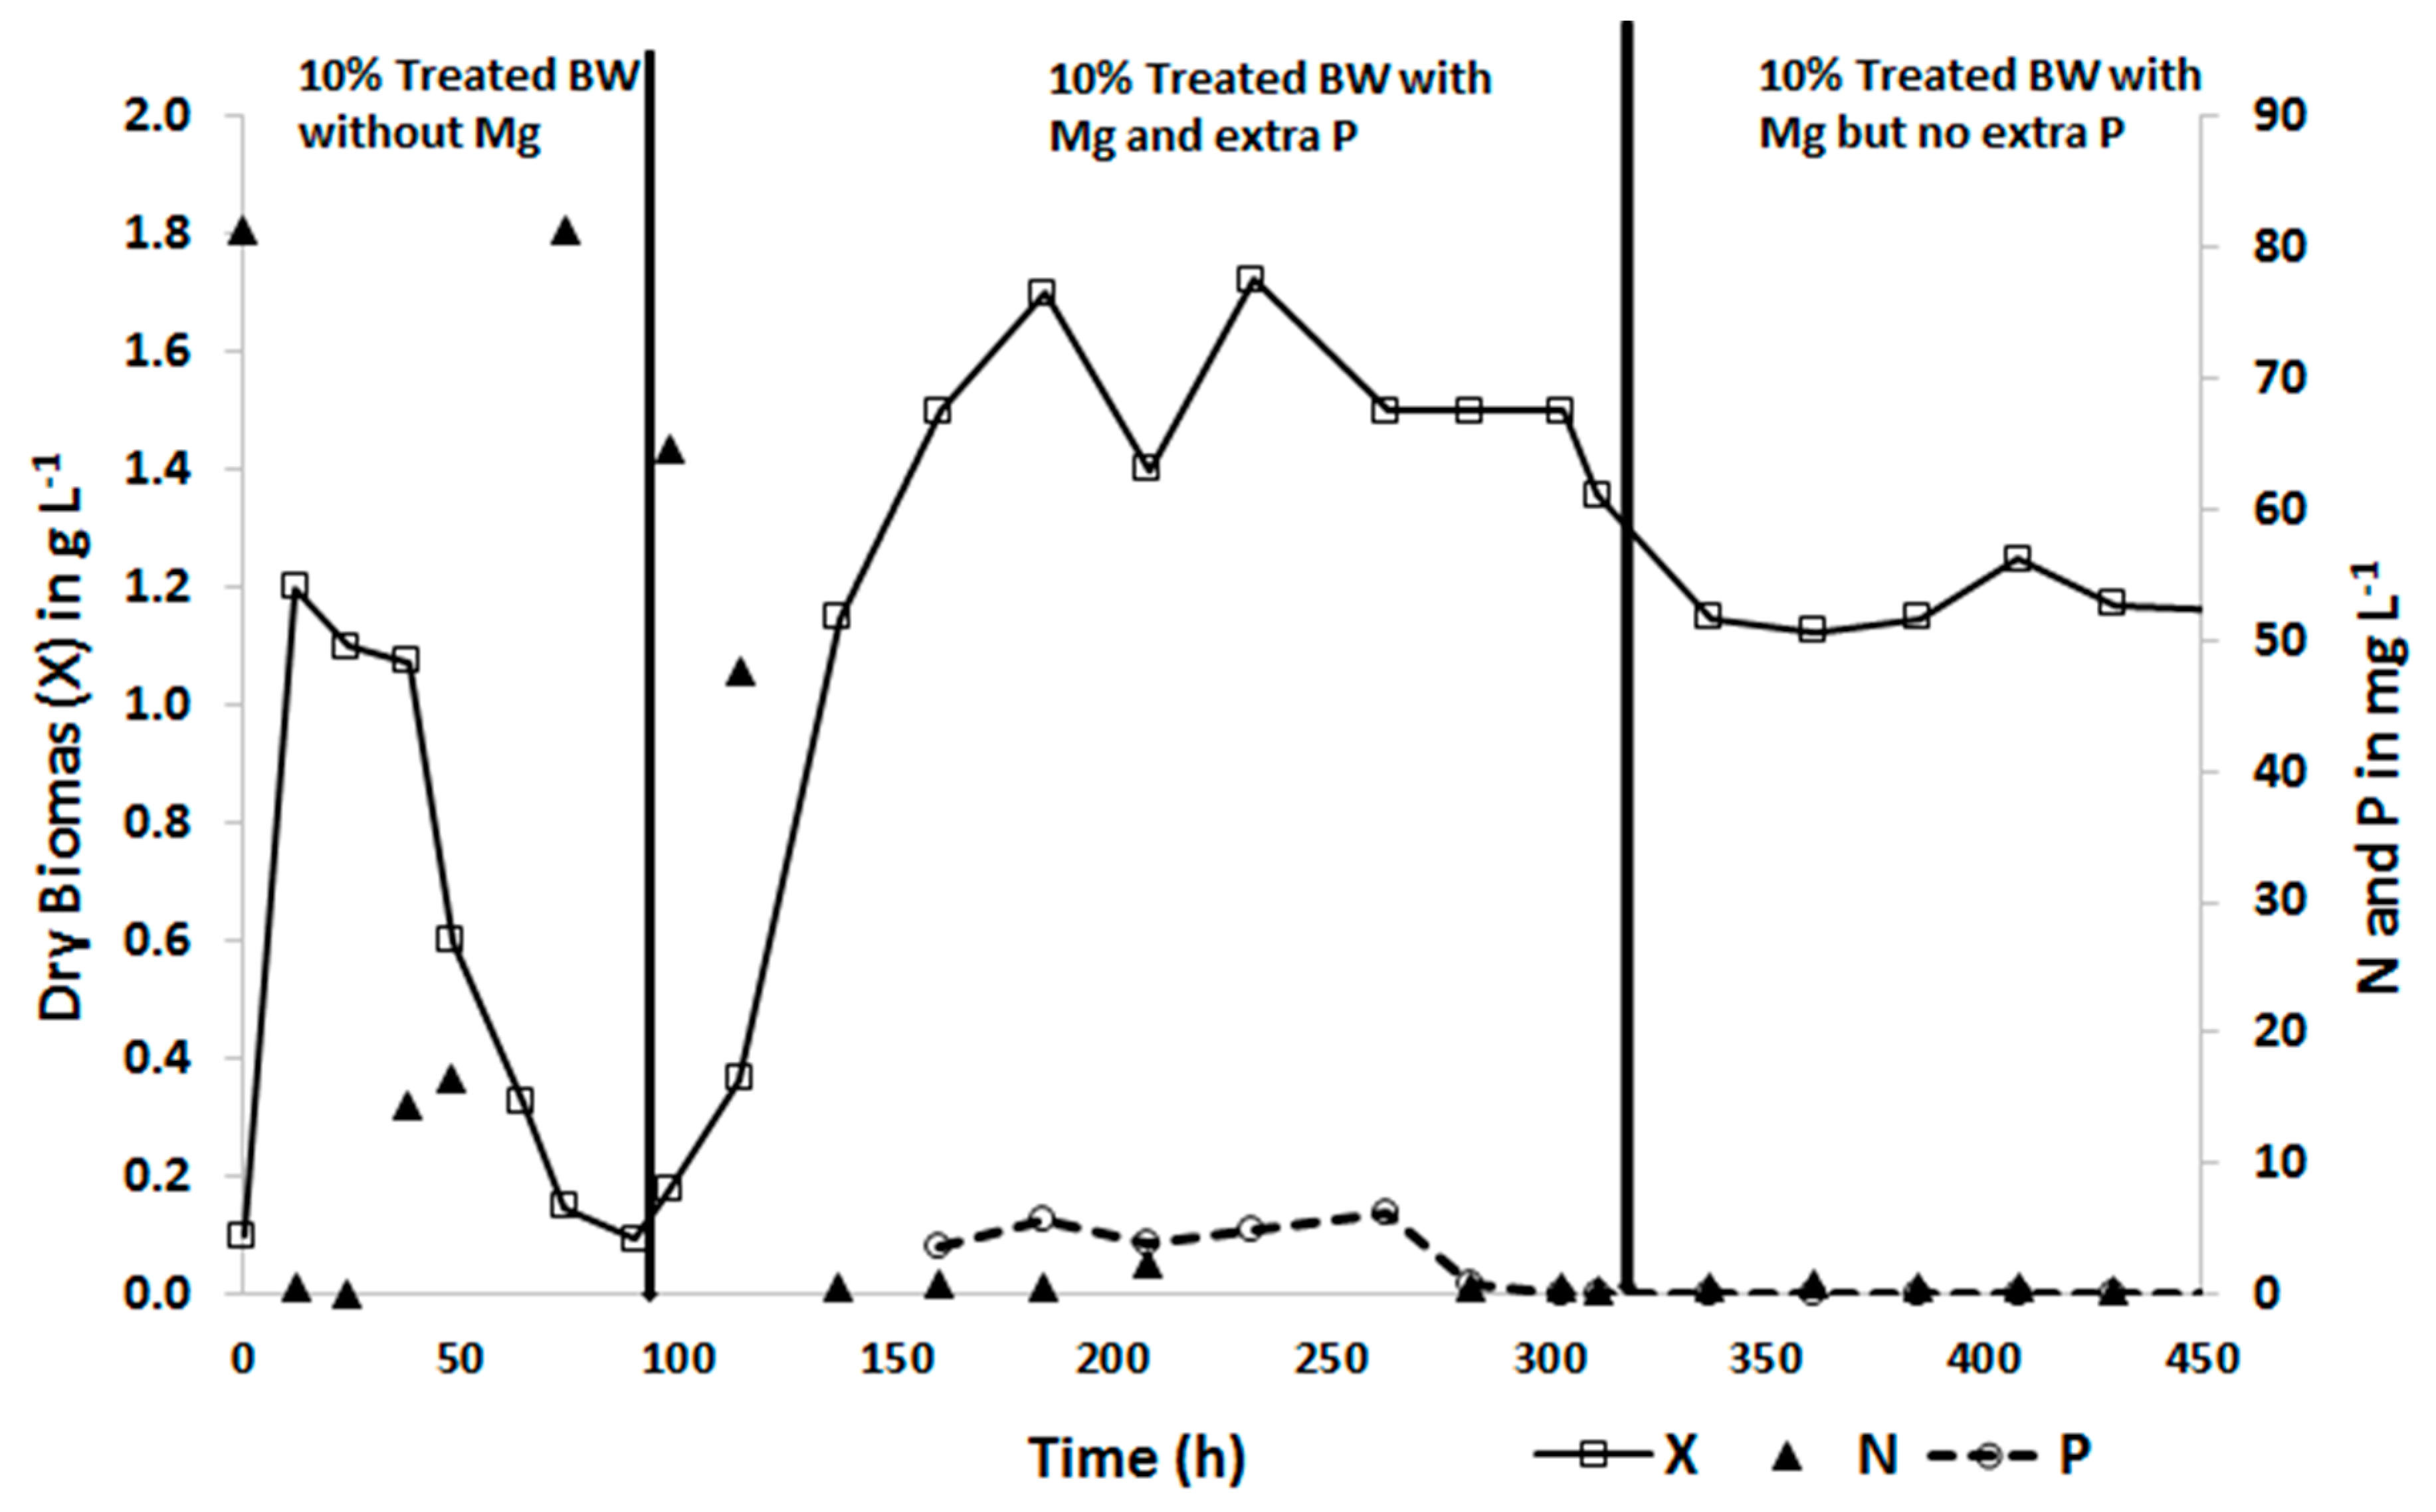
The biomass concentration of C. sorokiniana in the 10 % treated blackwater without additional Mg and trace elements increased and reached a maximum within 36 h. However, it sharply decreased to about 90 % of the maximum biomass concentration after 90 h. This suggests that the culture growth was supported by nutrients from the inoculum during the first 36 hours but later some nutrients in the 10 % treated blackwater limited the growth to a lower level. As presented in Table 1, P, Mg, and most of the trace elements (except Fe and Cu) in the 10% diluted treated blackwater were lower than in the defined medium. At the 96th h MgSO4 and Hutner’s trace element solution was added to the substrate at the same concentration as was used in the defined medium.
Addition of Mg and trace elements improved the growth of C. Sorokiniana, reached its maximum and sustained steady-state growth (Figure 4). This was also reflected in the increased removal of ammonium. Enhanced growth of microalgae with supplementation of Mg and micronutrients was also reported in literature [38]. As shown in Figure 4, the ammonium concentration in the effluent was 0.42 mg L−1 within 12 h and 0.03 mg L−1 after 24 h from initial influent substrate concentration of 81 mg L−1. However, with a decline in biomass productivity, the removal of ammonium by the microalgae decreased sharply and the concentration in the effluent reached the substrate concentration after 70 h. With the addition of Mg and trace elements biomass productivity improved, and thus the ammonium concentration in the effluent decreased again and reached close to zero (Figure 4).
Moreover, the volumetric and areal biomass productivity of C. sorokiniana with the 10% diluted treated blackwater measured at steady-state were found to be influenced by P. The P concentration in the 10% treated water was about 5 mg L−1. Addition of 29 mg L−1 of extra P together with Mg and trace elements at the same concentration as defined medium as a supplement improved biomass productivity. The volumetric and areal productivity with extra P was 2.1 g L−1d−1 and 50.4 g m−2d−1, respectively. However, a significant reduced volumetric productivity of 1.5 g L−1d−1 and areal productivity of 36.48 g m−2d−1 (p = 0.006) was observed when the culture was grown without extra P (Figure 4).
Similar effects were observed in Tuantet et al. [25]. Although this does not affect the N removal, it is important to note that the effluent P concentration does not increase above the discharge limit. Adding an extra 29 mg P L−1 resulted in an effluent P concentration ranging from 3.6 to 8.3 mg L−1, which is well above the permitted P discharge limits. On the other hand, the 10% treated blackwater without adding extra P resulted in an effluent P concentration far below the discharge limit. The N: P ratio should be considered not only for optimal biomass production but also to achieve the desired effluent quality.
Chlorella sorokiniana was able to remove ammonium and phosphate from the treated blackwater for growth. The average N and P removal rate at steady state with 10% treated blackwater with extra P were 110.5 ± 2.2 and 44.4 mg L−1d−1, respectively. The corresponding N and P removal rates for the 10% treated blackwater substrate solution without extra P were 99.2 ± 0.4 and 8.3 ± 0.4 mg L−1d−1, respectively. The higher N and P removal rates in the defined medium than in 10% treated blackwater may be due to the high initial influent concentrations of N and P in the defined medium, which can be related to increased biomass concentration compared to the initial concentration in the treated blackwater. However, both N and P were completely taken up for the 10% treated blackwater without added influent P.
The N and P removal yield in relation to light for the experiment with extra P were, 20.9 ± 0.4 mg (mol photons)−1 and 8 ± 0.1 mg (mol photons)−1, respectively, and 19.1 ± 0.1 and 1.59 mg (mol photons)−1, respectively, for the experiment without extra P. Similarly, the biomass yield on light was 290 mg dry biomass (mol photons)−1 of algae with 10% treated blackwater without the addition of extra P. The corresponding value of biomass yield on light when extra P was added to the 10% treated blackwater was 400 mg (mole photons)−1 which is comparable to the 420 ± 0.05 mg dry biomass (mole photons)−1 with the standard medium. Thus, a proportional amount of P is required for increased biomass production. In contrast to the results reported from other studies using urine and blackwater as substrate [25,39], our results show lower values. However, the biomass yield on light, N and P removal rates were comparably high.
3.3. Effect of NO2-N on Chlorella Sorokiniana
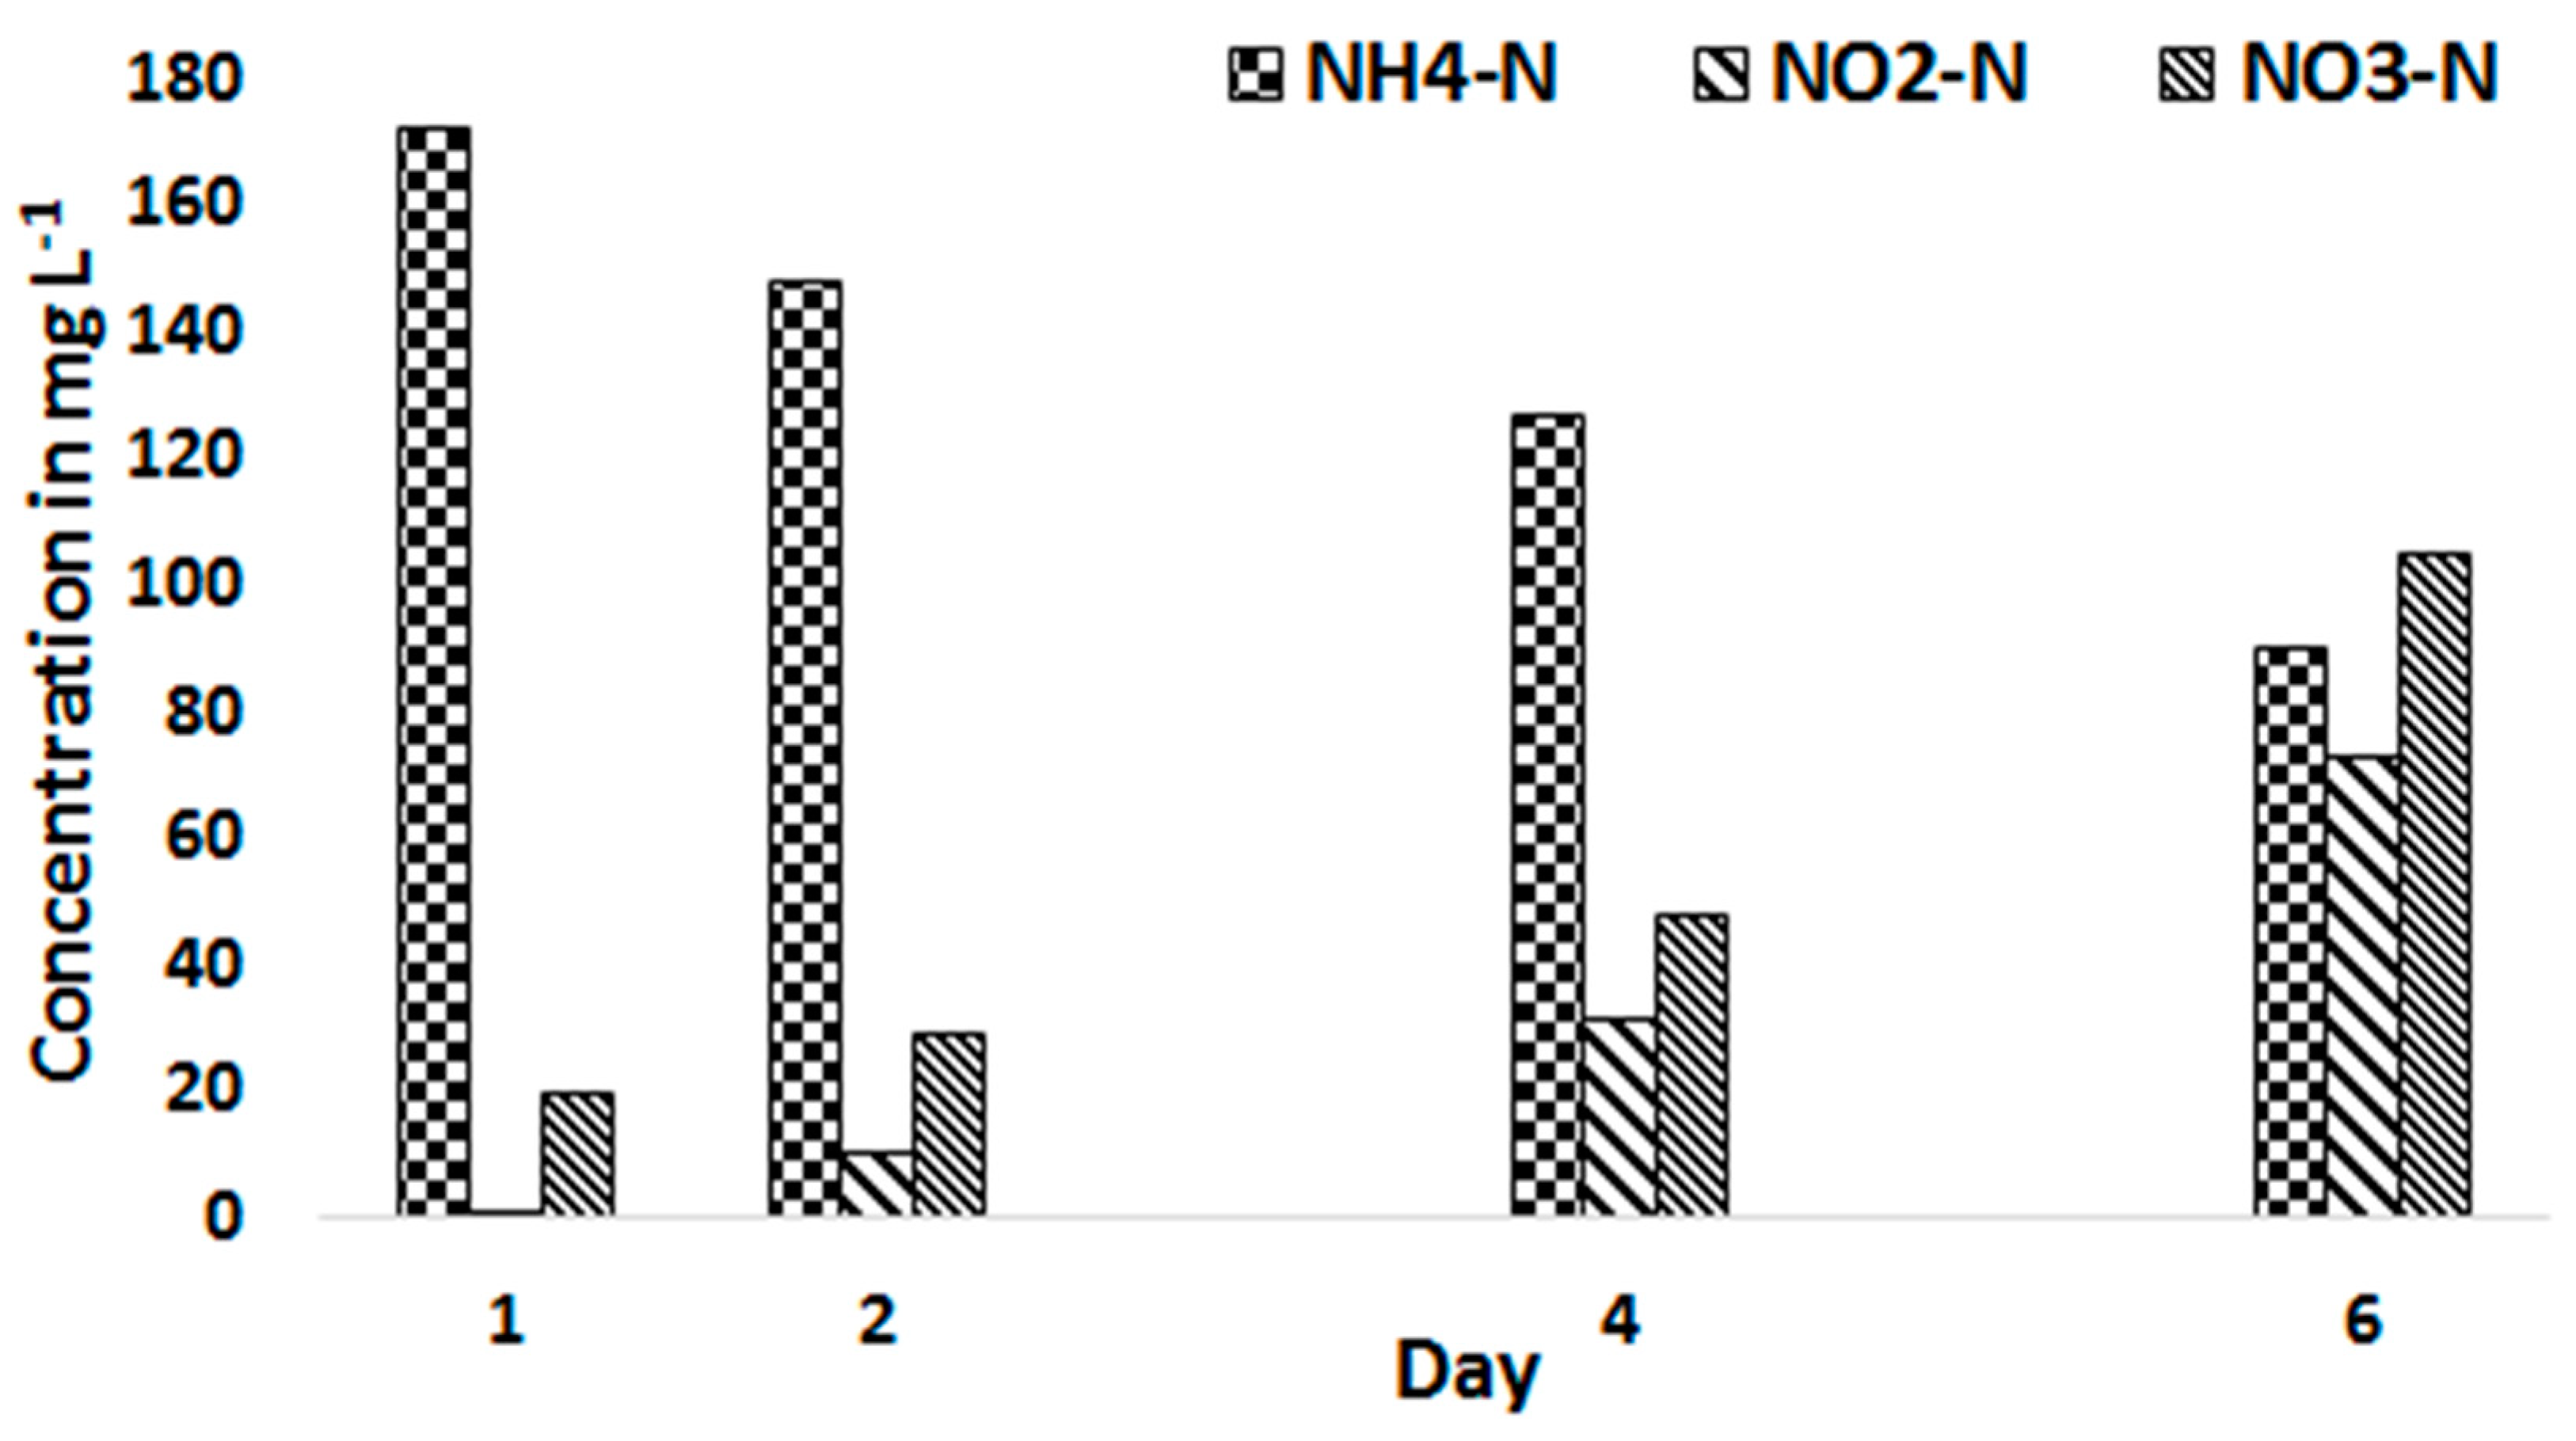
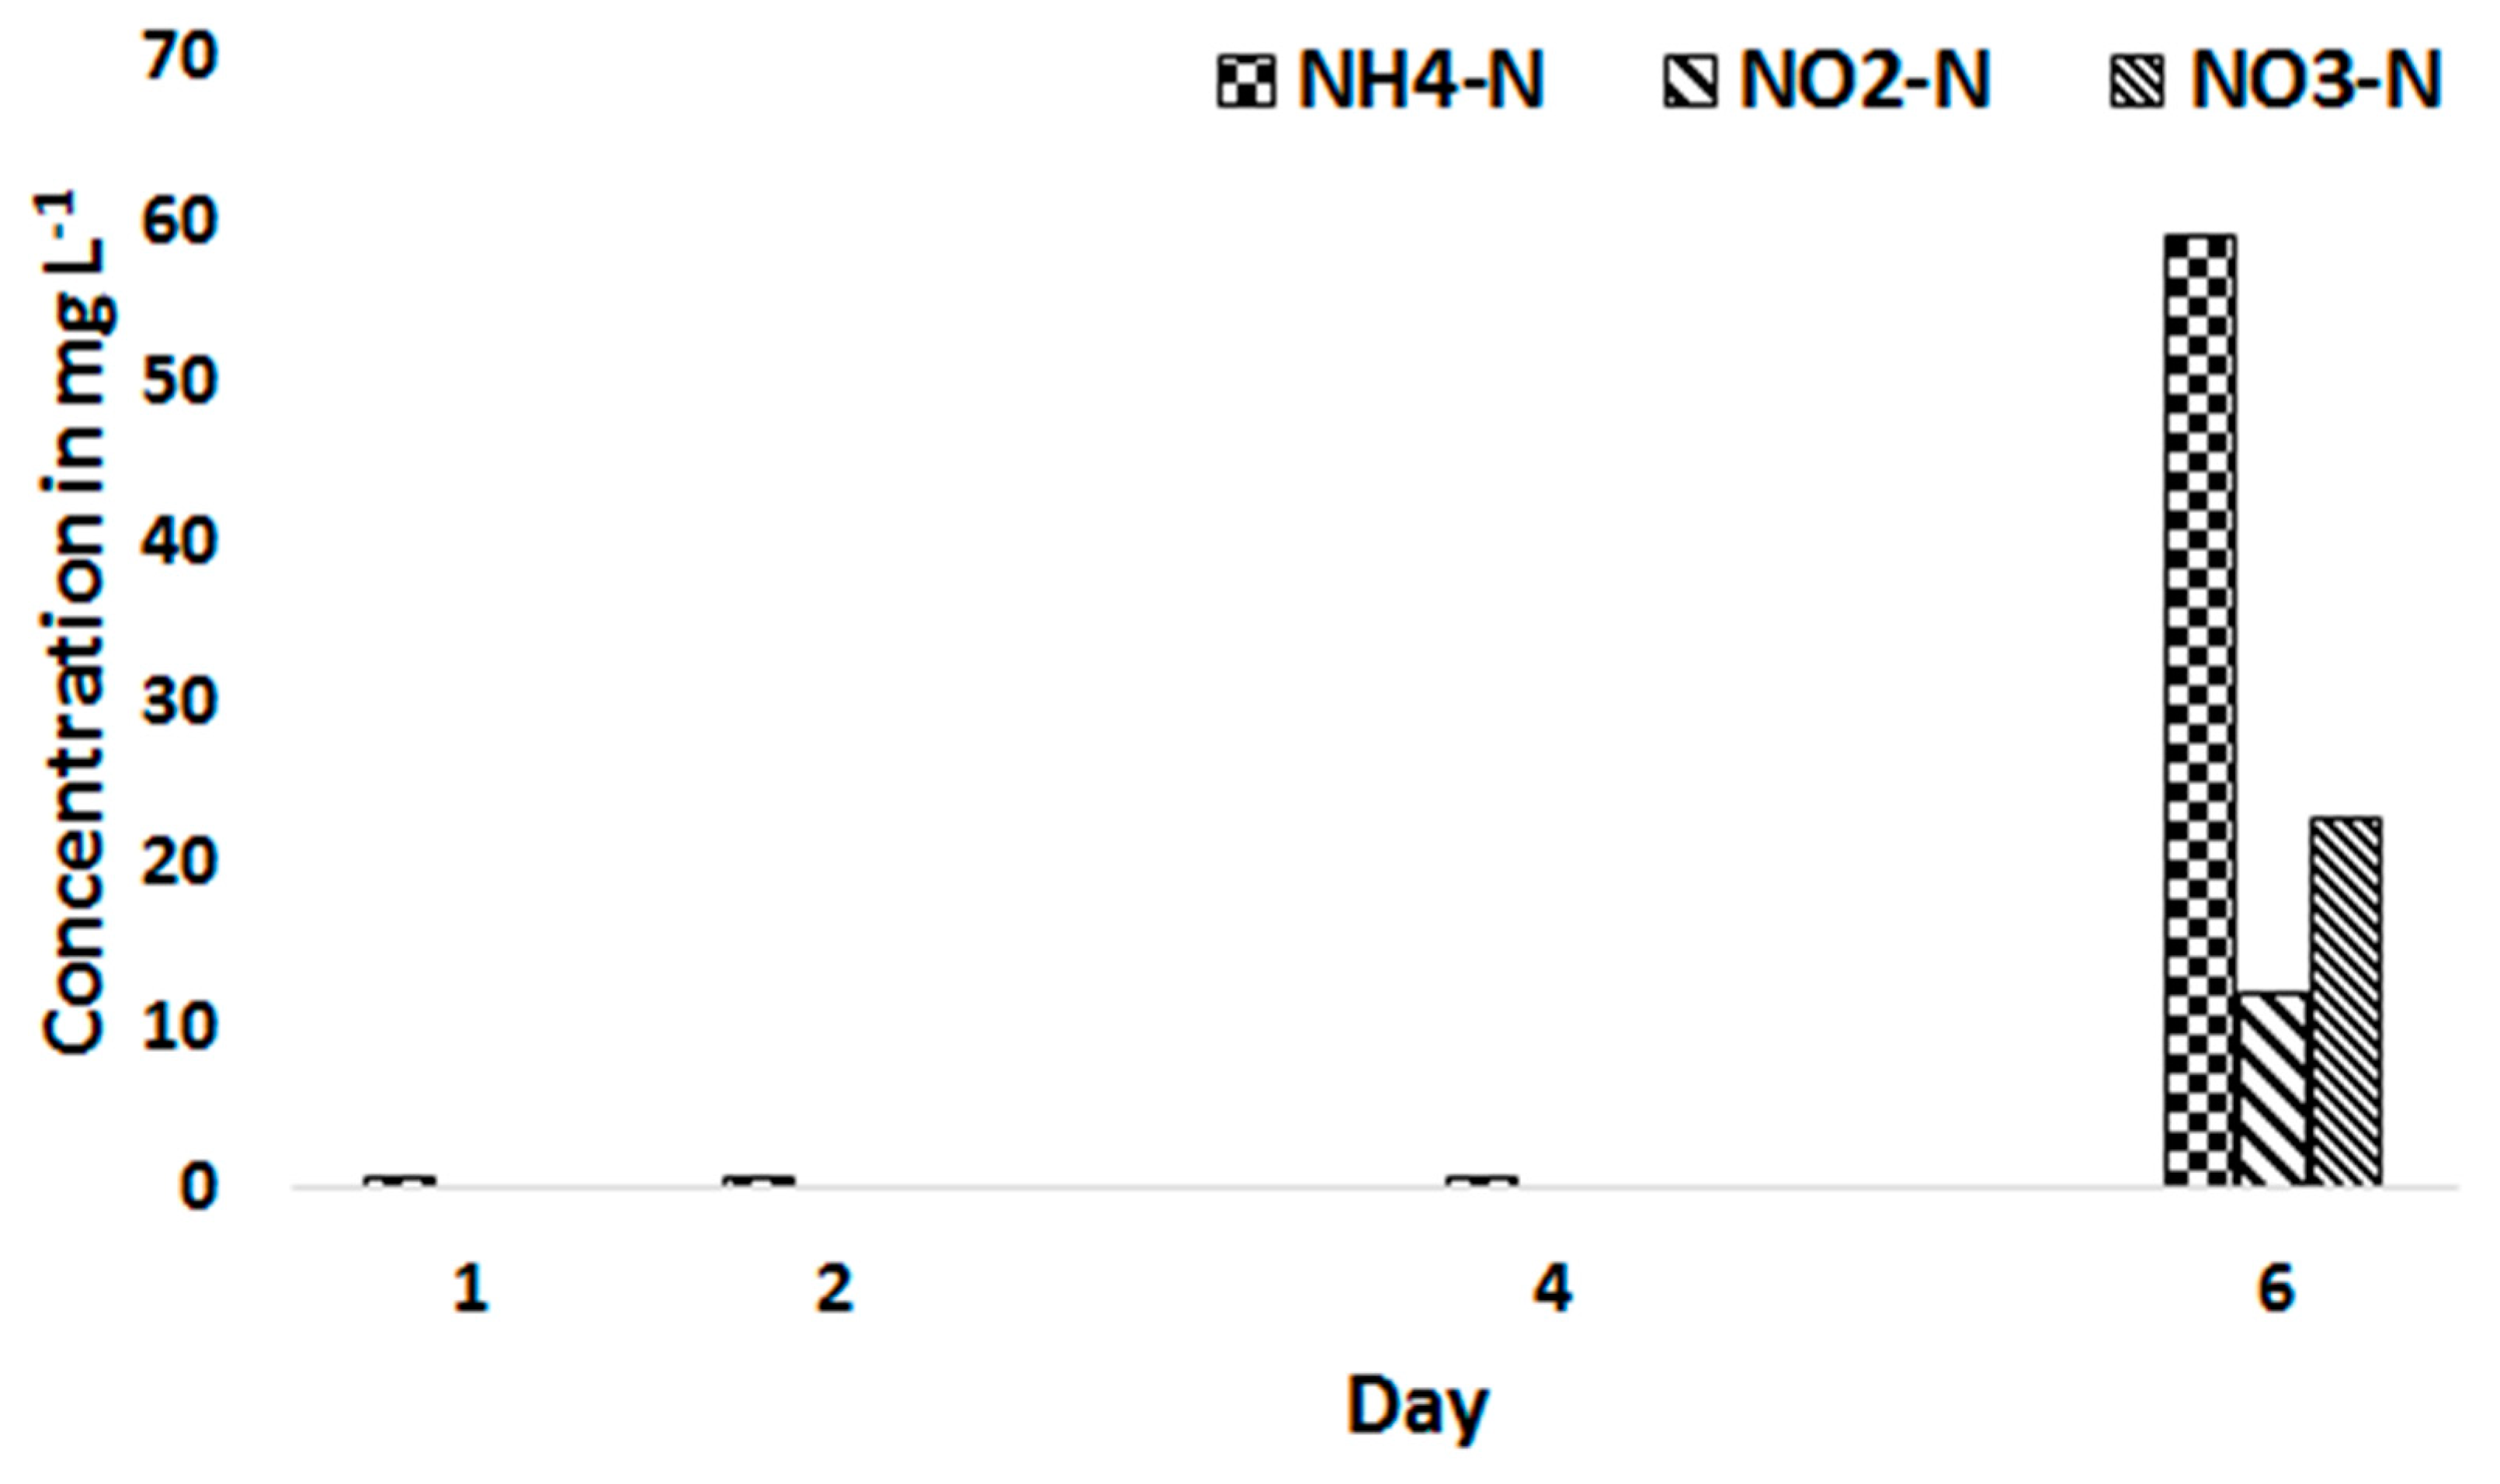
The productivity of C. sorokiniana with 20% treated blackwater and therefore increased ammonium concentration was influenced by nitrification in the substrate storage tank. The biomass concentration of C. sorokiniana increased from 350 mg L−1 of the first day to 1200 mg L−1 in the 4th day with 20% treated blackwater. However, the biomass concentration declined and reached 170 mg L−1 on the 6th day where the culture becomes pale yellow in colour. This was assumed to be associated with an increased nitrite concentration in the stored substrate. The long retention time of the medium in the substrate bottle, while stirring to supply a homogenized medium to the culture, resulted in oxidation of the NH4-N and thus the nitrite concentration in the substrate gradually increased (Figure 5). A nitrite concentration of 72 mg L−1 resulted in bleaching out of the culture and higher effluent concentrations of NH4-N, NO2-N, and NO3-N (Figure 6).
To prevent C. sorokiniana from toxic effects of nitrite the following approaches are possible: (1) complete nitrification of ammonium (NH4-N) to nitrate (NO3-N) without accumulation of nitrite (NO2-N), (2) a short substrate retention time without further oxygen supply (stirring), or (3) anaerobic conditions in the feeding tank to prevent oxidation of NH4-N. In the following experiment, the substrate bottle of one bioreactor (PBR I) was flushed with molecular nitrogen for oxygen removal and then connected to a bag with N2 to keep the substrate anaerobic. The substrate bottle of the second bioreactor (PBR II) was first kept aerobic for the first 5 days and on day 5 anaerobic and connected to a bag with N2 gas.
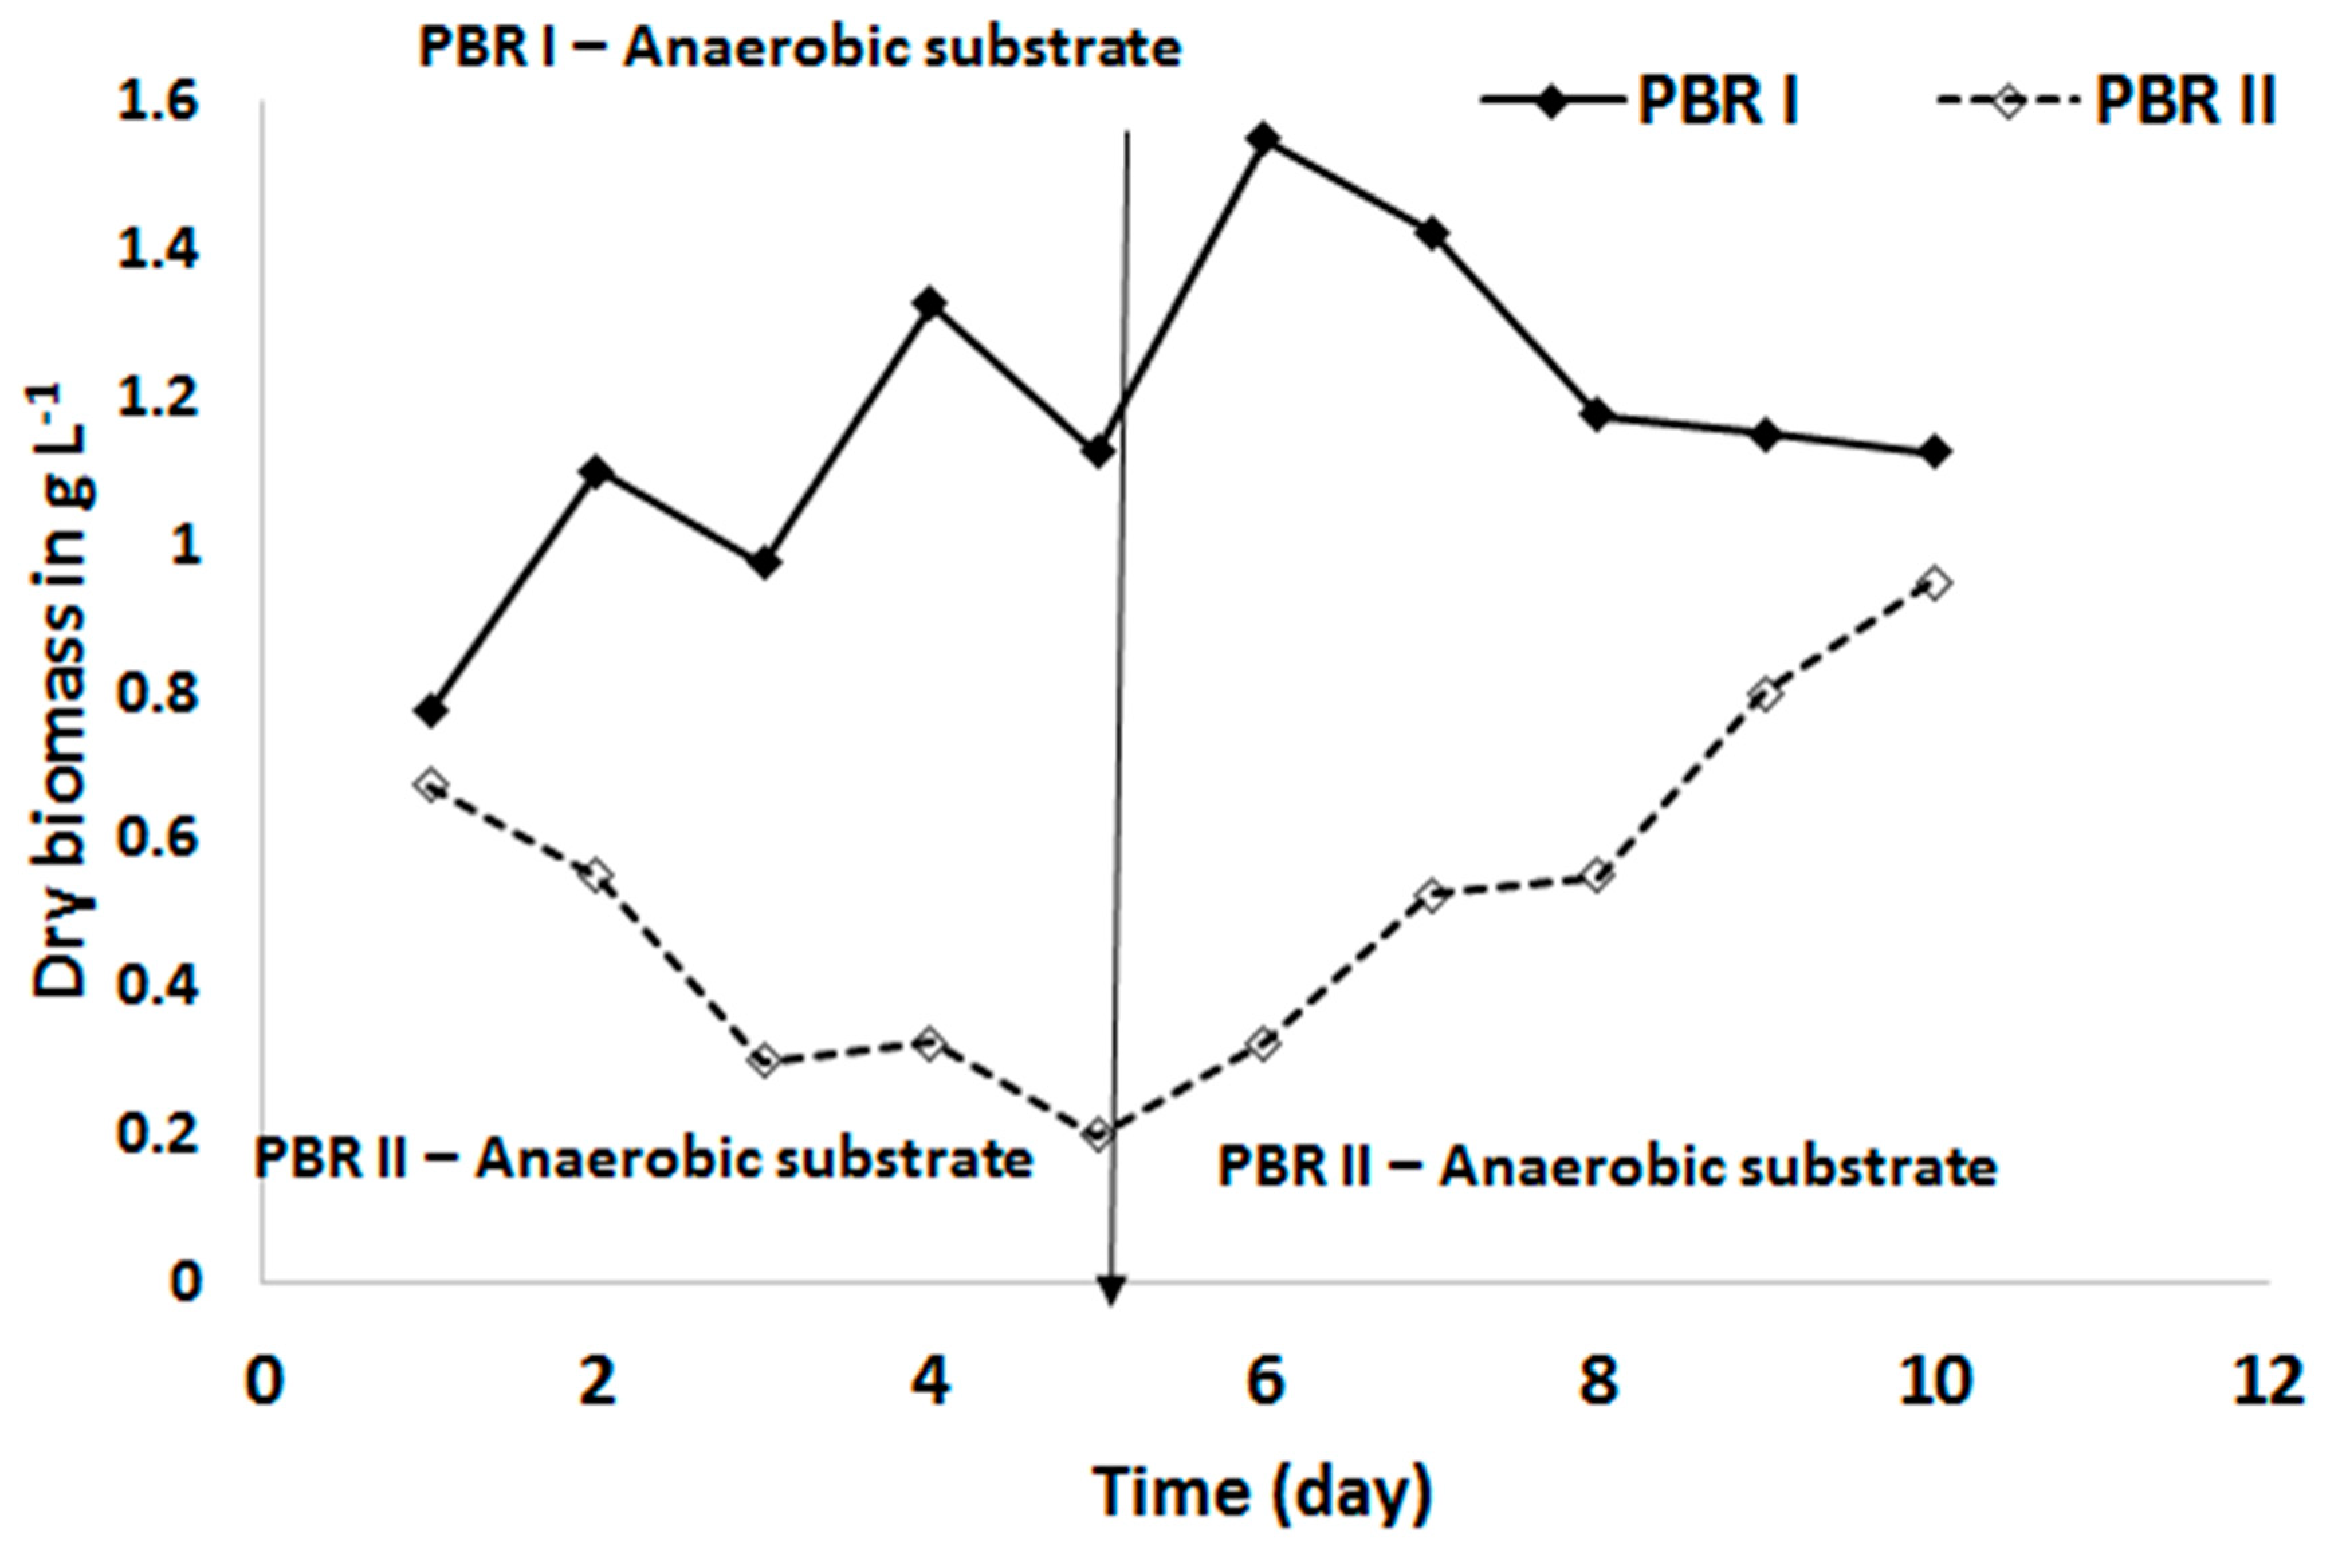
Figure 7 shows the effect of the anaerobised substrate on the biomass production of C. sorokiniana. The anaerobic substrate supply in PBR I resulted in an increased biomass concentration and reached a steady state. In contrast, the reactor with the aerobic substrate showed a decreasing biomass concentration in the first five days.
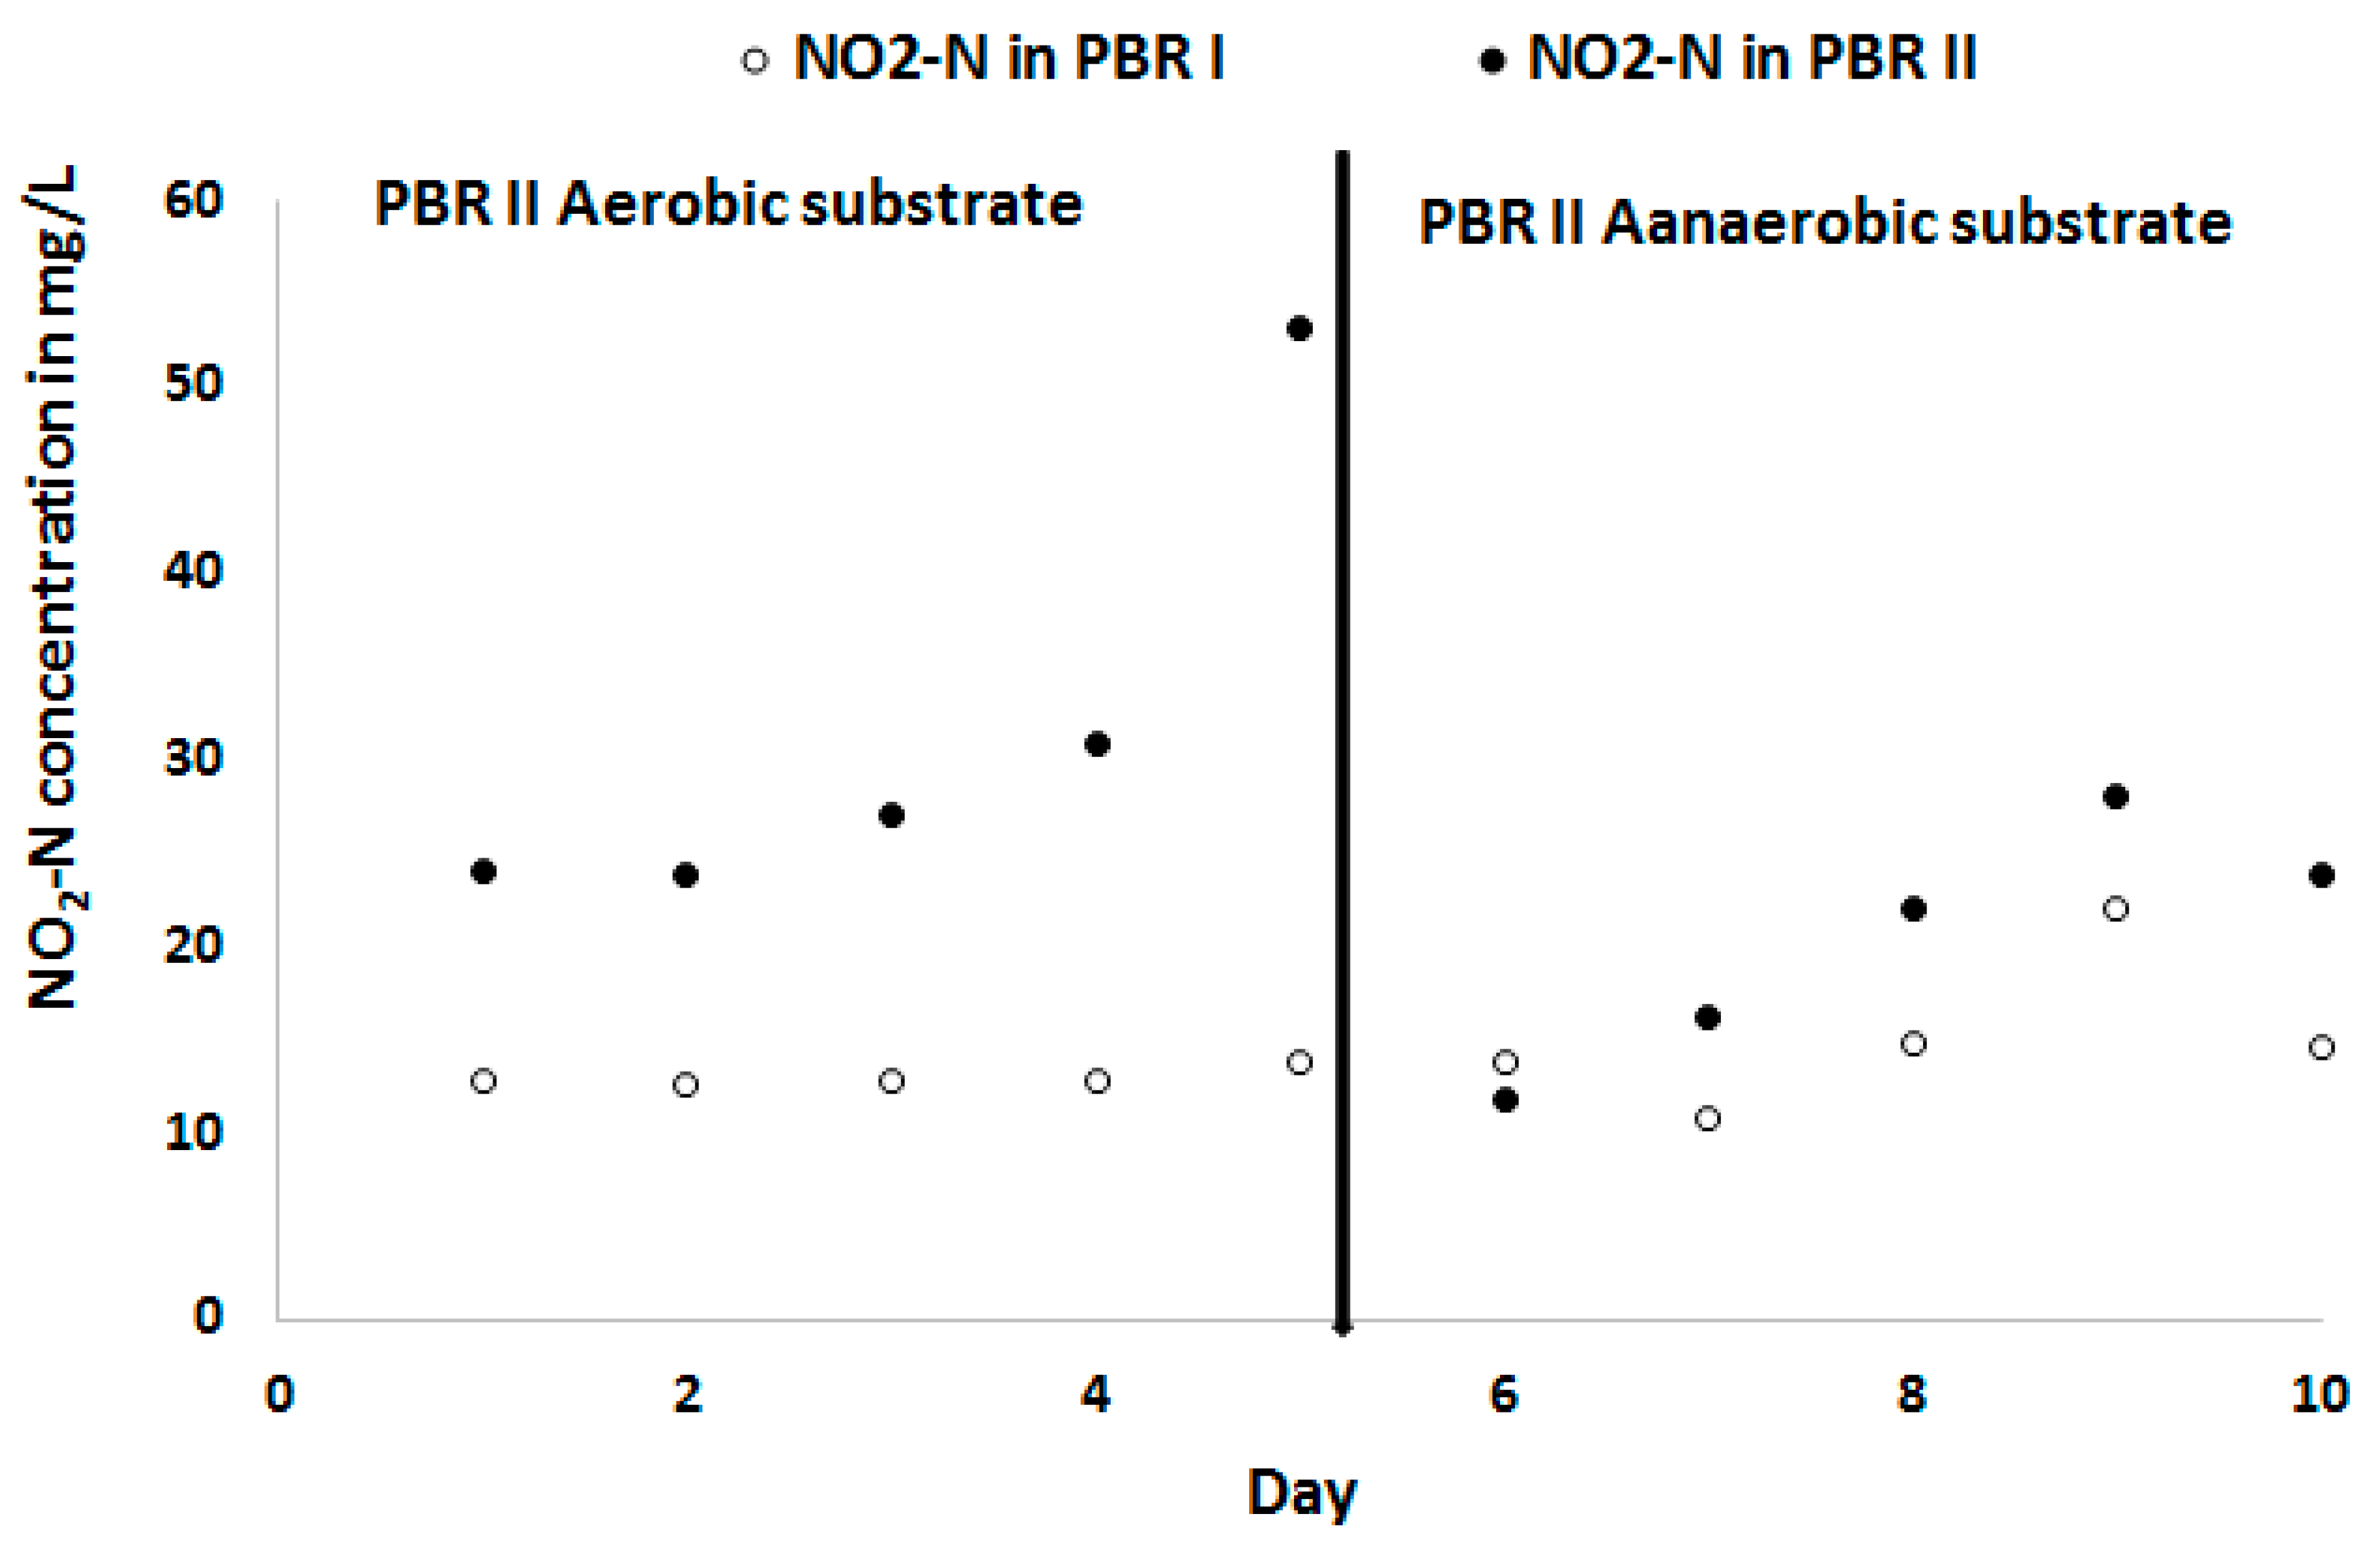
When the substrate of this reactor (PBR II) was anaerobised on day 5, the biomass concentration of C. sorokiniana increased and reached almost the same level as PBR I on day 10 (Figure 7). The corresponding NO2-N concentrations in the substrate of both PBR is given in Figure 8. The NO2-N concentration in the bioreactor with the aerobic substrate (PBR II) was increased to more than 50 mg L−1 when at the same time the biomass concentration in this bioreactor was decreasing. This confirmed that the decline in biomass concentration was caused by a too high NO2-N concentration.
3.4. Effects of Reducing Substrate Retention Time, Stopping Stirring and Removing CaCl2 as a Supplement
As an alternative solution to the anaerobisation of the substrate, the effect of a reduced substrate storage time in the medium bottle and a reduced oxygen supply by switching off the stirring on the performance of C. sorokiniana was evaluated. When renewing the substrate every 3 days instead of 5 to 6 days without stirring the growth of C. sorokiniana was stable as the NO2-N concentration did not increase to an inhibiting level. In addition, colourless crystals shaped like blunt ended needles or prisms were observed in the substrate through a microscope. A possible precipitation of Ca3(PO4)2, which can limit P availability, was suspected and the addition of supplementing CaCl2 stopped. The combination of reducing the substrate retention time, stopping the stirring and not supplementing with CaCl2 resulted in a steady-state growth of the C. sorokiniana in the medium with 20% treated blackwater.
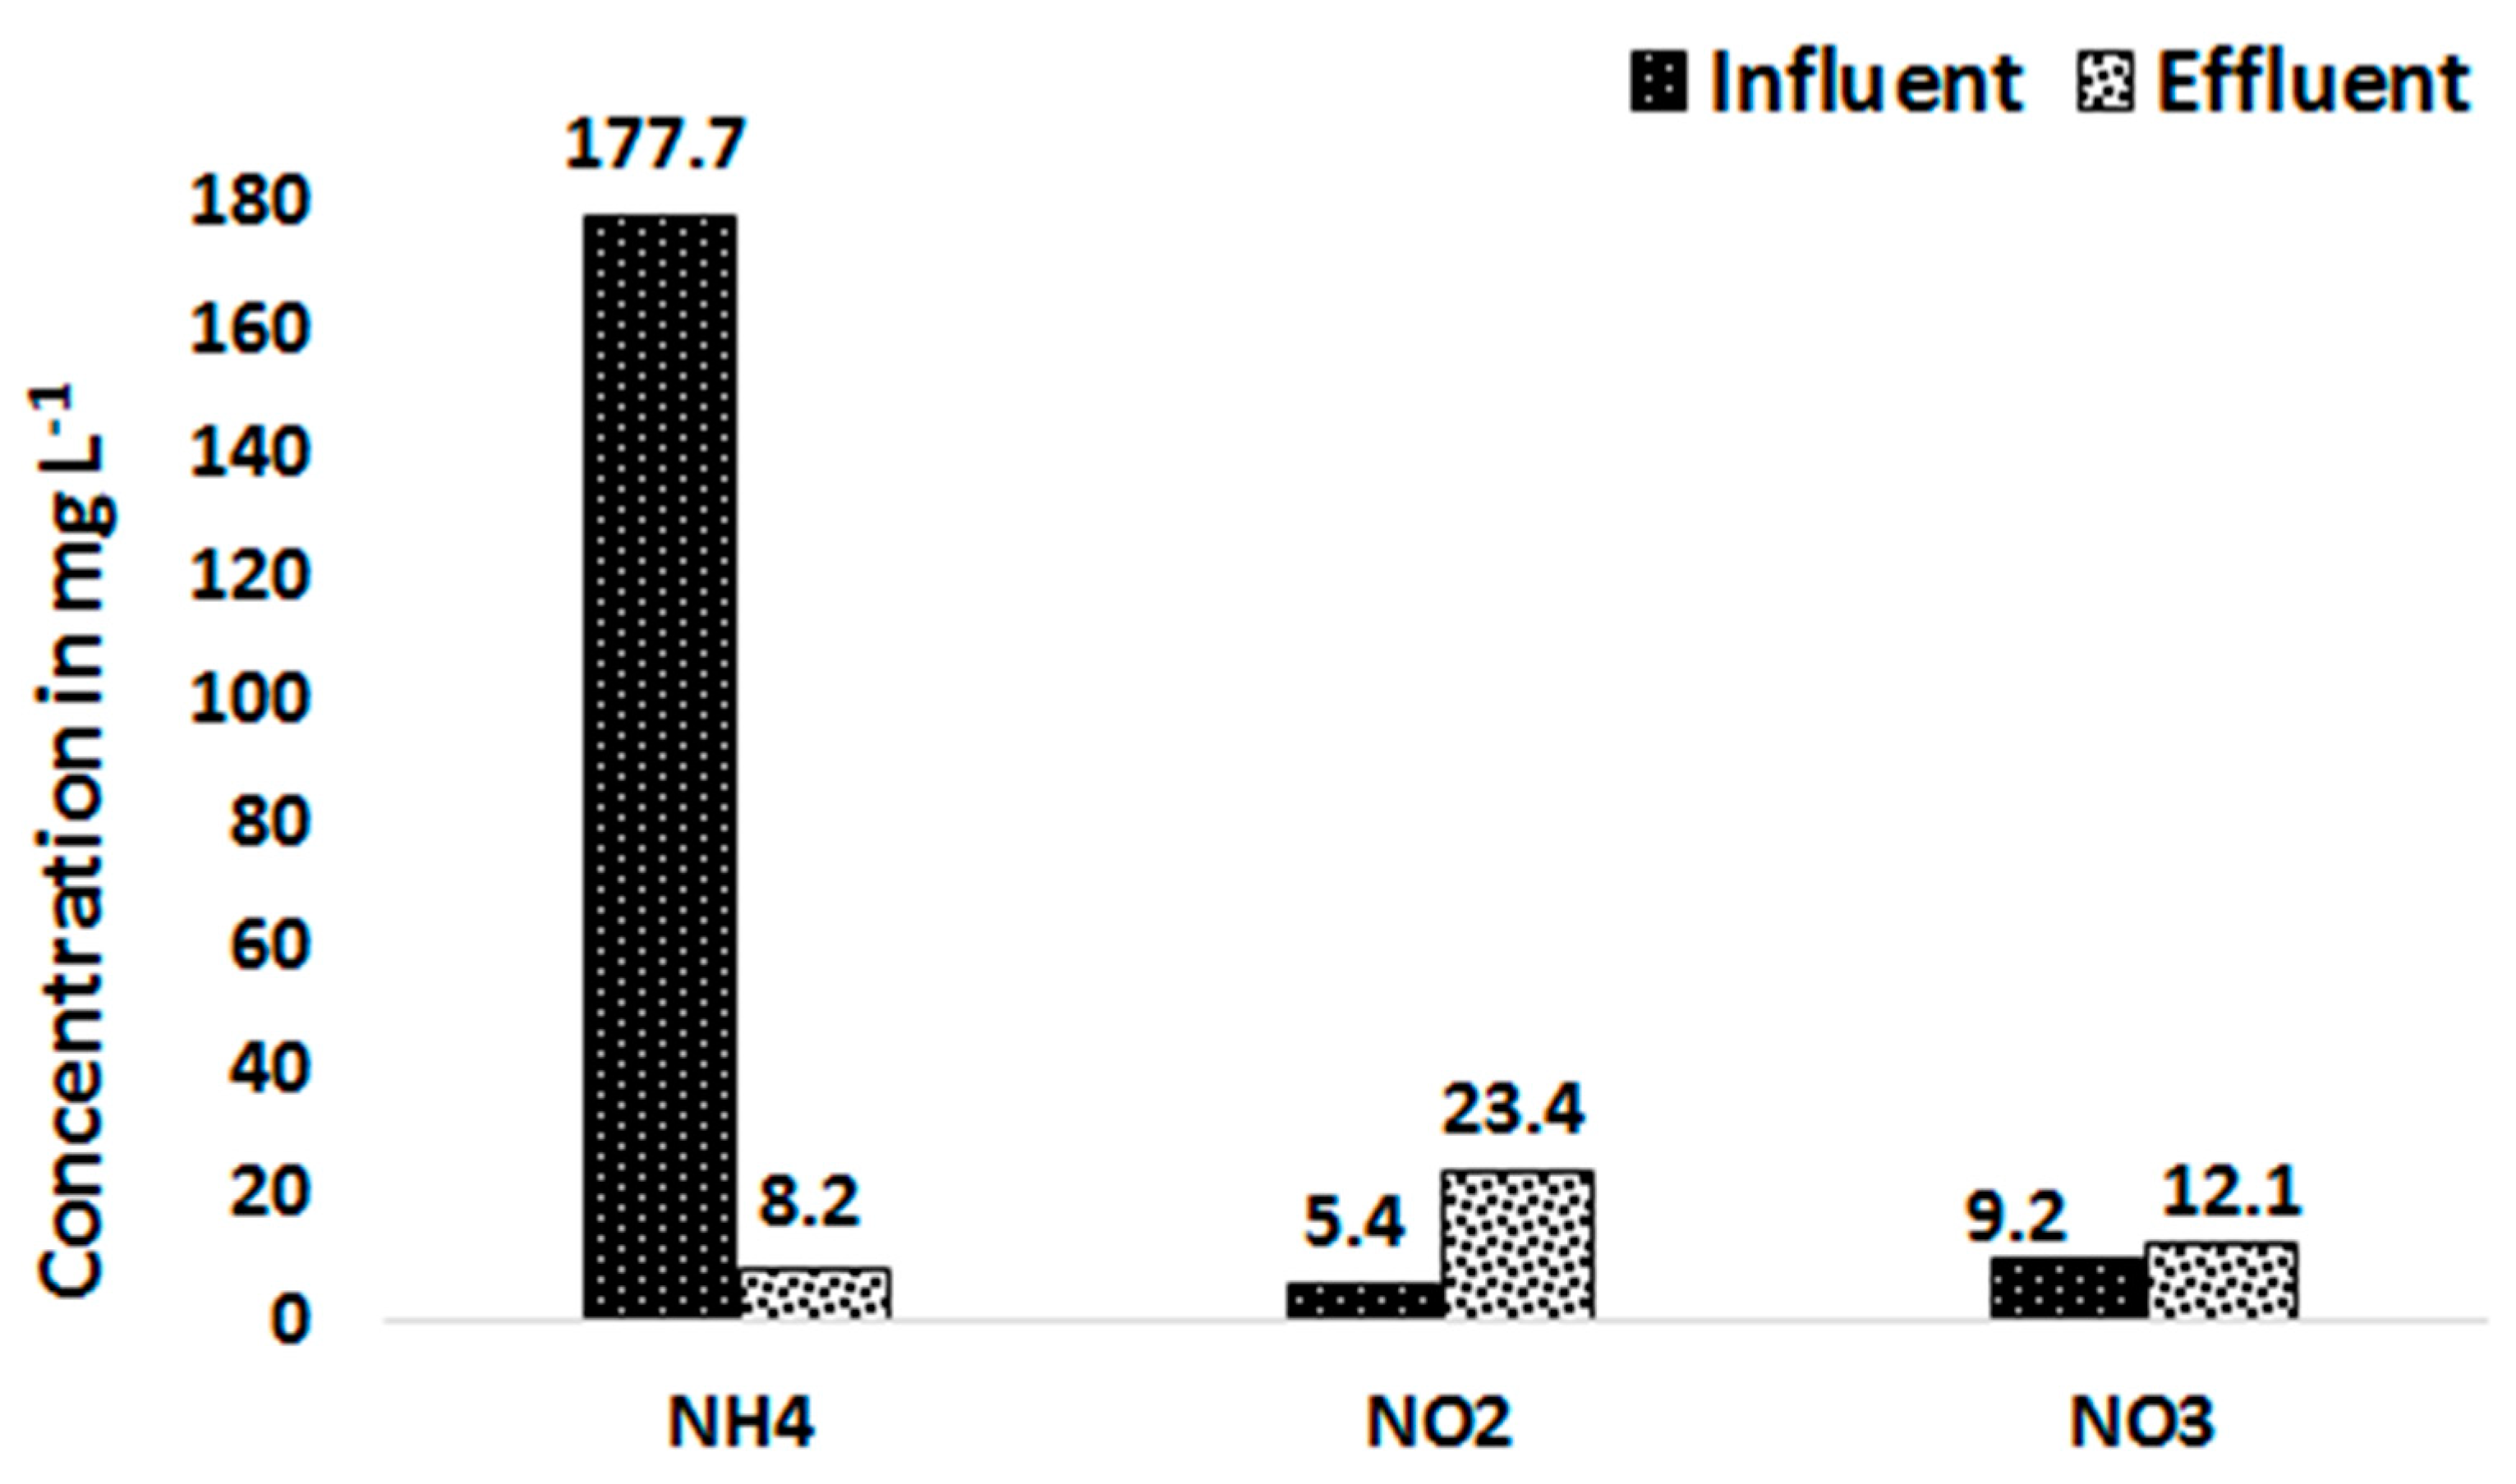
Figure 9 presents the average influent and effluent concentration of NH4-N, NO2-N and NO3-N from the 20% treated blackwater substrate after changing the operational conditions stated above. The results show that the NO2-N concentration increased from 5.4 mg L−1 in the influent to 23.4 mg L−1 in the PBR effluent. Similarly, the NO3-N concentration showed a slight increase from 9.2 mg L−1 in the influent to 12.1 mg L−1 in the effluent. The increase of the NO2-N concentration in the effluent but not much of NO3-N indicates the presence of only ammonium oxidizing bacteria (AOB) but not nitrite oxidizing bacteria (NOB) which may be the case for the accumulation of NO2-N. Only 4% of the influent N left the reactor in the form of NH4-N.
The higher concentrations of NO2-N and NO3-N than NH4-N in the effluent shows the fact that NH4-N is preferably taken up by C. sorokiniana when other forms of N compounds are also available to the microalgae [40]. Several studies have also indicated that nitrate consumption by microalgae does not occur until the ammonium is nearly completely removed [36,40,41,42]. Ammonium is the preferred form of nitrogen because a redox reaction is not involved in its assimilation; thus, it requires less energy [40,43]. On the other hand, nitrate must be converted to ammonium inside the cell and requires energy [40,44].
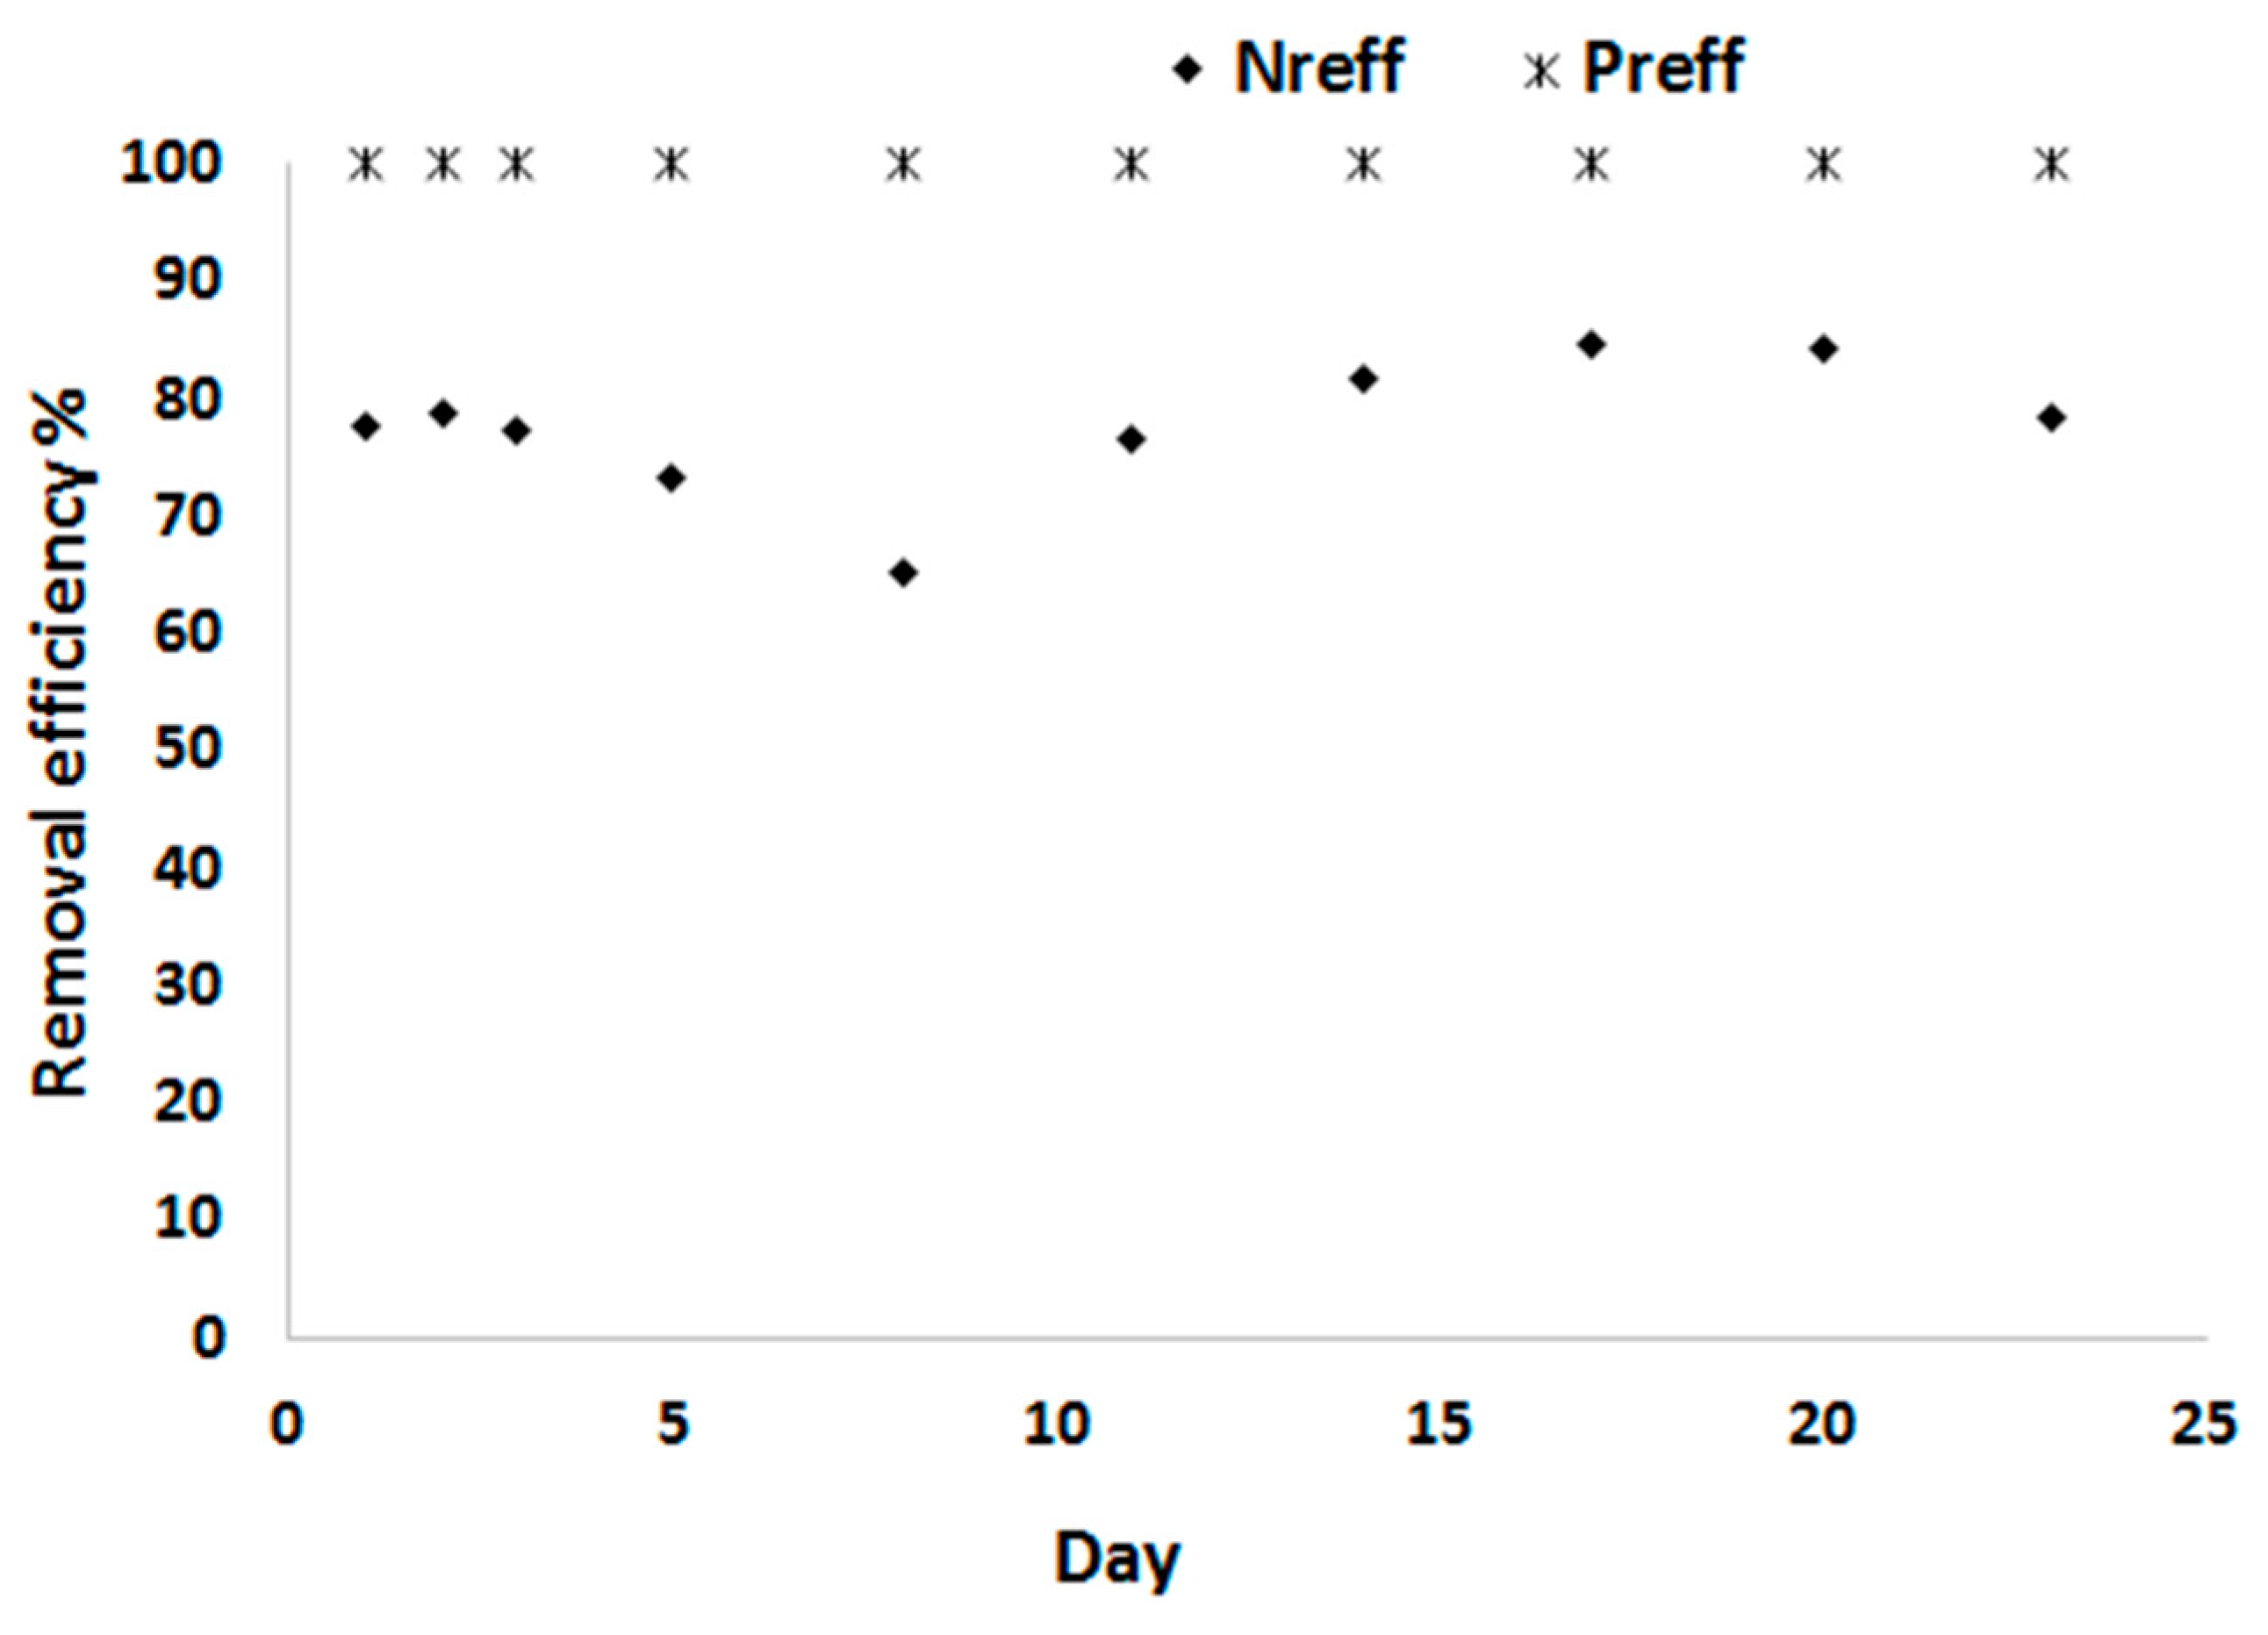
The average N removal efficiency of C. sorokiniana with the 20% treated blackwater was 78%, which was lower than observed at 10% treated blackwater. The P removal efficiency remains, however, high with an average of 99.95% (Figure 10). The nitrogen and phosphorus removal efficiencies with 5 times dilution are similar to the results obtained from 5 times diluted urine at a light intensity of 1500 μmole photons m−2 s−1 [38]. Similarly, high recovery of nitrogen (75%) and phosphorus (100%) was also reported when growing Chlorella sorokiniana from anaerobically treated BW [39]. The lower N removal efficiency could be due to either P limitation with higher N availability or due to light limitation. Increasing the light intensity may improve N uptake and thus biomass yield.
Table 2 presents the summary of the average (with ± standard deviations) nutrient removal rates, the nutrient yield on light, biomass yield on light, and biomass yield on a substrate (N and P) of the 10% and 20% treated blackwater as compared to the yields on defined medium. The amount of N and P that is assumed to be taken up by C. sorokiniana at the 20% treated blackwater as the substrate is given as a change in concentration of N and P in the influent and effluent, i.e., ΔN=(Ni−Ne) and ΔP = (Pi−Pe), respectively. This is also related to the efficiency of C. sorokiniana in removing N and P. The N and P removal rates under these conditions were on average 212.6 ± 23 mg L−1 d−1 and 35.3 ± 0.65 mg L−1 d−1, respectively as indicated in Table 2. Both N and P removal rates are higher for 20% treated BW compared to the 10% treated BW substrate. The N and P removal rate obtained in this study was relatively higher than reported in anaerobically treated source-separated blackwater in The Netherlands [26] but much lower than from undiluted urine [38].
The volumetric biomass productivity for 20% treated BW was 1.9 g L−1 d−1 with a corresponding areal biomass productivity of 46 g m−2 d−1. The biomass yield on light, N and P were on average 370 mg (mole photons)−1, 9 g g−1 and 54 g g−1, respectively. The N removal efficiency is largely related to the influent N concentration, which is higher at higher influent N concentration. The biomass yield in this study was low compared to results reported in the literature [26,37,38]. The high biomass yield obtained by Tuantet et al. [38] and others may be due to the high surface-to-volume ratio because of a smaller light path of the photobioreactor (5 and 10 mm [38], which is 3 to 6 times smaller than the light path used in the present study. This could be the main factor for differences in biomass yield.
In relation to effluent quality as shown in Table 2, the experiment with 10% treated BW and without the addition of extra P (with an influent PO4-P concentration of ca. 5 mg L−1) achieved complete removal of both N and P and comply with the discharge limit. However, the microalgae biomass production in this experiment was lower compared to the other experiments. The addition of 29 mg L−1 extra P to the 10% treated BW substrate improved the biomass productivity and with a similar high N removal efficiency (99.7%). However, as indicated in Figure 4, the effluent P concentration (ranged from 3.6 to 8.3 mg L−1) surpassed the discharge limit of 1 mg L−1. In the case of the 20% treated BW substrate, complete removal of P was achieved with influent PO4-P concentration of up to 25 mg L−1, but the N removal efficiency decreased to 78% (Table 2). The decrease in N removal efficiency at high initial influent N may be related to light limitation. Moreover, a fraction of the initial NH4-N concentration in the influent was transformed into NO2-N and NO3-N, which may have resulted in the preference uptake of NH4-N. The NO2-N and NO3-N, therefore, remain in the effluent as indicated in Figure 9.
The nutrient removal yields on light, YNr/Ph (mg N (mol photons)−1) and YPr/Ph (mg P (mol photons)−1), were calculated to estimate the amount of light energy required to remove N and P from the substrate at a given photon flux density (PFD). The N removal yield on light for the defined medium was higher than the N removal yield on the light for the 10% and 20% treated blackwater substrate. The P yield on light, on the other hand, was lower in the case of the 10% treated blackwater. The yield on the substrate is higher for P than for N in all cases indicating the role of P in biomass production.
4. Conclusions
This study demonstrates the growth of Chlorella sorokiniana strain NIVA CHL176 in diluted treated blackwater. An average of up to 2 g biomass L−1d−1 or 50 g m−2 d−1 was produced in flat panel photobioreactors with short light paths of 30 mm and a continuous irradiance of ca. 1450 μmol photons m−2 s−1. Chlorella sorokiniana removed more than 99% of NH4-N and PO4-P on the 10% treated blackwater. Magnesium and trace elements in the treated blackwater were a limiting factor. The supplementation of these nutrients is necessary for optimal biomass productivity and subsequent removal of N and P. An addition of P to the substrate resulted in an increased biomass concentration but the P in the effluent got above the discharge limit. Nitrification of the ammonium in the substrate caused accumulated nitrite which inhibited the growth of C. sorokiniana and resulted in reduced biomass productivity when 20% treated blackwater was used. Although nitrite toxicity to Chlorella sorokiniana is not well understood, the results revealed its inhibiting effect on growth above 50 mg L−1. Anaerobic substrate supply or reduced substrate storage time during feeding can help to minimize nitrite accumulation and its effect on growth and biomass productivity of Chlorella sorokiniana. At 10% treated blackwater and low nitrite concentrations, complete removal of NH4-N and PO4-P were achieved. The N and P recovery rates were 99 mg N L−1d−1 and 8 mg P L−1d−1 for 10% treated BW and reached 213 mg N L−1d−1 and 35 mg P L−1d−1, respectively, when using 20% treated BW as a substrate. This implies that N and P are assimilated and stored in the form of microalgae biomass that can later be used as slow release bio-fertilizer. The effluent after microalgae biomass separation is clean water that meets the discharge permit limit.
Author Contributions
The corresponding author, M.E.M. conceived and performed the experiment, collected and analyzed the data, drafted the manuscript and edited and reviewed the final version. T.H. provided the resources and the required support in the design set up and supervision of the experiment, and critically reviewed and commented on the manuscript. A.H. participated in the concept development of the experiment, reviewed and commented on the manuscript. All authors have read and approved the final manuscript.
Funding
This research was funded by Ecomotive AS, Hareid, Norway and The Norwegian Research Council, with grant number of 252510 and 194051. The APC was funded by NMBU and NIBIO.
Acknowledgments
The authors thanks Ecomotive AS, and The Norwegian Research Council for their financial support. The authors would like also to thank Arne Svendsen, Sebastian Bing, Oliver Sahlmann, Sven Andreas Högfeldt, and Frida Celius Kalheim for their technical support.
Conflicts of Interest
The authors declare no conflict of interest.
References
- Kujawa-Roeleveld, K.; Zeeman, G. Anaerobic treatment in decentralized and source-separation-based. Rev. Environ. Sci. Bio/Technol 2006, 5, 115–139. [Google Scholar] [CrossRef]
- De Graaff, M.S.; Temmink, H.; Zeeman, G.; Buisman, C.J. Anaerobic treatment of concentrated black water in a uasb reactor at a short hrt. Water 2010, 2, 101–119. [Google Scholar] [CrossRef]
- De Graaff, M.H.; Temmink, G.; Zeeman, C. Buisman. Energy and phosphorus recovery from black water. Water Sci. Technol. 2011, 63, 2759–2765. [Google Scholar] [CrossRef] [PubMed] [Green Version]
- Moges, M.E.; Todt, D.; Janka, E.; Heistad, A.; Bakke, R. Sludge blanket anaerobic baffled reactor for source-separated blackwater treatment. Water Sci. Technol 2018, 78, 1249–1259. [Google Scholar] [CrossRef] [Green Version]
- Zeeman, G.; Kujawa, K.; Mes, T.D.; Hernandez, L.; Graaff, M.D.; Abu-Ghunmi, L.; Mels, A.; Meulman, B.; Temmink, H.; Buisman, C.; et al. Anaerobic treatment as a core technology for energy, nutrients and water recovery from source-separated domestic waste (water). Water Sci. Technol 2008, 57, 1207–1212. [Google Scholar] [CrossRef] [Green Version]
- Fuchs, W.; Drosg, B. Assessment of the state of the art of technologies for the processing of digestate residue from anaerobic digesters. Water Sci. Technol. 2013, 67, 1984–1993. [Google Scholar] [CrossRef] [Green Version]
- Wang, L.; Li, Y.; Chen, P.; Min, M.; Chen, Y.; Zhu, J.; Ruan, R. Anaerobic digested dairy manure as a nutrient supplement for cultivation of oil-rich green Microalgae chlorella sp. Bioresour. Technol. 2010, 101, 2623–2628. [Google Scholar] [CrossRef]
- Vázquez-Padín, J.R.; Figueroa, M.; Fernández, I.; Mosquera-Corral, A.; Campos, J.L.; Mendez, R. Post-treatment of effluents from anaerobic digesters by the anammox process. Water Sci. Technol. 2009, 60, 1135–1143. [Google Scholar] [CrossRef]
- Ruiz, G.; Jeison, D.; Rubilar, O.; Ciudad, G.; Chamy, R. Nitrification–denitrification via nitrite accumulation for nitrogen removal from wastewaters. Bioresour. Technol. 2006, 97, 330–335. [Google Scholar] [CrossRef]
- Gao, D.; Peng, Y.; Li, B.; Liang, H. Shortcut nitrification–denitrification by real-time control strategies. Bioresour. Technol 2009, 100, 2298–2300. [Google Scholar] [CrossRef]
- Gao, D.; Peng, Y.; Wu, W.M. Kinetic model for biological nitrogen removal using shortcut nitrification-denitrification process in sequencing batch reactor. Environ. Sci. Technol. 2010, 44, 5015–5021. [Google Scholar] [CrossRef] [PubMed]
- Helmer, C.; Kunst, S. Simultaneous nitrification/denitrification in an aerobic biofilm system. Water Sci. Technol. 1998, 37, 183–187. [Google Scholar] [CrossRef]
- Yilmaz, G.; Lemaire, R.; Keller, J.; Yuan, Z. Simultaneous nitrification, denitrification, and phosphorus removal from nutrient-rich industrial wastewater using granular sludge. Biotechnol. Bioeng. 2008, 100, 529–541. [Google Scholar] [CrossRef] [PubMed]
- Virdis, B.; Rabaey, K.; Rozendal, R.A.; Yuan, Z.; Keller, J. Simultaneous nitrification, denitrification and carbon removal in microbial fuel cells. Water Res. 2010, 44, 2970–2980. [Google Scholar] [CrossRef]
- Fux, C.; Boehler, M.; Huber, P.; Brunner, I.; Siegrist, H. Biological treatment of ammonium-rich wastewater by partial nitritation and subsequent anaerobic ammonium oxidation (anammox) in a pilot plant. J. Biotechnol. 2002, 99, 295–306. [Google Scholar] [CrossRef]
- Lackner, S.; Gilbert, E.M.; Vlaeminck, S.E.; Joss, A.; Horn, H.; van Loosdrecht, M.C. Full-scale partial nitritation/anammox experiences–an application survey. Water Res. 2014, 55, 292–303. [Google Scholar] [CrossRef]
- Sun, S.-P.; Nàcher, C.P.i.; Merkey, B.; Zhou, Q.; Xia, S.Q.; Yang, D.H.; Sun, J.H.; Smets, B.F. Effective biological nitrogen removal treatment processes for domestic wastewaters with low c/n ratios: A review. Environ. Eng. Sci. 2010, 27, 111–126. [Google Scholar] [CrossRef] [Green Version]
- Kebede-Westhead, E.; Pizarro, C.; Mulbry, W.W. Treatment of dairy manure effluent using freshwater algae: Elemental composition of algal biomass at different manure loading rates. J. Agric. Food. Chem. 2004, 52, 7293–7296. [Google Scholar] [CrossRef]
- Chinnasamy, S.; Bhatnagar, A.; Claxton, R.; Das, K.C. Biomass and bioenergy production potential of microalgae consortium in open and closed bioreactors using untreated carpet industry effluent as growth medium. Bioresour. Technol. 2010, 101, 6751–6760. [Google Scholar] [CrossRef]
- IPCC. Climate Change—The Physical Science Basis: Working Group 1 Contribution to the Fourth Assessment Report of the IPCC; Cambridge University Press: Cambridge, UK; New York, NY, USA, 2007; p. 212. [Google Scholar]
- Olguín, E.J. Phycoremediation: Key issues for cost-effective nutrient removal processes. Biotechnol. Adv. 2003, 22, 81–91. [Google Scholar] [CrossRef]
- Chinnasamy, S.; Bhatnagar, A.; Hunt, R.W.; Das, K.C. Microalgae cultivation in a wastewater dominated by carpet mill effluents for biofuel applications. Bioresour. Technol. 2010, 101, 3097–3105. [Google Scholar] [CrossRef] [PubMed]
- Kong, Q.X.; Li, L.; Martinez, B.; Chen, P.; Ruan, R. Culture of microalgae chlamydomonas reinhardtii in wastewater for biomass feedstock production. Appl. Biochem. Biotechnol. 2010, 160, 9. [Google Scholar] [CrossRef] [PubMed]
- Wang, L.; Min, M.; Li, Y.; Chen, P.; Chen, Y.; Liu, Y.; Wang, Y.; Ruan, R. Cultivation of green algae chlorella sp. In different wastewaters from municipal wastewater treatment plant. Appl. Biochem. Biotechnol. 2010, 162, 1174–1186. [Google Scholar] [CrossRef] [PubMed]
- Tuantet, K.; Temmink, H.; Zeeman, G.; Janssen, M.; Wijffels, R.H.; Buisman, C.J. Nutrient removal and microalgal biomass production on urine in a short light-path photobioreactor. Water Res. 2014, 55, 162–174. [Google Scholar] [CrossRef] [PubMed]
- Vasconcelos Fernandes, T.; Shrestha, R.; Sui, Y.; Papini, G.; Zeeman, G.; Vet, L.E.; Wijffels, R.H.; Lamers, P. Closing domestic nutrient cycles using microalgae. Environ. Sci. Technol. 2015, 49, 12450–12456. [Google Scholar] [CrossRef]
- Singh, M.; Reynolds, D.L.; Das, K.C. Microalgal system for treatment of effluent from poultry litter anaerobic digestion. Bioresour. Technol. 2011, 102, 10841–10848. [Google Scholar] [CrossRef]
- Wang, L.; Wang, Y.; Chen, P.; Ruan, R. Semi-continuous cultivation of chlorella vulgaris for treating undigested and digested dairy manures. Appl. Biochem. Biotechnol. 2010, 162, 2324–2332. [Google Scholar] [CrossRef]
- Eshetu Moges, M.; Todt, D.; Heistad, A. Treatment of source-separated blackwater: A decentralized strategy for nutrient recovery towards a circular economy. Water 2018, 10, 463. [Google Scholar] [CrossRef] [Green Version]
- Hutner, S.H.; Provasoli, L.; Schatz, A.; Haskins, C.P. Some approaches to the study of the role of metals in the metabolism of microorganisms. Proc. Am. Philos. Soc. 1950, 94, 152–170. [Google Scholar]
- Redfield, A.C. The biological control of chemical factors in the environment. Am. Sci. 1958, 46, 205–221, 230A. [Google Scholar]
- NORCCA. Available online: https://niva-cca.no/shop/trebouxiophyceae/chlorella/niva-chl-176 (accessed on 21 February 2020).
- Becker, E.W. Micro-algae as a source of protein. Biotechnol. Adv. 2007, 25, 207–210. [Google Scholar] [CrossRef] [PubMed]
- Matsukawa, R.; Hotta, M.; Masuda, Y.; Chihara, M.; Karube, I. Antioxidants from carbon dioxide fixing chlorella sorokiniana. J. Appl. Phycol. 2000, 12, 263–267. [Google Scholar] [CrossRef]
- Skjånes, K.; Andersen, U.; Heidorn, T.; Borgvang, S.A. Design and construction of a photobioreactor for hydrogen production, including status in the field. J. Appl. Phycol. 2016, 28, 2205–2223. [Google Scholar] [CrossRef] [PubMed] [Green Version]
- Gonzalez-Camejo, J.; Barat, R.; Pachés, M.; Murgui, M.; Seco, A.; Ferrer, J. Wastewater nutrient removal in a mixed microalgae–bacteria culture: Effect of light and temperature on the microalgae–bacteria competition. Environ. Technol. 2018, 39, 503–515. [Google Scholar] [CrossRef]
- Cuaresma, M.; Janssen, M.; Vílchez, C.; Wijffels, R.H. Horizontal or vertical photobioreactors? How to improve microalgae photosynthetic efficiency. Bioresour. Technol. 2011, 102, 5129–5137. [Google Scholar] [CrossRef]
- Tuantet, K.; Janssen, M.; Temmink, H.; Zeeman, G.; Wijffels, R.H.; Buisman, C.J. Microalgae growth on concentrated human urine. J. Appl. Phycol. 2014, 287–297. [Google Scholar] [CrossRef]
- Fernandes, T.V.; Suárez-Muñoz, M.; Trebuch, L.M.; Verbraak, P.J.; Van de Waal, D.B. Toward an ecologically optimized n: P recovery from wastewater by microalgae. Front. Microbiol. 2017, 8, 1742. [Google Scholar] [CrossRef] [Green Version]
- Maguer, J.F.; L’Helguen, S.; Madec, C.; Labry, C.; Le Corre, P. Nitrogen uptake and assimilation kinetics in alexandrium minutum (dynophyceae): Effect of n-limited growth rate on nitrate and ammonium interactions. Eur. J. Phycol. 2007, 43, 295–303. [Google Scholar] [CrossRef]
- Hii, Y.S.; SOO, C.L.; Chuah, T.S.; Mohd-Azmi, A.; Abol-Munafi, A.B. Interactive effect of ammonia and nitrogen on the nitrogen uptake by Nannochloropsis sp. J. Sustain. Sci. Manage 2011, 6, 60–68. [Google Scholar]
- Gonzalez-Camejo, J.; Barat, R.; Ruano, M.V.; Seco, A.; Ferrer, J. Outdoor flat-panel membrane photobioreactor to treat the effluent of an anaerobic membrane bioreactor. Influence of operating, design, and environmental conditions. Water Sci. Technol. 2018, 78, 195–206. [Google Scholar] [CrossRef]
- Cai, T.; Park, S.Y.; Li, Y. Nutrient recovery from wastewater streams by microalgae: Status and prospects. Renew. Sustain. Energy Rev. 2013, 19, 360–369. [Google Scholar] [CrossRef]
- Podevin, M.; De Francisci, D.; Holdt, S.L.; Angelidaki, I. Effect of nitrogen source and acclimatization on specific growth rates of microalgae determined by a high-throughput in vivo microplate autofluorescence method. J. Appl. Phycol. 2015, 27, 1415–1423. [Google Scholar] [CrossRef] [Green Version]
Figure 1.
Schematic experimental set-up of the chemostat.

Figure 2.
Dry biomass concentration of Chlorella sorokiniana (X) in g L−1 as grown in the defined medium and the concentrations of (a) NO3−N and (b) PO4−P in the effluent in mg L−1.
Figure 2.
Dry biomass concentration of Chlorella sorokiniana (X) in g L−1 as grown in the defined medium and the concentrations of (a) NO3−N and (b) PO4−P in the effluent in mg L−1.

Figure 3.
N and P removal efficiency of C. sorokiniana as grown in the defined medium.

Figure 4.
Dry biomass concentration X in g L−1 without Mg and without extra P, with Mg and extra P and with Mg but not extra P (□), N concentration in the effluent (▲), and P concentration in the effluent (-o-) using 10% treated source-separated blackwater as a substrate.
Figure 4.
Dry biomass concentration X in g L−1 without Mg and without extra P, with Mg and extra P and with Mg but not extra P (□), N concentration in the effluent (▲), and P concentration in the effluent (-o-) using 10% treated source-separated blackwater as a substrate.

Figure 5.
Change in NH4-N, NO2-N, and NO3-N concentrations in the substrate during the 6th day feeding period.
Figure 5.
Change in NH4-N, NO2-N, and NO3-N concentrations in the substrate during the 6th day feeding period.

Figure 6.
NH4-N, NO2-N, and NO3-N concentrations in the effluent culture during the 6th day feeding period.
Figure 6.
NH4-N, NO2-N, and NO3-N concentrations in the effluent culture during the 6th day feeding period.

Figure 7.
The response of Chlorella sorokiniana to anaerobic substrate condition. Photobioreactor (PBR) I substrate was kept anaerobic during the entire 10 days of the experiment, while in PBR II the substrate was kept aerobic in the first 5 days and anaerobic thereafter.
Figure 7.
The response of Chlorella sorokiniana to anaerobic substrate condition. Photobioreactor (PBR) I substrate was kept anaerobic during the entire 10 days of the experiment, while in PBR II the substrate was kept aerobic in the first 5 days and anaerobic thereafter.

Figure 8.
Nitrite concentrations in the anaerobic substrate PBR I (o), and aerobic and anaerobic substrate in PBR II (●).
Figure 8.
Nitrite concentrations in the anaerobic substrate PBR I (o), and aerobic and anaerobic substrate in PBR II (●).

Figure 9.
Average influent and effluent concentrations of NH4-N, NO2-N and NO3-N.

Figure 10.
N and P removal efficiency of C. sorokiniana.


Table 1.
Nutrient concentration of anaerobically digested blackwater effluent, effluent after filtration and ultraviolet (UV) treatment and defined.
Table 1.
Nutrient concentration of anaerobically digested blackwater effluent, effluent after filtration and ultraviolet (UV) treatment and defined.
| Nutrient | Anaerobically Digested Blackwater | After Filtration and UV Treatment | 10% ** TreatedBW | Defined Medium |
|---|---|---|---|---|
| Ntot mg L−1 | 1140–2360 | 1100–1980 | 110–198 | 247 |
| NH4-N mg L−1 | 580–1390 | 580–1200 | 58–120 | ND |
| NO3-N mg L−1 | 0–4.05 | 6–93.6 | 0.6–9.36 | 247 |
| NO2-N mg L−1 | 0–0.6 | 0.2–130 | 0.02–13 | ND |
| Ptot mg L−1 | 100–140 | 76–92.4 | 7.6–9.24 | 29.2 |
| PO4-P mg L−1 | 46–92.5 | 54–85.3 | 5.4–8.53 | 29.2 |
| Mg mg L−1 * | 11.3 | 9.4 | 0.94 | 9.8 |
| K mg L−1 * | 165.0 | 185.0 | 18.5 | 59.3 |
| Ca mg L−1 * | 38.8 | 31.8 | 3.18 | 13.6 |
| Na mg L−1 * | 191.7 | 195 | 19.5 | 411 |
| Al µg L−1 * | 22.0 | 15.5 | 1.55 | 0.0 |
| Fe µg L−1 * | 143.3 | 40.7 | 4.07 | 1.0 |
| Cu µg L−1 * | 30.7 | 6.9 | 0.69 | 0.4 |
| Mn µg L−1 * | 37.5 | 6.0 | 0.60 | 1.4 |
| Ni µg L−1 * | 11.1 | 3.7 | 0.37 | 0.0 |
| Zn µg L−1 * | 62.0 | 30.5 | 3.05 | 5.0 |
| Co µg L−1 * | 0.43 | 0.17 | 0.017 | 0.4 |
| Turbidity NTU | 80–160 | 0.15–2 | ND | ND |
| E. coli MPN/100 mL | 10^5 | <1 | <1 | ND |
* For blackwater based media: Averages of three samples taken at earlier points of time before the algae experiment started. ND = not determined, ** calculated from the effluent concentration of “After filtration and UV treatment”.
Table 2.
The average (± standard deviation) of nutrient removal rates, the nutrient yield on light, biomass yield on light, and biomass yield on a substrate (N and P) on the defined medium as compared to the treated blackwater (BW).
Table 2.
The average (± standard deviation) of nutrient removal rates, the nutrient yield on light, biomass yield on light, and biomass yield on a substrate (N and P) on the defined medium as compared to the treated blackwater (BW).
| Unit | Defined Medium | 10% Treated BW without Extra P | 10% Treated BW with Extra P | 20% Treated BW with Extra P | |
|---|---|---|---|---|---|
| Ntot | mg L−1 | 247 | 54–85 | 54–85 | 177–212 |
| Ptot | mg L−1 | 29.2 | 4.5–6 | 33–35.2 | 18.8–21.3 |
| N:P ratio | 8.7 | 12–14 | 3.5 | 10 | |
| Volumetric biomass productivity PV | g L−1 d−1 | 2.17 | 1.5 | 2.1 | 1.9 |
| Areal biomass productivity PA | g m−1 d−1 | 52.21 | 36.18 | 50.43 | 46.04 |
| N removal efficiency Nreff | % | 80–98 | 99.8 | 99.7 | 77.8 |
| P removal efficiency Preff | % | 63–83 | 99.2 | 86.1 | 99.5 |
| N removal rate Nr | mg N L−1d−1 | 291.1 ± 29.8 | 99.17 ± 0.3 | 110.46 ± 0.4 | 212.6 ± 23 |
| P removal rate Pr | mg P L−1d−1 | 29.5 ± 4.1 | 8.3 ± 04 | 42.7 ± 2.6 | 35.3 ± 0.6 |
| N removal yield on light YN/Ph | mg (mole photons)−1 | 55.9 ± 5.7 | 19.1 ± 0.3 | 20.9 ± 0.1 | 41.0 ± 4.1 |
| P removal yield on light YP/Ph | mg (mole photons)−1 | 5.7 ± 0.8 | 1.6 ± 0.01 | 8 ± 0.9 | 6.8 ± 0.1 |
| Biomass yield on light YX/Ph | mg (mole photons)−1 | 420 | 290 | 400 | 370 |
| Biomass yield on N YX/N | g g−1 | 7.9 ± 1.3 | 15.2 ± 0.2 | 18.9 ± 1.5 | 9 ± 1.1 |
| Biomass yield on P YX/P | g g−1 | 78.4 ± 9.0 | 187.9 ± 9.5 | 50.2 ± 4.5 | 54 ± 5.2 |
© 2020 by the authors. Licensee MDPI, Basel, Switzerland. This article is an open access article distributed under the terms and conditions of the Creative Commons Attribution (CC BY) license (http://creativecommons.org/licenses/by/4.0/).
Share and Cite
MDPI and ACS Style
Moges, M.E.; Heistad, A.; Heidorn, T. Nutrient Recovery from Anaerobically Treated Blackwater and Improving Its Effluent Quality through Microalgae Biomass Production. Water 2020, 12, 592. https://doi.org/10.3390/w12020592
AMA Style
Moges ME, Heistad A, Heidorn T. Nutrient Recovery from Anaerobically Treated Blackwater and Improving Its Effluent Quality through Microalgae Biomass Production. Water. 2020; 12(2):592. https://doi.org/10.3390/w12020592
Chicago/Turabian StyleMoges, Melesse Eshetu, Arve Heistad, and Thorsten Heidorn. 2020. "Nutrient Recovery from Anaerobically Treated Blackwater and Improving Its Effluent Quality through Microalgae Biomass Production" Water 12, no. 2: 592. https://doi.org/10.3390/w12020592
Note that from the first issue of 2016, this journal uses article numbers instead of page numbers. See further details here.