Effect of Heavy Metal Ions on Steroid Estrogen Removal and Transport in SAT Using DLLME as a Detection Method of Steroid Estrogen


1
Key Lab of Groundwater Resources and Environment, Jilin University, Ministry of Education, Changchun 130021, China
2
Key Lab of Eco-restoration of Region Contaminated Environment, Shenyang University, Ministry of Education, Shenyang 110044, China
3
Institute of Intergrative Biology, University of Liverpool, Liverpool L69 3BX, UK
*
Author to whom correspondence should be addressed.
Water 2020, 12(2), 589; https://doi.org/10.3390/w12020589
Submission received: 27 January 2020
/
Revised: 12 February 2020
/
Accepted: 17 February 2020
/
Published: 21 February 2020
(This article belongs to the Section Wastewater Treatment and Reuse)
Abstract
:Environmental endocrine-disrupting chemicals have become a global environmental problem, and the distribution, transport, and fate of estrogens in soil and water environments closely relate to human and ecological health as well as to the remediation scheme design. A new micro-extraction technique termed dispersive liquid–liquid micro-extraction (DLLME) combined with high-performance liquid chromatography with fluorescence detector (HPLC-FLD) was developed for the determination of the concentration of steroid estrogens in water samples. The detection limits of HPLC-FLD and DLLME-HPLC/FLD were 0.68–1.73 μg L−1 and 7.16–69.22 ng L−1, respectively. Based on this method, the isothermal adsorption of 17β-E2 on sand and a breakthrough experiment of 17β-E2 and Cu2+ in a soil aquifer treatment (SAT) system were studied. The 17β-E2 adsorption capacity of sand in 17β-E2 solution was detected to be larger than that in a mixed solution of 17β-E2 and Cu(NO3)2 solution, and the breakthrough curves of 17β-E2 and Cu2+ in the mixed solution shifted forward in sand column experiments. Both suggested that the competitive adsorption of 17β-E2 and Cu2+ in the mixed solution might occur on the surface of the sand. In the process of the removal of 17β-E2 in wastewater by SAT, the existence of Cu2+ slightly inhibited the adsorption of 17β-E2 and accelerated the breakthrough of 17β-E2. These results ought to be a warning for SAT application for 17β-E2 removal in water where heavy metals coexist.
1. Introduction
Similar to ozone depletion and global warming, endocrine disruptors have become another major global issue. Natural steroid estrogens, such as estrone (E1), estradiol (E2), and estriol (E3), are kinds of endocrine-disrupting compounds with strong estrogenic activity. Concentrated animal feeding operations (CAFOs) and sewage treatment plants for effluent outfall are known as the two major pollution sources of steroid estrogen into the environment [1]. Steroidal estrogens can be transported and transformed in many ways, such as through adsorption, bioaccumulation and degradation [2,3], and have been detected in soil and water environments [4,5].
Endocrine-disrupting chemicals (EDCs) are harmful to wildlife, even at very low concentrations [6], which brings some difficulties to the remediation of EDCs. Studies show that estrogens can be removed by physical methods [7], chemical methods [8], photochemical methods [9], and biodegradation [10]. Under the appropriate conditions, a soil aquifer treatment system can include most of the above removal methods. Soil aquifer treatment (SAT) is an effective wastewater treatment technology. Compared with the conventional wastewater treatment process, it has a higher removal efficiency of trace organic matter [11,12]. A series of SAT simulation studies revealed that the removal mechanism of SAT for endocrine-disrupting substances, such as steroid estrogens, was mainly the adsorption of porous media, combined with biodegradation, and that the concentration could below the detection limit [13]. The precondition of SAT biodegradation is the adsorption and retention of pollutants by a medium. Therefore, by improving the adsorption capacity of the medium, the efficiency of SAT can be improved [14,15]. However, the adsorption effect of adsorbent will be affected by many factors under different conditions, especially for polluted water, which usually contains several kinds of pollution components. In the presence of such a multi-component, the specific adsorption ability of adsorbent for a specific adsorbate affects the pollution removal effect during the application of SAT [16,17].
Furthermore, as a new pollution component, the detection method for estrogens restricts the research of their pollution processes. Various methods are used for the testing of estrogens in environmental samples, including chemical analysis, biological analysis, and enzyme-linked immunosorbent assay (ELISA) [18,19]. However, the steroidal estrogen contents in the environment are usually at the nanogram to microgram level; hence, it is difficult to get accurate testing results, even if a high-sensitivity analysis instrument is used [20,21]. In recent years, dispersive liquid–liquid micro-extraction (DLLME) as a new highly efficient liquid phase micro-extraction method, has received significant research interest [22,23].
In this study, a SAT site located in Shenyang, Liaoning Province of China was taken as a case for the influences of multi-component pollutants on the SAT removal efficiency of steroidal estrogens. The specific objectives of the study were to (1) introduce the ionic liquid 1-butyl-3-methylimidazolium hexafluorophosphate ([BMIM]PF6) as an extractant in DLLME and optimize the factors influencing DLLME extraction and enrichment, (2) apply DLLME in field and laboratory sample analyses, and (3) investigate the effect of heavy metal ions (Cu2+) on the removal and transport of steroid estrogens (17β-E2) in a SAT system.
2. Materials and Methods
2.1. Description of the Study Area
The study area was located in Qianjin farm, Liaoning Province, China. Aquaculture and animal husbandry are developing rapidly in this area. The two main sources of steroid estrogens in the subsurface environment of this area are the infiltration of fish pond water, the direct excretion of livestock manure, and the application of organic fertilizer. Due to the small study area, it is impossible to build a traditional large-scale SAT infiltration tank. Therefore, a small-scale enhanced SAT system has been established in a limited area to meet the needs of relatively rapid treatment of a large volume of sewage [1].
In the initial stage of research, the well water (Sample No.: QJJ01-05) and farm wastewater (Sample No.: XQ) in the study area were sampled and analyzed, and some of the analysis results are given in Table 1.From the table, the concentration of Fe and Mn in the local well water seriously exceeded the Standard for Drinking Water Quality (GB 5749-2006), which has been proven to be caused by native aquifer chemical composition rather than human activities [24]. For farm wastewater, the concentration of all detected heavy metals was significantly higher than the standard. Since this study was focused on the co-transport of estrogen and heavy metal ions in the livestock wastewater, Cu2+ was used as a representative to investigate the effect of heavy metal ions on the removal and transport of steroid estrogens in SAT due to its thousand-fold concentration in comparison to local groundwater.
2.2. DLLME Method and Optimization
2.2.1. Detection Operation
Stock solutions of 1000 mg L−1 for 17β-E2 and E3 (Dr. Ehrenstorfer, GER) were dissolved in methanol and stored at 4 °C. Standard solutions made from stock solutions were diluted with methanol. The experimental water was ultrapure water and all the experimental water and solvents were filtered by 0.22 μm filters. Two sewage plant secondary effluent (SPSE) samples, two fishpond water samples, one river water sample and one groundwater sample were collected in brown bottles, and formaldehyde (v/v = 1%) was immediately added to prevent microbial degradation of steroid estrogen. The samples were then filtered by 0.22 μm glass fiber filters, and preserved away from the light at 4 °C. All the water samples were analyzed immediately after arrival at the laboratory.
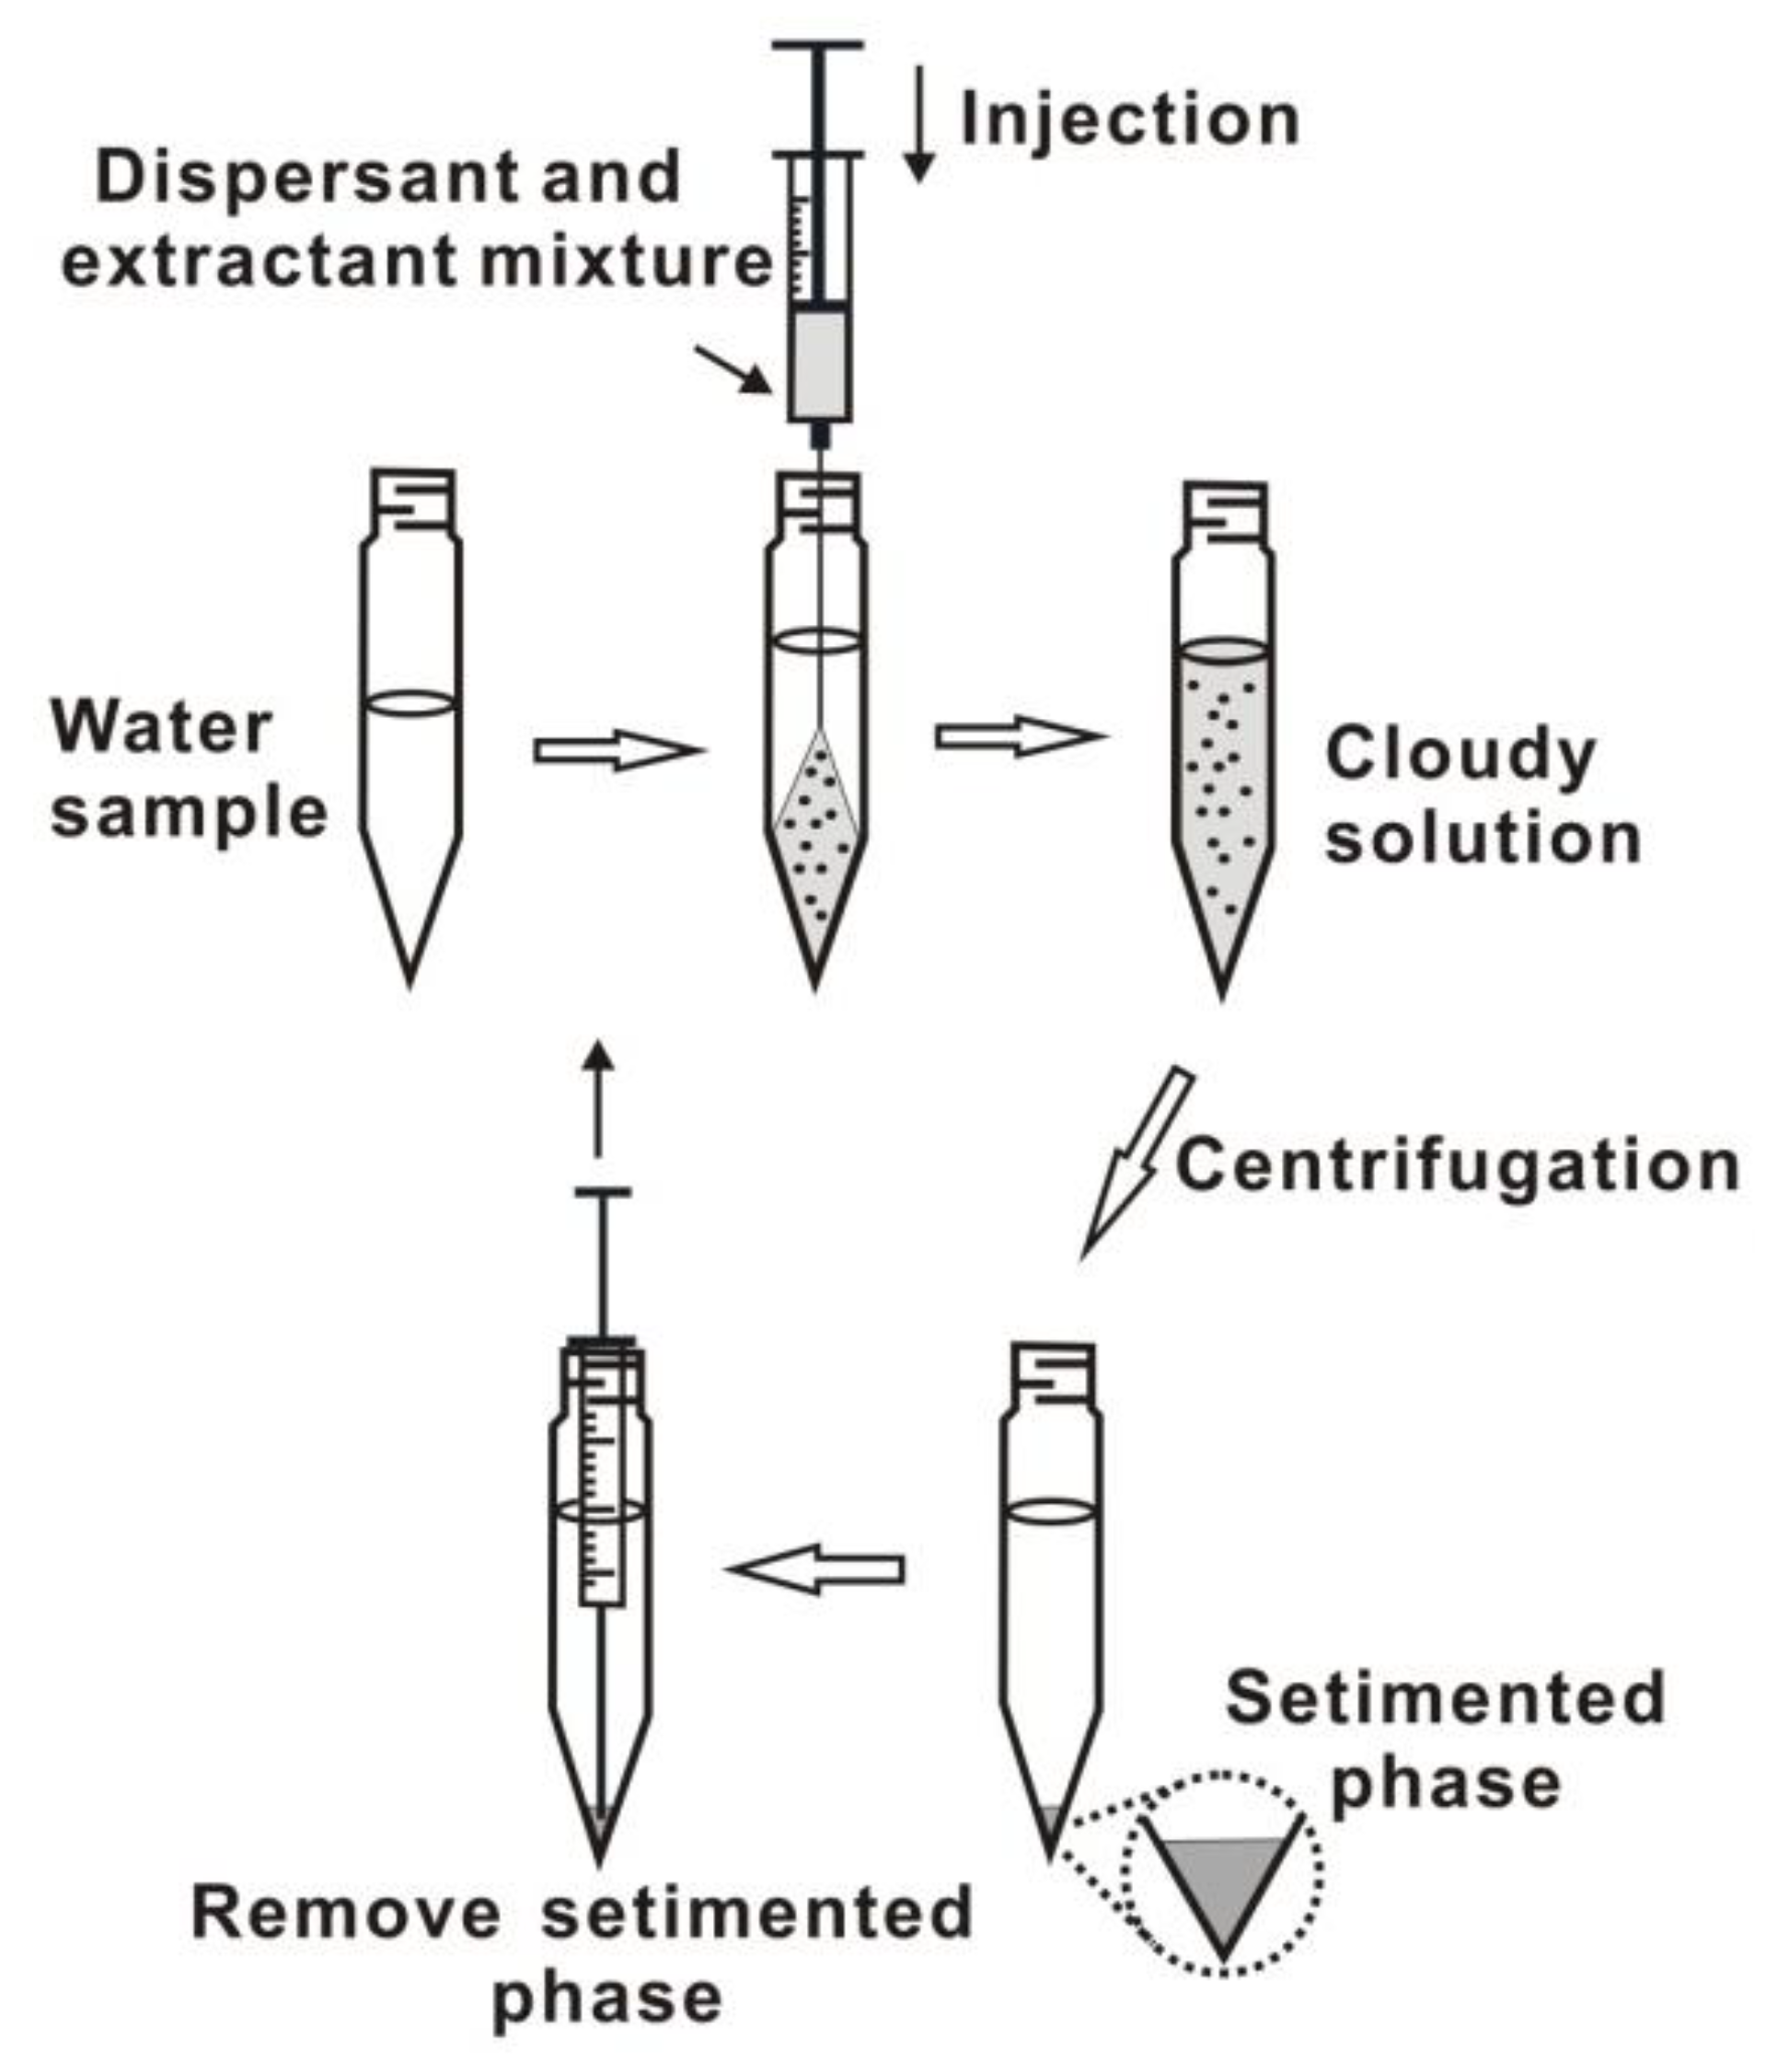
The water samples were subjected to DLLME. A 6 mL water sample was placed in a 10 mL glass centrifuge tube and the mixture of dispersant and extractant (Shanghai Cheng Jie Chemical Co., Ltd., CHN) were rapidly injected into the tube, and then the water sample was ultrasonicazed for a period of time to form a cloudy solution. After this, the mixture was centrifuged and the extraction phase gathered at the bottom of the centrifugal tube. A certain volume of sedimentation phase was collected and dissolved by methanol. Finally, the HPLC (Agilent, USA) was used to analyze the sample. The extraction steps are illustrated in Figure 1.
LC conditions: An extend C18 column was used to analyze the steroid estrogens and the mobile phase was water/methanol/acetonitrile (50–30–20) in isocratic mode. The excitation and emission wavelength were 280 and 310 nm and flow rate and injection volume was 1.0 mL min−1 and 20 μL, respectively.
2.2.2. Optimization of DLLME
The study used extraction recovery (ER), enrichment factor (EF), or relative recovery (RR) as the basis for optimizing the influential factors. The ER, EF [25], and RR [22] were calculated by the following equations:
where m0, msed, V0, and Vsed are the total analyte amount, the amount of analyte in the sedimentation phase, the water sample volume, and the volume of the sedimentation phase, respectively.
where Csed is the analyte concentration in the sediment and C0 is the initial concentration of analyte in the water samples.
where Cf is the detected concentration of analyte after addition of known amount of standard in the real sample, Cr is the analyte concentration in real sample, and Ca is the concentration of the known amount of standard which was spiked to the real sample.
Ionic liquid [BMIM]PF6 were selected as extraction solvent since it has a higher density than water, great extraction capability, low toxicity, and non-volatility [25], and an important criterion for dispersant selection is that the dispersant needs to be miscible with extractant and water. Methanol, acetonitrile, and acetone are some of the commonly used disperser solvents [26,27]. As environmental science research, considering the mobile phase of HPLC in the text and the solvent toxicity, methanol was selected as the disperser solvent. Considering the enrichment effect of extraction and the operability of the experiment, different volumes of [BMIM]PF6 and methanol were used in DLLME to obtain the optimal volumes of extractant and dispersant in this study.
Ultrasonic methods can promote better formation of a cloudy state. As such, appropriate ultrasonication time can improve the enrichment efficiency of estrogens and shorten the extraction time. With reference to some similar studies [28,29], several ultrasonication times were used in DLLME to observe the effect of ultrasonication time on the EF.
A glass centrifugal tube should be used to avoid the adsorption of the objects by plastic centrifugal tubes, since the estrogens are organic contaminants. However, a high centrifugal rotational speed can lead to glass fragmentation; hence, the 100 μg L−1 water samples were centrifuged at different centrifugal rotational speeds by following the same enrichment procedures to obtain an appropriate centrifugal rotational speed.
2.3. Isothermal Adsorption
In the batch adsorption experiments, typical sands sampled in the study area served as the adsorbent, and their average diameter and specific surface area were 0.479 mm and 0.003 m2 g−1, respectively. The adsorbents with the masses ranging from 0.2 to 1 g, were placed in a 250 mL Erlenmeyer flask containing 100 mL of 20 mg L−1 17β-E2 solution or 17β-E2 and Cu(NO3)2 mixed solution and the flasks were shaken at 180 rpm in a shaking incubator (Shanghai Min Quan Instruments Co., Ltd., CHN) at 288.15 K until equilibrium was achieved. The isothermal adsorption experiments were carried out for 24 h, which was long enough for adsorption to reach equilibrium, and the adsorption isotherms data were fitted to the Freundlich and Langmuir isotherm models [30]. The following expression describes the Freundlich equation:
The Langmuir equation is given as:
where qe and qm are the adsorption capacity of the medium at equilibrium and the maximum adsorption capacity of the medium (mg g−1), Ce is the concentration of the pollutant in equilibrium (mg L−1), n and KF are the Freundlich constants, and KL is the Langmuir constant.
2.4. Laboratory Simulation of SAT System
2.4.1. Soil Column Description
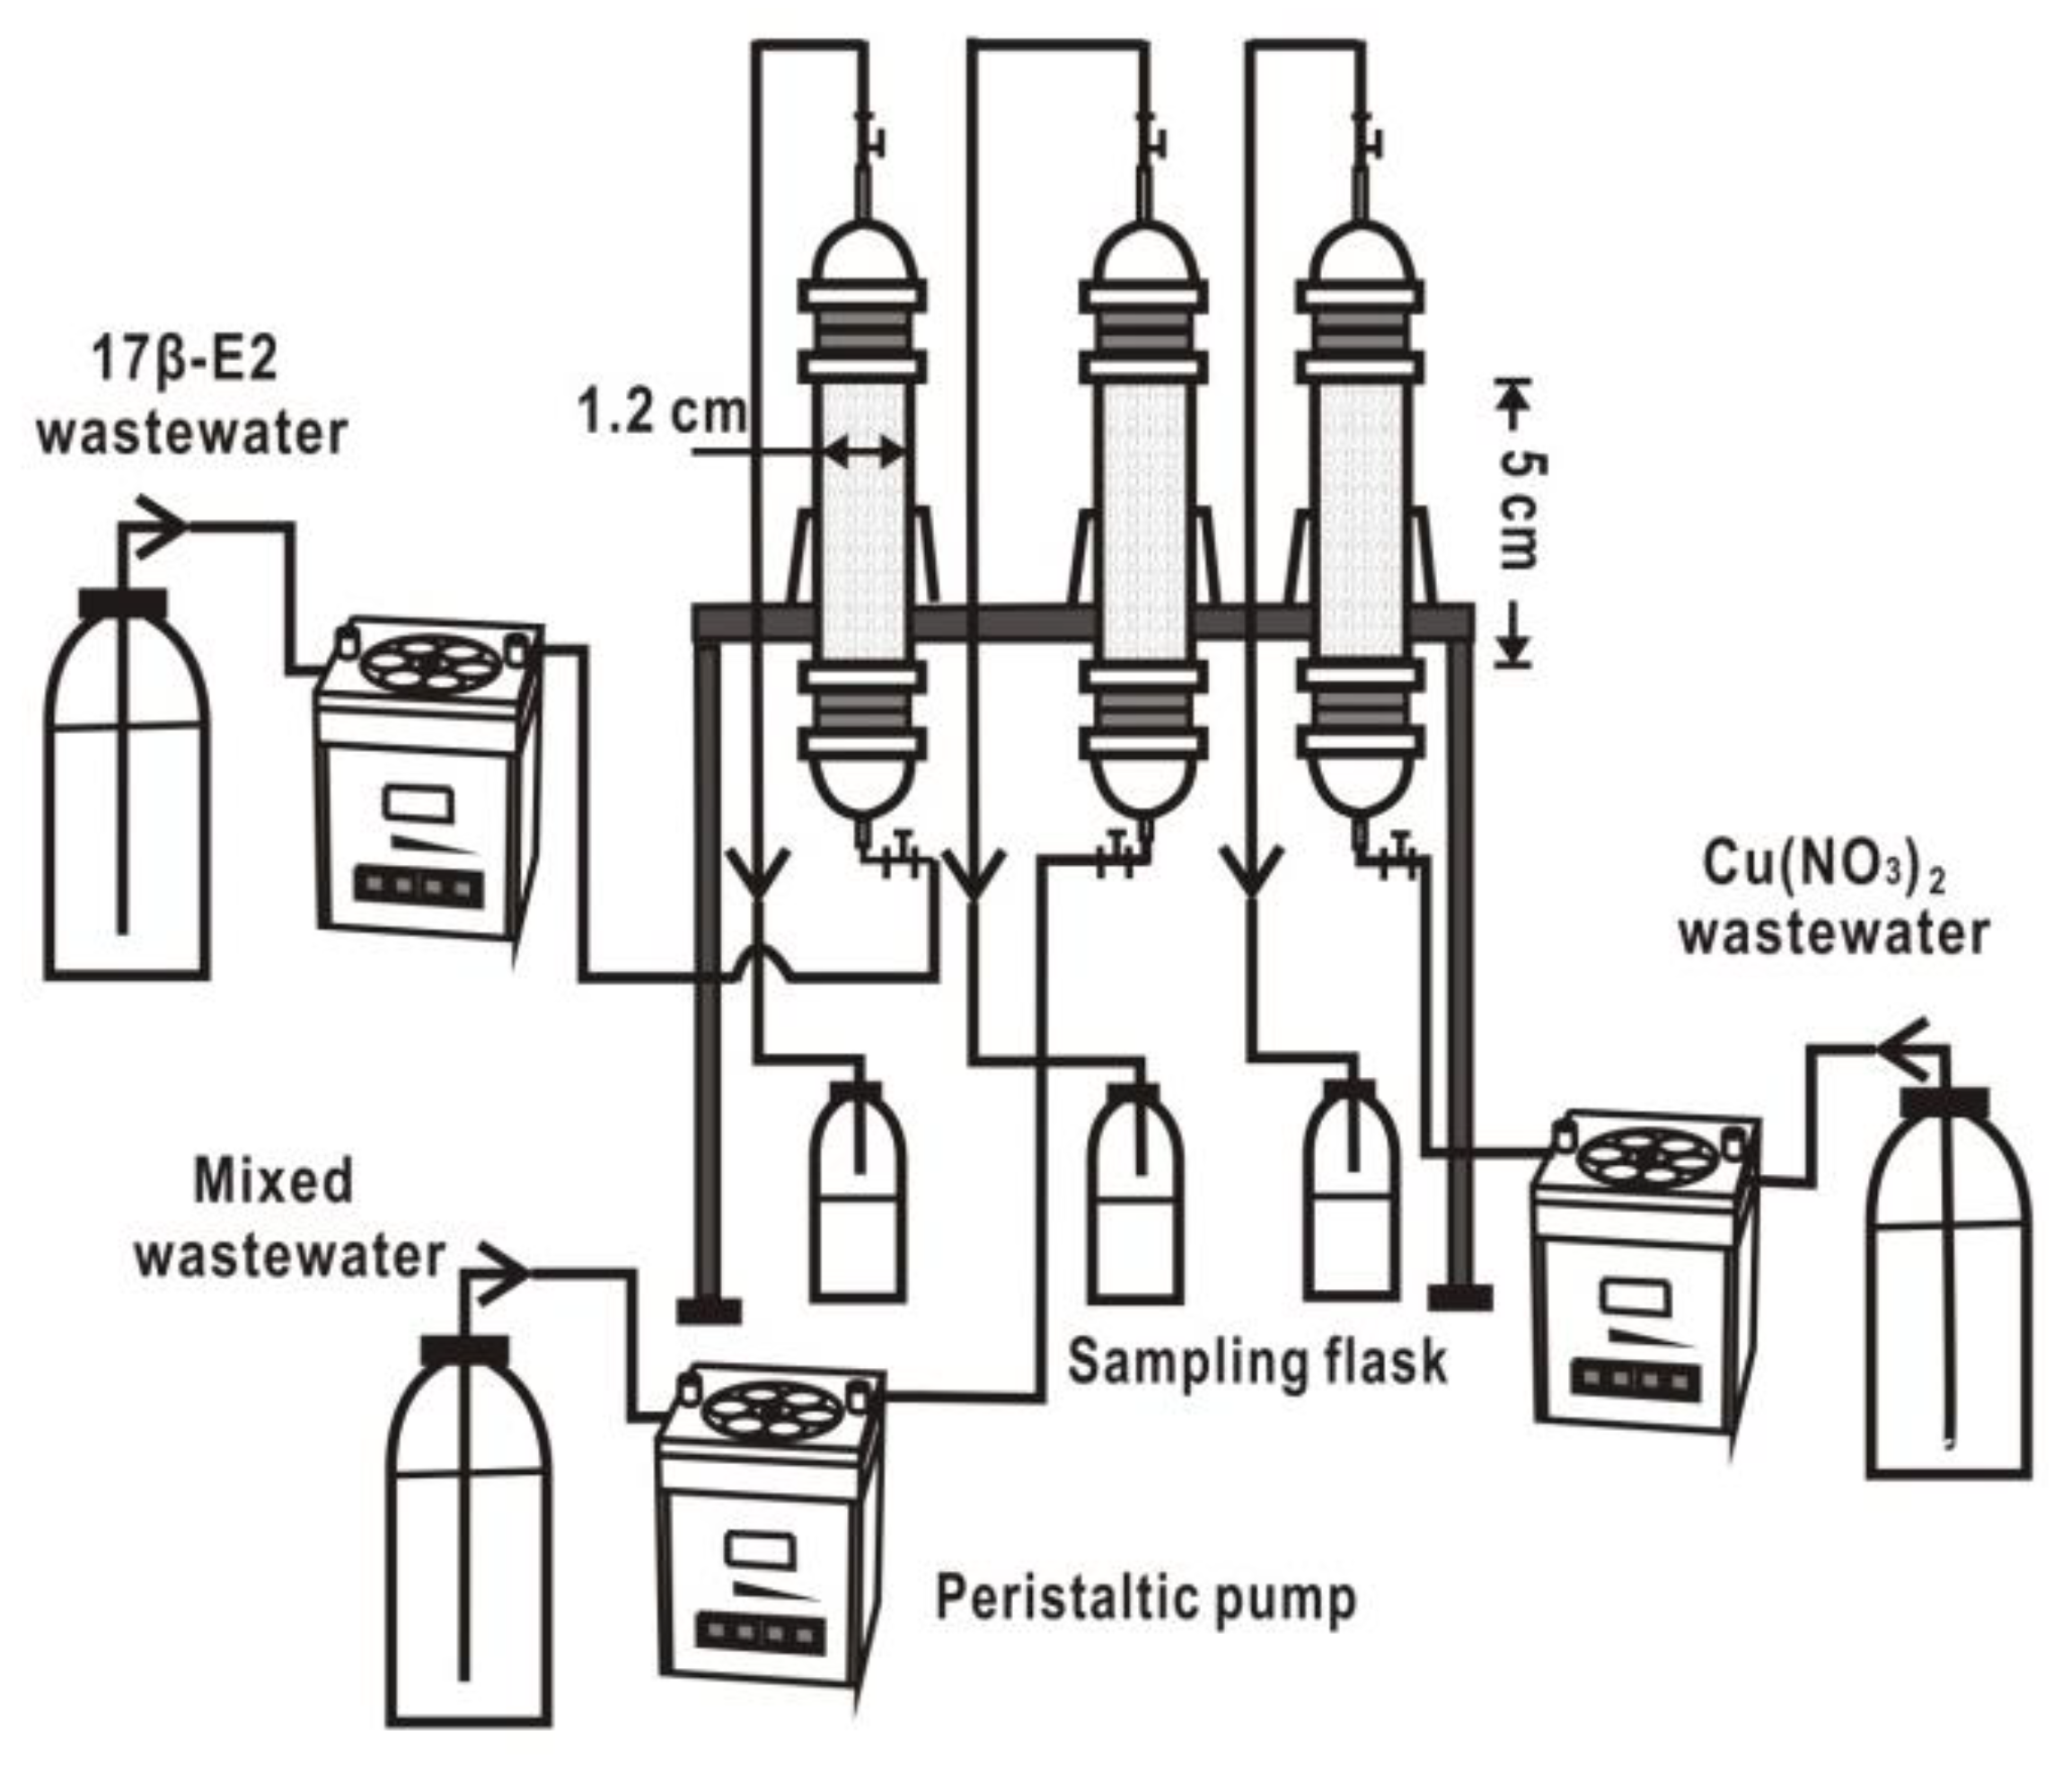
A schematic drawing of the soil column setup is shown in Figure 2. Plexiglass columns, 5 cm in length with inner diameters of 1.2 cm, were packed to a density of 1.77 g cm−3 under saturated conditions with river sand. The river sand was immersed in 0.1 mol L−1 NaOH solution to remove the surface impurities, and then washed thoroughly with ultra pure water and dried for packing columns. Pertinent soil characteristics are summarized in Table 2. In order to prevent the outlet of the column from clogging, 200 stainless steel meshes were filled at the top and bottom of the column, respectively, and a polytetrafluoroethylene gasket was fixed between the column top and body to prevent leakage.
2.4.2. SAT Simulation Scenarios
All columns were operated under saturated conditions at 15 ± 1 °C (to simulate the underground environment). The saturated condition was achieved by continuously feeding wastewater from the bottom of the column, with the water table being kept above the surface of the sand. Synthetic wastewater was prepared by ultrapure water, including 10 mg L−1 17β-E2 solution, 0.602 mmol L−1 Cu(NO3)2 solution, and the mixed solution of 17β-E2 and Cu(NO3)2. The pH of 17β-E2 and Cu(NO3)2 solution were 7.13 and 5.48, respectively.
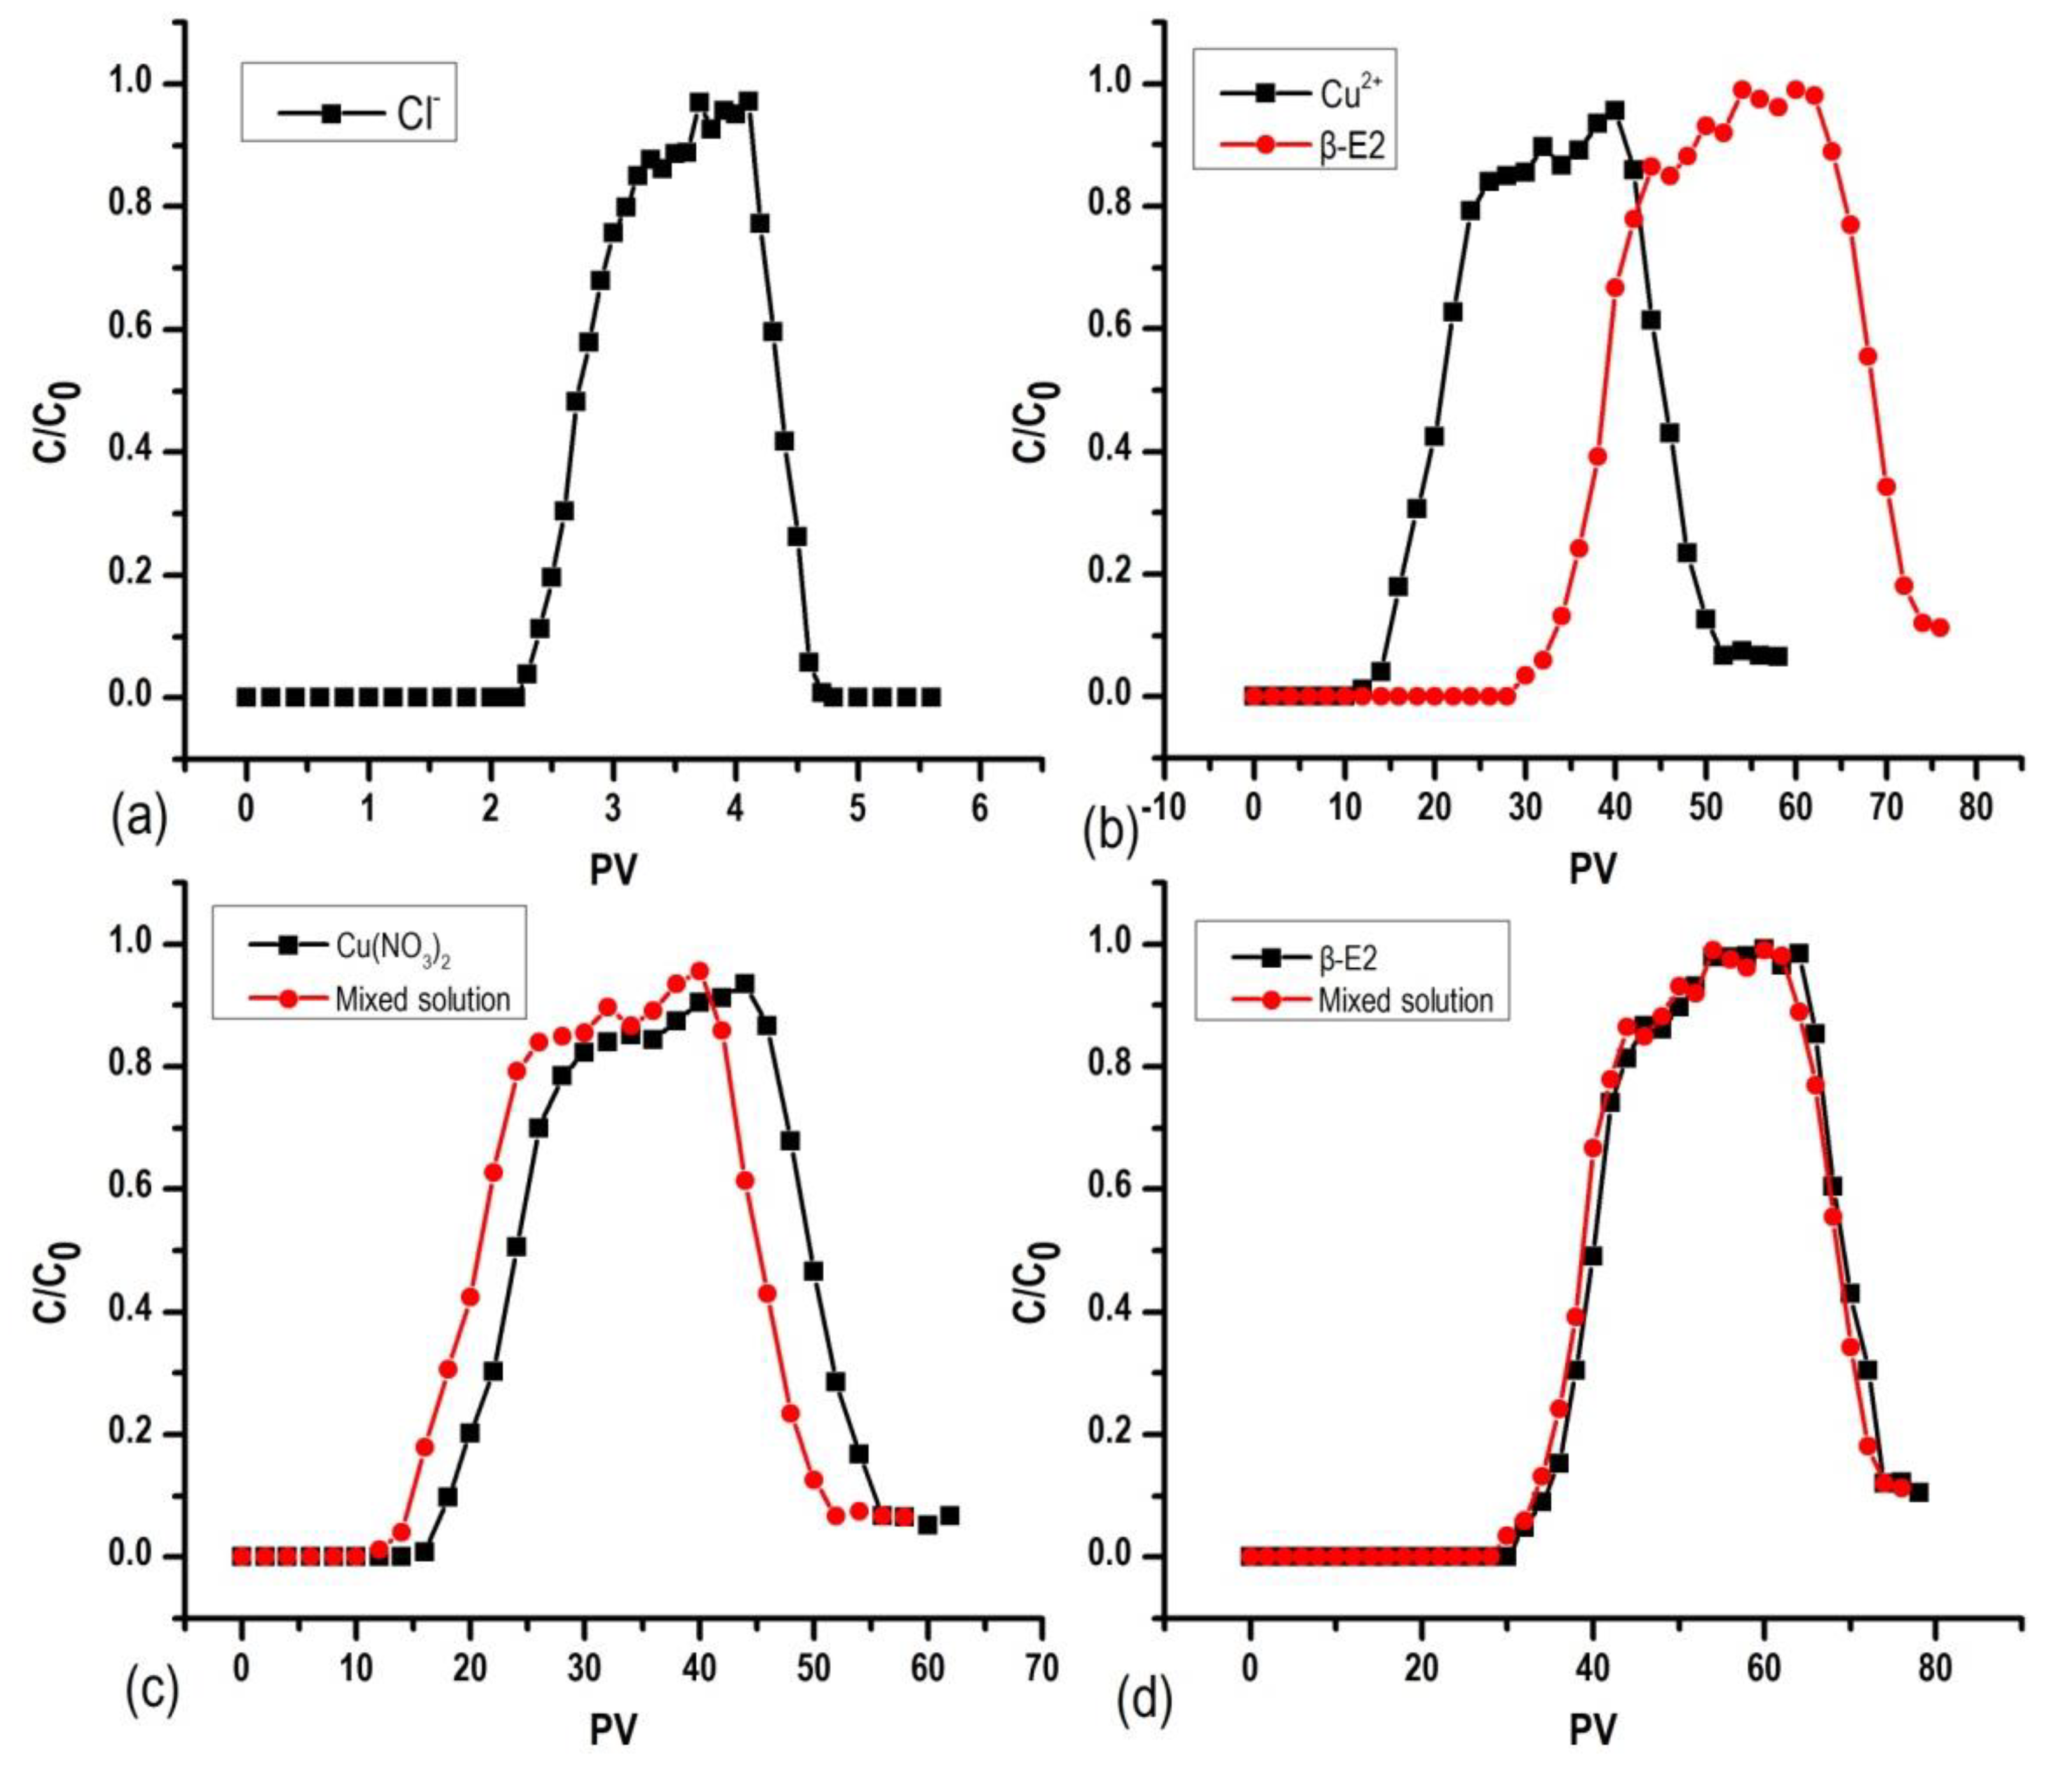
As a tracer, Cl− was supplied from the bottom of the column at an injection flow rate of 1 mL min−1. After the Cl− breakthrough, the ultrapure water was fed from the bottom of the column instead of the NaCl solution to obtain the breakthrough curve of the tracer. Then, three kinds of artificial wastewater were supplied to columns in the same way and under the same conditions. Effluent samples were collected every 10 min and analyzed by HPLC and Atomic Absorption Spectrometry (AAS) (Shimadzu, JPN). When the concentration of the effluent was similar to that of the inflow, the ultrapure water was fed from the column bottom instead of the artificial wastewater.
2.5. Retardation Factor
One of the important factors that affect the transport rate, concentration distribution, and pollution range distribution of pollutants in geological media is that in the process of pollutants moving with the groundwater-due to the physical adsorption, ion exchange, and chemical deposition of pollutants by geological media-the velocity of pollutant transport is lower or even far lower than that of groundwater flow, which is reflected in quantitative mathematics, described as the retardation factor. If there is no specific distinction between the mechanisms that cause the delay of pollutant transport, the retardation factor is expressed as the ratio of the velocity of water flow to the velocity of pollutant transport. The calculation formula is given as [31]:
where Rd is the retardation factor, vgw is the velocity of water flow (cm d−1), vsp is the velocity of pollutant transport (cm d−1), l is the length of column (cm), and t0.5 is the time when the ratio of concentration in the outflow and inflow is 0.5.
As Cl− is not easily adsorbed by the medium, it can be approximated considered that the velocity of Cl− transport is equal to the velocity of water flow in the calculation.
3. Results and Discussion
3.1. Optimized Effect of DLLME
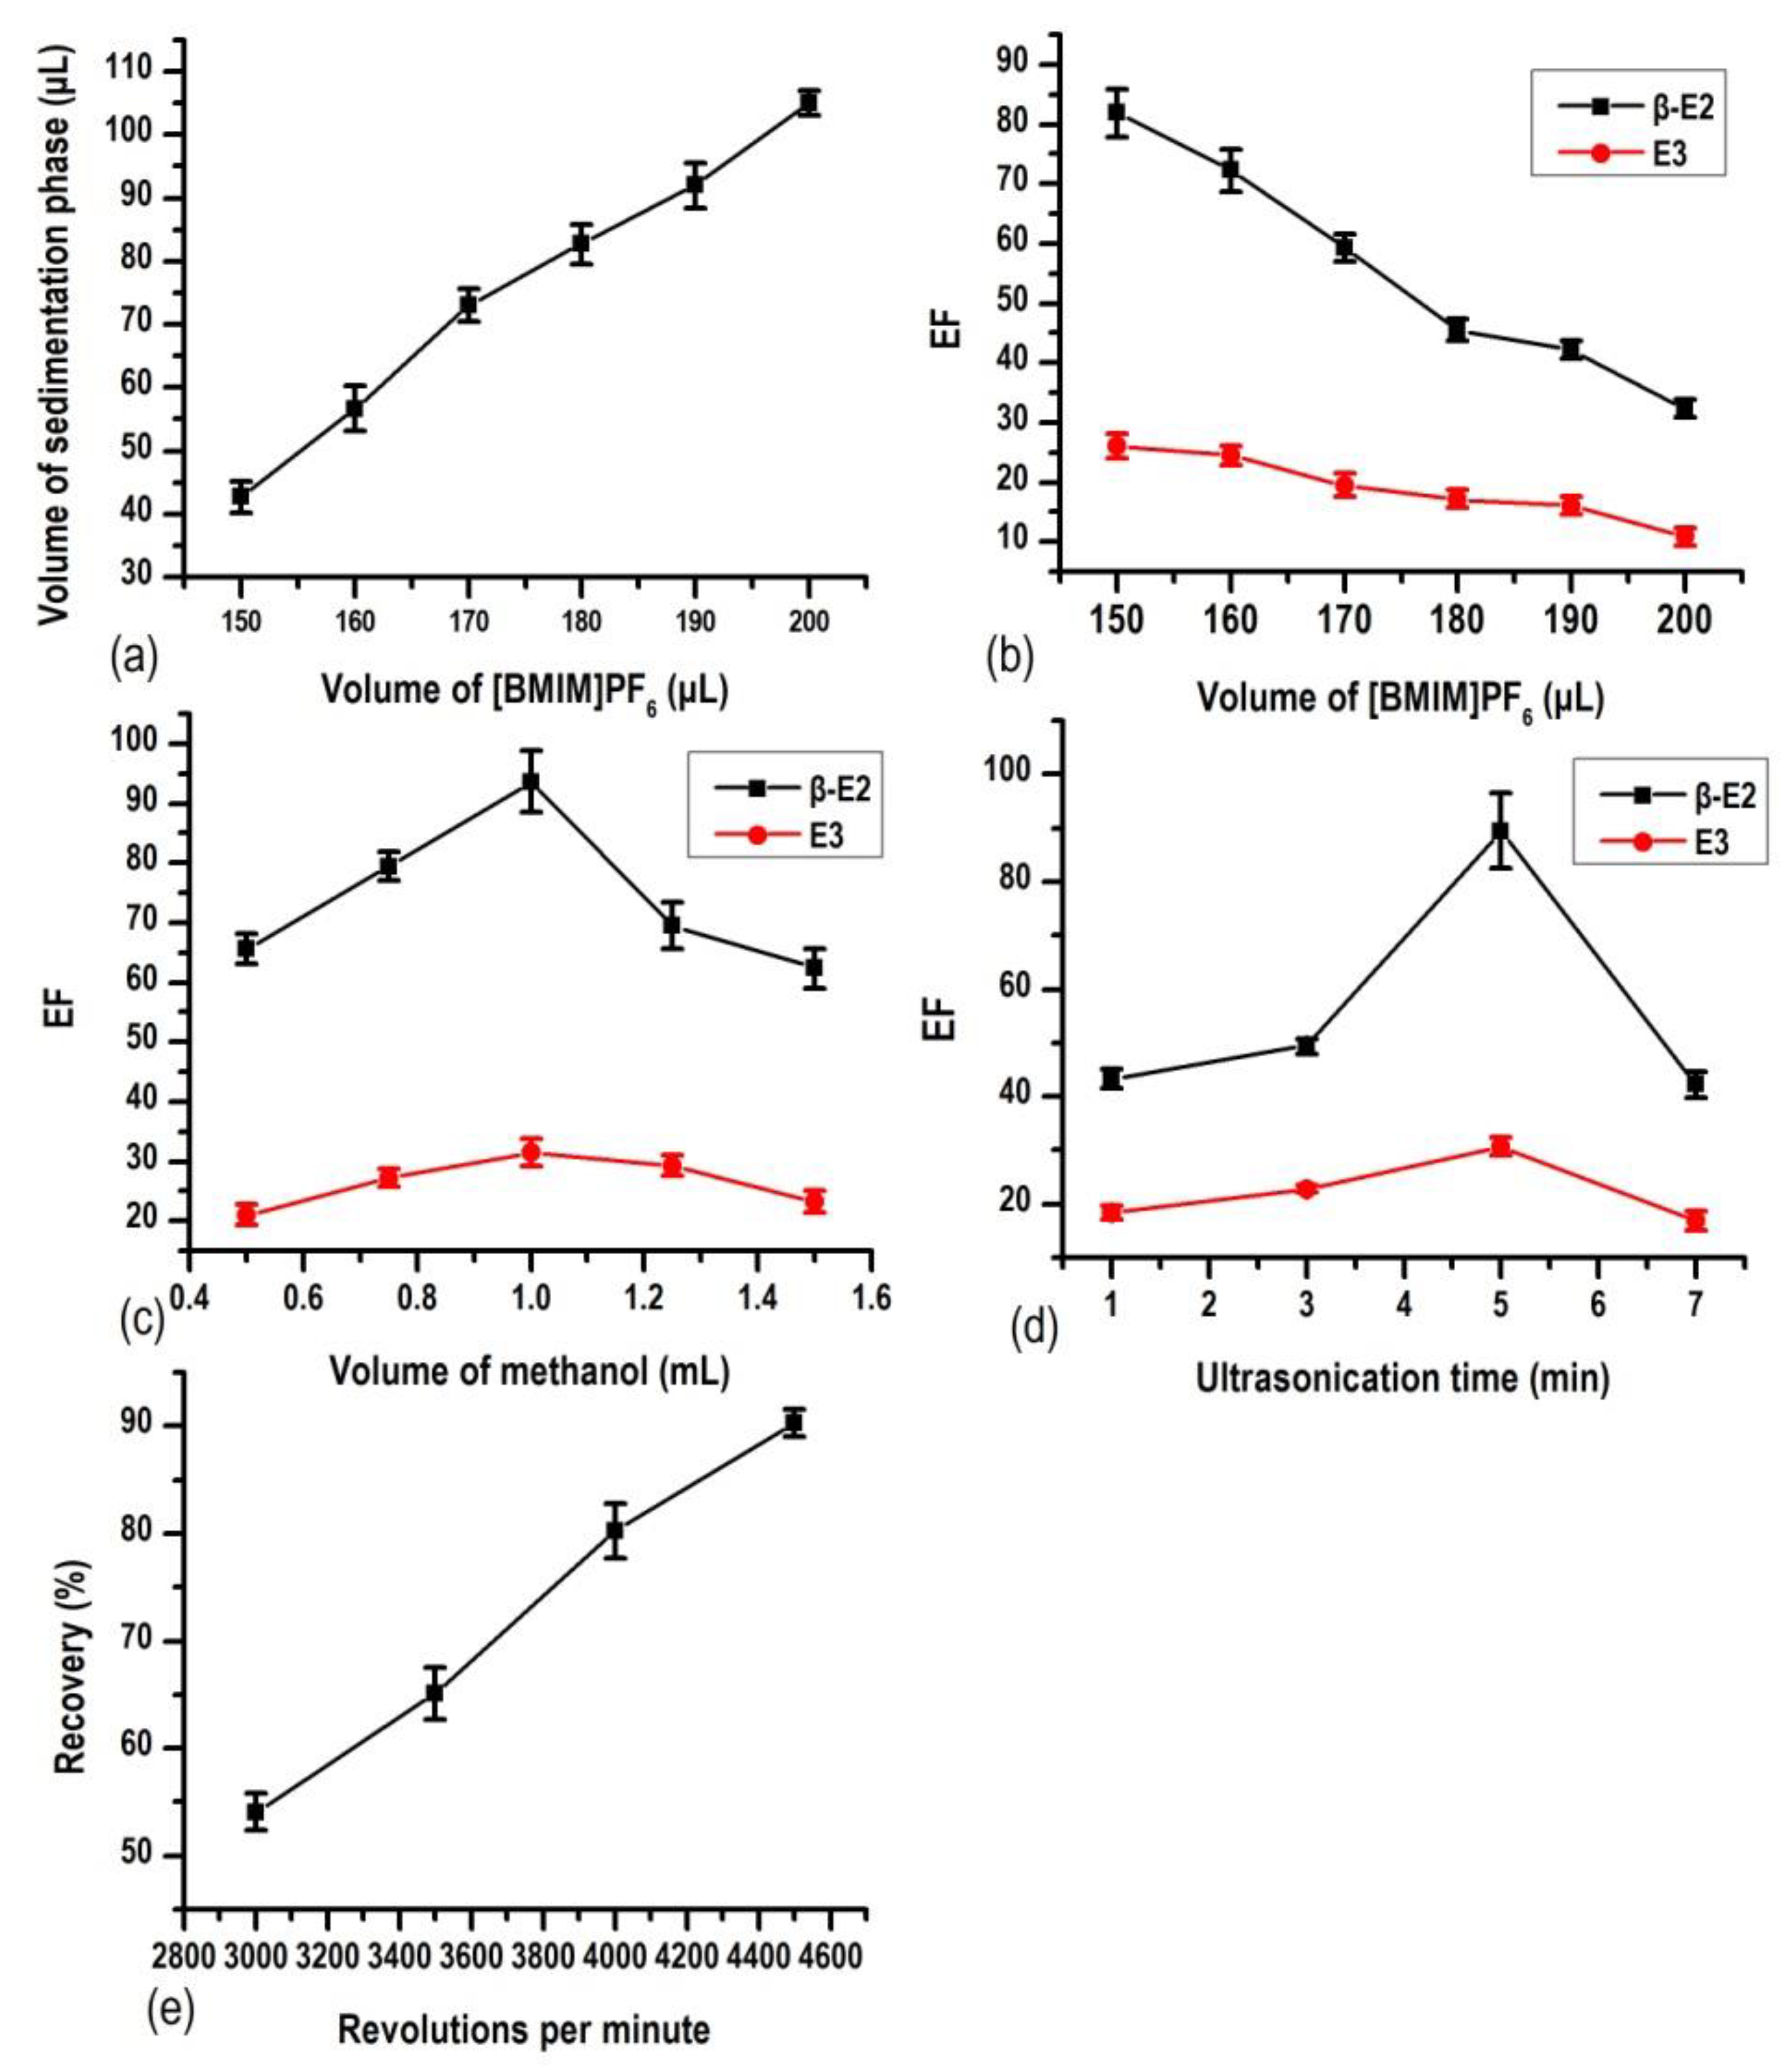
The comparison of DLLME’s detection effect under different conditions is shown in Figure 3. According to Figure 3b, EF decreases as the volume of [BMIM]PF6 increases from 150 μL to 200 μL. This is because the sedimentation phase volume increases when increasing the volume of [BMIM]PF6 (Figure 3a), leading to a decrease in Csed, and the decrease of the EF. Therefore, the lower the volume of the [BMIM]PF6, the higher the EF. However, the collection of the sedimentation phase was difficult when the volume was low. Therefore, 150 μL was selected as the extraction solvent volume for further analysis. Different methanol volumes containing the same volume of [BMIM]PF6 were used to investigate the effect of disperser solvent volume on the EF. As shown in Figure 3c, EF increases initially before decreasing when the methanol volume increases. When the methanol volume is 1.0 mL, EF is at its highest. A cloudy state in the centrifugal tube is not formed well at a low methanol volume, leading to poor extraction efficiency. In contrast, the solubility of estrogens in water increases at high methanol volumes, resulting in a decrease of the ER. In this study, 1.0 mL of methanol was selected as the optimum volume.
The effect of ultrasonication time on the EF is presented Figure 3d. EF increases initially before decreasing with time. When the ultrasonication time is 5 min, EF is at its highest. This is because a longer ultrasonication time can produce more heat, which may increase the volatilization of solvents or change the estrogens’ distribution balance in two phases. Consequently, EF can be lower. Hence, 5 min was selected as the optimum ultrasonication time. As glass cannot withstand high centrifugal rotational speeds as compared to plastic, the 100 μg L−1 water samples were centrifuged at different centrifugal rotational speeds by following the same enrichment procedures. As shown in Figure 3e, the recovery increases as the centrifugal rotational speed increases from 3000 rpm to 4500 rpm. When the rotational speed is 3000 rpm, the recovery is only 54.12%. This is because the extraction and water phases cannot fully separate at a low rotational speed. However, glass breakage occurred in the centrifugal tube when the rotational speed was faster than 4500 rpm. Therefore, 4500 rpm was selected as the optimum centrifugal rotational speed.
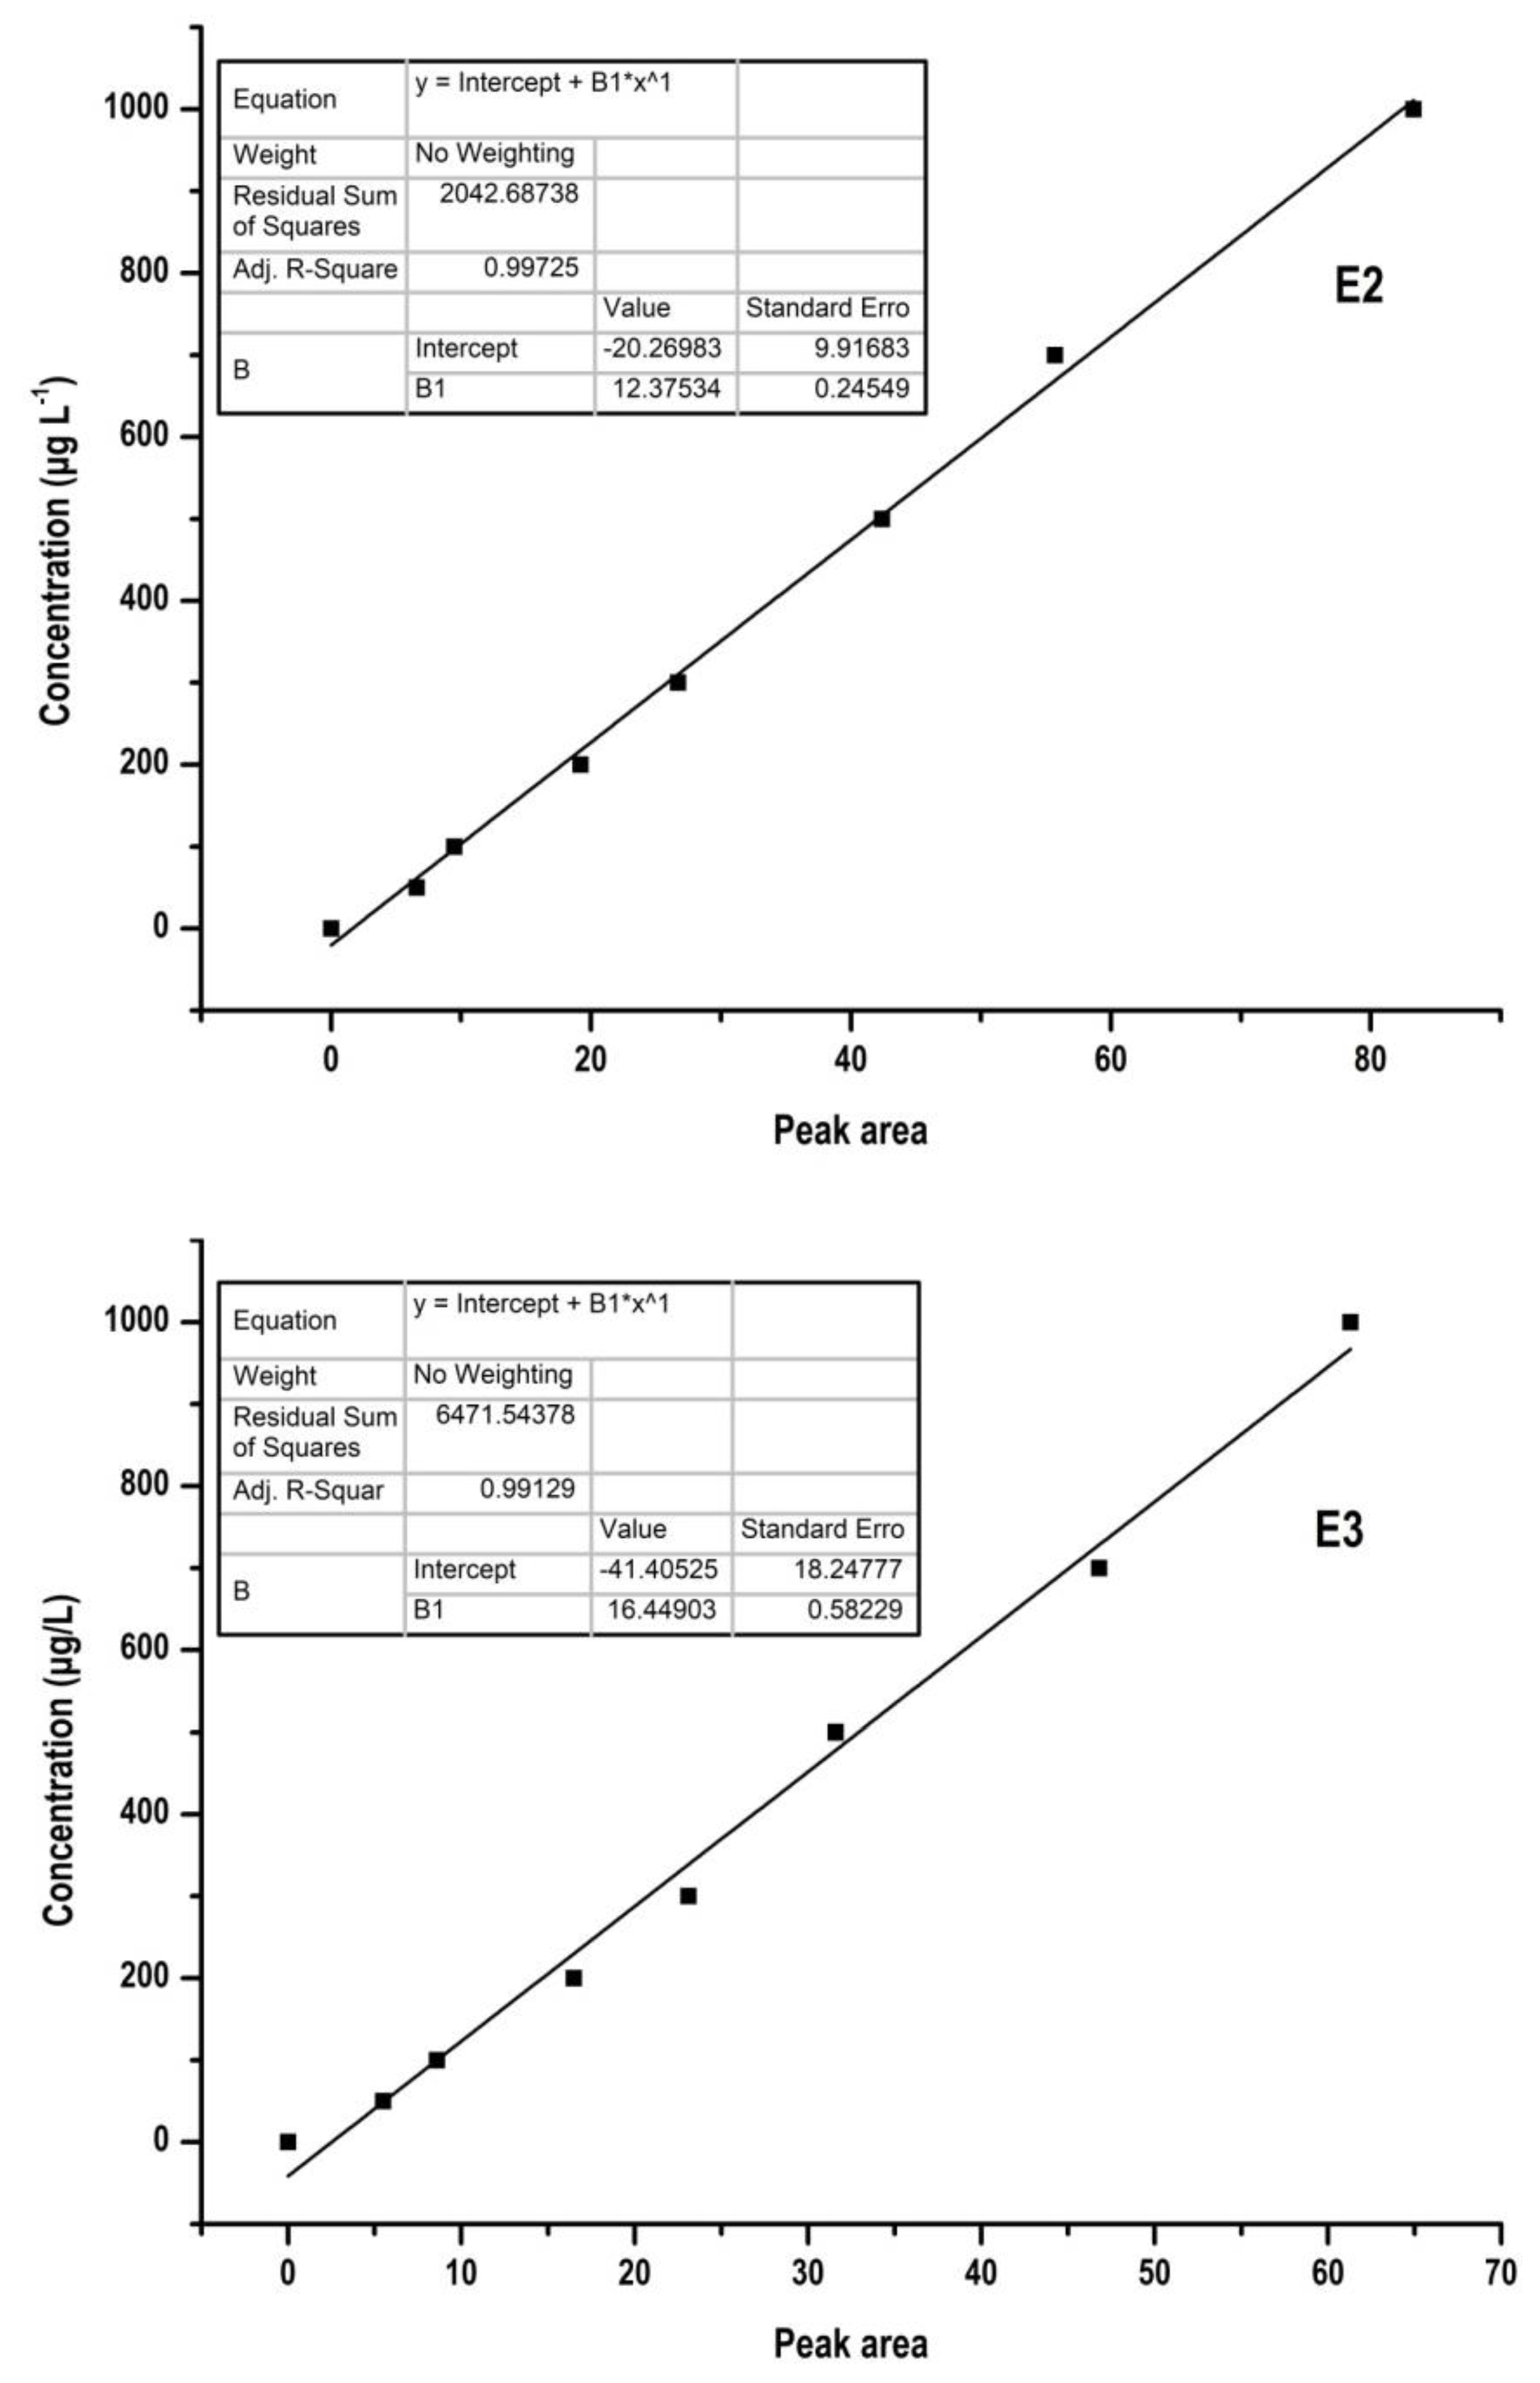
Overall, under the optimum experimental conditions, the standard curves of 17β-E2 and E3 in HPLC are shown in Figure 4. For the concentration range of 0–1000 μg L−1, the peak areas and analyte concentrations show a good linear relationship with a coefficient (R) greater than 0.991. The limits of detection (LOD) of HPLC-FLD for the two estrogens were 0.68–1.73 μg L−1 and the detection limits of DLLME-HPLC/FLD were 7.16–69.22 ng L−1. Compared with similar studies, the detection limit of this research was slightly higher, which may be caused by the different sensitivity of the detector [22,32].
3.2. Steroid Estrogens Concentration of Varied Water Sources in SAT Site
The typical water samples were taken from the secondary effluent of a sewage plant (two), fishpond (two), river (one), and groundwater (one) near and at the interested SAT site. The analysis results are shown in Table 3. The E3 content in the five samples is higher than that of 17β-E2. Thus, E2 is the primary metabolite of estrogen’s active substances and E3 is the final metabolite. However, the content in the groundwater sample is below the detection limit. This is due to the estrogens being adsorbed and degraded by the minerals and microorganisms in vadose zone soil during surface water infiltration [33]. This result further indicates that SAT has a certain natural advantage for estrogen remediation in this study area.
3.3. 17β-E2 Adsorption Isotherm Comparison in Solutions with and Without Cu
Figure 5 shows the 17β-E2 adsorption isotherms for sand in two solutions. The adsorption capacity of sand to 17β-E2 increased with the concentration of 17β-E2 in wastewater until the adsorption points on the surface of sand were saturated.
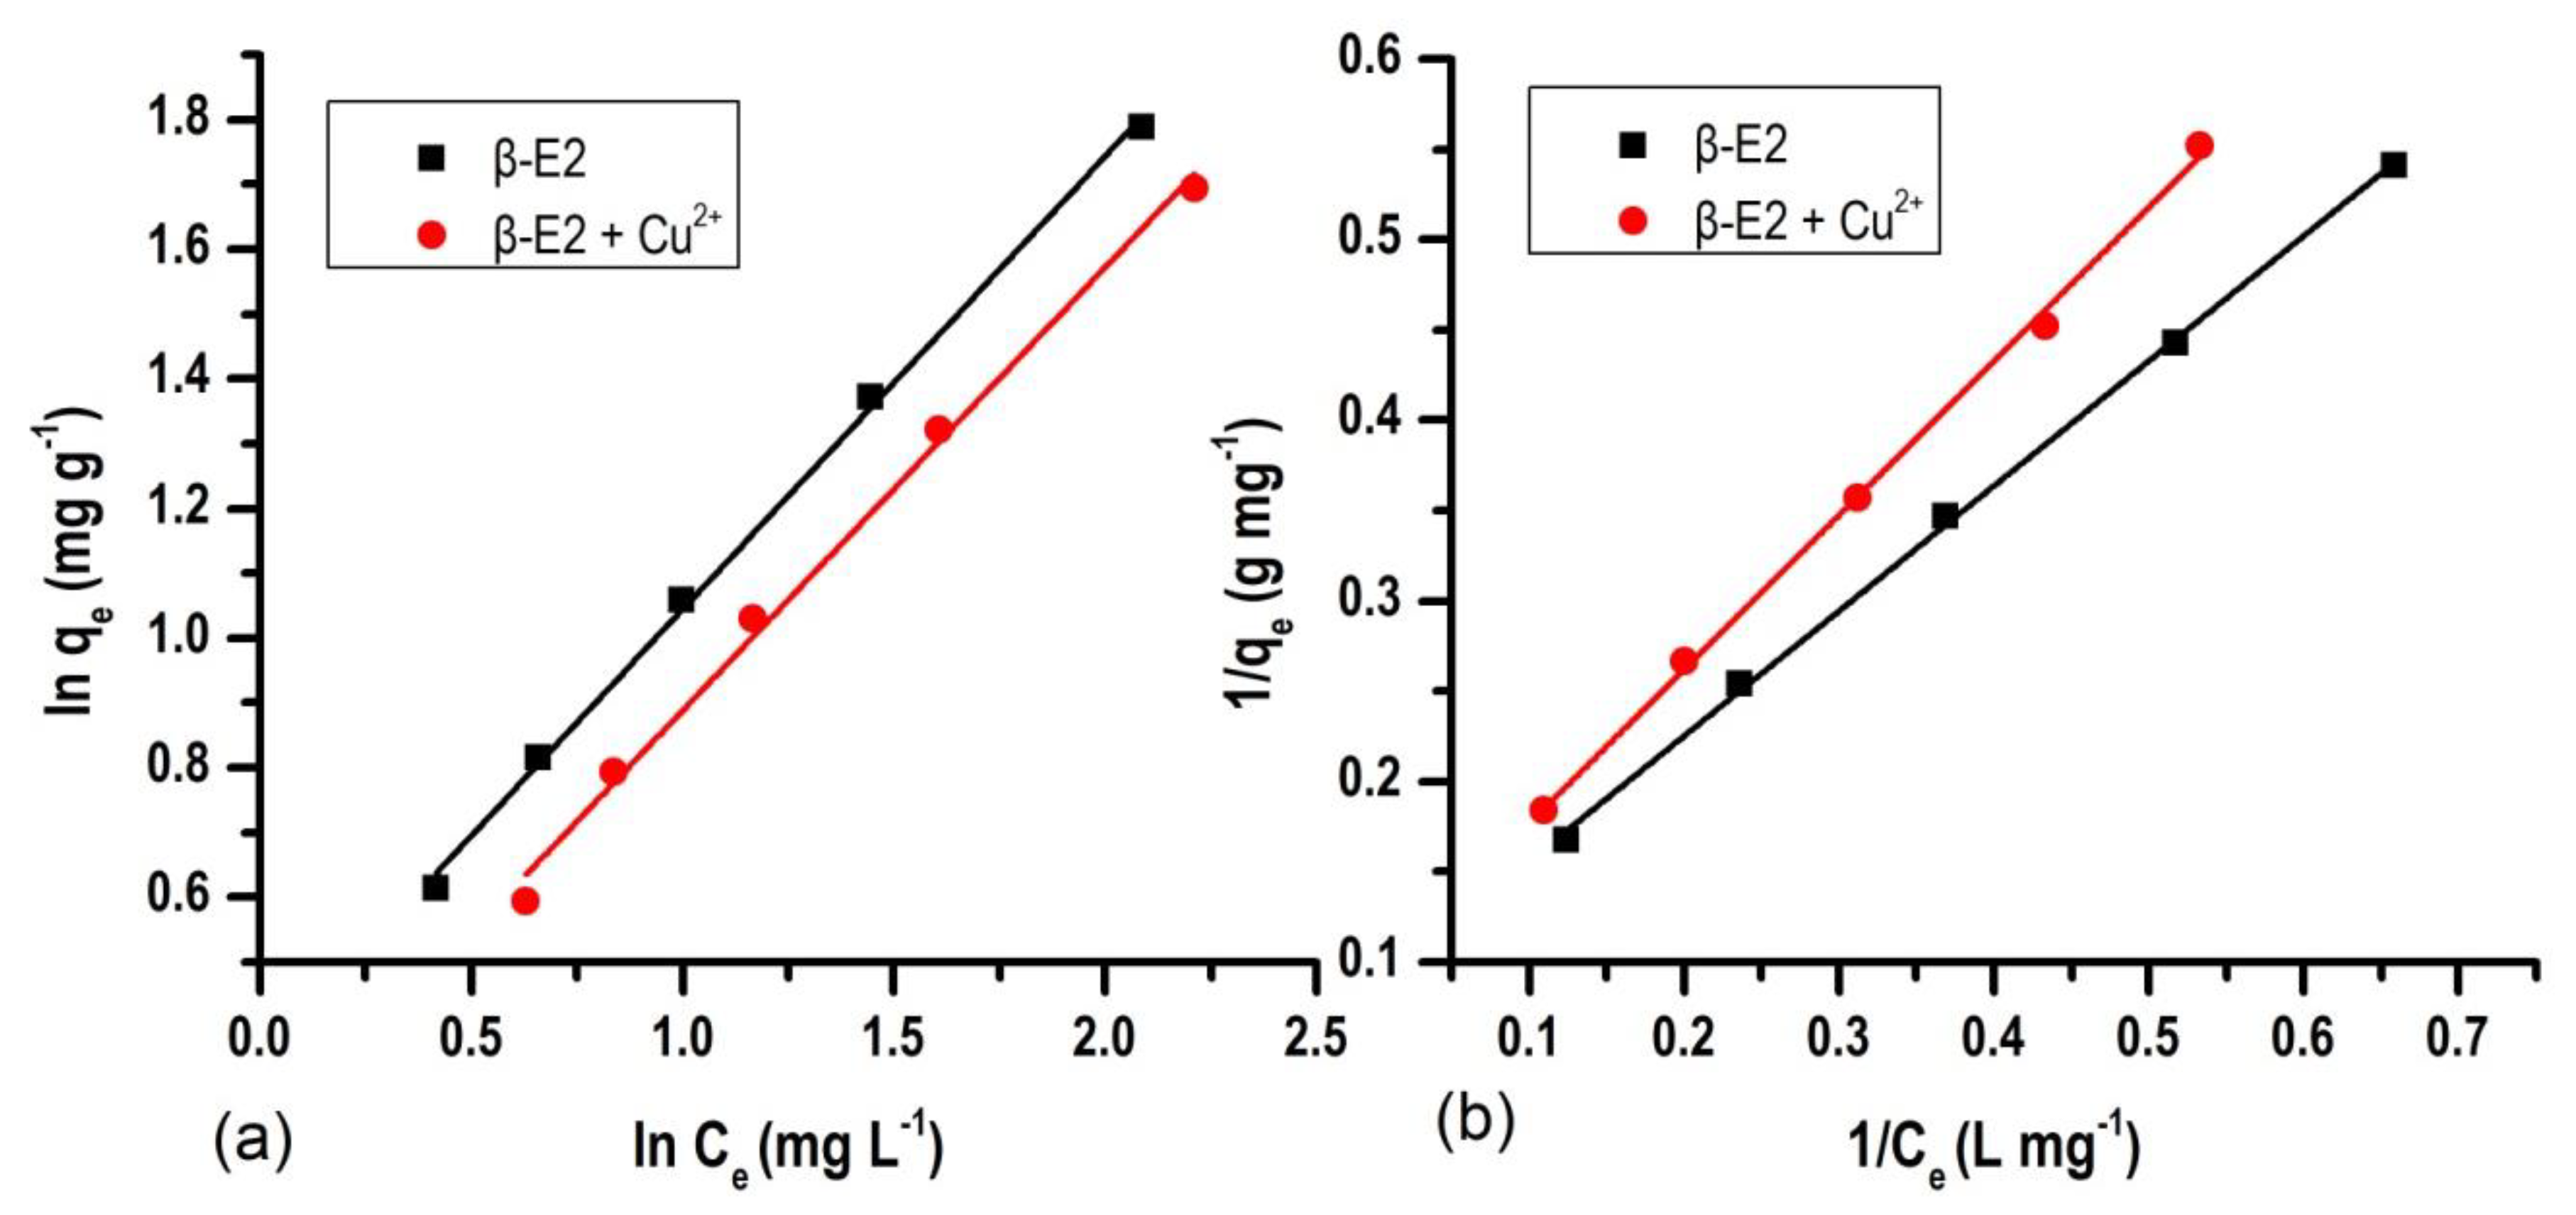
The Freundlich and Langmuir isotherm models were used to fit the adsorption isotherm data. Both models were well fitted to the experimental results (R2 > 0.99), so the isotherm adsorption characteristics of 17β-E2 on sand can be described by the parameters of the two models. In mixed solution, the KF and KL, representing the adsorption and binding force of sand to 17β-E2 was 1.2266 and 0.1072, respectively, which was lower than that in 17β-E2 solution (1.4130 and 0.1251). Calculated by the Langmuir equation, the 17β-E2 adsorption capacity of sand in 17β-E2 solution (11.543 mg g−1) was larger than that of sand in mixed solution (10.937 mg g−1), indicating that the competitive adsorption of 17β-E2 and Cu2+ in the mixed solution might occur on the surface of sand. Due to the strong cation hydration reactions, the heavy metal ions are likely to host one or more hydration shells of dense water in the meantime, which cover the surface of sand and directly compete with organic solutes for adsorption sites [34].
3.4. Co-Transport of 17β-E2 and Cu2+ in SAT
The breakthrough curves of 17β-E2 and Cu2+ in the SAT system were obtained by detecting the concentrations of two kinds of adsorbates in the effluent. As shown in Figure 6, the retardation of 17β-E2 and Cu2+ relative to the tracer can be observed clearly in both adsorption and desorption phases, as indicated by the shift of the breakthrough curves to the right [35]. The breakthrough of Cu2+ occurred at about 30 PV, earlier than that of 17β-E2 at 46 PV, which indicated that the adsorption capacity of sand for 17β-E2 was better than that of Cu2+. Compared with 17β-E2 and Cu(NO3)2 solution, the breakthrough curves of 17β-E2 and Cu2+ in the mixed solution shifted 2 PV and 5 PV to the left respectively, suggesting that the competitive adsorption of 17β-E2 and Cu2+ might occur on the surface of sand, which was consistent with the above results of isothermal adsorption. In the process of removal of 17β-E2 in wastewater by SAT, the existence of Cu2+ slightly inhibited the adsorption of 17β-E2 and accelerated the breakthrough of 17β-E2.
The retardation factors of 17β-E2 and Cu2+ under different conditions were calculated. The Rd of 17β-E2 in 17β-E2 and mixed solution was 14.71 and 14.24 respectively, which was greater than that of Cu2+ in two kinds of solutions (8.81 and 7.62). Compared with 17β-E2 and Cu(NO3)2 solution, the Rd of 17β-E2 and Cu2+ in the mixed solution was lower. This result indicates that the remediation effect of SAT system on pollutants is weakened when several pollutants coexist.
4. Conclusions
A new ultrasonication assisted dispersive liquid–liquid micro-extraction (DLLME) method combined with HPLC-FLD was developed in this study for the determination of the two natural steroid estrogens in water samples. Under the optimum experimental conditions, enrichment factors (EF) of 17β-Estradiol (17β-E2) and Estriol (E3) were 80–95 and 25–35, respectively. For the concentration range of 0–1000 μg L−1, the correlation coefficients (R) for the two estrogens were higher than 0.991 and the detection limits of HPLC-FLD and ILs-DLLME-HPLC/FLD were 0.68–1.73 μg L−1 and 7.16–69.22 ng L−1, respectively. The method was applied to real water samples and the relative recoveries (RRs) and relative standard deviations (RSDs, n = 5) were 86.03%–91.63% and 3.03%–4.27%, respectively.
The isothermal adsorption of 17β-E2 on sand and the breakthrough experiment of 17β-E2 and Cu2+ in the soil aquifer treatment (SAT) system indicated the effect of Cu2+ on the removal and transport of 17β-E2 in SAT. The isotherm adsorption characteristics of 17β-E2 on sand can be well described by the Langmuir and Freundlich isotherm models. The 17β-E2 adsorption capacity of sand in 17β-E2 solution was larger than that of sand in mixed solution, and compared with 17β-E2 and Cu(NO3)2 solution, the breakthrough curves of 17β-E2 and Cu2+ in the mixed solution shifted to the left, which both suggested that the competitive adsorption of 17β-E2 and Cu2+ in the mixed solution might occur on the surface of sand. In the process of removal of 17β-E2 in wastewater by SAT, the existence of Cu2+ slightly inhibited the adsorption of 17β-E2 and accelerated the breakthrough of 17β-E2. It can be seen that the complex components and environmental conditions generate higher requirements for the design and expected effect of SAT sites. All of the above studies are of guiding significance for the operation of SAT sites in the study area in the future.
Author Contributions
Conceptualization, Y.Y. and G.Z.; methodology, Y.C. and Y.L.; software, G.Z.; validation, W.L. and S.W.; formal analysis, G.Z.; investigation, Y.Y. and G.Z.; resources, Y.Y. and Y.L.; data curation, G.Z.; writing—original draft preparation, G.Z.; writing—review and editing, Y.L.; visualization, G.Z.; supervision, Y.Y.; project administration, G.Z. and Y.L.; funding acquisition, Y.Y. All authors have read and agreed to the published version of the manuscript.
Funding
This research was supported by the National Science Foundation of China (41472237), Liaoning Province Innovation Team (LT 2015017), and Shenyang Sci-Tech Program (F14-133-900, F15-113-900).
Conflicts of Interest
The authors declare there is no conflicts of interest regarding the publication of this paper.
References
- Zhang, G.; Yang, Y.; Lu, Y.; Zhang, X.; Wu, Y.; Chen, Y. Design of an enhanced SAT using the graphene-MAR mixture for the removal of 17β-E2 at a demonstration site of Qianjin farm in China. Environ. Sci. Pollut. Res 2018, 25, 28120–28128. [Google Scholar] [CrossRef]
- Steiner, L.D.; Bidwell, V.J.; Di, H.J.; Cameron, K.C.; Northcott, G.L. Transport and modeling of estrogenic hormones in a dairy farm effluent through undisturbed soil lysimeters. Environ. Sci. Technol. 2010, 44, 2341–2347. [Google Scholar]
- Caupos, E.; Mazellier, P.; Croue, J.P. Photodegradation of estrone enhanced by dissolved organic matter under simulated sunlight. Water Res. 2011, 45, 3341–3350. [Google Scholar] [CrossRef]
- Wagner, M.; Oehlmann, J. Endocrine disruptors in bottled mineral water: Total estrogenic burden and migration from plastic bottles. Environ. Sci. Pollut. Res. 2009, 16, 278–286. [Google Scholar] [CrossRef] [Green Version]
- Nie, M.; Yan, C.; Dong, W.; Liu, M.; Zhou, J.; Yang, Y. Dong Occurrence, distribution and risk assessment of estrogens in surface water, suspended particulate matter, and sediments of the Yangtze Estuary. Chemosphere 2015, 127, 109–116. [Google Scholar] [CrossRef]
- Lei, B.; Wen, Y.; Wang, X.; Zha, J.; Li, W.; Wang, Z.; Sun, Y.; Kang, J.; Wang, Y. Effects of estrone on the early life stages and expression of vitellogenin and estrogen receptor genes of Japanese medaka (Oryzias latipes). Chemosphere 2013, 93, 1104–1110. [Google Scholar] [CrossRef]
- Li, J.; Fu, J.; Xiang, X.; Wu, M.; Liu, X. Kinetics, equilibrium, and mechanisms of sorption and desorption of 17α-ethinyl estradiol in two natural soils and their organic fractions. Sci. Total Environ. 2013, 452, 404–410. [Google Scholar]
- Feng, X.; Ding, S.; Tu, J.; Wu, F.; Deng, N. Degradation of estrone in aqueous solution by Photo-Fenton system. Sci. Total Environ. 2005, 345, 229–237. [Google Scholar] [CrossRef]
- Chen, Y.; Wang, L.; Wu, F.; Deng, N.S. Photodegradation of 17α-Ethynylestradiol in Water by Fe (Ⅲ)/Oxalate System. Res. Environ. Sci. 2005, 18, 56–58. (In Chinese) [Google Scholar]
- Petrie, B.; McAdam, E.J.; Hassard, F.; Stephenson, T.; Lester, J.N.; Cartmell, E. Diagnostic investigation of steroid estrogen removal by activated sludge at varying solids retention time. Chemosphere 2014, 113, 101–108. [Google Scholar]
- Bai, X.; Casey, F.X.; Hakk, H.; DeSutter, T.M.; Oduor, P.G.; Khan, E. Sorption and degradation of 17β-estradiol-17-sulfate in sterilized soil–water systems. Chemosphere 2015, 119, 1322–1328. [Google Scholar] [CrossRef] [PubMed]
- Ghasemi, A.; Khansary, M.A.; Marjani, A.; Shirazian, S. Using quantum chemical modeling and calculations for evaluation of cellulose potential for estrogen micropollutants removal from water effluents. Chemosphere 2017, 178, 411–423. [Google Scholar] [CrossRef] [PubMed]
- Mansell, J.; Drewes, J.E. Fate of Steroidal Hormones During Soil-Aquifer Treatment. Groundw. Monit. Remediat. 2004, 24, 94–101. [Google Scholar] [CrossRef]
- Karnjanapiboonwong, A.; Morse, A.N.; Maul, J.D.; Anderson, T.A. Sorption of estrogens, triclosan, and caffeine in a sandy loam and a silt loam soil. J. Soils Sediments 2010, 10, 1300–1307. [Google Scholar] [CrossRef]
- Grover, D.P.; Zhou, J.L.; Frickers, P.E.; Readman, J.W. Improved removal of estrogenic and pharmaceutical compounds in sewage effluent by full scale granular activated carbon: Impact on receiving river water. J. Hazard. Mater. 2011, 185, 1005–1011. [Google Scholar] [CrossRef] [PubMed]
- Yin, Z.; Liu, Y.; Liu, S.; Jiang, L.; Tan, X.; Zeng, G.; Li, M.; Liu, S.; Tian, S.; Fang, Y. Activated magnetic biochar by one-step synthesis: Enhanced adsorption and coadsorption for 17β-estradiol and copper. Sci. Total Environ. 2018, 639, 1530–1542. [Google Scholar] [CrossRef] [PubMed]
- Su, W.; Wang, F.; Yan, S.; Wang, Z. Effect of heavy metal ions on environmental estrogens adsorption by biochar. Environ. Pollut. Control 2019, 41, 896–900. (In Chinese) [Google Scholar]
- Capriotti, A.L.; Cavaliere, C.; Colapicchioni, V.; Piovesana, S.; Samperi, R.; Laganà, A. Analytical strategies based on chromatography–mass spectrometry for the determination of estrogen-mimicking compounds in food. J. Chromatogr. A 2013, 1313, 62–77. [Google Scholar] [CrossRef]
- Kapelewska, J.; Kotowska, U.; Wiśniewska, K. Determination of personal care products and hormones in leachate and groundwater from Polish MSW landfills by ultrasound-assisted emulsification microextraction and GC-MS. Environ. Sci. Pollut. Res. 2016, 23, 1642–1652. [Google Scholar] [CrossRef] [Green Version]
- Pozo, O.J.; Van Eenoo, P.; Van Thuyne, W.; Deventer, K.; Delbeke, F.T. Direct quantification of steroid glucuronides in human urine by liquid chromatography–electrospray tandem mass spectrometry. J. Chromatogr. A 2008, 1183, 108–118. [Google Scholar] [CrossRef]
- Ding, J.; Gao, Q.; Li, X.S.; Huang, W.; Shi, Z.G.; Feng, Y.Q. Magnetic solid-phase extraction based on magnetic carbon nanotube for the determination of estrogens in milk. J. Sep. Sci. 2011, 34, 2498–2504. [Google Scholar] [CrossRef] [PubMed]
- Farajzadeh, M.A.; Mogaddam, M.R.A.; Aghdam, A.A. Comparison of air-agitated liquid–liquid microextraction technique and conventional dispersive liquid–liquid micro-extraction for determination of triazole pesticides in aqueous samples by gas chromatography with flame ionization detection. J. Chromatogr. A 2013, 1300, 70–78. [Google Scholar] [CrossRef] [PubMed]
- Martín, J.; Santos, J.L.; Aparicio, I.; Alonso, E. Determination of hormones, a plasticizer, preservatives, perfluoroalkylated compounds, and a flame retardant in water samples by ultrasound-assisted dispersive liquid–liquid microextraction based on the solidification of a floating organic drop. Talanta 2015, 143, 335–343. [Google Scholar] [CrossRef] [PubMed]
- Wang, Q.; Jiang, Z.; Sun, Z. Distribution and formation environment of Fe-Mn nodules in soil derived from Quaternary loess in north China. Acta Pedol. Sinica 2019, 56, 288–293. (In Chinese) [Google Scholar]
- Rykowska, I.; Ziemblińska, J.; Nowak, I. Modern approaches in dispersive liquid–liquid microextraction (DLLME) based on ionic liquids: A review. J. Mol. Liq. 2018, 259, 319–339. [Google Scholar] [CrossRef]
- Han, Y.; Jia, X.; Liu, X.; Duan, T.; Chen, H. DLLME combined with GC–MS for the determination of methylparaben, ethylparaben, propylparaben and butylparaben in beverage samples. Chromatographia 2010, 72, 351–355. [Google Scholar] [CrossRef]
- Almeida, C.; Fernandes, J.O.; Cunha, S.C. A novel dispersive liquid–liquid microextraction (DLLME) gas chromatography-mass spectrometry (GC–MS) method for the determination of eighteen biogenic amines in beer. Food Control 2012, 25, 380–388. [Google Scholar] [CrossRef]
- Andruch, V.; Burdel, M.; Kocúrová, L.; Šandrejová, J.; Balogh, I.S. Application of ultrasonic irradiation and vortex agitation in solvent microextraction. TrAC 2013, 49, 1–19. [Google Scholar] [CrossRef]
- Wei, N.; Zhao, X.E.; Zhu, S.; He, Y.; Zheng, L.; Chen, G.; You, J.; Liu, S.; Liu, Z. Determination of dopamine, serotonin, biosynthesis precursors and metabolites in rat brain microdialysates by ultrasonic-assisted in situ derivatization–dispersive liquid–liquid microextraction coupled with UHPLC-MS/MS. Talanta 2016, 161, 253–264. [Google Scholar] [CrossRef]
- Wang, H.; Liu, Y.G.; Zeng, G.M.; Hu, X.J.; Hu, X.; Li, T.T.; Li, H.Y.; Wang, Y.Q.; Jiang, L.H. Grafting of β-cyclodextrin to magnetic graphene oxide via ethylenediamine and application for Cr (VI) removal. Carbohydr. Polym. 2014, 113, 166–173. [Google Scholar] [CrossRef]
- Relyea, J.F. Theoretical and experimental considerations for the use of the column method for determining retardation factors. Radioact. Waste Manage. Nucl. Fuel Cycle 1982, 3, 151–166. [Google Scholar]
- Socas-Rodríguez, B.; Herrera-Herrera, A.V.; Asensio-Ramos, M.; Hernández-Borges, J. Recent applications of carbon nanotube sorbents in analytical chemistry. J. Chromatogr. A 2014, 1357, 110–146. [Google Scholar] [CrossRef] [PubMed]
- Lucas, S.D.; Jones, D.L. Biodegradation of estrone and 17 β-estradiol in grassland soils amended with animal wastes. Soil Biolog. Biochem 2006, 38, 2803–2815. [Google Scholar] [CrossRef]
- Chen, J.; Zhu, D.; Sun, C. Effect of heavy metals on the sorption of hydrophobic organic compounds to wood charcoal. Environ. Sci. Technol 2007, 41, 2536–2541. [Google Scholar] [CrossRef] [PubMed]
- Arye, G.; Dror, I.; Berkowitz, B. Fate and transport of carbamazepine in soil aquifer treatment (SAT) infiltration basin soils. Chemosphere 2011, 82, 244–252. [Google Scholar] [CrossRef]
Figure 1.
Dispersive liquid–liquid micro-extravtion (DLLME) operation schematic diagram.

Figure 2.
Soil aquifer treatment (SAT) soil column setup.

Figure 3.
Effect of 1-butyl-3-methylimidazolium hexafluorophosphate ([BMIM]PF6) volume on (a) sedimentation phase volume; and effect of (b) [BMIM]PF6 volume, (c) methanol volume, (d) and ultrasonication time on enrichment factor (EF) and effect of centrifugal rotational speed on recovery.
Figure 3.
Effect of 1-butyl-3-methylimidazolium hexafluorophosphate ([BMIM]PF6) volume on (a) sedimentation phase volume; and effect of (b) [BMIM]PF6 volume, (c) methanol volume, (d) and ultrasonication time on enrichment factor (EF) and effect of centrifugal rotational speed on recovery.

Figure 4.
Standard curve of (a) 17β-E2 and (b) E3 in HPLC.

Figure 5.
Isotherm plots for 17β-E2 adsorption by sand in different solutions (a) Freundlich fit and (b) Langmuir fit.
Figure 5.
Isotherm plots for 17β-E2 adsorption by sand in different solutions (a) Freundlich fit and (b) Langmuir fit.

Figure 6.
Breakthrough curves of (a) a tracer, (b) 17β-E2 and Cu2+ in mixed solution, (c) Cu2+ in Cu(NO3)2 and mixed solution, and (d) 17β-E2 in 17β-E2 and mixed solution.
Figure 6.
Breakthrough curves of (a) a tracer, (b) 17β-E2 and Cu2+ in mixed solution, (c) Cu2+ in Cu(NO3)2 and mixed solution, and (d) 17β-E2 in 17β-E2 and mixed solution.


Table 1.
Metal detection results of water samples in the study area.
| Metal | Maximal Allowed Amount a (µg L−1) | Concentration(µg L−1) | |||||
|---|---|---|---|---|---|---|---|
| QJJ01 | QJJ02 | QJJ03 | QJJ04 | QJJ05 | XQ | ||
| Al | 200 | 44.31 | 31.70 | 40.42 | 33.07 | ||
| Mn | 100 | 1852 | 2009 | 1662 | 2149 | 2202 | |
| Cu | 1000 | 4.98 | 3.02 | 2.45 | 2.12 | 2.66 | 5370 |
| Zn | 1000 | 61.18 | 46.85 | 76.52 | 39.80 | 41.13 | 4725 |
| Fe | 300 | 5027 | 7070 | 8898 | 4221 | 1894 | 5231 |
| Cr | 50 | 1.86 | 0.65 | 2.68 | 1.83 | 3.06 | 628.3 |
| Cd | 5 | 0.03 | 0.04 | 0.02 | 0.01 | 0.01 | 18.17 |
| Mo | 70 | 6.33 | 7.14 | 2.44 | 1.24 | 2.17 | |
| Ni | 20 | 4.50 | 4.58 | 4.06 | 4.15 | 4.25 | 210.5 |
| Pb | 10 | 0.90 | 0.50 | 0.53 | 0.32 | 0.24 | 90.21 |
a Standards for drinking water quality (GB 5479-2006).
Table 2.
Physical and chemical characteristics of soil in soil aquifer treatment (SAT) columns.
| Parameter | Units | Average Value |
|---|---|---|
| Structure | Medium sand | |
| Hydraulic conductivity | m d−1 | 7.543 |
| Porosity | 0.44 | |
| Dry density | g cm−3 | 1.77 |
| pH | 7.07 | |
| 17β-Estradiol concentration | mg L−1 | 0 |
| Cu2+ concentration | mg L−1 | 0 |
| Median diameter | mm | 0.409 |
| Average diameter | mm | 0.479 |
| Specific surface area | m2 g−1 | 0.003 |
Table 3.
Analytical results of natural steroid estrogens in different real water samples (n = 5).
| Water Sample | Object | Original (μg L−1) | Spiked (μg L−1) | Detected (μg L−1) | RR (%) | RSD (%) |
|---|---|---|---|---|---|---|
| SPSE I | 17β-E2 | 1.02 | 200.00 | 182.19 | 90.59 | 4.19 |
| E3 | 9.32 | 200.00 | 181.39 | 86.04 | 3.57 | |
| SPSE II | 17β-E2 | 3.99 | 200.00 | 181.46 | 88.73 | 3.14 |
| E3 | 12.81 | 200.00 | 184.86 | 86.03 | 3.25 | |
| Fishpond I | 17β-E2 | 0.02 | 200.00 | 182.71 | 91.34 | 3.85 |
| E3 | 0.15 | 200.00 | 182.83 | 91.34 | 3.56 | |
| Fishpond II | 17β-E2 | 0.03 | 200.00 | 182.96 | 91.46 | 3.94 |
| E3 | 0.12 | 200.00 | 183.08 | 91.48 | 3.97 | |
| River | 17β-E2 | 0.01 | 200.00 | 183.21 | 91.60 | 3.08 |
| E3 | 0.07 | 200.00 | 183.34 | 91.63 | 4.27 | |
| Groundwater | 17β-E2 | ND a | 200.00 | 181.11 | 90.55 | 3.03 |
| E3 | ND | 200.00 | 182.57 | 91.29 | 4.20 |
a ND: not detected.
© 2020 by the authors. Licensee MDPI, Basel, Switzerland. This article is an open access article distributed under the terms and conditions of the Creative Commons Attribution (CC BY) license (http://creativecommons.org/licenses/by/4.0/).
Share and Cite
MDPI and ACS Style
Zhang, G.; Yang, Y.; Lu, Y.; Chen, Y.; Li, W.; Wang, S. Effect of Heavy Metal Ions on Steroid Estrogen Removal and Transport in SAT Using DLLME as a Detection Method of Steroid Estrogen. Water 2020, 12, 589. https://doi.org/10.3390/w12020589
AMA Style
Zhang G, Yang Y, Lu Y, Chen Y, Li W, Wang S. Effect of Heavy Metal Ions on Steroid Estrogen Removal and Transport in SAT Using DLLME as a Detection Method of Steroid Estrogen. Water. 2020; 12(2):589. https://doi.org/10.3390/w12020589
Chicago/Turabian StyleZhang, Ge, Yuesuo Yang, Ying Lu, Yu Chen, Wenbo Li, and Siyuan Wang. 2020. "Effect of Heavy Metal Ions on Steroid Estrogen Removal and Transport in SAT Using DLLME as a Detection Method of Steroid Estrogen" Water 12, no. 2: 589. https://doi.org/10.3390/w12020589
Note that from the first issue of 2016, this journal uses article numbers instead of page numbers. See further details here.