Article

Improving the Reliability of Probabilistic Multi-Step-Ahead Flood Forecasting by Fusing Unscented Kalman Filter with Recurrent Neural Network

1
State Key Laboratory of Water Resources and Hydropower Engineering Science, Wuhan University, Wuhan 430072, China
2
Department of Geosciences, University of Oslo, P.O. Box 1047 Blindern, N-0316 Oslo, Norway
3
Department of Bioenvironmental Systems Engineering, National Taiwan University, Taipei 10617, Taiwan
*
Authors to whom correspondence should be addressed.
Water 2020, 12(2), 578; https://doi.org/10.3390/w12020578
Submission received: 7 January 2020 / Revised: 13 February 2020 / Accepted: 17 February 2020 / Published: 20 February 2020
(This article belongs to the Special Issue Advances in Hydrologic Forecasts and Water Resources Management )

Abstract

:
It is fundamentally challenging to quantify the uncertainty of data-driven flood forecasting. This study introduces a general framework for probabilistic flood forecasting conditional on point forecasts. We adopt an unscented Kalman filter (UKF) post-processing technique to model the point forecasts made by a recurrent neural network and their corresponding observations. The methodology is tested by using a long-term 6-h timescale inflow series of the Three Gorges Reservoir in China. The main merits of the proposed approach lie in: first, overcoming the under-prediction phenomena in data-driven flood forecasting; second, alleviating the uncertainty encountered in data-driven flood forecasting. Two commonly used artificial neural networks, a recurrent and a static neural network, were used to make the point forecasts. Then the UKF approach driven by the point forecasts demonstrated its competency in increasing the reliability of probabilistic flood forecasts significantly, where predictive distributions encountered in multi-step-ahead flood forecasts were effectively reduced to small ranges. The results demonstrated that the UKF plus recurrent neural network approach could suitably extract the complex non-linear dependence structure between the model’s outputs and observed inflows and overcome the systematic error so that model reliability as well as forecast accuracy for future horizons could be significantly improved.

1. Introduction

Reliable and accurate flood forecasting is one of the most important tasks of operational hydrology, while it is also very challenge due to the inordinately non-linear hydro-geological features and dynamic nature of climate conditions. High uncertainty encountered in the occurrence and magnitudes of future flood event stimulates the demands for probabilistic flood forecasting. The goal of probabilistic forecasting is to provide information about the uncertainty of the forecast [1]. Most hydrological forecast models produce deterministic forecasts, which provide the best point-value estimates rather than quantify the predictive uncertainty [2]. Nevertheless, when a deterministic forecast turns out to be far from what has taken place, the consequences will probably be worse than a situation where no forecast is available [3]. Probabilistic hydro-meteorological forecasts have been used frequently to communicate forecast uncertainty over the last few decades [4,5,6]. The transformation from a deterministic approach to a probabilistic approach is a development trend of flood forecasting around the world [6,7]. The optimal mega-reservoir operation for live-saving and resources utilization creates outreach demands for probabilistic flood forecasting; consequently, scientific research should focus on quantifying and mitigating the uncertainty of probabilistic flood forecasts [8,9]. The reliability of hydrologic forecasts can be affected by input uncertainty, meteorological uncertainty, and hydrologic uncertainty of model structure and parameters. One of the primary techniques to reflect different uncertainties in hydrologic forecasts is to create a probabilistic forecast [10,11]. Probabilistic forecasts can be made using three approaches: a probabilistic pre-processing approach plus a deterministic forecast model; a probabilistic forecast model; and a deterministic forecast model plus a probabilistic post-processing approach [12,13,14]. The first two approaches quantify uncertainties in inputs and model structure while the third quantifies the overall uncertainty in model structure and parameters. Our study would concentrate on improving hydrologic forecasts using deterministic models plus probabilistic post-processing technique.
Probabilistic post-processing techniques are commonly introduced to complement point-value estimations offered by the deterministic forecast model [15,16]. The Kalman filter (KF) proposed by Kalman [5] provides a theoretical post-processing framework based on model point estimation for reducing forecast uncertainty through recursively calculating a statistically optimal estimate of the prediction. The KF post-processing is a component of the probabilistic post-processing techniques, and is a recursive state estimator for a process that is assumed to be affected by stochastic interference and by stochastic noise [5]. The KF family consists of the linear KF (LKF) and non-linear KF (NKF) [17]. The LKF approach can only identify the linear error estimation whereas the NKF approach can quantify the non-linear error estimation. As is known, the NKF is widely used for extracting non-linear dependence of forecast errors and conquering the white noise with systematic over/under-predicting characteristics [17]. Furthermore, the extended KF (EKF) and the unscented KF (UKF) [17] are two common usages of NKF. Most importantly, the UKF approach has not yet been employed to lessen the uncertainty of multi-step-ahead flood forecasting driven by a recurrent neural network (RNN) according to a review of literature [18,19,20,21]. Despite there are several researches associated with the combination of UKF/EKF and hydrological models [22,23,24] on hydrological domain, all of them concentrate on quantifying the uncertainty of hydrological forecast driven by static (i.e., non-recurrent) artificial neural networks (ANNs), e.g., feed-forward neural network and local linear models as well as the hydraulic model. Bearing this in mind as motivation, for the first time, the UKF is introduced to quantify the uncertainty of multi-step-ahead flood forecasts driven by the RNN (i.e., RNN is more complicated than the static ANNs). Therefore, it is interesting to explore UKF for modeling and lowering the uncertainty appeared in RNN-driven flood forecasts.
Machine-learning techniques have developed fast during the last few decades, and they have been adopted as data-driven methods to model hydrological systems [11,25,26]. For instance, the back-propagation neural network (BPNN), the radial basis function (RBF), the support vector machine, the quantile regression neural network (QRNN), the recurrent neural network (RNN), the long-short term memory (LSTM) and the non-linear auto-regressive with exogenous inputs neural network (NARX) have been widely applied to modeling hydrologic and meteorological time series [27,28,29,30,31,32,33,34,35,36,37,38]. A number of recent studies indicate that ensemble artificial neural network can improve the probabilistic forecast skill for hydrological events [39,40,41]. The main advantage of ANN is owing to its ability to discern linear or non-linear relationships even with very limited data inputs and being able to recognize even complex patterns in a data set without a priori understating of the underlying mechanism. The major drawbacks, on the other hand, are that they are prone to under-predict flood series for extreme flood events. Therefore, it is essential to conduct in-depth research on machine-learning models for enhancing model accuracy and reliability through converting deterministic flood forecasts into probabilistic ones using a stochastic post-processing technique.
This study proposes a probabilistic forecasting approach to reduce the prediction intervals of multi-step-ahead flood forecasts, which consists of two parts: the deterministic forecast model and the probabilistic post-processing technique. First, the recurrent neural network (NARX) is introduced to make multi-step-ahead point forecasts. Then, the UKF technique driven by point forecasts is employed to create the prediction intervals of flood forecasts. We concentrate on hydrological uncertainty only (i.e., the uncertainty resulting from imperfect rainfall-runoff modeling), considering “perfect” rainfall as inputs. A static BPNN and a recurrent NARX are used to construct flood forecast models, and the model that produces more accurate point estimations will be employed to carry out probabilistic forecasting. The UKF approach is implemented separately to transform point flood forecasts into probabilistic flood forecasts. The rainfall and inflow datasets of the Three Gorges Reservoir (TGR) in China are used to demonstrate the reliability and applicability of the approach.

2. Methods

Figure 1 illustrates the probabilistic forecast architecture that separately integrates the NARX (Figure 1a) with the UKF approach (Figure 1b). The related methods are briefly described below.

2.1. Deterministic Flood Forecast Models Based on Artificial Neural Network (ANN)

The NARX is a recurrent neural network suitable for time-series prediction [42,43]. This study uses it to carry out deterministic flood forecasting because its recurrent mechanism can effectively integrate rainfall and discharge data with the latest outputs of the model to alleviate the time shift phenomenon and improve model reliability. The NARX network produces recurrent connections from the outputs, which could delay several unit times to produce new inputs (Figure 1a). This nonlinear system for M-step-ahead forecasting (M ≥ 1) can be described mathematically below:
y ^ ( t + M ) = f ( y ^ ( t + M 1 ) , , y ^ ( t + M q ) , y ( t ) , r ( t ) , , r ( t p ) )
where R ( t ) = [ y ( t ) , r ( t ) , , r ( t p ) ] and y ^ ( t + M ) denote the input vector and the output value at the time step t and t + M, respectively. f ( · ) is the nonlinear function. p and q are the input-memory and output memory orders. Two inputs: y ^ ( t + M i ) (i = 1, 2, …, q) serves as an autoregressive variable (e.g., forecasted runoff), R ( t ) , serves as an implicit exogenous variable (e.g., observed rainfall and runoff) in a time series.
The BPNN, a static neural network, is implemented for comparison purposes. Both BPNN and NARX have the same model architecture of one input layer, one hidden layer and one output layer. The NARX model is a dynamic ANN model with the recurrent mechanism whereas the BPNN is a non-recurrent ANN model. The mathematical equation of the BPNN model is described as follows:
y ^ ( t + M ) = f ( y ( t ) , r ( t ) , , r ( t p ) )
In this study, the Levenberg–Marquardt back-propagation algorithm is used to train both ANN models [44]. The transfer functions of hidden and output layers are of a sigmoid type and a linear type, respectively, owing to their practicability and good performance in flood forecasting [45].
The parameters of both models consist of: the maximal epoch = 1000, the initial learning rate (mu) = 0.001, the increasing factor of mu = 10, the decreasing factor of mu = 0.1 and the maximal value of mu = 1000 respectively. Besides, the two ANN models are configured to have one hidden layer with 8–10 nodes in the perspective of different forecast horizons. The value of output memory q is set as one whereas the value of input memory p should be determined by using correlation analysis methods (presented in the section of study area and materials).

2.2. Probabilistic Forecasting Based on the Unscented Kalman Filter (UKF)

The UKF is an optimal recursive data processing algorithm and can be introduced to find the optimal estimation error for each state in multi-step-ahead flood forecasts [17]. The unscented Kalman filter is applied to model a nonlinear flood forecasting system and described as below:
x ( t + 1 ) = g ( x ( t ) , u ( t ) , v ( t ) , t )
z ( t ) = h ( x ( t ) , u ( t ) , t ) + w ( t )
where x ( t ) is the n-dimensional state of the flood forecasting system at time-step t, u ( t ) is the input vector at time-step t, v ( t ) is the k-dimensional state noise process vector owing to disturbances and model errors, z ( t ) and w ( t ) are the observation vector and noise, g ( · ) and h ( · ) are the distributions of forecasted and observed datasets, both are assumed following Gaussian distribution.
The implementation procedures for the UKF (Figure 1b) contain the following four steps [17].
Step 1: Computation of set of sigma points and assignment of weights to all sigma points. The n-dimensional random variable x with mean x ¯ and covariance P x x is transformed to 2n + 1 weighted points described below:
χ 0 = x ¯ ,   W 0 = λ / ( n + λ )
χ i = x ¯ + ( n + 1 ) P x x ,   W i = 1 / 2 ( n + λ )
χ i + n = x ¯ ( n + 1 ) P x x ,   W i + n = 1 / 2 ( n + λ )
where χ 0 , χ i and χ i + n are the 2n + 1 sigma points, W 0 , W i and W i + n are the 2n + 1 weight coefficients, λ is the spreading parameter.
Step 2: Transformation of the points through non-linear function. The transformed set is produced by using a nonlinear function and the predicted mean and covariance are described below:
χ i ( t + 1 | t ) = g ( χ i n + k ( t | t ) , u ( t ) , t )
x ^ ( t + 1 | t ) = i = 0 2 ( n + k ) W i · χ i n + k ( t + 1 | t )
P ( t + 1 | t ) = i = 0 2 ( n + k ) W i · [ χ i ( t + 1 | t ) x ^ ( t + 1 | t ) ] · [ χ i ( t + 1 | t ) x ^ ( t + 1 | t ) ] T
where χ i ( t + 1 | t ) is the transformed set. x ^ ( t + 1 | t ) and P ( t + 1 | t ) are the predicted mean and covariance of the transformed set.
Step 3: Computation of Gaussian function from weighted and transformed points.
Z i ( t + 1 | t ) = h ( χ i ( t + 1 | t ) , u ( t ) , t )
where Z i ( t + 1 | t ) is the observed dataset computed by using the transformed point.
Step 4: Probabilistic forecasts. A Monte Carlo simulation is conducted to create probabilistic forecasts. A realization of observation h m at the horizon m can be simulated according to the Gaussian function (Equation (7)) and the Monte Carlo simulation would be repeated for K times. K is the number of Monte Carlo samples and set as 1000 in this study; 90% confidence intervals are employed to reveal the uncertainty of probabilistic flood forecasts. Then, both observed and forecasted datasets are transformed into the real space for evaluating the performance of UKF probabilistic forecasts.

2.3. Evaluation Indicators

To evaluate the deterministic forecast accuracy and predictability of flood peak and flood volume, the mean absolute error (MAE), the peak percent threshold statistics (PPTS) [46] and the Nash–Sutcliffe efficiency (NSE) coefficient [47] were introduced accordingly. Their mathematical expressions are described below:
MAE = 1 N t = 1 N | Z ^ ( t ) Z ( t ) | ,   MAE 0
PPTS ( l , u ) = 1 ( k l k u + 1 ) t = 1 N ( | Z ^ ( t ) Z ( t ) Z ( t ) | ) ,   PPTS 0
NSE = 1 t = 1 N ( Z ^ ( t ) Z ( t ) ) 2 t = 1 N ( Z ( t ) Z ¯ ( t ) ) 2 ,   NSE 1
where k l = l × N 100 and k u = u × N 100 . N is the number of observed data while l and u are the lower and higher limits in percentage, respectively. For instance, PPTS(l, 10%) denotes the flood percentage threshold statistic of larger than 10% data whereas PPTS(90%, u) denotes the flood percentage threshold statistic of smaller than 90% data. Z ^ ( t ) , Z ( t ) and Z ¯ ( t ) are the forecasted data (i.e., model output), observed data and the average of observed data at the t time, respectively.
The containing ratio (CR), the average relative bandwidth (RB) and the continuous ranked probability score (CRPS) were used for assessing the performance of probabilistic forecasts [48,49]. Their mathematical formulas are described below.
N ( t ) = { 1 , if ( q l ( t ) Z ^ ( t ) q u ( t ) ) 0 ,     else
CR = t = 1 N N ( t ) N × 100 %
RB = 1 N t = 1 N ( q u ( t ) q l ( t ) Z ( t ) )
CRPS = + [ F f ( x ) F o ( x ) ] 2 dx
where q l ( t ) and q u ( t ) are the lower and upper limitation of the forecasted value at the t time, F f ( x ) and F o ( x ) are the cumulative distribution functions (CDF) of the forecast and observation distributions, respectively, x is the variable of the CDF.
From the standpoint of model performance, the indicators of MAE, PPTS and NSE are employed to evaluate the accuracy of deterministic flood forecasts while the indicators of CR, RB and CRPS are employed to evaluate the correctness and sharpness of probabilistic flood forecasts. The general implementation programming of the NARX and UKF can be downloaded from the Statistics and Machine Learning Toolbox of the Matlab software (website: https://ww2.mathworks.cn/products/statistics.html#machine-learning).

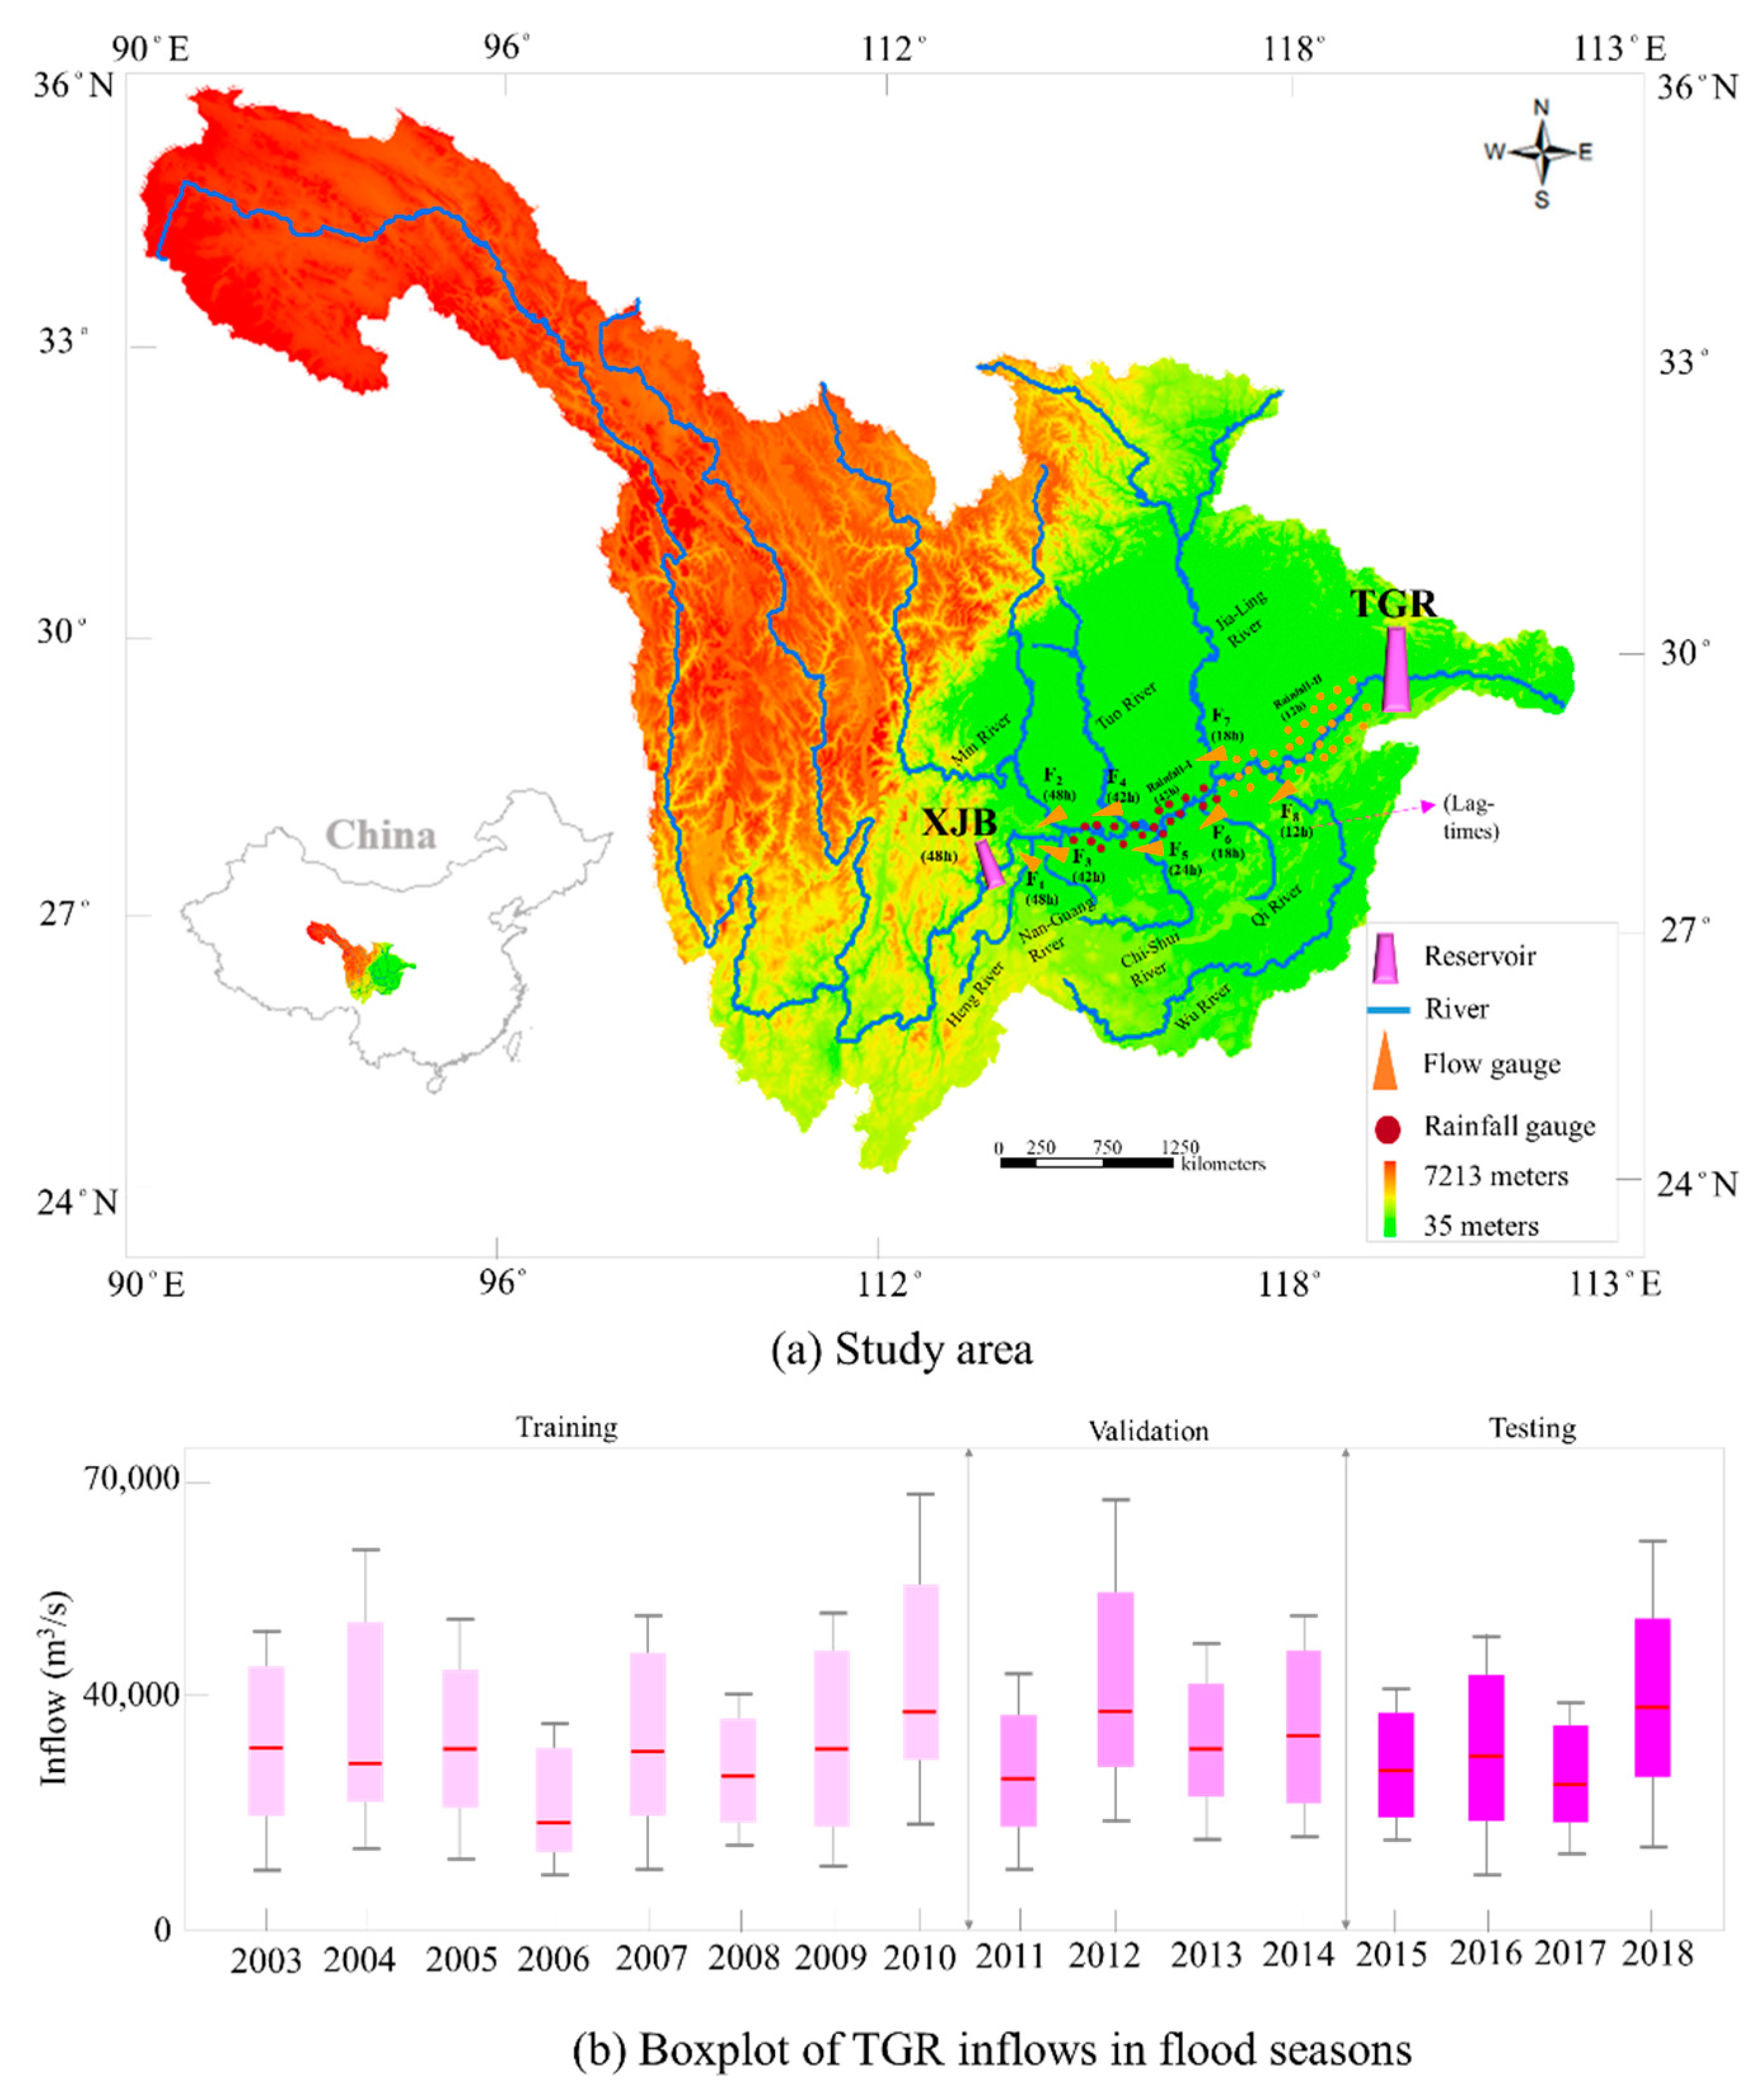
3. Study Area and Materials

Figure 2a illustrates the study area. The Yangtze River is famous for the longest river of China, and its length and drainage area are 6300 km and 1.80 million km2 accordingly. The Three Gorges Reservoir (TGR) is a pivotal hydraulic facility that serves many purposes consisting of flood control, hydropower production and navigation etc. We notice that the upper Yangtze River’ tributaries have notoriously complex hydro-geological characteristics. Plenty of studies were devoted to developing reliable and accurate short-term (less than 24-h ahead) flood forecast models for the Yangtze River due to the extremely non-linear relationship between rainfall and runoff over this basin during storm events [50,51]. Besides, a small improvement in the reliability and accuracy of short-term flood forecasts could be critical and beneficial to flood prevention as well as the dynamic management of the TGR. Heavy rainfalls usually cause floods and further induce downstream flooding within one day. In consequence, rational reservoir operation as well as river basin management require reliable and accurate flood forecasting so that they can adequately handle the high uncertainty of river discharge ranging from 8000 up to 70,000 m3/s, according to the observed reservoir inflows (Figure 2b).
The inflow of the TGR contains three parts: the upstream inflow from the discharge of the XJB reservoir, the inflows from 8 tributaries (flow stations F1–F8), and rainfall (aggregated into two variables: Rainfall-I and Rainfall-II) monitored by 67 rain gauge stations spreading over the TGR intervening basin. Inflow and rainfall data for use in this study were gathered from 2003 to 2018 at a temporal scale of 6 h. When model training completes (2003–2010, 8 years), two ANN models (BPNN and NARX) are constructed. Then the trained ANN that creates the best forecast accuracy in the validation period (2011–2014, 4 years) is identified as the final model to be evaluated upon model reliability using test datasets (2015–2018, 4 years). The Kendall tau coefficient analysis [38,52] is employed to extract the highest correlation of lag-times between model input and output values. According to the highest correlation coefficients, lag-times between the inflow of the TGR and flow/rainfall at various gauge stations are set as 6 h (TGR), 48 h (XJB reservoir), 48 h (F1), 48 h (F2), 42 h (F3), 42 h (F4), 24 h (F5), 18 h (F6), 18 h (F7), 12 h (F8), 42 h (Rainfall-I) and12 h (Rainfal-II) [36]. To reduce the adverse effect of the distinct scales of input data on model performance, all 12 input variables (one autoregressive variable plus 11 exogenous variables) were transformed into the same scale during data preprocessing.

4. Results and Discussion

This study intends to promote the predictability of the deterministic flood forecast model that is integrated with a UKF for probabilistic forecasting at different time horizons.

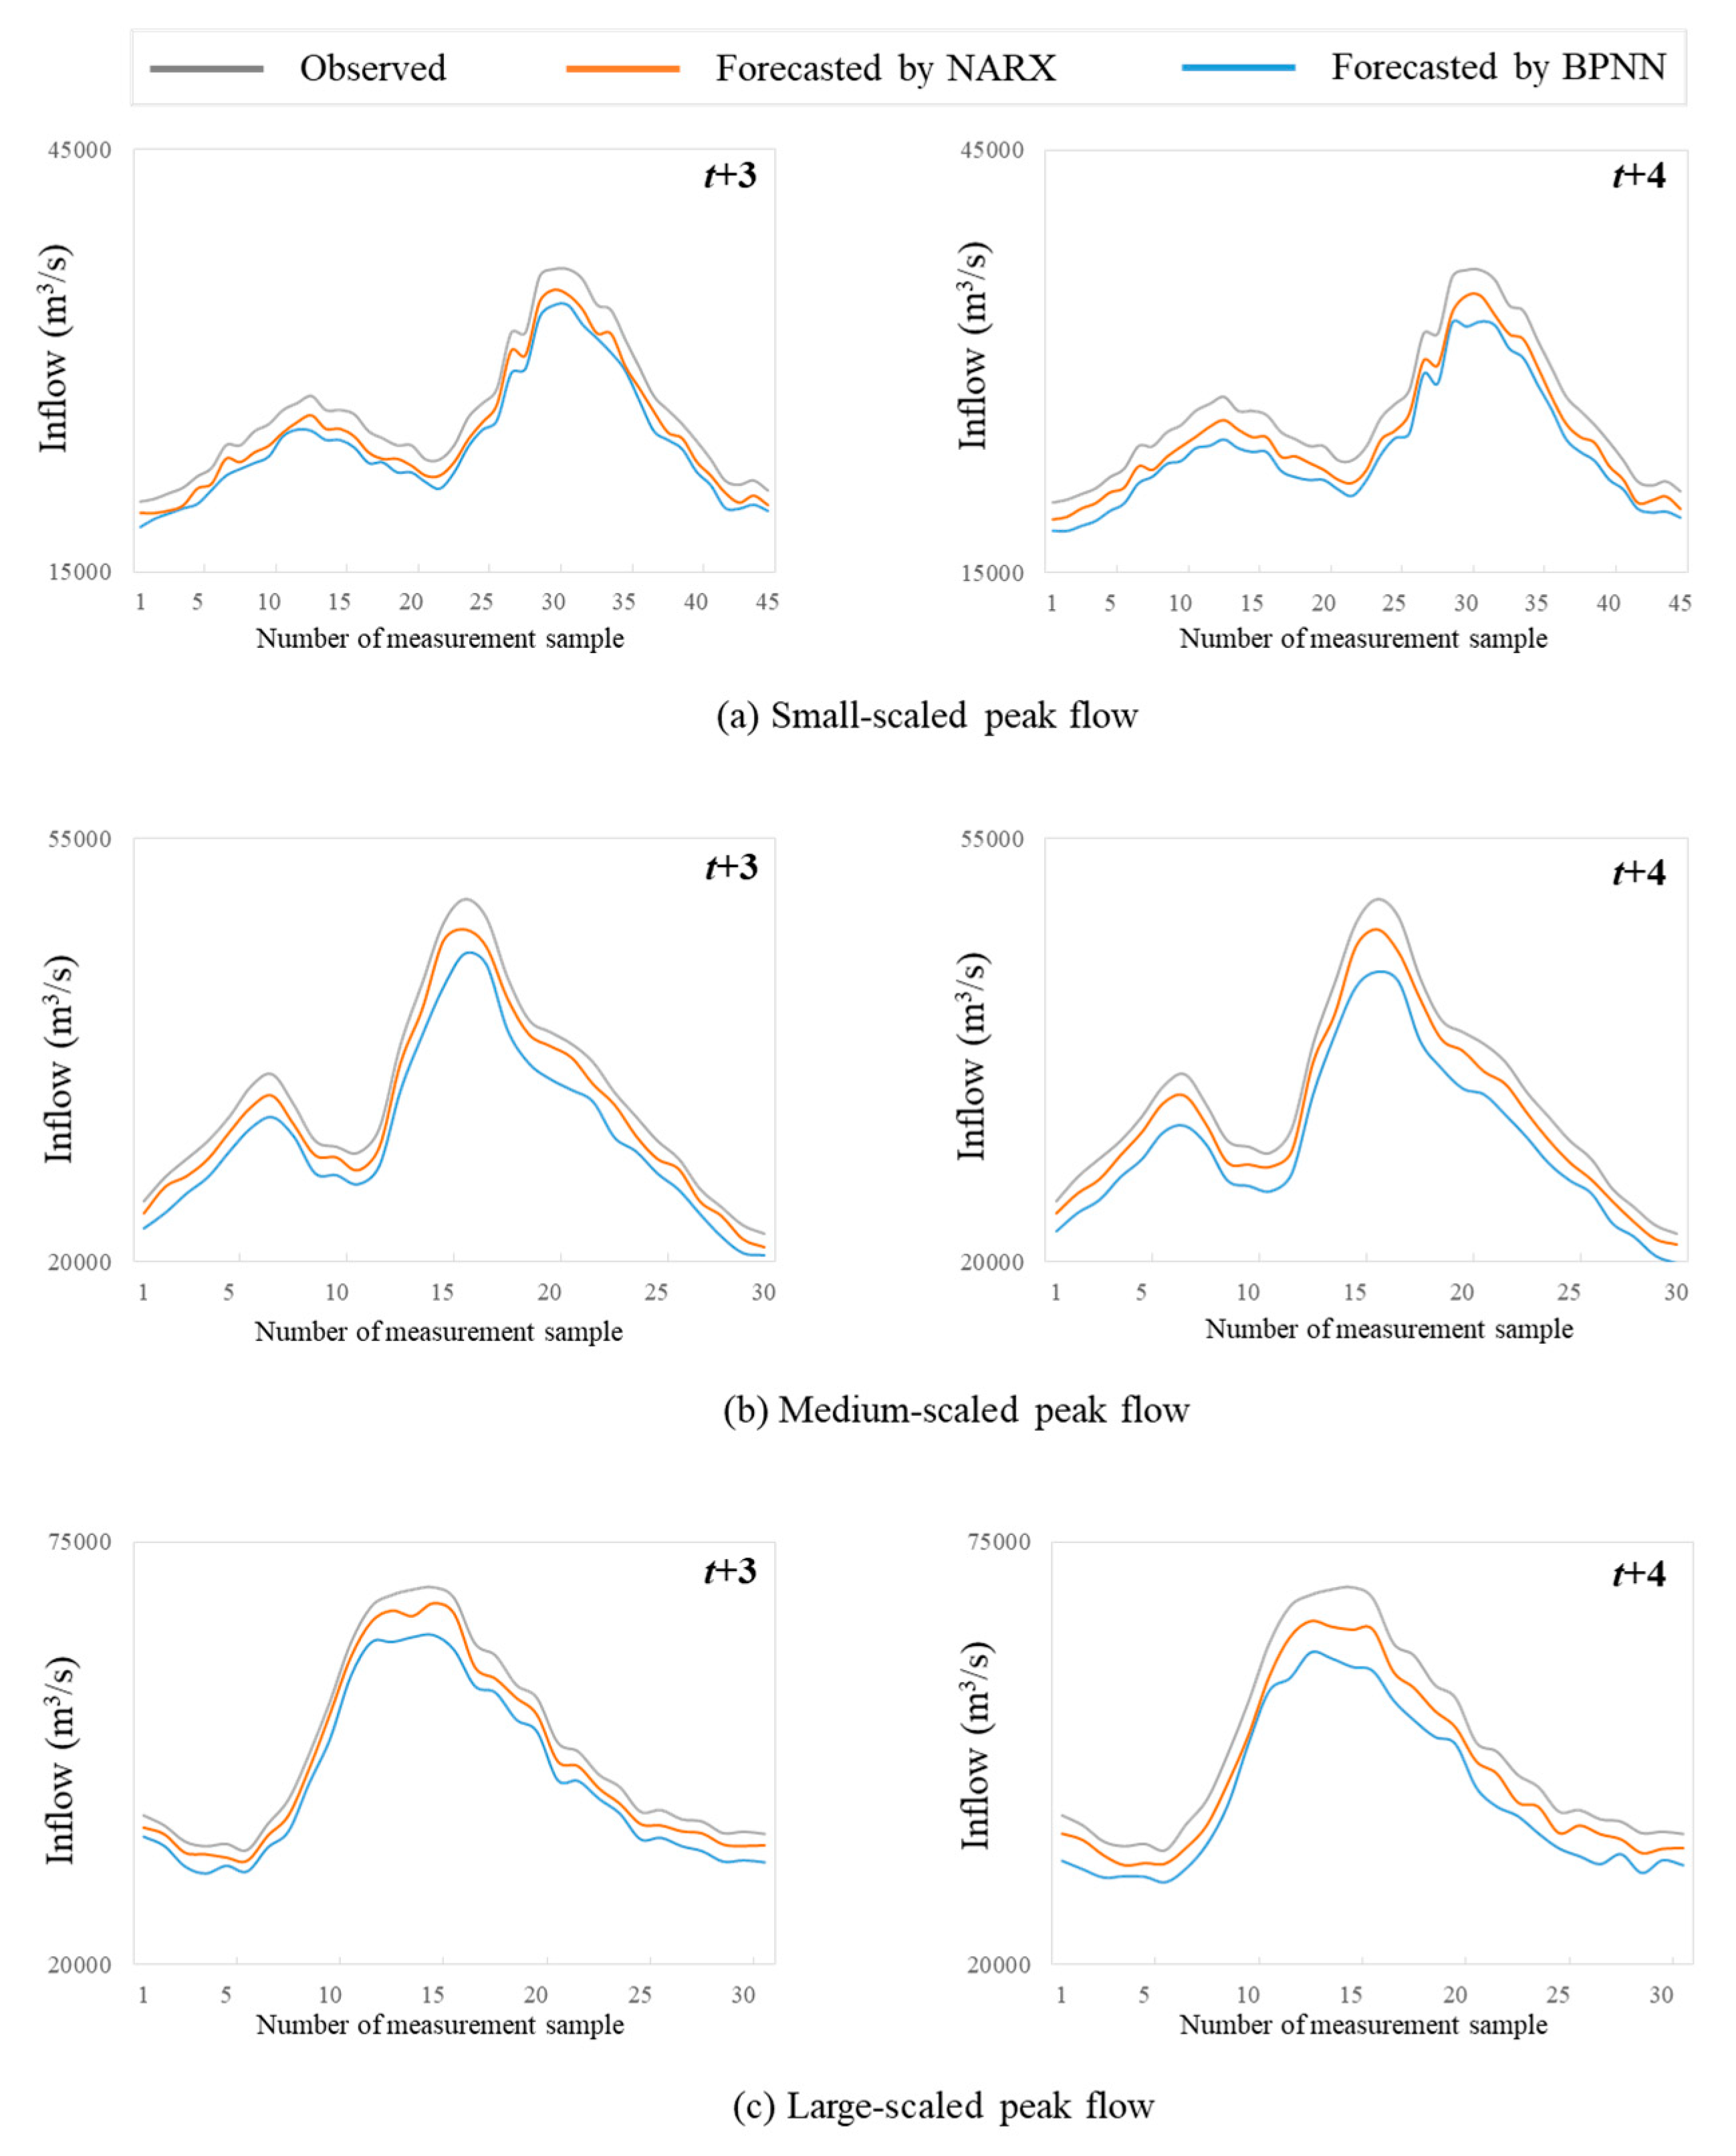
4.1. Performance of Deterministic Flood Forecasts

The short-term (one-day-ahead) forecast not only provides a crucial guideline in reservoir operation but also offers a warning to residents at inundation prone areas. Consequently, a 24 h lead time at a temporal scale of 6 h is suggested to evaluate the performance of two deterministic flood forecast models (NARX and BPNN). Four horizons (t + 1 to t + 4) are specified that 6 h (t + 1) is the first prediction, 12 h (t + 2) is the second prediction, 18 h (t + 3) is the third prediction and 24 h (t + 4) is the fourth prediction.
Table 1 summarizes the results of the NARX and BPNN models. It indicates that the BPNN model creates much lower NSE values but much higher PPTS and MAE values than the NARX model at all three stages. The PPTS indicator is able to show model forecast accuracy in different flood magnitudes. For instance, PPTS (l, 10%) denotes the flood percentage threshold statistic of larger than 10% data. The results in Table 1 demonstrate that the PPTS indicator raises gradually if the lead time increases from t + 1 to t + 4. The NARX model makes the smallest increments in PPTS and MAE values along the lead time while the BPNN model makes the largest ones. In addition, the NARX model displays its superiority compared with the BPNN model in predicting high-magnitude floods regarding frequencies of 2% and 5%. Given a lead time of one day (24 h), the NARX model can increase the NSE by 14.5% while decreasing the PPTS (l, 2%) by 35.8% and the MAE by 20.1% at the testing stage, in comparison to the BPNN model. The results demonstrate that the NARX model performs much better than the BPNN model as the forecast horizon increases. Therefore, it is obvious that the NARX model incorporated with a recurrent mechanism can improve forecast accuracy at longer horizons by feeding itself with the forecasted inflows attained from previous horizons.
To distinguish between the BPNN and NARX models on deterministic forecasting capabilities in the testing stage, three flood events with maximal peak-flows reaching 35,000 m3/s (small), 50,000 m3/s (medium) and 60,000 m3/s (large) are specified to test both models by evaluating the goodness-of-fit between observed and forecasted values at time-step t + 3 and t + 4 (Figure 3). The results appear to show that the NARX model is able to significantly mitigate the time gap between the observed and forecasted flood peaks. Furthermore, the NARX model can produce good forecast results at time-step t + 3 and t + 4, whereas the BPNN model creates a noticeable time-lag problem and fairly big gaps between observed and forecasted values at time-step t + 3 and t + 4. This demonstrates that the NARX model is able to effectively reduce time-lag phenomena and provide accurate deterministic flood forecasting results.
Although the NARX model provides substantial evidence of a good performance in flood forecasting, it is easy to produce systematic under-prediction results for extreme flood events (Figure 3). In addition, hydrologic uncertainties raised in model inputs (e.g., precipitation), as well as the structure and parameters, can be the drivers and causes of time-lag problems occurring in flood forecasting. Therefore, we next adopt a processing approach (i.e., UKF) to decrease the hydrological uncertainty based on the presumption that no uncertainty encounters in model input data.

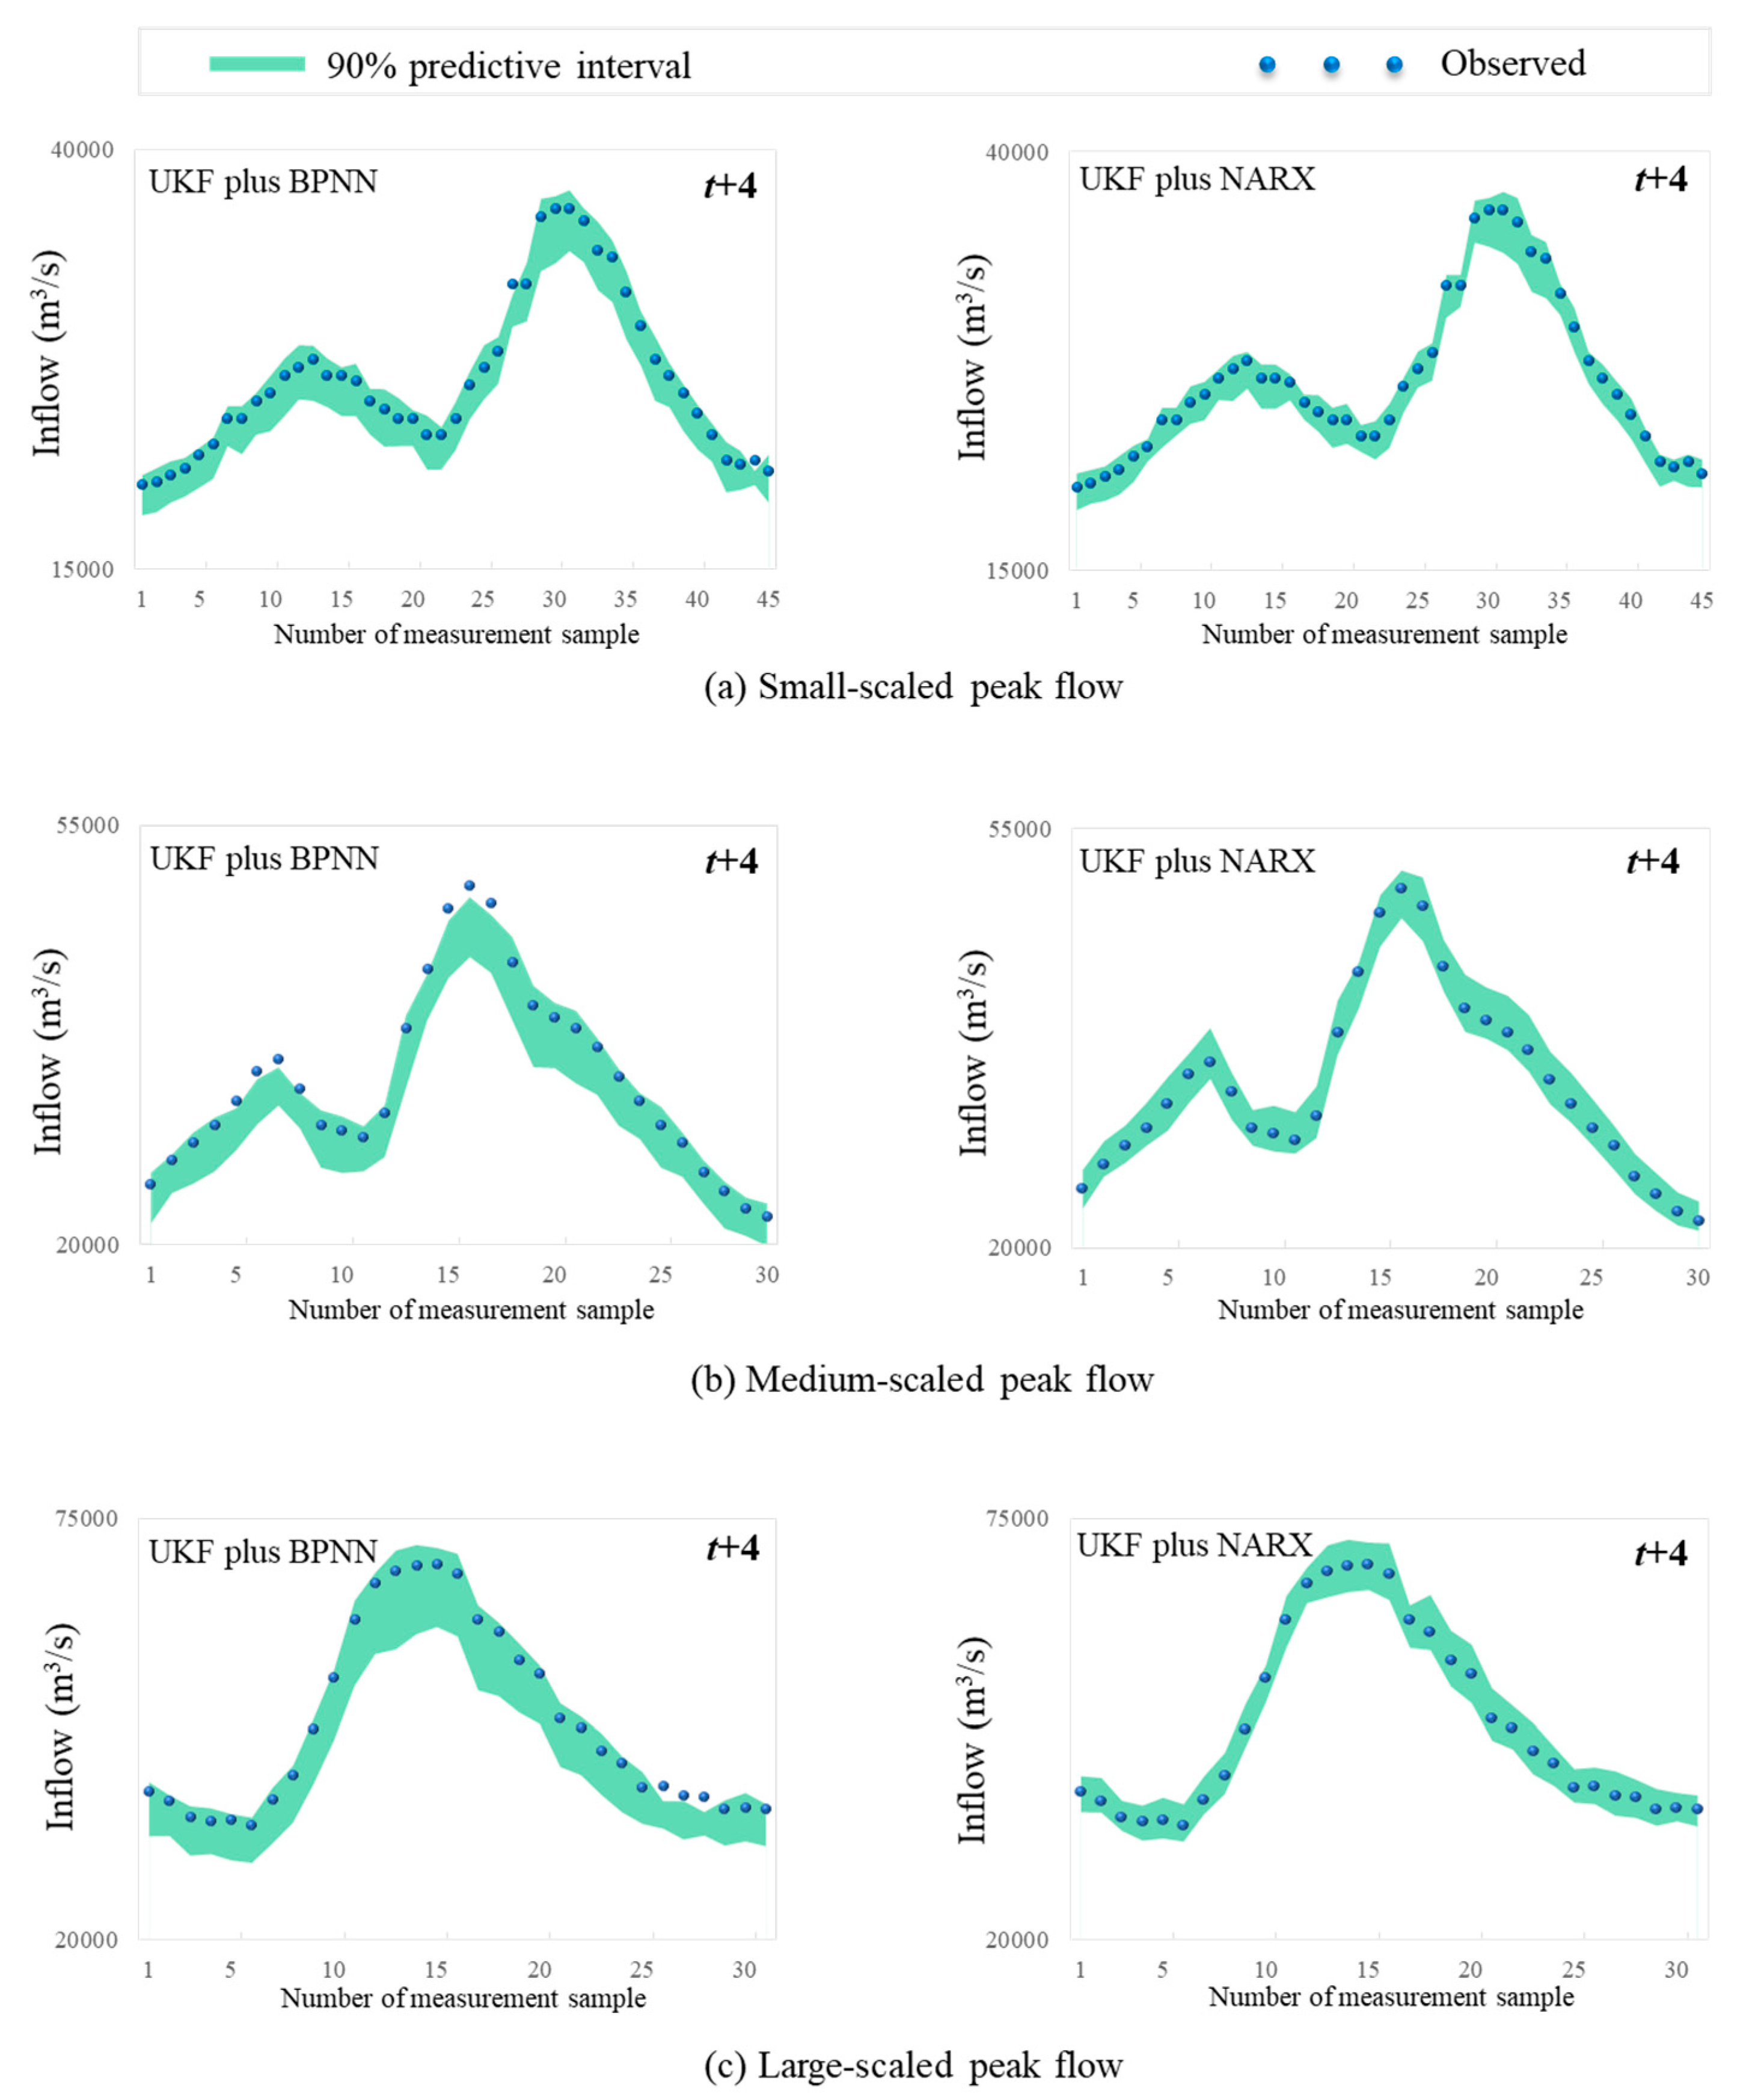
4.2. Probabilistic Flood Forecasting Performance

Table 2 illustrates the results of the CR, RB and CRPS corresponding to the UKF plus NARX and the UKF plus BPNN approaches in all three stages at forecast horizons (t + 1 to t + 4). It supports the superiority of the UKF plus NARX approach in all three stages, whereas the UKF plus BPNN approach performs almost as well as the UKF plus NARX one only in the training stages at forecast horizons up to t + 2 (RB is lower than 0.15, CRPS is lower than 1200 m3/s and CR is higher than 90%). The results demonstrate that the UKF plus NARX approach achieves higher reliability in probabilistic flood forecasting than the UKF plus BPNN one. For horizon t + 4 (one day ahead) in the testing stage, the UKF plus NARX approach is able to increase the CR value by 8.48% while reducing the RB and the CRPS values by 22.73% and 20.31%, respectively, in comparison to the UKF plus BPNN one. In other words, the UKF plus NARX approach is able to significantly improve probabilistic forecast accuracy by producing the narrower prediction bound.
For obviously differentiating the capabilities of the UKF plus NARX and the UKF plus BPNN approaches in the testing stage, the three aforementioned flood events are still specified to test both approaches by evaluating whether the observations fall in the 90% confidence interval at lead time t + 4 (Figure 4). It appears that most of the observations lie within the 90% confidence intervals created by both probabilistic forecasting approaches while the UKF plus NARX approach offers a narrower prediction range. Gneiting et al. [1] advocated that the maximization of the sharpness of the predictive distribution is the goal of probabilistic flood forecasts. Therefore, the UKF plus NARX approach is considered superior to the UKF plus BPNN one.
For median forecasts at horizons from t + 1 up to t + 4 in three stages, the indicators of MAE and CRPS closely associated with the deterministic forecast model (NARX) and the UKF plus NARX approach are listed in Table 3. It is revealed that the median forecasts of the UKF plus NARX approach would output lower values of MAE and CRPS indicators than those of the deterministic forecast model NARX after the horizon t + 2. That is to say, from the perspective of the median forecast, the probabilistic forecast approach also can mitigate the drawback of under-prediction.
In summary, the UKF plus NARX approach not only can create more accurate and robust probabilistic forecasting results but can also mitigate the problems of systematic under-prediction of extreme flood events. Despite UKF indeed correcting for bias, it also produces a probabilistic forecast which we believe is more important. Furthermore, the reasons that we do not conduct a comparative analysis between LKF (including the autoregressive model, AR(1)) and NKF consist of: first, the AR(1) is a simple formation of LKF. The LKF approach can only identify the linear error estimation whereas the NKF approach can quantify the non-linear error estimation. Second, the rainfall-runoff process is intrinsically complex and non-linear and demands non-linear techniques for quantifying predictive uncertainty.
We want to mention that the probabilistic forecasting approach only spent around 60-s calculation temporal cost to provide the deterministic (within 50 s) and the probabilistic (within 10 s) flood forecasting with respect to the inflows of the TGR. A DELL computer conducted the computation (Intel® CoreTM i5, 7th Generation CPU @ 2.50 GHz, RAM 8 GB and 1 TB Hard Disk).

5. Conclusions

We adopt a probabilistic forecasting methodology that hybridises UKF and ANN to generate posterior distributions from observed and forecasted inflows for effectively reducing the predictive distributions occurring in data-driven flood forecasting to small ranges. The contribution of the UKF approach depends on modeling the non-linear correlation among hydrologic variables and on reducing the uncertainty arosing in flood forecasting. The results demonstrated that the recurrent neural network (NARX model) produced more accurate and stable deterministic flood forecasting on the inflows as longer lead time and effectively mitigated time-lag effects as compared with the static neural network (BPNN model). The reason could be due to a key strategy: the recurrent mechanism drives the integration of the antecedent observations and forecasts of input variables into the next forecasting step for alleviating the accumulation and propagation of multi-step-ahead forecast errors.
Nevertheless, the NARX model also suffered the technical barrier of systematic under-prediction of extreme flood events. Therefore, the UKF was applied to the post-processing of deterministic forecasts obtained from the NARX model. The results demonstrated that the UKF plus NARX approach not only can provide a narrower predictive distribution on the inflow series at longer forecast horizons but also can significantly alleviate under-prediction phenomena. The reason can be due to the key strategy: the effective quantification of the non-linear correlation among variables for lessening hydrologic uncertainty. Finally, it is worth noting that the computational time of the UKF plus NARX approach is extremely short (less than 60 s); therefore, it can be applied with success to real-time flood forecasting.

Author Contributions

Y.Z. carried out the analysis and wrote the article; S.G., C.-Y.X. and F.-J.C. developed the methodology; C.-Y.X., F.-J.C. and J.Y. provided technical assistance and contributed in writing the article. All authors have read and agreed to the published version of the manuscript.

Funding

This work was supported by the National Natural Science Foundation of China (No. 51539009 and No. U1865201), the National Key Research and Development Program of China (2018YFC0407904) and the Research Council of Norway (FRINATEK Project 274310).

Acknowledgments

We thank the Changjiang Water Resources Commission of China for providing the monitoring data, and the data can be downloaded from this website (http://www.cjh.com.cn, Chinese). The authors would like to thank the editors and anonymous reviewers for their constructive comments that greatly contributed to improving the manuscript.

Conflicts of Interest

The authors declare no conflict of interest.

References

  1. Gneiting, T.; Balabdaoui, F.; Raftery, A.E. Probabilistic forecasts, calibration and sharpness. J. R. Stat. Soc. Ser. B (Stat. Methodol.) 2007, 69, 243–268. [Google Scholar] [CrossRef] [Green Version]
  2. Han, S.; Coulibaly, P. Bayesian flood forecasting methods: A review. J. Hydrol. 2017, 551, 340–351. [Google Scholar] [CrossRef]
  3. Wetterhall, F.; Pappenberger, F.; Alfieri, L.; Cloke, H.L.; Thielen-del Pozo, J.; Balabanova, S.; Danhelka, J.; Vogelbacher, A.; Salamon, P.; Carrasco, I.; et al. HESS Opinions: Forecaster priorities for improving probabilistic flood forecasts. Hydrol. Earth Syst. Sci. 2013, 17, 4389–4399. [Google Scholar] [CrossRef] [Green Version]
  4. Arnal, L.; Ramos, M.H.; Perez, E.C.D.; Cloke, H.L.; Stephens, E.; Wetterhall, F.; van Andel, S.J.; Pappenberger, F. Willingness-to-pay for a probabilistic flood forecast: A risk-based decision-making game. Hydrol. Earth Syst. Sci. 2016, 20, 3109–3128. [Google Scholar] [CrossRef]
  5. Kalman, R.E. A new approach to linear filtering and prediction problems. J. Basic Eng. 1960, 82, 35–45. [Google Scholar] [CrossRef] [Green Version]
  6. Laio, F.; Tamea, S. Verification tools for probabilistic forecasts of continuous hydrological variables. Hydrol. Earth Syst. Sci. 2007, 11, 1267–1277. [Google Scholar] [CrossRef] [Green Version]
  7. Herr, H.D.; Krzysztofowicz, R. Ensemble Bayesian forecasting system Part I: Theory and algorithms. J. Hydrol. 2015, 524, 789–802. [Google Scholar] [CrossRef]
  8. Zhou, Y.; Guo, S. Risk analysis for flood control operation of seasonal flood-limited water level incorporating inflow forecasting error. Hydrol. Sci. J. 2014, 59, 1006–1019. [Google Scholar] [CrossRef] [Green Version]
  9. Zhou, Y.; Guo, S.; Chang, F.J.; Liu, P.; Chen, A.B. Methodology that improves water utilization and hydropower generation without increasing flood risk in mega cascade reservoirs. Energy 2018, 143, 785–796. [Google Scholar] [CrossRef]
  10. Madadgar, S.; Moradkhani, H. Improved Bayesian multimodeling: Integration of copulas and Bayesian model averaging. Water Resour. Res. 2014, 50, 9586–9603. [Google Scholar] [CrossRef] [Green Version]
  11. Papacharalampous, G.A.; Tyralis, H.; Koutsoyiannis, D. Comparison of stochastic and machine learning methods for multi-step ahead forecasting of hydrological processes. Stoch. Environ. Res. Risk Assess. 2019, 33, 481–514. [Google Scholar] [CrossRef]
  12. Engeland, K.; Steinsland, I. Probabilistic postprocessing models for flow forecasts for a system of catchments and several lead times. Water Resour. Res. 2014, 50, 182–197. [Google Scholar] [CrossRef]
  13. Krapu, C.; Borsuk, M. Probabilistic programming: A review for environmental modellers. Environ. Model. Softw. 2019, 114, 40–48. [Google Scholar] [CrossRef]
  14. Todini, E. From HUP to MCP: Analogies and extended performances. J. Hydrol. 2013, 477, 33–42. [Google Scholar] [CrossRef]
  15. Siccardi, F.; Boni, G.; Ferraris, L.; Rudari, R.O.B.E.R.T.O. A hydrometeorological approach for probabilistic flood forecast. J. Geophys. Res.: Atmos. 2005, 110. [Google Scholar] [CrossRef]
  16. Liu, Z.; Guo, S.; Xiong, L.; Xu, C.Y. Hydrological uncertainty processor based on a copula function. Hydrol. Sci. J. 2018, 63, 74–86. [Google Scholar] [CrossRef]
  17. Julier, S.J.; UHlmann, J.K. A new extension of the Kalman filter to nonlinear systems. Aerosense 1997, 97, 182–193. [Google Scholar]
  18. Bosov, A.V.; Miller, G.B. Conditionally minimax nonlinear filter and Unscented Kalman filter: Empirical analysis and comparison. Autom. Remote. Control. 2019, 80, 1230–1251. [Google Scholar] [CrossRef]
  19. Jiang, P.; Sun, Y.; Bao, W. State estimation of conceptual hydrological models using unscented Kalman filter. Hydrol. Res. 2019, 50, 479–497. [Google Scholar] [CrossRef] [Green Version]
  20. Kanakaraj, S.; Nair, M.S.; Kalady, S. Adaptive Importance Sampling Unscented Kalman Filter based SAR image super resolution. Comput. Geosci. 2019, 133, 104310. [Google Scholar] [CrossRef]
  21. Fu, X.; Yu, Z.; Ding, Y.; Qin, Y.; Luo, L.; Zhao, C.; Yang, C. Unscented weighted ensemble Kalman filter for soil moisture assimilation. J. Hydrol. 2019, 580, 124352. [Google Scholar] [CrossRef]
  22. Wu, X.; Wang, Y. Extended and Unscented Kalman filtering based feedforward neural networks for time series prediction. Appl. Math. Model. 2012, 36, 1123–1131. [Google Scholar] [CrossRef]
  23. Wang, X.; Babovic, V. Application of hybrid Kalman filter for improving water level forecast. J. Hydroinf. 2016, 18, 773–790. [Google Scholar] [CrossRef] [Green Version]
  24. Wu, X.-L.; Xiang, X.-H.; Wang, C.-H.; Chen, X.; Xu, C.-Y.; Yu, Z. Coupled hydraulic and Kalman Filter model for real-time correction of flood forecast in the Three Gorges interzone of Yangtze River, China. J. Hydro. Eng. 2013, 18, 1416–1425. [Google Scholar] [CrossRef]
  25. Zhang, X.; Liang, F.; Yu, B.; Zong, Z. Explicitly integrating parameter, input, and structure uncertainties into Bayesian Neural Networks for probabilistic hydrologic forecasting. J. Hydrol. 2011, 409, 696–709. [Google Scholar] [CrossRef]
  26. Zhu, F.; Zhong, P.A.; Sun, Y.; Yeh, W.W.G. Real-time optimal flood control decision making and risk propagation under multiple uncertainties. Water Resour. Res. 2017, 53, 10635–10654. [Google Scholar] [CrossRef] [Green Version]
  27. Abrahart, R.J.; Anctil, F.; Coulibaly, P.; Dawson, C.W.; Mount, N.J.; See, L.M.; Wilby, R.L. Two decades of anarchy? Emerging themes and outstanding challenges for neural network river forecasting. Prog. Phys. Geogr. 2012, 36, 480–513. [Google Scholar] [CrossRef]
  28. Shen, C.; Laloy, E.; Elshorbagy, A.; Albert, A.; Bales, J.; Chang, F.J.; Ganguly, S.; Hsu, K.L.; Kifer, D.; Fang, Z.; et al. HESS Opinions: Incubating deep-learning-powered hydrologic science advances as a community. Hydrol. Earth Syst. Sci. 2018, 22, 5639–5656. [Google Scholar] [CrossRef] [Green Version]
  29. Asanjan, A.A.; Yang, T.; Hsu, K.; Sorooshian, S.; Lin, J.; Peng, Q. Short-term precipitation forecast based on the PERSIANN system and the long short-term memory (LSTM) deep learning algorithm. J. Geophys. Res.: Atmos. 2018, 123, 12543–12563. [Google Scholar]
  30. Bui, D.T.; Panahi, M.; Shahabi, H.; Singh, V.P.; Shirzadi, A.; Chapi, K.; Ahmad, B.B. Novel hybrid evolutionary algorithms for spatial prediction of floods. Sci. Rep. 2018, 8, 15364. [Google Scholar] [CrossRef] [Green Version]
  31. Cannon, A.J. Quantile regression neural networks: Implementation in R and application to precipitation downscaling. Comput. Geosci. 2011, 37, 1277–1284. [Google Scholar] [CrossRef]
  32. Chang, F.J.; Chen, P.A.; Lu, Y.R.; Huang, E.; Chang, K.Y. Real-time multi-step-ahead water level forecasting by recurrent neural networks for urban flood control. J. Hydrol. 2014, 517, 836–846. [Google Scholar] [CrossRef]
  33. Chang, F.J.; Tsai, M.J. A nonlinear spatio-temporal lumping of radar rainfall for modeling multi-step-ahead inflow forecasts by data-driven techniques. J. Hydrol. 2016, 535, 256–269. [Google Scholar] [CrossRef]
  34. Chen, P.A.; Chang, L.C.; Chang, F.J. Reinforced recurrent neural networks for multi-step-ahead flood forecasts. J. Hydrol. 2013, 497, 71–79. [Google Scholar] [CrossRef]
  35. Chen, L.; Sun, N.; Zhou, C.; Zhou, J.; Zhou, Y.; Zhang, J.; Zhou, Q. Flood forecasting based on an improved extreme learning machine model combined with the backtracking search optimization algorithm. Water 2018, 10, 1362. [Google Scholar] [CrossRef] [Green Version]
  36. Hu, C.; Wu, Q.; Li, H.; Jian, S.; Li, N.; Lou, Z. Deep learning with a long short-term memory networks approach for rainfall-runoff simulation. Water 2018, 10, 1543. [Google Scholar] [CrossRef] [Green Version]
  37. Zhou, Y.; Chang, F.J.; Chang, L.C.; Kao, I.F.; Wang, Y.S. Explore a deep learning multi-output neural network for regional multi-step-ahead air quality forecasts. J. Clean. Prod. 2019, 209, 134–145. [Google Scholar] [CrossRef]
  38. Zhou, Y.; Guo, S.; Chang, F.J. Explore an evolutionary recurrent ANFIS for modelling multi-step-ahead flood forecasts. J. Hydrol. 2019, 570, 343–355. [Google Scholar] [CrossRef]
  39. Kasiviswanathan, K.S.; Sudheer, K.P.; He, J. Probabilistic and ensemble simulation approaches for input uncertainty quantification of artificial neural network hydrological models. Hydrol. Sci. J. 2018, 63, 101–113. [Google Scholar] [CrossRef]
  40. Kumar, S.; Tiwari, M.K.; Chatterjee, C.; Mishra, A. Reservoir inflow forecasting using ensemble models based on neural networks, wavelet analysis and bootstrap method. Water Resour. Manag. 2015, 29, 4863–4883. [Google Scholar] [CrossRef]
  41. Zhong, Y.; Guo, S.; Ba, H.; Xiong, F.; Chang, F.J.; Lin, K. Evaluation of the BMA probabilistic inflow forecasts using TIGGE numeric precipitation predictions based on artificial neural network. Hydrol. Res. 2018, 49, 1417–1433. [Google Scholar] [CrossRef]
  42. Shen, H.Y.; Chang, L.C. Online multistep-ahead inundation depth forecasts by recurrent NARX networks. Hydrol. Earth Syst. Sci. 2013, 17, 935–945. [Google Scholar] [CrossRef] [Green Version]
  43. Wunsch, A.; Liesch, T.; Broda, S. Forecasting groundwater levels using nonlinear autoregressive networks with exogenous input (NARX). J. Hydrol. 2018, 567, 743–758. [Google Scholar] [CrossRef]
  44. Lourakis, M.I. A brief description of the Levenberg-Marquardt algorithm implemented by Levmar. Found. Res. Technol. 2005, 4, 1–6. [Google Scholar]
  45. Nanda, T.; Sahoo, B.; Beria, H.; Chatterjee, C. A wavelet-based non-linear autoregressive with exogenous inputs (WNARX) dynamic neural network model for real-time flood forecasting using satellite-based rainfall products. J. Hydrol. 2016, 539, 57–73. [Google Scholar] [CrossRef]
  46. Lohani, A.K.; Goel, N.K.; Bhatia, K.K.S. Improving real time flood forecasting using fuzzy inference system. J. Hydrol. 2014, 509, 25–41. [Google Scholar] [CrossRef]
  47. Nash, J.E. River flow forecasting through conceptual models, I: A discussion of principles. J. Hydrol. 1970, 10, 398–409. [Google Scholar] [CrossRef]
  48. Gneiting, T.; Raftery, A.E. Strictly Proper Scoring Rules, Prediction, and Estimation. J. Am. Stat. Assoc. 2007, 102, 359–378. [Google Scholar] [CrossRef]
  49. Xiong, L.; O’Connor, K.M. An empirical method to improve the prediction limits of the GLUE methodology in rainfall-runoff modeling. J. Hydrol. 2008, 349, 115–124. [Google Scholar] [CrossRef]
  50. Bai, Y.; Chen, Z.; Xie, J.; Li, C. Daily reservoir inflow forecasting using multiscale deep feature learning with hybrid models. J. Hydrol. 2016, 532, 193–206. [Google Scholar] [CrossRef]
  51. Chen, L.; Zhang, Y.; Zhou, J.; Singh, V.P.; Guo, S.; Zhang, J. Real-time error correction method combined with combination flood forecasting technique for improving the accuracy of flood forecasting. J. Hydrol. 2015, 521, 157–169. [Google Scholar] [CrossRef]
  52. Maidment, D.R. Handbook of Hydrology; McGraw-Hill: New York, NY, USA, 1993. [Google Scholar]
Figure 1. Probabilistic forecast architecture. (a) The non-linear auto-regressive with exogenous inputs (NARX) neural network model. (b) The unscented Kalman filter (UKF) post-processing approach.
Water 12 00578 g001
Figure 2. Study area and the statistical characteristics of reservoir inflows. (a) Locations of the Xiang-Jia-Ba (XJB) Reservoir and the Three Gorges Reservoir (TGR), river flow as well as rain gauging stations; (b) The boxplot of TGR inflows collected in flood seasons (from 1 June to 30 September) during 2003 and 2018 at a temporal scale of 6 h.
Water 12 00578 g002
Figure 3. TGR inflow forecasts using the NARX and the BPNN models. Three flood events with maximal peak-flow exceeding (a) 35,000 m3/s (small-scaled), (b) 50,000 m3/s (medium-scaled) and (c) 60,000 m3/s (large-scaled).
Water 12 00578 g003
Figure 4. Probabilistic flood forecasts for TGR of the testing stage at lead time t + 4. Three flood events with maximal peak-flow exceeding (a) 35,000 m3/s (small-scaled); (b) 50,000 m3/s (medium-scaled); and (c) 60,000 m3/s (large-scaled). The 90% confidence bound is corresponding to the lower (5%) and upper (95%) limitation of the forecasted value at time t.
Water 12 00578 g004
Table 1. Performances (peak percent threshold statistics (PPTS), mean absolute error (MAE) and Nash–Sutcliffe efficiency (NSE)) of NARX and back-propagation neural network (BPNN) models in three stages.
StageModelIndicatorHorizon
t + 1t + 2t + 3t + 4
TrainingNARXPPTS (l, 2%)0.02930.03100.03320.0349
PPTS (l, 5%)0.03140.03300.03550.0383
PPTS (l, 10%)0.03340.03560.03930.0450
PPTS (l, 20%)0.03660.03880.04290.0488
MAE (m3/s)6897508491037
NSE0.9800.9690.9630.942
BPNNPPTS (l, 2%)0.02930.03460.03640.0398
PPTS (l, 5%)0.03140.04470.04830.0512
PPTS (l, 10%)0.03340.05460.06060.0616
PPTS (l, 20%)0.03660.06010.06610.0672
MAE (m3/s)68995110241295
NSE0.9800.9350.9070.858
ValidationNARXPPTS (l, 2%)0.02950.03140.03400.0361
PPTS (l, 5%)0.03150.03340.03640.0397
PPTS (l, 10%)0.03350.03540.03950.0438
PPTS (l, 20%)0.03720.03990.04450.0491
MAE (m3/s)7167829191079
NSE0.9780.9650.9570.936
BPNNPPTS (l, 2%)0.02950.04320.04720.0493
PPTS (l, 5%)0.03150.04720.05150.0547
PPTS (l, 10%)0.03350.05510.06060.0643
PPTS (l, 20%)0.03720.06210.06900.0732
MAE (m3/s)71696410881317
NSE0.9800.9310.9040.853
TestingNARXPPTS (l, 2%)0.03050.03120.03320.0349
PPTS (l, 5%)0.03200.03390.03650.0418
PPTS (l, 10%)0.03430.03680.04110.0456
PPTS (l, 20%)0.03740.04010.04480.0497
MAE (m3/s)7939318931006
NSE0.9780.9670.9610.940
BPNNPPTS (l, 2%)0.03050.04880.05360.0544
PPTS (l, 5%)0.03200.05110.05620.0571
PPTS (l, 10%)0.03430.05820.06470.0686
PPTS (l, 20%)0.03740.06350.07050.0749
MAE (m3/s)79399210791259
NSE0.9780.9290.8720.821
Table 2. Probabilistic forecasting performance (containing ratio (CR), average relative bandwidth (RB) and continuous ranked probability score (CRPS)) regarding TGR reservoir inflow.
StageModelIndicatorHorizon
t + 1t + 2t + 3t + 4
TrainingUKF plus NARXCR (%)98.2396.3795.0694.53
RB0.080.100.130.17
CRPS (m3/s)75491110921253
UKF plus BPNNCR (%)98.2394.1192.2589.03
RB0.080.120.180.21
CRPS (m3/s)754109213611517
ValidationUKF plus NARXCR (%)98.2196.3295.0094.37
RB0.080.110.140.18
CRPS (m3/s)78993411121274
UKF plus BPNNCR (%)98.2193.0791.2188.06
RB0.080.130.190.23
CRPS (m3/s)789111813951576
TestingUKF plus NARXCR (%)98.1896.2995.0294.41
RB0.090.100.130.17
CRPS (m3/s)77692211041267
UKF plus BPNNCR (%)98.1892.0489.2587.03
RB0.090.120.180.22
CRPS (m3/s)776112714121590
Table 3. Results of median forecasts regarding inflows of Three Gorges Reservoir.
StageModelIndicatorHorizon
t + 1t + 2t + 3t + 4
TrainingNARXMAE (m3/s)4537508491037
CRPS (m3/s)781102511891306
UKF plus NARXMAE (m3/s)412702811954
CRPS (m3/s)72489410641202
ValidationNARXMAE (m3/s)4747829191079
CRPS (m3/s)813110612161390
UKF plus NARXMAE (m3/s)439736851975
CRPS (m3/s)76791010971243
TestingNARXMAE (m3/s)4659318931006
CRPS (m3/s)798103511941354
UKF plus NARXMAE (m3/s)428719838960
CRPS (m3/s)74990110821224

