Source and Mobilization Mechanism of Iron, Manganese and Arsenic in Groundwater of Shuangliao City, Northeast China
by
 , and
, and
Zhihao Zhang
1,2,3, 
Changlai Xiao
1,2,3,
Oluwafemi Adeyeye
1,2,3,4,
Weifei Yang
1,2,3 and
Xiujuan Liang
1,2,3,* 1
Key Laboratory of Groundwater Resources and Environment, Jilin University, Ministry of Education, Changchun 130021, China
2
National-Local Joint Engineering Laboratory of In-situ Conversion, Drilling and Exploitation Technology for Oil Shale, Changchun 130021, China
3
College of New Energy and Environment, Jilin University, Changchun 130021, China
4
Global Geosolutionz, Typesetters Biz Complex, Department of Geology, Ahmadu Bello University, Zaria 810107, Nigeria
*
Author to whom correspondence should be addressed.
Water 2020, 12(2), 534; https://doi.org/10.3390/w12020534
Submission received: 12 January 2020
/
Revised: 10 February 2020
/
Accepted: 11 February 2020
/
Published: 14 February 2020
(This article belongs to the Special Issue Geochemistry of Water and Sediment)
Abstract
:Excessive levels of Fe, Mn and As are the main factors affecting groundwater quality in Songliao plain, northeast China. However, there are few studies on the source and mobilization mechanisms of Fe, Mn and As in the groundwater of Northeastern China. This study takes Shuangliao city in the middle of Songliao plain as an example, where the source and mobilization mechanisms of iron, manganese and arsenic in groundwater in the study area were analyzed by statistical methods and spatial analysis. The results show that the source of Fe and Mn in the groundwater of the platform is the iron and manganese nodules in the clay layer, while, in the river valley plain, it originates from the soil and the whole aquifer. The TDS, fluctuation in groundwater levels and the residence time are the important factors affecting the content of Fe and Mn in groundwater. The dissolution of iron and manganese minerals causes arsenic adsorbed on them to be released into groundwater. This study provides a basis for the rational utilization of groundwater and protection of people’s health in areas with high iron, manganese and arsenic contents.
1. Introduction
Songliao plain is one of the important agricultural areas in China. Because Songliao plain is located in a semi-arid climate region, it lacks enough surface water. Groundwater from Quaternary sediments is the main source of drinking water for local residents. However, excessive levels of Fe, Mn and As are the main factors affecting groundwater quality in Songliao plain, northeast China [1]. Groundwater used as a source of drinking water containing excessive levels of iron, manganese and arsenic affects not only China but also other countries, such as Italy, Bangladesh and Argentina [2,3,4,5].
Iron and manganese ions can cause staining of laundry clothes and plumbing fixtures, and lead to the accumulation of sediment in the water delivery system. They can also raise the color and turbidity of the groundwater. The deleterious effect of Fe and Mn on health is known to include chronic intoxication, lung embolism, bronchitis, impotence, nerve damage and parkinsonism [6]. Excessive arsenic can have major health effects on residents, including skin cancer and other cardiovascular, neurological, hematological, renal and respiratory diseases [7]. The national standard for drinking water qualities in China are 0.3 mg/L, 0.1 mg/L and 10 μg/L for Fe, Mn and As. The WHO recommends a health-based value of 0.4 mg/L for Mn and 10 μg/L for As.
Iron and manganese are widely found in soils and aquifers, which have similar geochemical behavior. The reducing conditions, residence time, well depth, and salinity are the key factors leading the dissolution and migration of Fe and Mn to groundwater [2,3,5,8]. Organic matter (organic carbon) released into groundwater from aquifers and soils can quickly deplete dissolved oxygen in groundwater, resulting in a more reductive hydrochemistry [2]. After oxygen is exhausted, organic matter is degraded in the order of denitrification, Mn(IV) reduction, Fe(III) reduction, sulfate reduction, and methanogenesis [9,10]. With the increase in residence time, the groundwater gradually changes from oxic to reductive, and the reductive dissolution of Fe/Mn oxides increases the concentration of Fe and Mn in groundwater [8,11]. The Fe/Mn oxide-bound As would then be released during reductive dissolution of Fe/Mn oxides in reducing condition. This is the most accepted mechanism for high As groundwater in many places in the world [7,12,13,14]. To investigate the influence of organic matter on the mobility of Fe, Mn, and As, in situ experiments [13,15] were conducted to inject reactive carbon into shallow groundwater. In addition to the increase in groundwater reducibility, the concentration of nitrate and sulfate decreased [13]. The presence of nitrite, ammonium and sulfur ions also indicates the reductive inclination [2,7,16]. Studies [4,17,18] show that high arsenic water is distributed mostly in the following environments: favorable geological conditions and climate for iron oxide enrichment; geological conditions of rapid deposition, such as deltas and valley plains; a sedimentary environment rich in organic matter, such as wetland; and fine particle sediments, among others.
The Songliao plain, located in northeast China, is a typical area with high iron and manganese content in groundwater. Though some domestic studies focus on the treatment of iron and manganese groundwater, studies into its source and mobilization mechanism have not been carried out. Although arsenic has been reported in high concentrations in northern China [19], the high levels of arsenic in the Songliao plain have only been recently reported globally [7,20].
Above all, the source and mobilization mechanisms of Fe, Mn and As in groundwater in Songliao plain of northeast China are not clear. Other studies have only mentioned Fe and Mn in groundwater from sediments and soil, without quantitative discussion. In addition, the influence of water level fluctuation, groundwater residence time and groundwater exploitation on Fe, Mn and As in groundwater have not been studied.
This study systematically investigated the hydrogeochemical characteristics of groundwater with high iron, manganese and arsenic in Shuangliao city, within the Songliao plain. The relationship between iron, manganese and arsenic and their source were investigated. The relationship between the concentration of iron, manganese in groundwater and the character of the aquifer (thickness of clay, vadose zone, and groundwater level fluctuation) and TDS is discussed quantitatively. In addition, a good correlation between the concentration of Fe/Mn and residence time was found in the study area. This study provides a basis for the rational utilization of groundwater and protection of local people’s health.
2. Materials and Methods
2.1. Study Area
Shuangliao city (123°20′ E–124°05′ E, 43°20′ N–44°05′ N) is a county located in the center of Songliao plain, western Jilin province, hosting up to 0.42 million people in the whole district. Mean annual precipitation is 465.2 mm, with 78.6% concentrated within May to September. Mean annual pan evaporation is 1280.3 mm.
The south of the study area is flat terrain, the north of which is mainly sand dune. The terrain of the study area is high in the northeast and low in the southwest. The overall terrain varies by about 100 m. The river cuts down, forming a zonal distribution of river valley plain. The river valley plain is mainly composed of the flood plain and first-level terraces, which are distributed along both sides of the Dongliaohe River and Xiliaohe River in a belt, and the terrain is relatively flat.
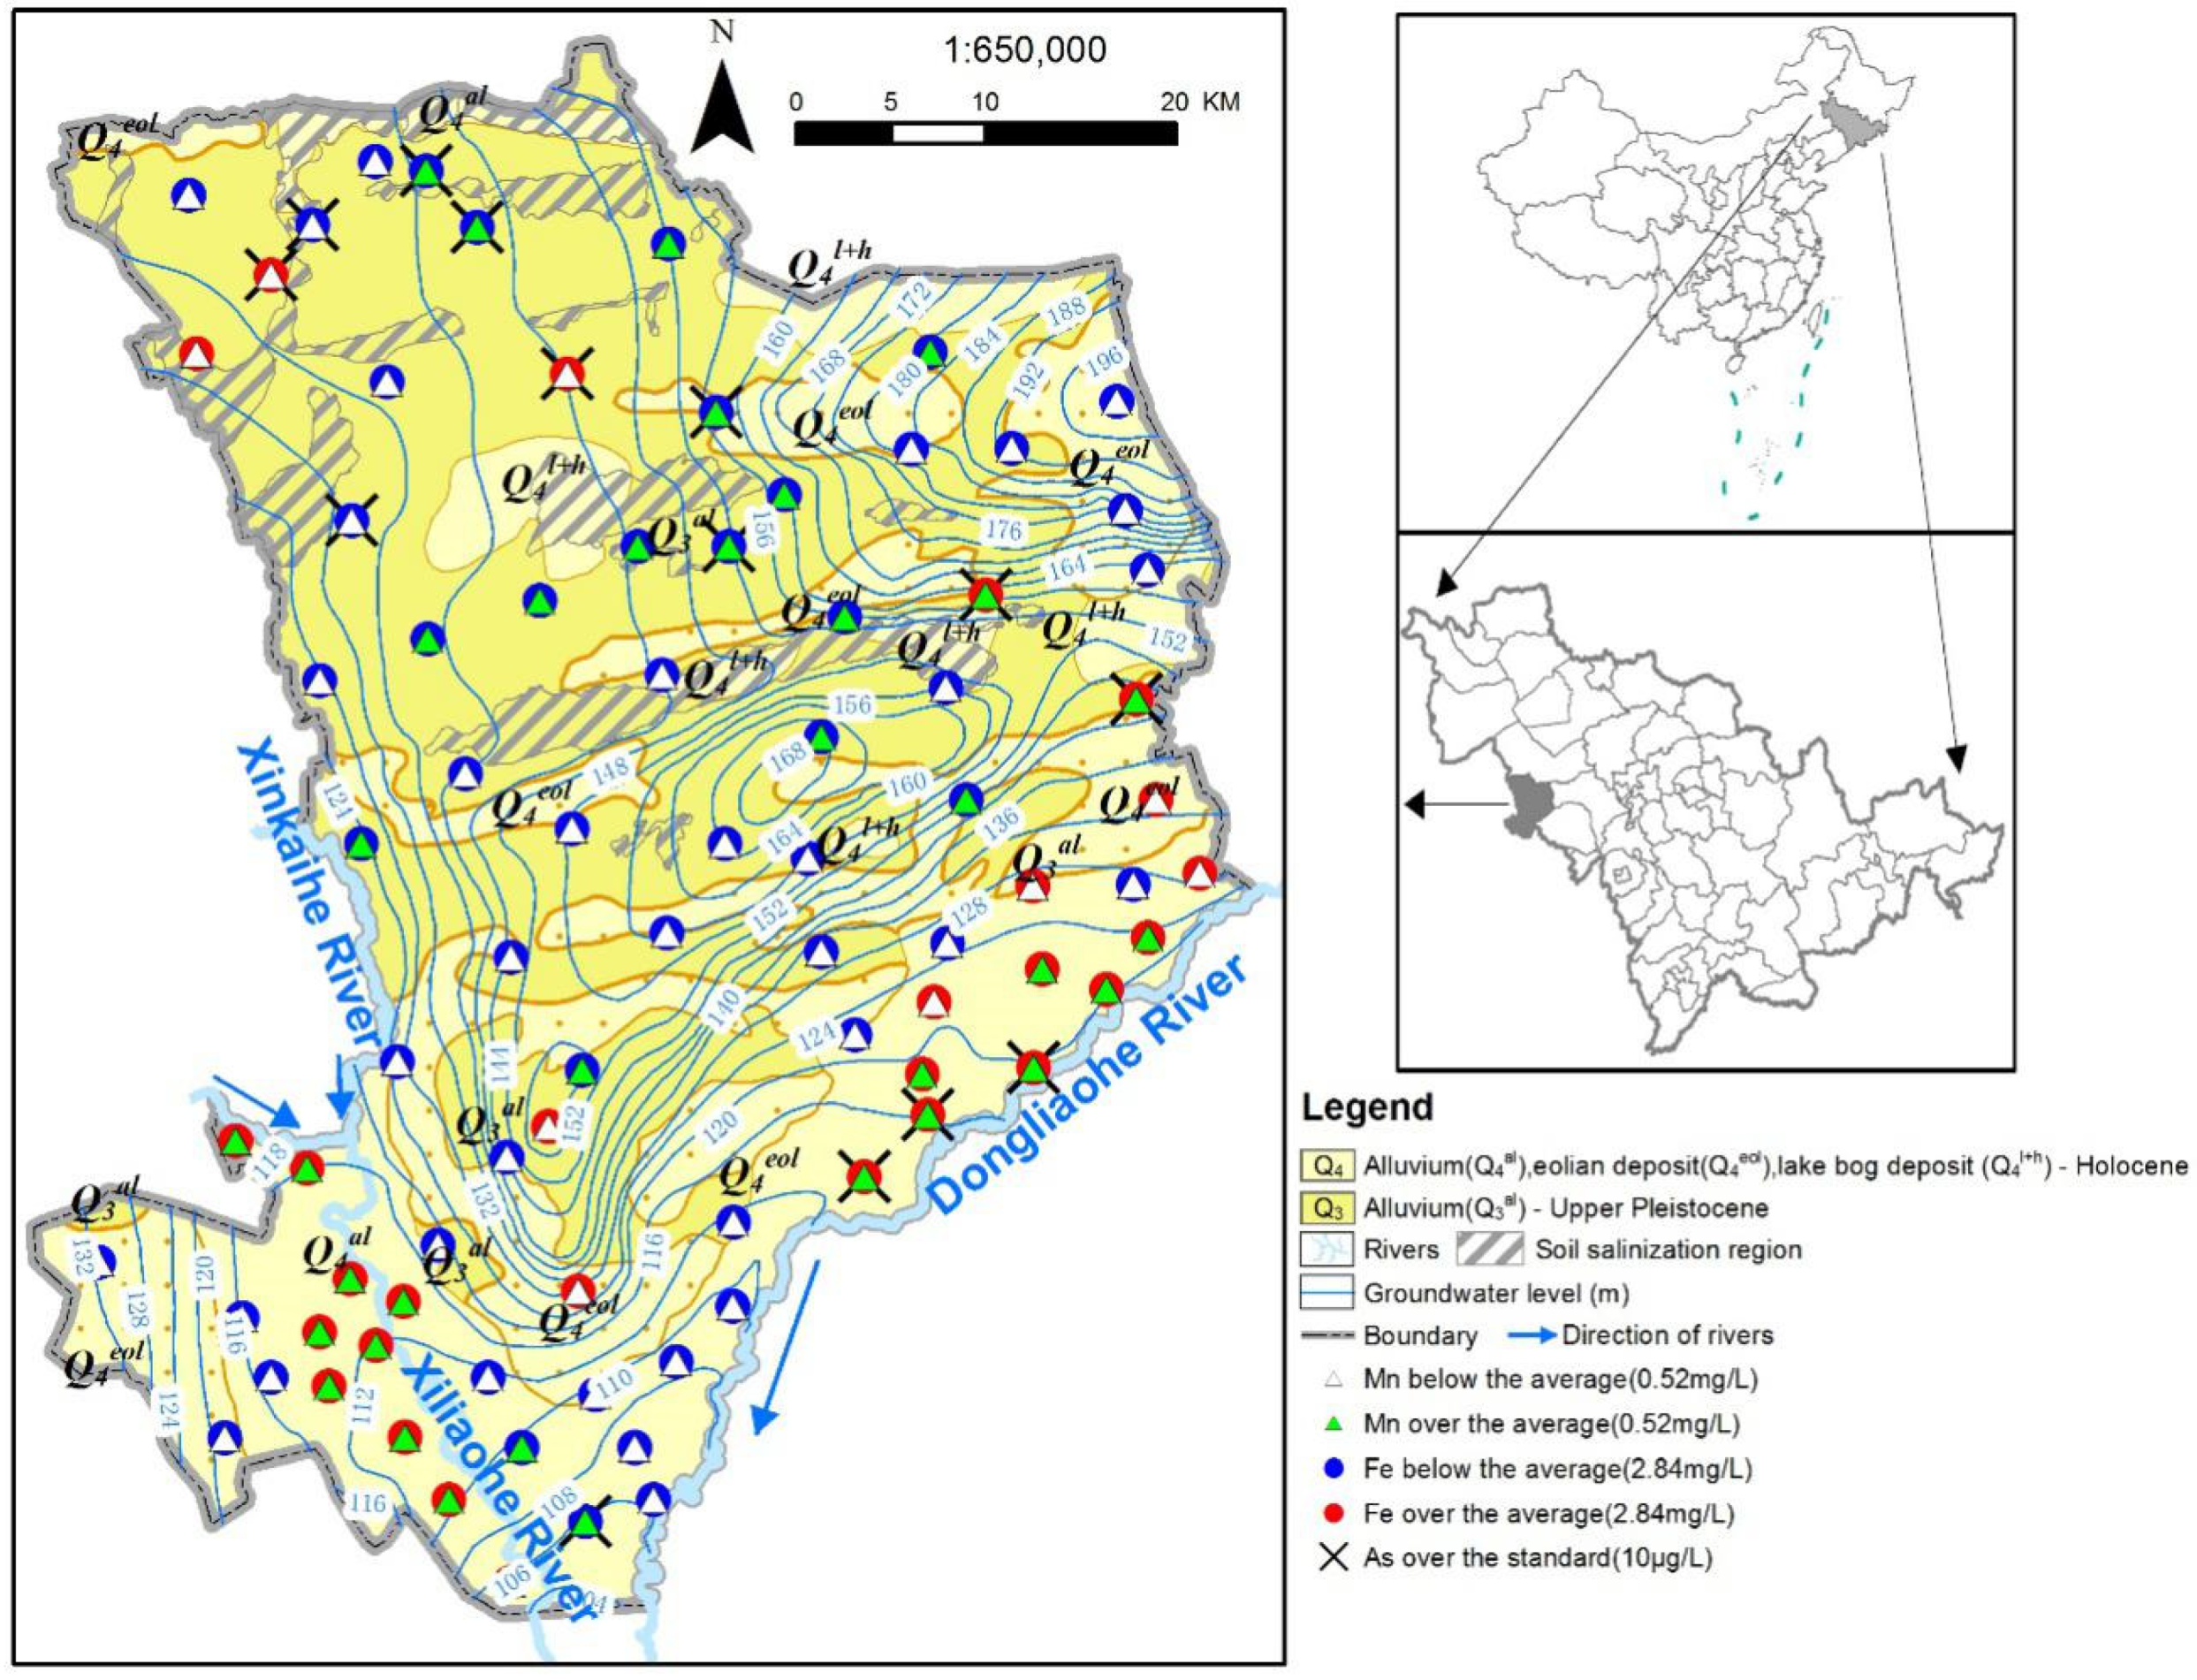
Groundwater in Shuangliao constitutes almost all drinking water for the city and counties. According to the standard for drinking water quality in China, 97.56% of all the water samples have Fe in excess, followed by 69.51% with excessive Mn and 17.00% with excessive As. The main aquifer mined in the study area is phreatic. The aquifer is composed of the lower Pleistocene fluvioglacial deposit Baitushan formation (Q1bfgl), middle Pleistocene alluvium and lake deposit Daqinggou formation (Q2dal + l), upper Pleistocene alluvium deposit Guxiangtun formation (Q3gal) and Holocene (Q4). Holocene deposits are made up of eolian fine sand (Q4eol) in sand dune, alluvial sand and gravel (Q4al) in valley, lag and bog deposits in the lakes and moors. Soil salinization is heavy in the study area, and accounts for about 10% of the study area [21] (Figure 1).
2.2. Field Work, Sample Collection and Analysis
According to the variation in groundwater level in Shuangliao city, a groundwater level survey including 961 groundwater level survey points was conducted in the rainy season and the dry season of 2017 respectively. A total of 3446 boreholes were collected from Shuangliao water resources bureau. A total of 82 hydrochemical samples from different wells were collected during rainy season in 2017. The groundwater level in the observation wells was collected every five days. The inter-annual hydrochemical data of the observation well were collected every May from 1991 to 1998, and one year hydrochemical data were collected in March, May, August and October in 2016. Plastic bottles were used for collection of the water sample. At each location, the bottle was rinsed with the water to be sampled before the water was collected. Sampling was done following the National Environmental Protection Standard (2009), where two water samples from each of these 82 wells, one acidified and the other non-acidified, were carefully collected and packaged, labeled and transported to the laboratory. The acidified water samples were used for the analysis of cations and the other non-acidified water samples for the anions. A few drops of concentrated solution of nitric acid were added to the samples at the sampling points for the purpose of keeping the ions in the solution and also to minimize the reaction with the container wall. Coordinates of each of the wells were taken during the field work. The water samples were tested by Pony Testing International Group in Changchun, China (http://www.ponytest.com). The laboratory has China Inspection Body and Laboratory Mandatory Approval (CMA) certification. Temperature and pH were measured in situ using EC/pH meter (HI99131, HANNA, Woonsocket, RI, USA) [22]. TDS was measured by an electric blast-drying oven and an electronic analytical balance (vapor-drying method) [22]. Turbidity was determined via formazine scatterometer method (WGZ-200, Xinrui, Shanghai, China); the detection limit was determined to be 0.5NTU [22]. Total hardness (TH) was measured by Na2EDTA titrimetric method; the detection limit was determined to be 1.0 mg/L [22]. were measured by acid-base titration [23]. Fe and Mn were tested by inductively coupled plasma atomic emission spectrometry (5100ICP-OES, Agilent, Santa Clara, CA, USA); the detection limits were determined to be 0.0045 and 0.0005 mg/L respectively [24]. Total As was determined by atomic fluorescence spectroscopy (SK-2003A, Jinsuokun, Beijing, China); the detection limit was determined to be 0.0010 mg/L [24]. Ammonia nitrogen was analyzed using ultraviolet-visible spectrophotometer (UV-2800, UNICO, Princeton, NJ, USA); the detection limit was determined to be 0.025 mg/L [25]. Procedural blanks and replicate samples were also analyzed in a similar way to check the accuracy of analysis. The reliability of the water sample analysis data was checked by the relative error of the anion and cation milliequivalent, and the error of all water samples was less than 5%.
2.3. Statistical and Spatial Analysis
Correlation and factor analysis were carried out between Fe, Mn, As, and some related physical and chemical parameters, using SPSS 22.0 software. Factor analysis is a widely used statistical method, which compresses the total information content of the multivariate data in terms of a few factors. Then, through the geological interpretation of these factors, the main processes affecting hydrogeochemistry can be found [26,27]. R-mode and Q-mode are two approaches of factor analysis commonly used in earth science. The purpose of this study is to explore the relationship between variables, therefore we think R-mode analysis is appropriate. See the papers [28,29] for the mathematical principles and flow diagrams of factor analysis. The influencing factors of Fe, Mn and As in groundwater were determined by correlation analysis and factor analysis.
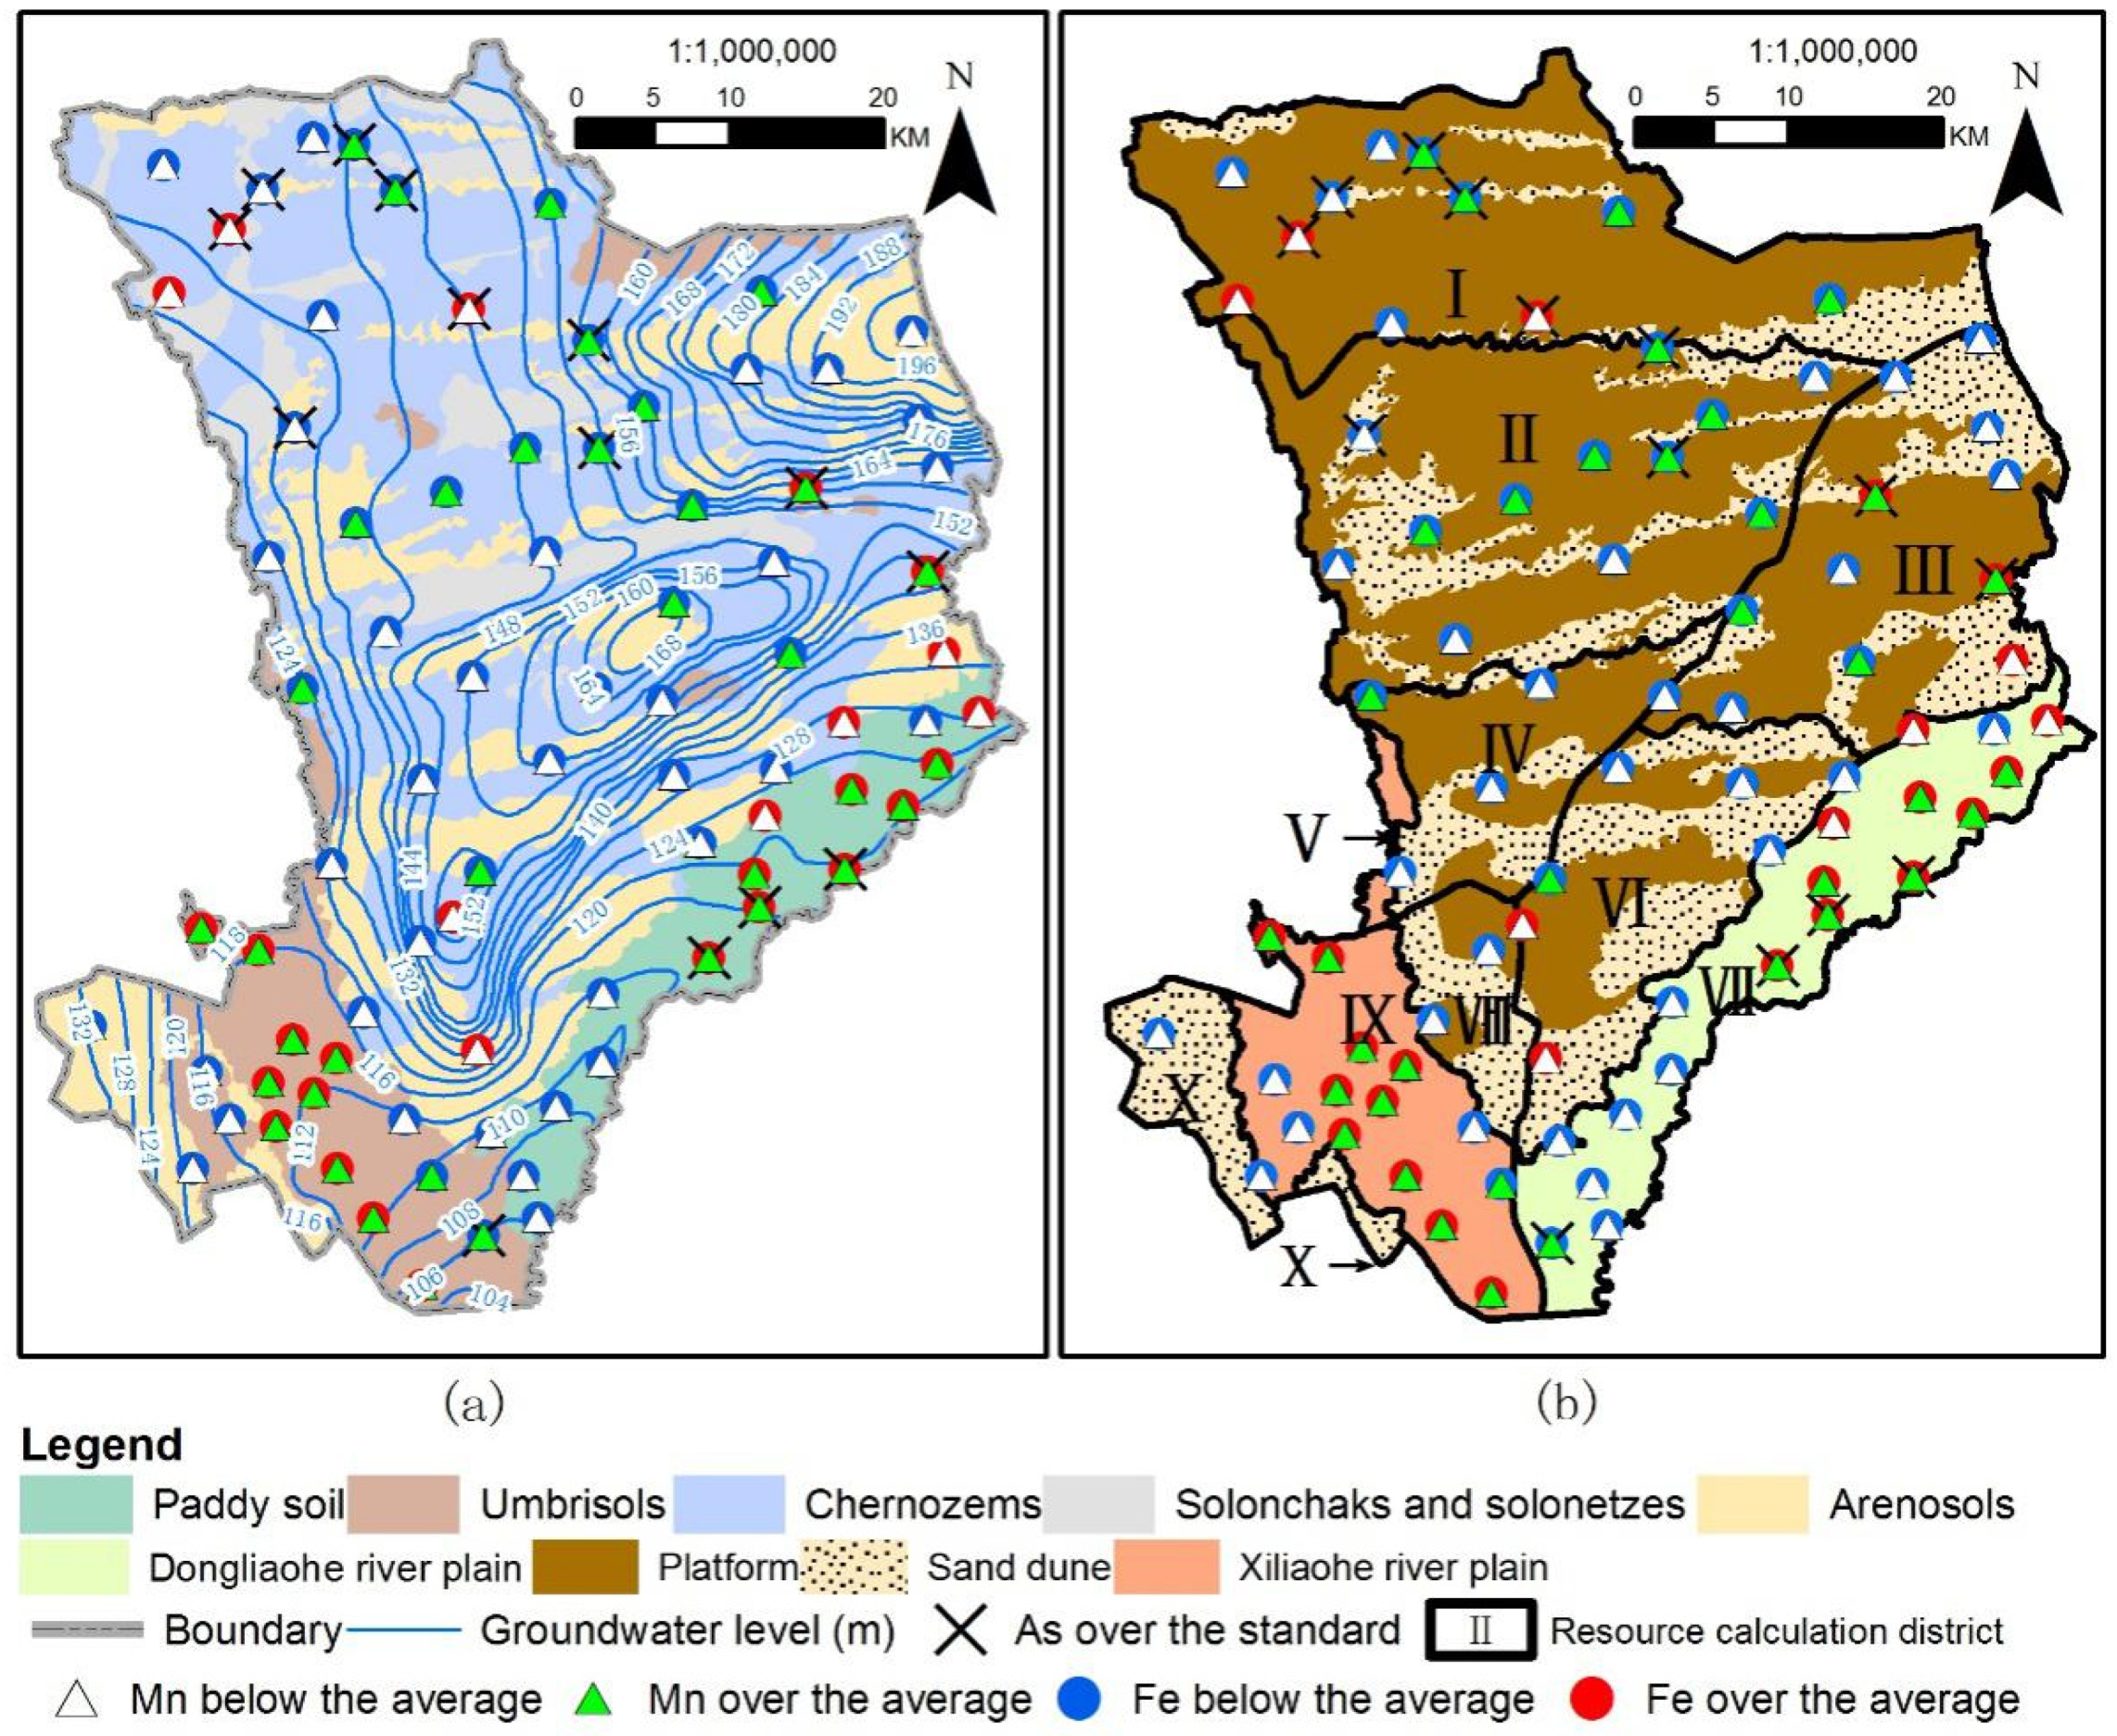
Spatial data analysis involved all 82 wells. Fe and Mn concentration were posted on thematic maps of geology (Figure 1), soil (Figure 2a), geomorphology and resource calculation districts (Figure 2b). The average Fe and Mn in different soil types and resource calculation districts are calculated. Mean values of Fe and Mn concentration in groundwater samples from different resource calculation districts and soil type districts were calculated.
3. Results
3.1. Physio-Chemical Parameters
A summary of the values obtained from laboratory and fieldwork are presented in Table 1. Fe, Mn and As in the groundwater seriously exceed the standard in the study area. The pH of groundwater is neutral-to-weak alkaline, the anion is mainly bicarbonate, and the TDS is high.
3.2. Correlation Matrix
It can be seen from Figure 2b that high iron and manganese (above average) levels in Shuangliao city are mainly distributed in the valley plain of Dongliaohe River and Xiliaohe River. The differences in correlation coefficients in Table 2 and Table 3 indicate that the sources of iron and manganese in groundwater in platforms and river valleys are different [5].
The Pearson correlation of groundwater obtained from the platform shows that Fe was positively correlated with TDS and TH (r = 0.59 and r = 0.71, p < 0.01, respectively), while Mn was positively correlated with TDS, r = 0.34, p < 0.05. A similar result was observed in the river valley. Fe was positively correlated with TDS and TH, with r = 0.61 and r = 0.58, p < 0.01, respectively. Mn had a positive correlation of r = 0.69 and 0.69, p < 0.01 with TDS and TH, respectively. This suggests that elevated iron and manganese concentrations in groundwater are associated with the influence of salinity [3]. In the platform, Fe and Mn have a negative correlation with pH (r = −0.33, p < 0.05 and r = −0.28, respectively). This was also observed in the river valley (r = −0.37, p < 0.05 and r = −0.3 respectively), indicating that acidic conditions in the groundwater promote the release of Fe and Mn into the groundwater [30]. On the platform, As is positively correlated with TDS, r = 0.32, p < 0.05. This is because the salinization of groundwater can promote the release of As in reducing aquifers [14,31]. On the platform, As is also positively correlated with Mn, r = 0.36, p < 0.05. In the river valley, the correlation coefficient between As and Fe is 0.24, and 0.25 between As and Mn. This is because arsenic has a strong geochemical affinity with iron manganese hydroxide [32,33]. The correlation between As and WLF is 0.21, suggesting that changing water levels alters the redox state of groundwater, prompting the release of arsenic [34].
In the river valley, the well depth is negatively correlated with Fe and Mn (r = −0.50 and r = −0.51, p < 0.01, respectively). This is because the source of Fe and Mn in river valley groundwater is soil and an aquifer, which will be discussed in detail later. Fe and Mn are positively correlated with bicarbonate at p < 0.05 or p < 0.01 (Table 2 and Table 3). A similar positive correlation is observed between Fe and Mn with ammonia on the platform (r = 0.51, p < 0.01 and 0.48, respectively) as well as in the river valley (r = 0.52, p < 0.01 and 0.39, respectively). This is caused by the reductive dissolution of Fe and Mn. Ammonia indicates that the groundwater is in a reducing condition. The dissolution of Fe and Mn oxides in the aquifer is at the cost of the oxidation of organic matter [15,16], and the bicarbonate will increase. The reaction equation is as follows:
3.3. Factor Analysis
The factor analysis for the platform shows that three factors account for 60.89% of the variation in the data (Table 4). Factor 1 accounts for 27.44% of the variation. This factor shows the inorganic sources of iron in groundwater, as shown earlier by the correlation matrix. Factor 2 explains 18.85% of the variation. This factor indicates the effect of fluctuations in groundwater level. This suggests that changes in pH and redox state caused by seasonal groundwater level fluctuations dissolve Mn complexes and release arsenic adsorbed on them into groundwater [35]. Factor 3, which accounts for 14.60% of the variation, is the positive loading of well depth and turbidity. This factor is related to geology. The lithology of the aquifer on the platform is silt and fine sand; the particle is very fine. Due to the limitations of drilling technology and cost, the filters in the well do not filter the silty sand very well. The deeper the well, the thicker the aquifer, and the more siltty and turbid the water becomes.
The factor analysis for the River Valley shows that three factors account for 79.22% of the variation in the data (Table 5). Factor 1 explains 38.91% of the variance. This factor represents the effect of pH on the dissolution of Fe and Mn. Factor 2 accounts for 26.25% of the variance. This factor displays mineralization of groundwater, as earlier shown by the correlation matrix. Factor 3 explains 14.06% of the variance. This factor indicates the relationship between water-level fluctuation and arsenic in groundwater.
4. Discussion
4.1. Source of Fe and Mn
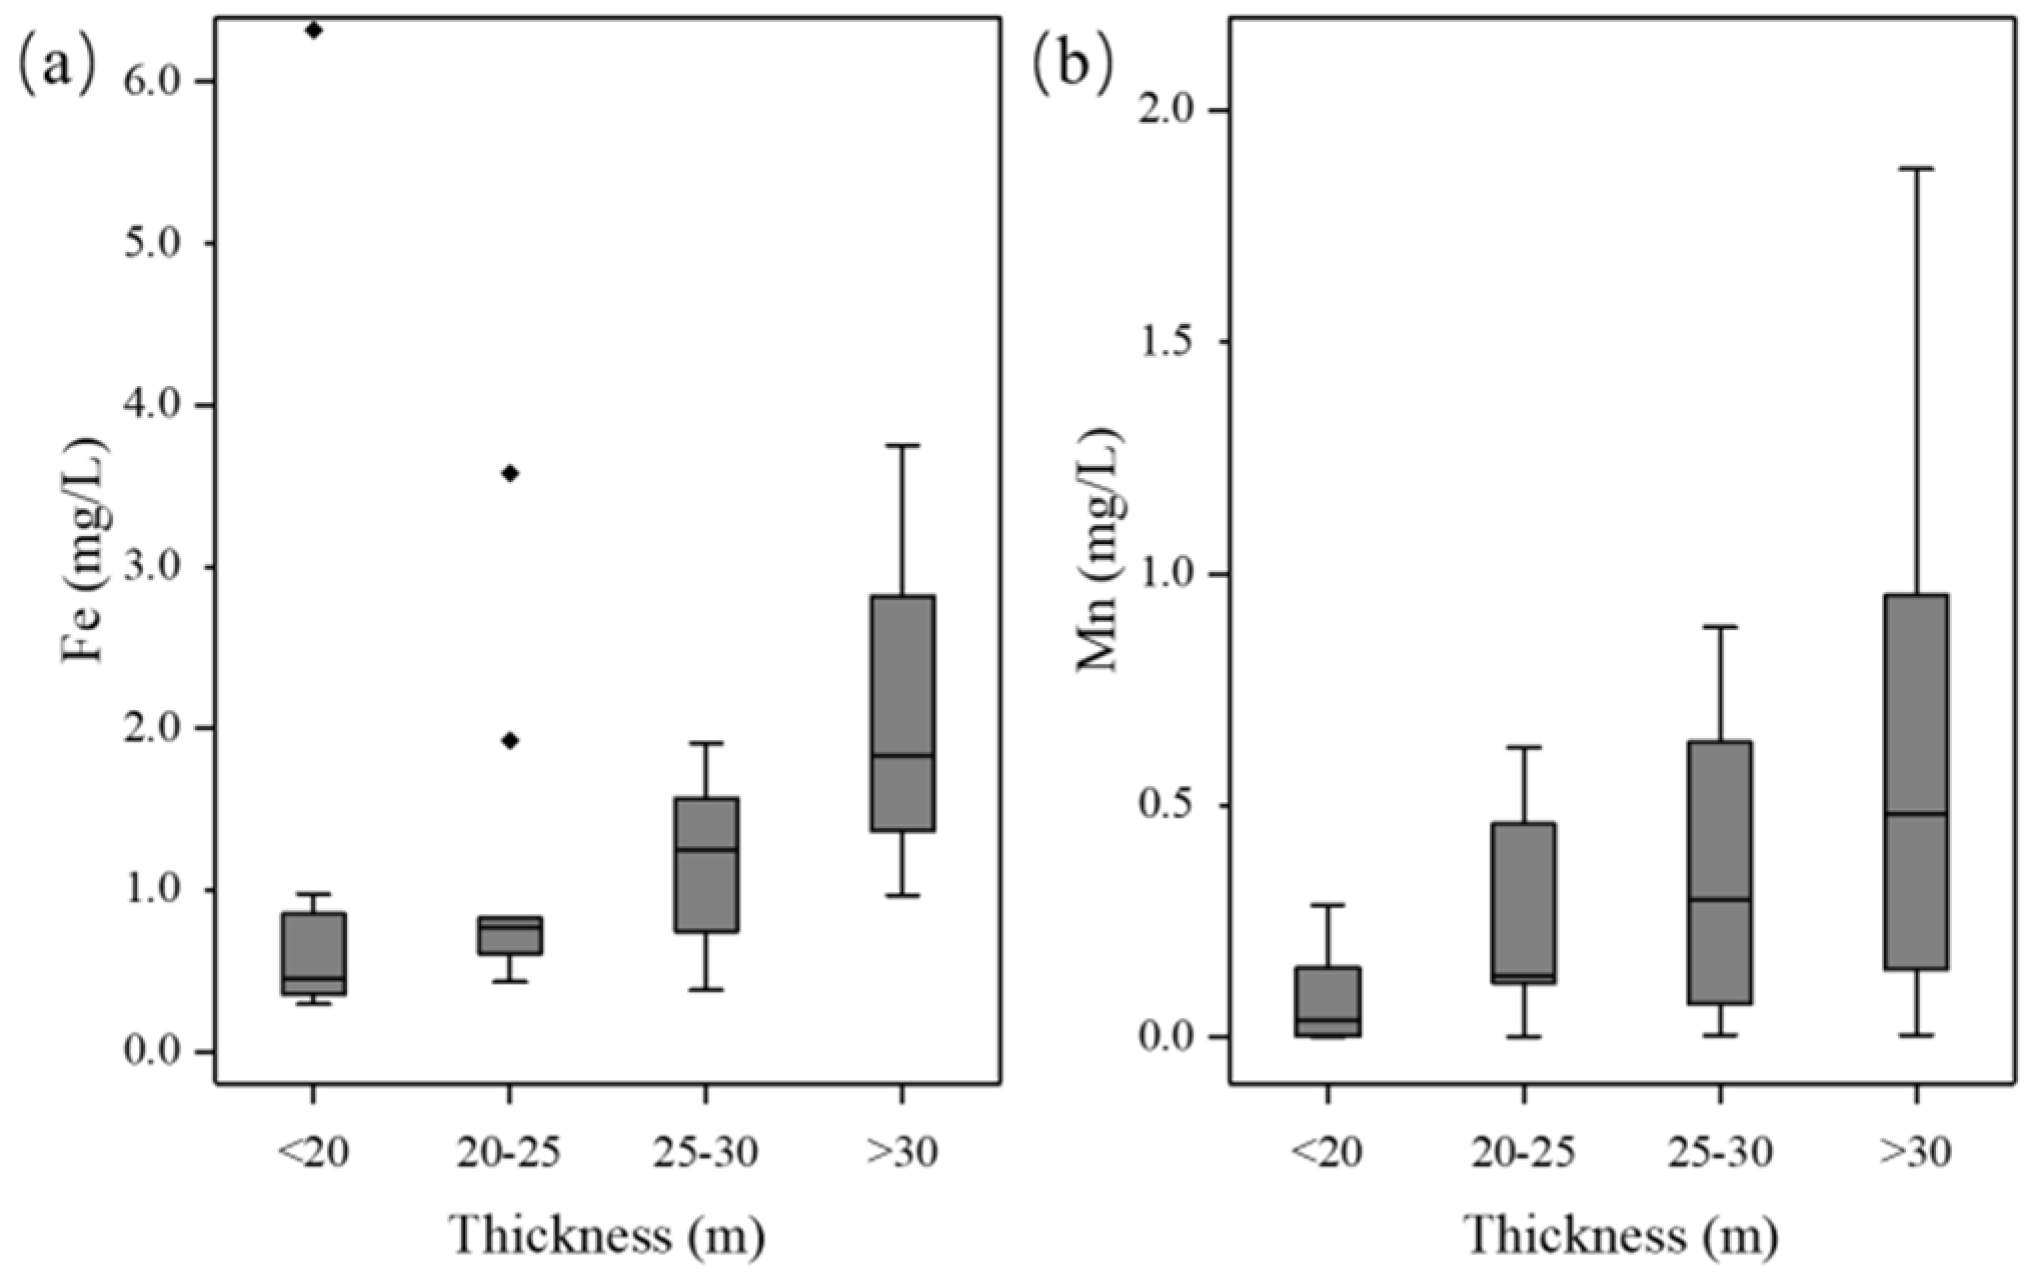
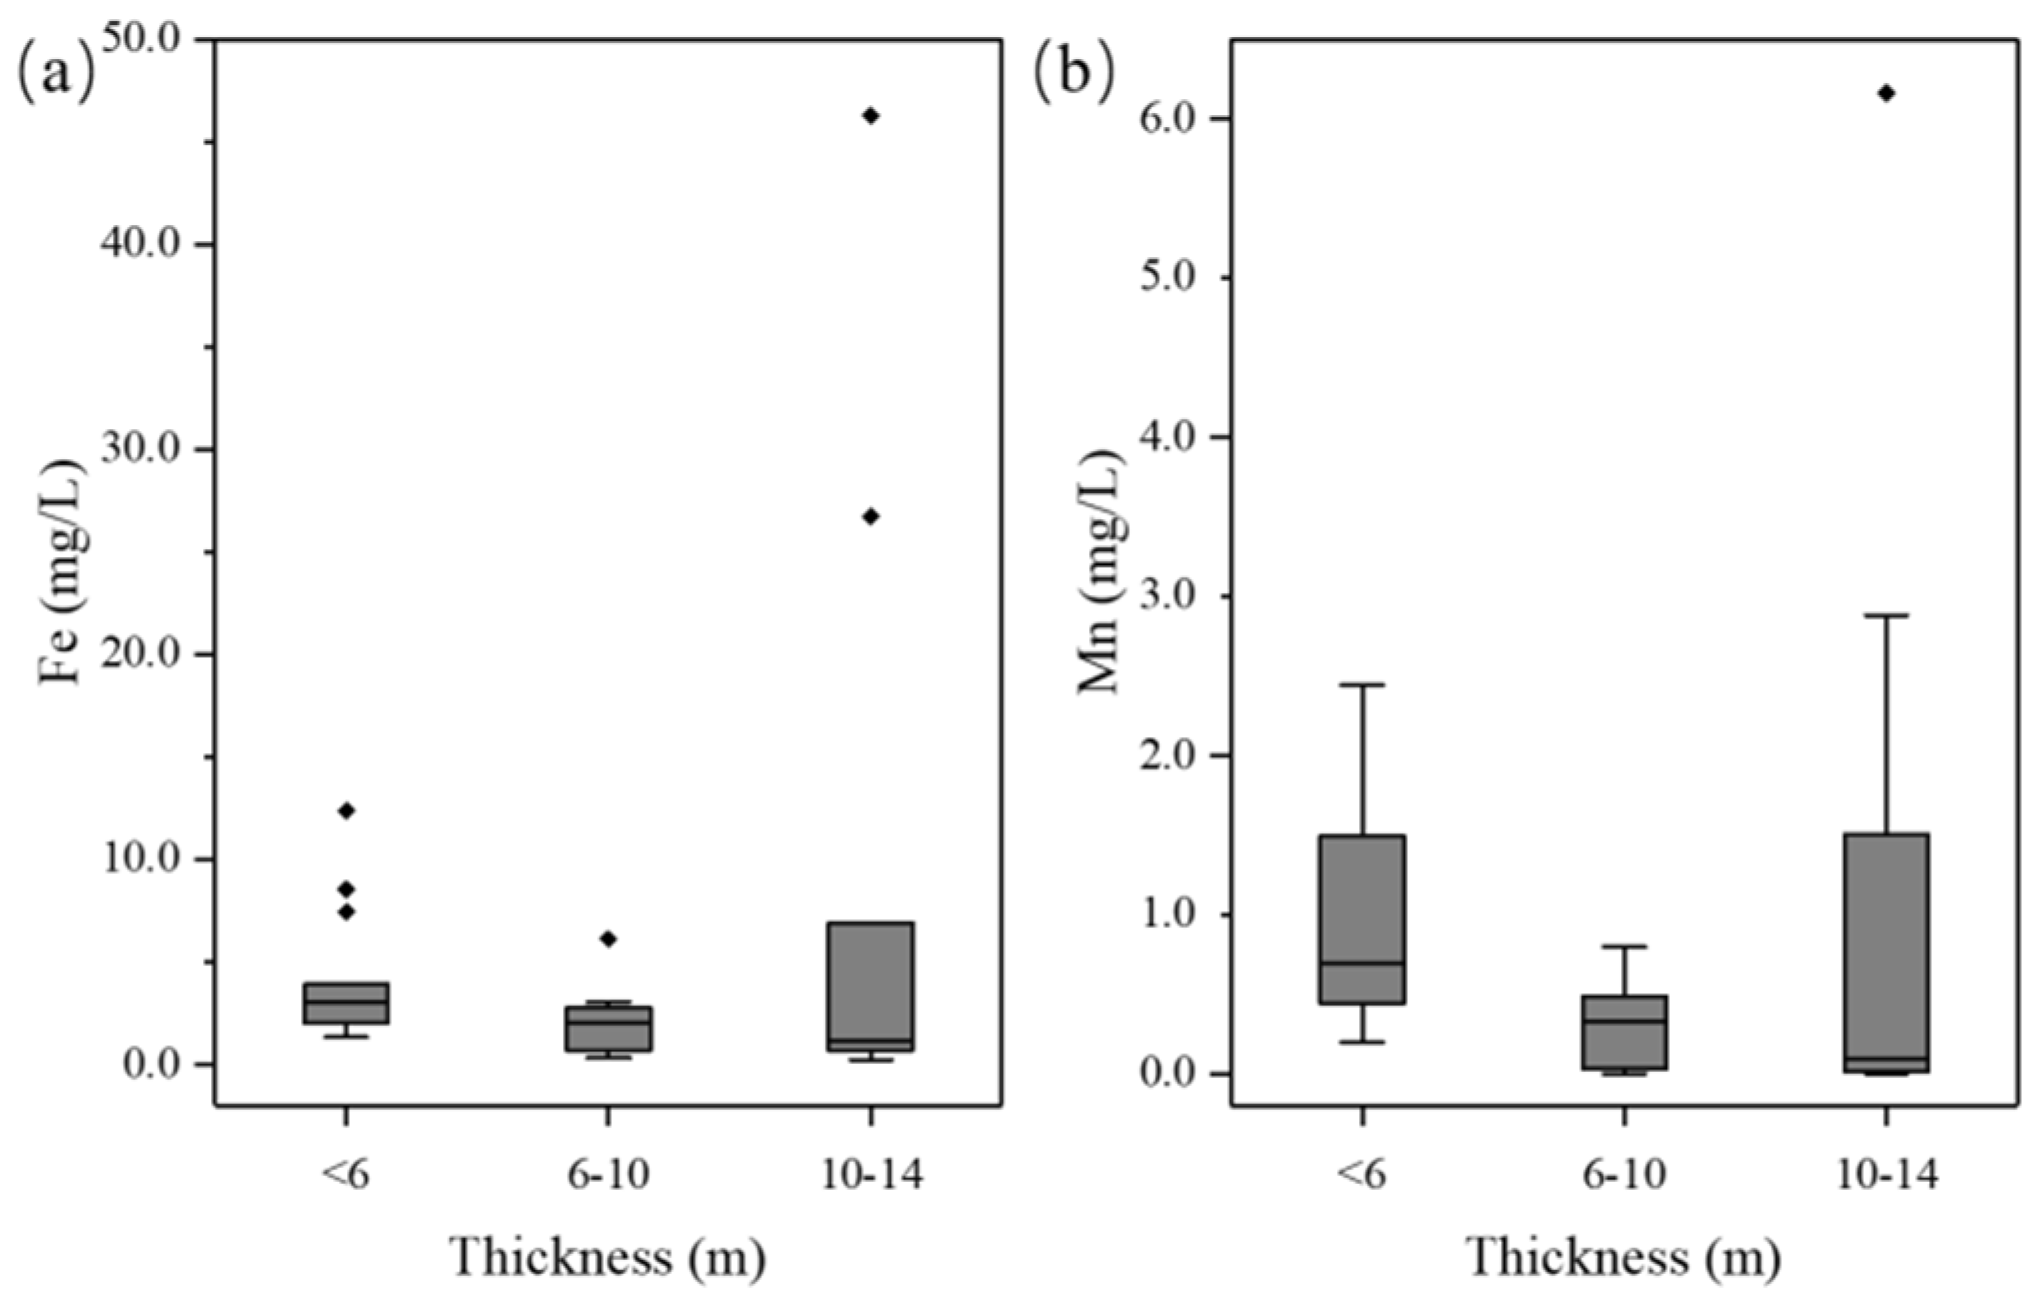
Several main factors affect the content of iron and manganese in groundwater in Shuangliao city is Fe and Mn substances and organic matter deposited during the Holocene. It has been observed in field investigation that once colorless groundwater is extracted from wells, it will appear red or yellow after a short time of contact with air. This indicates that the groundwater is in a reduced state [5]. A microbially mediated redox process, controlled by organic matter, can lead to the mobilization of Fe, Mn and As into groundwater [13,36,37]. This reduction environment is fostered by the combination of fine-grained sediments and organic matter [17]. Iron and manganese from soil and aquifers will be released into groundwater under these conditions [38]. The lithology of platform in Shuangliao city is Quaternary deposits. The aquifer is made up of mid-Pleistocene (Q2d), and upper Pleistocene (Q3g). Daqinggou formation (Q2d) is mainly made up of grey and green silty sub-clay which is frequently alternated with silt sand. Iron and manganese nodules can be found in the clay. Guxiangtun formation (Q3g) is composed of loess-like clay in the upper part, which exhibits iron contamination and large amounts of iron and manganese nodules. The lower part is mainly composed of sub-clay, silty sub-clay and fine sand. The presence of organic carbon in clays and sub-clays of aquifers causes the reductive dissolution of Fe and Mn minerals [2]. To prove this point, a diagram of the relationship between the Fe and Mn content in water samples and the clay thickness of the aquifer in the sampling well was made in this study. The approximate clay thickness of the sampling well was determined from collected 3446 boreholes. It can be seen from the boxplot that the content of iron and manganese in well water increases with the increase in clay thickness (Figure 3). However, there was no correlation between the concentration of iron and manganese in the river valley groundwater and the thickness of the clay (Figure 4).
In addition, the concentration and correlation of iron and manganese in the river valley and platform are also quite different. These all show that Fe and Mn have a different source in the river valley and platform. The river valley plain sediments are relatively new and contain many organic substances. Study [36] noted that Fe and Mn are mainly found in organic matter, plant debris and soil. The oxidation of organic matter causes iron and manganese minerals to dissolve in aquifers [39,40,41]. Thus, the source of Fe and Mn in valley groundwater is not only clay, but the whole aquifer.
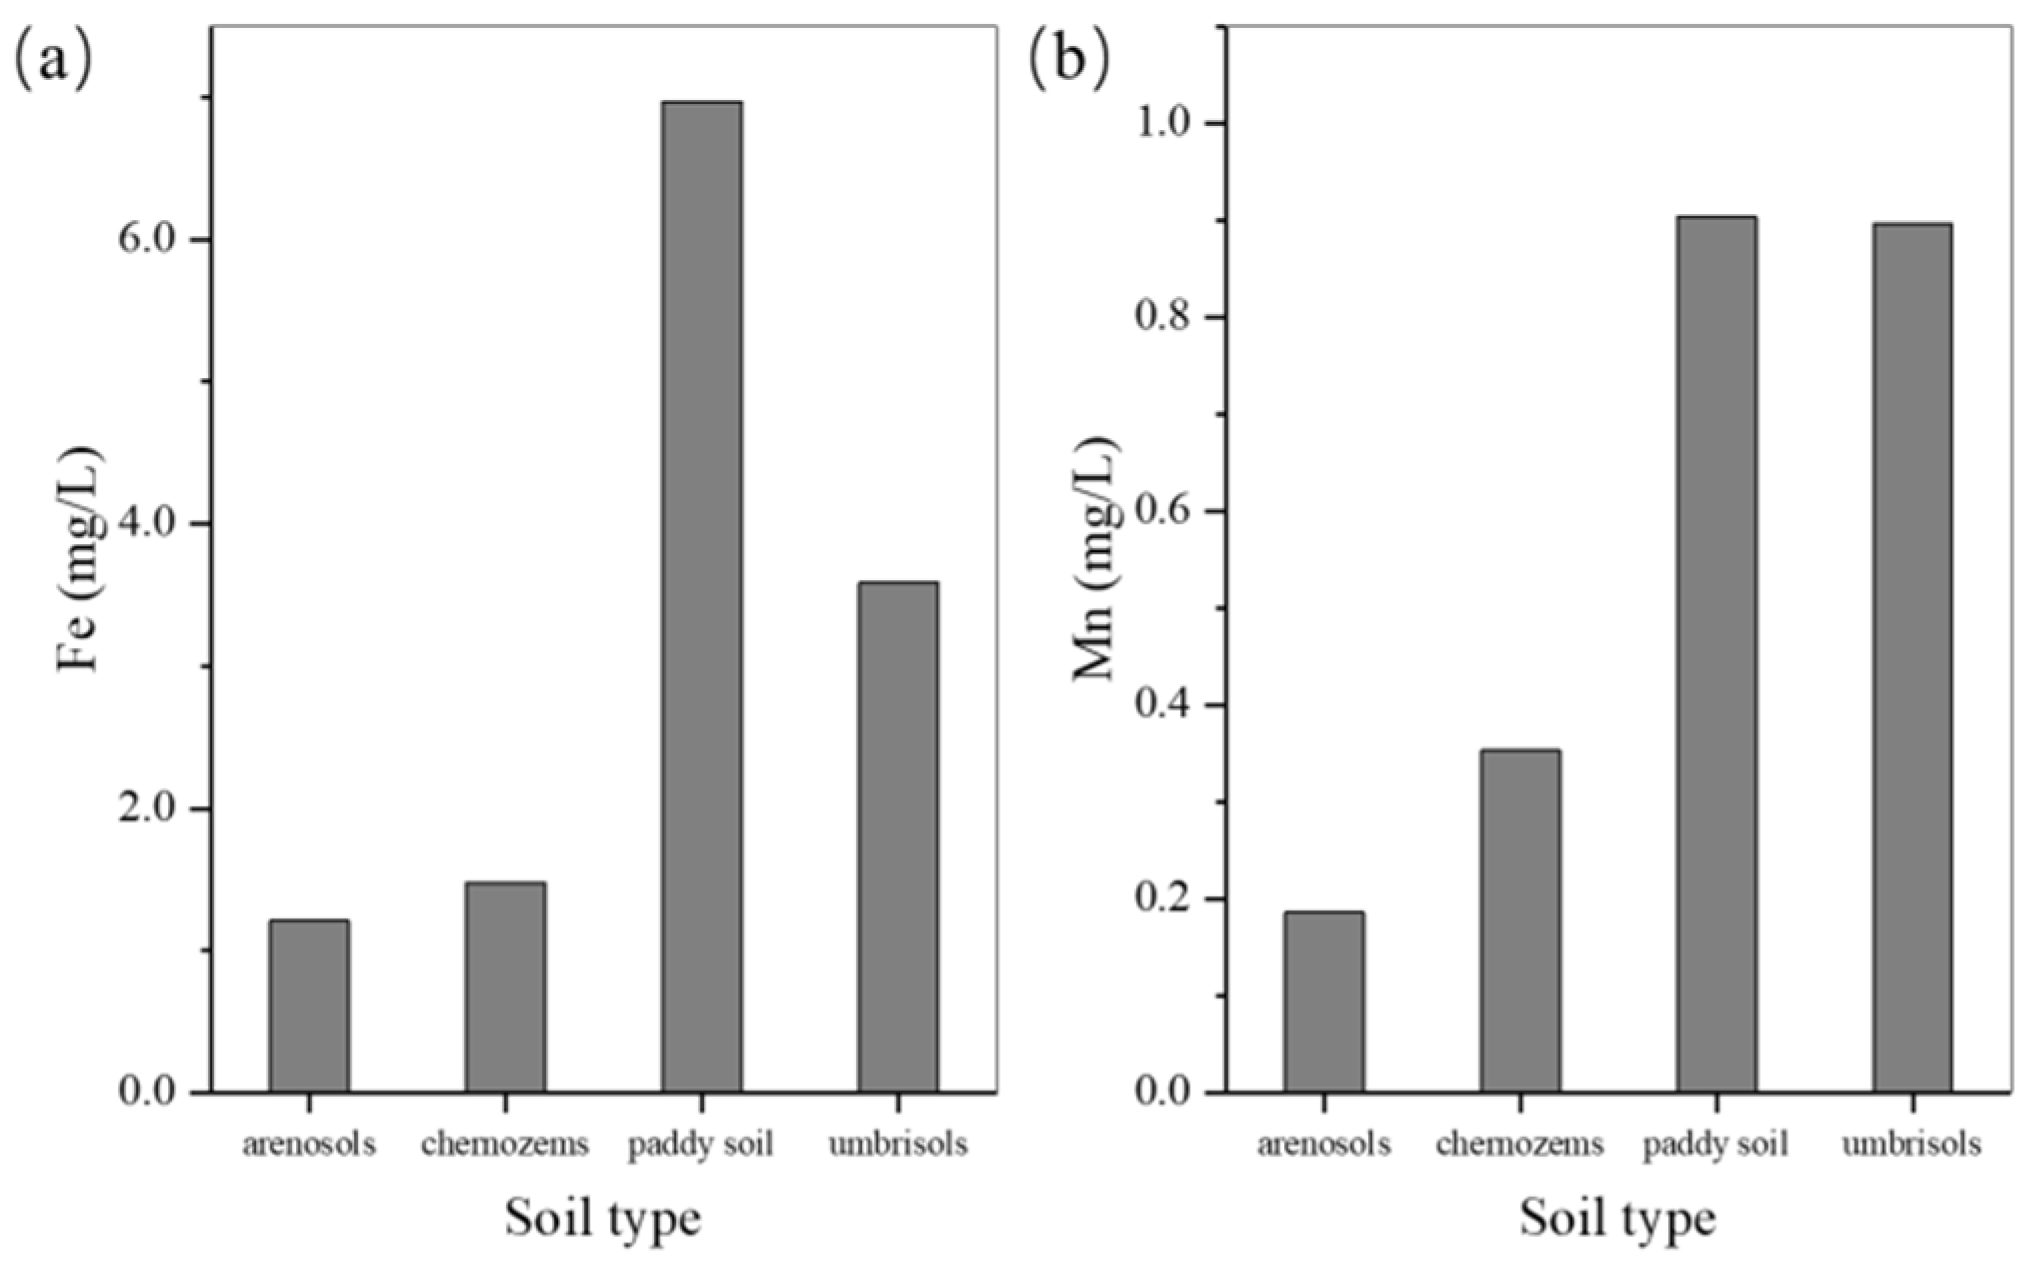
There are also soil sources of Fe and Mn in the groundwater of river valley. The correlation matrix (Table 3) shows that well depth has a negative medium correlation with Fe and Mn. The mean value of Fe and Mn concentration in different soil types are shown in Figure 5. The mean value of Fe and Mn in water samples, as distributed on respective soil types of the area, is in the order paddy soil > umbrisols > chernozems > arenosols. Studies [21,42] also show that the concentration of Fe in different soil types is in the same order. The soil type in Xiliaohe River valley is umbrisols (Figure 2a). This kind of soil is rich in humus, which fosters anoxic conditions that foster Fe and Mn mobilization. In umbrisols, the water-logging process involves alternating oxidation and a reduction in soil caused by the seasonal rise and fall of groundwater, leading to the formation of Fe–Mn nodules or rust spots and other new bodies. This process is common in the umbrisols, with a high groundwater level in the valley plain, and is the main geochemical feature of umbrisol formation [43]. The Dongliaohe River valley plain has a long history of rice cultivation. Paddy soils are widely distributed in rice-growing areas (Figure 2a). Under the condition of artificial periodic submerging and draining, paddy soil was kept in the process of redox alternation for a long time, and underwent a series of unique biochemical changes [44]. This is the basic formation process of paddy soil. Long-term submerged conditions are favorable for soil organic matter deposition. The input of inorganic and organic fertilizers continuously increases the organic content of soil. The iron and manganese oxides in the ploughing layer were reduced to low valence iron and manganese compounds under submerging conditions and entered the groundwater with the water under the action of gravity [37,45].
4.2. Effect of Groundwater Level Fluctuation on Fe and Mn
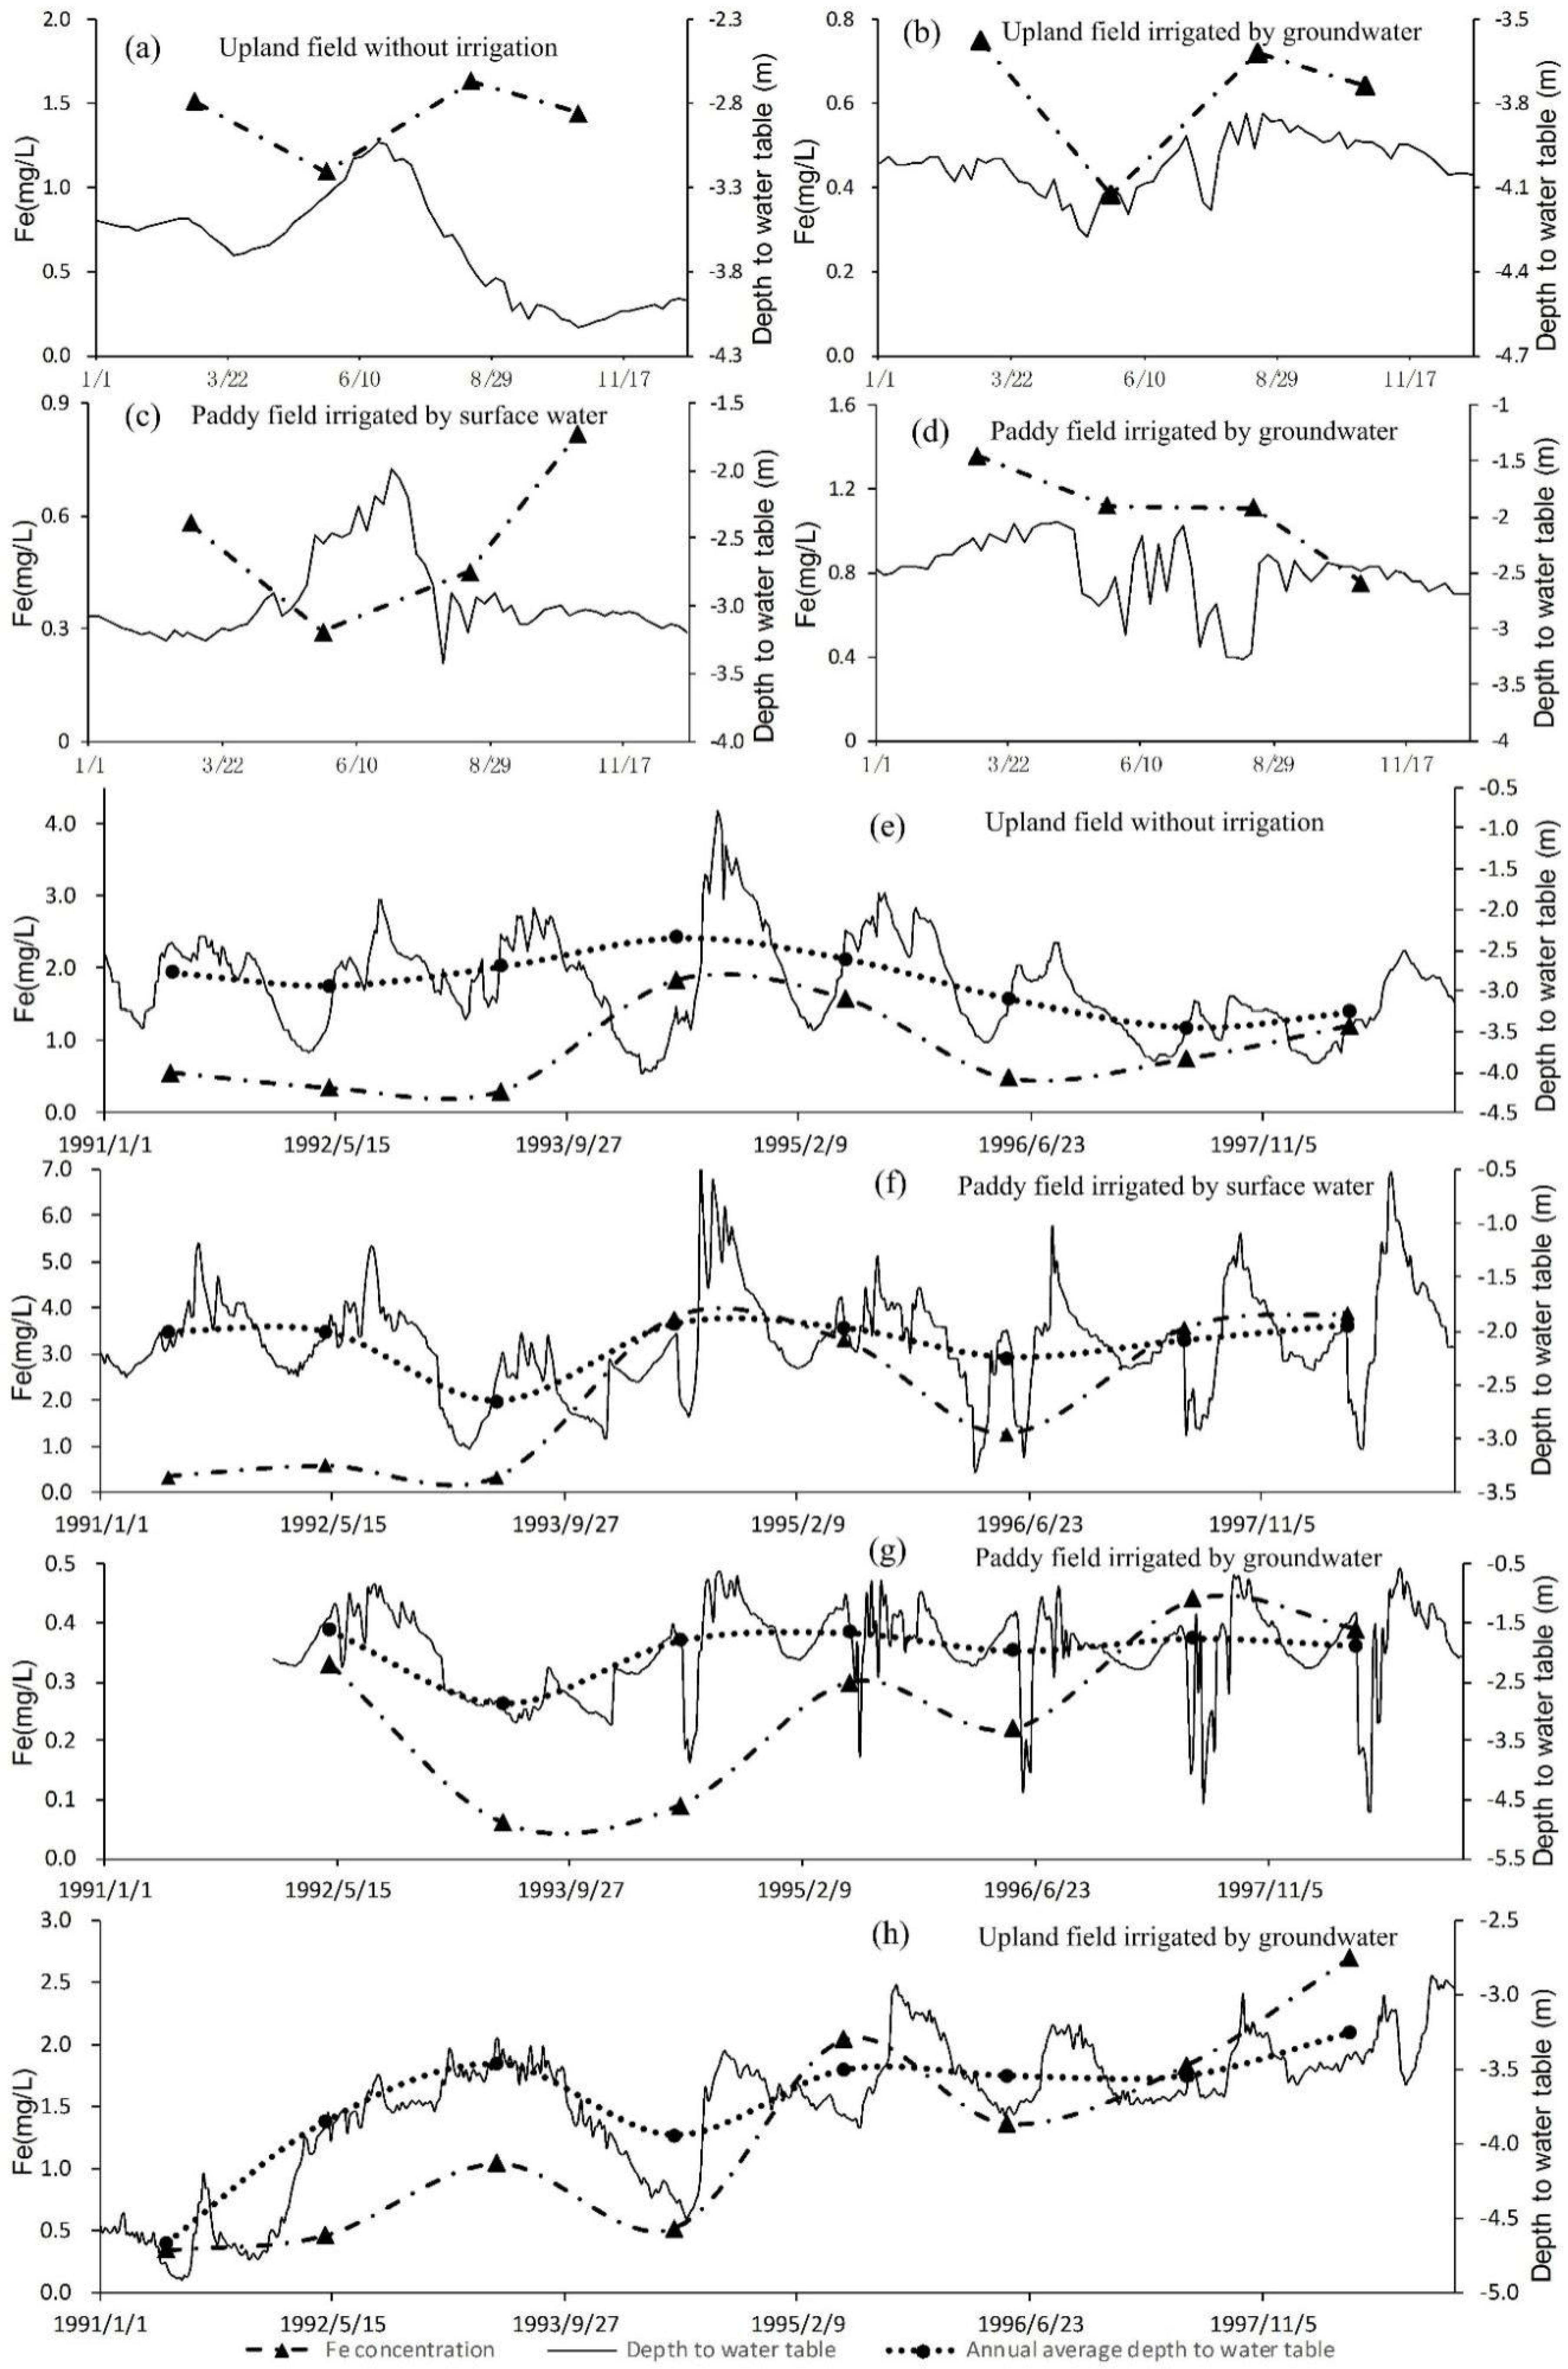
At present, it is generally accepted that there are four ways for oxygen to enter shallow groundwater: vertical infiltration of oxygen-containing precipitation, infiltration of oxygen-containing surface water, diffusion of air in the vadose zone, and gas capture caused by fluctuation of groundwater level caused by intermittent operation of exploitation wells [46,47]. The dynamic of groundwater in the study area is mainly influenced by precipitation and human activities (mostly irrigation and exploitation). Different groundwater dynamic types represent different ways in which oxygen enters shallow groundwater. According to the formation mechanism, the groundwater dynamics in the study area can be divided into four types, that is, the upland field without irrigation (Figure 6a,e), the upland field irrigated by groundwater (Figure 6b,h), the paddy field irrigated by surface water (Figure 6c,f), and the paddy field irrigated by groundwater (Figure 6d,g).
In paddy fields irrigated by groundwater, Fe decreases significantly after irrigation begins. This is caused by the thickening of the vadose zone and the infiltration of oxygenated river water and irrigation water. During the irrigation period (groundwater exploitation period), Fe concentration is relatively stable. After groundwater exploitation stops, as groundwater levels rise rapidly, air entrapment dissolves due to increased hydrostatic pressure, making it an important source of oxygen. Therefore, the concentration of Fe decreased during the recovery period of groundwater although the vadose zone thinned. In paddy fields irrigated by surface water, Fe concentration decreases as irrigation begins. This is because oxygenated surface water enters the aquifer and oxidizes it. When irrigation stops, the source of oxygen is cut off, the reducibility of aquifer is enhanced, and the content of iron is increased. The annual changes in the concentration of Fe in groundwater have a good correlation with the thickness of the vadose zone, regardless of whether the upland field is irrigated. This is consistent with previous studies [47], that is, gas capture and surface water infiltration are important oxygen input mechanisms, while the oxygen input by the infiltration of rainwater and the diffusion of air in the vadose zone is negligible. The long-term observation of groundwater table depth and hydrogeochemistry shows that the concentration of Fe has a good correlation with the annual average depth of water table. When the groundwater level rises, the bottom of the vadose zone becomes saturated, the dissolved oxygen in the aquifer decreases and the reducibility increases.
Similarly, the upper plain of Dongliaohe River is irrigated by the river, and the groundwater table depth is shallower in the irrigation period (usually 0.4–3 m). However, the lower plain is irrigated by groundwater and the groundwater table depth is deeper (usually 4–8 m). The deep depth of water table makes the groundwater in plain downstream more oxidized than in the upstream. In addition, the lower water table causes the groundwater in the lower plain to be recharged by the river with lower Fe and Mn content [2]. Therefore, the Fe and Mn in the plain downstream is lower than that upstream (Figure 2b).
4.3. Effect of TDS on Fe and Mn
The TDS in the study area was high, with an average of 838 mg/L. Under the influence of salt effect, the increase in TDS leads to an increase in ionic strength and a decrease in activity coefficient, which will dissolve more Fe and Mn in groundwater. Fe and Mn ions can also form inorganic complexes with anions in water (such as , , , , etc.), thereby increasing their solubility in water [2]. Free ions of Fe and Mn can be calculated by the following formula:
The hydrochemistry data of water samples with TDS close to the mean value were selected for calculation, and the results showed that and . This indicates that the concentration of Fe and Mn can be significantly increased under the effect of inorganic complexes. This is also reflected in the correlation analysis and factor analysis above.
4.4. Effect of Residence Time on Fe and Mn
As mentioned earlier, the residence time of groundwater in aquifers can affect the concentration of Fe and Mn. The residence time of groundwater reflects the renewability of groundwater. The renewability of groundwater systems depends largely on the quantity and quality of aquifer recharge [48]. Turnover time (a) is an indicator of groundwater renewal capacity [49]. It refers to the ratio between the total storage of groundwater in aquifer (m3) and the amount of groundwater system recharge per unit time (m3/a). This method has been used in many places [50]. Therefore, in order to measure the impact of groundwater residence time on iron and manganese in aquifers, groundwater turnover time is taken as the factor reflecting groundwater residence time in this study. Its formula is
where T is turnover time (T), Q is the total storage of groundwater in aquifer (L3), Qr is the groundwater system recharge per unit time (L3/T), A is the horizontal area of an aquifer (L2), H is the thickness of the saturated zone (L), and μ is the specific yield of the aquifer.
According to the topographic, geomorphic and geological characteristics, the research area was divided into 10 resource calculation districts (Figure 2b); the respective Q, Qr, and T parameters were calculated separately. The Fe and Mn concentrations in each resource calculation district are represented by the mean concentration of Fe and Mn at sampling points within the district (Table 6). Because the formation of Fe and Mn in river valley is more complicated than that in the platform and is greatly affected by human activities, the calculation district in the river valley does not participate in the discussion. Three areas with too few or no water samples were not included in the discussion.
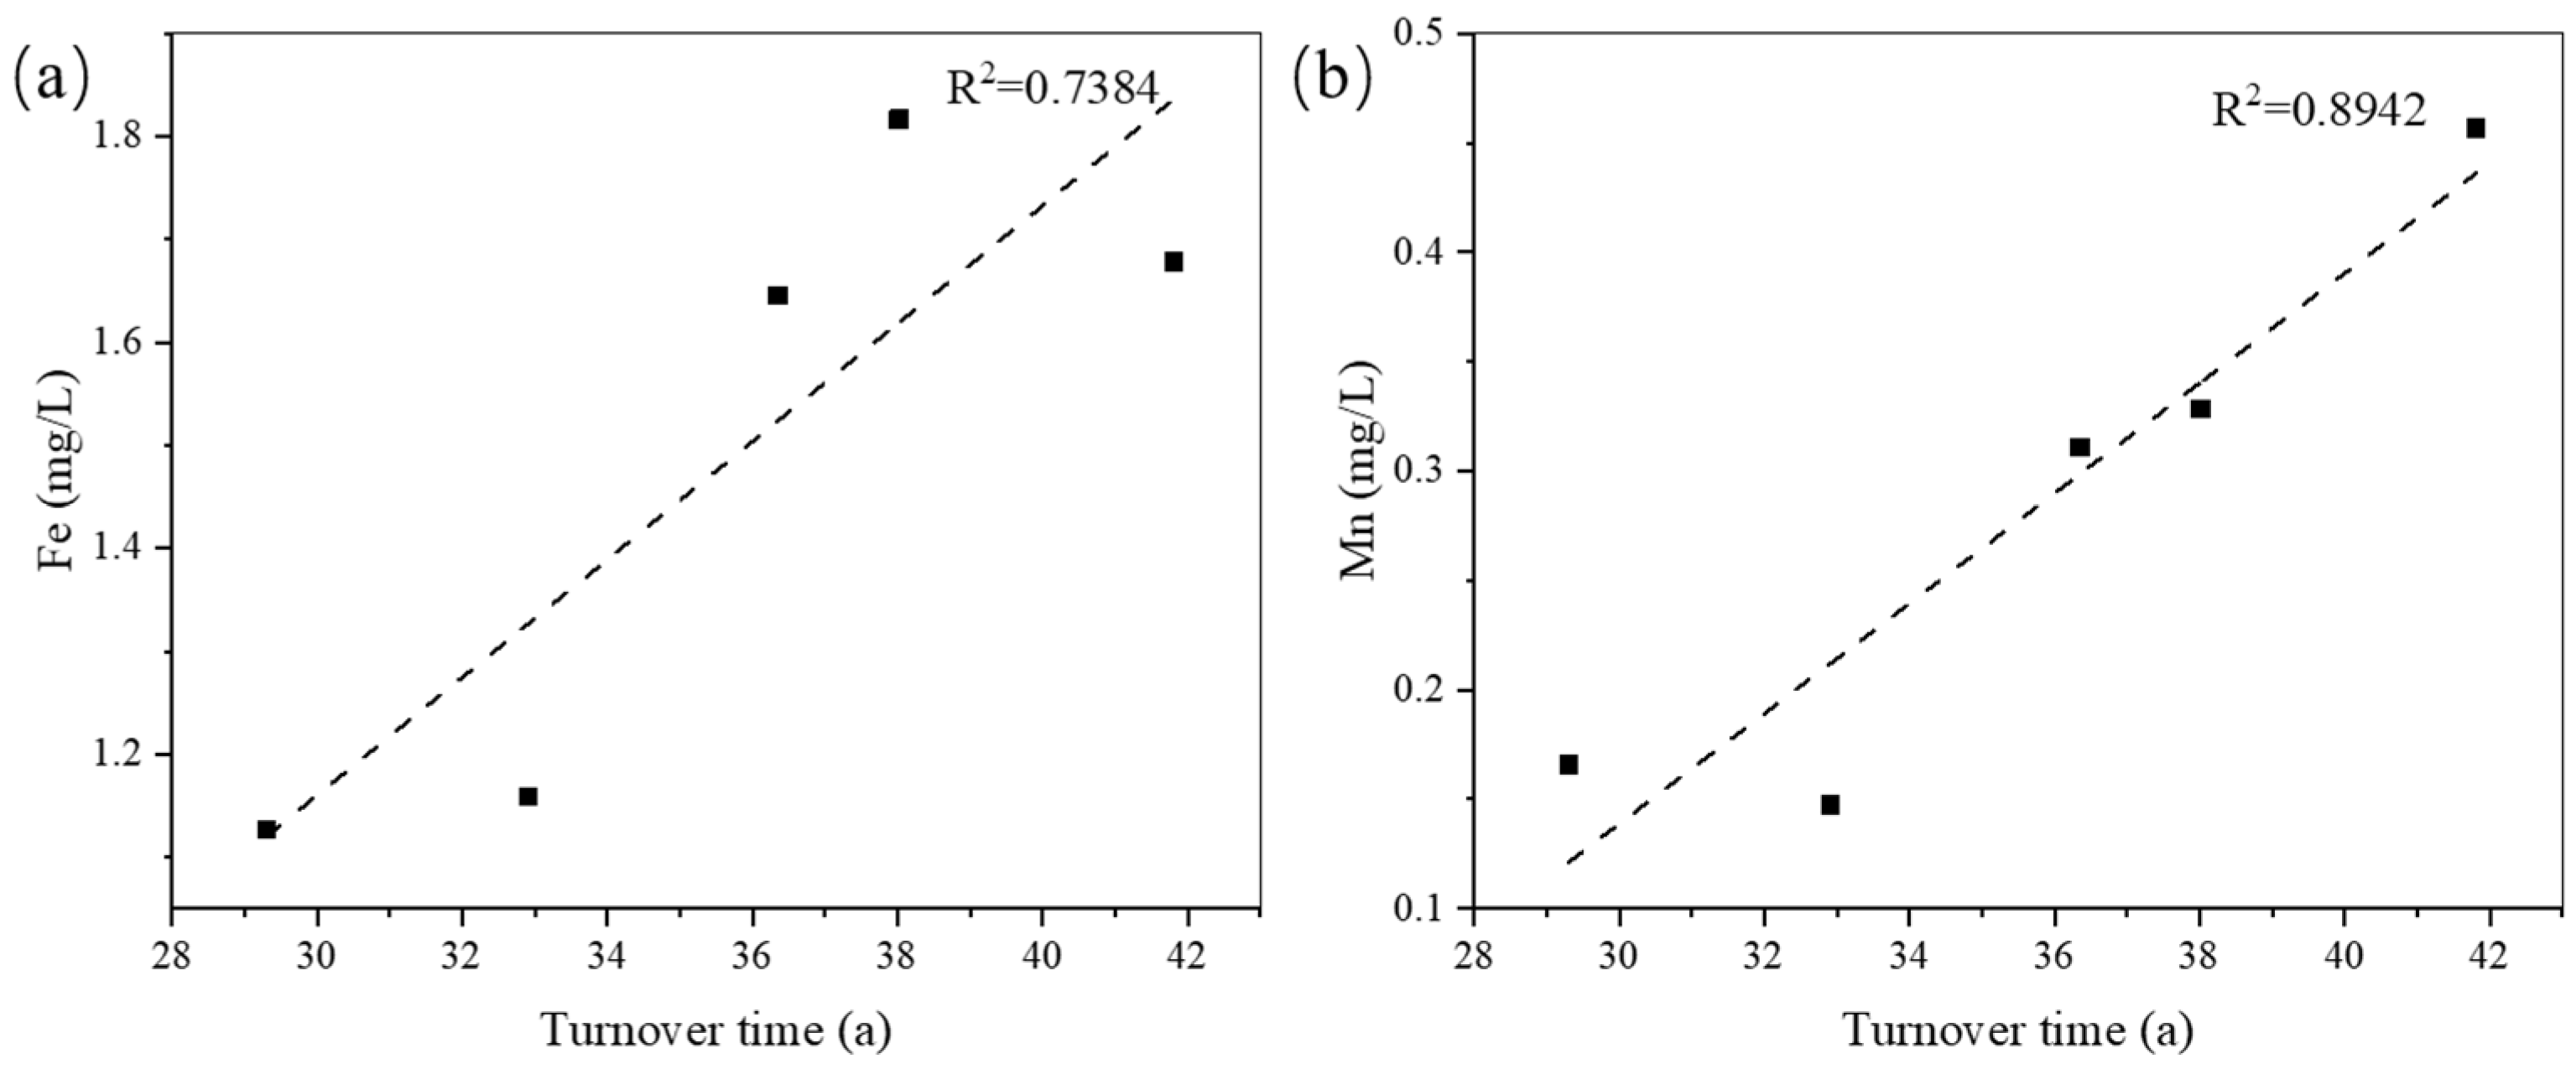
It can be seen from Figure 7 that the content of Fe and Mn increases with the growth of residence time and shows a good correlation (R2 are 0.74 and 0.89, respectively). This indicates that the residence time of groundwater in aquifer has a certain effect on the Fe and Mn contents. In simple aquifers, the residence time can be expressed as groundwater turnover time.
4.5. Source of Arsenic
Inland or enclosed basins with arid and semi-arid climates and strongly reductive aquifers are conducive to the enrichment of arsenic in groundwater. In these areas, the terrain is flat, the groundwater flow is sluggish, and the sediment age is relatively new [19].
The study area has a similar geological environment. The samples with excessive arsenic ions were mainly distributed in the north of the platform and the upper reaches of the Dongliaohe river valley plain.
The climate of the study area was humid during the Pleistocene, and large lakes and swamps developed in the area. Over a long period of history, generations of biological remains have decomposed into arsenic-containing silt. This results in an aquifer with a high content of organic matter and arsenic in the study area [51]. The arsenic content in aquifers is 3.7 to 4.2 times higher than the Clark value of arsenic in the earth’s crust.
The correlation matrix and factor analysis show that arsenic adsorbed by iron and manganese nodules is an important source of arsenic in the platform. As the sediment particles in the arsenic excess area are fine, and there are many iron–manganese nodules in the aquifer of the study area, the pH and redox state changes caused by the fluctuations in water level dissolve the iron–manganese nodules and release the adsorbed arsenic [7]. The Eh range in the southwest Songnen plain near the study area is 78.7–272 mV, showing a slightly moderately reducing condition, and the Eh of the high-arsenic groundwater is generally lower than 200 mV [7]. This is similar to the range of Eh on the platform of the study area (50.6–152.4 mV).
Arsenic in groundwater in the upper reaches of the Dongliaohe River is released from paddy soil where anoxic conditions release arsenic into groundwater [52]. In the lower plain of Dongliaohe River, the dissolved iron in the groundwater is oxidized to form iron hydroxide, which removes arsenic from the groundwater [53].
The Eh of the upper reaches of Dongliaohe River is concentrated between −116.8–5.1 mV. Research shows that the concentration of dissolved arsenic increases when Eh falls below 0 or −100 mV [54]. The paper also points out that intermittent irrigation can change the Eh, pH and Fe(II) concentrations in the soil, thus significantly affecting the concentration of arsenic in the soil.
5. Conclusions
In this study, the source and mobilization mechanisms of Fe, Mn and As in groundwater in Shuangliao city were determined. The source and mobilization mechanisms of Fe, Mn and As in groundwater were determined by method and spatial analysis. The main conclusions are as follows: firstly, the Fe and Mn in the river valley groundwater comes from the soil and the whole aquifer, while the source of Fe and Mn in the groundwater of the platform is the iron and manganese nodules in the clay layer. Secondly, according to different formation mechanisms, four groundwater dynamic types in the study area were discerned. The annual and seasonal changes in iron in four dynamic types and their influencing factors were determined. Thirdly, the increase in TDS lead to a decrease in the activity coefficient; in addition, iron and manganese ions can form inorganic complexes with anions in water. Together, they promote the dissolution of iron and manganese in water. Fourthly, by calculating the residence time of groundwater, it is found that with the increase in residence time, more iron and manganese will release progressively from the geological materials. Fifthly, the arsenic adsorbed by iron and manganese nodules is an important source of arsenic in the platform, and the arsenic in the river valley comes from the soil, whilst the pH and redox state changes caused by the fluctuations in water level dissolve the iron–manganese nodules and release the adsorbed arsenic. Finally, this paper provides the basis for groundwater development in high iron, manganese and arsenic areas. Deep wells should be drilled in rice-growing areas or river valleys. Intermittent irrigation should be used in rice-growing areas. When drilling a well on a platform, avoid areas with thick clay.
Author Contributions
Conceptualization, Z.Z. and X.L.; Data curation, O.A. and W.Y.; Funding acquisition, C.X. and X.L.; Investigation, Z.Z.; Methodology, W.Y. and X.L.; Project administration, C.X.; Software, Z.Z.; Writing—original draft, Z.Z.; Writing—review and editing, Z.Z., C.X., O.A. and W.Y. All authors have read and agreed to the published version of the manuscript.
Funding
This work is supported by the National Natural Science Foundation of China (41572216), the China Geological Survey Shenyang Geological Survey Center “Hydrogeological Survey of Songnen Plain” project ([2019]DD20190340-W09), and the Geological Survey Foundation of Jilin Province (2018-13).
Acknowledgments
We would like to thank the anonymous reviewers and the editor.
Conflicts of Interest
The authors declare no conflict of interest.
References
- Zhang, B.; Song, X.; Zhang, Y.; Han, D.; Tang, C.; Yu, Y.; Ma, Y. Hydrochemical characteristics and water quality assessment of surface water and groundwater in Songnen plain, Northeast China. Water Res. 2012, 46, 2737–2748. [Google Scholar] [CrossRef] [PubMed]
- Weng, H.X.; Qin, Y.C.; Chen, X.H. Elevated iron and manganese concentrations in groundwater derived from the Holocene transgression in the Hang-Jia-Hu Plain, China. Hydrogeol. J. 2007, 15, 715–726. [Google Scholar] [CrossRef]
- Pezzetta, E.; Lutman, A.; Martinuzzi, I.; Viola, C.; Bernardis, G.; Fuccaro, V. Iron concentrations in selected groundwater samples from the lower Friulian Plain, northeast Italy: Importance of salinity. Environ. Earth Sci. 2011, 62, 377–391. [Google Scholar] [CrossRef]
- Ravenscroft, P.; Burgess, W.G.; Ahmed, K.M.; Burren, M.; Perrin, J. Arsenic in groundwater of the Bengal Basin, Bangladesh: Distribution, field relations, and hydrogeological setting. Hydrogeol. J. 2005, 13, 727–751. [Google Scholar] [CrossRef]
- Carretero, S.; Kruse, E. Iron and manganese content in groundwater on the northeastern coast of the Buenos Aires Province, Argentina. Environ. Earth Sci. 2015, 73, 1983–1995. [Google Scholar] [CrossRef]
- Silvia, Z.; Elisa, A.; Roberto, L. Neuropsychological testing for the assessment of manganese neurotoxicity: A review and a proposal. Am. J. Ind. Med. 2007, 50, 812–830. [Google Scholar]
- Guo, H.; Zhang, D.; Wen, D.; Wu, Y.; Ni, P.; Jiang, Y.; Guo, Q.; Li, F.; Zheng, H.; Zhou, Y. Arsenic mobilization in aquifers of the southwest Songnen basin, P.R. China: Evidences from chemical and isotopic characteristics. Sci. Total Environ. 2014, 490, 590–602. [Google Scholar] [CrossRef]
- Luzati, S.; Beqiraj, A.; Beqiraj Goga, E.; Jaupaj, O. Iron and Manganese in Groundwater of Rrogozhina Aquifer, Western Albania. J. Environ. Sci. Eng. B 2016, 5, 276–285. [Google Scholar]
- Champ, D.R.; Gulens, J.; Jackson, R.E. Oxidation–reduction sequences in ground water flow systems. Can. J. Earth Sci. 1979, 16, 12–23. [Google Scholar] [CrossRef]
- Petrunic, B.M.; MacQuarrie, K.T.B.; Al, T.A. Reductive dissolution of Mn oxides in river-recharged aquifers: A laboratory column study. J. Hydrol. 2005, 301, 163–181. [Google Scholar] [CrossRef]
- Brown, C.J.; Coates, J.D.; Schoonen, M.A.A. Localized sulfate-reducing zones in a coastal plain aquifer. Ground Water 1999, 37, 505–516. [Google Scholar] [CrossRef]
- Kim, M.-J.; Nriagu, J.; Haack, S. Arsenic species and chemistry in groundwater of southeast Michigan. Environ. Pollut. 2002, 120, 379–390. [Google Scholar] [CrossRef]
- Neidhardt, H.; Berner, Z.A.; Freikowski, D.; Biswas, A.; Majumder, S.; Winter, J.; Gallert, C.; Chatterjee, D.; Norra, S. Organic carbon induced mobilization of iron and manganese in a West Bengal aquifer and the muted response of groundwater arsenic concentrations. Chem. Geol. 2014, 367, 51–62. [Google Scholar] [CrossRef]
- Shakoor, M.B.; Bibi, I.; Niazi, N.K.; Shahid, M.; Nawaz, M.F.; Farooqi, A.; Naidu, R.; Rahman, M.M.; Murtaza, G.; Luttge, A. The evaluation of arsenic contamination potential, speciation and hydrogeochemical behaviour in aquifers of Punjab, Pakistan. Chemosphere 2018, 199, 737–746. [Google Scholar] [CrossRef] [PubMed]
- Rawson, J.; Siade, A.; Sun, J.; Neidhardt, H.; Berg, M.; Prommer, H. Quantifying Reactive Transport Processes Governing Arsenic Mobility after Injection of Reactive Organic Carbon into a Bengal Delta Aquifer. Environ. Sci. Technol. 2017, 51, 8471–8480. [Google Scholar] [CrossRef]
- Biswas, A.; Gustafsson, J.P.; Neidhardt, H.; Halder, D.; Kundu, A.K.; Chatterjee, D.; Berner, Z.; Bhattacharya, P. Role of competing ions in the mobilization of arsenic in groundwater of Bengal Basin: Insight from surface complexation modeling. Water Res. 2014, 55, 30–39. [Google Scholar] [CrossRef] [Green Version]
- Nickson, R.T.; Mcarthur, J.M.; Ravenscroft, P.; Burgess, W.G.; Ahmed, K.M. Mechanism of arsenic release to groundwater, Bangladesh and West Bengal. Appl. Geochem. 2000, 15, 403–413. [Google Scholar] [CrossRef]
- Zheng, Y.; Stute, M.; Van Geen, A.; Gavrieli, I.; Dhar, R.; Simpson, H.J.; Schlosser, P.; Ahmed, K.M. Redox control of arsenic mobilization in Bangladesh groundwater. Appl. Geochem. 2004, 19, 201–214. [Google Scholar] [CrossRef]
- Smedley, P.L.; Kinniburgh, D.G. A review of the source, behaviour and distribution of arsenic in natural waters. Appl. Geochem. 2002, 17, 517–568. [Google Scholar] [CrossRef] [Green Version]
- Tang, J.; Bian, J.; Li, Z.; Zhu, J.; Wang, C. A study on arsenic distribution characteristics in groundwater of Western Jilin Province, P.R. China. In Proceedings of the 4th International Conference on Bioinformatics and Biomedical Engineering iCBBE 2010, Chengdu, China, 18–20 June 2010; pp. 1–5. [Google Scholar]
- Jilin Province Soil Fertilizer Station. Soil of Jilin Province, 1st ed.; China Agricultural Press: Beijing, China, 1998; pp. 165–315. (In Chinese) [Google Scholar]
- National Standardization Administration of China. Standard Examination Methods for Drinking Water: Organoleptic and Physical Parameters (GB/T 5750.4-2006), 1st ed.; China Standard Press: Beijing, China, 2007; pp. 1–11. (In Chinese) [Google Scholar]
- State Environmental Protection Administration. Methods for Monitoring and Analyzing Water and Wastewater, 4th ed.; China Environmental Science Press: Beijing, China, 2004; pp. 120–126. (In Chinese) [Google Scholar]
- National Standardization Administration of China. Standard Examination Methods for Drinking Water: Metal Parameters (GB/T 5750.6-2006), 1st ed.; China Standard Press: Beijing, China, 2007; pp. 1–30. (In Chinese) [Google Scholar]
- National Standardization Administration of China. Standard Examination Methods for Drinking Water: Nonmetal Parameters (GB/T 5750.5-2006), 1st ed.; China Standard Press: Beijing, China, 2007; pp. 30–35. (In Chinese) [Google Scholar]
- Kumru, M.N.; Bakaç, M. R-mode factor analysis applied to the distribution of elements in soils from the Aydın basin, Turkey. J. Geochem. Explor. 2003, 77, 81–91. [Google Scholar] [CrossRef]
- Aryafar, A.; Doulati Ardejani, F. R-mod factor analysis, a popular multivariate statistical technique to evaluate water quality in Khaf-Sangan basin, Mashhad, Northeast of Iran. Arab. J. Geosci. 2011, 6, 893–900. [Google Scholar] [CrossRef]
- Krumbein, W.C.; Graybill, F.A. An Introduction to Statistical Models in Geology; McGraw-Hill: New York, NY, USA, 1965; p. 317. [Google Scholar]
- Johnson, A.R.; Wichern, W.D. Applied Multivariate Statistical Analysis, 2nd ed.; Prentice-Hall: Englewood Cliffs, NJ, USA, 1988; p. 607. [Google Scholar]
- Kshetrimayum, K.S.; Hegeu, H. The state of toxicity and cause of elevated Iron and Manganese concentrations in surface water and groundwater around Naga Thrust of Assam-Arakan basin, Northeastern India. Environ. Earth Sci. 2016, 75, 1–14. [Google Scholar] [CrossRef]
- Jia, Y.; Guo, H.; Xi, B.; Jiang, Y.; Zhang, Z.; Yuan, R.; Yi, W.; Xue, X. Sources of groundwater salinity and potential impact on arsenic mobility in the western Hetao Basin, Inner Mongolia. Sci. Total Environ. 2017, 601–602, 691–702. [Google Scholar] [CrossRef] [PubMed]
- Manning, B.A.; Fendorf, S.E.; Bostick, B.; Suarez, D.L. Arsenic(III) Oxidation and Arsenic(V) Adsorption Reactions on Synthetic Birnessite. Environ. Sci. Technol. 2002, 36, 976–981. [Google Scholar] [CrossRef] [Green Version]
- Sun, X.; Doner, H.E.; Zavarin, M. Spectroscopy Study of Arsenite (As(III)) Oxidation on Mn-Substituted Goethite. Clays Clay Miner. 1999, 47, 474–480. [Google Scholar]
- Duan, Y.; Gan, Y.; Wang, Y.; Deng, Y.; Guo, X.; Dong, C. Temporal variation of groundwater level and arsenic concentration at Jianghan Plain, Central China. J. Geochem. Explor. 2014, 149, 106–119. [Google Scholar] [CrossRef]
- Gan, Y.; Wang, Y.; Duan, Y.; Deng, Y.; Guo, X.; Ding, X. Hydrogeochemistry and arsenic contamination of groundwater in the Jianghan Plain, central China. J. Geochem. Explor. 2014, 138, 81–93. [Google Scholar] [CrossRef]
- Hem, J.D. Study and Interpretation of the Chemical Characteristics of Natural Water; U.S. Geological Survey Water-Supply Paper: Washington, DC, USA, 1985; Volume 2254, p. 363.
- Brown, C.J.; Walter, D.A.; Colabufo, S. Iron in the Aquifer System of Suffolk County, New York, 1990–1998; Water Science Center U.S. Geological Survey: New York, NY, USA, 1999.
- Opponganane, A.B. Insights into the Mechanisms of Iron Reductive Dissolution in Vadose Zone Soils and Implications for Landfill Activities: Predicting the Potential for Groundwater Pollution. Ph.D. Thesis, University of Florida, Gradworks, FL, USA, 2014. [Google Scholar]
- Huang, B.; Li, Z.; Chen, Z.; Chen, G.; Zhang, C.; Huang, J.; Nie, X.; Xiong, W.; Zeng, G. Study and health risk assessment of the occurrence of iron and manganese in groundwater at the terminal of the Xiangjiang River. Environ. Sci. Pollut. Res. 2015, 22, 19912–19921. [Google Scholar] [CrossRef]
- Matsunaga, T.; Karametaxas, G.; von Gunten, H.R.; Lichtner, P.C. Redox chemistry of iron and manganese minerals in river-recharged aquifers: A model interpretation of a column experiment. Geochim. Cosmochim. Acta 1993, 57, 1691–1704. [Google Scholar] [CrossRef]
- Bourg, A.C.M.; Berlin, C. Seasonal and Spatial Trends in Manganese Solubility in an Alluvial Aquifer. Environ. Sci. Technol. 1994, 28, 868–876. [Google Scholar] [CrossRef]
- Liang, S.; Li, Y.F.; Tang, J.; Wang, Y.J.; Li, Q.Y. Study on form distribution of soil iron in western Jilin and its correlation with soil properties. Global Geol. 2016, 35, 593–600. (In Chinese) [Google Scholar]
- Jenčo, M.; Matečný, I.; Putiška, R.; Burian, L.; Tančárová, K.; Kušnirák, D. Umbrisols at Lower Altitudes, Case Study from Borská lowland (Slovakia). Open Geosci. 2018, 10, 121–136. [Google Scholar] [CrossRef]
- Zhang, C.; Ge, Y.; Yao, H.; Chen, X.; Hu, M. Iron oxidation-reduction and its impacts on cadmium bioavailability in paddy soils: A review. Front. Environ. Sci. Eng. China 2012, 6, 509–517. [Google Scholar] [CrossRef]
- Akter, M.; Deroo, H.; De Grave, E.; Van Alboom, T.; Kader, M.A.; Pierreux, S.; Begum, M.A.; Boeckx, P.; Sleutel, S. Link between paddy soil mineral nitrogen release and iron and manganese reduction examined in a rice pot growth experiment. Geoderma 2018, 326, 9–21. [Google Scholar] [CrossRef]
- Williams, M.D.; Oostrom, M. Oxygenation of anoxic water in a fluctuating water table system: An experimental and numerical study. J. Hydrol. 2000, 230, 70–85. [Google Scholar] [CrossRef]
- Kohfahl, C.; Massmann, G.; Pekdeger, A. Sources of oxygen flux in groundwater during induced bank filtration at a site in Berlin, Germany. Hydrogeol. J. 2009, 17, 571–578. [Google Scholar] [CrossRef]
- Liu, Y.; Yamanaka, T.; Zhou, X.; Tian, F.; Ma, W. Combined use of tracer approach and numerical simulation to estimate groundwater recharge in an alluvial aquifer system: A case study of Nasunogahara area, Central Japan. J. Hydrol. 2014, 519, 833–847. [Google Scholar] [CrossRef]
- Zheng, J.; Teng, Y.; Wang, J.; Hu, L. Assessment of the Groundwater Renewability in Beijing Plain Area. In Proceedings of the 5th International Conference on Bioinformatics and Biomedical Engineering iCBBE 2011, Wuhan, China, 10–12 May 2011; pp. 1–4. [Google Scholar]
- Yamanaka, T.; Mikita, M.; Lorphensri, O.; Shimada, J.; Kagabu, M.; Ikawa, R.; Nakamura, T.; Tsujimura, M. Anthropogenic changes in a confined groundwater flow system in the Bangkok Basin, Thailand, part II: How much water has been renewed? Hydrol. Process. 2011, 25, 2734–2741. [Google Scholar] [CrossRef]
- Huang, J.H. Impact of microorganisms on arsenic biogeochemistry: A review. Water Air Soil Pollut. 2014, 225, 1848. [Google Scholar] [CrossRef]
- Meharg, A.A.; Zhao, F.J. Arsenic & Rice; Springer Science + Business Media: Berlin, Germany, 2012; ISBN 9789400729476. [Google Scholar]
- Nickson, R.; McArthur, J.; Burgess, W.; Ahmed, K.M.; Ravenscroft, P.; Rahmanñ, M. Arsenic poisoning of Bangladesh groundwater. Nature 1998, 395, 338. [Google Scholar] [CrossRef]
- Honma, T.; Ohba, H.; Kaneko-Kadokura, A.; Makino, T.; Nakamura, K.; Katou, H. Optimal Soil Eh, pH, and Water Management for Simultaneously Minimizing Arsenic and Cadmium Concentrations in Rice Grains. Environ. Sci. Technol. 2016, 50, 4178–4185. [Google Scholar] [CrossRef] [PubMed]
Figure 1.
Location and geology map of the study area showing sample locations and rivers.

Figure 2.
Soil map (a) and geomorphology map with resource calculation district (b) of the study area.
Figure 2.
Soil map (a) and geomorphology map with resource calculation district (b) of the study area.

Figure 3.
Boxplot of sample well clay thickness and Fe (a) and Mn (b) content (on the platform).

Figure 4.
Boxplot of sample well clay thickness and Fe (a) and Mn (b) content (in the river valley).
Figure 4.
Boxplot of sample well clay thickness and Fe (a) and Mn (b) content (in the river valley).

Figure 5.
Bar charts showing mean values of Fe (a) and Mn (b) in groundwater of different soil types districts.
Figure 5.
Bar charts showing mean values of Fe (a) and Mn (b) in groundwater of different soil types districts.

Figure 6.
The relationship between depth to water table and iron concentration in different groundwater dynamic types.
Figure 6.
The relationship between depth to water table and iron concentration in different groundwater dynamic types.

Figure 7.
Relationship between groundwater turnover time and concentration of Fe (a) and Mn (b) in groundwater.
Figure 7.
Relationship between groundwater turnover time and concentration of Fe (a) and Mn (b) in groundwater.


Table 1.
Summary of physio-chemical and field measurements.
| Sample ID | N 2 | Minimum | Maximum | Median |
|---|---|---|---|---|
| Well Depth (m) | 82 | 7.00 | 90.00 | 30.00 |
| WLF 1(m) | 82 | 0.02 | 6.66 | 0.60 |
| Fe (mg/L) | 82 | 0.245 | 46.3 | 1.37 |
| Mn (mg/L) | 82 | 0.0010 | 6.16 | 0.197 |
| As (mg/L) | 82 | <0.0010 | 0.112 | 0.0031 |
| TDS (mg/L) | 82 | 252 | 2611 | 703 |
| TH 3 (in CaCO3, mg/L) | 82 | 127 | 1250 | 321 |
| pH | 82 | 7.04 | 8.38 | 7.55 |
| Turbidity (NTU) | 82 | <0.5 | 8.9 | 0.7 |
| (mg/L) | 82 | 136 | 1330 | 357 |
| -N (mg/L) | 82 | <0.025 | 2.14 | 0.400 |
1 WLF refers to water level fluctuation; 2 TH refers to total hardness; 3 N refers to sample population.
Table 2.
Correlation of physio-chemical parameters and field observations with Fe and Mn concentrations (on the platform).
Table 2.
Correlation of physio-chemical parameters and field observations with Fe and Mn concentrations (on the platform).
| Parameters | WD | WLF | Fe | Mn | As | TDS | TH | pH | Turbidity | ||
|---|---|---|---|---|---|---|---|---|---|---|---|
| WD | 1.00 | ||||||||||
| WLF | −0.03 | 1.00 | |||||||||
| Fe | 0.08 | 0.09 | 1.00 | ||||||||
| Mn | −0.15 | 0.24 | 0.19 | 1.00 | |||||||
| As | −0.10 | 0.12 | 0.14 | 0.36 * | 1.00 | ||||||
| TDS | 0.05 | 0.02 | 0.59 ** | 0.34 * | 0.32 * | 1.00 | |||||
| TH | 0.08 | 0.09 | 0.71 ** | 0.24 | 0.15 | 0.73 ** | 1.00 | ||||
| pH | 0.01 | −0.15 | −0.33 * | −0.28 | −0.18 | −0.20 | −0.19 | 1.00 | |||
| Turbidity | 0.27 | 0.00 | 0.32 * | 0.18 | 0.07 | 0.26 | 0.25 | −0.20 | 1.00 | ||
| 0.05 | 0.10 | 0.36 * | 0.43 ** | 0.34 | 0.77 ** | 0.28 | −0.18 | 0.12 | 1.00 | ||
| 0.22 | 0.20 | 0.51 ** | 0.48 | 0.14 | 0.15 | 0.21 | −0.35 * | 0.26 | 0.44 | 1.00 |
* correlation is significant at p < 0.05, ** correlation is significant at p < 0.01.
Table 3.
Correlation of physio-chemical parameters and field observations with Fe and Mn concentrations (in the river valley).
Table 3.
Correlation of physio-chemical parameters and field observations with Fe and Mn concentrations (in the river valley).
| Parameters | WD | WLF | Fe | Mn | As | TDS | TH | pH | Turbidity | ||
|---|---|---|---|---|---|---|---|---|---|---|---|
| WD | 1.00 | ||||||||||
| WLF | 0.54 ** | 1.00 | |||||||||
| Fe | −0.50 ** | −0.08 | 1.00 | ||||||||
| Mn | −0.51 ** | −0.16 | 0.75 ** | 1.00 | |||||||
| As | −0.02 | 0.21 | 0.24 | 0.25 | 1.00 | ||||||
| TDS | −0.53 ** | −0.32 | 0.61 ** | 0.69 ** | −0.17 | 1.00 | |||||
| TH | −0.53 ** | −0.28 | 0.58 ** | 0.69 ** | −0.17 | 0.97 ** | 1.00 | ||||
| pH | 0.29 | 0.12 | −0.37 * | −0.30 | 0.23 | −0.22 | −0.26 | 1.00 | |||
| Turbidity | −0.13 | −0.21 | 0.91 ** | 0.82 ** | 0.16 | 0.05 | −0.02 | −0.30 | 1.00 | ||
| −0.48 ** | −0.47 ** | 0.68 ** | 0.63 ** | −0.15 | 0.79 ** | 0.67 ** | −0.19 | 0.21 | 1.00 | ||
| −0.21 | −0.03 | 0.52 ** | 0.39 | −0.11 | 0.33 | 0.24 | 0.17 | 0.16 | 0.51 ** | 1.00 |
* correlation is significant at p < 0.05, ** correlation is significant at p < 0.01.
Table 4.
Varimax rotated R-mode factor-loading matrix for groundwater of the platform.
| Parameters | 1 | 2 | 3 |
|---|---|---|---|
| TH | 0.896 | 0.063 | 0.091 |
| TDS | 0.872 | 0.162 | 0.000 |
| Fe | 0.813 | 0.138 | 0.206 |
| Mn | 0.245 | 0.722 | −0.129 |
| WLF | −0.133 | 0.635 | 0.078 |
| pH | −0.178 | −0.589 | −0.244 |
| As | 0.249 | 0.551 | −0.265 |
| Well Depth | 0.006 | −0.160 | 0.803 |
| Turbidity | 0.272 | 0.215 | 0.682 |
Table 5.
Varimax rotated R-mode factor loading matrix for groundwater of the river valley.
| Parameters | 1 | 2 | 3 |
|---|---|---|---|
| Fe | 0.957 | 0.028 | −0.003 |
| Turbidity | 0.942 | −0.161 | −0.031 |
| Mn | 0.909 | 0.23 | 0.018 |
| pH | −0.749 | −0.157 | −0.152 |
| TH | 0.018 | 0.967 | −0.094 |
| TDS | 0.026 | 0.961 | −0.123 |
| Well Depth | −0.484 | −0.559 | 0.295 |
| As | 0.227 | −0.009 | 0.768 |
| WLF | −0.159 | −0.296 | 0.734 |
Table 6.
Calculation results of turn over time of groundwater in different calculation districts.
| District | Q (×104 m3) | Qr (×104 m3/a) | T (a) | Mean (Fe) (mg/L) | Mean (Mn) (mg/L) |
|---|---|---|---|---|---|
| I | 99,368.52 | 2733.62 | 36.35 | 1.65 | 0.311 |
| II | 122,690.16 | 2934.45 | 41.81 | 1.68 | 0.457 |
| III | 115,636.58 | 3041.17 | 38.02 | 1.82 | 0.328 |
| IV | 27,834.79 | 845.86 | 32.91 | 1.16 | 0.147 |
| VI | 74,411.83 | 2539.55 | 29.30 | 1.13 | 0.166 |
© 2020 by the authors. Licensee MDPI, Basel, Switzerland. This article is an open access article distributed under the terms and conditions of the Creative Commons Attribution (CC BY) license (http://creativecommons.org/licenses/by/4.0/).
Share and Cite
MDPI and ACS Style
Zhang, Z.; Xiao, C.; Adeyeye, O.; Yang, W.; Liang, X. Source and Mobilization Mechanism of Iron, Manganese and Arsenic in Groundwater of Shuangliao City, Northeast China. Water 2020, 12, 534. https://doi.org/10.3390/w12020534
AMA Style
Zhang Z, Xiao C, Adeyeye O, Yang W, Liang X. Source and Mobilization Mechanism of Iron, Manganese and Arsenic in Groundwater of Shuangliao City, Northeast China. Water. 2020; 12(2):534. https://doi.org/10.3390/w12020534
Chicago/Turabian StyleZhang, Zhihao, Changlai Xiao, Oluwafemi Adeyeye, Weifei Yang, and Xiujuan Liang. 2020. "Source and Mobilization Mechanism of Iron, Manganese and Arsenic in Groundwater of Shuangliao City, Northeast China" Water 12, no. 2: 534. https://doi.org/10.3390/w12020534
Note that from the first issue of 2016, this journal uses article numbers instead of page numbers. See further details here.