Quantifying Escherichia coli and Suspended Particulate Matter Concentrations in a Mixed-Land Use Appalachian Watershed


1
Division of Plant and Soil Sciences, Davis College of Agriculture, Natural Resources and Design, West Virginia University, Agricultural Sciences Building, Morgantown, WV 26506, USA
2
Institute of Water Security and Science, Schools of Agriculture and Food, and Natural Resources, Davis College of Agriculture, Natural Resources and Design, West Virginia University, 3109 Agricultural Sciences Building, Morgantown, WV 26506, USA
*
Author to whom correspondence should be addressed.
Water 2020, 12(2), 532; https://doi.org/10.3390/w12020532
Submission received: 2 January 2020
/
Revised: 4 February 2020
/
Accepted: 12 February 2020
/
Published: 14 February 2020
(This article belongs to the Special Issue Integrated Water Resources Research: Advancements in Understanding to Improve Future Sustainability)
Abstract
:The relationships between Escherichia (E) coli concentration, suspended particulate matter (SPM) particle size class, and land use practices are important in reducing the bacterium’s persistence and health risks. However, surprisingly few studies have been performed that quantify these relationships. Conceivably, such information would advance mitigation strategies for practices that address specific SPM size classes and, by proxy, E. coli concentration. To advance this needed area of research, stream water was sampled from varying dominant land use practices in West Run Watershed, a representative mixed-land use Appalachian watershed of West Virginia in the eastern USA. Water samples were filtered into three SPM intervals (<5 µm; 5 µm to 60 μm; and >60 μm) and the E. coli concentration (colony forming units, CFU) and SPM of each interval was quantified. Statistically significant relationships were identified between E. coli concentrations and size intervals (α < 0.0001), and SPM (α = 0.05). The results show a predominance (90% of total) of E. coli CFUs in the <5 μm SPM interval. The results show that land use practices impact the relationships between SPM and E. coli concentrations. Future work should include additional combined factors that influence bacterial CFUs and SPM, including hydrology, climate, geochemistry and nutrients.
1. Introduction
Globally, there is a need to investigate factors that influence risks facilitated by pathogenic microbes in water sources [1]. The need for research is stimulated by the common and widespread occurrence of fecal pollution and pathogenic water contamination in many parts of the globe [2,3,4,5]. The World Health Organization provided an estimate of 2.2 million deaths that occur annually due to waterborne diseases, making it the leading cause of deaths in the developing world [6]. Between 2013 and 2014, pathogen-contaminated drinking water resulted in 1006 cases, 42 outbreaks of disease, 124 hospitalizations, and 13 deaths in the United States of America alone [7]. Conceivably, advancing the understanding of variables that influence the persistence and risk of exposure to potentially harmful fecal microbes (e.g., E. coli, enterococci or fecal coliform), including the association of bacteria with suspended particulate matter (SPM), will better inform policy makers and contribute to decreased morbidity and mortality caused by pathogenic microbes.
SPM, defined as heterogeneous aggregates of organic matter, mineral fragments and microbiological fractions [8] in aquatic ecosystems, can facilitate the growth and persistence (survivability) of fecal and pathogenic bacteria [9,10]. For example, Jeng et al. [11] reported that suspended particles extended the survival of fecal indicator organisms for several days through the physical and chemical protection of microbes from biotic and abiotic stresses [12]. Other studies showed that SPM-associated bacteria occur in conjunction with, or adsorbed to, suspended organic or inorganic matter via physical, electrostatic or chemical binding [8,13], and benefit from the increased nutrient and organic matter availability (comparable to biofilms), and optimal light exposure [14,15]. Increased nutrients, organic matter and light that SPM-associated bacteria are exposed to can increase the growth rate of microbes by up to 50% relative to free-floating microbes. SPM-associated bacteria are typically larger, more abundant and feature increased cellular uptake of sugars and amino acids relative to free-floating microbes [16,17]. In addition, the proximity of SPM-associated microbes to each other facilitates horizontal transfer and potential proliferation of resistance genes [18,19]. Advancing the understanding of variables that influence bacterial association with SPM is important to better manage the growth and persistence of microbes in the environment.
Previous work showed that microbes attach preferentially to small particles (e.g., fine clay particles; <2 µm) due to the increased surface area to volume and electrostatic charge [1,12]. Conversely, fecal bacteria (e.g., E. coli) associated with large suspended particles will settle to the stream bed more readily than smaller particles [1], potentially decreasing microbial water quality impairment once re-suspension occurs. The potential risk of exposure to E. coli through its association with SPM is important given that E. coli can be pathogenic [20], while simultaneously indicating the presence of other harmful fecal microbes (e.g., E. coli serves as an indicator organism) [2]. This is important because association can increase the risk posed by E. coli or by the other fecal microbes that E. coli is an indicator for. Thus, an improved understanding of the relationships between E. coli concentration and SPM could aid in determining the influence of SPM size on other potentially harmful fecal bacteria, commonly occurring with E. coli, such as Enterococcus [21]. Pathogenic strains of E. coli can cause gastroenteritis, diarrhea, urinary tract infections hemolytic uremic syndrome, and meningitis [22]. Therefore, the increased risk of exposure, through association with SPM, can potentially increase instances of disease outbreaks and subsequent morbidity and mortality [2,3]. In short, advanced understanding of the correlation between E. coli concentrations and SPM size class will reduce human health risks by advancing the understanding of exposure and informing effective remediation.
Many knowledge gaps exist regarding E. coli (fecal matter) concentration relative to SPM size distribution. For example, previous investigations have been limited by laboratory simulations [1], few sampling locations [11], and/or low to no land use variability [23,24]. The latter is important given land use and land use change has been shown to alter particle size characteristics of SPM in aquatic systems [25,26]. For example, in a mixed-land use watershed (Hinkson Creek, Columbia, Missouri, USA), Hubbart [25] and Kellner and Hubbart [27] reported that suspended sediment displayed a decreasing trend in particle size from agricultural headwaters to urban areas and a subsequent increase in particle size to suburban areas in the lower watershed. Kellner et al. [28] reported a disproportionate contribution of fine sediment from urban areas, relative to receiving waters comprising different land uses (e.g., rural and agriculture) of Flat Branch Creek (a tributary to Hinkson) and Hinkson Creek. The increased fine sediment from urban areas was attributed to preexisting compaction in these areas, increased impervious surface cover relative to other land use types, and in-stream weathering of sediment in conjunction with preferential deposition [25,28]. Ultimately, the results of previous studies have stimulated questions regarding the influence of land use practices, particle size class distribution and E. coli (fecal matter) concentration [29].
The Appalachian region of the United States of America (USA) is well-suited for investigations that will resolve existing knowledge gaps regarding the relationship between E. coli concentration and SPM size. This region of the USA comprises diverse physiography and widespread, frequent, and problematic fecal pollution [30]. On the basis of physiography alone, Appalachia is comparable to other regions globally. For example, the Central Appalachian region, encompassing a temperate climate, distinct winter and summer periods, and a precipitation regime that is nearly evenly distributed throughout the year is comparable to similarly temperate locations comprising year round precipitation (e.g., Northern Honshu in Japan [31,32]). In rural areas of Appalachia, thousands of residents are exposed to water security issues, in particular microbial contamination [33]. The vulnerabilities of rural Appalachia to decreased water quality due to microbial contamination is exacerbated by some of the greatest levels of poverty, isolation, rough geographical terrain, and inadequate septic treatment systems in the USA [33]. Therefore, water quality is a primary concern and studies investigating fecal pollutants (e.g., E. coli) and factors increasing the risk posed by fecal pollution (e.g., by increasing risk of exposure) in this region are greatly needed.
The overarching objective of the current investigation was to quantitatively characterize E. coli concentration relative to SPM size distribution from multiple sites in a mixed-land use watershed of Appalachia. A sub-objective was to evaluate the influence of varying land use practices on the relationship between E. coli concentration and SPM particle size distribution. This work was also intended to serve as a valuable springboard for future investigations on the alteration of exposure and subsequent health risks of E. coli facilitated by SPM of various sizes.
2. Methods
2.1. Study Site Description
This investigation took place in West Run Watershed (WRW), a 3rd order tributary of the Monongahela River, located in Morgantown, West Virginia, USA. The WRW is 23 km2 in area and is a mixed-land use urbanizing watershed comprising many land use practices, including agriculture, urban and forested areas. At the time of this investigation, forested land use accounted for 50.1%, and agricultural and developed (urban and commercial areas) land use practices accounted for 22.6% and 19%, respectively, of the land use of WRW. The primary stream of WRW, West Run Creek, is typically narrow with small floodplains and is considered to be a moderately entrenched stream [34,35]. Elevation ranges from 420 m above mean sea level, at the headwaters, to 240 m above mean sea level at the confluence of the Monongahela River [35]. The physiography of the watershed comprises relatively rugged terrain, featuring numerous rock outcroppings dating to the Paleozoic era [35]. The oldest recorded geological formation in the watershed is the Upper Kittanning coal, while the most recent formation is the Monongahela series (located in the headwaters) [35]. The water quality in WRW, specifically in the headwaters, has been negatively impacted by historic mining of the Pittsburg coal seam [36].
The climate of West Virginia ranges from temperate and humid with hot summers to cold and humid with warm summers [37]. The climate of Morgantown, WV, located in Monongalia County (and including the WRW), is characterized by warm to hot summers (mean monthly temperature >22 °C), cold winters (mean monthly temperature <0 °C), and no dry season [37]. The average annual precipitation in Morgantown between 1981 and 2010 was approximately 1060 mm. During this time period, July (typically warmest and wettest month) had an average daily temperature of approximately 23 °C and average monthly precipitation of 117 mm. Conversely, the coldest (January) and driest (February) months have an average daily temperature of −0.4 °C and average monthly precipitation of 66 mm, respectively [38].
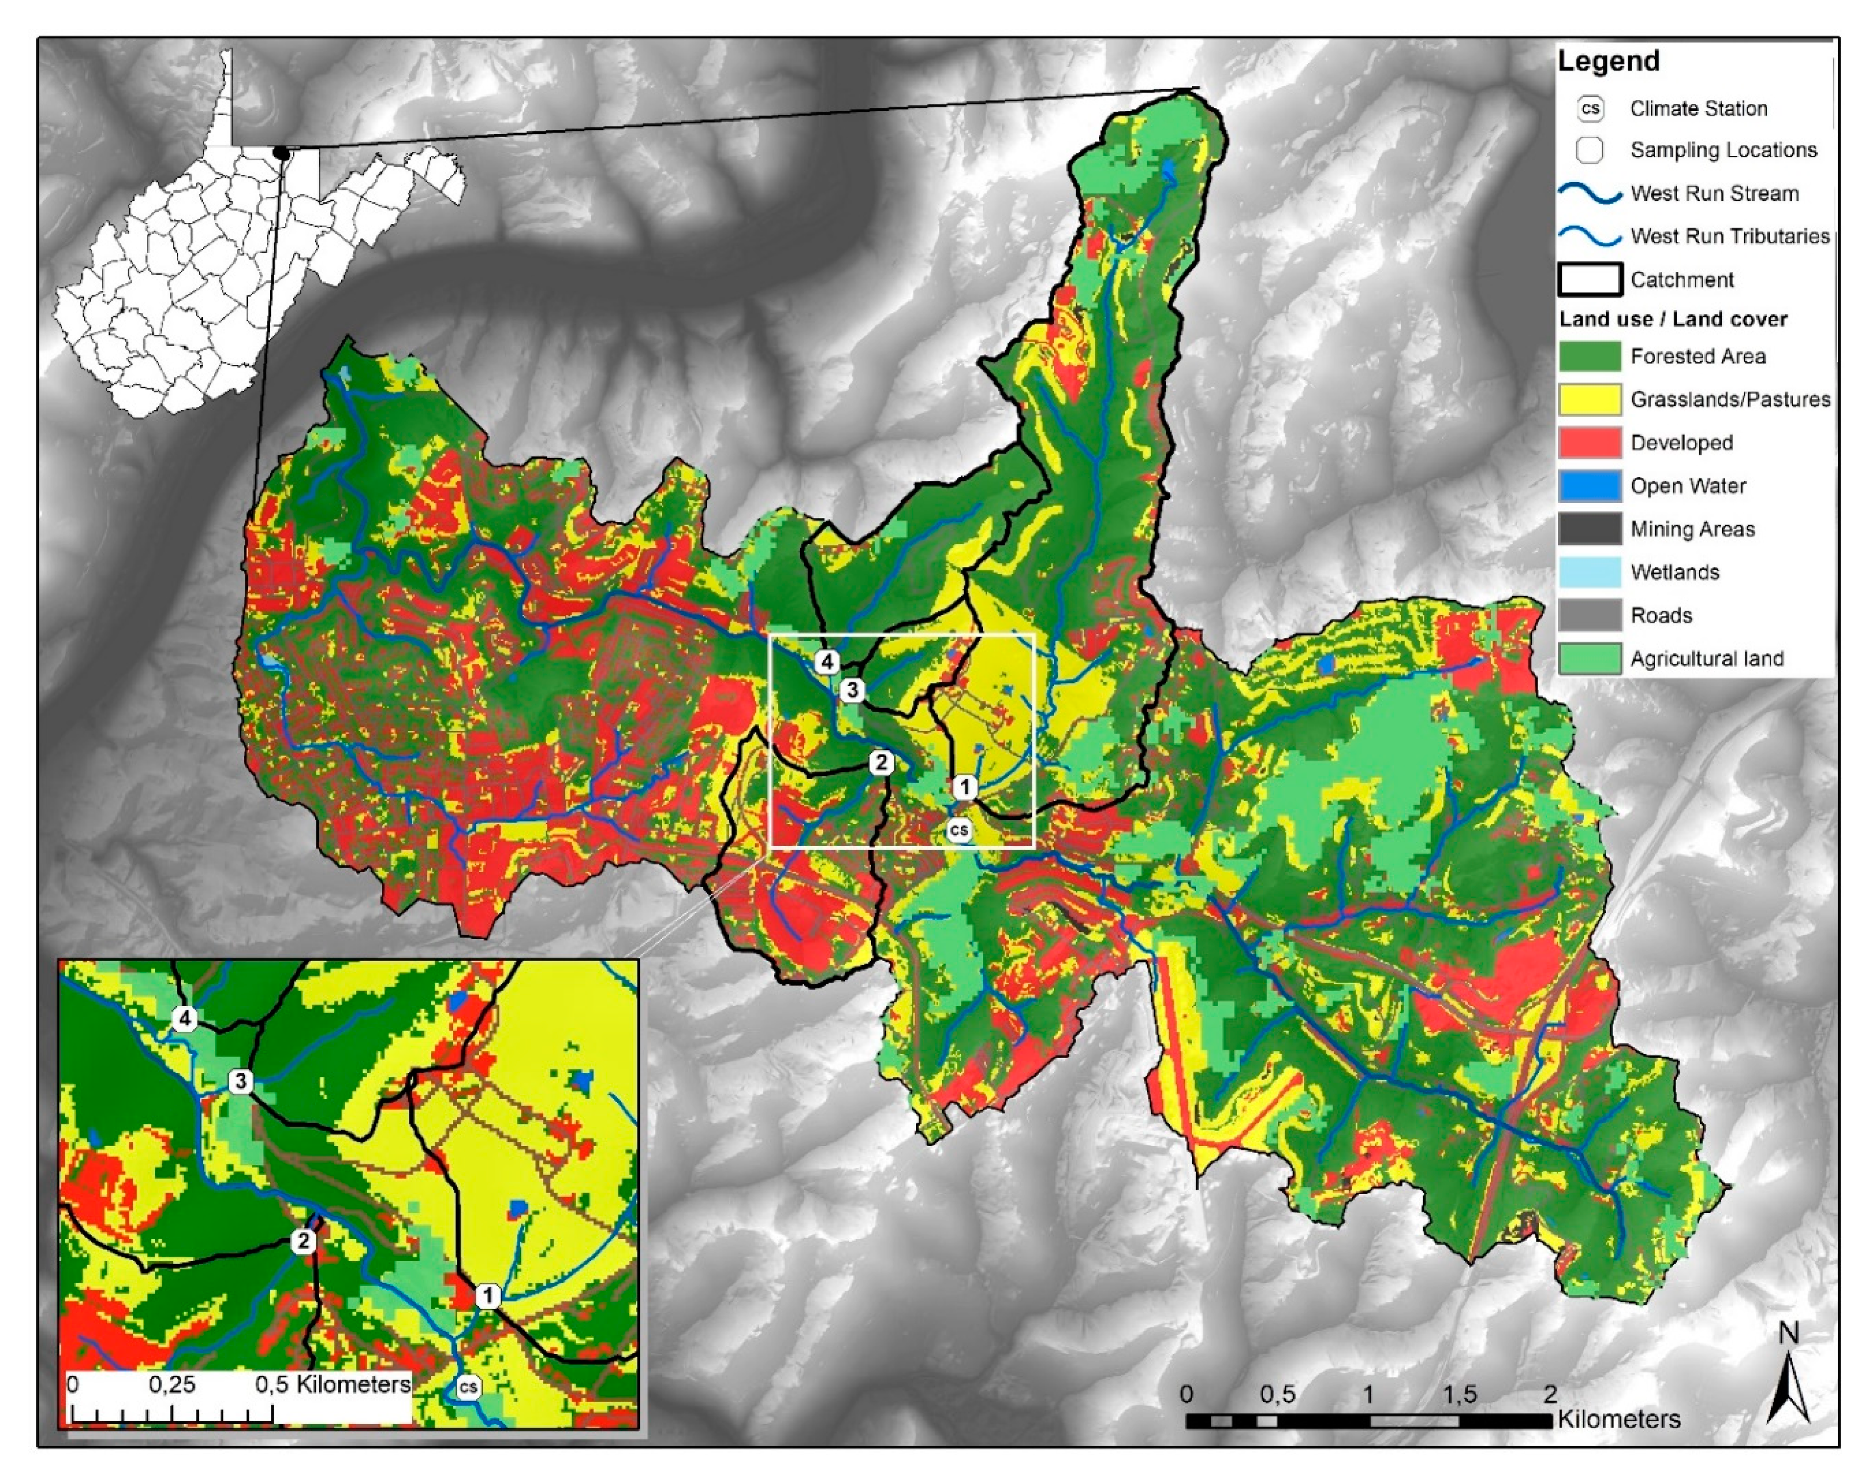
For the current investigation, a study design including four monitoring sites (gauged sampling locations) was implemented. The sites included varying land use practices (Table 1) and (numbered in downstream order) consisted of 1st and 2nd order confluence tributaries of the West Run Creek (Figure 1). A combination of geographic information system (GIS) data and field surveys were implemented to identify study sites and associated sub-catchments. At the time of this investigation, Site #1 comprised developed and forested lands in the upper sub-catchment, and actively grazed pasture in the lower sub-catchment. The primarily urban site (Site #2) drained a commercial area located on the southern side of the Watershed. Site #3 drained a local farm which includes dairy cattle grazing pastures, holding pens, and livestock manure stacks. Site #4 comprised predominantly (82.4%) forested land use and served as a reference sub-catchment (control) for the current work.
2.2. Data Collection
During the study period (20 July 2018–27 October 2018), climate data were recorded using research-grade climate instrumentation located within approximately 100 m of Site #1 (Figure 1). The climate variables (recorded at a height of 3 m) included precipitation (TE525 Tipping Bucket Rain Gauge), average air temperature and relative humidity (Campbell Scientific HC2S3 Temperature and Relative Humidity Probe), and average wind speed (Met One 034B Wind Set instrument).
Stream water grab-samples were collected following the USGS methods described in the National Field Manual for the Collection of Water-Quality Data [39] and as per Petersen et al. [35], Hubbart et al. [40], Kellner and Hubbart [41], and Zeiger and Hubbart [42,43] from each monitoring site (stream order ≤3). The sampling regime was determined by stream stage (based on the streamflow descriptions by Zeiger and Hubbart [42]) at the sites to ensure sample extraction occurred during low (approximately 25% bankfull), medium (approximately 40–60% bankfull) and high(er) (approximately >60% bankfull) stages. This sampling regime facilitated a distributed SPM concentration data set, providing for robust investigation of the general relationship between SPM and E. coli concentration. The stream stage-based sampling regime resulted in irregular sample collection. For example, multiple samples were collected on some days during runoff events (leading and receding limbs of hydrograph, etc.) and other consequent samples extracted multiple days apart. During the course of the investigation, 32 samples were collected from each of the sampling locations. Following collection, the samples were transported to the Interdisciplinary Hydrology Laboratory (https://www.researchgate.net/lab/The-Interdisciplinary-Hydrology-Laboratory-Jason-A-Hubbart), located in the Davis College of Agriculture, Natural Resources and Design at West Virginia University, for analyses. Previous investigations have implemented one filter size (size varies between studies) to separate particle-attached from free-living microbes [13,44,45,46], although, as noted above, no widely established method exists. During the current investigation, the extracted water grab-samples were subdivided into three water sub-samples. One subsample was processed as per the standard Colilert test (see below) procedures and incubated without filtration (i.e., normal sample processing), while the other two subsamples were filtered using different filter matrices (60 µm and 5 µm), processed (as below) and then incubated. Hydrophilic, nylon net, Merck Millipore filters were used for filtration. The filtration of the samples resulted in water samples containing SPM and E. coli of sizes <60 µm and <5 µm, respectively. Therefore, after incubating the samples (process described below), the E. coli concentrations of the total sample and the <60 µm and <5 µm sizes were known. Subsequently, subtracting the E. coli concentration in the <60 µm filtered sample from the E. coli concentration of the total sample thus yielded the E. coli concentration in the respective SPM size class interval. Additionally, the E. coli concentrations in the <5 µm size were subtracted from the <60 µm size, resulting in E. coli concentration data for the intermediate (5 µm < interval < 60 µm) interval. The selection of the filter aperture was determined by approximate soil particle size classifications (i.e., larger than 60 µm = sand; smaller than 60 µm and larger than 4 µm = silt, and smaller than 4 µm = fine silt and clay) [47].
The U.S. Environmental Protection Agency (EPA)-approved Colilert test [29], developed by IDEXX Laboratories Inc., was used to quantify E. coli colony forming units (CFU) in the filtered and unfiltered samples. The test, included in Standard Methods for Examination of Water and Wastewater, was developed to estimate fecal concentration in water samples without requiring sample dilution [48,49]. The chances of obtaining inaccurate results with the test is low (chance of reporting false positives ±10%) due to a combination of Colilert’s Defined Substrate Technology (DST) nutrient-indicator (ONPG), and a selectively suppressing formulated matrix. ONPG was formulated to render the majority of non-target organisms unable to grow or interfere as they lack the enzyme to metabolize the provided carbon source [48]. The few non-target organisms that can metabolize ONPG were suppressed by the selectively suppressing formulated matrix [48].
The Colilert (ONPG) substrate was added to 100 mL of sampled water and sealed in the Quanti-Tray, prior to the 24-h incubation at 35 °C [29]. Following incubation, the number of fluorescing (positive for E. coli) wells was converted (with a 95% confidence interval) into a concentration of E. coli CFU per the 100 mL of filtered and unfiltered sample water using a Most Probable Number (MPN) table. The MPN table facilitated an estimation of the concentration value, as it yielded a number of CFU per 100 mL. The Quanti-Tray/MPN table method allowed for the estimation of E. coli concentration in the range <1 to 1011.2 CFU. The upper limit of the estimation range from the Quanti-Tray/MPN table method presented a challenge for the current investigation, as E. coli concentrations in excess of 1011 CFU per 100 mL could not be accurately estimated, as the test becomes effectively saturated. Due to the fiscal cost associated with the dilution and subsequent incubation of extracted water samples, serial dilutions were not feasible for the current work, as it would have significantly increased the number of samples to be analyzed. Regardless, the method as applied allowed for the detection of small changes in E. coli concentration, which are important for small SPM sizes (a focus of the current work), which the literature has shown to be more closely associated with pathogen persistence.
2.3. Data Analysis
Descriptive statistics were generated for E. coli and SPM concentrations aggregated to the study period level. The total E. coli concentrations (i.e., colony forming unit; CFU) from each filtration interval (<5 µm; 5 µm to 60 μm; and >60) were divided by the total unfiltered E. coli concentration. This facilitated the estimation of the average percentage E. coli concentration resultant from each respective SPM interval. This process was completed for all four sites for the duration of the study period (20 July 2018–27 October 2018). The average SPM and average E. coli concentration from each interval (n = 32) (and totals) were compared to each other to determine the average percentage difference between the sampling locations. Statistical analyses were conducted using Origin Pro 2018 (OriginLab Corporation, Northampton, MA, USA). Normality testing was completed using the Anderson Darling Test, which tests whether a sample of data is drawn from a given probability distribution (normal distribution for the current work) [50]. Ordinal logistic regression was used to explore the effect of SPM size concentrations on E. coli concentrations in the same size intervals, while also accounting for the effect of varying land use practices at the four sampling locations. This regression is used to predict an ordinal dependent variable given one or more independent variables and requires that the continuous E. coli concentration and SPM concentration data be converted to ordinal data. Therefore, the E. coli concentration and SPM concentration data were divided into tertiles in which data in the lowest tertile were assigned a value of 1, data in the second tertile were assigned a value of 2, and data in the upper tertiles were assigned a value of 3. Following the conversion to ordinal data, the regression was calculated using JMP software (JMP®, Version Pro 12.2, SAS Institute Inc., Cary, NC, USA, Copyright ©2015), following the method presented by Stokes et al. [51]. The significance threshold for all statistical tests was set at α = 0.05. Principal component analysis (PCA) was used to investigate the relationships between E. coli concentrations, SPM and land use practices for both the smallest interval (<5 µm) and the total values (presented in biplots) across all four sampling locations.
3. Results
3.1. Climate during Study
During the study period (20 July 2018–27 October 2018), the total precipitation was 449 mm, the average air temperature was 19 °C, the relative humidity was 82.7%, and the average wind speed was 0.89 m/s. Historic records since 2007 [52] indicated that the study period comprised normal temperatures (average 19 °C), but received 99 mm more precipitation than average (350 mm). A monthly analysis of climate data showed that the month of July included normal average monthly temperatures (difference between recorded values and average was less than 1 °C) for the time period (22 °C). However, there was approximately 20 mm less precipitation than average [52]. Conversely, August had average temperatures that were 2 °C cooler than average and the month was approximately 39 mm wetter than average [52]. Precipitation during September (186mm) was more than double the long-term average (80mm), but the average temperature was consistent with the long-term average (18 °C). October also exhibited long-term average temperatures (12 °C); however, it was drier than average, receiving approximately 25mm less precipitation.
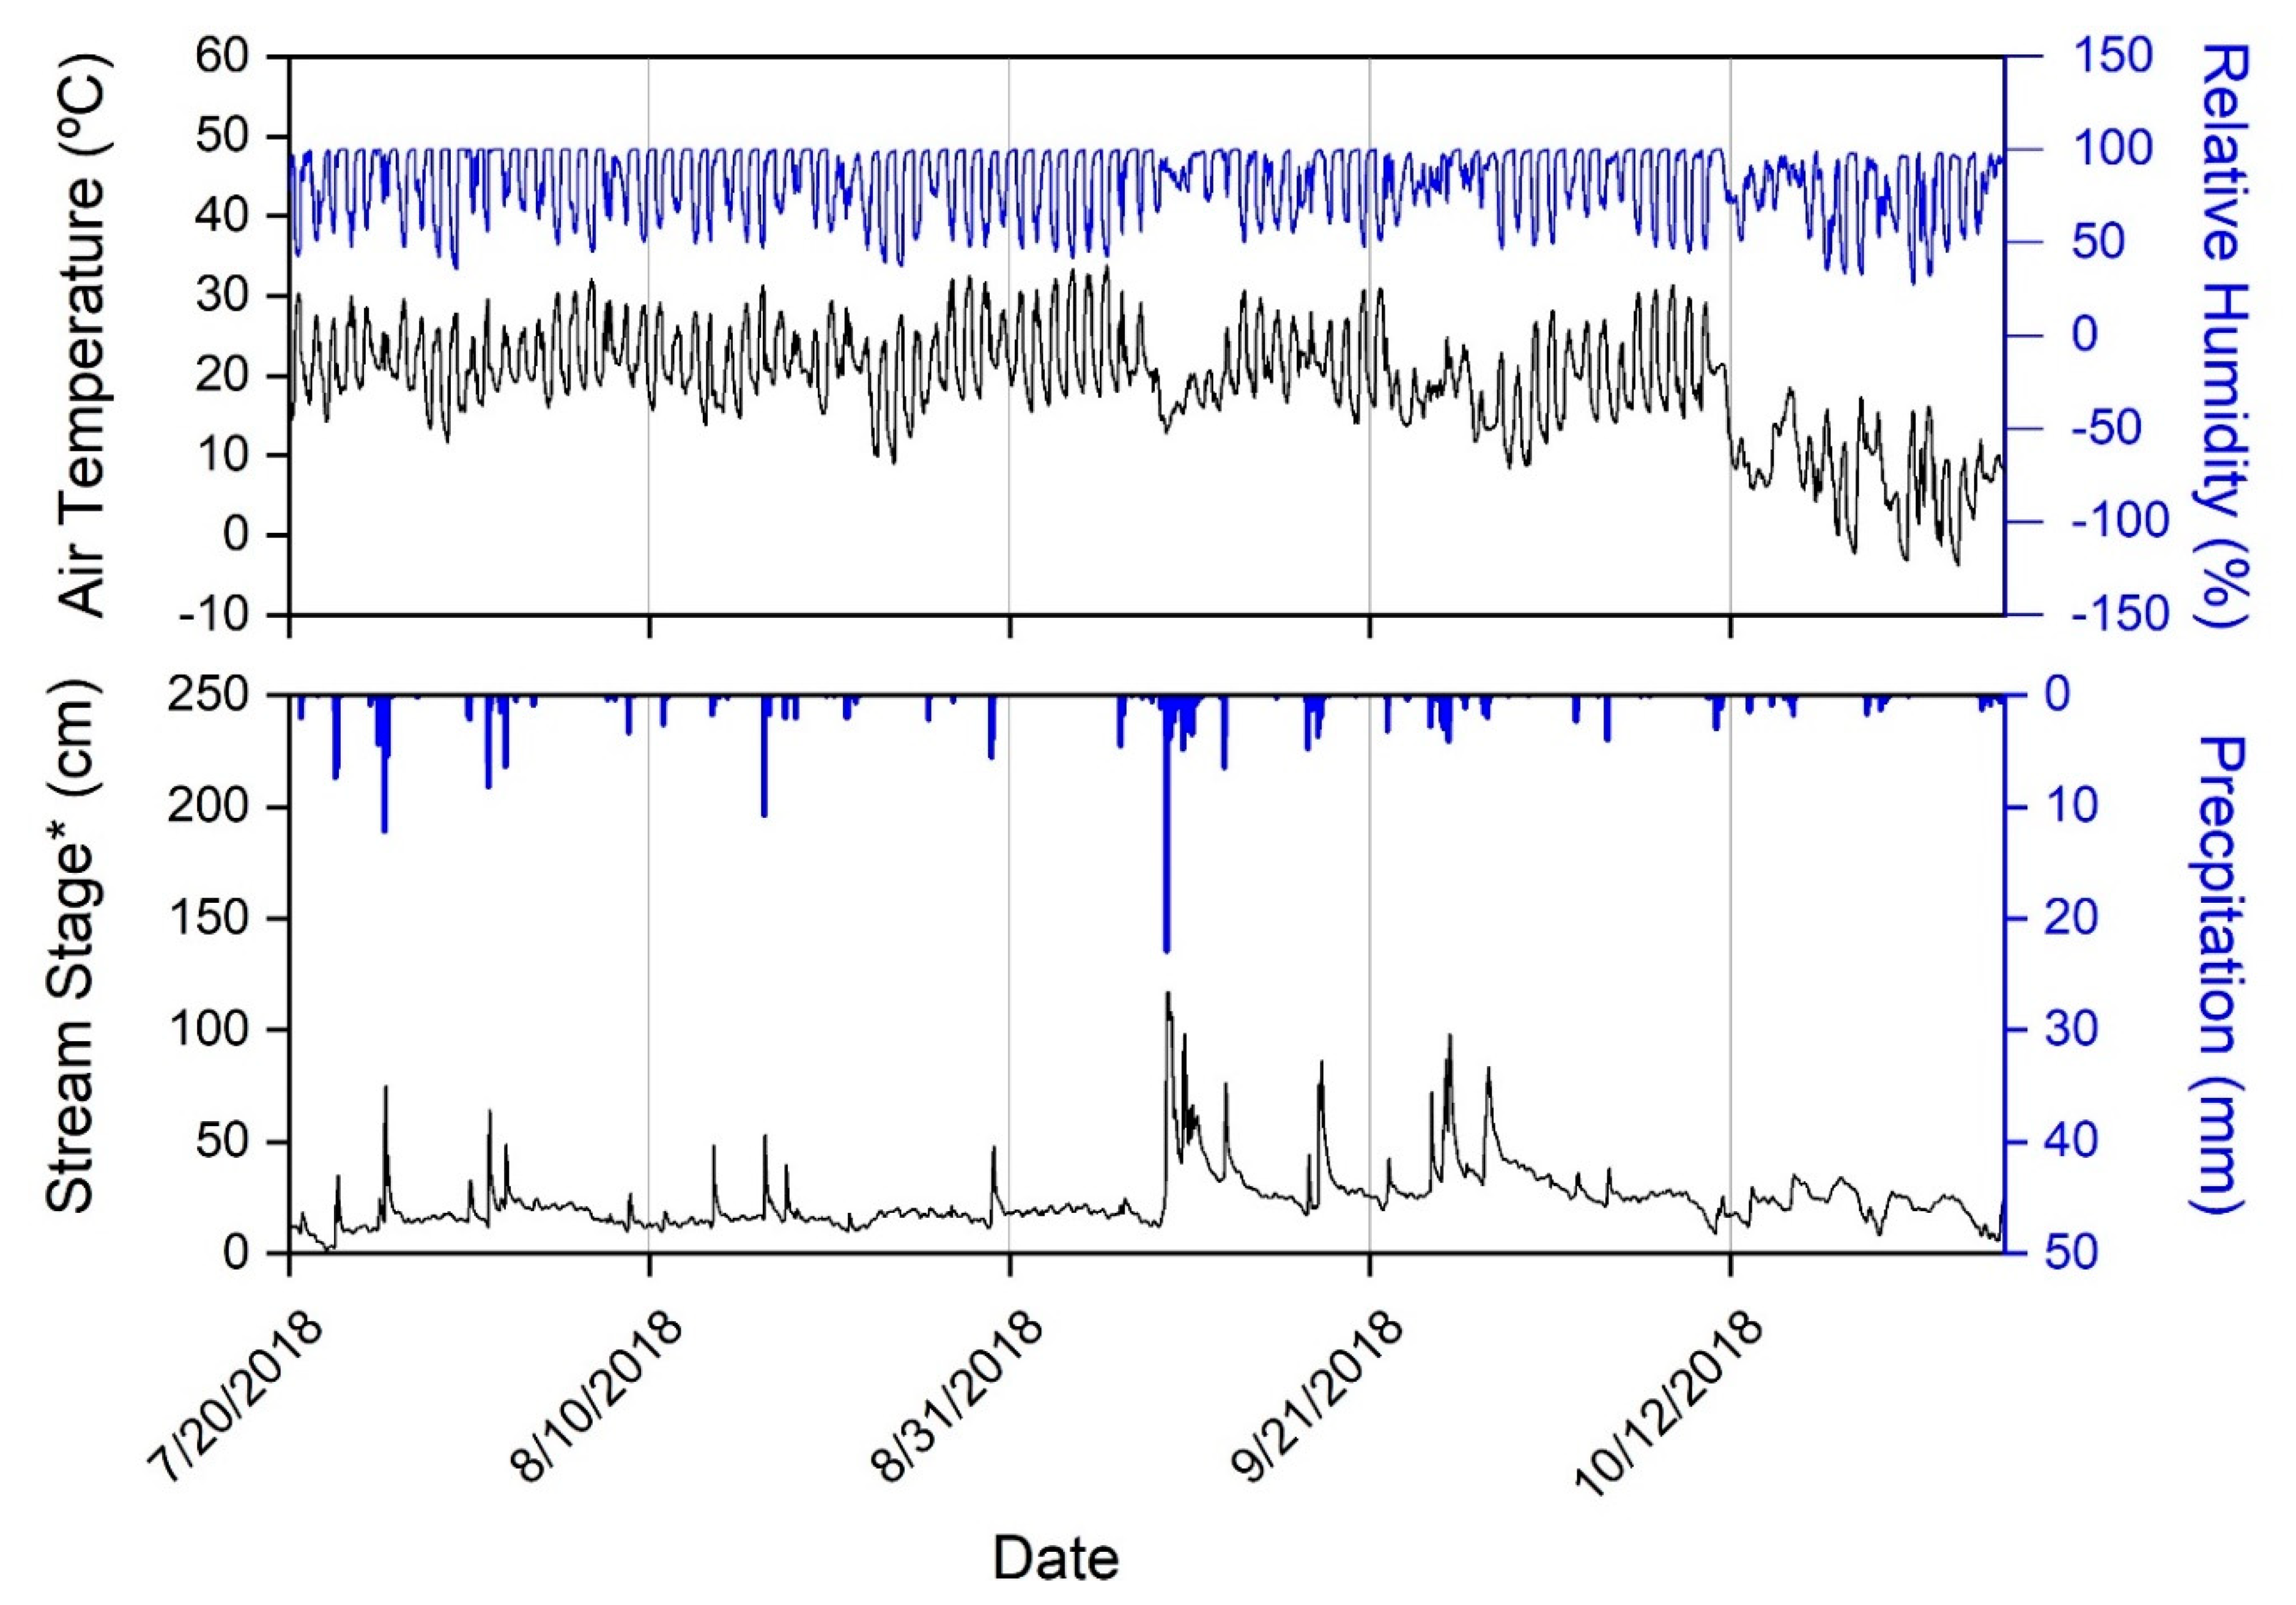
The climate during the period of study (20 July 2018–27 October 2018) was predictably variable and consistent with historic trends (Figure 2). The weather was characteristically humid and warm at the start of the investigation, with temperatures decreasing with transition to winter. As previously noted, stream stage was used to determine the timing of sampling events given that streamflow (depth and velocity) is directly related to SPM transport processes and has been reported to influence E. coli concentrations with elevated concentrations typically occurring during high flows [53]. This approach facilitated the opportunity to investigate the relationship between E. coli and SPM size under a variety of hydrologic conditions. Thus, climatic conditions that could directly influence stream stage, such as precipitation, were particularly important for this work. During the investigation large precipitation events (e.g., 7/25 and 9/9) resulted in maximum stream stages, while drier periods (e.g., 10/12) resulted in low stream stages, as is common in late summer in the region (Figure 2) [35].
3.2. Suspended Particulate Matter Concentrations and Escherichia coli
The average total SPM concentration (38.52 mg L−1) was the highest at Site #3, which included 49.1% forested area, the highest percentage of agricultural land-use (42.1%) and the highest maximum SPM (402 mg L−1). Site #3 also had the largest standard deviation of SPM (83.91 mg L−1), almost double the standard deviation of the second highest standard deviation (Site #4: 43.28 mg L−1). Site #1 had the highest median (10.83 mg L−1) and minimum (0.67 mg L−1) SPM values. Conversely, Site #2 had the lowest average SPM (12.25 mg L−1), maximum (70 mg L−1), median SPM (2.67 mg L−1), and minimum (0 mg L−1) among the sampled sites.
Site #2 (land use: 40.6% developed, Table 1) had the lowest average E. coli concentration (596 CFU per 100 mL) and the lowest median (629 CFU per 100 mL) among the sites. The lowest minimum E. coli concentration (38 CFU per 100 mL) was recorded at Site #4 (82.4% forested). Conversely, the highest mean value for E. coli concentration (708 CFU per 100 mL), the highest median value for E. coli concentration (961 CFU per 100 mL), and the lowest standard deviation (351 CFU per 100 mL) were recorded at Site #3 (42.1% Agricultural, and 49.1% Forested). Site #1, which had the second highest percentage of agricultural land use (31.8%) among the sub-catchments, had the second highest mean value for E. coli concentration (676 CFU per 100 mL), the second highest median value for E. coli concentration (813 CFU per 100 mL), and second lowest standard deviation (355 CFU per 100 mL).
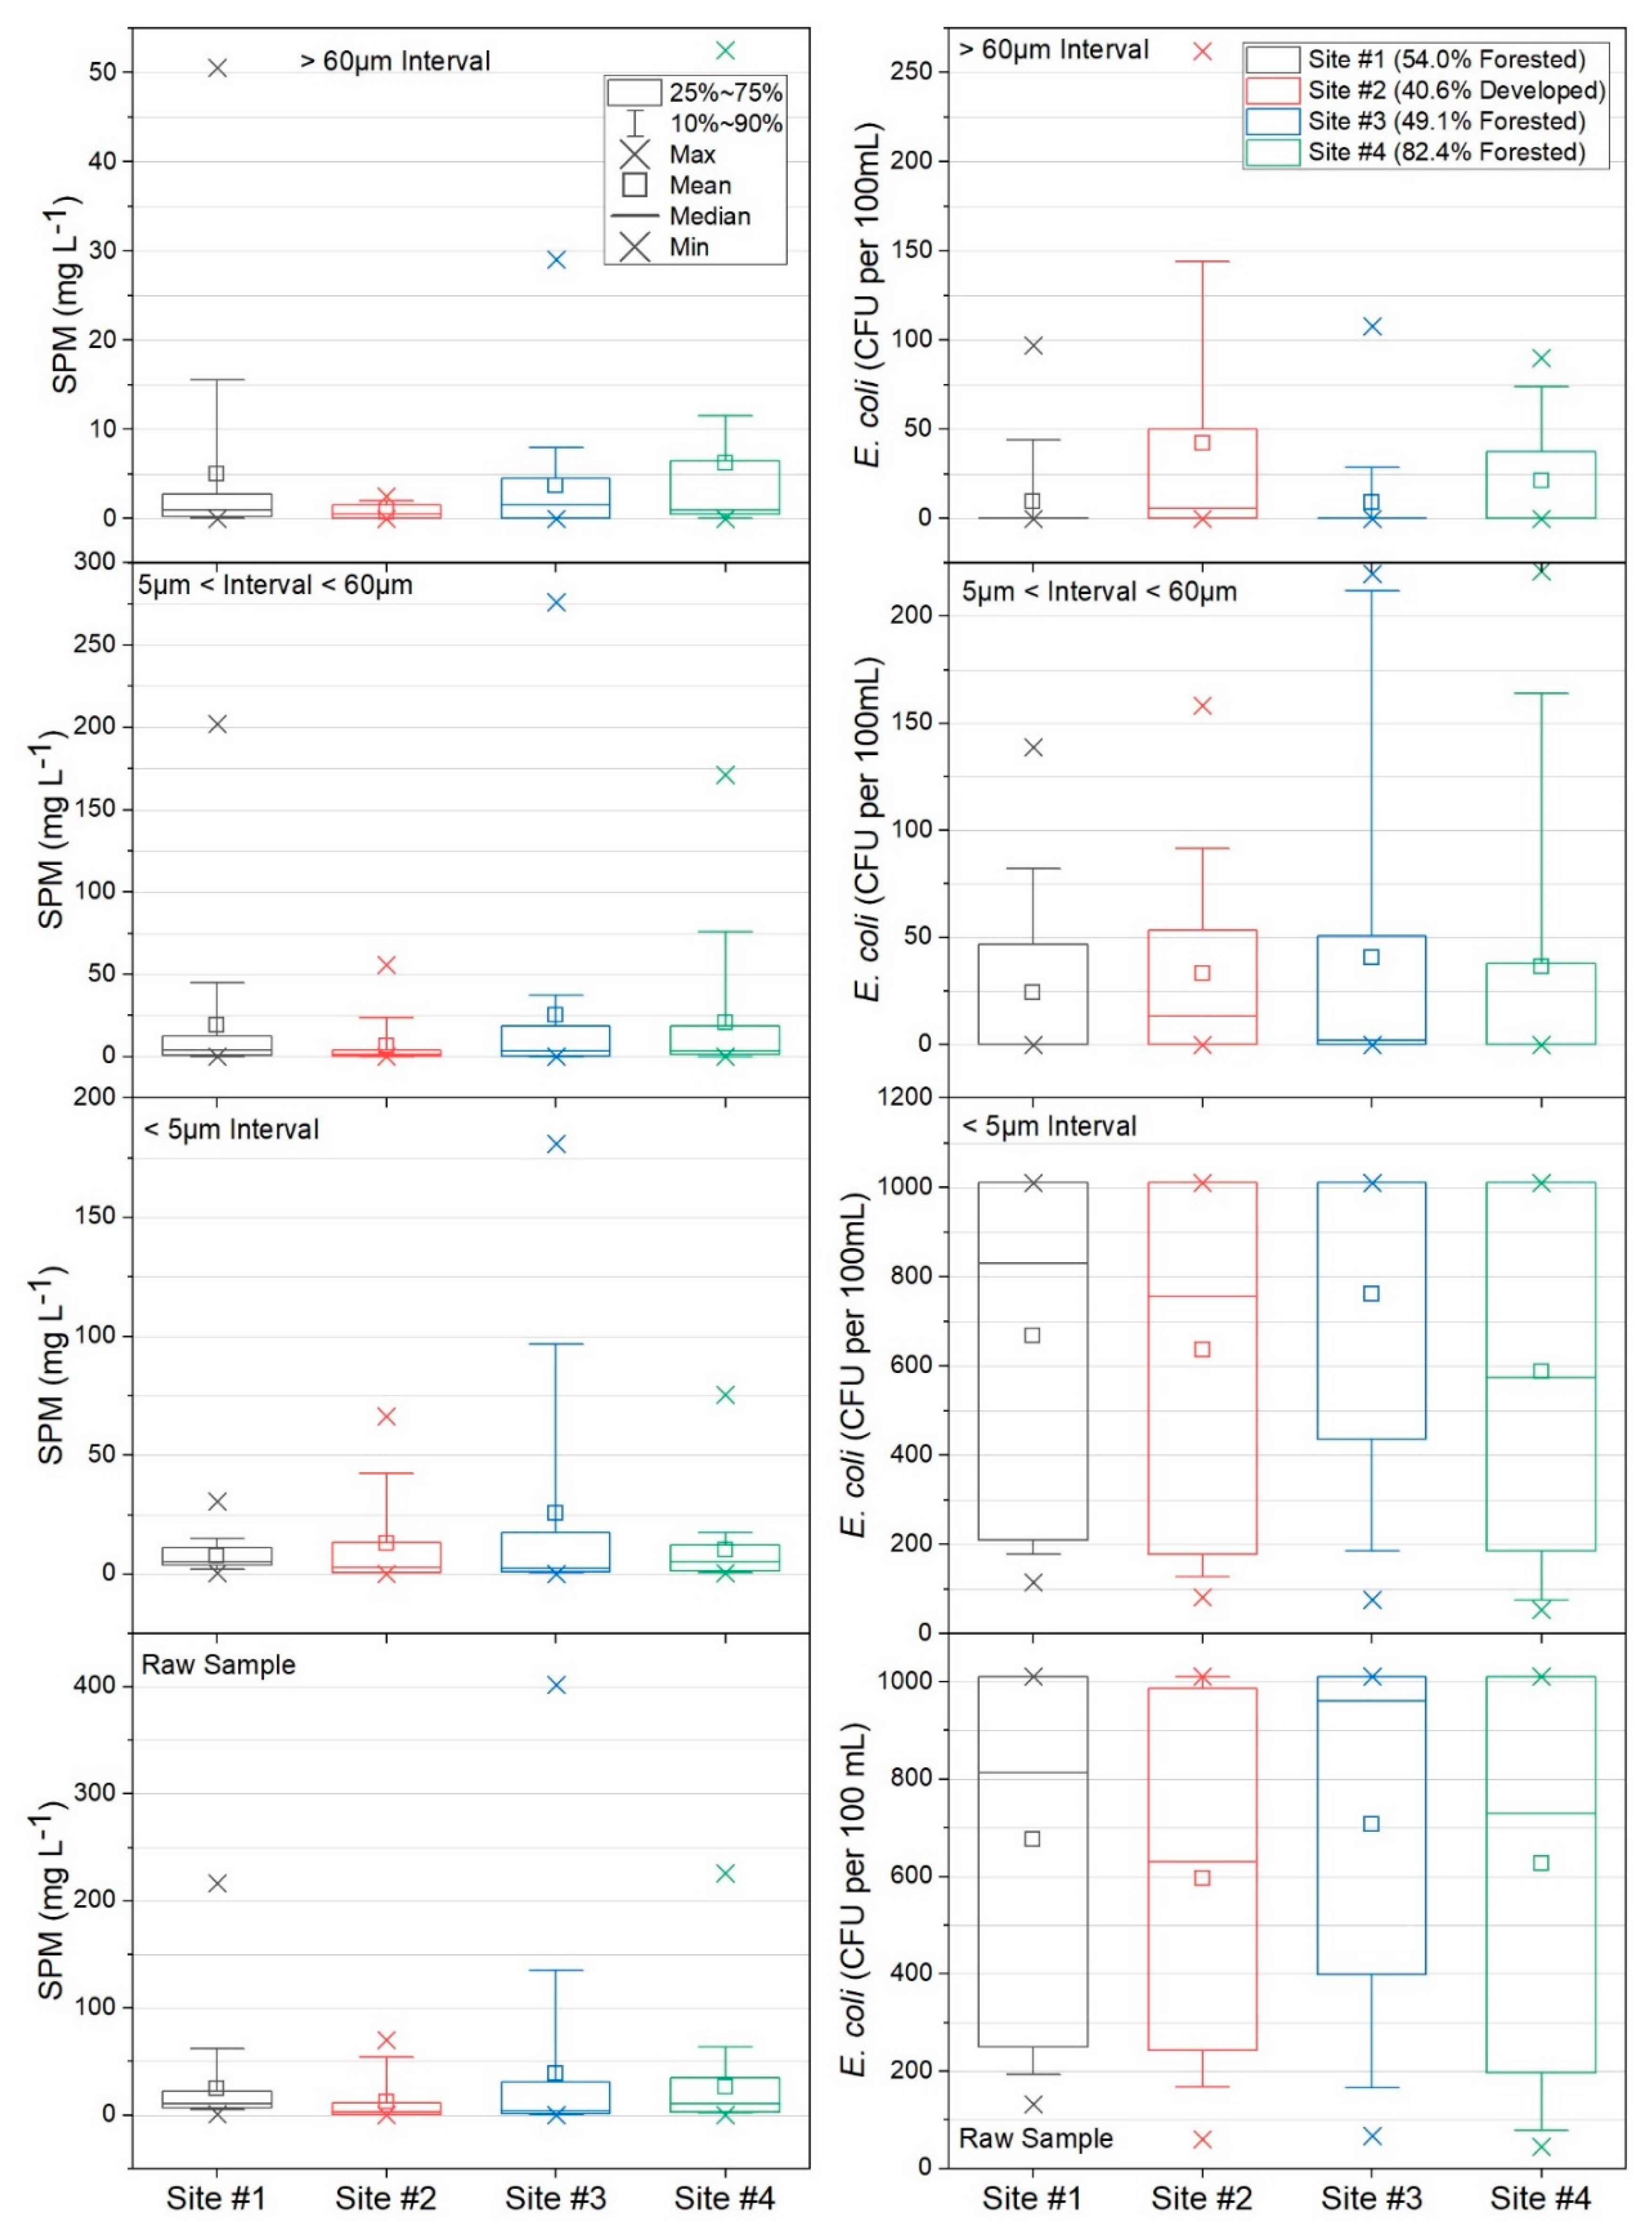
Box and whisker plots reflecting descriptive statistics of SPM (mg L−1) and E. coli concentration (CFU per 100 mL) are provided in Figure 3. In the >60 µm interval, Site #2 (40.6 % developed) had both the smallest SPM concentration range (0–2.5 mg L−1) and the largest E. coli concentration range (0–262 CFU per 100 mL). However, in the 5 to 60 µm particle size class, Site #4 (82.4% forested) had the largest SPM concentration range (0–171.5 mg L−1), whereas Site #3 (49.1% forested and 42.1% agriculture) had the largest E. coli concentration range (0–276 CFU per 100 mL). In the <5 µm interval, Site #3 had the highest SPM (0–181 mg L−1) and E. coli concentration values (0–1011 CFU per 100 mL), while Site #1 (54% forested) had the lowest SPM concentration range (0–30.5 mg L−1) and Site #4 (82.4% forested) generally had the lowest E. coli concentration values. The raw (unfiltered) samples had a similar distribution to the <5 µm interval, with Site #3 again featuring the highest SPM (0–402 mg L−1) and E. coli concentration values (0–1011 CFU per 100 mL). Similarly, Site #1 (54% forested) comprised the lowest SPM concentration range (0–216 mg L−1); however, Site #2 generally had the lowest E. coli concentration values (Figure 3).
3.3. Non-Parametric Statistical Analysis
Normality test results indicated that E. coli concentration data were non-normally distributed, thus a non-parametric statistical method was used for further analysis. Due to the detection range (including an upper limit) of the Colilert method, ordinal logistic regression was deemed the most suitable form of regression to analyze the data [51]. E. coli concentration data for all sites were used as the dependent variable with the corresponding size interval, SPM and land use percentages (forest %, agriculture %, and developed %) data from all sites used as independent (explanatory) variables. Across the sites, the results indicate that size interval (α < 0.0001), and SPM (α = 0.05) showed statistically significant relationships with E. coli concentration. Percentage of land use practices across all sites did not display any statistically significant correlations with E. coli concentrations, with the percentage of forested land, percentage of agricultural land and percentage of developed land having significance levels (α) of 0.8425, 0.8478, and 0.9031, respectively.
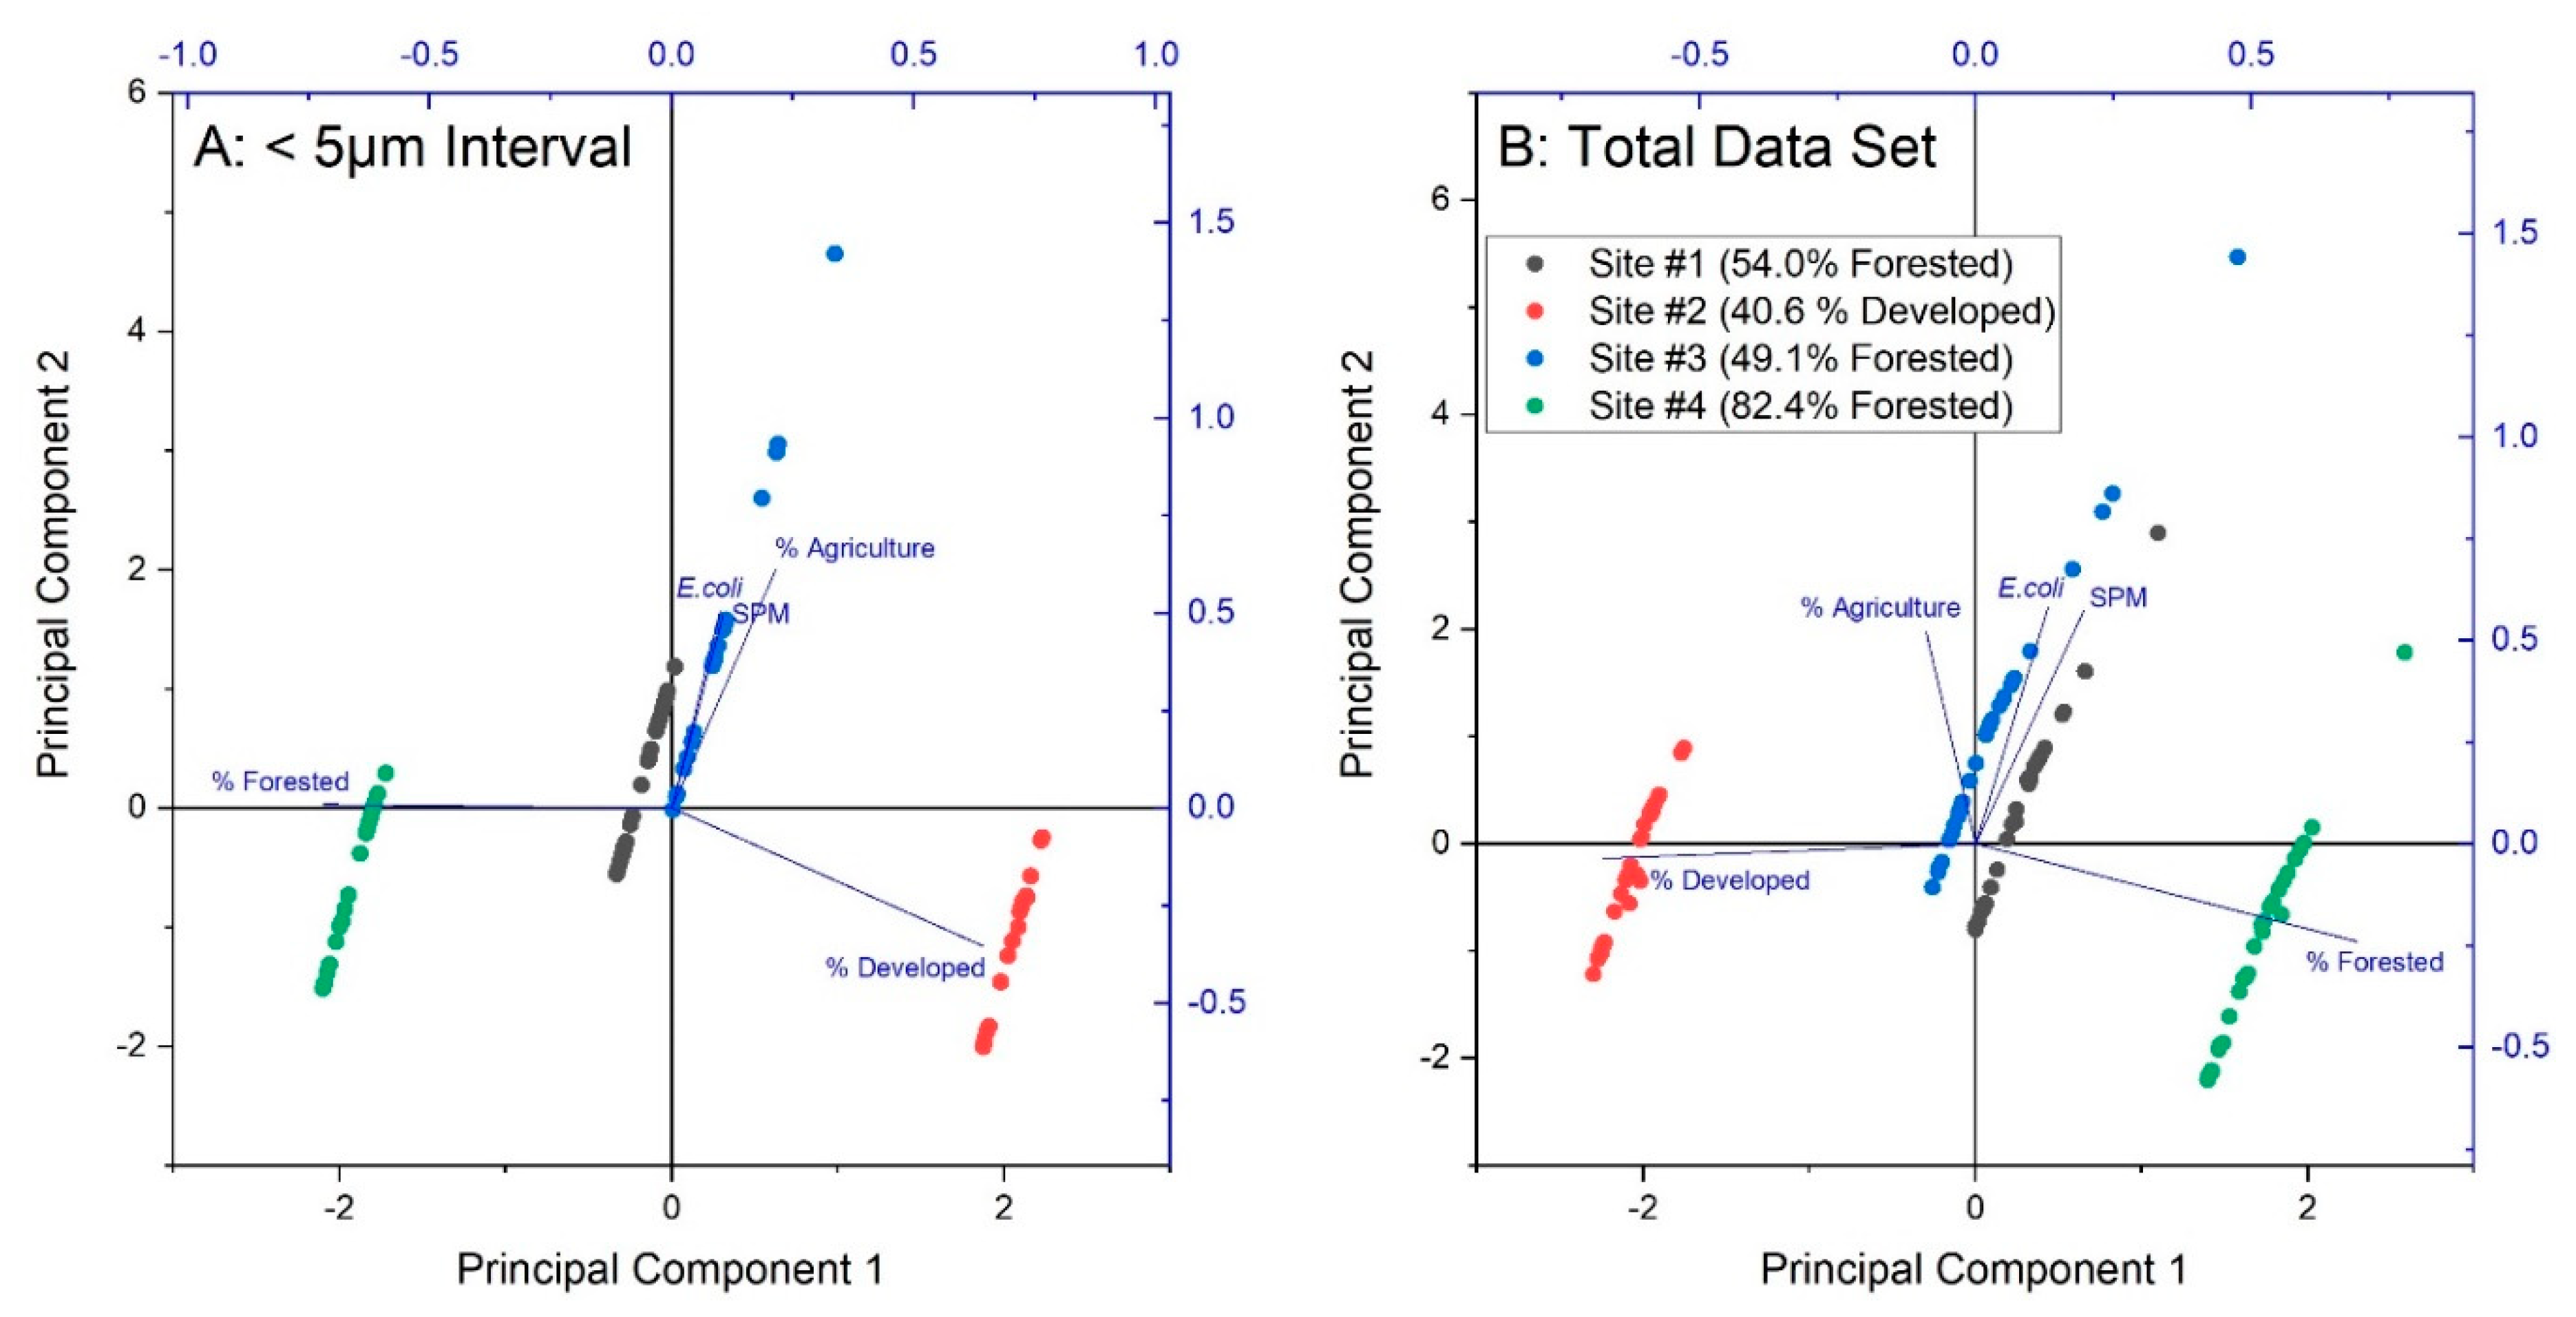
The results from the initial PCA identify two principal components with eigenvalues exceeding 1, an accepted threshold of importance [54] for the smallest interval (<5 µm) (Table 2). E. coli concentrations (Eigenvalue = 1.89) and SPM concentrations (Eigenvalue = 1.35) explained approximately 65% of the cumulative variance of the smallest interval data set. The percentage of agricultural land comprised an Eigenvalue of 0.91 and its inclusion accounted for 83% of the cumulative variance of the smallest interval data set. For the total data set (defined as all he SPM and E. coli data >0.7 µm) PCA, three principal components were identified with eigenvalues exceeding 1; E. coli concentration (1.90), SPM concentration (1.42) and the percentage of agricultural land (1.01) and accounted for 87% of the cumulative variance of the total data set (Table 2). For both PCAs, the percentage of forested land and percentage of developed land accounted for relatively small percentages of variance in the data. Specifically, in the smallest interval, 17% and 0.1% of the variance of the data were accounted for by the percentage of forested land and the percentage of developed land, respectively. Similarly, for the total data set, forested land use accounted for 13% of the data variance and the percentage of developed land accounted for 0.04%.
4. Discussion
4.1. E. coli and SPM Concentrations
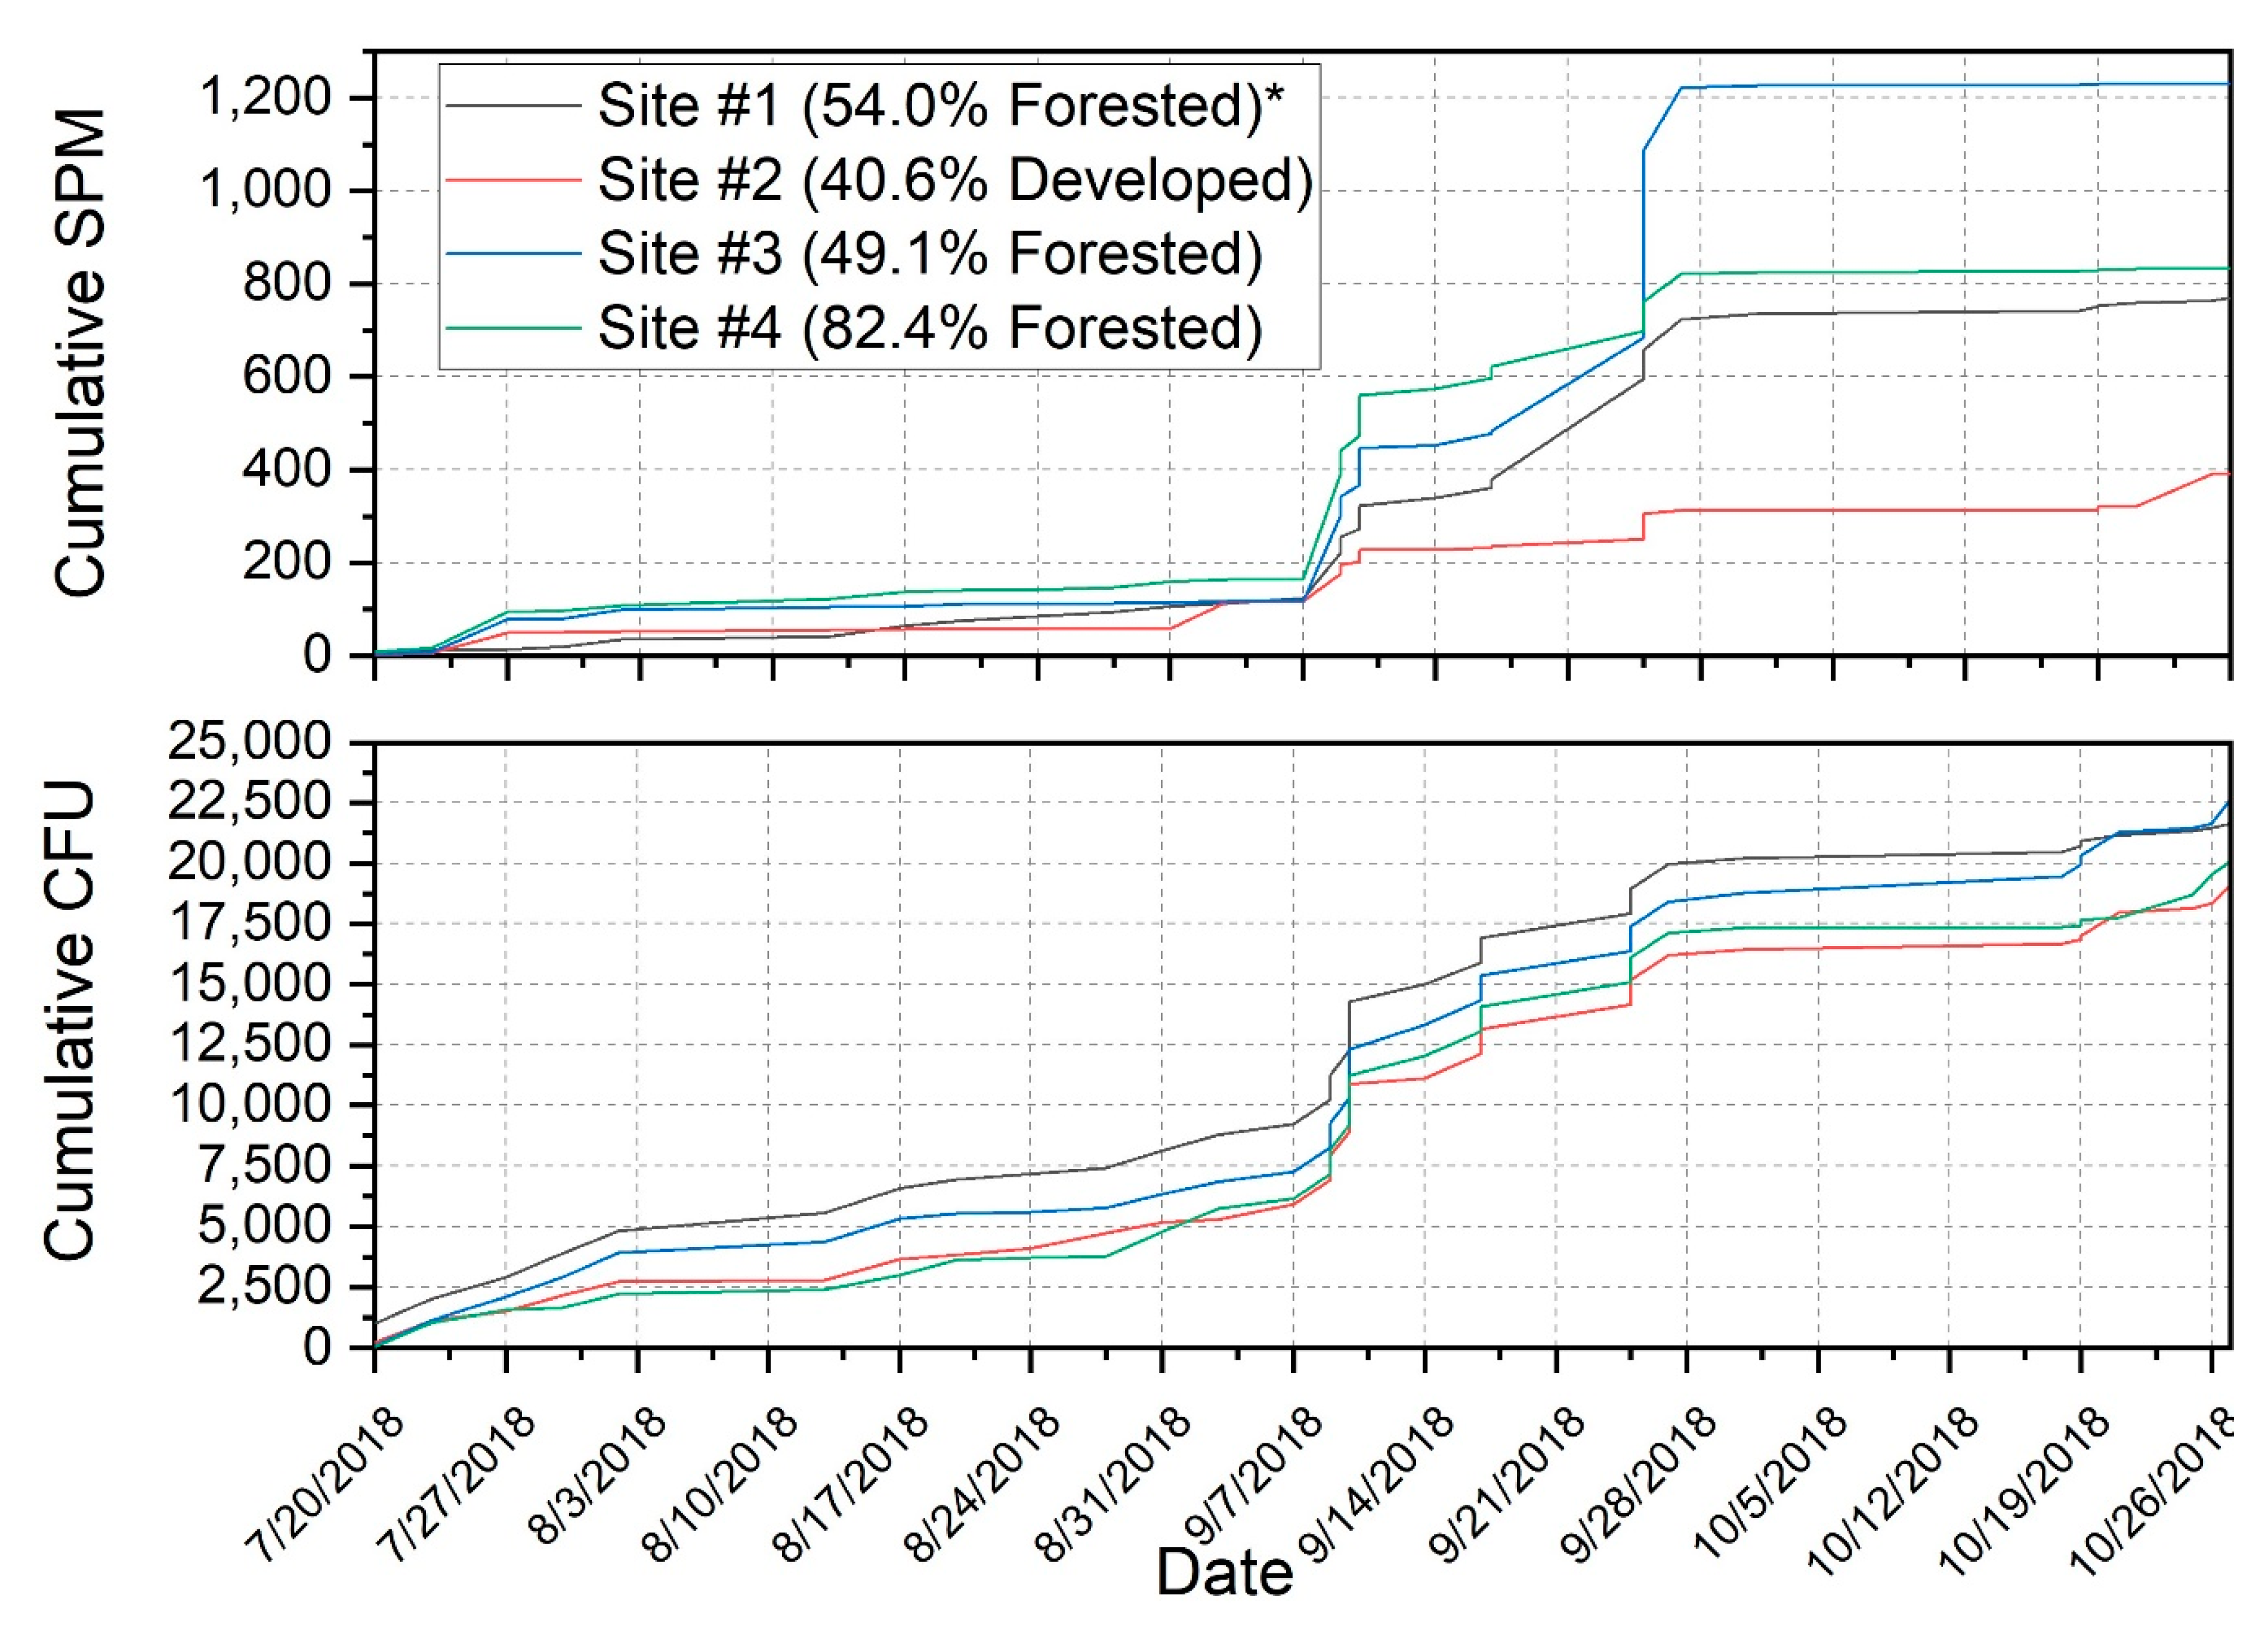
At the time of this study, Site #3 (Table 1) had the highest percentage of agricultural land use among the study sites (42.1%) and comprised the greatest cumulative SPM (1232 mg L−1) (Figure 4). The cumulative SPM recorded at Site #3 was more than three times the cumulative SPM recorded at Site #2 (40.6% developed), which had the lowest cumulative SPM (391 mg L−1). Previous studies investigating land use practices and SPM also recorded elevated levels of SPM in agricultural land use areas, thereby supporting the results from Site #3 [55]. The flattened cumulative curves (Figure 4) from 28 September 2018 to 19 October 2018 reflect a lack of sample collection during a period of negligible rainfall (and thus runoff; see Figure 2). Cumulative E. coli was the highest at Site # 1 (21632 CFU per 100 mL) and Site #3 (22641 CFU per 100 mL) during the sampling period (20 July 2018–27 October 2018) (Figure 4). These two sites drained the highest (42.1%; Site 3) and second highest (31.8%; Site #1) area of agricultural land use practices among the sampled sites (Table 1). The results are supported by previous work that showed increased fecal matter content with agricultural land use practices [53,56]. Conversely, Site #2 and Site #4 had the lowest cumulative E. coli CFU (19082 CFU per 100 mL and 20080 CFU per 100 mL, respectively) during the study period. Site #4′s low cumulative E. coli CFU was anticipated, as this site consisted primarily of forested land use (82.4%) (Table 1) and previous work showed negative correlations between fecal concentration and forest land cover [56]. Furthermore, Site #4 lacked artificial sources of E. coli (e.g., livestock manure stacks present at Site #3), which could have increased the E. coli concentration in its receiving waters. The low cumulative E. coli CFU recorded at Site #2 is contrary to results from previous work linking urban land use practices to increased E. coli concentrations in receiving waters [57,58,59]. Given the differing study design (sampling regime) relative to other studies, these differences are not confounding. It is, however, worth noting that in cases where the current study agreed with previous studies, those agreements are important, given the different sampling regime and yet agreement(s) in results.
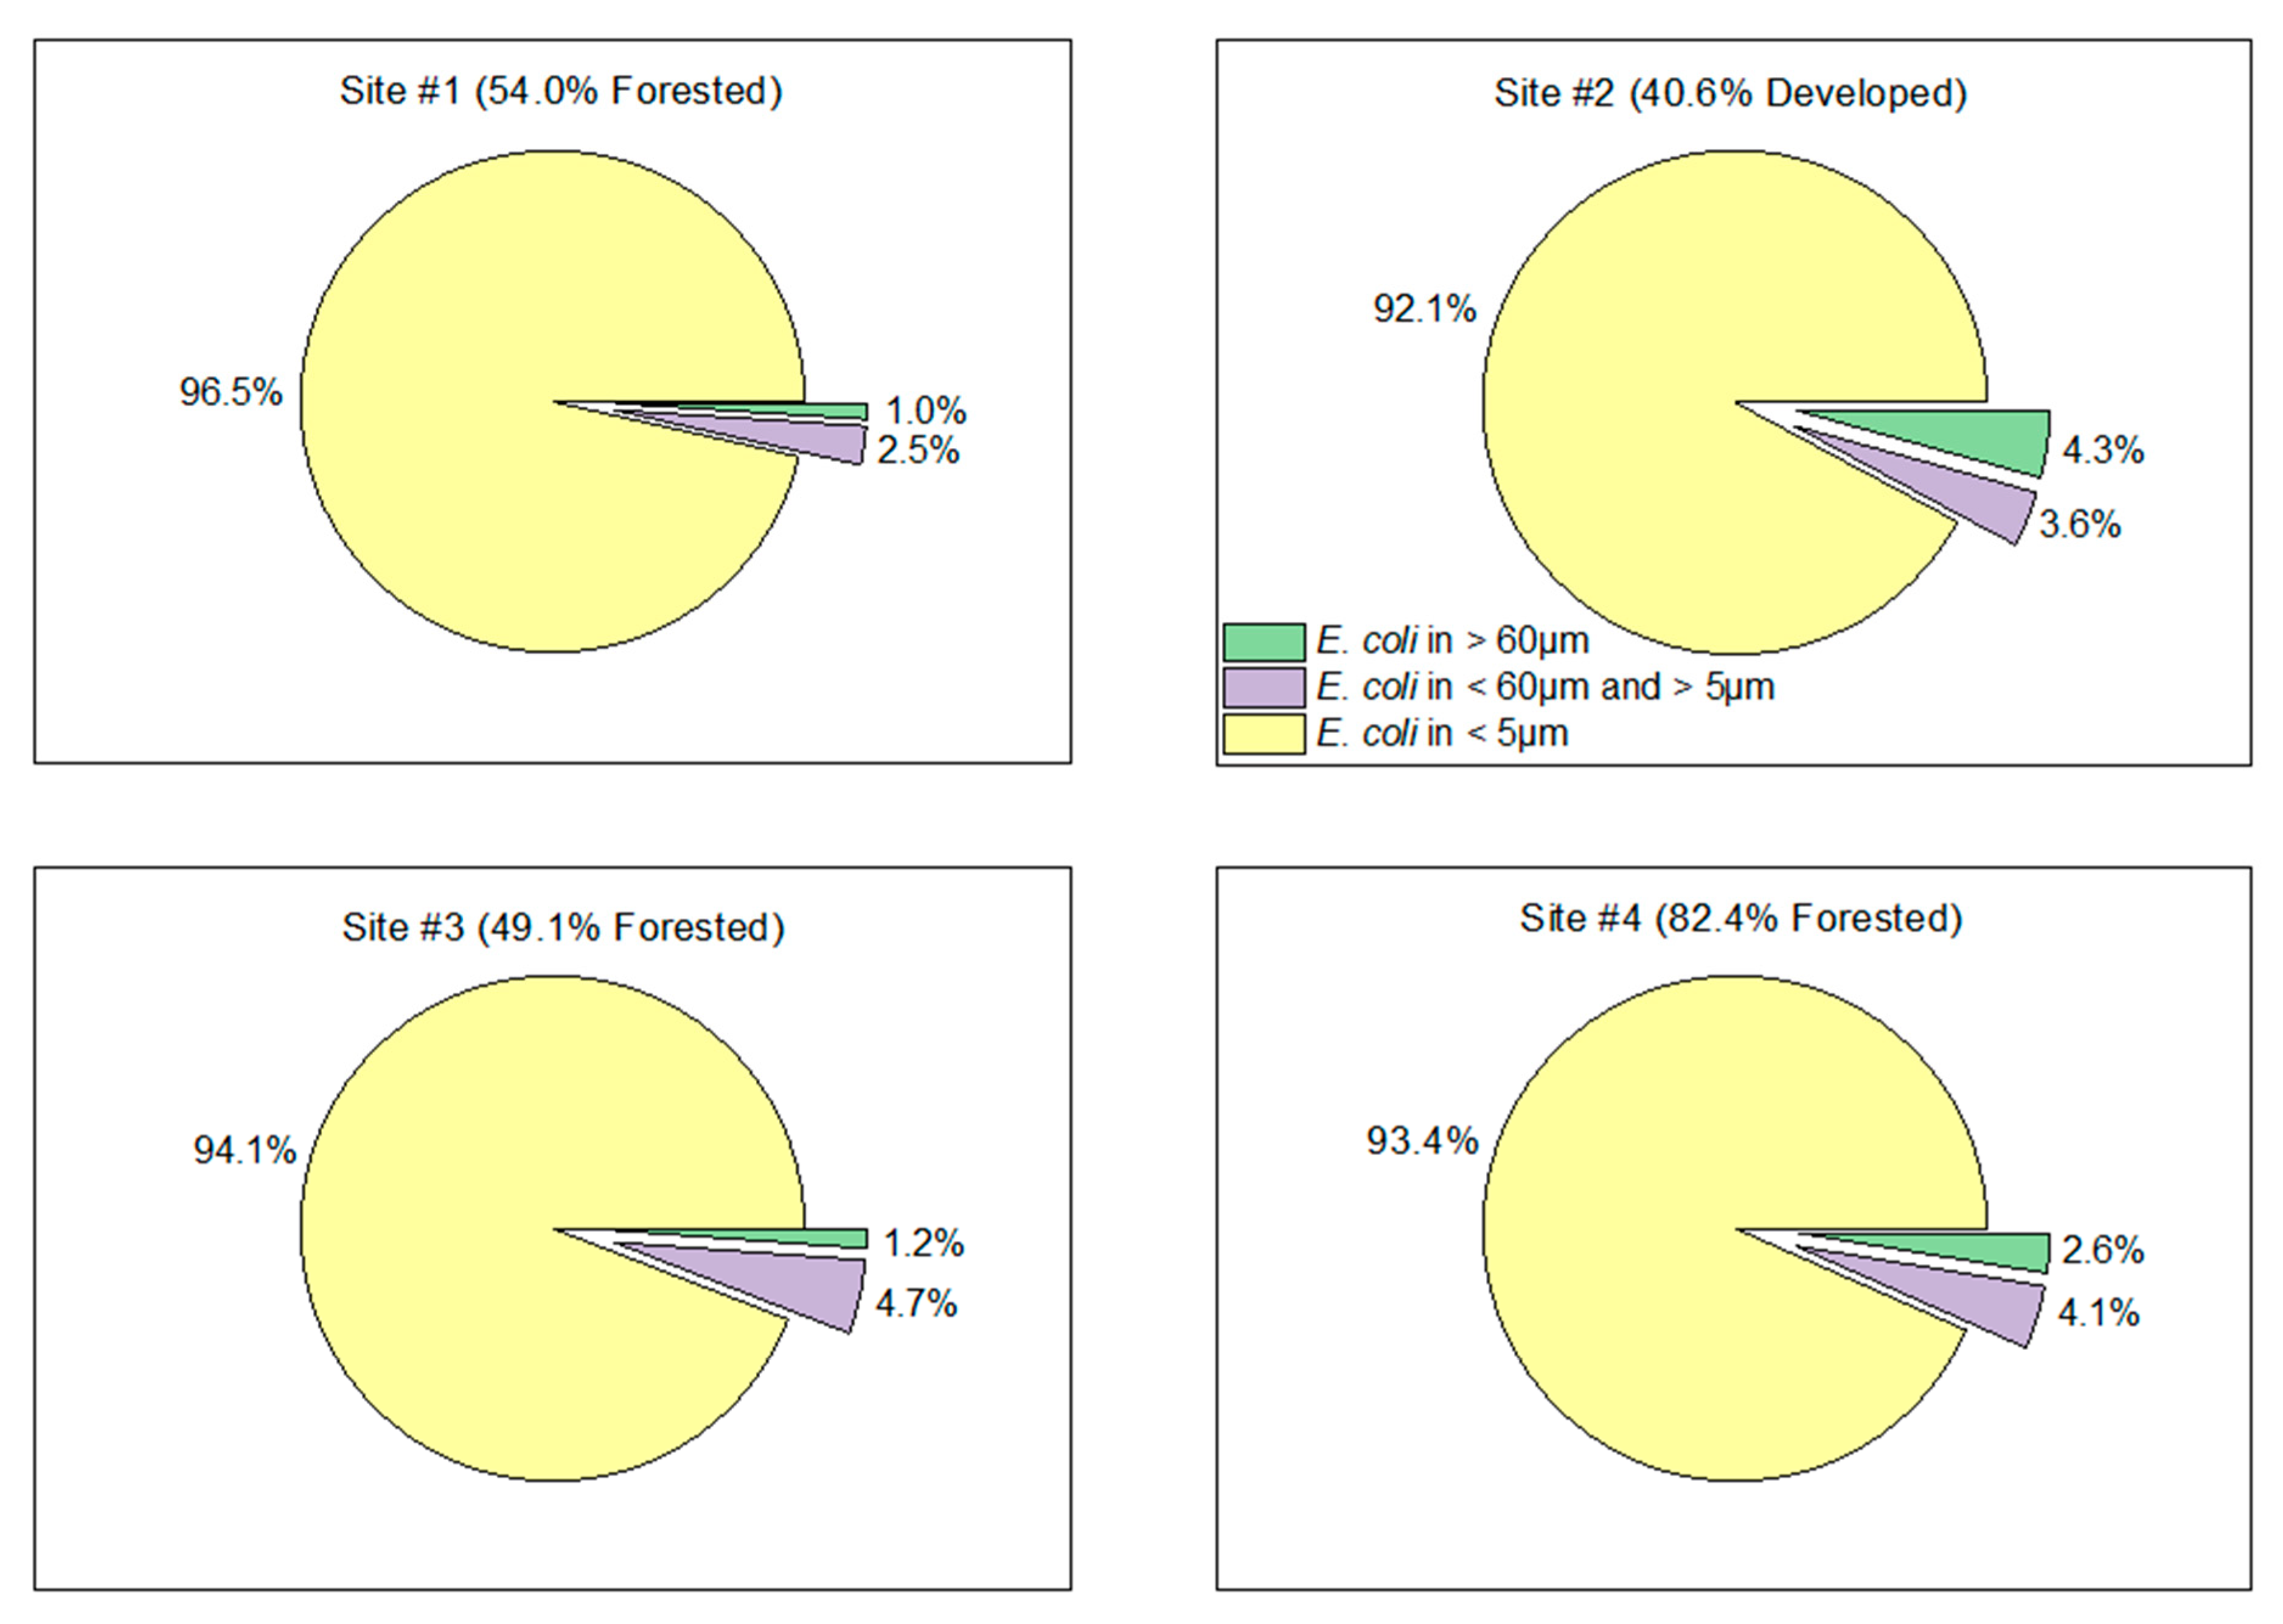
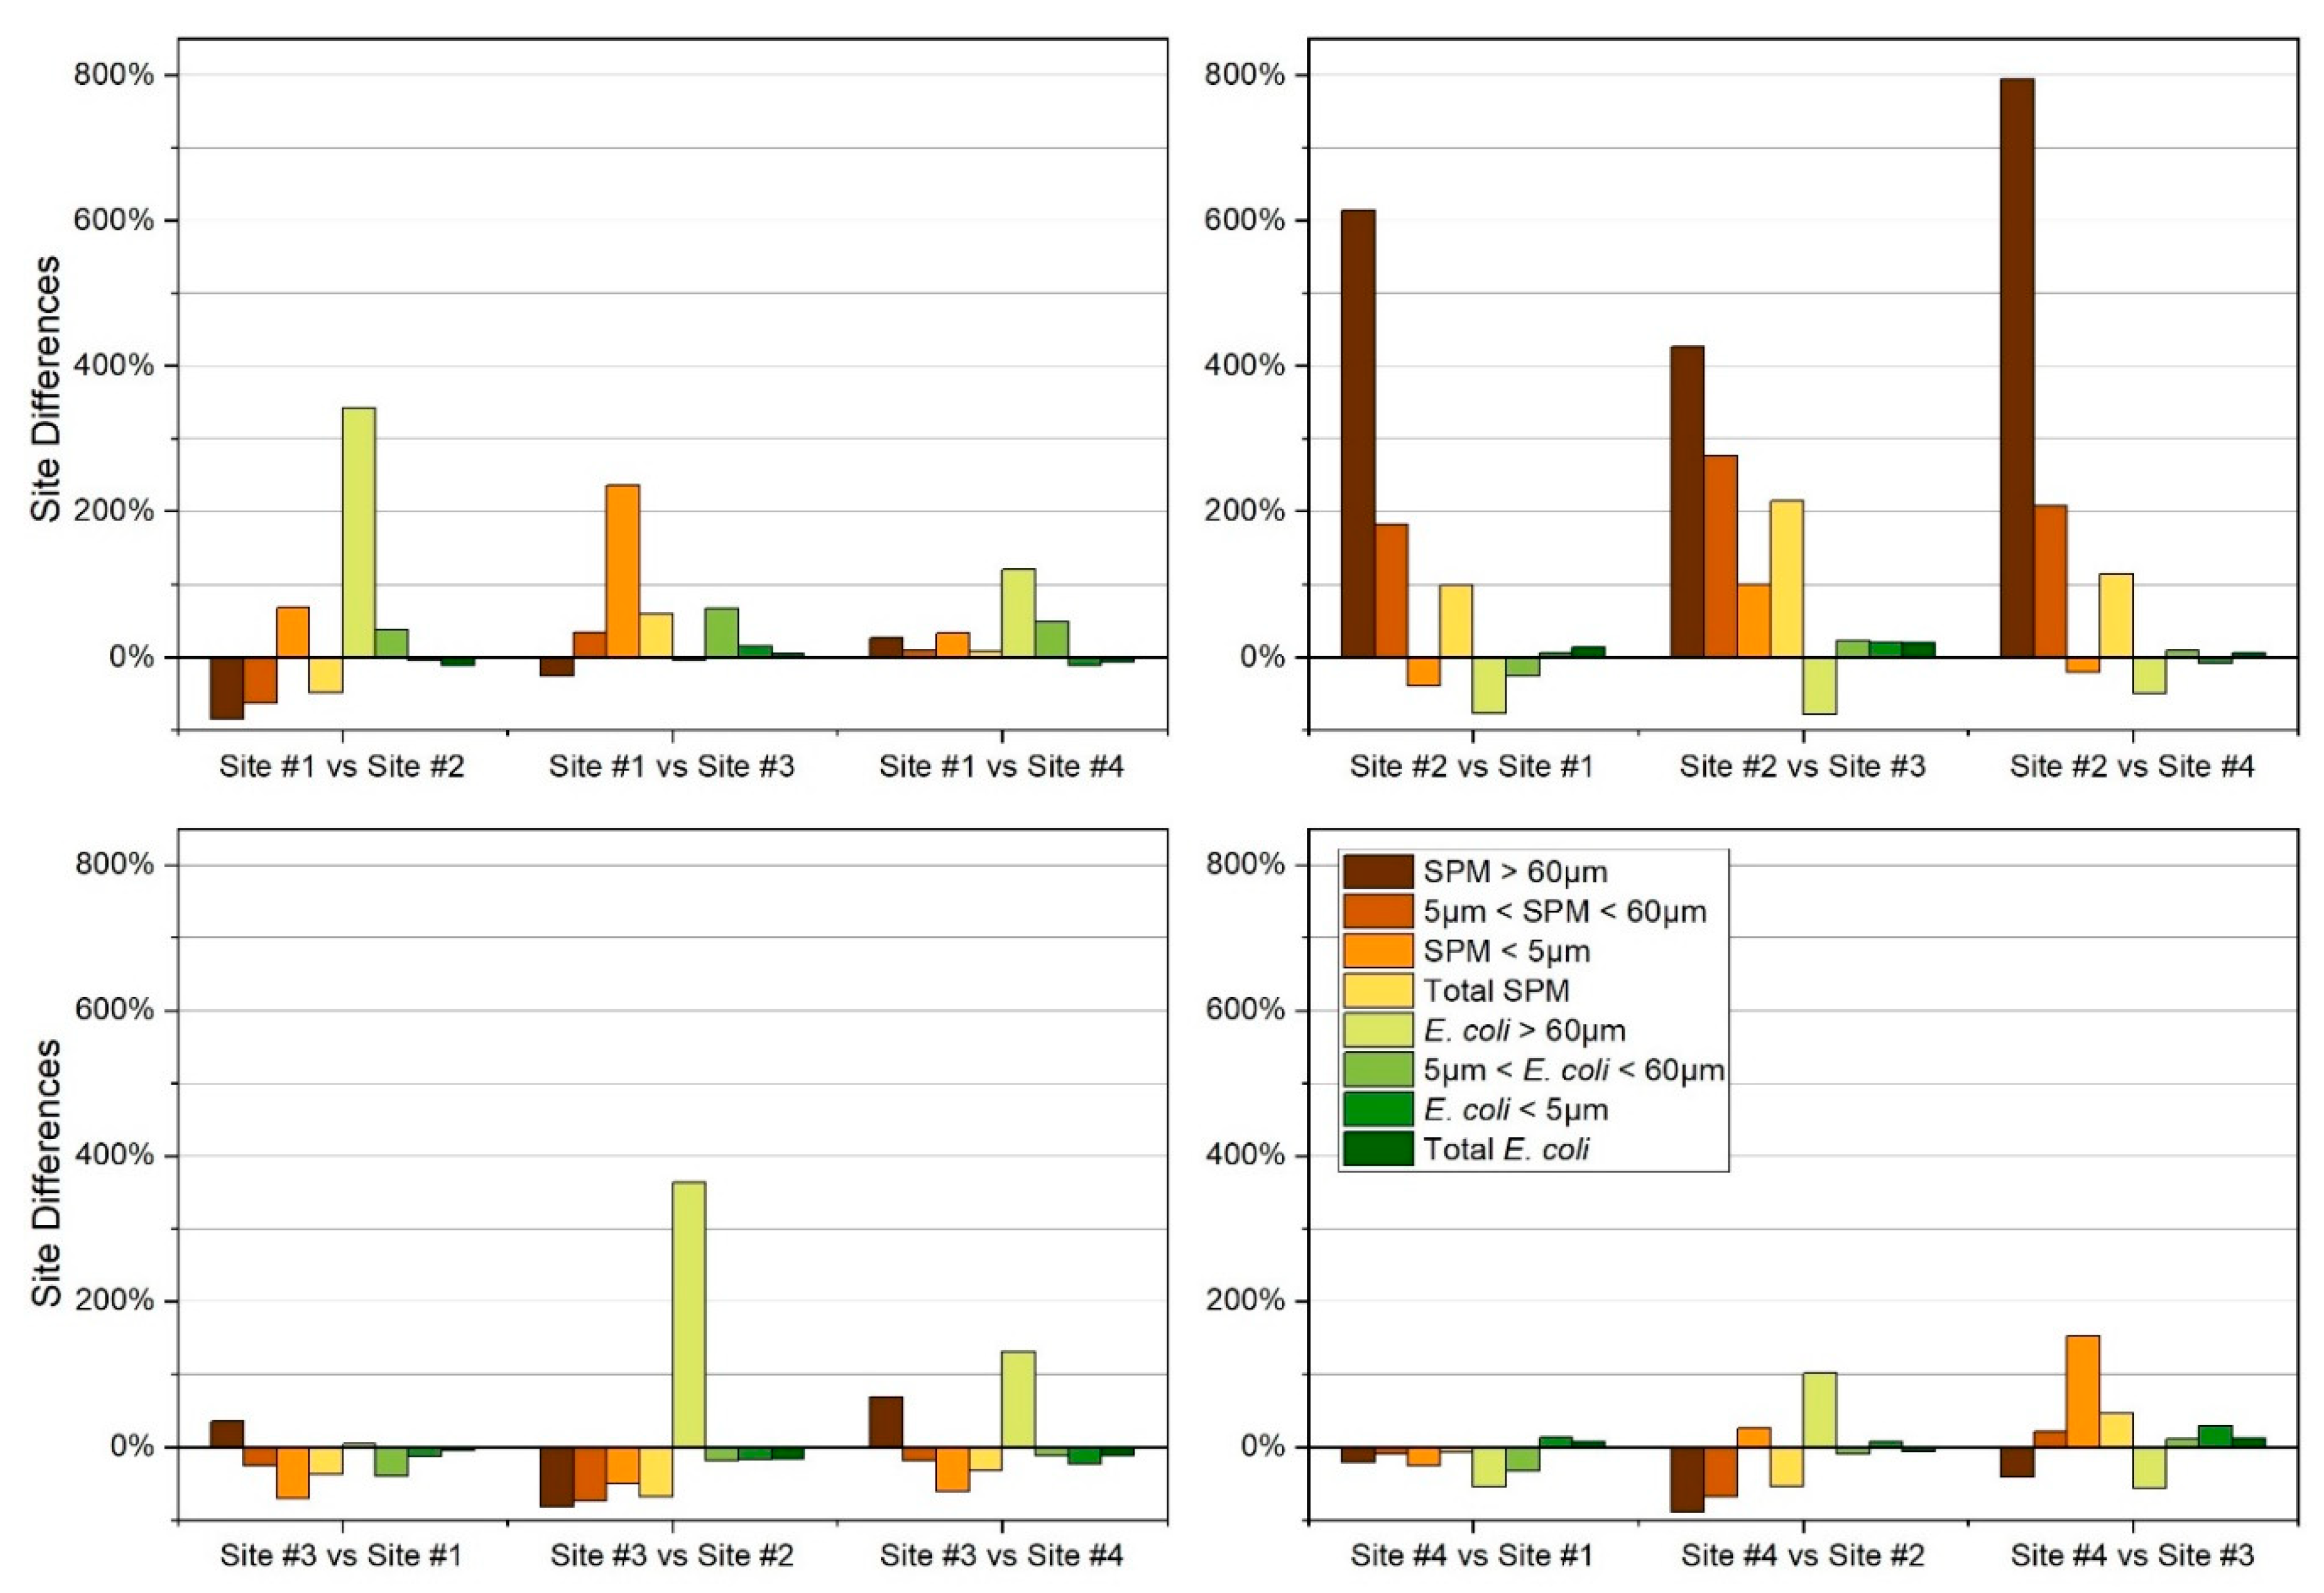
The average percentage E. coli concentration in the ≤5 μm interval exceeded 90 % of the total E. coli at all four sites (Figure 5). This finding was supported by ordinal logistic regression results, which showed that the <5 μm size interval had the strongest relationship (α < 0.0001) with E. coli concentration. The results for Site #2 (40.6% developed land use) differ from the other sites as it had a higher E. coli concentration in the >60 μm interval than in the intermediate (5 µm< interval < 60 μm) interval (Figure 6). This result differs from the negative correlations (p < 0.05) between particle size and bacterial association typically reported in the literature [60,61]. In the current work, E. coli concentrations generally increased with decreasing SPM interval size, with lowest E. coli concentration associated with the >60 μm interval, while the highest concentration of E. coli were coincident with the <5 μm interval (Figure 5). This result is supported by previous work that reported negative correlations (p < 0.05) between particle size and bacterial association [60,61]. Of importance, and as noted earlier, greater concentrations in the smallest interval increase the likelihood that the bacteria will remain buoyant for longer time periods, thereby increasing the downstream extent of decreased microbial water quality [1,12].
Site #1 (54% forested) had the lowest SPM in the <5 µm interval among the sites (Figure 6). This is consistent with previous studies that showed that developed land use practices typically produce greater quantities of finer (<5 µm) particles relative to other land uses [27], and forested areas originate fewer suspended materials [62,63,64]. Site #3 (49.1% forested) generally had increased SPM and E. coli concentrations in the intermediate (5 µm < interval < 60 μm), <5 µm, and total intervals (Figure 7). Although this site was predominantly forested, it included agricultural land use (42.1%) (including livestock manure stacks), which may account for the elevated SPM and E. coli levels [36,65] given the percentage of agricultural land use has been reported to be significantly correlated (p < 0.04) with E. coli concentrations in receiving waters [35]. Site #4 (82.4% forested; control site) had the lowest average E. coli concentration in the < 5 µm interval and the second lowest average total E. coli concentration. The low E. coli concentrations at Site #4 were expected, given that previous studies reported negative correlations (p < 0.01) between E. coli concentration and forested land use practices [56]. Decreased E. coli in receiving waters from forested locations is usually attributed to decreased endotherm population density relative to agricultural areas [58], lack of artificial sources of E. coli (e.g., water infrastructure in urban areas) [65], and decreased run-off compared to urban areas [65]. The decreased E. coli and SPM (Figure 4 and Figure 6) from forested areas indicates that the association of E. coli with SPM might not be as concerning in forested areas relative to other land use types.
At Site #2, in the >60 µm interval, there was an increase in E. coli concentration and a simultaneous decrease in SPM concentration relative to the other sites (Figure 6). This contradicts the negative correlation between E. coli concentration and SPM size reported by previous work [60,61]. However, these results support Figure 5, which shows the apparent preferential association of E. coli to SPM in the >60 µm interval relative to the 5 µm to 60 µm interval in developed areas. It is conceivable that there may be an unknown variable that altered the SPM size interval that the E. coli at Site #2 preferentially associated with in the current work. This result must be interpreted with caution, however, given differences in sampling regime between this and other studies (as noted earlier). Additionally, given the lack of previous studies, further investigation is needed to validate (or refute) these findings [1].
4.2. Non-Parametric Statistical Analysis
The significant relationship between E. coli and SPM discovered using ordinal logistic regression corresponds well with the results from previous work [10,11], which also reported strong relationships between E. coli concentrations and SPM. The relationship between E. coli and SPM has been shown to be a function of physical processes including runoff events that can influence respective concentrations or it can indicate a potential preferential association of E. coli to SPM. However, differentiating between these two possibilities was beyond the scope of the current investigation. The results from ordinal logistic regression indicate no statistically significant (95% confidence interval) relationship between land use practices and E. coli concentrations. Therefore, land use practices alone could not be used to predict E. coli concentrations in receiving waters in the current investigation. The results from the current work emphasize that additional factors that influence E. coli concentrations (i.e., water temperature, pH, and geochemistry) should be addressed in future work.
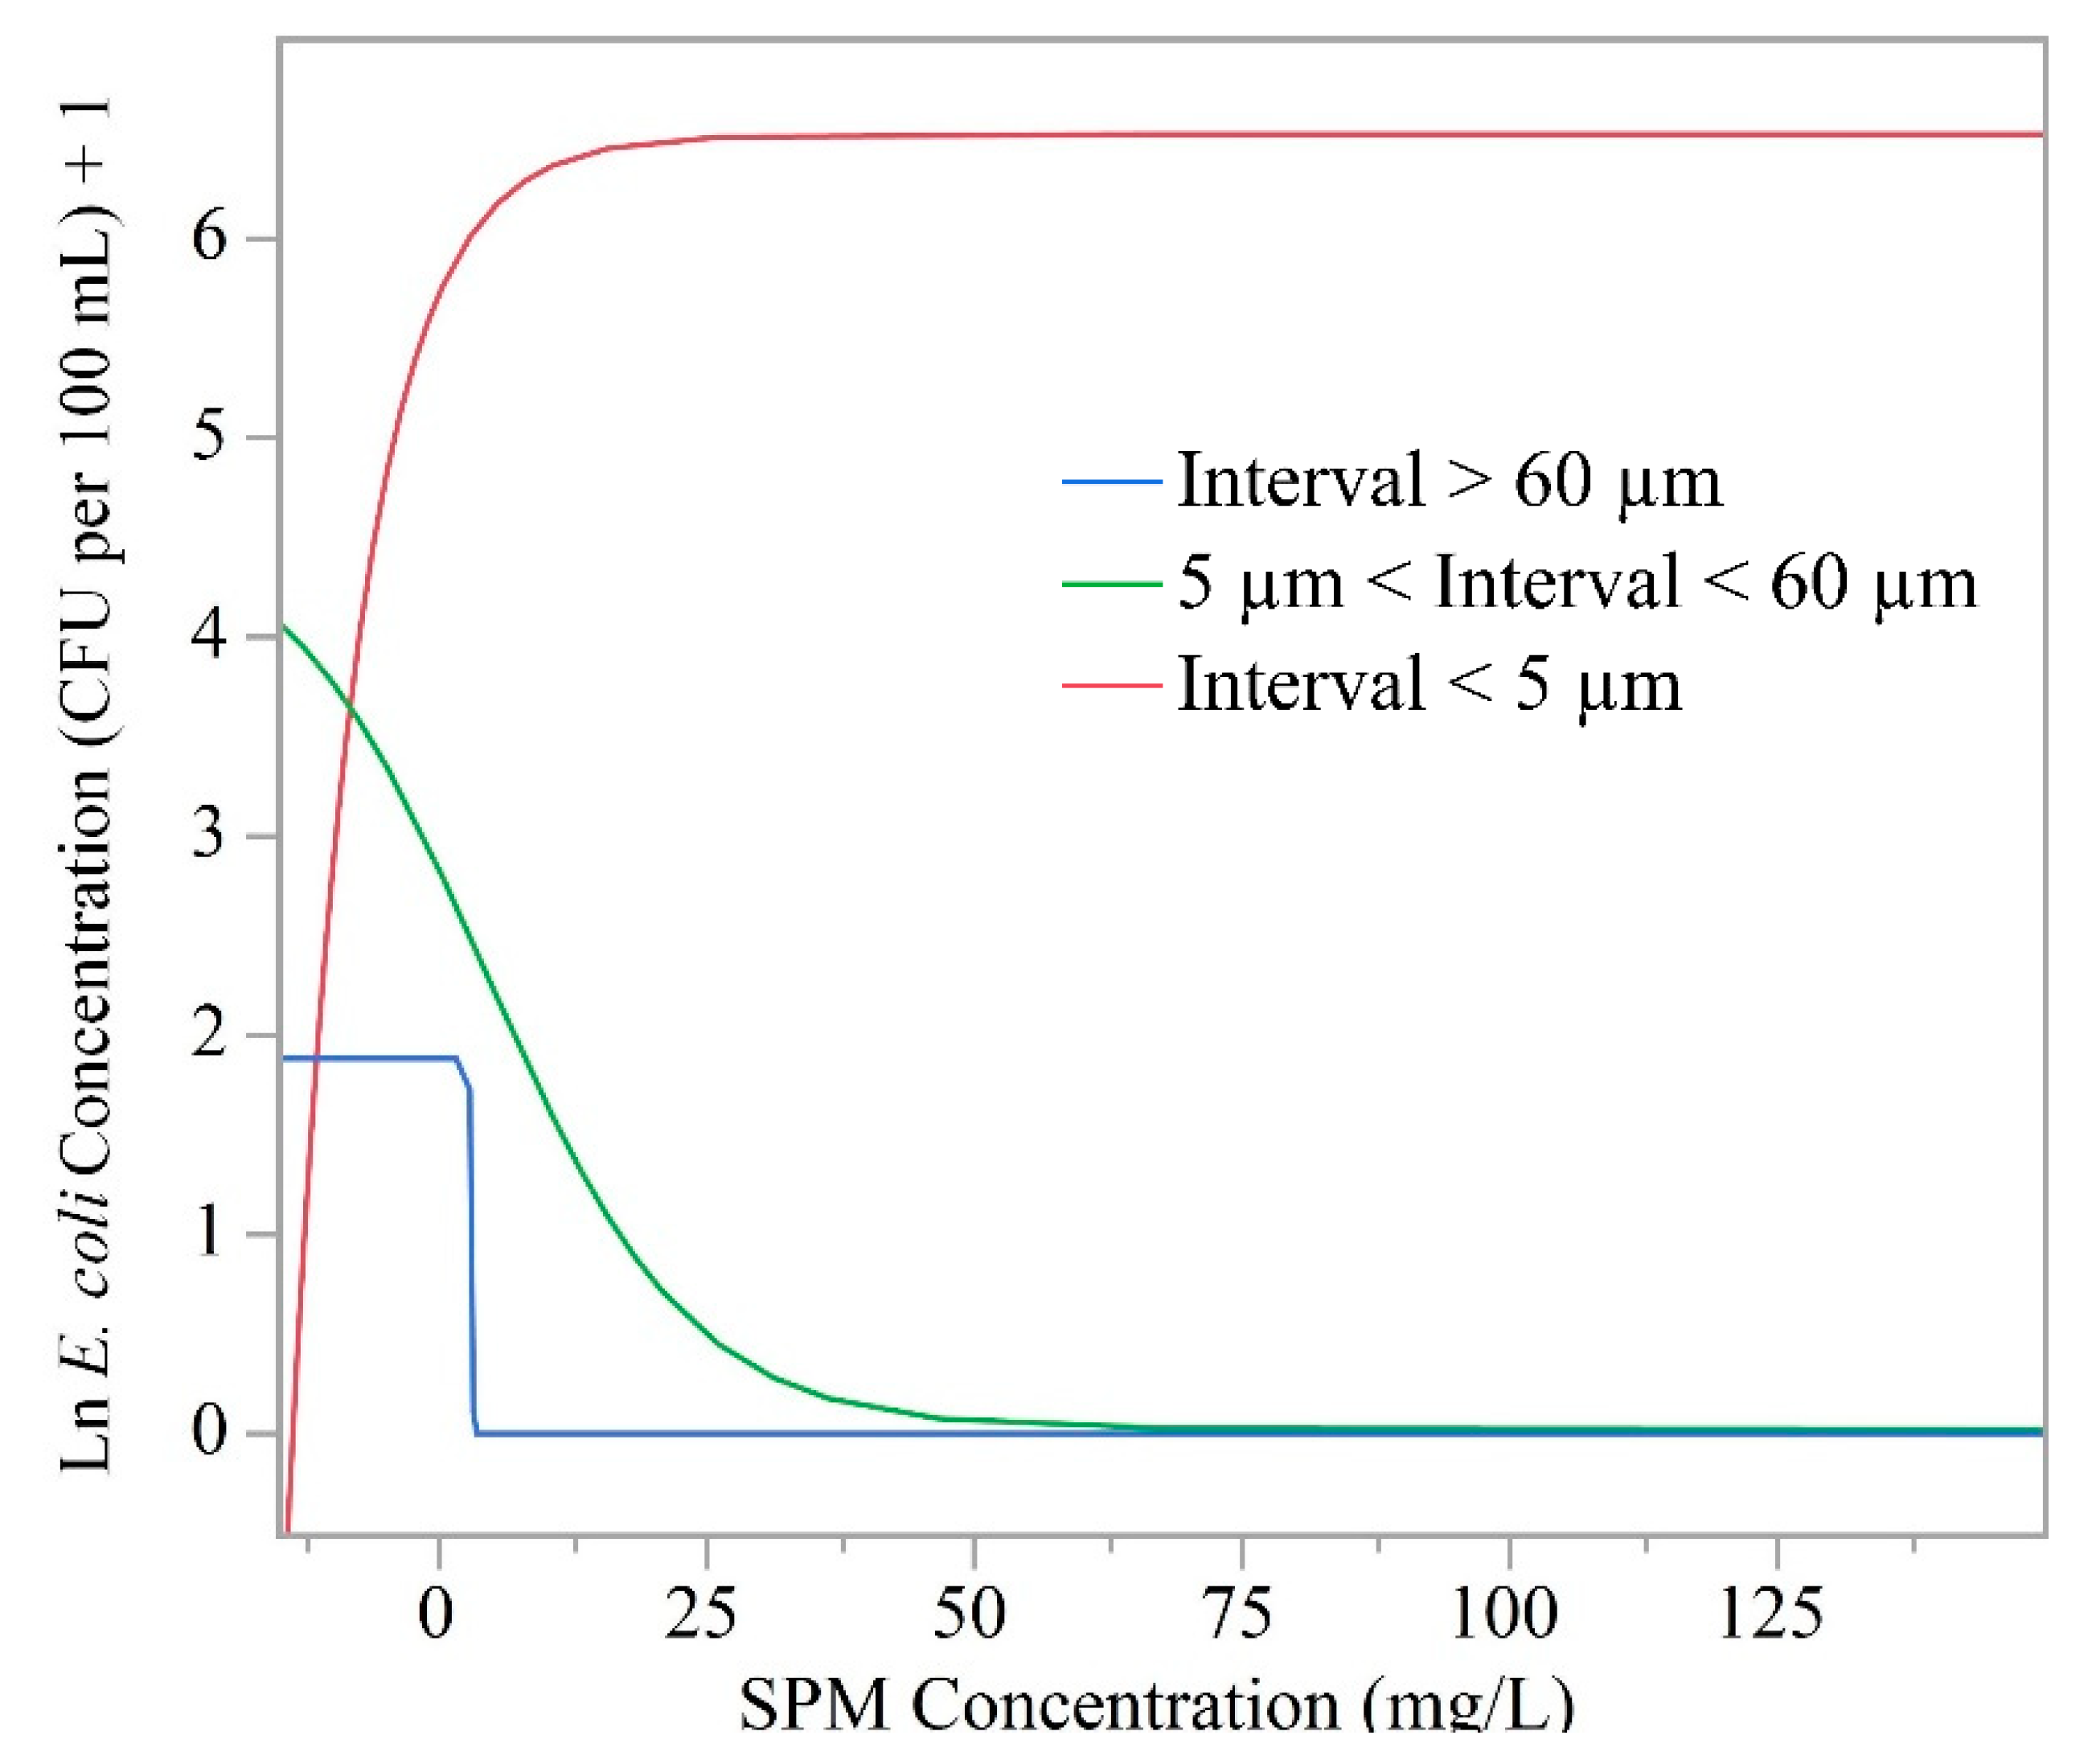
Increasing SPM concentrations in the intermediate (5 μm < interval < 60 μm) or large (>60 μm) intervals did not result in similar increases to the corresponding E. coli concentration (Figure 7). However, increased SPM in the smallest interval (<5 µm) had corresponding increases in the E. coli concentration in this interval. This result was attributed to bacteria becoming predominantly attached to, and subsequently transported with, SPM in the smallest interval (<5 µm), a relationship shown preliminarily in previous investigations [66,67,68]. This relationship may also be a function of the similar transport physics of E. coli and SPM particles <5 µm in size, due to similar sizes and buoyancy [69]. In general, this relationship supports the likelihood of E. coli remaining in suspension for longer time periods, thereby increasing the stream areas affected by fecal contamination.
Principle component analysis (PCA) showed that the components that account for the maximal variance within a given data set can be identified through the computation of multiple principal components and their respective eigenvalues [70]. Eigenvalues represent the variance of the data in a given direction, therefore components with the highest eigenvalues are principal components [70]. However, most data cannot be well described by a single principal component [70]. Therefore, multiple principal components are typically computed and ranked based on their eigenvalues and displayed visually with biplots [70]. In the current work, principle component biplots showed a distinct spatial distribution of study sites along principal components 1 and 2 for both the smallest interval (<5 µm) and the total data set (defined as all he SPM and E. coli data >0.7 µm) (Figure 8). Both biplots highlight the grouping of each of the sites within the idealized vector space defined by principal components 1 and 2. Given the similarity between the sites in terms of geology, topography, and climate, and their close proximity to each other, it can be concluded that the varying land use practices are the principal factors influencing the grouping of the data observed in both biplots [34]. The most obvious patterns are the strong correlation between E. coli concentration and SPM concentration in both the smallest interval and total data set (Figure 8). Ultimately, the percentage of agriculture land use was most closely associated with both E. coli and SPM concentrations, particularly in the smallest interval, attributable to reasons presented earlier [53,55,56]. This result further emphasizes that agricultural land use practices are strongly correlated with not only the occurrence of fecal contamination [35], but potentially the persistence of fecal microbes in receiving water. Conversely, forested and developed land uses were not as closely correlated with E. coli or SPM concentrations (Figure 8). Ultimately, PCA analysis (Table 2) and biplot results (Figure 8) effectively illustrate spatially the relationships between E. coli concentration, SPM and land use practices.
4.3. Study Considerations and Future Directions
It is acknowledged that other variables likely affect the lifecycle of E. coli (e.g., hydrology and climate) or the association of E. coli to SPM (e.g., aquatic geochemistry) [71,72]. Therefore, future work should expand on the results of this investigation by identifying and accounting for these variables. Regression analyses could be a useful tool in establishing the effect of the identified additional variables (e.g., hydrology, climate and aquatic geochemistry) [73]. Future work should also include the use of serial dilutions to avoid sample saturation during the quantification of E. coli concentrations. This would improve the accuracy of the results, specifically in areas comprising frequent elevated fecal pollution.
The current work used a study design and sampling regime that was focused on SPM size class and E. coli, which was dissimilar to previous work. The study design created challenges in comparing the effects of varying land use practices on E. coli or SPM, respectively. Therefore, combining the filtration methodology of the current work with a more traditional sampling regime during future work (i.e., regular temporal and spatial sampling) may facilitate more robust analysis of the influence of different land use practices on the relationship between E. coli and SPM of various size intervals. This is particularly important given the strong relationships between E. coli concentrations and land use practices identified in previous work [35] and the influence of land use practices on both E. coli and SPM concentrations identified in the current investigation. Additionally, the study design applied in the current work can also be used to investigate the association of other constituents in receiving waters with SPM. For example, investigating the association of various microplastics to SPM, and perhaps E. coli, in receiving waters, may enhance the understanding of this relatively novel freshwater pollutant. Given the current general lack of process understanding of E. coli and emergent co- or in-dependent human population-induced pollutants, such as microplastics, in freshwater sources [74,75,76], and the potentially harmful effects of microplastics [74,77,78], improving scientific understanding is critical from a water quality perspective.
5. Conclusions
The paucity of field-based research investigating the relationship between E. coli (fecal matter) concentration and SPM size distribution and the importance of this relationship, particularly for human health, policy makers, and water resource managers [23,79], provided the impetus for the current work. Similarly, the need to characterize the relationship between SPM size distribution, E. coli (fecal matter) and land use practices provided further motivation. A four-site study design (comprising 1st and 2nd order streams) was implemented to advance this understanding in a contemporary representative, mixed-use, urbanizing watershed in the Appalachian region of the eastern United States. The key results show a statistically significant correlation of SPM (α = 0.05 with E. coli concentration. Moreover, the importance of SPM in the <5 μm interval was also highlighted as 1) more than 90% of E. coli data were found in this smallest interval at all four sampling locations, 2) this interval also featured the strongest correlation with E. coli concentration data (α < 0.0001), and 3) increasing SPM concentrations in the ≤5 µm interval showed corresponding increases in relative E. coli concentration. These results generally imply that E. coli principally remains free floating or attaches to particles <5 µm in size in receiving waters. Principle component analysis results highlighted the influence of agricultural land use practices on both E. coli and SPM concentrations, thereby providing evidence for the potential influence of land use practices on bacterial association with SPM. The work elucidates the effects of SPM and land use practices on E. coli concentrations in receiving waters and provides a valuable steppingstone for future research into microbial water quality and fecal pollution. The results from this work better inform policy makers and water resource managers concerned with microbial and fecal pollution in receiving waters, thereby aiding in decision making and the effective management of freshwater resources.
Author Contributions
For the current work author contributions were as follows: conceptualization J.A.H.; methodology J.A.H.; formal analysis F.P. and J.A.H.; investigation J.A.H. and F.P.; resources, J.A.H.; data curation J.A.H.; writing—original draft preparation J.A.H. and F.P.; writing—review and editing J.A.H. and F.P.; visualization, J.A.H. and Petersen; supervision, J.A.H.; project administration, J.A.H.; funding acquisition, J.A.H. All authors have read and agreed to the published version of the manuscript.
Funding
This work was supported by the National Science Foundation under Award Number OIA-1458952, the USDA National Institute of Food and Agriculture, Hatch project accession number 1011536, and the West Virginia Agricultural and Forestry Experiment Station. Results presented may not reflect the views of the sponsors and no official endorsement should be inferred. The funders had no role in study design, data collection and analysis, decision to publish, or preparation of the manuscript.
Acknowledgments
Special thanks are due to many scientists of the Interdisciplinary Hydrology Laboratory (https://www.researchgate.net/lab/The-Interdisciplinary-Hydrology-Laboratory-Jason-A-Hubbart), and the Institute of Water Security and Science (https://iwss.wvu.edu/). The authors extend great appreciation to Ida Holásková of the Davis College of Agriculture, Natural Resources and Design office of statistics for her expertise and guidance. The authors also appreciate the feedback of anonymous reviewers whose constructive comments improved the article.
Conflicts of Interest
The authors declare no conflict of interest for the current work.
References
- Oliver, D.M.; Clegg, C.D.; Heathwaite, A.L.; Haygarth, P.M. Preferential attachment of Escherichia coli to different particle size fractions of an agricultural grassland soil. Water Air Soil Pollut. 2007, 185, 369–375. [Google Scholar] [CrossRef] [Green Version]
- Samie, A. Escherichia coli—Recent Advances on Physiology, Pathogenesis and Biotechnological Applications; IntechOpen Seattle: Washington, WA, USA, 2017. [Google Scholar]
- Mahmoud, M.A.; Abdelsalam, M.; Mahdy, O.A.; El Miniawy, H.M.F.; Ahmed, Z.A.M.; Osman, A.H.; Mohamed, H.M.H.; Khattab, A.M.; Zaki Ewiss, M.A. Infectious bacterial ogens, parasites and pathological correlations of sewage pollution as an important threat to farmed fishes in Egypt. Environ. Pollut. 2016, 219, 939–948. [Google Scholar] [CrossRef]
- Bain, R.; Cronk, R.; Hossain, R.; Bonjour, S.; Onda, K.; Wright, J.; Yang, H.; Slaymaker, T.; Hunter, P.; Prüss-Ustün, A.; et al. Global assessment of exposure to faecal contamination through drinking water based on a systematic review. Trop. Med. Int. Health 2014, 19, 917–927. [Google Scholar] [CrossRef] [Green Version]
- Bain, R.; Cronk, R.; Wright, J.; Yang, H.; Slaymaker, T.; Bartram, J. Fecal contamination of drinking-water in low- and middle-income countries: A systematic review and meta-analysis. PLoS Med. 2014, 11. [Google Scholar] [CrossRef] [Green Version]
- WHO World Water Day Report. Available online: https://www.who.int/water_sanitation_health/takingcharge.html (accessed on 12 December 2019).
- Benedict, K.M. Surveillance for waterborne disease outbreaks associated with drinking water—United States, 2013–2014. MMWR Morb. Mortal. Wkly. Rep. 2017, 66, 1216. [Google Scholar] [CrossRef]
- Olsen, C.R.; Cutshall, N.H.; Larsen, I.L. Pollutant—Particle associations and dynamics in coastal marine environments: A review. Mar. Chem. 1982, 11, 501–533. [Google Scholar] [CrossRef]
- Jamieson, R.; Joy, D.M.; Lee, H.; Kostaschuk, R.; Gordon, R. Transport and deposition of sediment-associated Escherichia coli in natural streams. Water Res. 2005, 39, 2665–2675. [Google Scholar] [CrossRef]
- Amalfitano, S.; Corno, G.; Eckert, E.; Fazi, S.; Ninio, S.; Callieri, C.; Grossart, H.-P.; Eckert, W. Tracing particulate matter and associated microorganisms in freshwaters. Hydrobiologia 2017, 800, 145–154. [Google Scholar] [CrossRef]
- Jeng, H.C.; England, A.J.; Bradford, H.B. Indicator organisms associated with stormwater suspended particles and estuarine sediment. J. Environ. Sci. Health 2005, 40, 779–791. [Google Scholar] [CrossRef]
- Hassard, F.; Gwyther, C.L.; Farkas, K.; Andrews, A.; Jones, V.; Cox, B.; Brett, H.; Jones, D.L.; McDonald, J.E.; Malham, S.K. Abundance and distribution of enteric bacteria and viruses in coastal and estuarine sediments—A review. Front. Microbiol. 2016, 7, 1692. [Google Scholar] [CrossRef] [Green Version]
- Rieck, A.; Herlemann, D.P.; Jürgens, K.; Grossart, H.-P. Particle-associated differ from free-living bacteria in surface waters of the Baltic Sea. Front. Microbiol. 2015, 6, 1297. [Google Scholar] [CrossRef] [Green Version]
- Grossart, H.-P. Ecological consequences of bacterioplankton lifestyles: Changes in concepts are needed. Environ. Microbiol. Rep. 2010, 2, 706–714. [Google Scholar] [CrossRef]
- Drummond, J.D.; Davies-Colley, R.J.; Stott, R.; Sukias, J.P.; Nagels, J.W.; Sharp, A.; Packman, A.I. Microbial transport, retention, and inactivation in streams: A combined experimental and stochastic modeling approach. Environ. Sci. Technol. 2015, 49, 7825–7833. [Google Scholar] [CrossRef]
- Simon, M.; Grossart, H.-P.; Schweitzer, B.; Ploug, H. Microbial ecology of organic aggregates in aquatic ecosystems. Aquat. Microb. Ecol. 2002, 28, 175–211. [Google Scholar] [CrossRef] [Green Version]
- Bidle, K.D.; Flecthcer, M. Comparison of free-living and particle-associated bacterial communities in the Chesapeake Bay by stable low-molecular-weight Rna analysis. Appl. Environ. Microbiol. 1995, 61, 944–952. [Google Scholar] [CrossRef] [Green Version]
- Allen, H.K.; Donato, J.; Wang, H.H.; Cloud-Hansen, K.A.; Davies, J.; Handelsman, J. Call of the wild: Antibiotic resistance genes in natural environments. Nat. Rev. Microbiol. 2010, 8, 251. [Google Scholar] [CrossRef]
- Corno, G.; Coci, M.; Giardina, M.; Plechuk, S.; Campanile, F.; Stefani, S. Antibiotics promote aggregation within aquatic bacterial communities. Front. Microbiol. 2014, 5, 297. [Google Scholar] [CrossRef]
- Madoux-Humery, A.-S.; Dorner, S.; Sauvé, S.; Aboulfadl, K.; Galarneau, M.; Servais, P.; Prévost, M. The effects of combined sewer overflow events on riverine sources of drinking water. Water Res. 2016, 92, 218–227. [Google Scholar] [CrossRef]
- Jett, B.D.; Huycke, M.M.; Gilmore, M.S. Virulence of enterococci. Clin. Microbiol. Rev. 1994, 7, 462–478. [Google Scholar] [CrossRef]
- Anastasi, E.M.; Matthews, B.; Gundogdu, A.; Vollmerhausen, T.L.; Ramos, N.L.; Stratton, H.; Ahmed, W.; Katouli, M. Prevalence and persistence of Escherichia coli strains with uropathogenic virulence characteristics in sewage treatment plants. Appl. Environ. Microbiol. 2010, 76, 5882–5886. [Google Scholar] [CrossRef] [Green Version]
- Abia, A.L.K.; Ubomba-Jaswa, E.; Genthe, B.; Momba, M.N.B. Quantitative microbial risk assessment (QMRA) shows increased public health risk associated with exposure to river water under conditions of riverbed sediment resuspension. Sci. Total Environ. 2016, 566, 1143–1151. [Google Scholar] [CrossRef]
- Characklis, G.W.; Dilts, M.J.; Simmons III, O.D.; Likirdopulos, C.A.; Krometis, L.-A.H.; Sobsey, M.D. Microbial partitioning to settleable particles in stormwater. Water Res. 2005, 39, 1773–1782. [Google Scholar] [CrossRef]
- Hubbart, J.A. Using sediment particle size class analysis to better understand urban land-use effects. Int. J. Appl. 2012, 2, 12–27. [Google Scholar]
- Kellner, E.; Hubbart, J.A. Improving understanding of mixed-land-use watershed suspended sediment regimes: Mechanistic progress through high-frequency sampling. Sci. Total Environ. 2017, 598, 228–238. [Google Scholar] [CrossRef]
- Kellner, E.; Hubbart, J.A. Flow class analyses of suspended sediment concentration and particle size in a mixed-land-use watershed. Sci. Total Environ. 2019, 648, 973–983. [Google Scholar] [CrossRef]
- Kellner, E.; Hubbart, J.A. Quantifying urban land-use impacts on suspended sediment particle size class distribution: A method and case study. Stormwater J. 2014, 15, 40–50. [Google Scholar]
- Chen, H.J.; Chang, H. Response of discharge, TSS, and E. coli to rainfall events in urban, suburban, and rural watersheds. Environ. Sci. Process. Impacts 2014, 16, 2313–2324. [Google Scholar] [CrossRef]
- Cantor, J.; Krometis, L.-A.; Sarver, E.; Cook, N.; Badgley, B. Tracking the downstream impacts of inadequate sanitation in central Appalachia. J. Water Health 2017, 15, 580–590. [Google Scholar] [CrossRef] [Green Version]
- Koppen, W.D. Das geographische system der klimate. Handb. Klimatol. 1936, 46, 1–44. [Google Scholar]
- Central Appalachian Broadleaf Forest—Coniferous Forest—Meadow Province. Available online: https://www.fs.fed.us/land/ecosysmgmt/colorimagemap/images/m221.html (accessed on 12 December 2019).
- Arcipowski, E.; Schwartz, J.; Davenport, L.; Hayes, M.; Nolan, T. Clean water, clean life: Promoting healthier, accessible water in rural Appalachia. J. Contemp. Water Res. Educ. 2017, 161, 1–18. [Google Scholar] [CrossRef] [Green Version]
- Kellner, E.; Hubbart, J.; Stephan, K.; Morrissey, E.; Freedman, Z.; Kutta, E.; Kelly, C. Characterization of sub-watershed-scale stream chemistry regimes in an Appalachian mixed-land-use watershed. Environ. Monit. Assess. 2018, 190, 586. [Google Scholar] [CrossRef]
- Petersen, F.; Hubbart, J.A.; Kellner, E.; Kutta, E. Land-use-mediated Escherichia coli concentrations in a contemporary Appalachian watershed. Environ. Earth Sci. 2018, 77, 754. [Google Scholar] [CrossRef]
- The West Virginia Water Research Institute, The West Run Watershed Association. (WVWRI) Watershed Based Plan for West Run of the Monongahela River 2008; The West Virginia Water Research Institute, The West Run Watershed Association: Morgantown, WV, USA, 2008. [Google Scholar]
- Peel, M.C.; Finlayson, B.L.; McMahon, T.A. Updated world map of the Köppen-Geiger climate classification. Hydrol. Earth Syst. Sci. Discuss. 2007, 4, 439–473. [Google Scholar] [CrossRef] [Green Version]
- Arguez, A.; Durre, I.; Applequist, S.; Squires, M.; Vose, R.; Yin, X.; Bilotta, R. NOAA’s US climate normals (1981–2010). NOAA Natl. Cent. Environ. Inf. 2010, 10, V5PN93JP. [Google Scholar]
- Myers, M.D. National field manual for the collection of water-quality data. US Geol. Surv. Tech. Water Resour. Investig. Book 2006, 9. [Google Scholar] [CrossRef]
- Hubbart, J.A.; Kellner, E.; Hooper, L.W.; Zeiger, S. Quantifying loading, toxic concentrations, and systemic persistence of chloride in a contemporary mixed-land-use watershed using an experimental watershed approach. Sci. Total Environ. 2017, 581, 822–832. [Google Scholar] [CrossRef]
- Kellner, E.; Hubbart, J. Advancing understanding of the surface water quality regime of contemporary mixed-land-use watersheds: An application of the experimental watershed method. Hydrology 2017, 4, 31. [Google Scholar] [CrossRef] [Green Version]
- Zeiger, S.J.; Hubbart, J.A. Quantifying flow interval–pollutant loading relationships in a rapidly urbanizing mixed-land-use watershed of the Central USA. Environ. Earth Sci. 2017, 76, 484. [Google Scholar] [CrossRef]
- Zeiger, S.J.; Hubbart, J.A. Nested-scale nutrient flux in a mixed-land-use urbanizing watershed. Hydrol. Process. 2016, 30, 1475–1490. [Google Scholar] [CrossRef]
- Crump, B.C.; Armbrust, E.V.; Baross, J.A. Phylogenetic analysis of particle-attached and free-living bacterial communities in the Columbia River, its estuary, and the adjacent coastal ocean. Appl. Environ. Microbiol. 1999, 65, 3192–3204. [Google Scholar] [CrossRef] [Green Version]
- Riemann, L.; Winding, A. Community dynamics of free-living and particle-associated bacterial assemblages during a freshwater phytoplankton bloom. Microb. Ecol. 2001, 42, 274–285. [Google Scholar] [CrossRef]
- Ortega-Retuerta, E.; Joux, F.; Jeffrey, W.H.; Ghiglione, J.-F. Spatial variability of particle-attached and free-living bacterial diversity in surface waters from the Mackenzie River to the Beaufort Sea (Canadian Arctic). Biogeosciences 2013, 10, 2747–2759. [Google Scholar] [CrossRef] [Green Version]
- Wentworth, C.K. A scale of grade and class terms for clastic sediments. J. Geol. 1922, 30, 377–392. [Google Scholar] [CrossRef]
- IDEXX Laboratories Colilert Procedure Manual. Available online: https://www.idexx.com/files/colilert-procedure-en.pdf (accessed on 4 April 2019).
- Cummings, D. The Fecal Coliform Test Compared to Specific Tests For Escherichia Coli. Available online: https://www.idexx.com/resource-library/water/water-reg-article9B.pdf (accessed on 24 September 2019).
- Yazici, B.; Yolacan, S. A comparison of various tests of normality. J. Stat. Comput. Simul. 2007, 77, 175–183. [Google Scholar] [CrossRef]
- Stokes, M.E.; Davis, C.S.; Koch, G.G. Categorical Data Analysis Using SAS; SAS institute: Cary, NC, USA, 2012. [Google Scholar]
- United States Climate Data (USCD). Available online: https://www.usclimatedata.com/climate/morgantown/west-virginia/united-states/uswv0507/2012/7 (accessed on 28 September 2019).
- Stein, E.D.; Tiefenthaler, L.; Schiff, K. Comparison of stromwater pollutant loading by land use type. Proc. Water Environ. Fed. 2007, 2007, 700–722. [Google Scholar] [CrossRef]
- Bro, R.; Smilde, A.K. Principal component analysis. Anal. Methods 2014, 6, 2812–2831. [Google Scholar] [CrossRef] [Green Version]
- Jeloudar, F.T.; Sepanlou, M.G.; Emadi, S.M. Impact of land use change on soil erodibility. Glob. J. Environ. Sci. Manag. 2018, 4, 59–70. [Google Scholar]
- Tong, S.T.; Chen, W. Modeling the relationship between land use and surface water quality. J. Environ. Manag. 2002, 66, 377–393. [Google Scholar] [CrossRef]
- Wilson, C.; Weng, Q. Assessing surface water quality and its relation with urban land cover changes in the Lake Calumet Area, Greater Chicago. Environ. Manag. 2010, 45, 1096–1111. [Google Scholar] [CrossRef]
- Causse, J.; Billen, G.; Garnier, J.; Henri-des-Tureaux, T.; Olasa, X.; Thammahacksa, C.; Latsachak, K.O.; Soulileuth, B.; Sengtaheuanghoung, O.; Rochelle-Newall, E. Field and modelling studies of Escherichia coli loads in tropical streams of montane agro-ecosystems. J. Hydro Environ. Res. 2015, 9, 496–507. [Google Scholar] [CrossRef]
- Rochelle-Newall, E.J.; Ribolzi, O.; Viguier, M.; Thammahacksa, C.; Silvera, N.; Latsachack, K.; Dinh, R.P.; Naporn, P.; Sy, H.T.; Soulileuth, B. Effect of land use and hydrological processes on Escherichia coli concentrations in streams of tropical, humid headwater catchments. Sci. Rep. 2016, 6, 32974. [Google Scholar] [CrossRef] [Green Version]
- Dong, H.; Onstott, T.C.; DeFlaun, M.F.; Fuller, M.E.; Scheibe, T.D.; Streger, S.H.; Rothmel, R.K.; Mailloux, B.J. Relative dominance of physical versus chemical effects on the transport of adhesion-deficient bacteria in intact cores from South Oyster, Virginia. Environ. Sci. Technol. 2002, 36, 891–900. [Google Scholar] [CrossRef]
- Levy, J.; Sun, K.; Findlay, R.H.; Farruggia, F.T.; Porter, J.; Mumy, K.L.; Tomaras, J.; Tomaras, A. Transport of Escherichia coli bacteria through laboratory columns of glacial-outwash sediments: Estimating model parameter values based on sediment characteristics. J. Contam. Hydrol. 2007, 89, 71–106. [Google Scholar] [CrossRef]
- Mallin, M.A.; Johnson, V.L.; Ensign, S.H. Comparative impacts of stormwater runoff on water quality of an urban, a suburban, and a rural stream. Environ. Monit. Assess. 2009, 159, 475–491. [Google Scholar] [CrossRef]
- Gilley, J.E.; Bartelt-Hunt, S.L.; Eskridge, K.M.; Li, X.; Schmidt, A.M.; Snow, D.D. Setback distance requirements for removal of swine slurry constituents in runoff. Trans. ASABE 2017, 60, 1885–1894. [Google Scholar] [CrossRef] [Green Version]
- Sutherland, D.G.; Ball, M.H.; Hilton, S.J.; Lisle, T.E. Evolution of a landslide-induced sediment wave in the Navarro River, California. GSA Bull. 2002, 114, 1036–1048. [Google Scholar] [CrossRef]
- Gotkowska-Plachta, A.; Golaś, I.; Korzeniewska, E.; Koc, J.; Rochwerger, A.; Solarski, K. Evaluation of the distribution of fecal indicator bacteria in a river system depending on different types of land use in the southern watershed of the Baltic Sea. Environ. Sci. Pollut. Res. 2016, 23, 4073–4085. [Google Scholar] [CrossRef]
- Davies, C.M.; Bavor, H.J. The fate of stormwater-associated bacteria in constructed wetland and water pollution control pond systems. J. Appl. Microbiol. 2000, 89, 349–360. [Google Scholar] [CrossRef] [Green Version]
- Muirhead, R.W.; Collins, R.P.; Bremer, P.J. Interaction of Escherichia coli and soil particles in runoff. Appl. Environ. Microbiol. 2006, 72, 3406–3411. [Google Scholar] [CrossRef] [Green Version]
- Guber, A.K.; Pachepsky, Y.A.; Shelton, D.R.; Yu, O. Effect of bovine manure on fecal coliform attachment to soil and soil particles of different sizes. Appl. Environ. Microbiol. 2007, 73, 3363–3370. [Google Scholar] [CrossRef] [Green Version]
- Southard, J. Introduction to Fluid Motions, Sediment Transport, and Current-Generated Sedimentary Structures Course Textbook; MIT OpenCourseWare, Massachusetts Institute of Technology: Cambridge, MA, USA, 2006. [Google Scholar]
- Multivariate Analysis: Principal Component Analysis: Biplots-9.3. Available online: http://support.sas.com/documentation/cdl/en/imlsug/64254/HTML/default/viewer.htm#imlsug_ugmultpca_sect003.htm (accessed on 23 December 2019).
- Presser, K.A.; Ratkowsky, D.A.; Ross, T. Modelling the growth rate of Escherichia coli as a function of pH and lactic acid concentration. Appl. Environ. Microbiol. 1997, 63, 2355–2360. [Google Scholar] [CrossRef] [Green Version]
- Noble, R.T.; Lee, I.M.; Schiff, K.C. Inactivation of indicator micro-organisms from various sources of faecal contamination in seawater and freshwater. J. Appl. Microbiol. 2004, 96, 464–472. [Google Scholar] [CrossRef] [Green Version]
- Helsel, D.R.; Hirsch, R.M. Statistical Methods in Water Resources, 1st ed.; Elsevier: Amsterdam, The Netherlands, 1992; Volume 49, ISBN 978-0-08-087508-8. [Google Scholar]
- Wagner, M.; Lambert, S. Freshwater Microplastics: Emerging Environmental Contaminants; The Handbook of Environmental Chemistry; Barcelo, D., Kostianoy, A.G., Eds.; Springer International Publishing: Cham, Switzerland, 2018; ISBN 978-3-319-61614-8. [Google Scholar]
- Rillig, M.C. Microplastic in terrestrial ecosystems and the soil? Environ. Sci. Technol. 2012, 46, 6453–6454. [Google Scholar] [CrossRef]
- Barnes, D.K.A.; Galgani, F.; Thompson, R.C.; Barlaz, M. Accumulation and fragmentation of plastic debris in global environments. Philos. Trans. R. Soc. B Biol. Sci. 2009, 364, 1985–1998. [Google Scholar] [CrossRef] [Green Version]
- Lithner, D.; Damberg, J.; Dave, G.; Larsson, Å. Leachates from plastic consumer products—Screening for toxicity with Daphnia magna. Chemosphere 2009, 74, 1195–1200. [Google Scholar] [CrossRef]
- Bejgarn, S.; MacLeod, M.; Bogdal, C.; Breitholtz, M. Toxicity of leachate from weathering plastics: An exploratory screening study with Nitocra spinipes. Chemosphere 2015, 132, 114–119. [Google Scholar] [CrossRef] [Green Version]
- Pandey, P.K.; Soupir, M.L. Assessing linkages between E. coli levels in streambed sediment and overlying water in an agricultural watershed in Iowa during the first heavy rain event of the season. Trans. ASABE 2014, 57, 1571. [Google Scholar]
Figure 1.
Monitoring/sampling locations for the current investigation, with land use/land cover, in West Run Watershed, Morgantown, West Virginia, USA.
Figure 1.
Monitoring/sampling locations for the current investigation, with land use/land cover, in West Run Watershed, Morgantown, West Virginia, USA.

Figure 2.
Thirty-minute time series of climate variables (recorded at the climate station) during study period (20 July 2018–27 October 2018) in West Run Watershed, West Virginia, USA. * Note: Stream stage was monitored in the primary stream of WRW, West Run Creek, within approximately 100m of the confluence of Site #1 and West Run Creek (39°40′3.20′′ N 79°55′48.99′′ W).

Figure 3.
Box and whisker plot of suspended particulate matter (SPM) (mg L−1) and E. coli concentration (CFU per 100 mL) at each sampling location (n = 4) during the study period (20 July 2018–27 October 2018) in West Run Watershed, Morgantown, West Virginia, USA. Box delineates 25th and 75th percentiles; line denotes median; square shows mean; whisker describes 10th and 90th percentiles; x shows maximum and minimum when above and below, respectively.

Figure 4.
Top: cumulative total SPM (mg L−1). Bottom: cumulative total E. coli concentration (CFU per 100 mL) at four monitoring sites during study period (20 July 2018–27 October 2018) in West Run Watershed, Morgantown, West Virginia, USA. * Only predominant land use percentage indicated, for full land use information refer to Table 1.

Figure 5.
Fractions of E. coli concentration (CFU) in three filtered size intervals, at four monitoring sites during the study period (20 July 2018–27 October 2018) in West Run Watershed, Morgantown, West Virginia, USA.
Figure 5.
Fractions of E. coli concentration (CFU) in three filtered size intervals, at four monitoring sites during the study period (20 July 2018–27 October 2018) in West Run Watershed, Morgantown, West Virginia, USA.

Figure 6.
Suspended particulate matter (SPM) and E. coli concentration percent difference, separated into filtration intervals (<5 µm; 5 µm < interval < 60 μm; and >60); and total, at four monitoring sites during study period (20 July 2018–27 October 2018) in West Run Watershed, Morgantown, West Virginia, USA.

Figure 7.
Ln of E. coli concentration (CFU per 100 mL) relative to SPM in three filtration size intervals (<5 μm; 5 µm < interval < 60 µm; >60 µm), at four monitoring sites during study period (20 July 2018–27 October 2018) in West Run Watershed, West Virginia, USA. Note all E. coli concentration values are +1 to avoid ln values being undefined where E. coli concentrations were zero. Additionally, interval size was dictated by the filer sizes (5 μm and 60 μm) that we used during the filtration of the extracted water samples.

Figure 8.
Results of principal components analysis, including biplots A) showing the data in the smallest interval (E. coli and SPM) and B) the total data set (defined as all he SPM and E. coli data >0.7 µm), for extracted principal components of E. coli concentration and SPM concentration at four monitoring sites during study period (20 July 2018–27 October 2018) in West Run Watershed, West Virginia, USA.


Table 1.
Land use/land cover characteristics (% cover) and total drainage area (km2) at four monitoring sites in West Run Watershed (WRW), West Virginia, USA. Note: land use percentages may not sum to 100%, as not every category is included (i.e., wetland, open water, etc.) and some categories are combinations of others (e.g., developed = urban + residential), or independent (e.g., impervious). Final row indicates total values for the entire watershed.
| Site Number and General Description | Forest (%) | Agriculture (%) | Developed (%) | Drainage Area (km2) |
|---|---|---|---|---|
| #1 (54.0% Forested) | 54.0 | 31.8 | 7.6 | 3.3 |
| #2 (40.6% Developed) | 27.6 | 20.8 | 40.6 | 1.0 |
| #3 (49.1% Forested) | 49.1 | 42.1 | 6.6 | 0.2 |
| #4 (82.4% Forested) | 82.4 | 13.3 | 0.8 | 0.7 |
| WRW (Total) | 50.1 | 22.6 | 19.0 | 23.3 |
Table 2.
Results of principal component analysis comprising 5 components (E. coli concentration, SPM concentration, percentage of agricultural land use, percentage of forested land use and percentage of developed land use) displaying eigenvalues, percentage of variance and cumulative variance during the study period (20 July 2018–27 October 2018) for the smallest interval (<5 µm) and the total data set across the four monitoring sites in West Run Watershed, West Virginia, USA. Note: bold numbers indicate eigenvalues exceeding 1 (representing importance).
| Variable | Eigenvalue | Percentage of Variance | Cumulative Variance |
|---|---|---|---|
| Smallest Interval (<5 µm) | |||
| E. coli concentration | 1.89 | 38% | 38% |
| SPM concentration | 1.35 | 27% | 65% |
| % Agriculture | 0.91 | 18% | 83% |
| % Forested | 0.84 | 17% | 100% |
| % Developed | 0 | 0 | 100% |
| Total Data Set | |||
| E. coli concentration | 1.90 | 38% | 38% |
| SPM concentration | 1.41 | 28% | 66% |
| % Agriculture | 1.01 | 20% | 86% |
| % Forested | 0.67 | 14% | 100% |
| % Developed | 0 | 0% | 100% |
© 2020 by the authors. Licensee MDPI, Basel, Switzerland. This article is an open access article distributed under the terms and conditions of the Creative Commons Attribution (CC BY) license (http://creativecommons.org/licenses/by/4.0/).
Share and Cite
MDPI and ACS Style
Petersen, F.; Hubbart, J.A. Quantifying Escherichia coli and Suspended Particulate Matter Concentrations in a Mixed-Land Use Appalachian Watershed. Water 2020, 12, 532. https://doi.org/10.3390/w12020532
AMA Style
Petersen F, Hubbart JA. Quantifying Escherichia coli and Suspended Particulate Matter Concentrations in a Mixed-Land Use Appalachian Watershed. Water. 2020; 12(2):532. https://doi.org/10.3390/w12020532
Chicago/Turabian StylePetersen, Fritz, and Jason A. Hubbart. 2020. "Quantifying Escherichia coli and Suspended Particulate Matter Concentrations in a Mixed-Land Use Appalachian Watershed" Water 12, no. 2: 532. https://doi.org/10.3390/w12020532
Note that from the first issue of 2016, this journal uses article numbers instead of page numbers. See further details here.