Transformation of the Flow Regime of a Large Allochthonous River in Central Europe—An Example of the Vistula River in Poland


Department of Hydrology and Water Management, Institute of Physical Geography and Environmental Planning, Faculty of Geographical and Geological Sciences, Adam Mickiewicz University, Krygowskiego str. 10, 61-712 Poznań, Poland
*
Author to whom correspondence should be addressed.
Water 2020, 12(2), 507; https://doi.org/10.3390/w12020507
Submission received: 31 December 2019
/
Revised: 7 February 2020
/
Accepted: 10 February 2020
/
Published: 12 February 2020
(This article belongs to the Special Issue Effects of Oceanic-Atmospheric Oscillations on Rivers)
Abstract
:Identification of river flow regime and its possible changes caused by natural factors or human activity is one of major issues in modern hydrology. In such studies different approaches and different indicators can be used. The aim of this study is to determine changes in flow regime of the largest river in Poland—the Vistula, using new, more objectified coefficients and indices, based on data recorded in 22 gauges on the Vistula mainstream and 38 gauges on its tributaries in the multi-year period 1971–2010. The paper consists of three main parts: in the first part, in order to recognize changes in the flow regime characteristics along the Vistula, data from gauges located on the river mainstream were analyzed with the help of the theory of entropy. In the second part gauging stations on the Vistula mainstream and its tributaries were grouped; values of the newly introduced pentadic Pardé’s coefficient of flow (discharge) (PPC) were taken as the grouping criterion. In the third part of the study a novel method of determining river regime characteristics was applied: through the recognition of the temporal structure of hydrological phenomena and their changes in the annual cycle sequences of hydrological periods (characteristic phases of the hydrological cycle) on the Vistula River mainstream and its tributaries were identified and their occurrence in the yearly cycle was discussed. Based on the detected changes of the 73-pentad Pardé’s coefficients of flow four main types of rivers were distinguished. Transformation of the flow regime was reflected in the identified different sequences of hydrological periods in the average annual cycle. It was found that while transformation of the Vistula River regime occurred along its whole course, the most frequent changes were detected in its upper, mountainous reaches, under the influence of the flow characteristics of its tributaries. This allowed the Vistula to be considered the allochthonous river. These findings are interesting not only from a theoretical point of view, but they also can be valuable to stakeholders in the field of the Vistula River basin water management and hydrological forecasting, including flood protection, which has recently become a matter of growing concern due to the observed effects of climate change and human impact.
1. Introduction
The hydrological regime defines the state and responses of a river system with relation to the climatic system and the catchment’s physical-geographic characteristics [1]. Different flow regime patterns can be treated as some “preferred states” of the runoff system, which are more or less stable. In order to identify a change in any pattern (whatever the reason), it is necessary first of all to adequately describe its initial state [2]. Multi-year variations in river discharge may result from environmental changes at a local scale (e.g., caused by human activity) or at regional and global scales (caused by climate changes). Hydrological data, including river discharge, may, therefore, serve as an indicator of climate changes [3]. Long-term fluctuations of hydrological and meteorological quantities have been the object of attention of hydrologists and climatologists since the beginning of the 20th century [4]. Pekarova et al. [5] tested the annual discharge time series of selected large rivers in the world for wet and dry periods and identified the 28–29-year and 20–22-year cycles of extremes occurrence. It was also found that the temporal shift in the discharge extremes occurrence (both, maxima and minima) depended on the longitude and latitude. Pekarova et al. [6] analyzed the occurrence of dry and wet periods for 18 major European rivers during the period 1850–1997. While the statistical analysis of the discharge series did not confirm any long-term increase or decrease during the last 150 years, dry cycles of about 13.5 years and 28–29 years were identified. In East Europe the occurrence of the wet and dry cycles were shifted compared to North and West/Central Europe by a few years. Similar periods had been reported in other world rivers (Amazon, Congo) as well as in the Southern Oscillation, North Atlantic Oscillation and Pacific Decadal Oscillation phenomena. National Committee [7] carried out a project on the Danube basin water regime characteristics, with respect to runoff long-term trends and inter- as well as intra-annual variability. Bormann [8] studied changes in runoff regime of rivers in Germany in relation to climate change and found that while the general runoff regime types (such as pluvial, nival and glacial) had not changed, their detailed characteristics (amplitude, timing of extreme values of the Pardé coefficient) were considerably affected by environmental change. Khon and Mokhov [9] evaluated the future mean annual regime of river runoff and its within-year distribution for major Eurasian basins, including the basins of the Volga and Amur and the major Siberian rivers: the Ob, Yenisei, and Lena. The obtained results show that the mean annual runoff of Siberian rivers can be expected to increase by the late 21st century, mostly due to an increase in spring runoff, an increase in winter precipitation and, accordingly, snow mass, as well as more intense snow melting in spring. Hall et al. [10] assessed the state-of-the-art of the flood regime changes in Europe and pointed at growing concern that flooding is becoming more frequent and severe in Europe. Stojkovic et al. [4] presented a new stochastic model, based on historical characteristics of time series of annual flows, for simulating mean annul flows of large European rivers. Pekarova et al. [11] applied a hydrological series of the mean daily discharges from 20 gauging stations to study spatial and temporal changes in the magnitude, duration and frequency of high flows in the Danube basin.
While human activity and the ongoing climate change have unquestionable impact on the hydrological cycle, Pekarova et al. [5] concluded that there exist also other natural factors that influence the runoff variability and may reinforce the runoff changes, including large air pressure oscillations over the oceans, as for example the Southern Oscillation (SO) over the Pacific and the North Atlantic Oscillation (NAO) over the Atlantic Ocean. Bover and Hannah [12] using 25-year records carried out spatial and temporal variability of river flow regimes in the United Kingdom and proposed their regionalization and assessed their inter-annual variability (stability) in relation to large-scale atmospheric circulation patterns, particularly during the autumn recharge season. Furthermore, Wrzesiński [1] analyzed the impact of the North Atlantic Oscillation (NAO) on the hydrological regimes of rivers of Northern and Central Europe and detected differences in the variability of hydrological regimes of Scandinavian and Central European rivers in various NAO circulation periods. Bochiola [13] investigated long-term hydrological regime of 23 alpine rivers in Northern Italy and proved likely significant changes of hydrological fluxes during the winter, spring and summer periods and correlation between NAO and global thermal anomalies. Recent studies have proved that the North Atlantic thermohaline circulation has impact also on flow of rivers in Poland [14].
The consequences of the destabilization of river flow regimes are not only a hydrological issue, but they also affect the economic and social aspects of human development [3]. For example, Bochiola et al. [15], Tahir et al. [16] and Faiz et al. [17] analyzed hydrological regime of the poorly gauged high altitude area of the Upper Indus River Basin in Pakistan and proved significance of such studies in planning and management of water resources, designing of hydraulic structures and better policies in response to agricultural water requirement downstream of that area in relation to climate changes. Some researchers point at the importance of variability of the hydrological regime in shaping the biophysical attributes and functioning of riverine ecosystems. Harris et al. [18] proposed a classification of regimes of four British rivers using multivariate techniques to separate annual discharges and temperatures in the context of hydroecology and importance of flow and temperature as primarily variables in driving running water, riparian and floodplain ecosystems. Kennard et al. [19] presented the first continental-scale classification of hydrological regimes for Australia based on mean daily discharge data from 830 stream gauges and using a fuzzy partitional method—Bayesian mixture modelling. The analysis resulted in distinguishing 12 classes of flow regime types differing in the seasonal pattern of discharge, degree of flow permanence and frequency and other aspects of flow predictability and variability. Martinez-Capel et al. [20] in order to support environmental flow assessments proposed hydrological classification of natural flow regimes in intensively regulated Mediterranean rivers with the Segura River Basin in Spain.
In Poland studies on the river flow regime concentrate on the largest Central European river—the Vistula. Rutkowska et al. [21] investigated the temporal and spatial variability in extreme quantile anomalies of seasonal and annual maximum river flows for 41 gauging stations on rivers in the Upper Vistula River basin. The anomalies showed a high variability on the right bank of the Upper Vistula River basin during the summer season with the highest values in catchments located in the western and south-western parts of the basin. River flow extreme quantiles were found to be associated with large-scale climatic variables from the regions of the North Atlantic Ocean, Scandinavia, Eastern Europe, Asia, and, to a lesser extent, the Pacific Ocean. Piniewski et al. [22] analyzed projections of low and high flow changes in the Vistula and the Odra basins (VOB), using SWAT model forced with the bias-corrected EURO-CORDEX data to review and analyze projections of low and high river flows in Central and Eastern Europe, based on results of large-scale models reported in literature. Wrzesiński and Sobkowiak [23] detected changes in the flow regime characteristics of rivers in Poland, including the Vistula, and determined their exact dates. Jokiel and Tomalski [24] identified the flow seasonality of the Vistula in 14 water-gauge cross-sections along the river course in 1951–2016 and concluded that despite climate warming and impact of human activity the seasonal structure of the Vistula River flow did not show clear tendencies, multi-annual fluctuations or changes, which could be described and reliably documented by more or less comprehensive seasonality measures.
The purpose of this study is to analyze the flow regime of the Vistula River and on this basis propose its detailed typology. It also aims at examining if the detected changes of the Vistula mainstream are influenced by the flow characteristics of its tributaries. The obtained results would help to better understand variability of flow regime in the Vistula River basin. Compared to previous studies this research uses new indices and coefficients, as entropy and stability, to analyze spatial changes of the flow regime along the river course. The regime characteristics of the Vistula and its tributaries are determined by more objective (unsupervised) methods and on that basis grouping of rivers in the Vistula basin is made. This results in a typology of flow regime characteristics taking as a criterion the pentadic Pardé’s coefficient (PPC). The originality of the research is also in the applied methodology, and more precisely in the application of a new method of determining regime features by distinguishing the sequence of hydrological periods. Apart from a strictly scientific dimension, these findings can be of practical value in the area of water management and hydrological forecasting, including flood protection, which has become of particular importance in recent years, when growing attention has been paid to the problem of rational utilization of water resources in the Vistula River basin.
2. Materials and Methods
2.1. Study Area
The Vistula (Wisła) River is the longest river in Poland (1047 km), and its basin occupies 194,376 km2 (168,800 km2 in Poland). In Europe the Vistula ranks 12th in terms of length, 9th in terms of river basin area and 10th in terms of discharge. The source of the Vistula River is located on the Barania Góra Mountain (1107 m a.s.l.) in southern Poland. The river flows north and discharges into the Baltic Sea (Figure 1). The largest tributaries are: the left-bank San (16,877 km2) and Narew (74,527 km2) rivers, and the right-bank Pilica (9258 km2) and Bzura (7764 km2) rivers [25]. The Vistula River basin is diversified in terms of its physical-geographical characteristics. It is located within five geographical provinces distinguished in [26]: the Western Carpathians with the Western and Northern Sub-Carpathia, the Eastern Carpathians with the Eastern Sub-Carpathia, the Polish Uplands, the Central-European Lowlands and the East Baltic-Belorussian Lowlands, respectively.
The upper part of the Vistula River basin has the most abundant water resources. It covers the Carpathians, the Sub-Carpathian basins and the Southern Poland uplands, which constitute only 26% of the total area of the Vistula River basin. In the years 1971–2010 the total outflow from that area was 276 mm, while the total outflow of the Vistula in gauge Tczew in its lower reaches was only 165 mm. Such large regional differences of outflow result mainly from different sums of precipitation and retention capabilities of the basin. The Vistula is an allochthonous river, whose regime characteristics change along the course. Generally, the allochthonous (non-indigenous, of exotic origin) rivers rise in humid regions or regions of snow and ice (polar) and flow into dry areas where they are joined, if at all, only by tributaries with meagre and often sporadic streamflow. The largest of the exotic rivers are so abundantly supplied with water in their upper courses that they are able to reach the sea. Representatives of this type include the Niger, Nile, Colorado, and rivers of the Near East [27]. In the case of smaller river systems allochthonous rivers have flow characteristics influenced by the water supply conditions in the upper part of their basins. Thus, also the Vistula flowing through the Sandomierz Basin is the allochthonous river, because its flow characteristics depend on the environment of the Carpathian Mountains, where numerous tributaries of the Vistula (such as the Soła, Skawa, Dunajec and other rivers) originate. According to the criteria of river regimes proposed in [28], the Vistula River mainstream represents three types of regime, that is: the pluvial-nival in the upper reaches (between its source and gauge Goczałkowice), the nival-pluvial (between gauges Goczałkowice and Puławy) and the nival moderately formed in its lower reaches (below gauge Puławy). There are also various types of hydrological regimes in the respective parts of the Vistula River basin: while in the middle and lower reaches the nival regimes are predominant, from poorly formed to well-formed, in the upper reaches the right-bank Carpathian tributaries have the nival–pluvial and pluvial–nival regimes, and the left-bank tributaries have the nival regime with different degrees of development [28]. According to the Köppen–Geiger classification of climates the Vistula River basin is cold without dry season and with warm summer (Dfb) [29].
Compared to other large European rivers human impact on the regime of the Vistula is relatively limited. The largest hydro-technical structures are located in the upper part of the basin, more specifically on the tributaries of the Vistula, as for example the Dunajec River. The largest dam on the Vistula mainstream is the Wloclawek dam built in 1962–1970. As a result, section of the Vistula River between Puławy and Warsaw has the most quasi-natural regime. Main characteristics of the analyzed rivers are given in Table 1.
2.2. Materials
In this study daily discharges from 1971–2010 collected in 60 gauging stations (22 on the Vistula mainstream and 38 on its tributaries, respectively) in the Vistula River basin were analyzed. The research was carried out with reference to the hydrological year, which in Poland lasts from 1 November to 31 October of the next year. The data were obtained from the Institute of Meteorology and Water Management (IMGW) in Warsaw.
2.3. Methods
In studies on hydrological characteristics of river flow two main approaches, supervised and unsupervised, can be applied [2]. In the supervised approach, pre-selected indicators (types of regime) are firstly defined, and secondly, in accordance to them, regularities in the multi-year monthly or seasonal discharges are sought. Such an approach can be exemplified by typologies of flow regime proposed in [30,31] or—in case of rivers in Poland—in [32]. In the unsupervised approach, based mainly on the grouping of variables selected for the analysis, there are no such pre-defined indicators, and determination of the type of regime is being made on the basis of data structure, so that objects within a single type are as similar as possible. Such an approach was introduced in [33] in the hydrological regionalization of Sweden, and in [34,35] in Poland. While in the first approach, determining a priori an indicator that decides about the type of regime, exhibits its certain subjectivity, in the second, objectified, unsupervised approach the result of the analysis is affected by the so-called ‘stopping rule’ and the acceptance of a certain degree of compliance within the identified groups. Whatever approach has been chosen for the initial pattern identification, it will affect the analyses of its eventual changes in time. In the supervised approach a too precise definition of the “indicator type” may lead to exaggerated sensitivity to a climatic variation and vice versa, while with the unsupervised approach the selected degree of consistency in the identified groups may also affect the result. Under these circumstances it would be tempting to avoid a rigid framework of pre-defined flow regime types, at the same time preserving information about seasonal behaviour of river flow [2]. Given the above remarks, the use of the more objective, unsupervised approach seems to be fully justified. Consequently, in this study the unsupervised method of analyzing the regime characteristics was applied to determine changes in the flow regime of the Vistula River along its course.
The study consists of three main parts: in the first part changes in the flow regime characteristics along the Vistula were analyzed. In the second part gauging stations on the Vistula mainstream and its tributaries were grouped. In the third part of the study sequences of hydrological periods on the Vistula River mainstream and its tributaries were identified and their occurrence in the yearly cycle was discussed.
2.3.1. Analysis of Changes in the Flow Regime Characteristics along the Vistula River Mainstream
In this part, in order to recognize changes in the flow regime characteristics along the Vistula, data from 22 gauges located along the river mainstream were analyzed. The following coefficients and indices were calculated:
- coefficient of variability of daily discharges (Cv):where: is the standard deviation; is the mean;
- coefficient of groundwater supply ()—obtained in accordance with the method proposed in [35], where the average value of the ground outflow was calculated as the median of the linearized values of the monthly minimum flows arranged in ascending order;
- uncertainty of the occurrence of the maximum (Emax) and minimum (Emin) monthly flow, according to the theory of entropy information in [36], applied in [37]:where: is the probability of occurrence of the maximum monthly flow in a given month:where: is the number of occurrences of the maximum flow in i-th month, is the number of analyzed years,where: is the probability of occurrence of the minimum monthly flow in a given month:where: is the number of occurrences of the minimum flow in i-th month, is the number of analyzed years.
The maximum value of Emax or Emin is achieved when the maximum or minimum monthly flows in individual months of the year occur with equal probability. Because higher values of entropy mean a lower frequency of observation of a given river flow characteristics, entropy can be treated as a measure of the instability of the flow regime characteristics, expressed by the month in which the maximum and minimum flow occurs [38,39,40].
• coefficient of stability of the river flow regime (Cs) defined as the regularity of high (CS max) and low (CS min) flow periods during any given year, characterized by a pre-selected regime descriptor [41,42], used in [39,40].
According to [42] stability is determined by the frequency of a given regime descriptor in the shortest possible period of time. Therefore, the coefficient of stability is described by the following equation:
where: is the frequency of a regime descriptor (number of occurrences in m—consecutive months during a multiyear period, m = 1, …, 12), and CR is the distribution coefficient for the analyzed period of time:
Consequently, the stability of a river flow regime increases if the frequency of a given regime descriptor also increases, but its duration decreases. The stability coefficient CS reaches the maximum value only in specific optimal situations, since an increase in the length of the analyzed interval of time (duration of the descriptor) causes a decrease in the distribution coefficient CR, and an increase in the frequency of a regime descriptor [3].
2.3.2. Grouping of Gauging Stations in the Vistula River Basin
In this part of the study gauging stations on the Vistula mainstream and its tributaries were grouped. Using the Ward’s hierarchical grouping method the analyzed hydrological profiles were grouped. Values of the 73-pentad flow coefficients (PPC) were taken as the grouping criterion.
Among many techniques of clustering of similar elements, methods of hierarchical grouping are particularly useful. They are procedures of an agglomerating type, consisting of the grouping of n objects characterised by a similarity matrix in a hierarchical way. The general algorithm of hierarchical grouping starts from the assumption that each element (object) of the set under study is at first a separate class, a so-called one-element cluster. Then the number of classes is gradually reduced by joining them into groups called multi-element clusters. The procedure is iterated n−2 times until all the objects have been assigned to two clusters. The criterion of combining elements in groups is a minimum taxonomic distance (dpq = min) between two cluster (Sp and Sq). Depending on how this distance is defined, different methods of hierarchical grouping are mentioned. Wishart [43] cited six methods, namely the nearest neighbour, farthest neighbour, median, average group, centroid and Ward’s methods.
Ward [44] proposed a clustering procedure seeking to form the partitions Pk, Pk−1, …, P1 in a manner that minimizes the loss associated with each grouping and to quantifies that loss in readily interpretable form. Information loss is defined by Ward in terms of an error sum-of-squares (ESS) criterion. The error sum of squares is given by the functional relation:
where: xi is the score of the i-th individual.
2.3.3. Identification of Hydrological Periods on Rivers in the Vistula River Basin
In this part of the study, through the recognition of the temporal structure of hydrological phenomena and their changes in the annual cycle [34] also sequences of hydrological periods (characteristic phases of the hydrological cycle) on the Vistula River mainstream and its tributaries were identified and their occurrence in the yearly cycle was discussed.
The method employed in order to determine the flow regime involved identification of the temporal structure of hydrological phenomena and their variations in the yearly cycle. Its theoretical foundations were introduced in [34,35]. An important part of the research procedure is separation of characteristic stages of the cycle, called hydrological periods. The procedure consisted of the grouping of elementary time units of the hydrological year on the basis of the similarity of one of their features. The elementary time unit was a five-day period of time called a pentad, and river discharge was the grouping criterion. So, the hydrological year consisted of 73 pentads, each represented by five values of river discharge.
The method of analysis and characterization of the river regime by identifying the temporal structure of hydrological phenomena and their changes in the annual cycle proposed in [34] was used not only in theoretical studies, but also in application research. It was applied to identify changes in the features of the flow regime in prognostic studies under various scenarios of global climate change [45]. It is also a tool helpful in determining the stability of river regime characteristics under the changing climatic or caused by human activity conditions. In previous research this method has been used to assess changes in the river flow regime characteristics caused by the varying intensity of the North Atlantic Oscillation [1].
The analyzed discharges were divided into 20-year intervals. In such a 20-year observation period a 100-element set of discharges is obtained for each of the pentads. The grouping characteristic is described by variable x, which was presented in the form of a discharge frequency distribution. The similarity of discharge distributions was defined using the nonparametric Kolmogorov-Smirnov test. The testing procedure results in is a quadratic similarity matrix of the yearly set of pentads, in which the rows and columns are designated by the numbers of the pentads in chronological order. The matrix is pictured as a diagram presenting relations (links) among the pentads in term of the similarity of their features. An illustrative diagram of similarity matrix depicting the structure of the elementary time units of the year and the method of distinguishing hydrological periods for the Vistula River in gauge Wisła is exemplified in Figure 2.
Along its diagonal, groups of similar pentads can be noted; it is those groups that formed so-called hydrological periods. Thus, a hydrological period is a time segment displaying a uniform structure of links among pentads in terms of the conformity of discharge distributions. River regime is defined as a kind and temporal structure of river discharges in a normal hydrological cycle. The elements of the structure are hydrological periods, which are a tool for the study of a regime and a basis for its classification [35].
The study was carried out with the help of Microsoft Office (Word and Excel) and STATISTICA 13 packages. The graphics were created using COREL and QGIS software.
3. Results
3.1. Changes of the Flow Regime Characteristics along the Vistula Mainstream
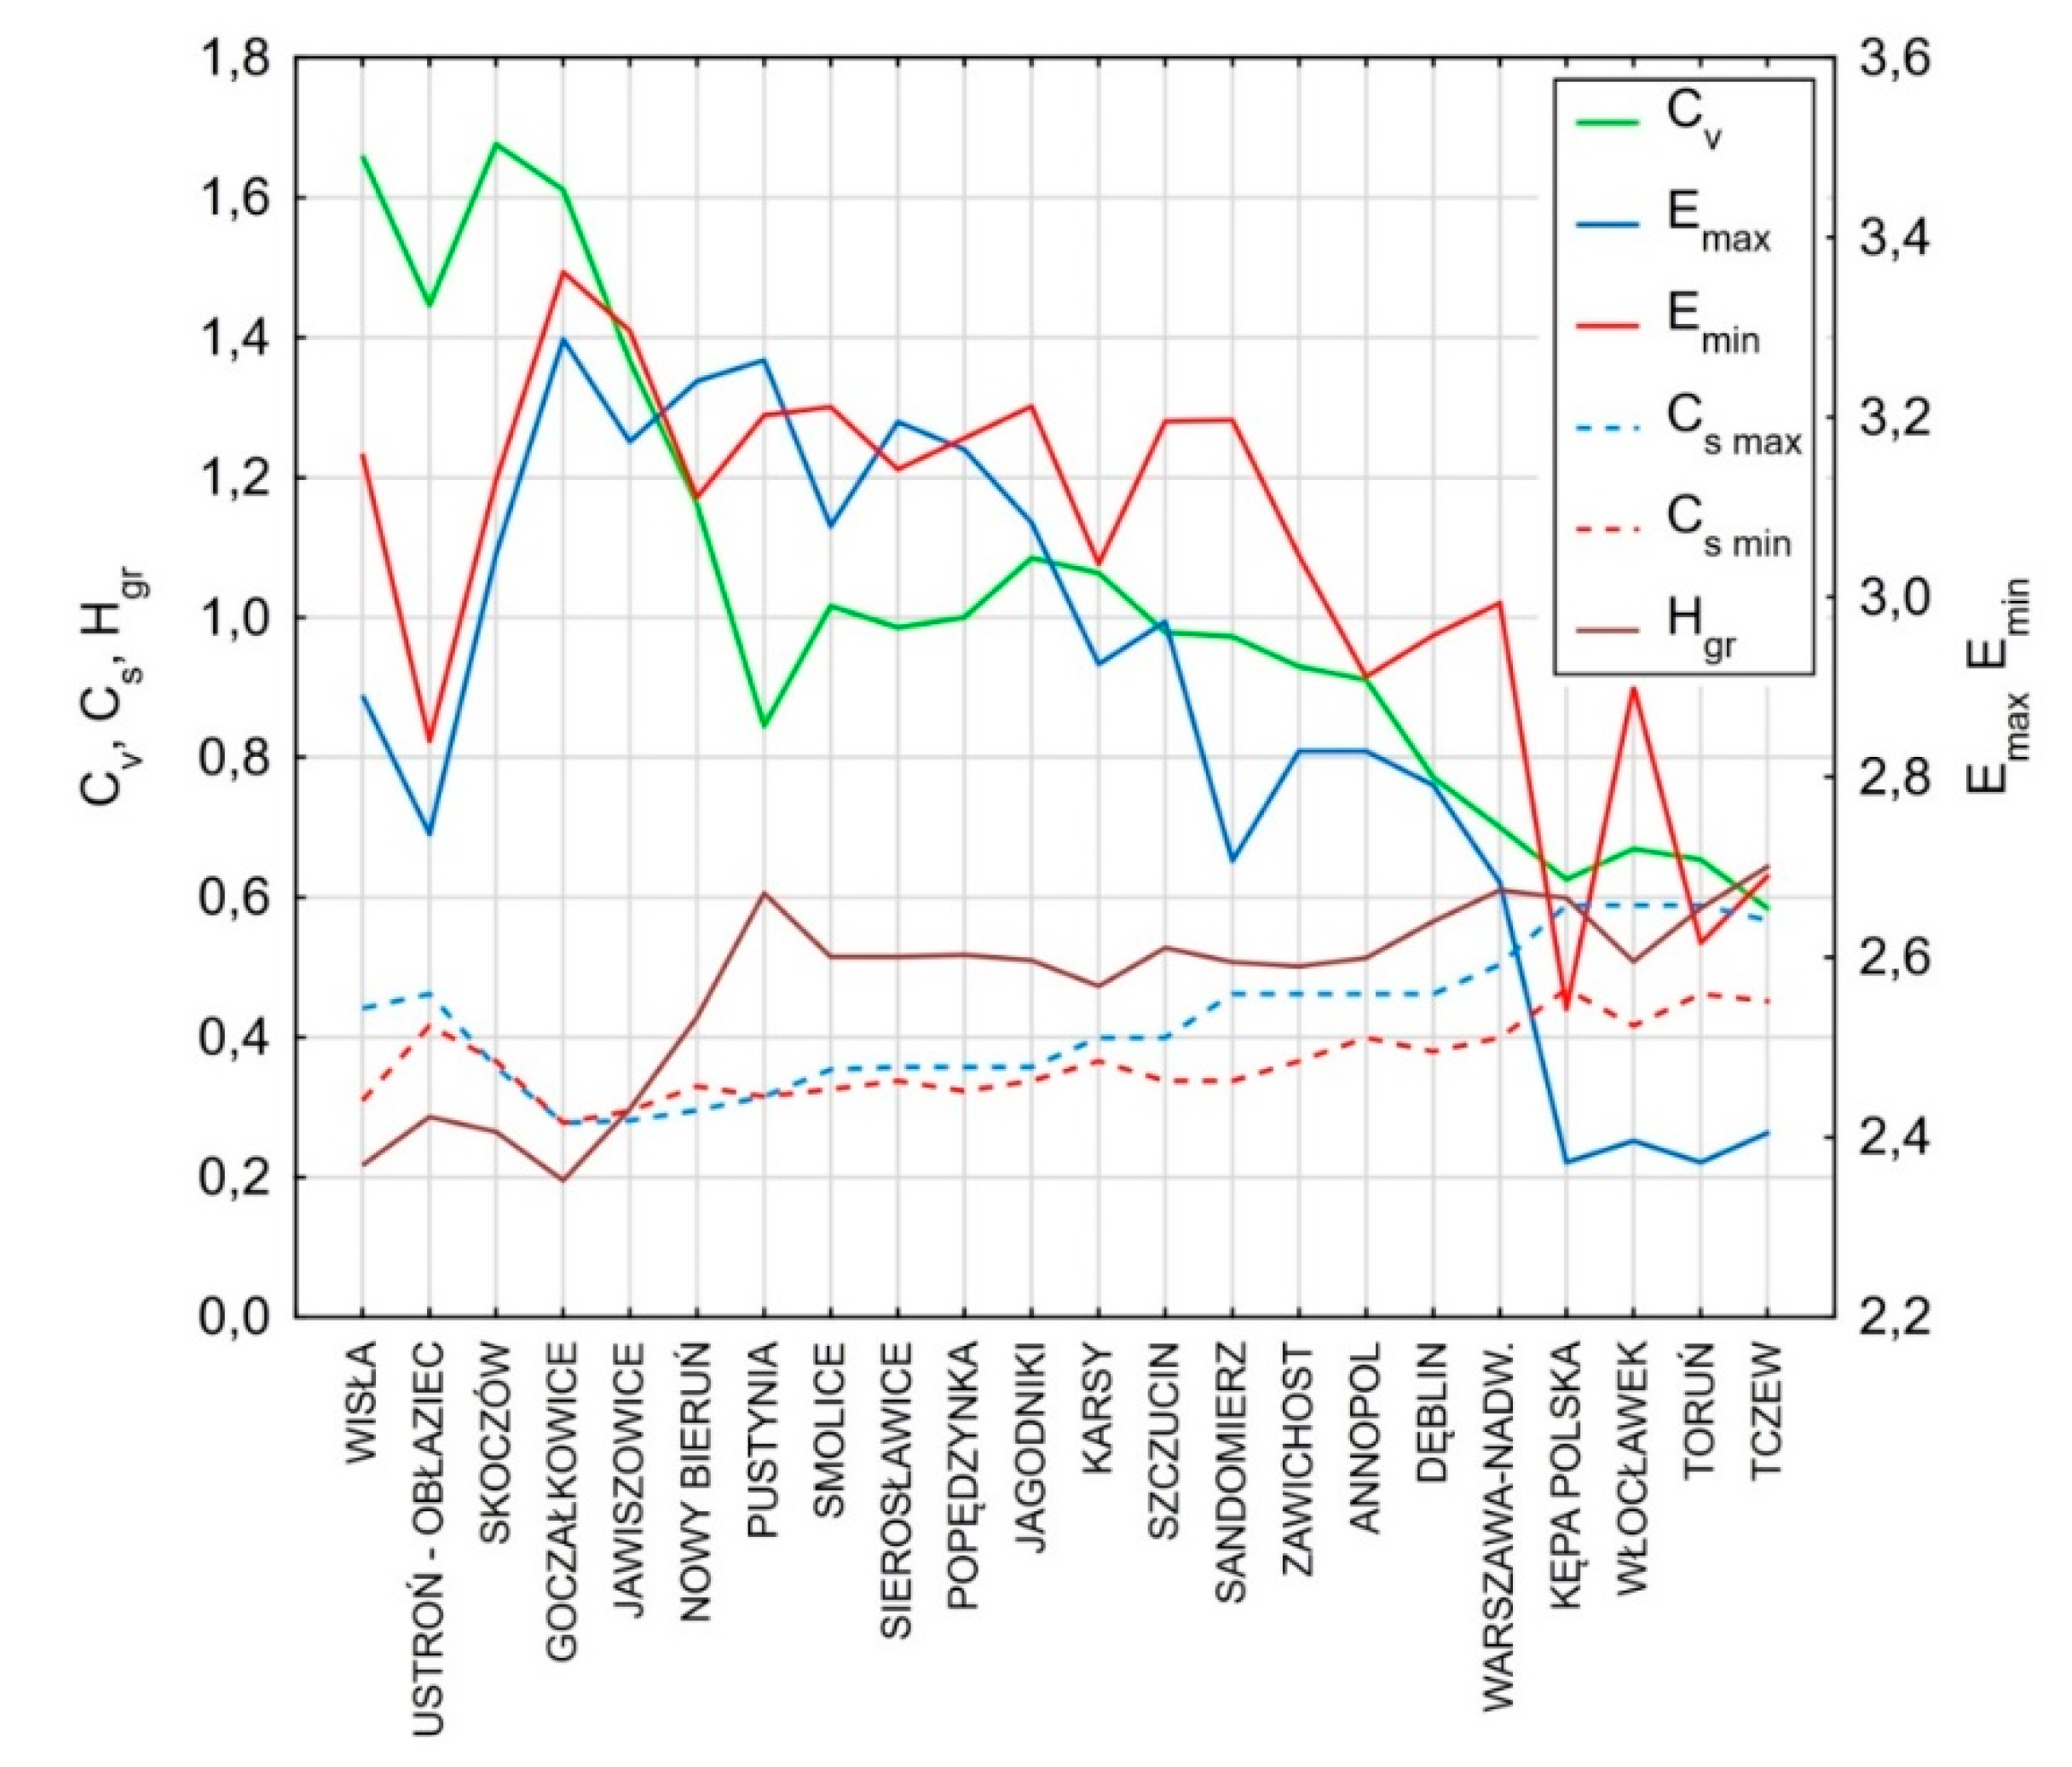
On the basis of the calculated coefficients and indices (Cv, CS, Hgr, Emax, Emin) the following types of the Vistula River regime were distinguished along its course, from the source to the mouth (Figure 3):
- 1st (4c)—section from the river source to gauge Skoczów: the nival-pluvial regime with a very high snowmelt flow (CS > 2.0) at the turn of March and April, and lower, but clearly marked flow caused by rainfall in summer (June, July or September) (CS < 1.4);
- 2nd (3b)—section between gauges Goczałkowice and Jagodniki: the nival-pluvial regime with a reduced thaw flow (CS < 1.5), which results from river regulations and inflow of tributaries with even flows (type 3a), represented by the Gostynia, Przemsza, Rudawa and Prądnik rivers;
- 3rd (4b)—section between gauges Karsy and Szczucin, below the inflow of the Dunajec River: the nival-pluvial regime with a high flow caused by rainfall, especially in the second half of July, and slightly lower high-water period caused by thaw in April (CS > 1.6).
- 4th (4a)—section between gauges Sandomierz and Warsaw: the nival-pluvial regime, below the inflow of the Wisłoka (4c) and San (4a) rivers the Vistula River takes over the regime characteristics of the San River. This is reflected by enhancing the thaw flow (CS > 1.7) and weakening of the rainfall flow (CS < 1.5), and it also results from the influence of regimes of the Vistula tributaries in its middle reaches (1, 2a);
- 5th (2b)—section between the mouth of the Narew River and the Vistula River estuary, where it meets the Baltic Sea: the moderately formed nival regime; the Vistula takes over the flow regime of the Narew and Bug (2b) rivers after the reception of their waters, which is reflected by a clear dominance of the snowmelt flow in spring (CS < 1.8) and a reduced summer flow (CS < 1.0).
3.2. Grouping of Rivers in the Vistula River Basin
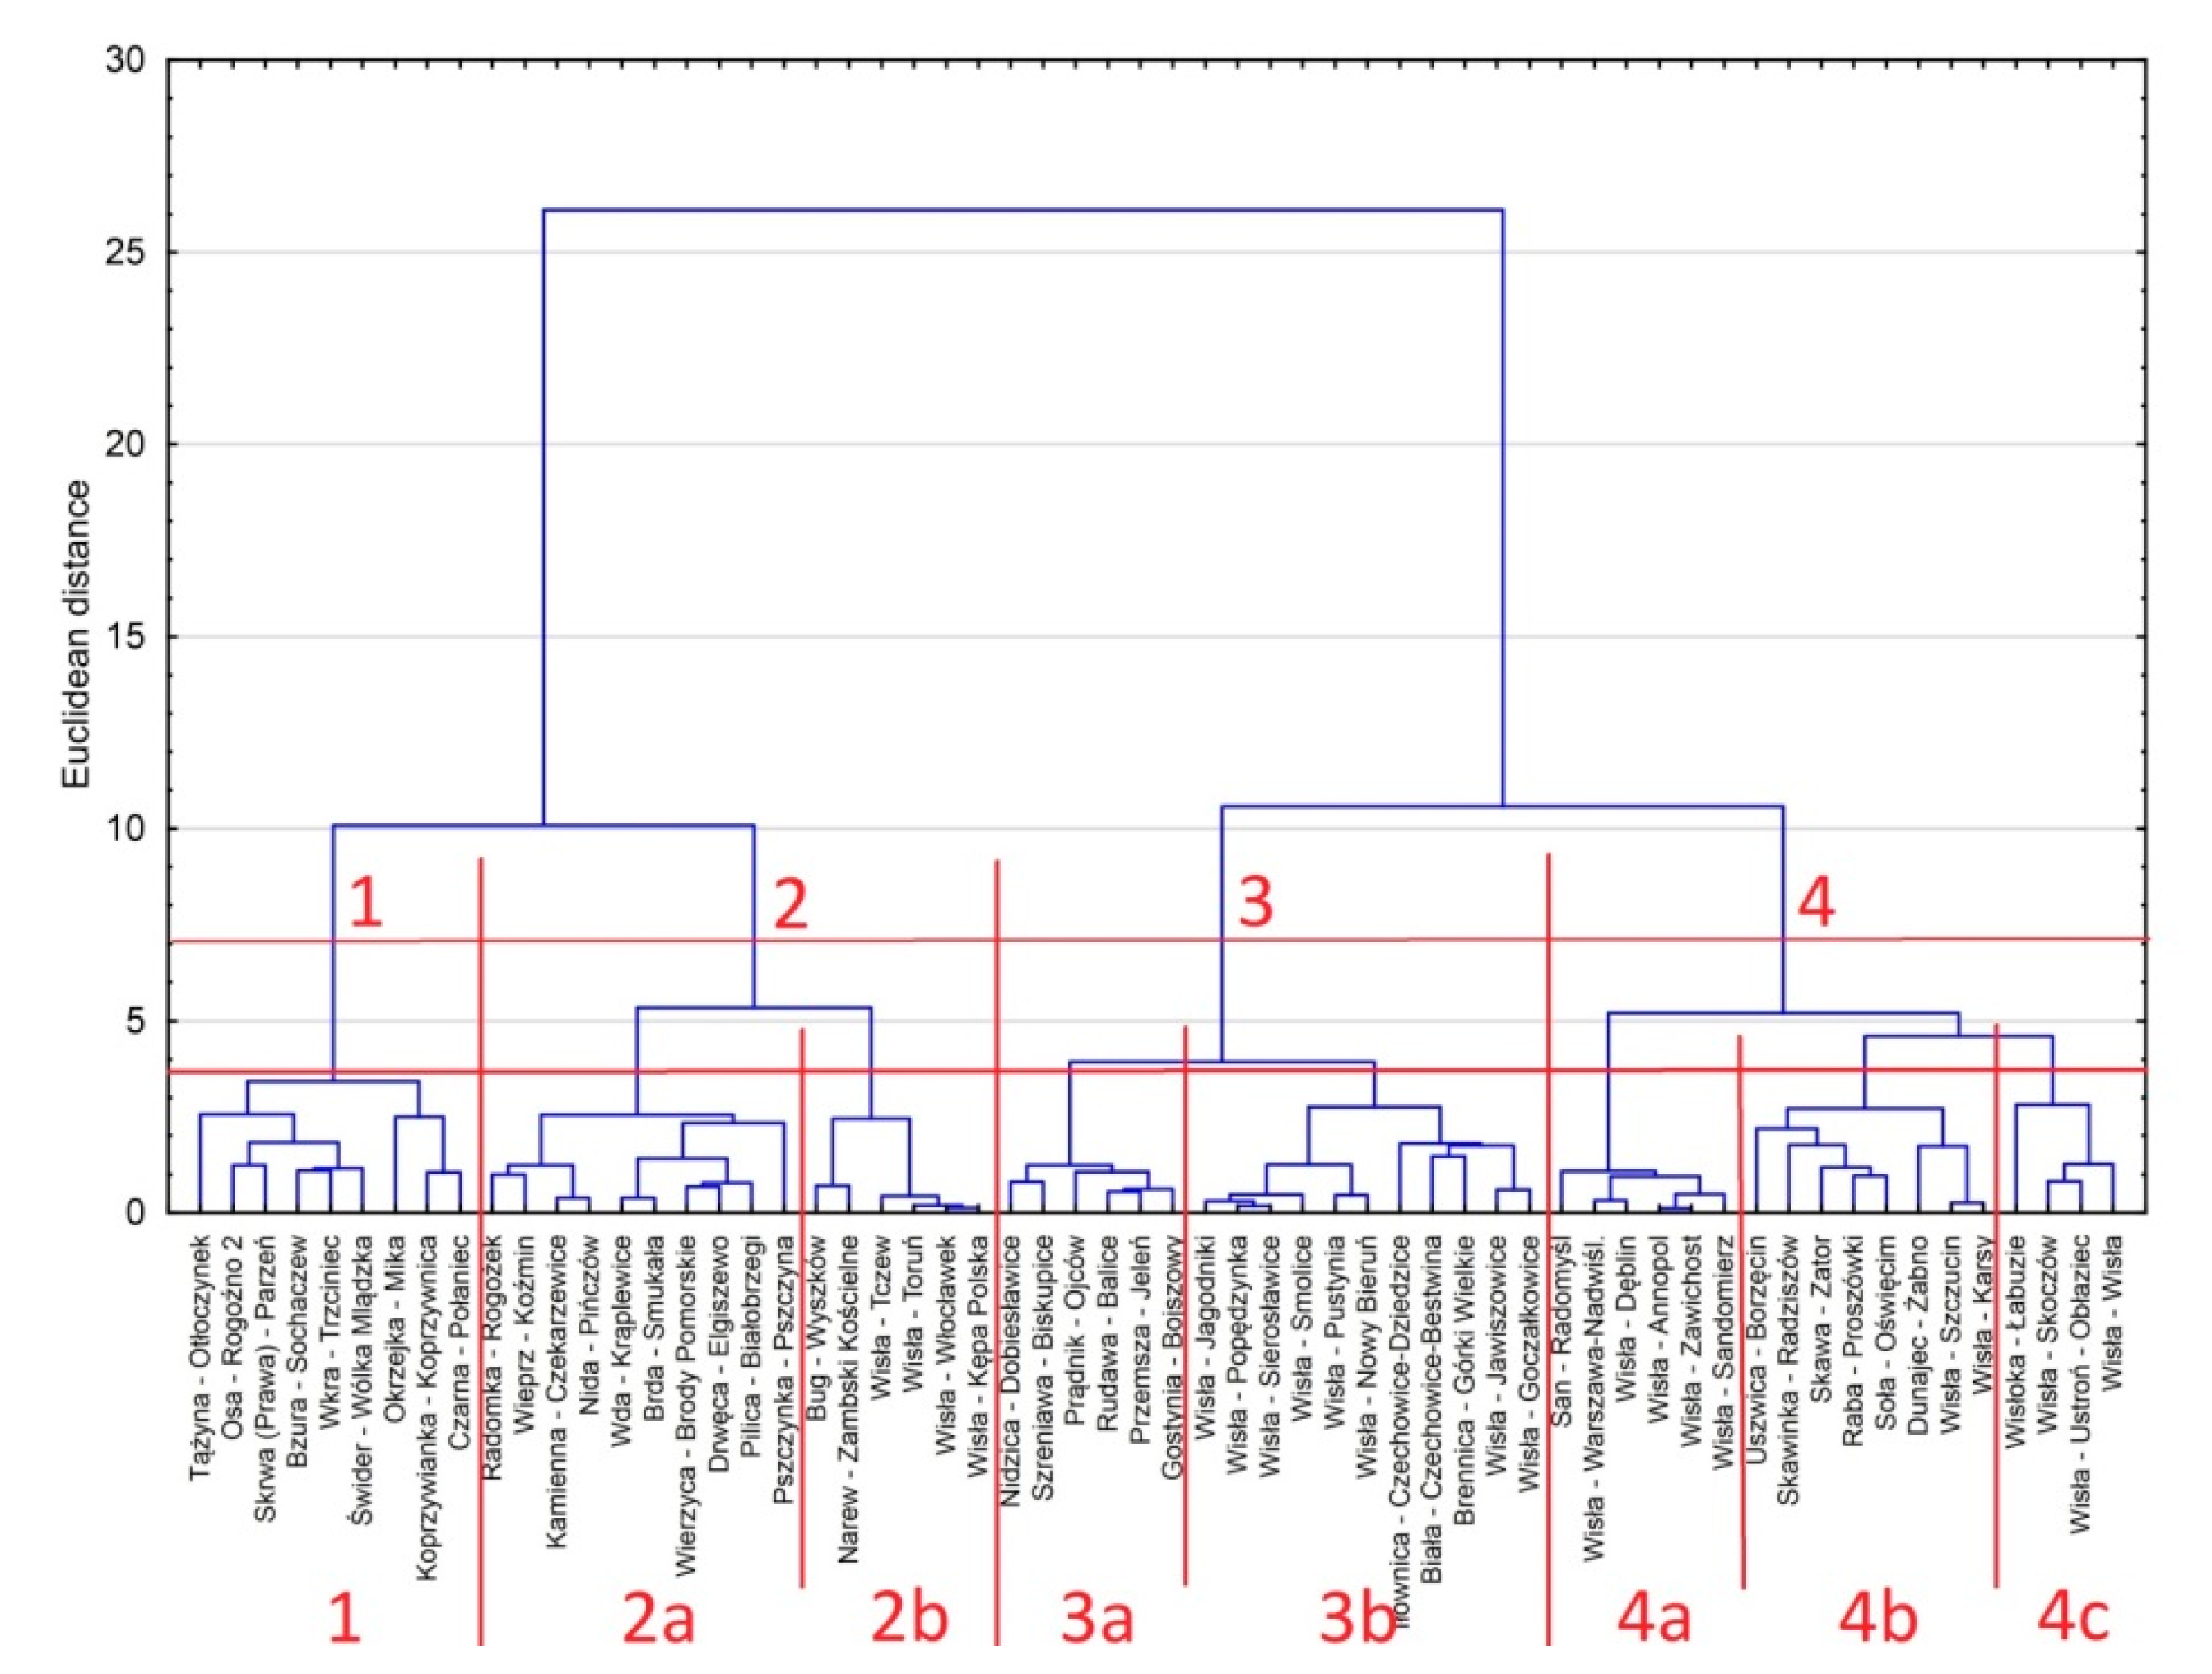
In the second part of the study 60 analyzed gauges (22 on the Vistula River mainstream and 38 on its tributaries) were grouped, based on the values of the 73-pentad Pardé’s coefficient of flow (PPC) in the average annual cycle. At the grouping level E.S.S. = 7 four main groups of rivers were identified: 1, 2, 3 and 4, respectively, while at the grouping level E.S.S. = 4 groups 2, 3 and 4 were additionally divided into seven sub-groups, numbered 2a, 2b, 3a, 3b, 4a, 4b, 4c, respectively (Figure 4).
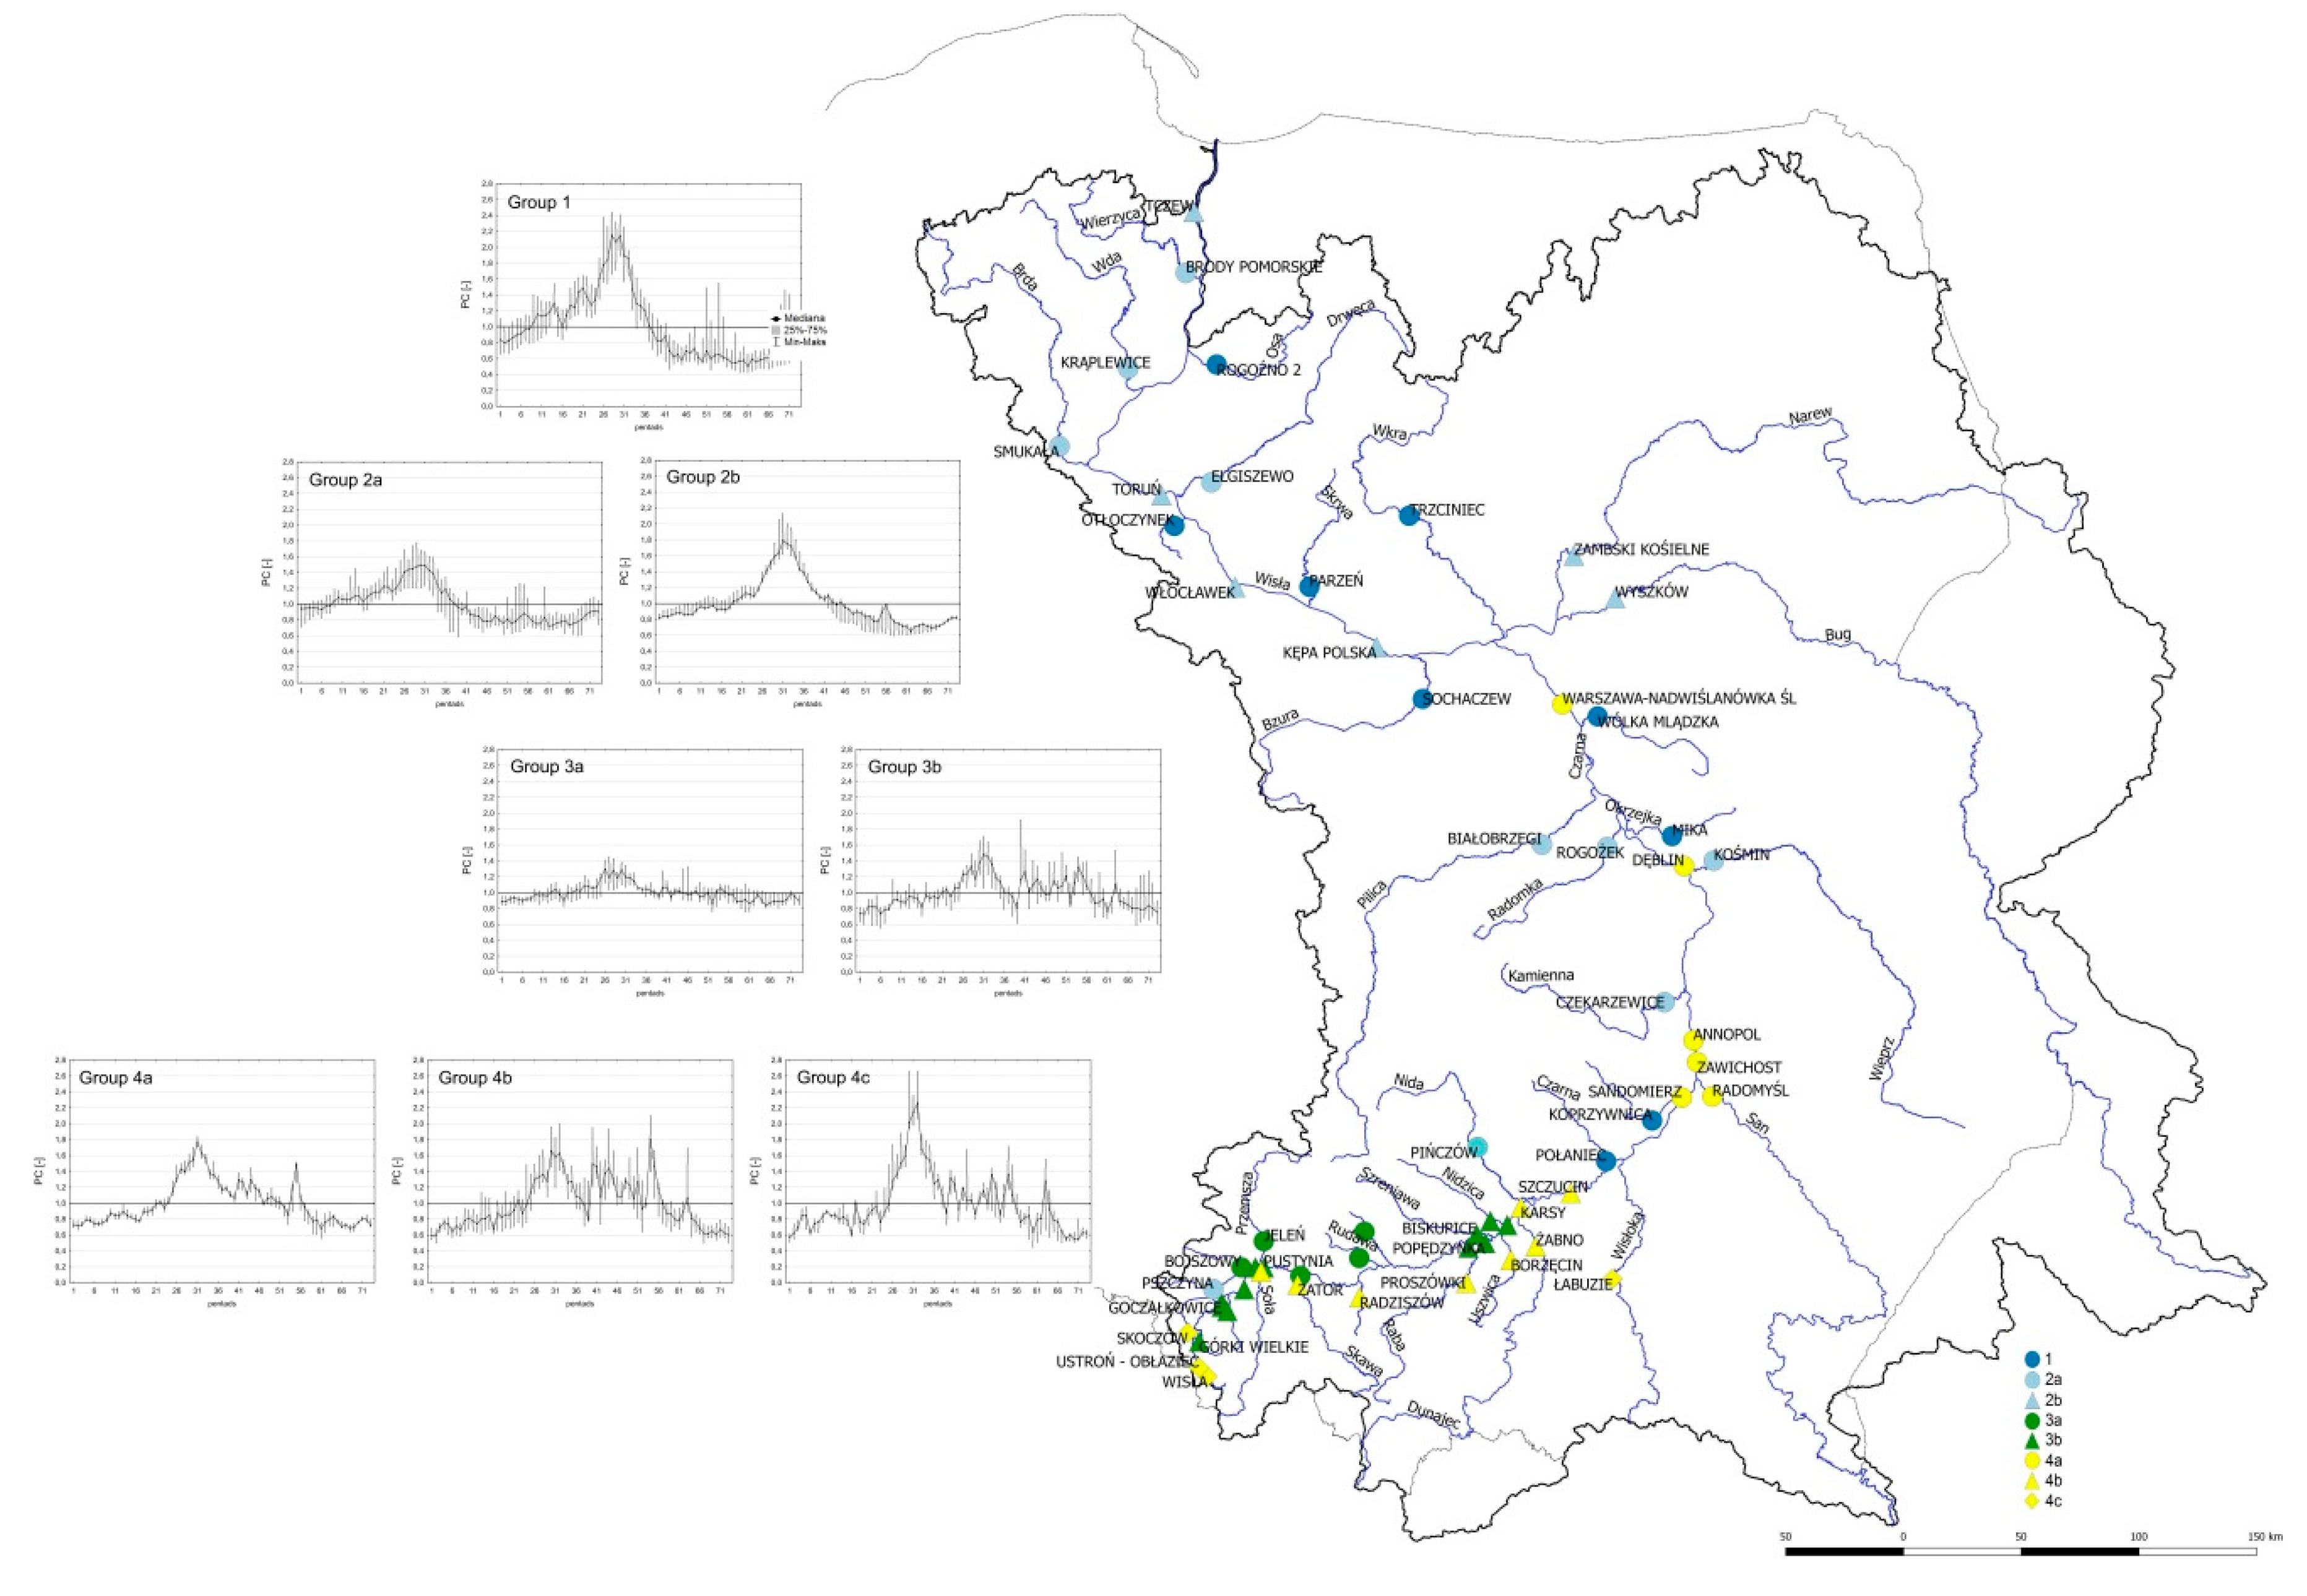
The grouping procedure resulted in distinguishing main groups of rivers, different in the course of PPC in the average annual cycle. Differences in the course of PPC in the separated sub-groups in the yearly cycle can be seen in Figure 5. It also shows spatial distribution of the grouped rivers.
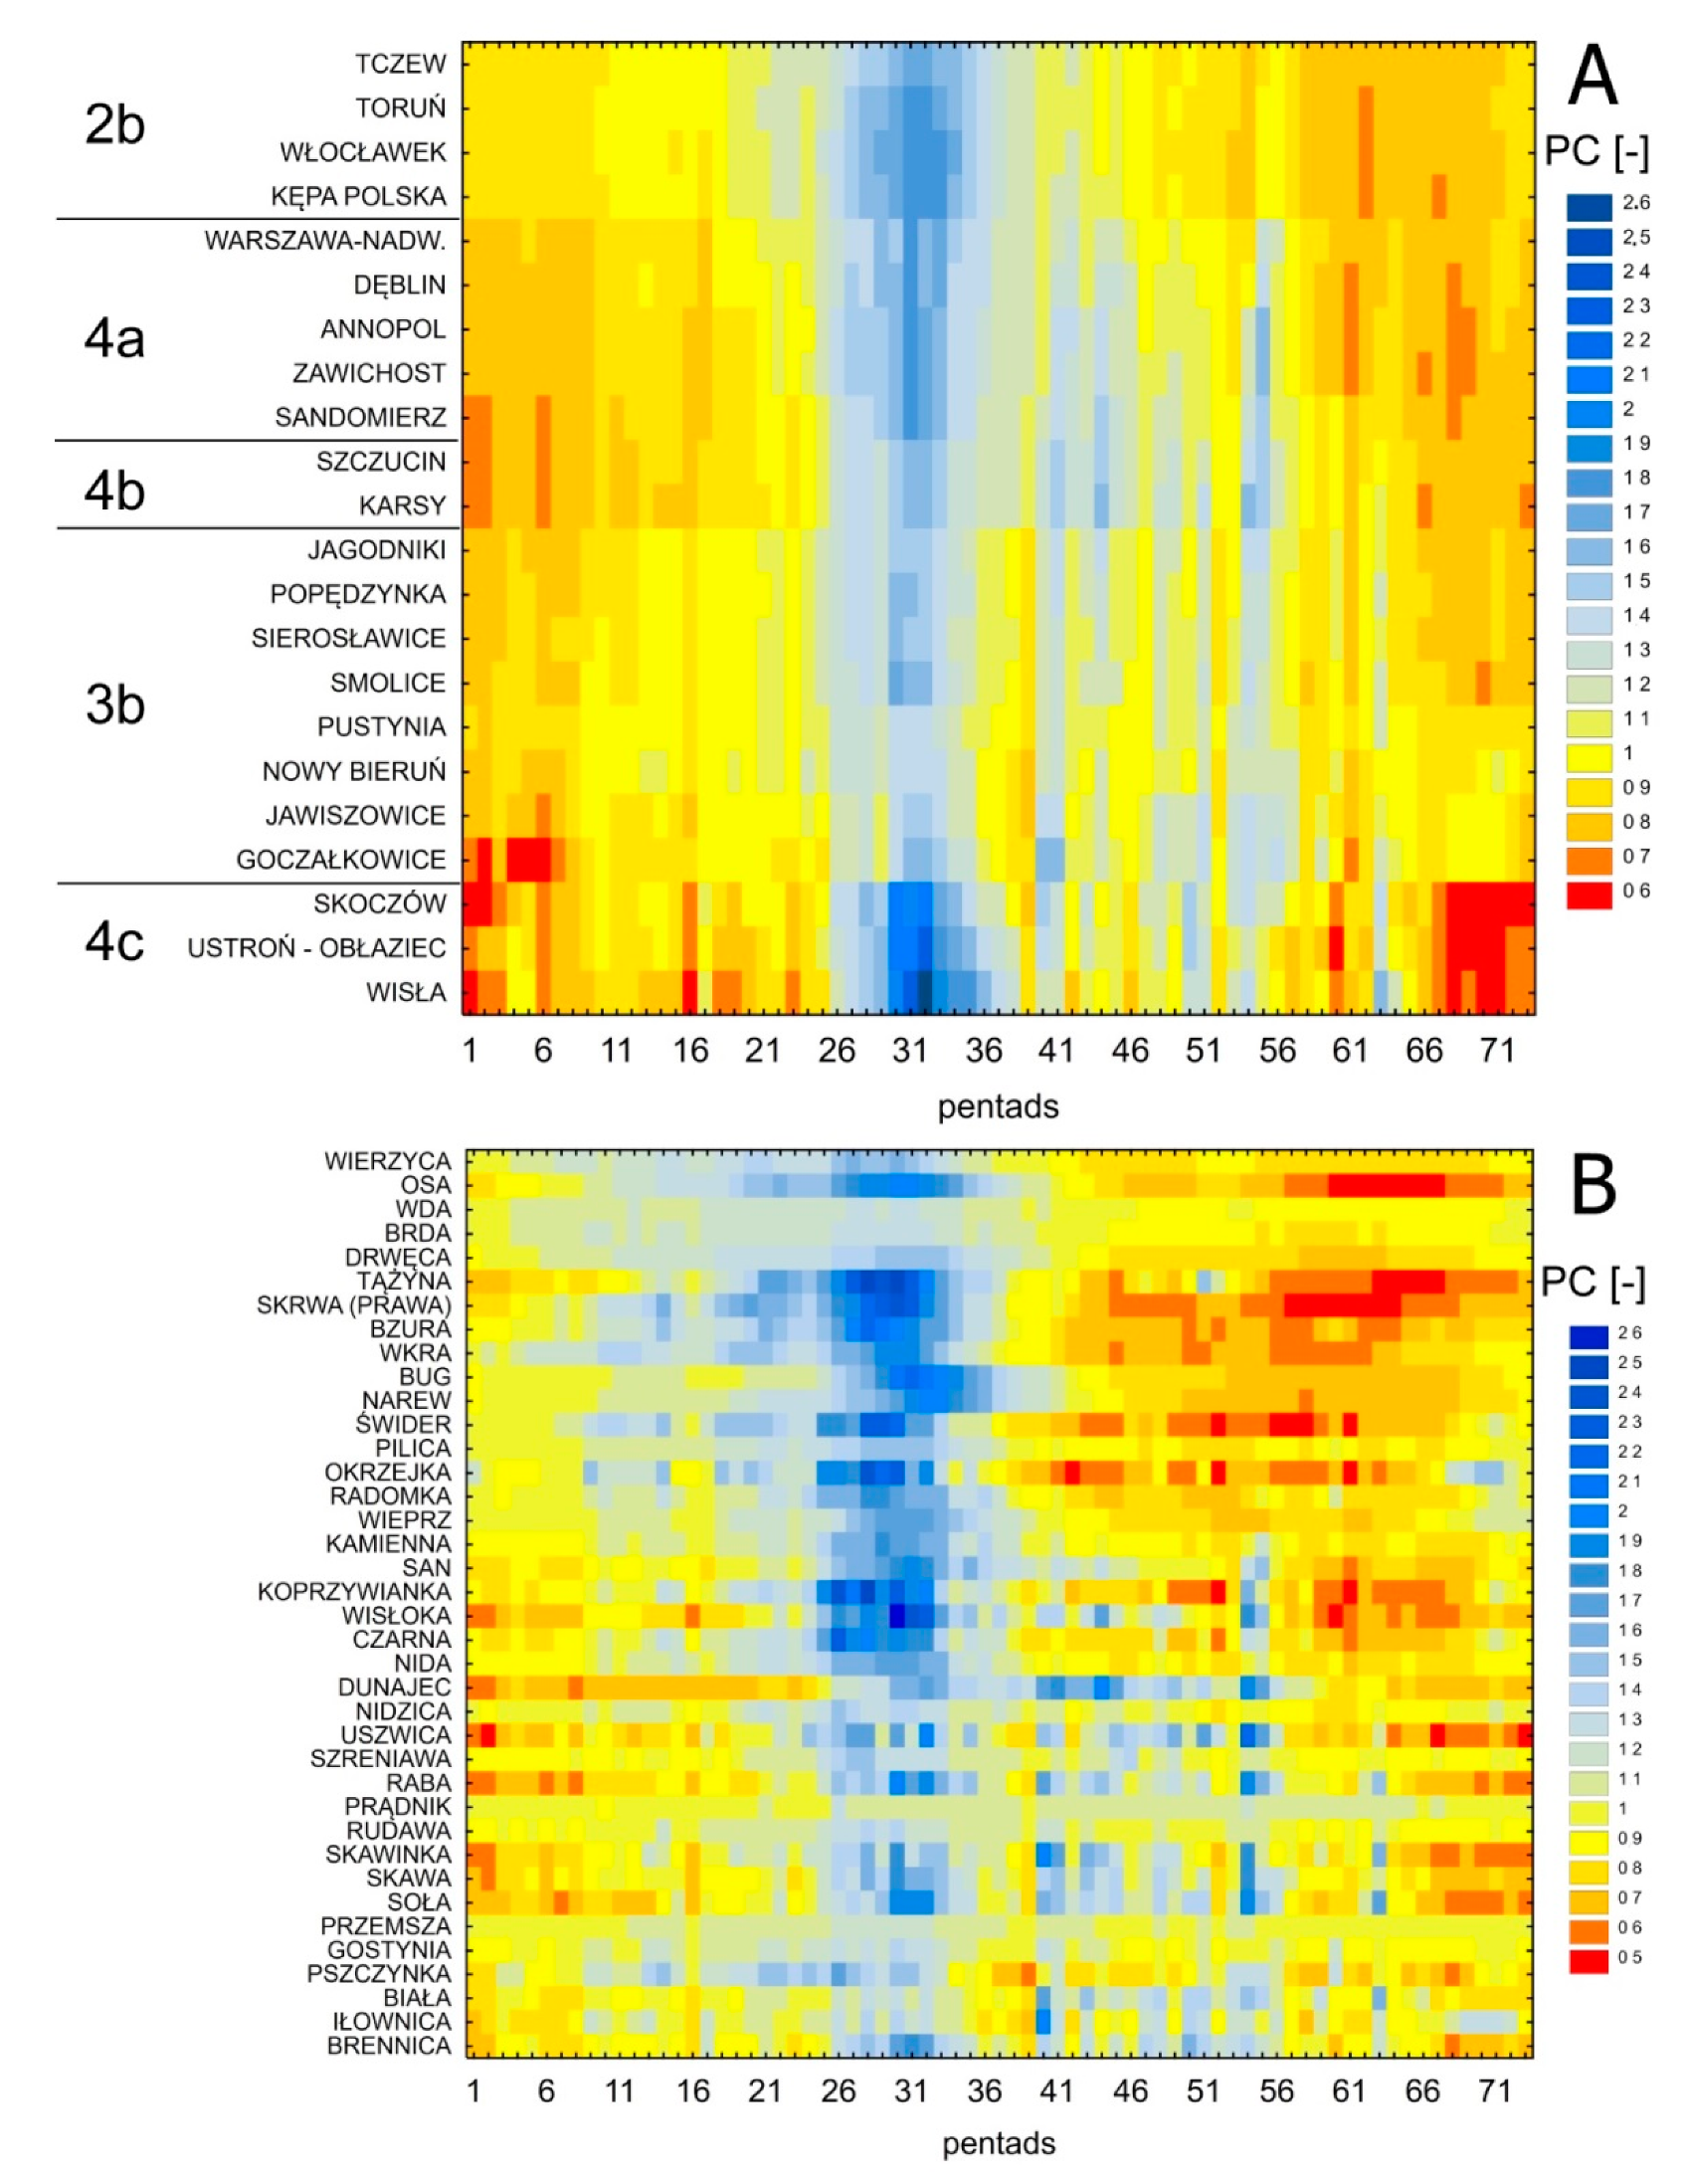
Additionally, Figure 6 shows the courses of PPC for the Vistula River mainstream (A) and its tributaries (B), respectively.
Group 1 consisted of nine rivers, tributaries of the Vistula, located both in the upper, middle and lower parts of the basin. These rivers were characterized by the most diversified flows and the most contrasting hydrological periods in the annual cycle. The period of higher flows began already at the turn of January and February, and the maximum snowmelt flows (PPC > 2.0) occurred in the last decade of March. The period of very low flows lasted from June to the end of September (PPC < 0.7).
Group 2 consisted of 16 rivers, divided additionally into two sub-groups: 2a—with 10 rivers, tributaries of the Vistula in its middle and lower reaches, and 2b—with six rivers, including the lower Vistula in all gauges after the intake of the Narew River waters, and also the Narew with its tributary—the Bug River. Similarly to rivers of group 1, in the seasonal structure of flow of rivers belonging to sub-group 2a there was a noticeable increase of flow the winter season (January–February). However, there was relatively lower (PPC = 1.5) culmination of snowmelt flow in spring, followed by the summer-autumn low-water period with slightly higher flows (PPC = 0.8). In case of rivers of sub-group 2b, there was a lack of increased flows in the winter months, while culminations of snowmelt flows in spring were much higher (PPC = 1.8), and they lasted longer, that is until the end of April. As a result, the low-water period began relatively later, that is in mid-June.
Group 3 was divided into two sub-groups: 3a—with six rivers, which were left tributaries of the Vistula in its upper reaches, and 3b—with eight gauges on the Vistula mainstream from Goczałkowice to Karsy, and its three right tributaries in this section of the Vistula. Rivers of sub-group 3a were characterized by the most even flows in the annual cycle, and the spring flooding period can hardly be distinguished (PPC = 1.3). Flow variations of rivers of sub-group 3b were similar to those of sub-group 3a, but the scope of changes in the pentadic flows in the hydrological year was much larger. In the summer season the high-water period caused by rainfall was also clearly marked.
Group 4 consisted of 18 gauges divided into three sub-groups. Sub-group 4a included the San River and the Vistula in five gauges below the San River, from Sandomierz to Warsaw. Sub-group 4b comprised all the Carpathian tributaries of the Vistula between rivers Soła and Dunajec, and the Vistula mainstream after receiving waters of the Dunajec River in gauges Karsy and Szczucin. Sub-group 4c contained the mountain part of the Vistula mainstream and its tributary—the Wisłok River. In the average annual cycle rivers of group 4 were distinguished by two flood periods: first in spring after snowmelt and second in summer after rainfall. For rivers in sub-group 4a, the range of changes of PPC was the lowest. On most rivers PPC reaches 1.8 in spring and 1.5 in summer. This was different in the case of rivers of sub-group 4b. During the summer high-water periods the pentadic values were higher (PPC = 1.8) than in spring. This indicates the dominant role of water supply from summer rainfall. On the other hand, rivers of the 4c sub-group were characterized by a clear prevalence of flow during the spring snowmelt, and PPC was then higher than 2.2.
3.3. Sequence and Types of Hydrological Periods in the Vistula River Basin
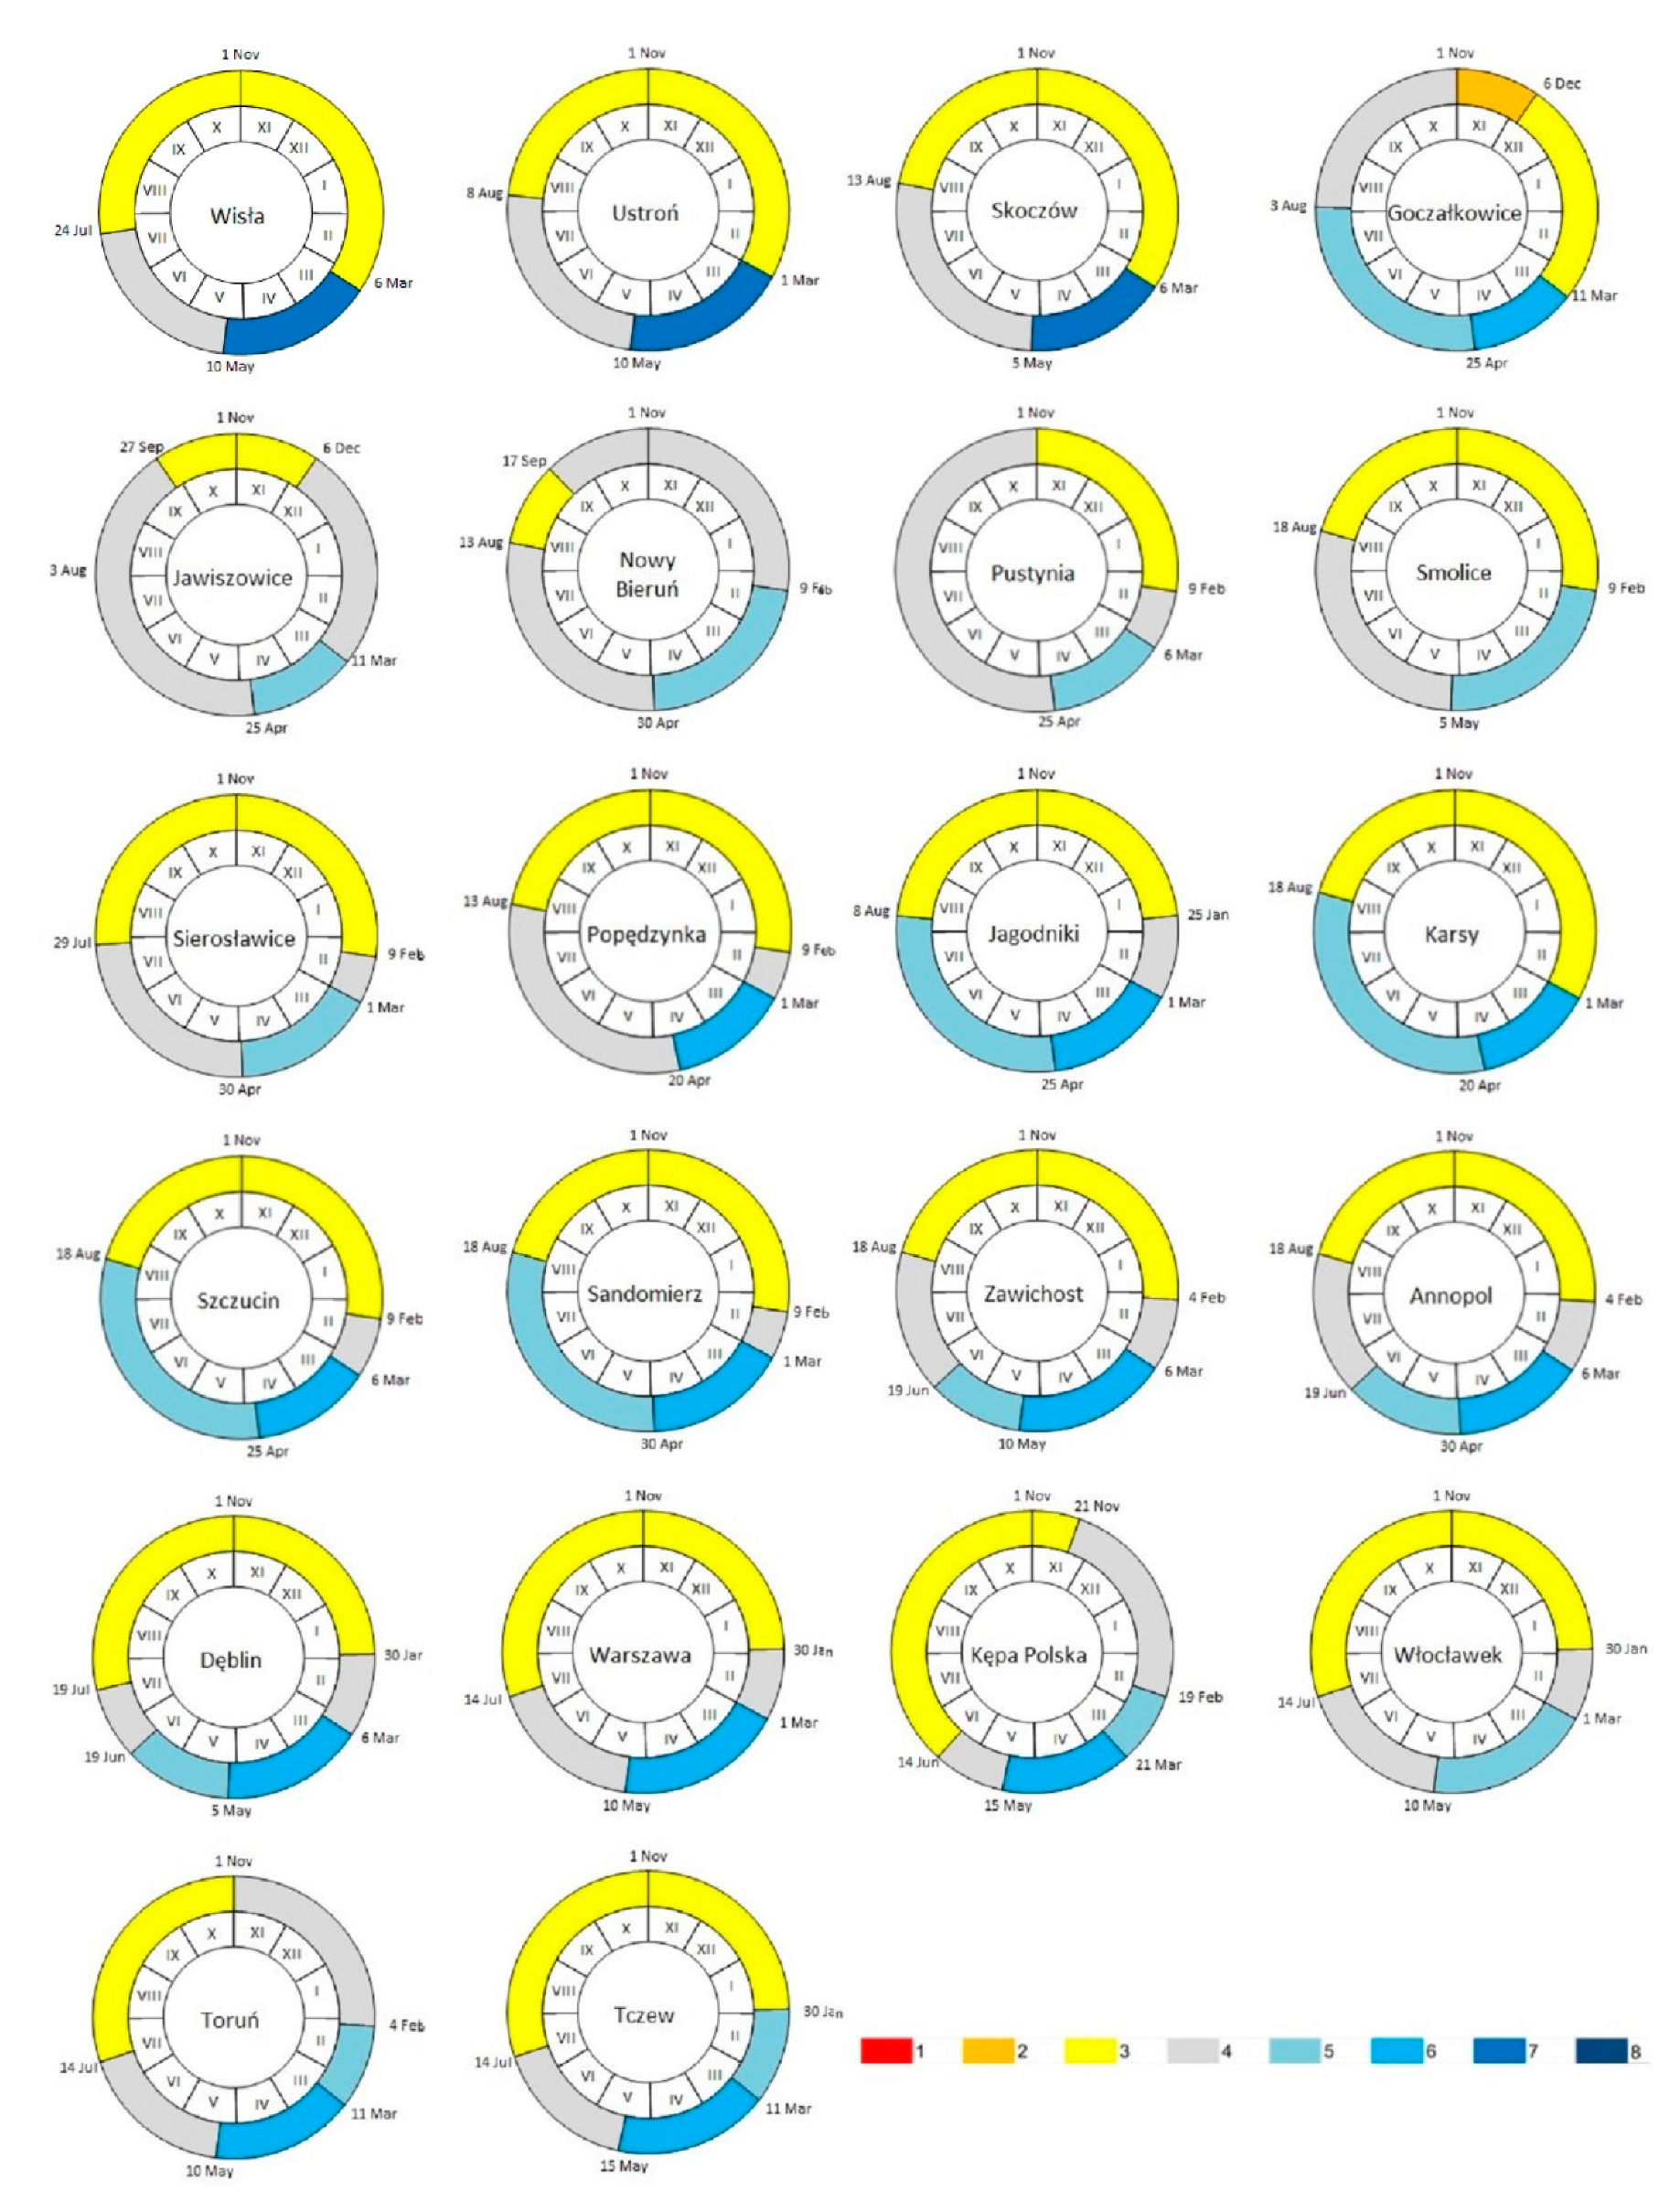
Analysis of the sequence and types of regime provides new information on changes in the characteristics of the flow regime along the Vistula River. In its upper section (up to gauge Skoczów) a three-stage type of regime can be distinguished. In the sequence of periods, there was a very specific, long low-water period lasting from summer, through autumn, until winter (from mid-August to the end of February), followed by the second period of very high discharges (flows) from the beginning of March to the first decade of May, and by the third period of normal (average) discharges (Figure 7).
A significant change in the flow regime of the Vistula was observed in gauge Goczałkowice, located below the Goczałkowicki Reservoir. There the sequence and types of periods were the most diversified, and the five-period type of river regime can be distinguished. From the beginning of the hydrological year, there was a 40-day period of the average low-water, followed by the shallow low-water in the winter period (from December to March). The period of thaw flow began after the first decade of March (average high-water) and ended at the end of April. Then, there was a shallow high-water period, which lasted until the beginning of August. The last period of average flows lasted until the end of the hydrological year.
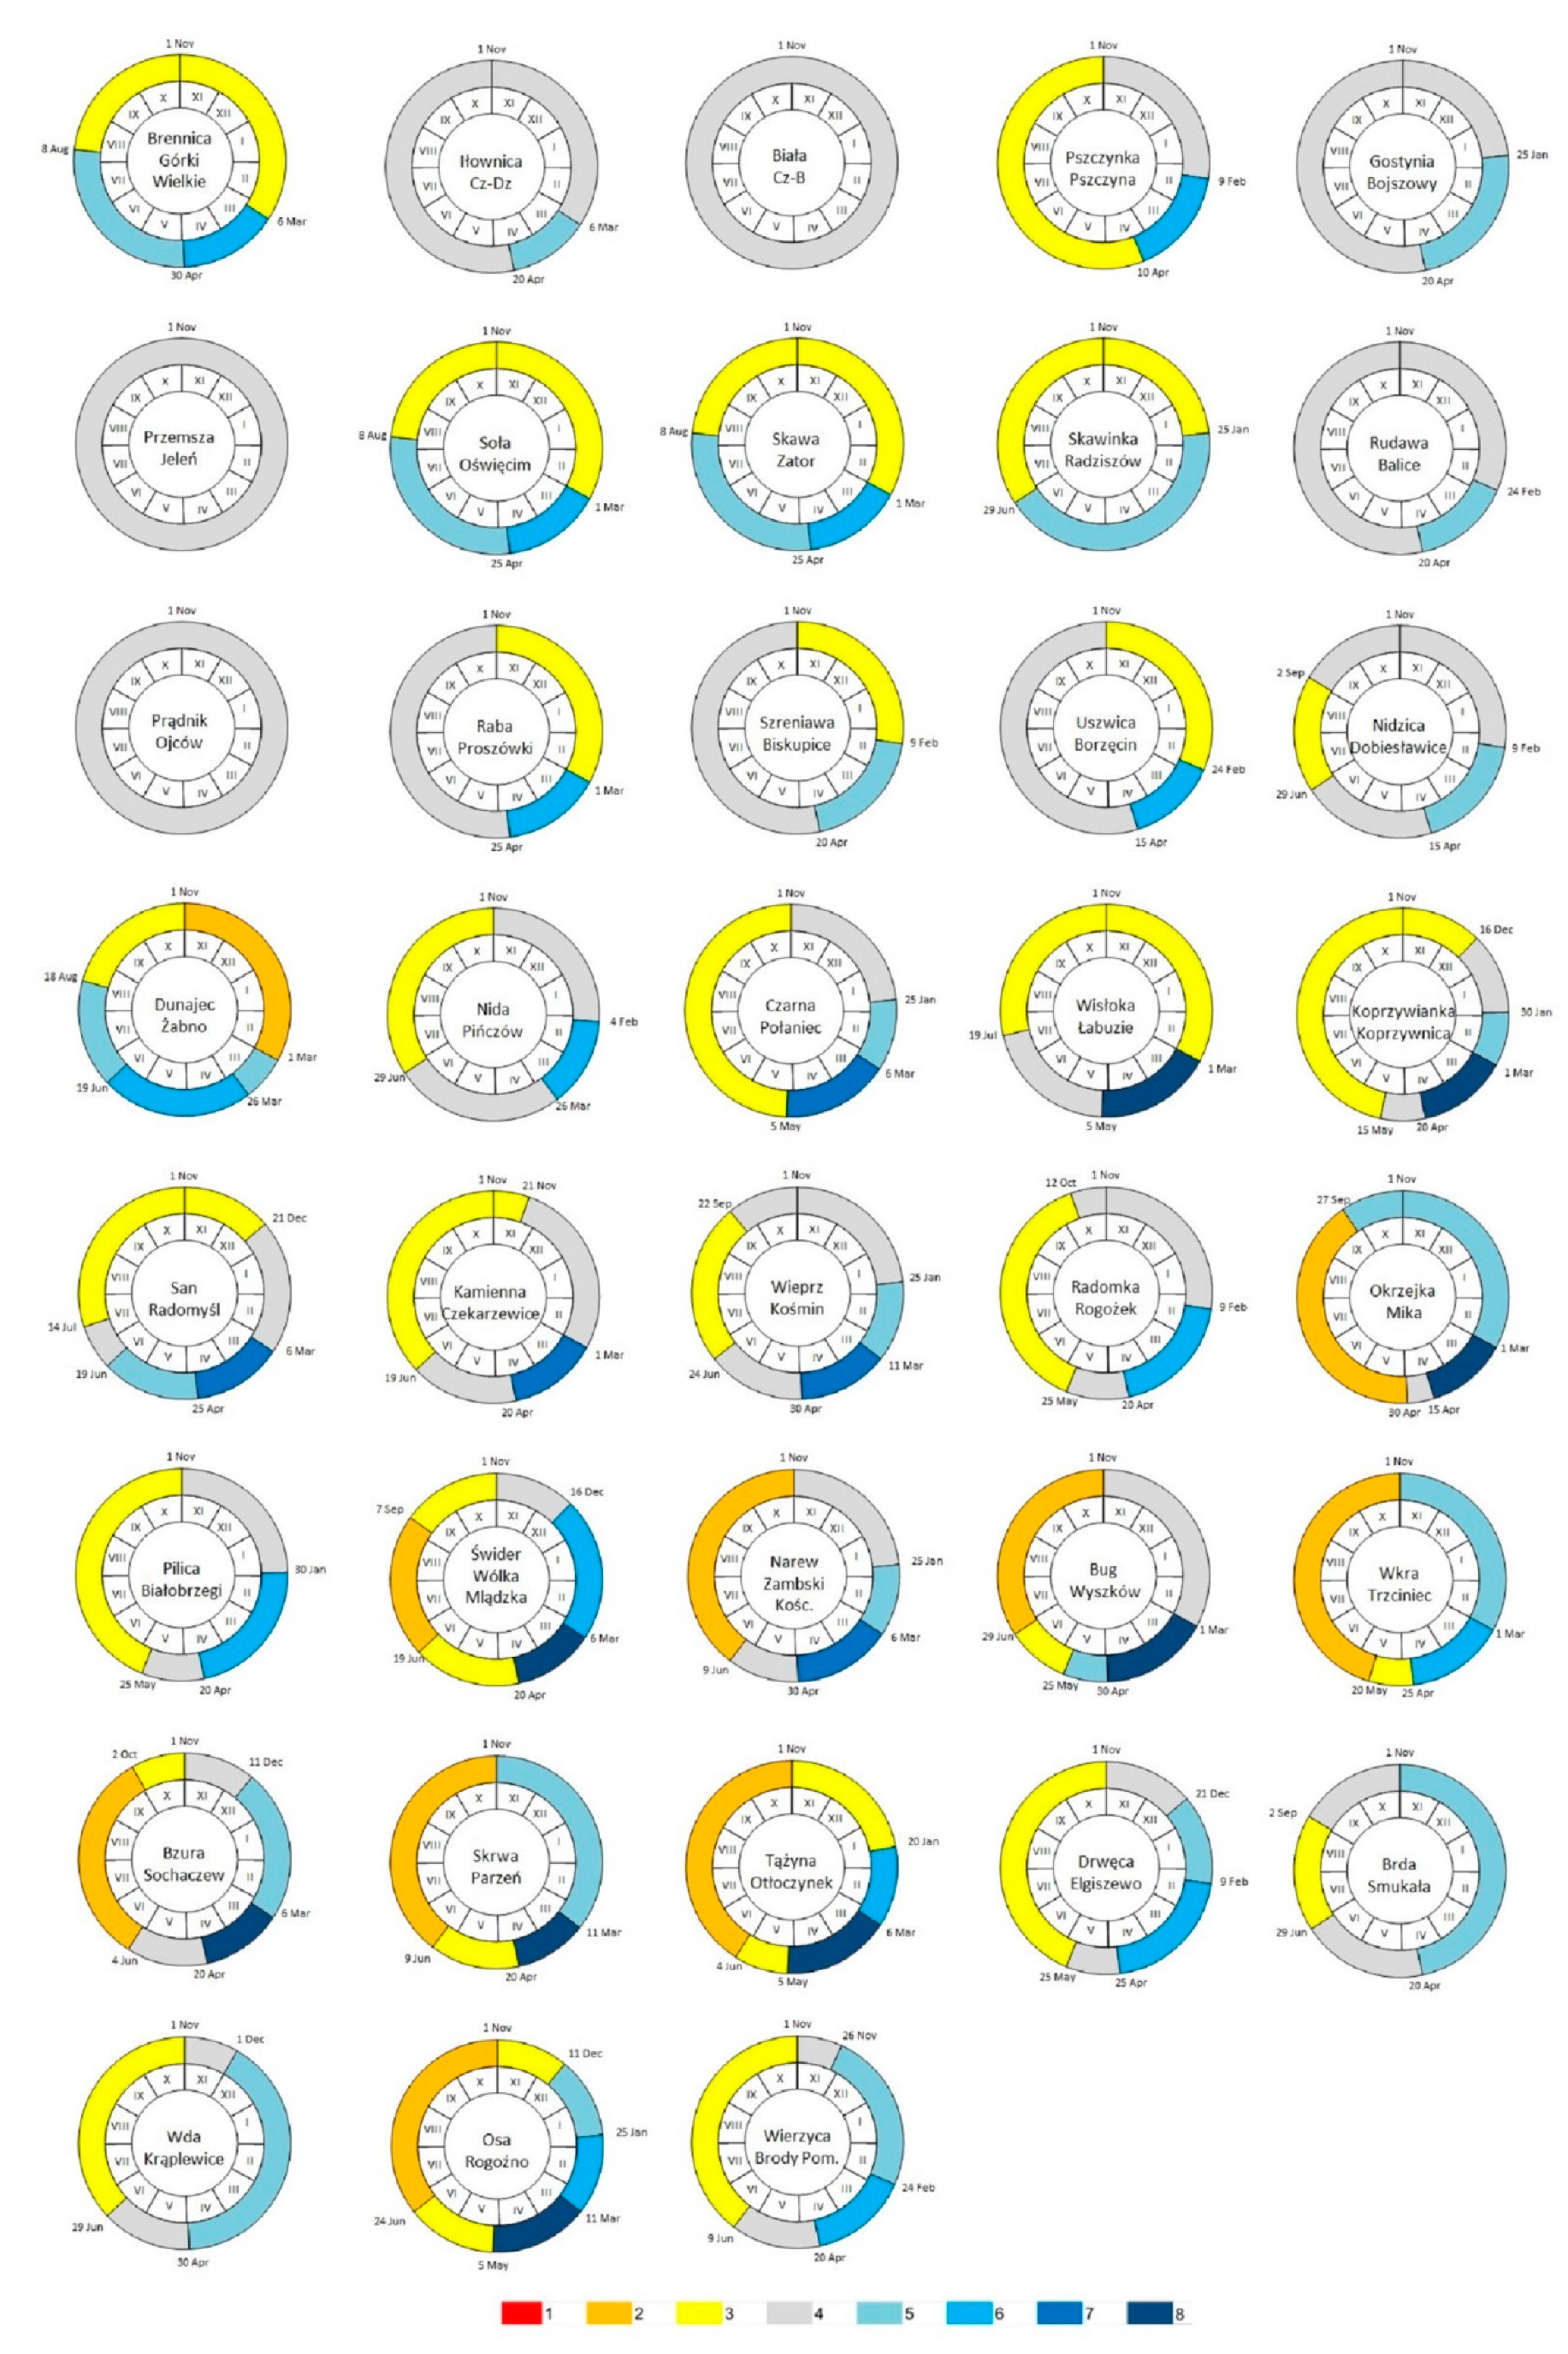
In the next section (between gauges Goczałkowice and Pustynia), the types of hydrological periods were the least varied along the entire Vistula River mainstream. The river had a three-period type of regime with a clear dominance of periods of average flows, which usually lasted over 200 days per year. A shallow high-water period occurred during the thaw season and lasted about two months: in March and April. In this section of the Vistula river flow was clearly levelled by its Silesian tributaries, which were transformed by the human activity: the Gostynia, Przemsza, Iłownica and Biała rivers, and characterized by a one-period type of regime with very even flows, without the high- and low-water periods (Figure 8).
After the intake of two Carpathian tributaries (the Soła and Skawa rivers) between gauges Smolice and Jagodniki, the sequence of hydrological periods became more diversified. In this section the Vistula River regime was a four-period with shallow low-water from August to the first decade of February, and with periods of average flows—in February and from May to July. There was an average or shallow high-water period caused by snowmelt in March and April. Further the Carpathian tributaries: the Uszwica, Dunajec and Wisłoka rivers, made that in the subsequent gauges (between Jagodniki and Sandomierz) the high-water periods lasted much longer (up to 170 days). They consisted of average high-water periods caused by snowmelt in March and April and shallow high-water periods caused by rainfall from late April to mid-August. In this section, in the summer months, daily discharges may have been higher than in the spring period, hence only in this section the Vistula River had the pluvial-nival regime.
After the admission of San River, the Vistula regime took over many of its features, which was mainly reflected in shortening of the high-water period. However, the high-water period caused by snowmelt was prolonged (in gauge Zawichost) until the first decade of May, and the subsequent low-water period lasted much shorter—until mid-June—and was not transformed into a typical summer high-water period caused by rainfall. As a result, throughout its middle course the Vistula had a four-period type of regime with an average low-water period (from mid-July to the end of January), then a normal (average) period, followed by a high-water period caused by snowmelt until mid-May and an average-water period until mid-July.
In the lower reaches, after the intake of the Narew and Bug rivers, the Vistula still had the four-period type of regime and a similar sequence of hydrological periods. However, the beginning of the high-water period was clearly earlier—it is shifted from mid-February in gauge Kępa Polska to the 30 January in gauge Tczew. The high-water period consisted of a shallow high-water until the 13 March and an average high-water until mid-May. After this period, there was a transition period (normal). The shallow low-water period usually began in mid-July and lasted until the end of the hydrological year (in gauge Toruń) or even until the end of January (in gauge Tczew).
4. Discussion and Conclusions
The purpose of this study was to identify the river regime characteristics, which could be a basis for future analyses aiming to determine hydrological consequences (changes of flow regime) associated with climate change and human activity. The research was mainly about determining transformation of the river regime characteristics resulting from natural (environmental) conditions. Recognition of the scale of that transformation allows the Vistula to be considered the allochthonous river, that is having the flow regime characteristics changed under the influence of environmental factors (different climatic conditions) in its upper reaches (in mountain and foothill areas).
Analysis of the flow regime of the Vistula River resulted in a detailed typology of this regime and proved that its changes were strongly influenced by the flow characteristics of its tributaries. The regime of the Vistula River shows most frequent transformations in its upper reaches (after the intake of the San River waters). In its mountainous section, below gauge Skoczów, the quasi-natural conditions of flow represent the nival-pluvial regime with very high discharges from early March to the first decade of May. Variability of daily discharges is there the highest (Cv > 1.5), while the share of groundwater supply is the lowest (Hgr < 0.30). The regime of the maximum and minimum monthly discharges is relatively stable, which is confirmed by the values of the average entropy (Emax and Emin). In the river section between gauges Goczałkowice and Jagodniki, where the Vistula meets both the transformed by human activity tributaries from the Silesian region and the Carpathian tributaries, the nival-pluvial regime of the river has the lowest stability (0.2 < Cs < 0.35), and the uncertainty of its characteristics is the highest. In that section the variability of daily flows is significantly reduced and the share of the groundwater supply increases. Below gauge Pustynia these values are stabilized at Cv = 1.0 and Hgr = 0.55, respectively. In the last section of the upper reaches, after the intake of the Dunajec River, the Vistula has the pluvial-nival regime with a clearly extended flood season from March to mid-August.
In the middle reaches the Vistula has the nival-pluvial regime with the dominance of the thaw flow. In that section the flow variability Cv (up to 0.65) and the uncertainty of the maximum and minimum monthly flow decrease, while their stability Cs increases (up to 0.50).
In the lower reaches, below the Narew River, the Vistula has the moderately formed nival regime. In this section the river has the lowest variability of daily flows (Cv = 0.60), the largest share of the groundwater supply (0.60), the highest stability of the maximum (Cs max =0.60) and minimum (Cs min = 0.45) flows and consequently their uncertainty is the lowest.
This research, similarly to results of earlier studies presented in [38,40,46], proves that new indicators based on the theory of information entropy and determining river regime characteristics provide reliable information on regularity of river runoff pattern in the annual cycle, and can be used to determine their transformation.
Previous analyses of the regime stability in the Vistula River basin reveal that rivers in its upper part represent the most stable characteristics of the flow regime in the years 1951–2010 [23]. This refers to the rivers of the upper and middle part of the Vistula River basin along with the Bug River, and indicates that the transformation of the Vistula regime has so far been influenced more by the natural conditions of the flow of its Carpathian tributaries than by climate changes. However, this is different in the case of rivers in the north-eastern part of the Vistula River basin, in the Narew River basin (with the exception of the Bug River). Wrzesiński and Sobkowiak [23] revealed greater importance of climatic conditions in the modification of their flow regime characteristics. This is reflected in transformations of the flow regime characteristics in the winter-spring period, a clear decrease in winter flows and a delayed increase in the spring melt flow in the 1950s and 1960s. In turn, in the 1970s and 1980s on these rivers there was a disappearance of winter low flows associated with a visible increase in winter flow, sometimes also prolonging a relatively lower high-water period in spring. The observed regularities may indicate the importance of changes in the macro-scale intensity of the type of air circulation, namely the North Atlantic Oscillation, which affects the conditions of water circulation not only in Western Europe, but also in Poland, which was detected in a number of earlier works [47,48,49,50] and the thermohaline circulation [14].
In general, these findings are consistent with results obtained in [23,24], and other researchers analyzing river regime characteristics and their long-term trends in Europe, including [6,8]. Changes in the regime characteristics detected in the Vistula River basin are typical of allochthonous rivers. It is worth noting that the Vistula is one of few European rivers that has retained its quasi-natural flow and therefore is more sensitive to changes of regime patterns than a large part of heavily regulated allochthonous rivers in the world.
As pointed in [24], the identified spatial and temporal (seasonal) patterns of river regime are unstable and may change over time, as do the seasons and climate regions. Despite this, identifying there regularities does not seem to be a meaningless task, since such a description allows to outline at least the framework of possible temporal variability today and in the future and to approximate the directions of possible changes of the current hydrological state of individual parts of the river basin.
Author Contributions
Conceptualization, D.W.; methodology, D.W.; software, D.W. and L.S.; validation, D.W.; formal analysis, D.W.; writing—original draft preparation, D.W. and L.S.; writing—review and editing, D.W. and L.S.; visualization, D.W.; supervision, L.S. All authors have read and agreed to the published version of the manuscript.
Funding
This research received no external funding.
Conflicts of Interest
The authors declare no conflict of interest.
References
- Wrzesiński, D. Changes of the hydrological regime of rivers of Northern and Central Europe in various periods of the North Atlantic Oscillation. Quaest. Geogr. 2005, 24, 97–109. [Google Scholar]
- Krasovskaia, I.; Gottschalk, L. River flow regime in a changing climate. Hydrol. Sci. J. 2002, 47, 597. [Google Scholar] [CrossRef] [Green Version]
- Wrzesiński, D. Stability of high and low flow periods on European rivers. Badania Fizjograficzne Series A–Phys. Geog. 2014, A66, 183–194. [Google Scholar] [CrossRef]
- Stojkovic, M.; Prohaska, S.; Plavsic, J. Stochastic structure of annual discharges of large European rivers. J. Hydrol. Hydromech. 2015, 63, 63–70. [Google Scholar] [CrossRef] [Green Version]
- Pekarova, P.; Miklanek, P.; Pekar, J. Spatial and temporal runoff oscillation analysis of the main rivers of the world during the 19th–20th centuries. J. Hydrol. 2003, 274, 62–79. [Google Scholar] [CrossRef]
- Pekarova, P.; Miklanek, P.; Pekar, J. Long-term trends and runoff fluctuations of European rivers. Climate Variability and Change—Hydrological Impacts. In Proceedings of the 5th FRIEND World Conference, Havana, Cuba, 27 November–1 December 2006; IAHS Publ. 308: Wallingford, Oxfordshire, UK; p. 708. [Google Scholar]
- National Committee of the Slovak Republic for IHP. In Proceedings of the PROJECT 9 Flood Regime of Rivers in the Danube River Basin. Proposal submitted at 21st Working Meeting, Novi Sad, Serbia, 26 June 2007.
- Bormann, H. Runoff regime changes in German rivers due to climate change. Erdkunde 2010, 64, 257–279. [Google Scholar] [CrossRef]
- Khon, V.C.; Mokhov, I.I. The Hydrological Regime of Large River Basins in Northern Eurasia in the XX–XXI Centuries. Water Resour. Regime Water Bodies 2012, 39, 1–10. [Google Scholar] [CrossRef]
- Hall, J.; Arheimer, B.; Borga, M.; Brázdil, R.; Claps, P.; Kiss, A.; Kjeldsen, T.R.; Kriauciuniene, J.; Kundzewicz, Z.W.; Lang, M.; et al. Understanding flood regime changes in Europe: A state-of-the-art assessment. Hydrol. Earth Syst. Sci. 2014, 18, 2735–2772. [Google Scholar] [CrossRef] [Green Version]
- Pekarova, P.; Pramuk, B.; Halmova, D.; Miklanek, P.; Prohaska, S.; Pekar, J. Identification of long-term high-flow regime changes in selected stations along the Danube River. J. Hydrol. Hydromech. 2016, 64, 393–403. [Google Scholar] [CrossRef]
- Bower, D.; Hannah, D.M. Spatial and temporal variability of UK river flow regimes. In FRIEND 2002—Regional Hydrology: Bridging the Gap between Research and Practice, Proceedings of the Fourth International FRIEND Conference, Cape Town, South Africa, 18–22 March 2002; IAHS Publ. 274: Wallingford, Oxfordshire, UK; p. 518.
- Bochiola, D. Long term (1921–2011) hydrological regime of Alpine catchments in Northern Italy. Adv. Water Resour. 2014, 70, 51–64. [Google Scholar] [CrossRef]
- Wrzesiński, D.; Marsz, A.A.; Styszyńska, A.; Sobkowiak, A. Effect of the North Atlantic Thermohaline Circulation on Changes in Climatic Conditions and River Flow in Poland. Water 2019, 11, 1622. [Google Scholar] [CrossRef] [Green Version]
- Bocchiola, D.; Diolaiuti, G.; Soncini, A.; Mihalcea, C.; D’Agata, C.; Mayer, C.; Lambrecht, A.; Rosso, R.; Smiraglia, C. Prediction of future hydrological regimes in poorly gauged high altitude basins: The case study of the upper Indus, Pakistan. Hydrol. Earth Syst. Sci. 2011, 15, 2059–2075. [Google Scholar] [CrossRef] [Green Version]
- Tahir, A.A.; Chevallier, P.; Arnaud, Y.; Ahmad, B. Snow cover dynamics and hydrological regime of the Hunza River basin, Karakoram Range, Northern Pakistan. Hydrol. Earth Syst. Sci. 2011, 15, 2275–2290. [Google Scholar] [CrossRef] [Green Version]
- Faiz, M.A.; Liu, D.F.; Khan, M.I.; Li, T.X.; Cui, S. Assessment of characteristics and distinguished hydrological periods of a river regime. Environ. Earth Sci. 2018, 77, 729. [Google Scholar] [CrossRef]
- Harris, N.M.; Gurnell, A.M.; Hannah, D.M.; Petts, G.E. Classification of river regimes: A context for hydroecology. Hydrol. Process. 2000, 14, 2831–2848. [Google Scholar] [CrossRef]
- Kennard, M.J.; Pusey, B.J.; Olden, J.D.; Mackay, S.J.; Stein, J.L.; Marsh, N. Classification of natural flow regimes in Australia to support environmental flow management. Freshw. Biol. 2010, 55, 171–193. [Google Scholar] [CrossRef]
- Martinez-Capel, F.; Belmar, O.; Velasco, J. Hydrological classification of natural flow regimes to support environmental flow assessments in intensively regulated Mediterranean rivers, Segura River Basin (Spain). Environ. Manag. 2011, 47, 992–1004. [Google Scholar] [CrossRef] [Green Version]
- Rutkowska, A.; Willems, P.; Onyutha, C.; Młocek, W. Temporal and spatial variability of extreme river flow quantiles in the Upper Vistula River basin, Poland. Hydrol. Process. 2016, 1510–1526, 1–17. [Google Scholar] [CrossRef]
- Piniewski, M.; Marcinkowski, P.; Kundzewicz, Z.W. Trend detection in river flow indices in Poland. Acta Geophys. 2018, 66, 347–360. [Google Scholar] [CrossRef] [Green Version]
- Wrzesiński, D.; Sobkowiak, L. Detection of changes in flow regime of rivers in Poland. J. Hydrol. Hydromech. 2018, 66, 55–64. [Google Scholar] [CrossRef] [Green Version]
- Jokiel, P.; Tomalski, P. Differentiation of river flow seasonality and its multiannual changeability in selected cross-sections on the Vistula river. Prace Geogr. 2018, 155, 27–45. [Google Scholar] [CrossRef] [Green Version]
- Pociask-Karteczka, J. Geographical location of Poland against the background of Europe. In Hydrology of Poland; Jokiel, P., Marszalewski, W., Pociask-Karteczka, J., Eds.; Wydawnictwo Naukowe PWN: Warsaw, Poland, 2017. (In Polish) [Google Scholar]
- Kondracki, J. Regional Geography of Poland; PWN: Warsaw, Poland, 2002. (In Polish) [Google Scholar]
- Czaya, E. Rivers of the World; Edition Leipzig: Leipzig, Germany, 1981. [Google Scholar]
- Dynowska, I. Regime of river flow Sheet: 32.3. In Atlas of the Republic of Poland; IG PZ PAN: Warsaw, Poland, 1994. (In Polish) [Google Scholar]
- Peel, M.C.; Finlayson, B.L.; McMahon, T.A. Updated world map of the Köppen-Geiger climate classification. Hydrol. Earth Syst. Sci. Discuss. Eur. Geosci. Union 2007, 11, 1633–1644. [Google Scholar] [CrossRef] [Green Version]
- Pardé, M. Rivers; PWN: Warsaw, Poland, 1957. (In Polish) [Google Scholar]
- Lvovich, M.I. Water Resources of the World; PWN: Warsaw, Poland, 1979. [Google Scholar]
- Dynowska, I. Types of River Regimes in Poland; Zeszyty Naukowe Uniwersytetu Jagiellońskiego CCLXVIII, Pr. Geogr. Z. 28, Pr. Instyt. Geogr. Z. 50; Wyd. UJ: Kraków, Poland, 1971. (In Polish) [Google Scholar]
- Gottschalk, L. Hydrological regionalization of Sweden. Hydrol. Sci. J. 1985, 30, 65–83. [Google Scholar] [CrossRef] [Green Version]
- Rotnicka, J. Taxonomic Foundations of the Classification of River Regime; the Example of the Catchments of the Odra and Polish Coastal Rivers; Seria Geografia, 40; Wyd. UAM: Poznań, Poland, 1988. (In Polish) [Google Scholar]
- Rotnicka, J. A typology of hydrological periods for use in river regime studies. Quaest. Geogr. 1993, 15/16, 77–95. [Google Scholar]
- Kille, K. Das Verfahren MoMNQ, eine Beitrag zur Berechnung der mittlern langjährigen Grundwasserneubildung mit Hilfe der monatlichen Niederwasserabflüsse; Zeitschrift der Deutschen Geologischen Gesellschaft Band Sonderba: Hannover, Germany, 1970; pp. 89–95. (In German) [Google Scholar]
- Shannon, C.E. A mathematical theory of communication. Bell Syst. Tech. J. 1948, 27, 379–423. [Google Scholar] [CrossRef] [Green Version]
- Wrzesiński, D. Use of entropy in the assessment of uncertainty of river runoff regime in Poland. Acta Geophys. 2016, 64, 1825–1839. [Google Scholar] [CrossRef] [Green Version]
- Wrzesiński, D. Entropy of River Flow in Poland; Bogucki Wyd. Naukowe: Poznań, Poland, 2013. (In Polish) [Google Scholar]
- Wrzesiński, D. Uncertainty of flow regime characteristics of rivers in Europe. Quaest. Geogr. 2013, 32, 49–59. [Google Scholar] [CrossRef] [Green Version]
- Corbus, C.S.; Stanescu, V.A. A new method for the determination of river flow regime stability. In Proceedings of the FRIEND AMHY Annual Seminar, Cosenza, Italy, 15 October 1999. [Google Scholar]
- Corbus, C.S.; Stanescu, V.A. The Stability of the Hydrological Regimes: A Hydroecological Descriptor of River Life. In Proceedings of the Conference on Water Observation and Information System for Decision Support, Ohrid, Macedonia, 25–29 May 2004. [Google Scholar]
- Wishart, D. An algorithm for hierarchical classifications. Biometrics 1969, 25, 165–170. [Google Scholar] [CrossRef]
- Ward, J.H. Hierarchical Grouping to Optimize an Objective Function. J. Am. Stat. Assoc. 1963, 58, 236–244. [Google Scholar] [CrossRef]
- Gutry-Korycka, M.; Rotnicka, J. The hydrological regime of rivers in the light of scenarios of global climatic change. Geogr. Pol. Pap. Glob. Chang. 1998, 71, 61–78. [Google Scholar]
- Faiz, M.A.; Liu, D.; Fu, Q.; Wrzesiński, D.; Muneer, S.; Khan, M.I.; Li, T.; Cui, S. Assessment of precipitation variability and uncertainty of stream flow in the Hindu Kush Himalayan and Karakoram River basins of Pakistan. Meteorol. Atmos. Phys. 2019, 131, 127–136. [Google Scholar] [CrossRef]
- Pociask-Karteczka, J.; Limanówka, D.; Nieckarz, Z. Impact of the North Atlantic Oscillation on hydrological regime in the Polish Carpathians 1951–2000. Folia Geogr. Ser. Geogr. Phys. 2002–2003, 33–34, 89–104. (In Polish) [Google Scholar]
- Danilovich, I.; Wrzesiński, D.; Nekrasova, L. Impact of the North Atlantic Oscillation on river runoff in the Belarus part of the Baltic Sea basin. Nord. Hydrol. 2007, 38, 413–423. [Google Scholar] [CrossRef]
- Wrzesiński, D. Regional differences in the influence of the North Atlantic Oscillation on seasonal river runoff in Poland. Quaest. Geogr. 2011, 30, 127–136. [Google Scholar] [CrossRef] [Green Version]
- Wrzesiński, D.; Paluszkiewicz, R. Spatial differences in the impact of the North Atlantic Oscillation on the flow of rivers in Europe. Hydrol. Res. 2011, 42, 30–39. [Google Scholar] [CrossRef]
Figure 1.
Geographical position of the Vistula River basin in Poland.

Figure 2.
(A)—Diagram of a similarity matrix for an annual set of pentads with the distinguished types of hydrological periods of the Vistula River in gauge Wisła: navy blue dot—similar distribution of discharges, blue dot—probably similar distribution of discharges. (B)—hydrogram of water discharges of specified probability of occurrence, with characteristic discharge and boundaries of average discharge zone: SWQ—average high discharge; SSQ—average medium discharge, SNQ—average low discharge; GGSQ—upper boundary of average discharge zone; DGSQ—lower boundary of average discharge zone. (C)—sequence of hydrological periods in average annual cycle. Types of hydrological periods: 1—deep low-water, 2—average low-water, 3—shallow low-water, 4—normal period, 5—low high-water, 6—average high-water, 7—high high-water, 8—very high high-water.

Figure 3.
Characteristics of the flow regime along the course of the Vistula River mainstream. CV—variability of daily discharges, CS—coefficient of stability of the maximum and minimum monthly flows, Hgr—coefficient of groundwater supply, Emax—entropy of the maximum monthly flows, Emax—entropy of the minimum monthly flows.

Figure 4.
Dendrogram of the Ward’s hierarchical grouping of hydrometric profiles on the Vistula River and its tributaries based on the values of pentadic Pardé’s coefficient (PPC).
Figure 4.
Dendrogram of the Ward’s hierarchical grouping of hydrometric profiles on the Vistula River and its tributaries based on the values of pentadic Pardé’s coefficient (PPC).

Figure 5.
Spatial distribution of rivers in distinguished groups taking as a criterion grouping of monthly flow rates and range of their variability in average annual cycle and range of variability of PPC in the separated groups of gauges.
Figure 5.
Spatial distribution of rivers in distinguished groups taking as a criterion grouping of monthly flow rates and range of their variability in average annual cycle and range of variability of PPC in the separated groups of gauges.

Figure 6.
Coefficients of pentadic flow (PPC) along the course of the Vistula River (A) and its tributaries (B).
Figure 6.
Coefficients of pentadic flow (PPC) along the course of the Vistula River (A) and its tributaries (B).

Figure 7.
Sequence of hydrological periods in average annual cycle in 22 gauges along the Vistula River mainstream. Types of hydrological periods: 1—deep low-water, 2—average low-water, 3—shallow low-water, 4—normal period, 5—low high-water, 6—average high-water, 7—high high-water, 8—very high high-water.

Figure 8.
Sequence of hydrological periods in average annual cycle in 38 gauges on the Vistula River tributaries. Types of hydrological periods: 1—deep low-water, 2—average low-water, 3—shallow low-water, 4—normal period, 5—low high-water, 6—average high-water, 7—high high-water, 8—very high high-water.


Table 1.
Main characteristics of the analyzed rivers in the years 1971–2010.
| River | Gauge | Latitude (° N) | Longitude (° E) | Area (km2) | Annual Runoff Depth (mm) | Coefficient of Variation of Daily Discharges (Cv) | Type of River Regime * |
|---|---|---|---|---|---|---|---|
| Wisła | Wisła | 49.63 | 18.90 | 54 | 807 | 1.66 | 4 |
| Wisła | Ustroń | 49.67 | 18.85 | 108 | 773 | 1.45 | 4 |
| Wisła | Skoczów | 49.80 | 18.78 | 297 | 641 | 1.68 | 4 |
| Wisła | Goczałkowice | 49.92 | 18.98 | 738 | 364 | 1.61 | 4 |
| Wisła | Jawiszowice | 49.97 | 19.12 | 971 | 401 | 1.37 | 4 |
| Wisła | Nowy Bieruń | 50.05 | 19.18 | 1748 | 376 | 1.16 | 4 |
| Wisła | Pustynia | 50.05 | 19.23 | 3912 | 353 | 0.84 | 4 |
| Wisła | Smolice | 50.02 | 19.45 | 6796 | 370 | 1.02 | 4 |
| Wisła | Sierosławice | 50.12 | 20.45 | 8999 | 343 | 0.99 | 4 |
| Wisła | Popędzynka | 50.13 | 20.55 | 10,704 | 340 | 1.00 | 4 |
| Wisła | Jagodniki | 50.20 | 20.68 | 12,058 | 342 | 1.08 | 4 |
| Wisła | Karsy | 50.27 | 20.77 | 19,817 | 341 | 1.06 | 4 |
| Wisła | Szczucin | 50.32 | 21.07 | 23,901 | 312 | 0.98 | 4 |
| Wisła | Sandomierz | 50.67 | 21.75 | 31,846 | 289 | 0.97 | 4 |
| Wisła | Zawichost | 50.80 | 21.85 | 50,732 | 268 | 0.93 | 4 |
| Wisła | Annopol | 50.88 | 21.83 | 51,518 | 267 | 0.91 | 4 |
| Wisła | Dęblin | 51.55 | 21.82 | 68,234 | 232 | 0.77 | 4 |
| Wisła | Warszawa | 52.18 | 21.10 | 84,540 | 215 | 0.70 | 4 |
| Wisła | Kępa Polska | 52.42 | 19.95 | 168,956 | 174 | 0.63 | 2 |
| Wisła | Włocławek | 52.65 | 19.07 | 172,389 | 168 | 0.67 | 2 |
| Wisła | Toruń | 53.00 | 18.60 | 181,033 | 171 | 0.65 | 2 |
| Wisła | Tczew | 54.08 | 18.80 | 194,376 | 170 | 0.58 | 2 |
| Brennica | Górki Wielkie | 49.77 | 18.85 | 82.2 | 763 | 1.90 | 4 |
| Iłownica | Czechowice-Dziedzice | 49.90 | 18.98 | 194 | 497 | 1.99 | 4 |
| Biała | Czechowice-Bestwina | 49.88 | 19.02 | 118 | 848 | 1.68 | 4 |
| Pszczynka | Pszczyna | 49.97 | 18.93 | 185 | 247 | 1.49 | 4 |
| Gostynia | Bojszowy | 50.05 | 19.10 | 331 | 325 | 0.81 | 1 |
| Przemsza | Jeleń | 50.15 | 19.23 | 1996 | 295 | 0.33 | 4 |
| Soła | Oświęcim | 50.03 | 19.22 | 1386 | 465 | 1.75 | 4 |
| Skawa | Zator | 49.98 | 19.43 | 1154 | 454 | 1.47 | 4 |
| Skawinka | Radziszów | 49.93 | 19.80 | 317 | 305 | 2.49 | 4 |
| Rudawa | Balice | 50.08 | 19.80 | 290 | 245 | 0.70 | 1 |
| Prądnik | Ojców | 50.18 | 19.83 | 67.5 | 202 | 0.51 | 4 |
| Raba | Proszówki | 49.98 | 20.43 | 1470 | 357 | 1.91 | 4 |
| Szreniawa | Biskupice | 50.17 | 20.50 | 682 | 147 | 1.17 | 4 |
| Uszwica | Borzęcin | 50.07 | 20.70 | 265 | 319 | 3.02 | 5 |
| Nidzica | Dobiesławice | 50.22 | 20.58 | 643 | 110 | 0.70 | 4 |
| Dunajec | Żabno | 50.12 | 20.85 | 6735 | 412 | 1.25 | 5 |
| Nida | Pińczów | 50.50 | 20.52 | 3352 | 173 | 0.96 | 2 |
| Czarna | Połaniec | 50.43 | 21.28 | 1354 | 154 | 1.62 | 3 |
| Wisłoka | Łabuzie | 49.98 | 21.30 | 2546 | 350 | 1.56 | 4 |
| Koprzywianka | Koprzywnica | 50.58 | 21.57 | 502 | 131 | 1.76 | 3 |
| San | Radomyśl | 50.67 | 21.93 | 16,824 | 246 | 0.95 | 4 |
| Kamienna | Czekarzewice | 51.03 | 21.67 | 1878 | 140 | 0.82 | 2 |
| Wieprz | Kośmin | 51.57 | 22.00 | 10,231 | 113 | 0.72 | 2 |
| Radomka | Rogożek | 51.63 | 21.35 | 2060 | 129 | 0.99 | 2 |
| Okrzejka | Mika | 51.67 | 21.75 | 300 | 159 | 1.77 | 3 |
| Pilica | Białobrzegi | 51.65 | 20.95 | 8664 | 163 | 0.70 | 2 |
| Świder | Wólka Mlądzka | 52.13 | 21.32 | 845 | 159 | 1.31 | 3 |
| Narew | Zambski Kościelne | 52.75 | 21.20 | 27,784 | 158 | 0.64 | 2 |
| Bug | Wyszków | 52.58 | 21.45 | 39,119 | 124 | 0.88 | 3 |
| Wkra | Trzciniec | 52.92 | 20.17 | 1928 | 168 | 0.75 | 2 |
| Bzura | Sochaczew | 52.22 | 20.23 | 6281 | 115 | 1.07 | 3 |
| Skrwa (right) | Parzeń | 52.65 | 19.53 | 1534 | 128 | 1.23 | 3 |
| Tążyna | Otłoczynek | 52.88 | 18.68 | 417 | 59 | 1.65 | 3 |
| Drwęca | Elgiszewo | 53.05 | 18.92 | 4959 | 180 | 0.46 | 2 |
| Brda | Smukała | 53.18 | 17.95 | 4414 | 192 | 0.35 | 1 |
| Wda | Krąplewice | 53.48 | 18.38 | 2022 | 182 | 0.35 | 1 |
| Osa | Rogoźno 2 | 53.50 | 18.95 | 1135 | 126 | 0.88 | 2 |
| Wierzyca | Brody Pom. | 53.85 | 18.75 | 1544 | 178 | 0.51 | 2 |
* Type of river regime: 1—nival poorly formed; 2—nival moderately formed; 3—nival well-formed; —nival-pluvial; 5—pluvial-nival.
© 2020 by the authors. Licensee MDPI, Basel, Switzerland. This article is an open access article distributed under the terms and conditions of the Creative Commons Attribution (CC BY) license (http://creativecommons.org/licenses/by/4.0/).
Share and Cite
MDPI and ACS Style
Wrzesiński, D.; Sobkowiak, L. Transformation of the Flow Regime of a Large Allochthonous River in Central Europe—An Example of the Vistula River in Poland. Water 2020, 12, 507. https://doi.org/10.3390/w12020507
AMA Style
Wrzesiński D, Sobkowiak L. Transformation of the Flow Regime of a Large Allochthonous River in Central Europe—An Example of the Vistula River in Poland. Water. 2020; 12(2):507. https://doi.org/10.3390/w12020507
Chicago/Turabian StyleWrzesiński, Dariusz, and Leszek Sobkowiak. 2020. "Transformation of the Flow Regime of a Large Allochthonous River in Central Europe—An Example of the Vistula River in Poland" Water 12, no. 2: 507. https://doi.org/10.3390/w12020507
Note that from the first issue of 2016, this journal uses article numbers instead of page numbers. See further details here.