Delineation of Seawater Intrusion Using Geo-Electrical Survey in a Coastal Aquifer of Kamala Beach, Phuket, Thailand


1
Faculty of Technology and Environment, Prince of Songkla University, Phuket Campus, Phuket 83120, Thailand
2
Andaman Environment and Natural Disaster Research Center, Prince of Songkla University, Phuket Campus, Phuket 83120, Thailand
*
Author to whom correspondence should be addressed.
Water 2020, 12(2), 506; https://doi.org/10.3390/w12020506
Submission received: 30 December 2019
/
Revised: 6 February 2020
/
Accepted: 8 February 2020
/
Published: 12 February 2020
(This article belongs to the Special Issue Applied Geophysics in Hydrogeological Practice)
Abstract
:The coastal areas of Phuket Island are facing the risk of seawater intrusion, because intense anthropic activity due to urbanization and the expansion of tourism influences coastal hydrologic systems. Indeed, the Kamala sub-district—on the western part of Phuket Island—is a well-known and attractive destination for tourists. Previous research indicates that there is likely to be a seawater intrusion in Kamala. The main purpose of this study was to delineate the seawater intrusion problem in a coastal aquifer in Kamala. Geo-electrical surveys of four lines were successfully conducted in the study area. Two-dimensional (2D) inversion models from the resistivity data show high-resolution subsurface resistivity anomalies of seawater intrusion. The concentration of the seawater intrusion decreases eastward toward the inland areas. Based on a sample measurement, the contaminated zone of seawater has a resistivity value smaller than 30 Ohm-m, and the empirical relationship between the formation conductivity and fluid conductivity of the study area was established. Finally, time-lapse Electrical Resistivity Imaging (time-lapse ERI) was conducted to prove that there was no presence of clay layers in study area; thus, the low resistivity plumes (smaller than 30 Ohm-m) were scientifically interpreted as being seawater intrusion.
1. Introduction
Seawater intrusion is the most common problem in coastal areas. During the last decade, Phuket Island (Thailand) has experienced extensive urbanization and an associated shift away from a largely agricultural economy to one governed by the growth of tourism. Indeed, Phuket Island is considered one of the most attractive destinations for tourists in Thailand, with a growth rate of approximately 100,000 visitors/year [1]. Water demands in the Phuket area have therefore greatly increased, due to the rapid increase of the population and tourists, alongside the consequent economic growth. The main water resource in Phuket is groundwater, which accounts for 68% of the water used on the island [2]. The over-exploitation of available groundwater can cause a landward migration of groundwater pollution due to the intrusion of seawater. The balance between fresh water in the aquifer and seawater intruding from the Andaman Sea has probably been altered due to the over-pumping of groundwater to satisfy the rapid increase in water demand to support tourism in the past decade. Puttiwongrak et al. [3] indicated that the average groundwater level in Kathu District—including the Kamala, Patong, and Kathu sub-districts—gradually rose due to the increment of groundwater recharge, predictably caused by several factors, including high precipitation rates and aquifer types, as well as seawater intrusion caused by Andaman sea level rise—even though there was a high extraction rate of groundwater.
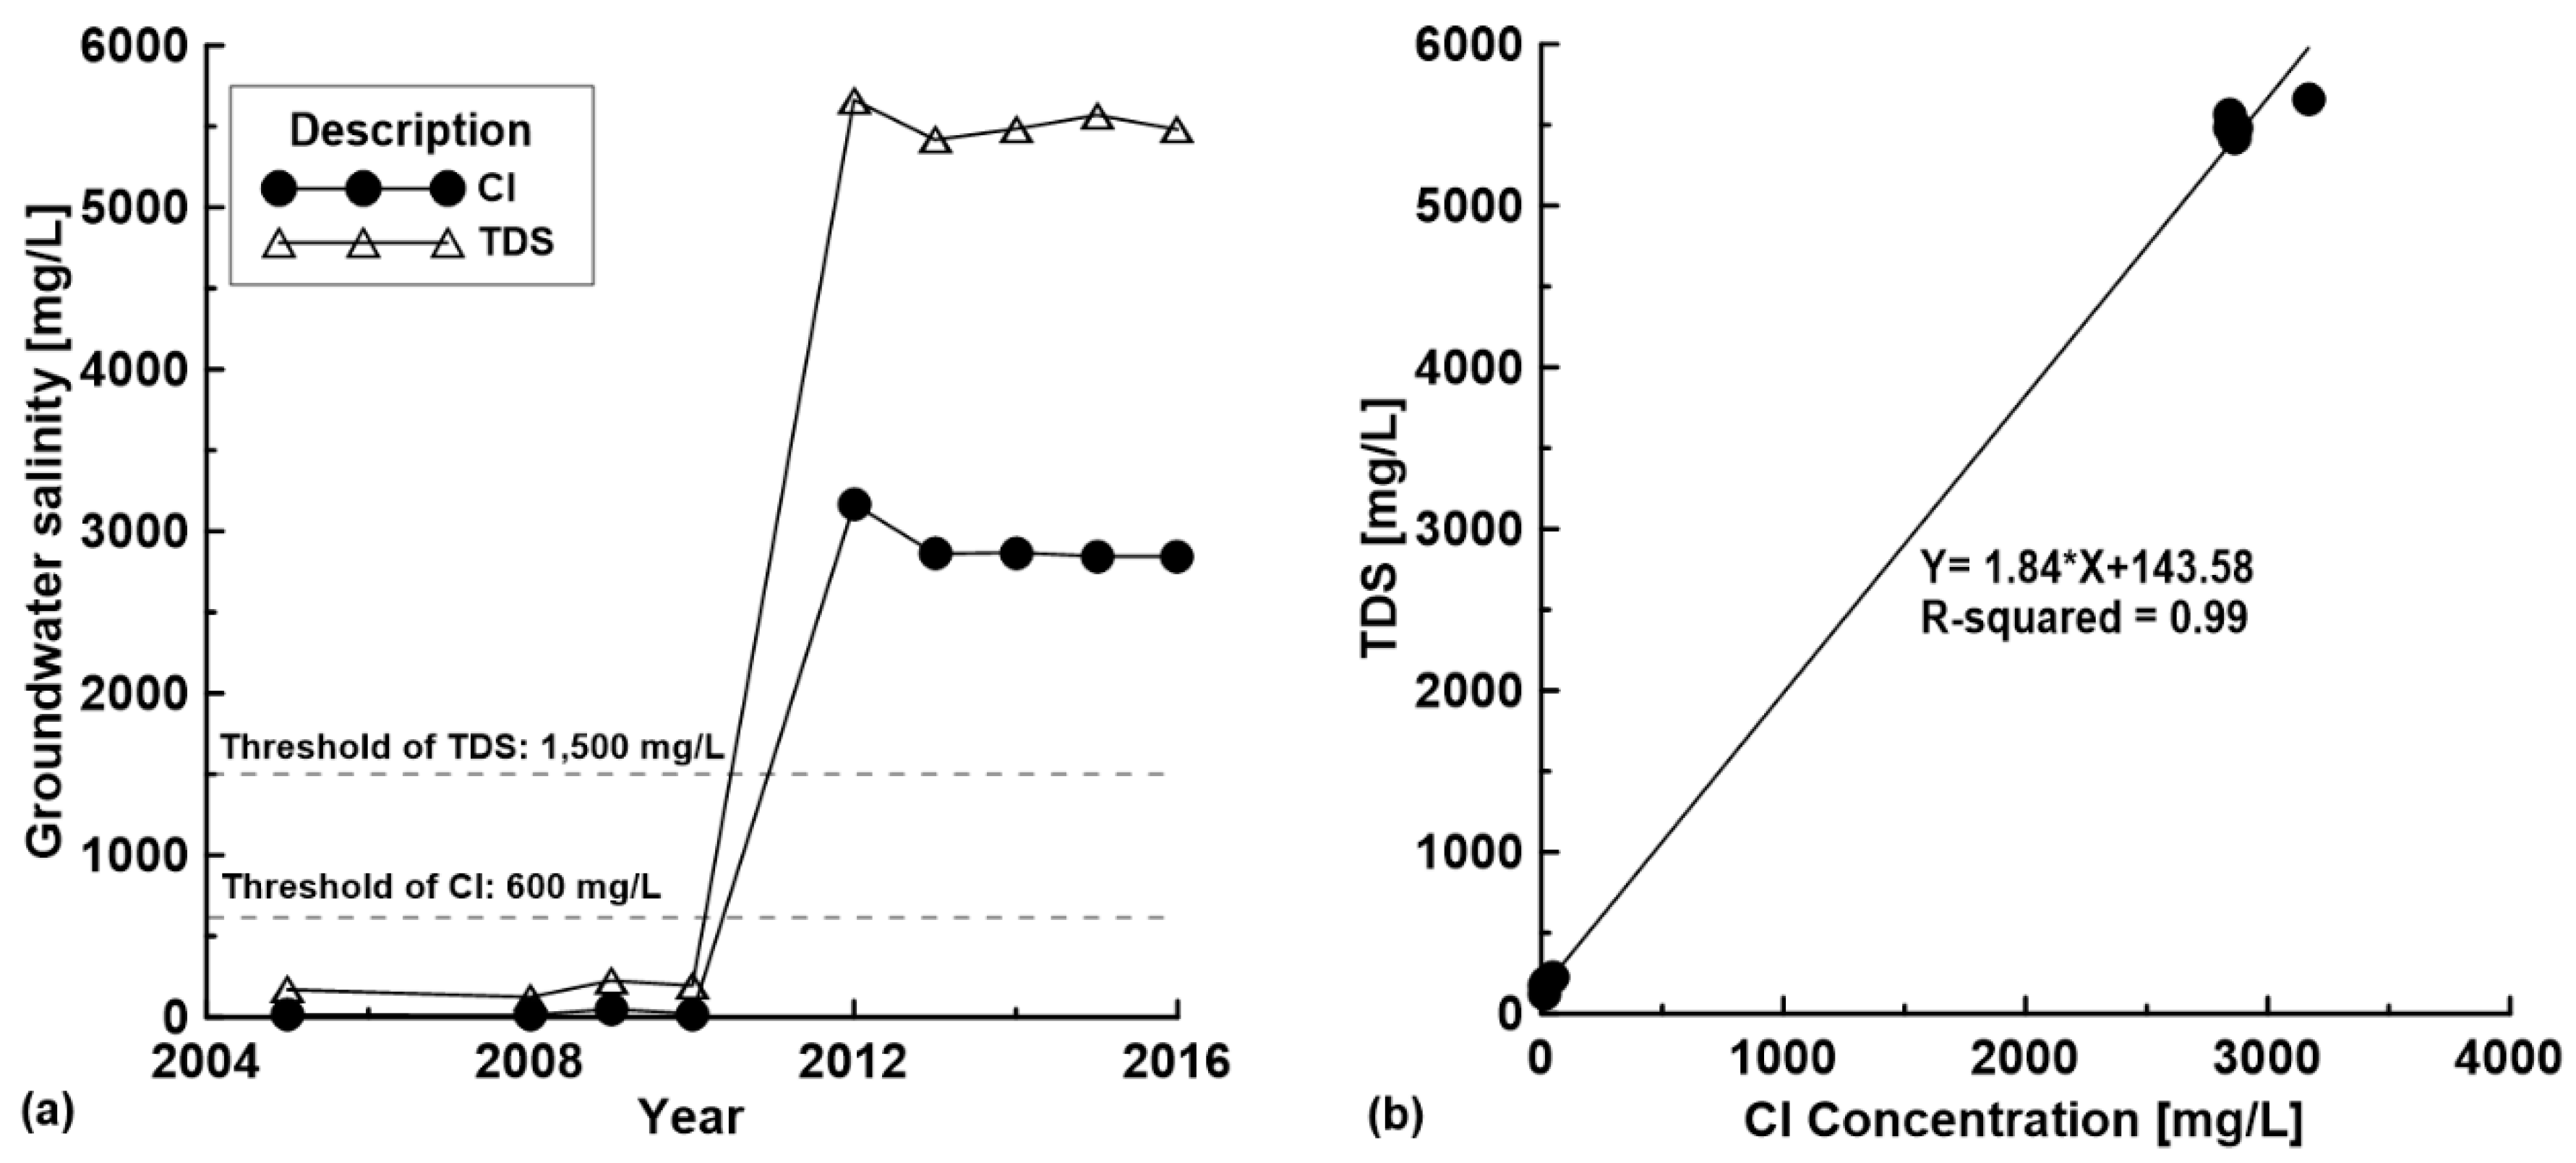
The groundwater generally grades into the saline water with a steady increase in the content of total dissolved solids (TDS) [4]. However, when seawater intrusion is associated with high salinity groundwater, analysis of the groundwater generally indicates a high concentration of major anions, i.e., chlorides (Cl), as well as a high TDS content [5]. Puttiwongrak et al. [6] performed geochemistry data analyses to investigate seawater intrusion in the Kamala coastal area. Their research found that both TDS and Cl were higher than the water quality standard, and the correlation between TDS and Cl were high in this area, as shown in Figure 1. Furthermore, the electrical conductivity (the inverse of electrical resistivity) is controlled by the concentration of TDS [7], and resistivity is generally used as an indicator of seawater contamination as resistivity anomalies (i.e., low resistivities) generally indicate a seawater intrusion problem [8]. However, since groundwater chemistry analysis of hydrogeological and pollution research is expensive, labor-intensive, and time-consuming [9], electrical resistivity imaging (ERI), accompanied by limited groundwater chemistry data are increasingly being used as an effective tool because they are a non-destructive and efficient method for characterizing the subsurface, especially for quantitative and qualitative assessments of subsurface problems [10]. Sherif et al. [7] applied geoelectrical and hydrogeochemical studies to delineate seawater intrusion in the outlet of Wadi Ham, UAE. The authors successfully determined the present of brackish and saline water zones with resistivity values ranging from 1 to 30 Ohm-m in their study area. Similarly, Kura et al. [9] conducted ERI to study effect of pumping on seawater intrusion in the coastal area near the pumping wells of Kapas Island, Malaysia. Their result showed the seawater intrusion from the sea coming towards the pumping well with resistivity values ranging between 10 and 25 Ohm-m. The researchers categorized the groundwater situation in their research area into three types based on the resistivity values: (1) seawater intrusion (1–10 Ohm-m), (2) dilution of saltwater (approximately Ohm-m), and (3) freshwater (50–100 Ohm-m). ERI and groundwater chemistry analyses were employed by Eissa et al. [10] to investigate seawater intrusion in Bagoush area, Northwestern coast, Egypt. Their study confirmed that the brackish water zone varied from 7.0 Ohm-m to 15.0 Ohm-m while saline water plumes were determined with resistivity values from 3.0 Ohm-m to 7.0 Ohm-m.
In recent years, several studies have been conducted around the world to elucidate the spatial distribution of seawater intrusions, and to delineate the areas characterized by the presence of seawater, and how that influences groundwater resistivity values. Moreover, strategies have been implemented to control the salinization of groundwater [4,5,8,9,10,11]. For example, Costall et al. [12] researched and proposed a comprehensive study of ERI along coastal margins, which was validated with substantial evidence from seawater monitoring wells. Goebel et al. [13] used ERT data to characterize the spatial distribution of freshwater and saltwater along the coastal region and revealed the ways in which ERI can provide key information about what influences seawater intrusion. Similarly, Gemail et al. [14] demonstrated the combination of 1D, 2D, and 3D resistivity measurements of seawater intrusion distribution for illustrating the correlation with subsurface geological information available from shallow boreholes. Furthermore, a combined methodology for the validation of both the geo-electrical interpretation of geophysical investigations and groundwater flow modeling was successfully studied by Beaujean et al. [15] and Conmte and Banton [16]. While Hermans et al. [17] used electromagnetic induction borehole logging data to constrain the geostatistical regularization of the 2D-surface, using ERI and the time lapse-ERI of the seawater dynamic investigation in coastal aquifers and for detecting the relationships between contamination and the environmental parameters controlling the intrusion occurrence was first proposed by Franco et al. [18].
In this study, geo-electrical surveys were conducted to identify and confirm that Kamala has been encountered a seawater intrusion problem. Two-dimension ERI (2D ERI) was conducted to delineate the zone of seawater intrusion, while time-lapse ERI models were generated to present the clay layer and seasonal effect on seawater intrusion. The resistivity range used for interpreting the seawater-contaminated zone in this study was estimated using a soil sample measurement taken in the laboratory. Two relationships—between (1) formation resistivity and TDS, and between (2) the formation and fluid conductivities—were used to obtain empirical models in the study area.
2. Methodology
2.1. Site Description
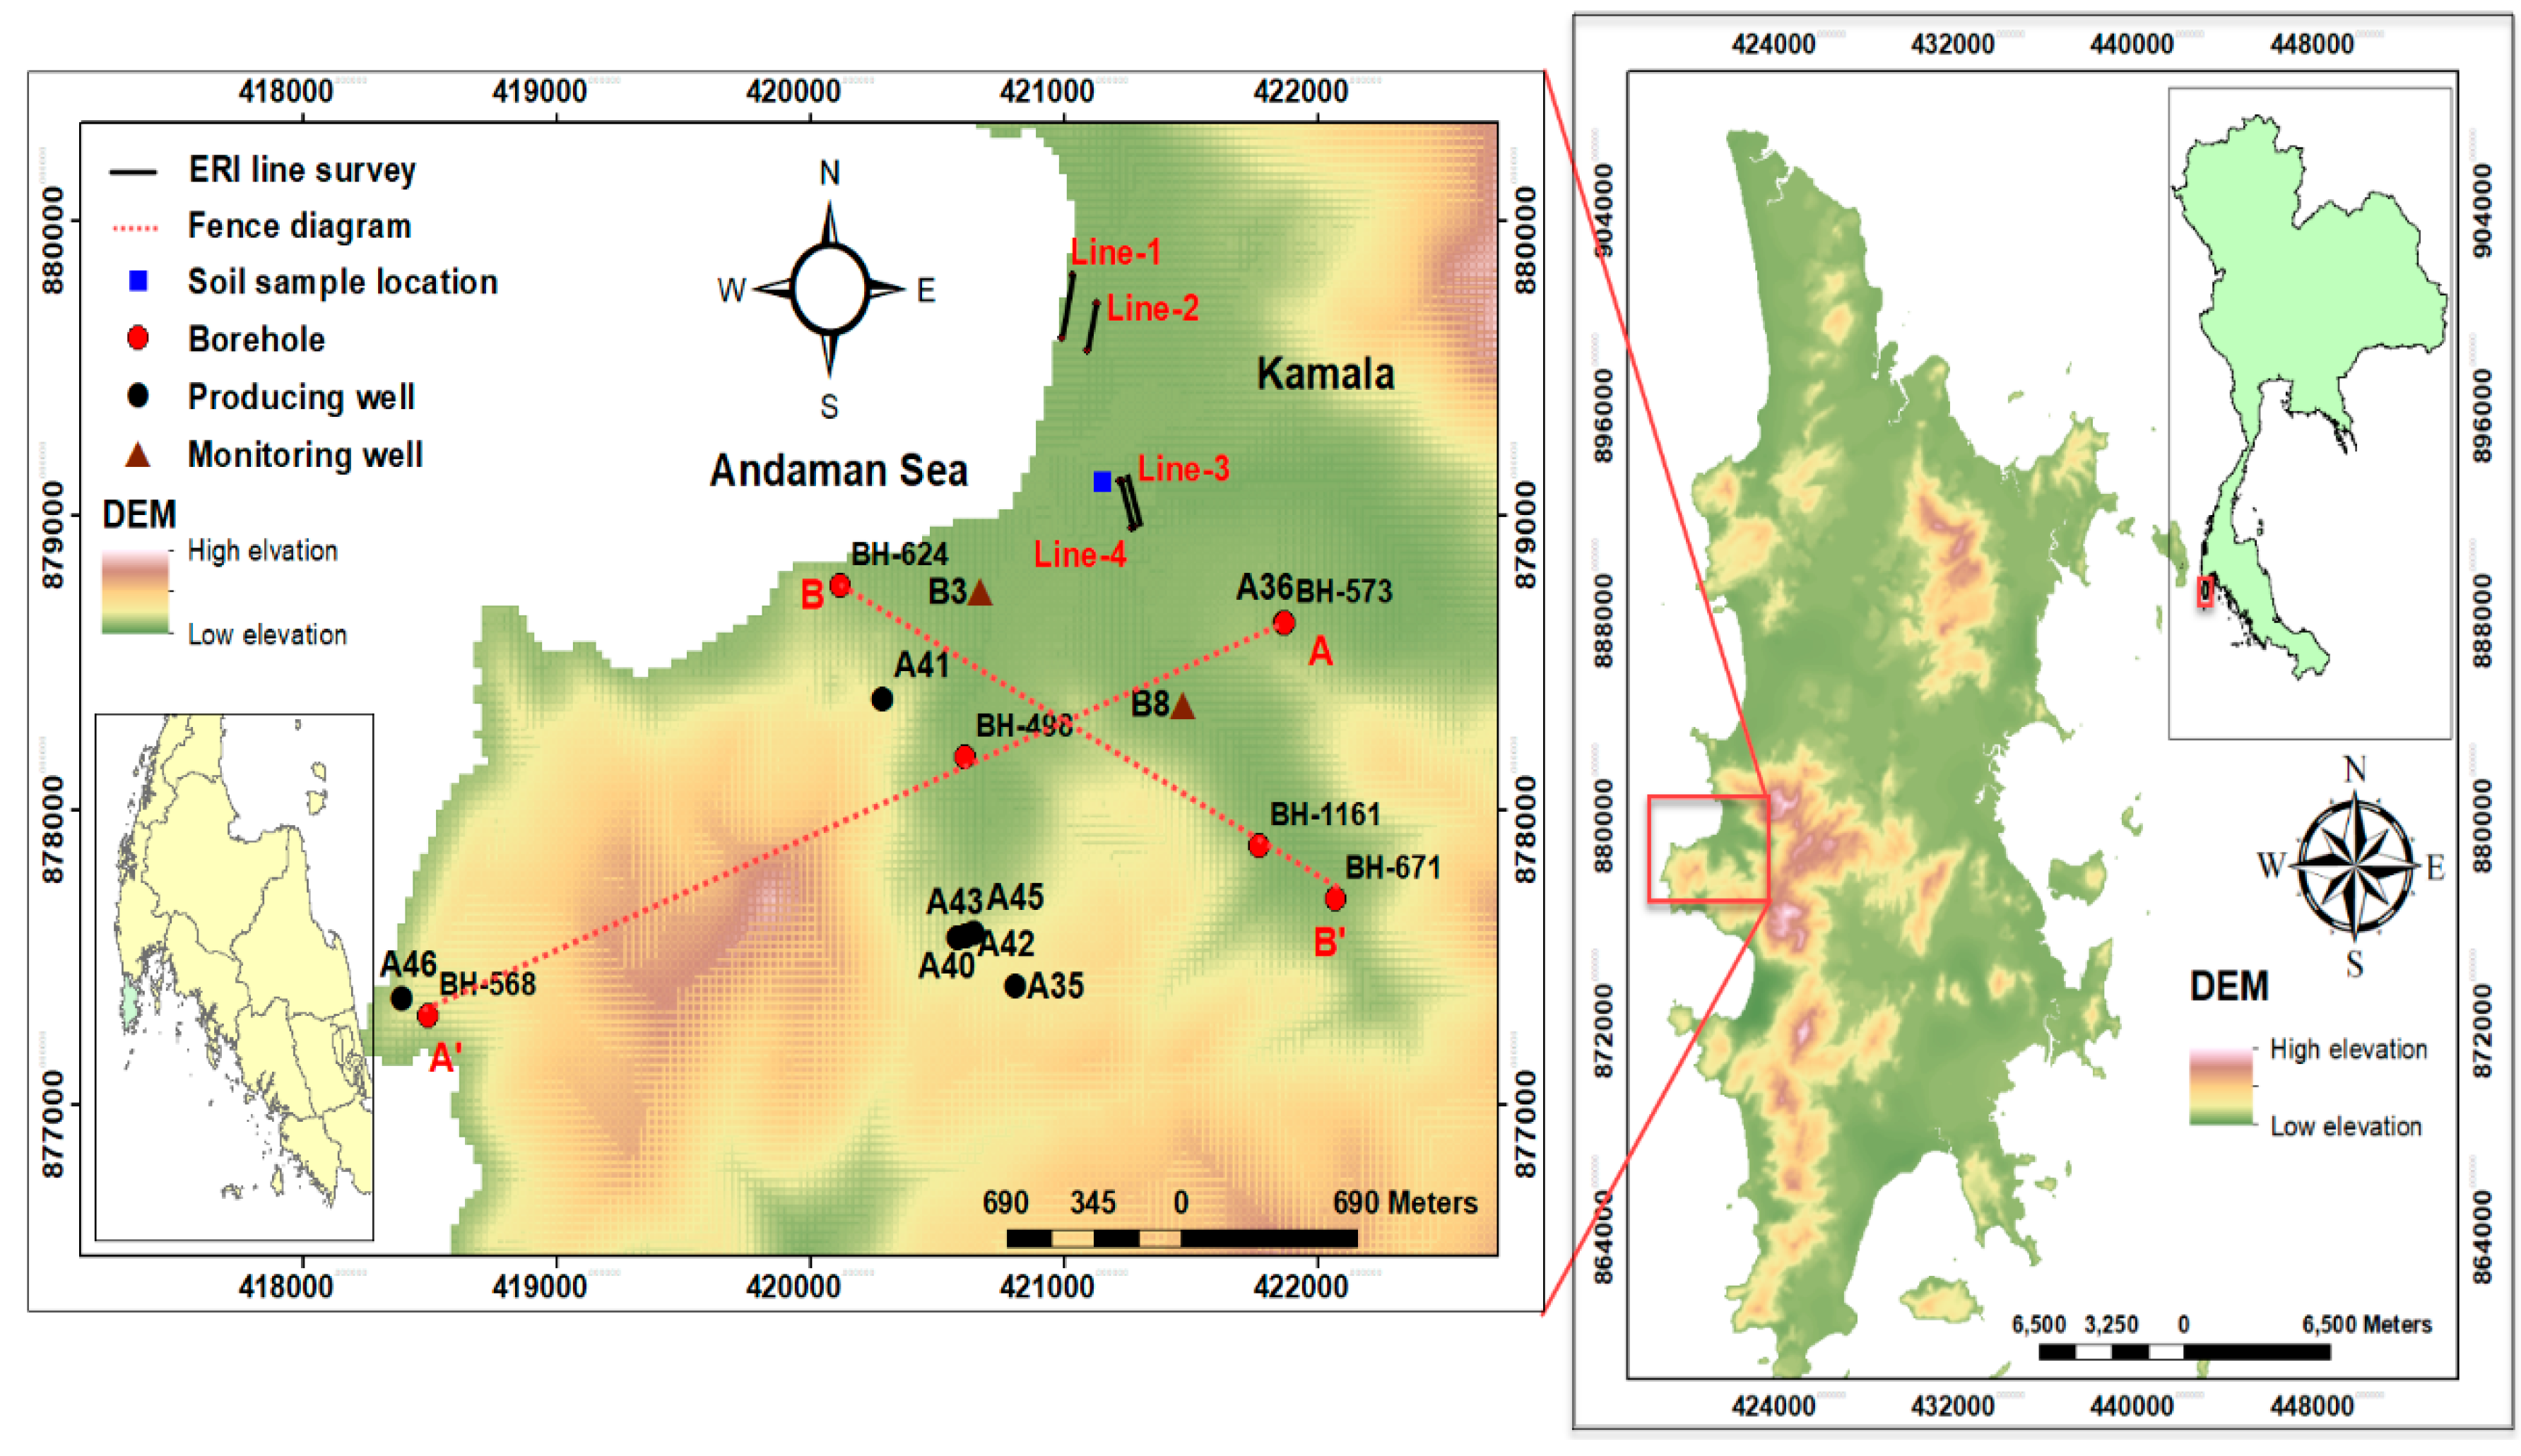
The study area was in the Kamala sub-district, Kathu district, which is on the western coast of Phuket Island located at 7°57′07.3″ N and 98°17′10.5″ E as shown in Figure 2, which is about 695 km from Bangkok, the capital of Thailand. This area is representative of the areas with the most tourism-related developments and intensive anthropologic activities, with most of the surrounding areas being built-up for tourism, which favors a heavy seawater intrusion. Most of the drinking water is supplied by groundwater wells, and local people have complained that some wells have experienced an increase in groundwater salinity and other effects of seawater intrusion, e.g., material corrosion, water turbidity, etc. Fourteen registered groundwater wells have been installed in the study area (Figure 2); of which twelve are producing wells (A35–A46), and two are monitoring wells (B3 and B8). Among the producing and monitoring wells, B3—situating at coordinates UTM (420,666, 878,738)—has been observed to be invaded by seawater. The Cl concentration and TDS found in groundwater from this well were approximately 6000 mg/L and 11,000 mg/L respectively in 2016 [6].
2.1.1. Geological Setting
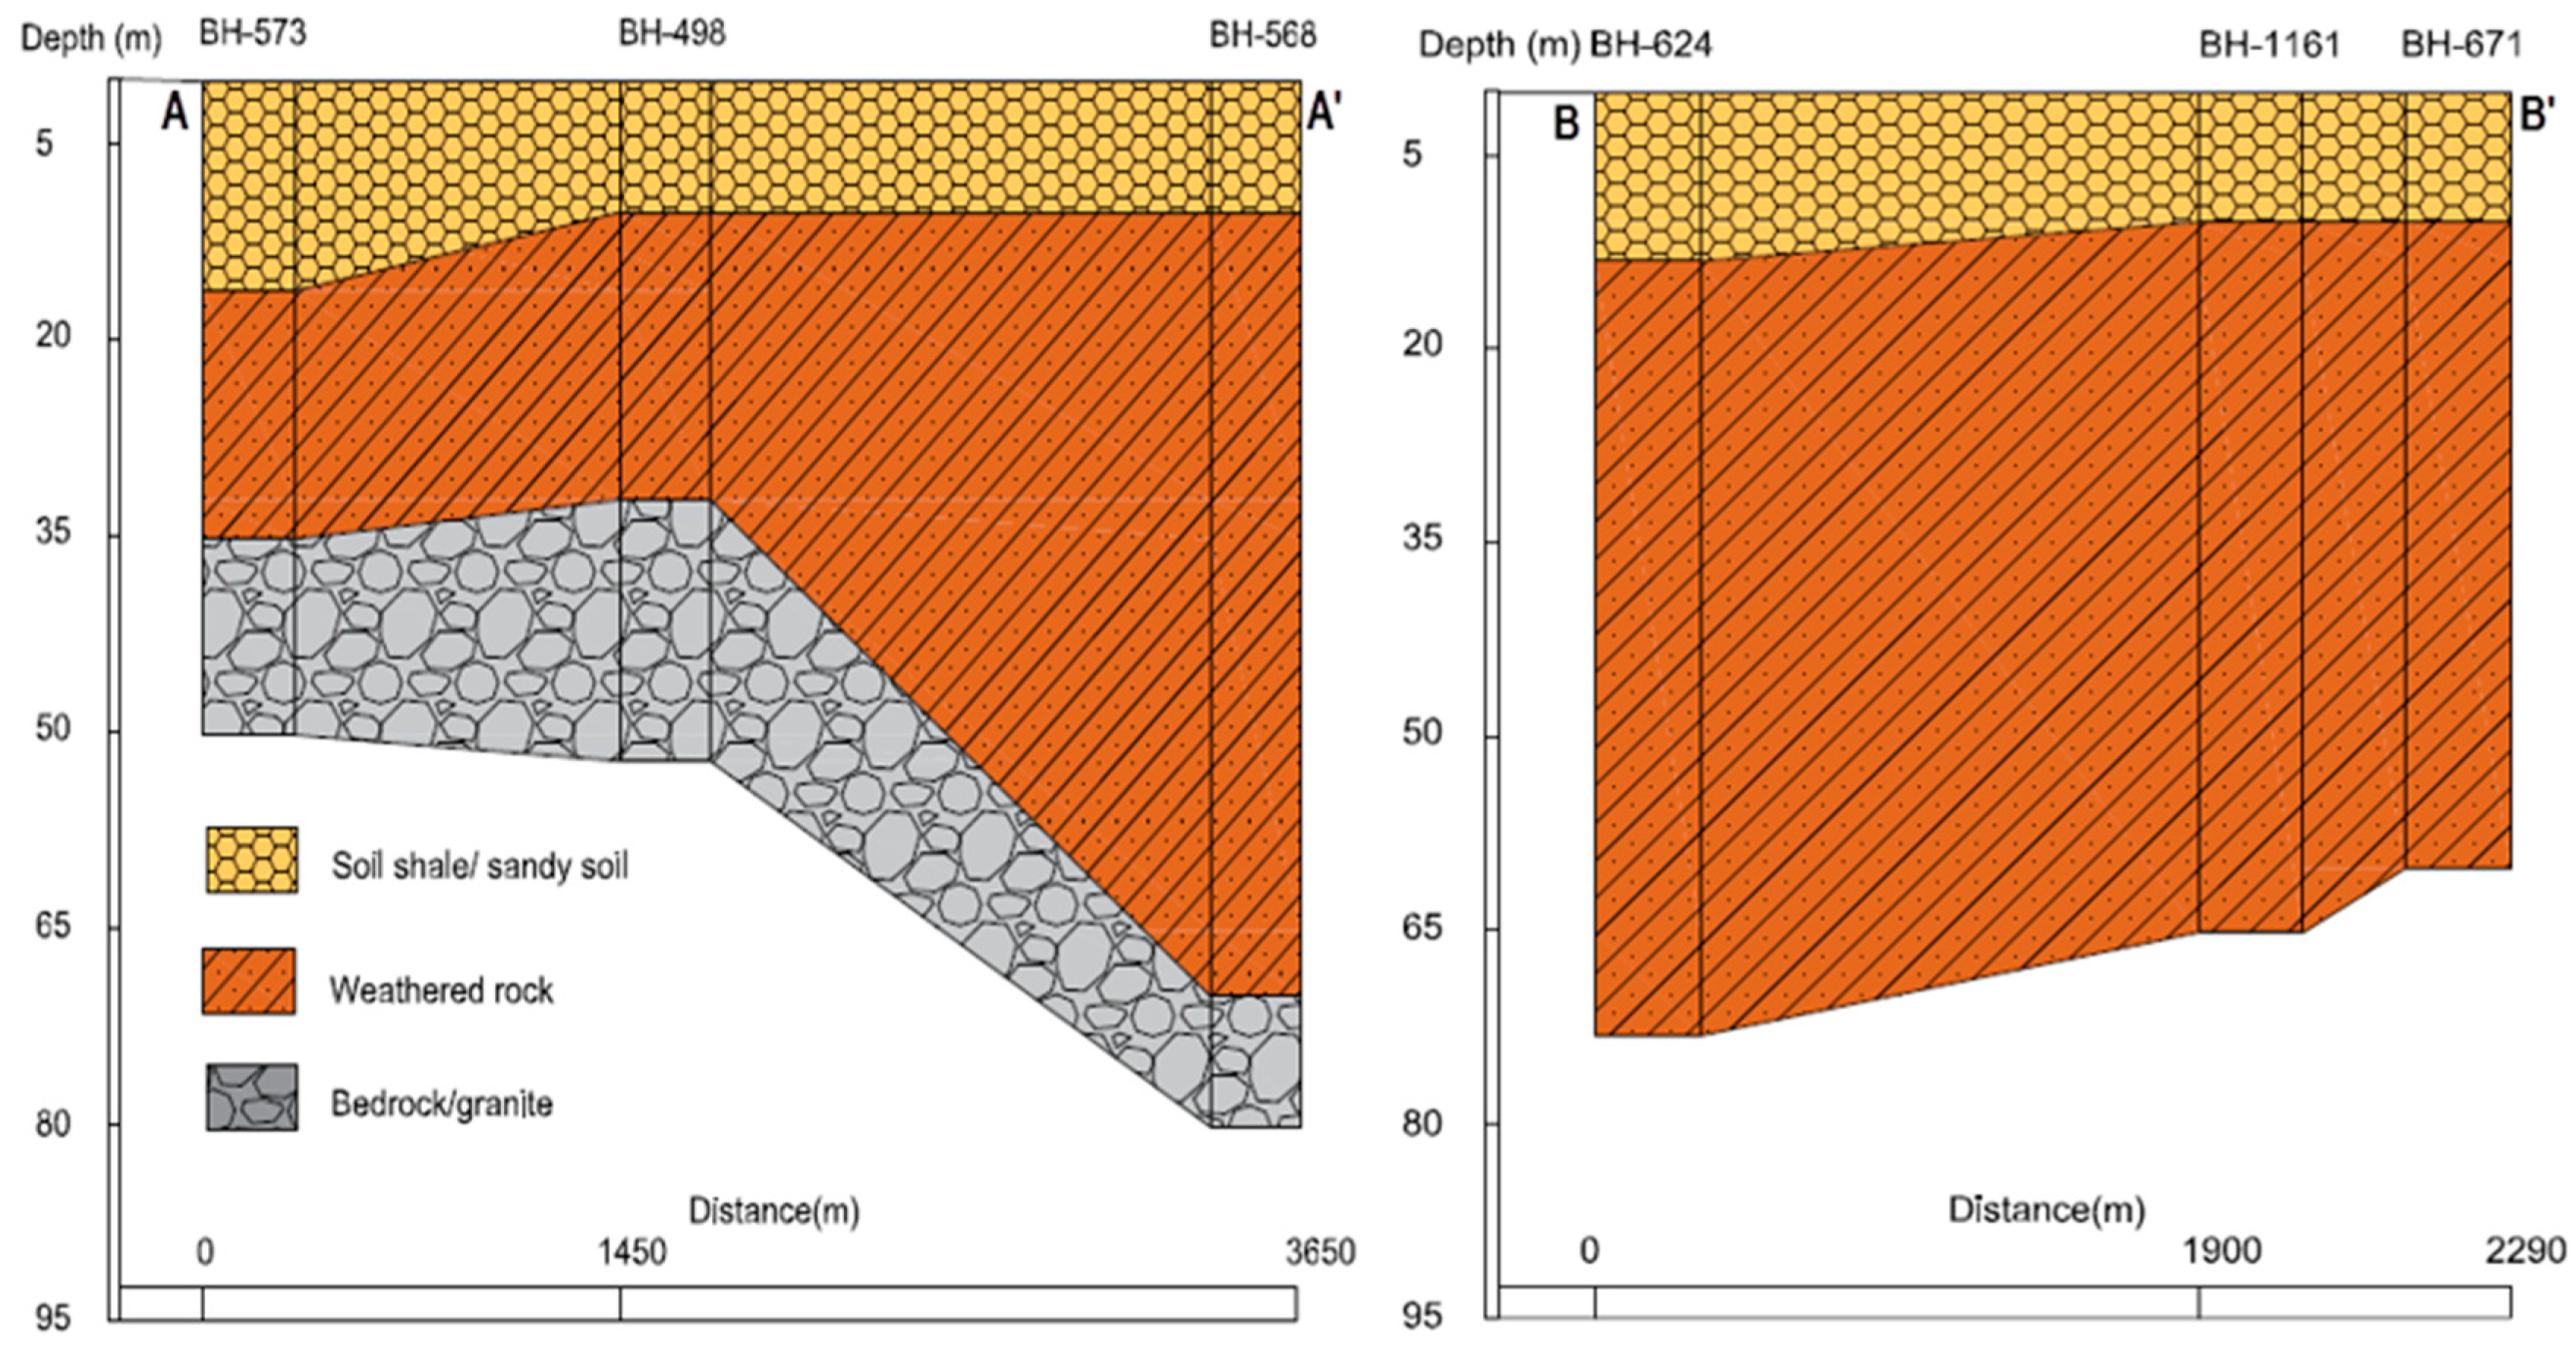
The lithology of the study area consists of three main layers. The top layer is composed of fine-grained sediments (sand and sandy soil) approximately 20 m thick overlying a weathered rock layer, which extends to a thickness of nearly 70 m, with most of the bedrock being granite (Figure 3). Phuket is located in the Andaman Sea, on the western peninsular of Thailand. The geological setting of the Kamala sub-district is Phuket, which is the largest island in Thailand with an area of approximately 543 km2, and most (around 70%) of that area is covered by mountains stretching from north to south with a maximum elevation of 529 meters above sea level (masl). The remaining 30% is flat plain areas located mainly in the middle and eastern parts of the island. Geographically, there are no main rivers, but there are nine brooks and creeks. The west coast has stretches of mountain and white sandy beaches.
The eastern part is dominated by muddy soil and mangrove forests. The total forest area is around 307.9 km2, and—between 2007 and 2009—the area consisted of nine forests and seven mangrove forests.
Geologically, the island is basically composed of igneous rock (granite and granodiorite) in the west, and of sedimentary rock (mudstone and conglomerate) in the center. The geology of Phuket was naturally formed by tectonic activity in its setting in the southern part of Thailand, and there is a major fold with intrusive granite in the north-south direction. In fact, Phuket Island has both a fold produced by granite intrusion in the Cretaceous age and a fault caused by the convergent boundary of a tectonic plate, creating a subduction zone in the Andaman region. Quaternary sediments in this area have accumulated unexpected geomorphology variations in the recent neo-tectonic age [19].
2.1.2. Hydrogeology
Rainfall is the main source of fresh water supply in the area, with a high rainfall intensity and average annual precipitation of 2500 mm [20]. Phuket is affected by both the southwest and northeast monsoons. Rainfall is highest during the rainy season from April to November, while the summer lasts from December to March. The average air temperature is 29 °C, with it being hottest in April and coolest in December [20]. The aquifer is classified as an unconfined aquifer formed from two layers consisting of fine-grain sediments (clayey sand and soil) and weathered rock. Based on the producing wells distributed in the Kamala sub-district, the average depth of groundwater is 12 m below ground level (approximately −3 masl). The highest groundwater potential is located in Tepkrasattri sub-district, Thalang district, on the northeastern part of Phuket Island.
The groundwater pumping rate in Phuket remained steady at just over 1000 m3/day from 2006 to 2012, followed by a significant rise to approximately 55,000 m3/day in 2016, and the increasing trend is continuing. It is evident that the average groundwater consumption on Phuket Island shows an increasing trend from 2006 to 2016. However, the level of groundwater in Phuket gradually decreased during the period 2006–2009, then remained constant from 2009 to 2011, before steeply increasing up to the present. That the Phuket groundwater level increased despite the high extraction rate probably implies seawater intrusion. A rise in sea level caused by global warming might be the root cause of seawater intruding into the freshwater aquifers, and the Andaman Sea has gradually risen between 1992 and 2016 at a rate of around 4.2 mm/year [21]. A rise in sea level could also lift the entire aquifer, and this lifting would help alleviate the overall long-term impacts of seawater intrusion [22,23].
2.2. Resistivity Threshold Determination for Seawater Intrusion
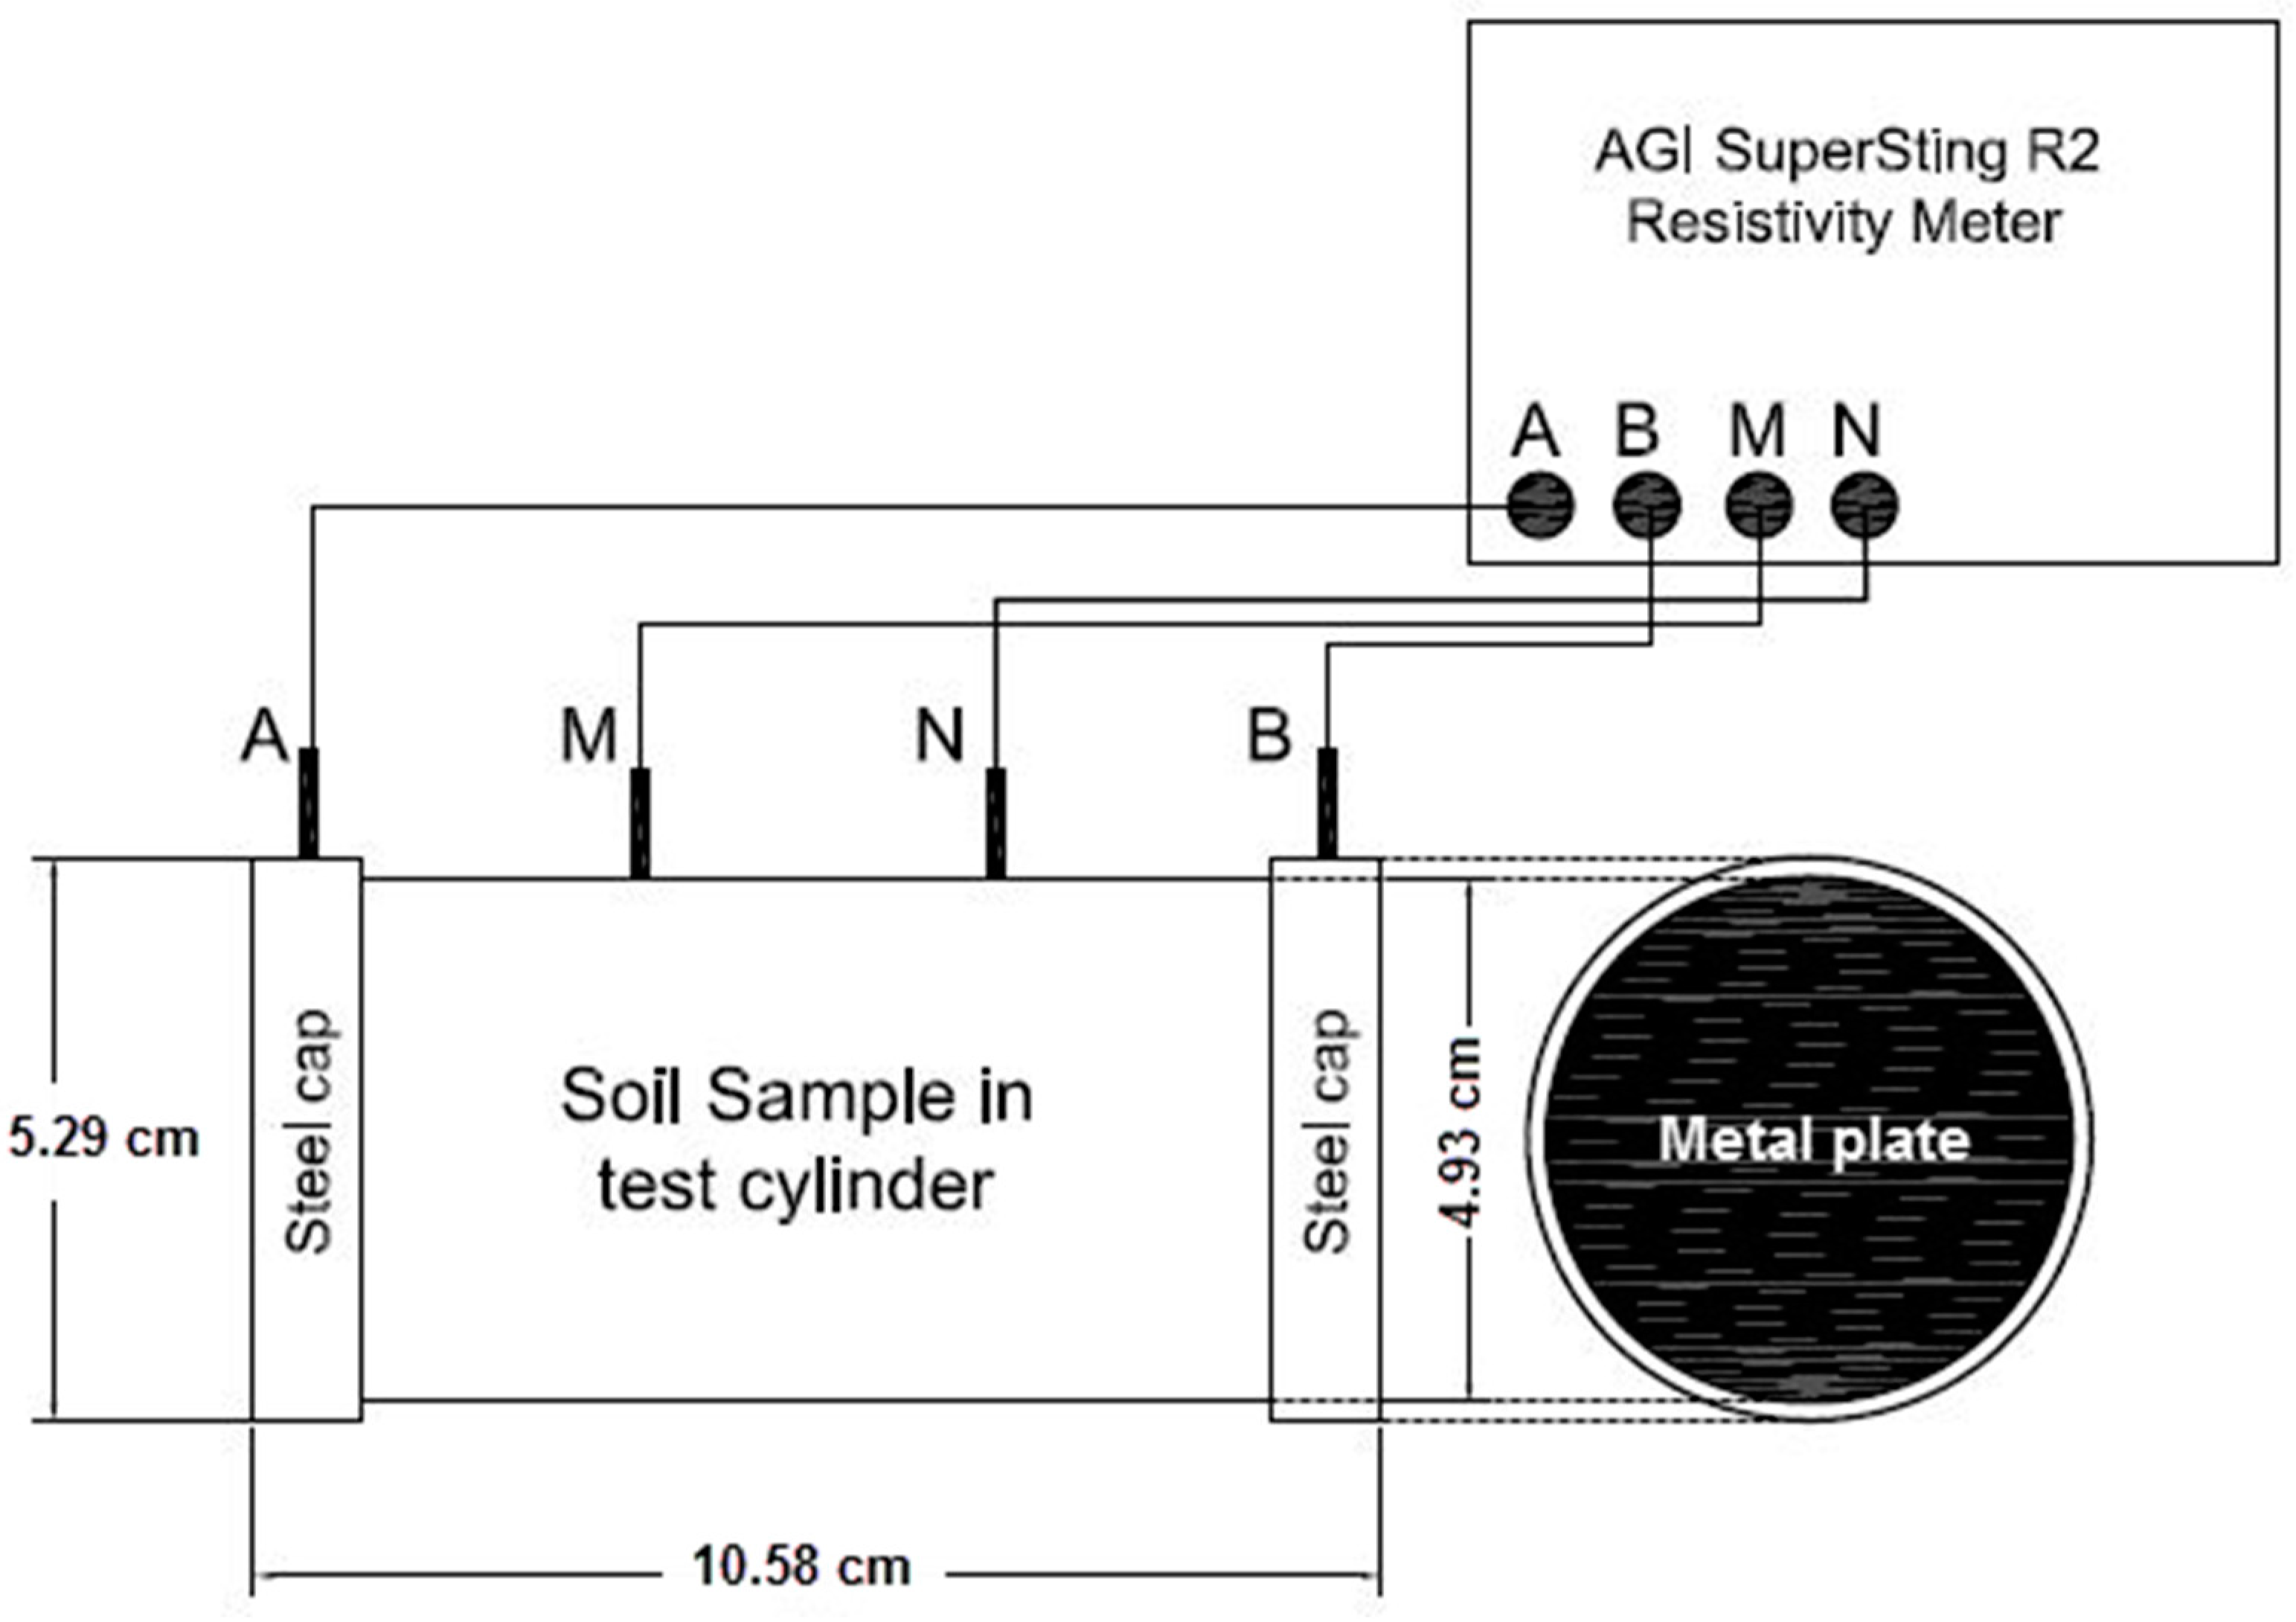
The resistivity value representing seawater intrusion has no universal standard number, because it varies based on the geological setting of those study areas. Therefore, the determination of the resistivity threshold to be used for an interpretation of seawater intrusion is first needed before the Geo-electrical surveys are conducted. A beach sand sample, as shown on the map in Figure 2, was collected at a 3 m depth from the study area using a hand auger. The sample was brought to the laboratory in order to conduct the experiments of the formation resistivity measurement.
In the laboratory, the samples were separated into 11 samples with a volume of 232 cm3 each. The samples were measured to determine the initial resistivity condition via formation resistivity testing [24], as shown in Figure 4; then, the samples were combined with the artificial seawater intrusion of the volume of 250 mL in order to measure the different formation resistivities influenced by the seawater intrusion.
The artificial seawater intrusion was made up of Andaman seawater and tap water, with different proportions of the Andaman sea by volume (4%, 6%, 8%, 10%, 20%, 40%, 50%, 75%, and 100%). Furthermore, the fluid electrical conductivity and TDS of each artificial seawater intrusion was measured using a HANNA HI 9813-6 portable meter in order to determine the fluid resistivity . Based on several studies [4,5,8,9,10,11], resistivity decreases when a formation is combined with seawater. Likewise, the correlation between the formation and fluid conductivities was evaluated. Finally, the formation factor of the geological material in the study area would also be defined by the above information.
2.3. Geo-Electrical Surveys
2.3.1. 2D ERI
Groundwater and both its physical and chemical properties influence the electrical current flowing in the subsurface. In general, subsurface formations are formed of resistive materials [11]. Resistivity is commonly reduced by the salinization of groundwater. Four ERI lines (Line-1, Line-2, Line-3 and Line-4) were conducted near Kamala Beach in the western part of Phuket Island as shown in Figure 2. The field measurements from these resistivity surveys were implemented with an AGI SuperSting R2 resistivity meter with a multi-electrode system of 56 electrode channels. The ERI survey lines were positioned to delineate both the depth and extent of the seawater intrusion zones. The ERI data measured was based on four survey lines. Two survey lines (Line-1 and Line-2) were set up from north to south, parallel to the Andaman Sea, while Line-3 and Line-4 ran in the east-west direction, perpendicular to the shoreline. The electrode array on the two parallel lines was a dipole–dipole array with an electrode spacing of 4 and 3 m for Line-1 and Line-2, respectively. Line-1 was laid on the beach and was about 220 m long, and the investigation depth in this line reached 50 m; Line-2 was located inland, was 165 m long and reached an investigation depth of about 40 m. The different lengths and spacing between Line-1 and Line-2 was because of the space availability and the desired depth of data penetration. Although dipole–dipole arrays are known to produce a low signal to noise ratio, they are an effective configuration for interpreting complex structures and dispersion plume anomalies, because they provide high-resolution data [25]. Consequently, Line-1 and Line-2 were necessary for identifying the distribution of seawater plumes, for which high-resolution data were required and it was reasonable to implement a dipole–dipole configuration in this study. Line-3 and Line-4—with 165 m long cables (3 m in spacing)—were set up to determine the interface between fresh and seawater in the study site. A Wenner array—which is usually applied for good vertical resolution (a dense near-surface cover of resistivity data) and clear images of groundwater, saltwater intrusion, and sand-clay boundaries—was an attractive configuration, because it provides a high signal to noise ratio [10,26]. The ERI data acquisitions are provided in detail in Table 1.
The apparent resistivity data were automatically stored in the instrument’s memory, then the data were inverted using computer software in order to create ERI models using an optimization process (adjusting iteratively) between the calculated and observed apparent resistivity values. EarthImager 2D (Version 2.4.4) software was used to invert the data into a 2D model to allow imaging with the highest level of detail to facilitate the investigation of changes in the subsurface groundwater salinity. A smooth inversion model known as Occam’s inversion was used in the inversion processes, because this finds the smoothest possible model fitting the data based on a-priori Chi-squared statistics [27].
2.3.2. Time-Lapse Electrical Resistivity Imaging (Time-Lapse ERI)
Unfortunately, the resistivity interpretation of the seawater intrusion is not straightforward, due to the presence of the clay layers in the area which are also conductive, like seawater [9]. The clay layers can cause the seawater intrusion to be misinterpreted when using ERI. The different resistivity interpretations for the seawater intrusion can be found in previous studies based on their own localisms. Typically, time-lapse ERI was applied to indicate the dynamic effect of a particular parameter on subsurface resistivity distribution [28]. With this perception, the resistivity of seawater intrusion in the dry season (from December to April) is smaller than that in the rainy season (from May to November) because the aquifer is likely to be penetrated by rainfall as a natural refill. When the seawater zone merges with the freshwater recharge, the resistivity of the seawater zone increases due to its loss of the conductive property [18]. Similarly, if the change of resistivity in the time-lapse ERI is not found seasonally in the aquifer, that indicates the possibility of clay layers being present in the study area. Consequently, Line-2 and Line-4 conducted the time-lapse ERI using EarthImager 2D (Version 2.4.4) software in both the dry and rainy seasons in order to prove that the low resistivity in the study area is caused by seawater intrusion and that there are no misleading interpretations due to clay layers in this study. The time-lapse inversion module of EarthImager 2D produces difference images between any monitor dataset and the base dataset. The difference inversion requires inversion of the dry season dataset as the base dataset and inversion of the rainy season dataset as a single monitor dataset. The result of time lapse inversion is presented as the difference between the two sections of the base dataset and the monitor dataset using the smooth constraint approach as the same as 2D inversion results [29].
3. Results and Discussion
3.1. An Effect of Seawater Intrusion on Electrical Resistivity
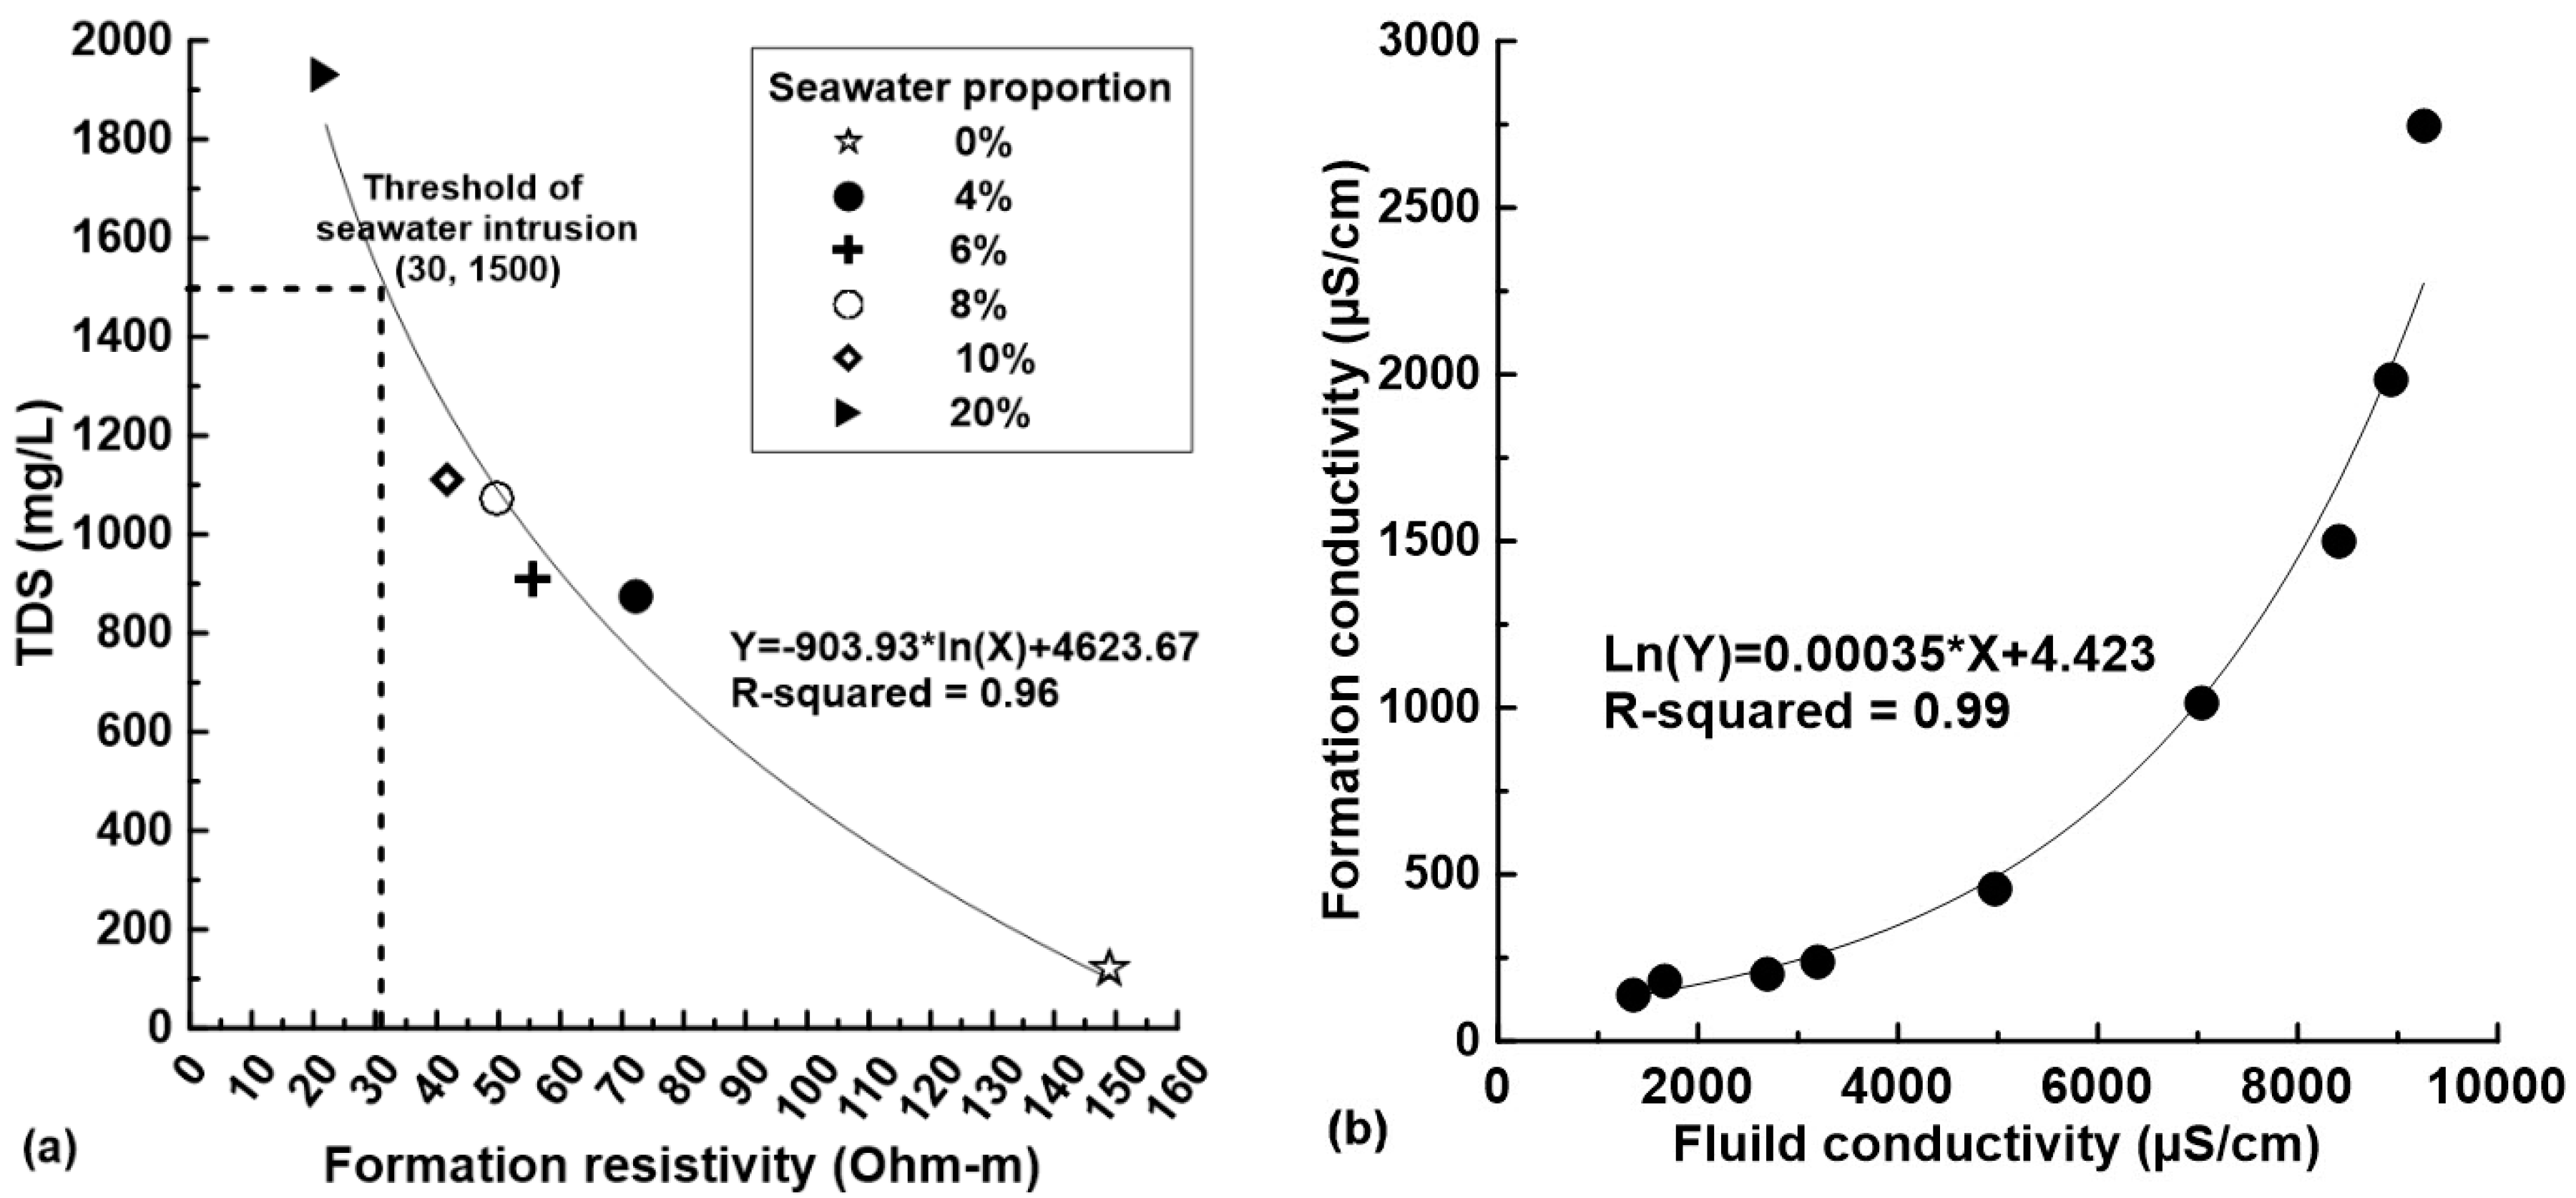
The initial condition of the samples was 216 Ohm-m in an average measured by the resistivity meter at room temperature. The formation resistivity decreases with an increase in the volume of seawater in saturated beach sand. It is clear from Table 2 that resistivity with 100% of the artificial seawater intrusion was lower than 4 Ohm-m (TDS > 2000 mg/L), compared to approximately 150 Ohm-m (around 121 mg/L of TDS) in 0% seawater. The resistivity increases from 4 up to 22 Ohm-m (1930 mg/L of TDS) when the artificial seawater was added into the sample at 20%. The seawater intrusion is indicated by a standard of the groundwater quality limitation from DGR (Department of Groundwater Resources of Thailand) as TDS is higher than 1500 mg/L. The formation resistivity and TDS were plotted as shown in Figure 5a to obtain the empirical relationship in Equation (1).
where is the formation resistivity (Ohm-m), and TDS is total dissolved solid (mg/L).
The groundwater in the Kamala sub-district is interpreted as being contaminated with seawater when its resistivity is lower than 30 Ohm-m (TDS > 1500 mg/L). Therefore, a resistivity lower than 30 Ohm-m is used as a threshold for the interpretation of seawater intrusion delineation in the study area.
The fluid conductivity was plotted as a function of the formation conductivity (Figure 5b). The good correlation (R-squared = 0.99) in exponential regression between fluid conductivity and formation conductivity was constructed using an empirical relationship as follows:
where is the fluid conductivity (µS/cm), and is the formation conductivity (µS/cm).
This correlation confirms that the formation conductivity is highly affected by groundwater salinity. Based on this analysis, the geo-electrical surveys are considered to be an effective tool for investigating the distribution of salinity intrusion into coastal aquifer systems caused by seawater in the Kamala sub-district of Phuket.
3.2. Delineation of Seawater Intrusion Zone Using 2D ERI
In general, the electrical resistivity of groundwater varies from 10 to 100 Ohm-m depending on the TDS concentration [9] and the electrical resistivity decreases progressively with an increase in the levels of chemical concentrations in seawater. The presence of a low resistivity zone (lower than 10 Ohm-m) can be interpreted as indicating the presence of a seawater intrusion [5,8,30] because freshwater generally has a resistivity of between 50 and 100 Ohm-m [9,31] with a resistivity of 10 to 50 Ohm-m corresponding to the transition, or brackish water zone. In terms of the study area, Kamala, it can be mapped that the contaminated zone caused by seawater has resistivity smaller than 30 Ohm-m.
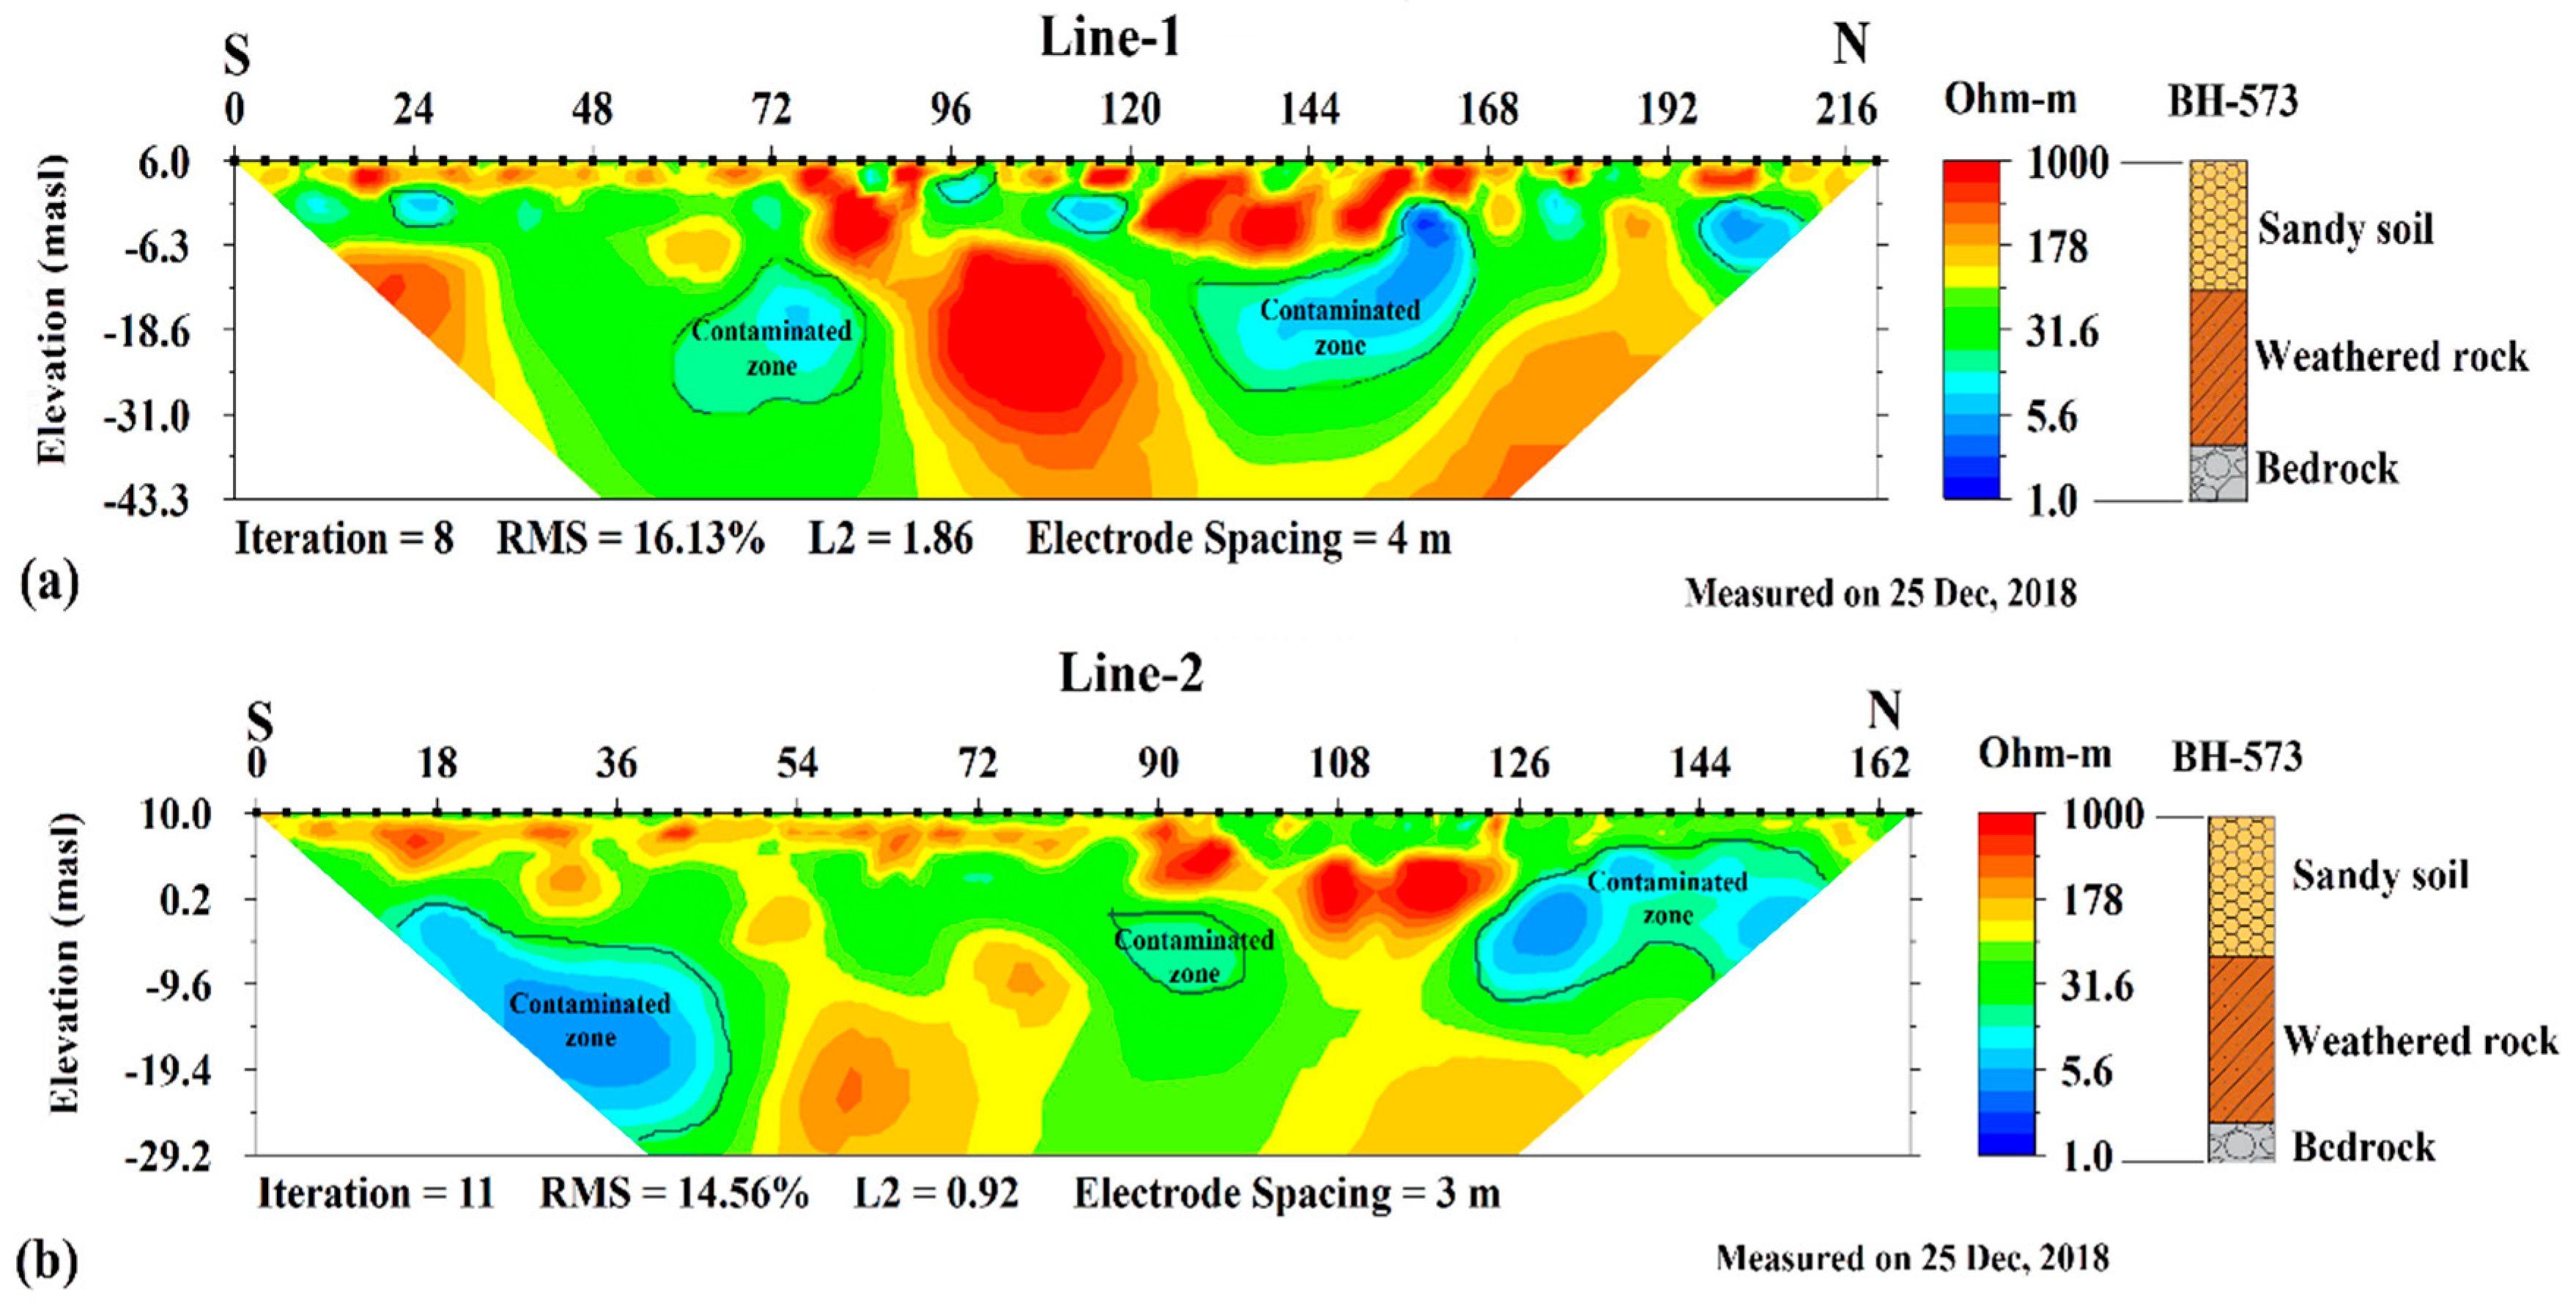
The quality of resistivity data was checked simultaneously during the measurements by a contact resistance, i.e., the contact resistances of each electrode are supposed to be less than 2000 ohms, as recommended by AGI’s guideline [32]. In addition, the noise ratio of each line was manually processed in order to reduce the RMS in the inversion results. Based on the apparent resistivity in the Kamala coastal area, the 2D-ERI results give clear evidence for the influence of a seawater intrusion. The 2D-ERI result from Line-1 (Figure 6a) shows a wide and elongated low resistivity zone representing the seawater intrusion. The thickness of the seawater intrusion zone ranges from approximately 6 m in the south to 23 m in the north. Therefore, the seawater intrudes increasingly towards the north. The contaminated zone extends outward from the seawater intrusion zone, throughout the investigation depth at around -31 masl. Line-2 was situated parallel to Line-1 at a distance of 80 m. The main difference in the 2D-ERI result between Line-2 (Figure 6b) and Line-1 is the appearance of the seawater intrusion zone at the edges of the model at a depth of about 19 m (0.2 to −19.4 masl) at the southern edge, and at a depth of about 10 m (5 to −4.7 masl) in the north. Furthermore, the seawater intrusion and the contaminated zones decrease eastward away from the Andaman Sea.
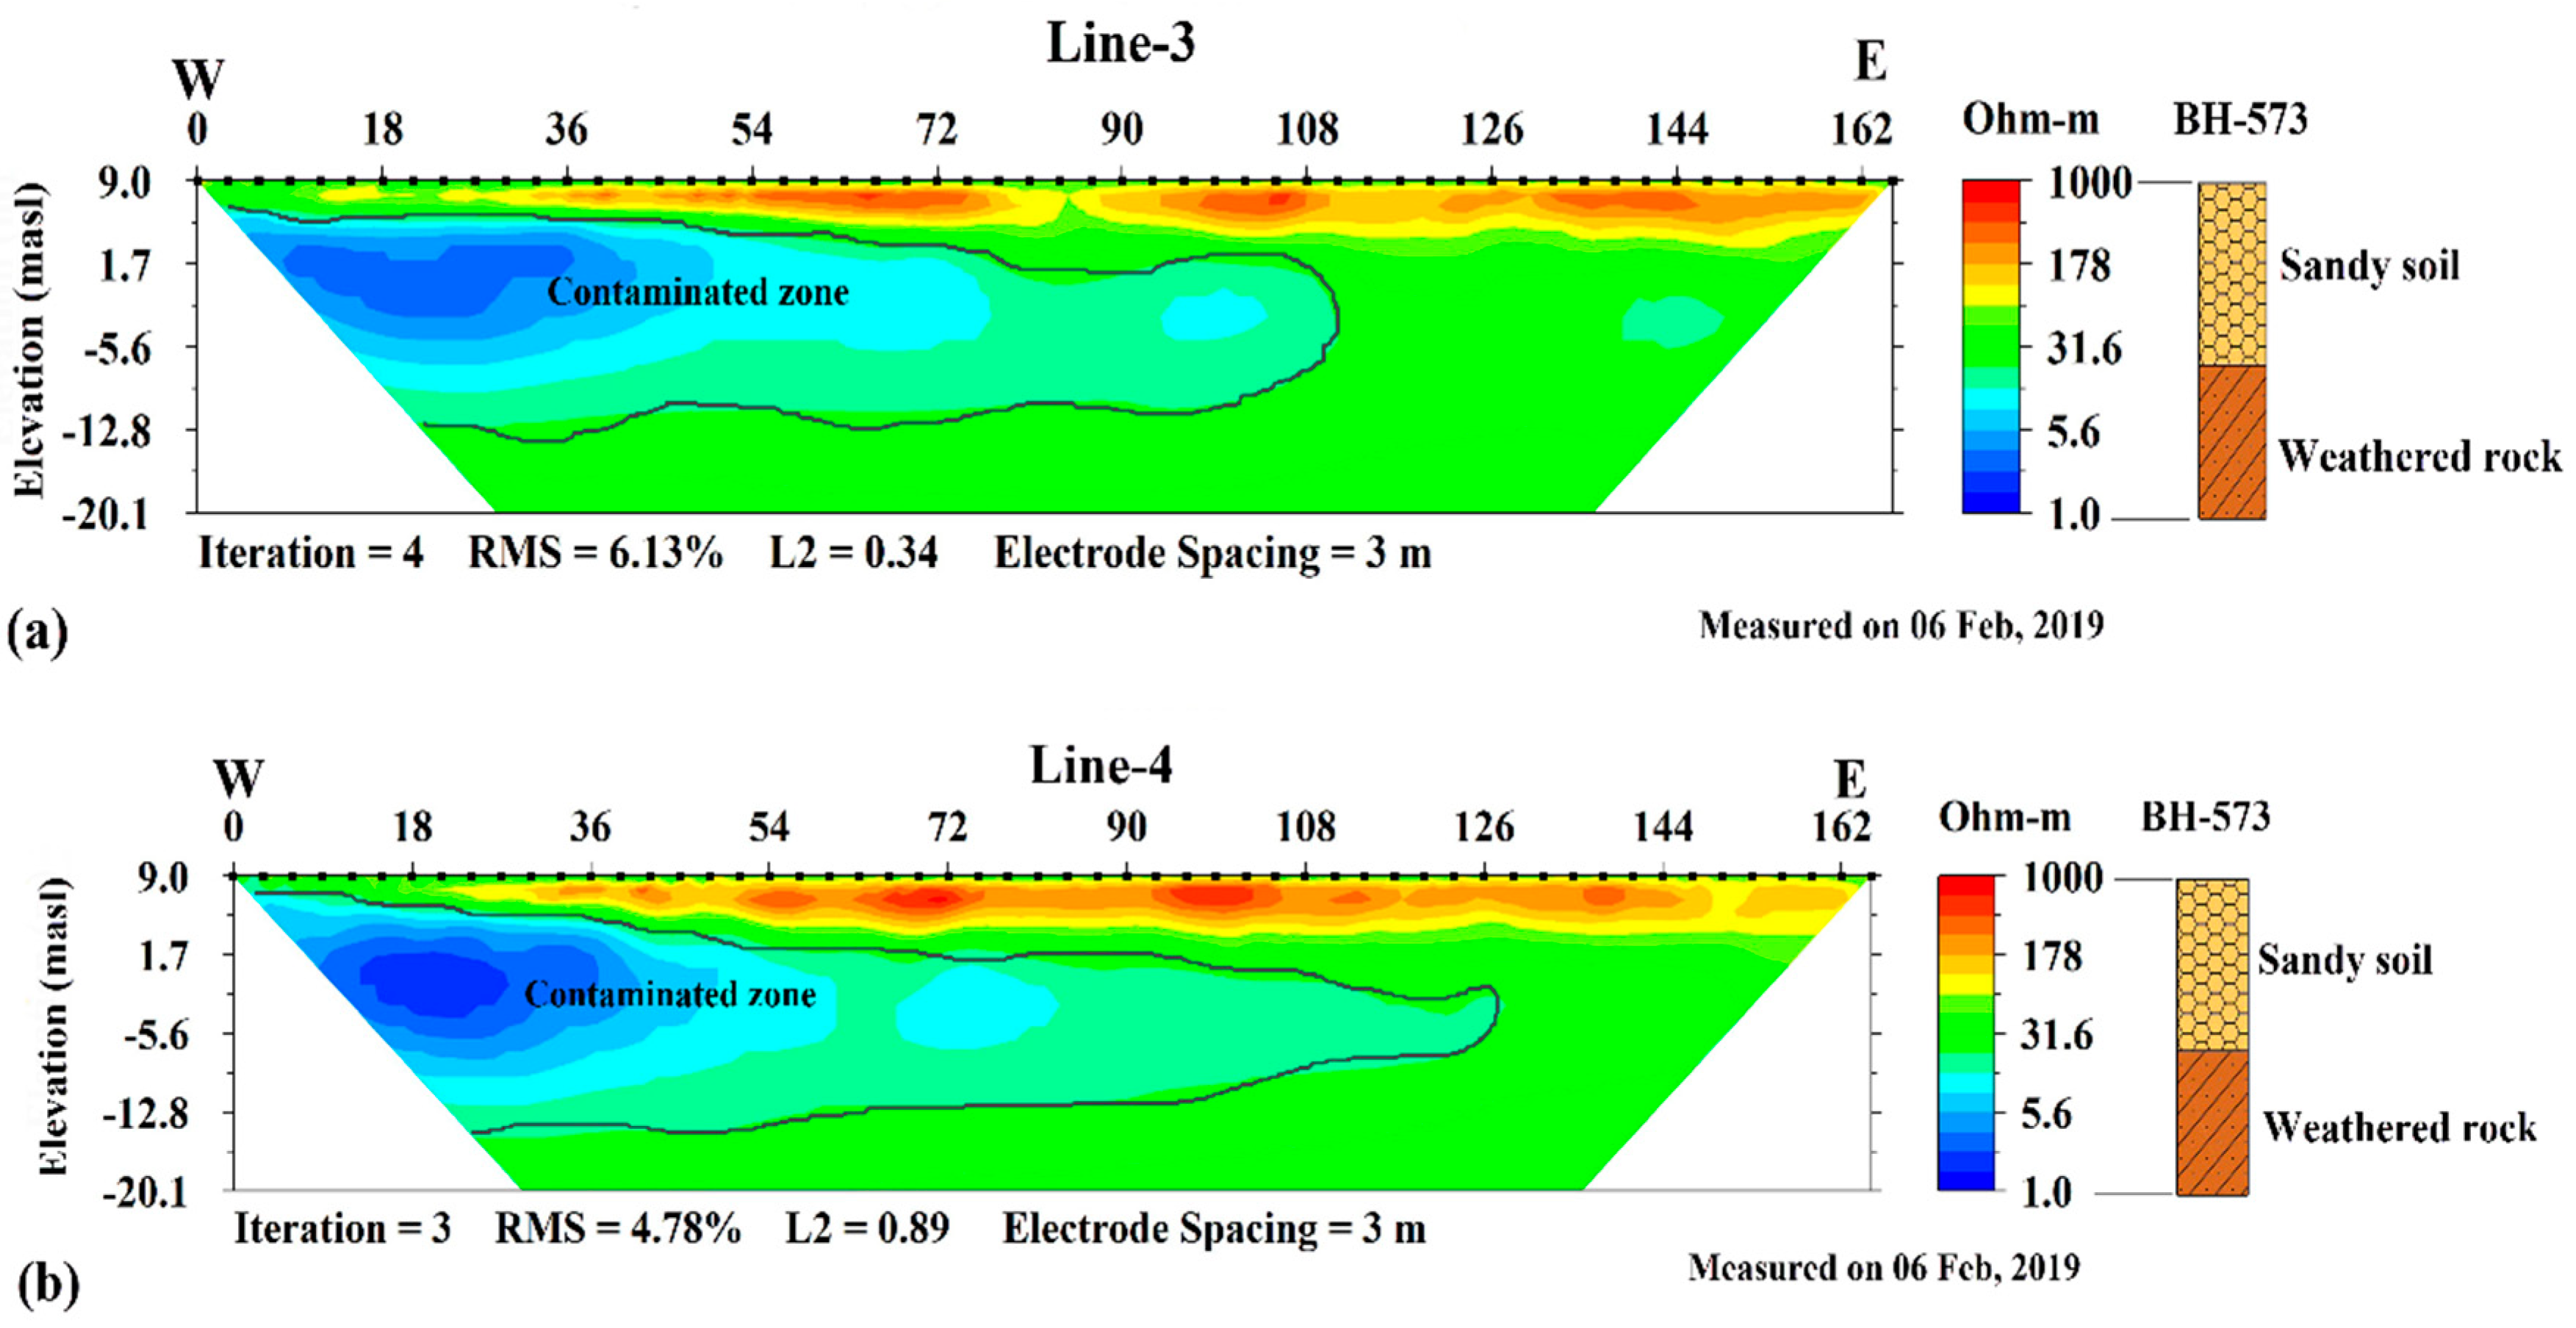
In contrast to those lines, Line-3 and Line-4 were situated perpendicularly to the beach at a distance of about 360 m from them in order to identify the interface between fresh and sea water. The 2D-ERI results of Line-3 (Figure 7a) and Line-4 (Figure 7b) are identical. The data quality of Line-3 and Line-4 are considered to be very high. Low contact resistance (lower than 1000 Ohm in average) was detected along those profiles covered by moisture soil. For Line-3 and Line-4, very few noisy data points were deleted in order to obtain the low RMS in the output inversion. The data of Line-3 and Line-4 produced 6.13% and 4.78% of the RMS, respectively.
These results are reasonable because Line-4 located around 10 m from Line-3; therefore, the results between these two lines are not expected to be much different. The results show unique features with a low resistivity zone near the Andaman Sea at a depth of between 5.0 and −10 masl. Thereafter, the seawater intrusion decreases eastward from the Andaman Sea corresponding to the results of Line-1 and Line-2 with the freshwater–seawater interface was located at a distance of about 400 m from the sea.
3.3. Validation of Seawater Intrusion Using Time-Lapse ERI
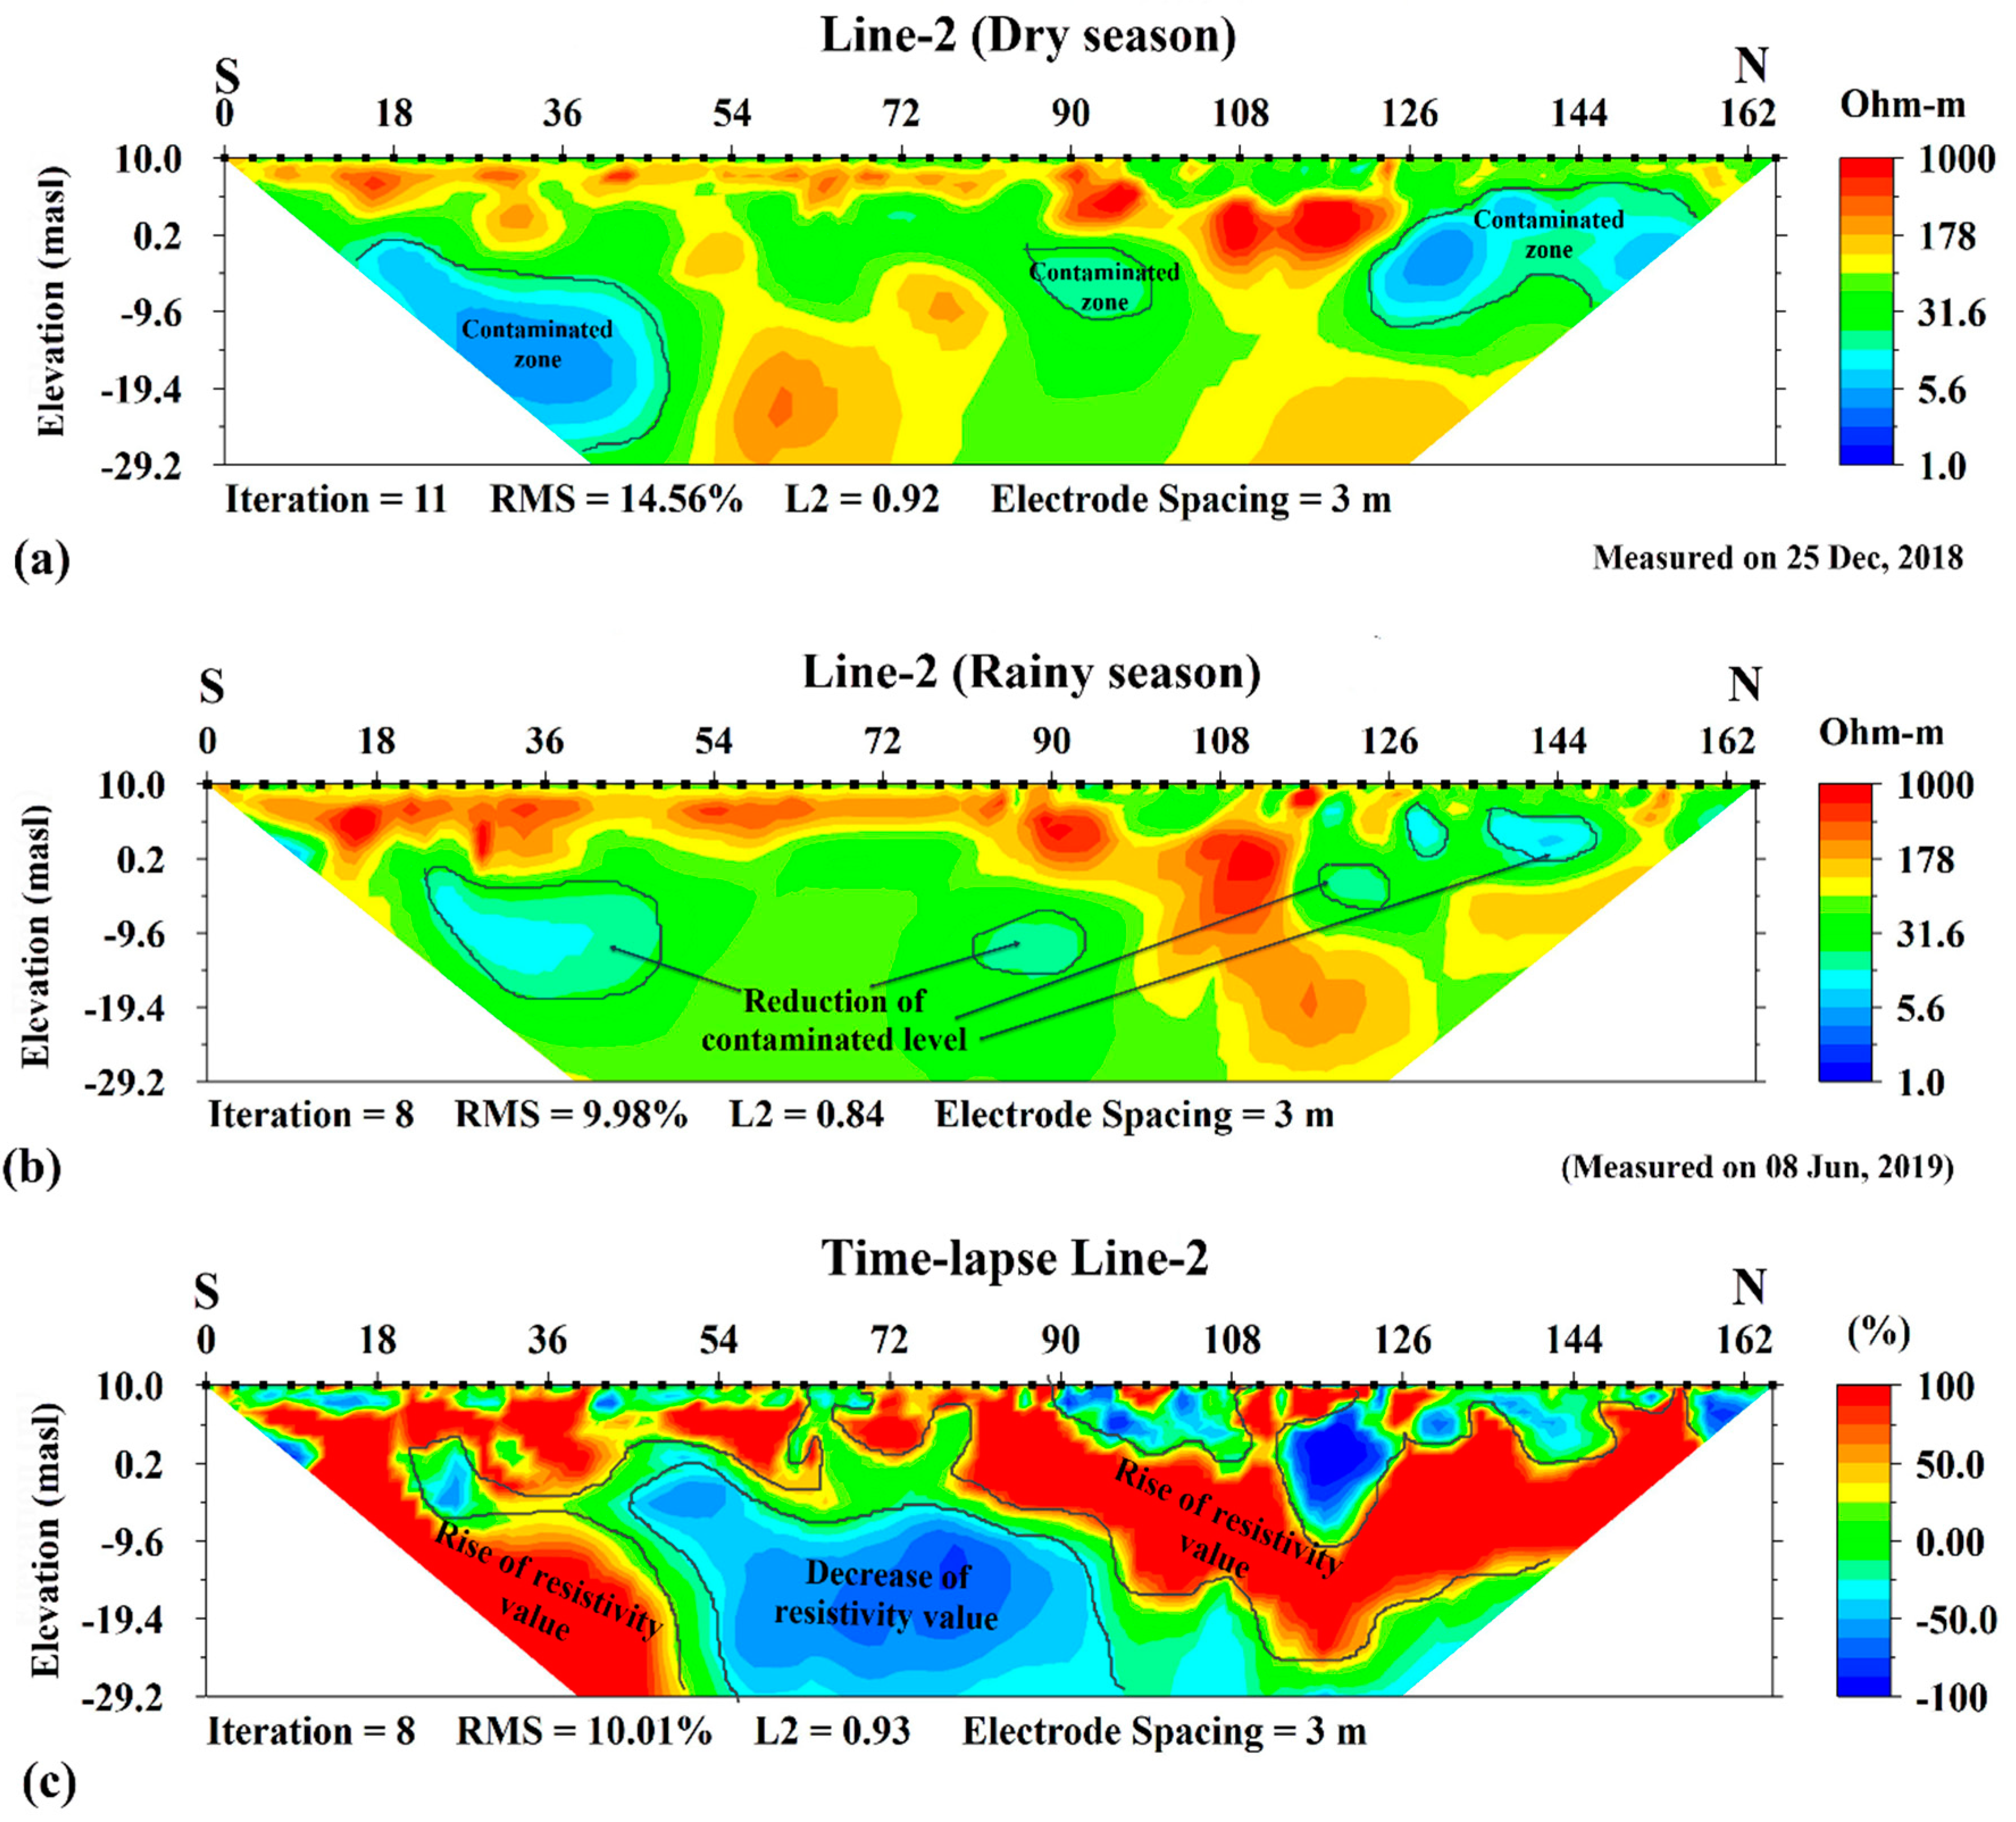
A time-lapse ERI applying the difference inversion method has been used for the seasonal monitoring of seawater intrusion and groundwater dynamics in the coastal aquifer of Kamala beach, Phuket, since it is possible to prove that low resistivity value (smaller than 30 Ohm-m) should be confirmed as seawater intrusion, not clay layers. Regarding the time-lapse ERI of Line-2 (Figure 8c), at the southern part (from around 5 masl to the datum) and the northern part of the profile, the result shows the percentage change (100%) representing the increment of resistivity (corresponding to a decrease of the salination in the porous media in aquifer). The resistivity of these plumes was lower than 6 Ohm-m in the dry season (the end of December 2018), as shown in Figure 8a, but increased in the rainy season (June 2019), as presented in Figure 8b, due to a rainfall infiltration into the aquifer. This output is reasonable, because the aquifer in Kamala is an unconfined aquifer (weathered rock) overlain by sandy soil; therefore, the significant rainfall might penetrate easily and abruptly to the subsurface.
In terms of the time-lapse ERI of Line-4 (Figure 9), the rise of resistivity (percentage change from 20% to 100%) is shown in the zone locating the western part of the inversion model. This zone is highly conductive during the dry season (February 2018). However, the resistivity value of this zone is higher in the rainy month (June 2019), compared to that of the dry season. For this profile, it indicates clearly that the reduction in resistivity presents near ground surface (approximately 4 m in thickness) owing to seasonal freshwater recharge supplied regionally from the mainland which is a similar reason to time-lapse ERI of Line-2. According to these two pieces of evidence, the low resistivity plumes (smaller than 30 Ohm m) are confirmed as indicating the presence of seawater intrusion.
The geo-electrical survey using 2D-ERI in combination with laboratory testing in this study presents a successful investigation technique for characterizing the subsurface of the spatial distribution of seawater dynamics in coastal aquifers. The resistivity threshold obtained from laboratory testing can help to eliminate a wide range of resistivities based on different locations in terms of the ERI interpretation. Most of the studies interpreted the resistivity results using their estimated range of the resistivity of seawater and freshwater without conducting systematic studies into correct ERI interpretation. However, a predicting assessment (seawater simulation) and quantitative estimations are both the limitation and the research gap of this study. The subsurface information results of this study can be used to motivate further research modelling seawater intrusion, and for determining and predicting the effects of different pumping schemes.
4. Conclusions
A combination of geo-electrical surveys using 2D-ERI and time-lapse ERI and groundwater chemistry data has been proven to be an effective tool for delineating the spatial extent and interaction between freshwater and seawater from a seawater intrusion in the Kamala subdistrict in the west of Phuket Island. Resistivity represents a feasible and efficient parameter for both quantitative and qualitative studies with respect to the problem of seawater intrusion in coastal aquifers. The 2D models show the extent of seawater intrusion in the freshwater aquifer in Kamala. In both the top layer (clayey sand) and second layer (weathered and fractured rock layer), the fresh/sea water interface was identified at a depth of about 5 m below the ground surface, running eastward toward the inland area and extending approximately 400 m away from the beach. The historical trends and cross-correlation of the TDS and Cl concentrations [6] were confirmed by the success of the ERI method in identifying seawater intrusion in Kamala. In addition, a clear relationship between the earth resistivity and water resistivity was found, and the resistivity value used for interpreting the contaminated zone in the study area—Kamala—was established. Similarly, there are many previous studies [5,7,11] that have investigated the cross-correlation between the electrical resistivity of subsurface formations and the TDS and Cl concentrations in groundwater, and increases in TDS and Cl concentrations have been generally found to cause an anomalously low electrical resistivity in the area of the seawater intrusion. Finally, these research findings can help us establish the capacity of the aquifer and the threshold level of groundwater exploitation, in order to maintain the sustainable use of water resources in this area.
Author Contributions
S.V.; data acquisition, data inversion, formal analysis and interpretation and writing manuscript, S.V.; A.P.; methodology, review and edition and final approval for submission, T.S.; and W.K.; suggestion provision. All authors have read and agreed to the published version of the manuscript.
Funding
The authors would like to thank the Thai Royal Scholarship under Her Royal Highness Princess Maha Chakri Sirindhorn Education Project for providing financial support for conducting this research.
Acknowledgments
We would like to express our sincere thanks to R. Men, N.N. Htwe, T.T. Yacob, and K.M. Phoung, students at the Interdisciplinary Graduate School of Earth System Science and Andaman Natural Disaster Management (ESSAND), for technical support and for field operations. We would also like to extend our thanks to the Department of Groundwater Resources (DGR), Thailand for providing the groundwater chemistry data. Finally, we would like to thank PSU English Clinic for English proofreading.
Conflicts of Interest
The authors declare no conflict of interest.
References
- Institute for Social and Environmental Transition-International (ISET); Thailand Environmental Institute (TEI); Vietnam National Institute for Science and Technology Policy and Strategy Studies (VNISTPSS). Urban Vulnerability in Southeast Asia: Summary of Vulnerability assessments in Mekong-building Climate Resilience in Asian Cities (M-BRACE); ISET: Bangkok, Thailand, 2014. [Google Scholar]
- Department of Groundwater Resource (DGR). Annual Report: Thailand Groundwater Situation in 2015; Groundwater Conservation and Recovery Institution: Bangkok, Thailand, 2015. [Google Scholar]
- Puttiwongrak, A.; Kong, S.O.; Vann, S. Groundwater recharge estimation in Kathu, Phuket using groundwater modelling. Geotech. Eng. J. SEAGS AGSSEA 2018, 49, 4–10. [Google Scholar]
- Cimino, A.; Cosentino, C.; Oieni, A.; Tranchina, I. A geophysical and geochemical approach for seawater intrusion assessment in the Acquedolci coastal aquifer (Northern Sicily). Environ. Geol. 2008, 55, 1473–1482. [Google Scholar] [CrossRef]
- Song, S.H.; Lee, J.Y.; Park, N. Use of vertical electrical soundings to delineate seawater intrusion in a coastal area of Byunsan, Korea. Environ. Geol. 2007, 52, 1207–1219. [Google Scholar] [CrossRef]
- Puttiwongrak, A.; Vann, S.; Rattanakom, R.; Ruamkaew, S. Preliminary assessment of seawater intrusion on phuket island using groundwater data analysis and geographic information system (GIS) techniques. Eng. J. Res. Dev. 2019, 30, 75–88. [Google Scholar]
- Sherif, M.; Mahmoudi, A.E.; Garamoon, H.; Kacimov, A.; Akram, S.; Ebraheem, A.; Shetty, A. Geoelectrical and hydrogeochemical studies for delineating seawater intrusion in the outlet of Wadi Ham, UAE. Environ. Geol. 2006, 49, 536–551. [Google Scholar] [CrossRef]
- Chafouq, D.; Mandour, A.E.; Elgettafi, M.; Himi, M.; Bengamra, S.; Lagfid, Y.; Casas, A. Assessing of saltwater intrusion in Ghiz-Nekor aquifer (North Morocco) using electrical resistivity tomography. Near Surf. Geosci. 2016, 1–6. [Google Scholar] [CrossRef]
- Kura, N.U.; Ramli, M.F.; Ibrahim, S.; Sulaiman, W.N.A.; Zaudi, M.A.; Aris, A.Z. A preliminary appraisal of the effect of pumping on seawater intrusion and upconing in a small tropical island using 2D resistivity technique. TSWJ 2014, 2014, 1–12. [Google Scholar] [CrossRef] [Green Version]
- Eissa, M.S.; Mahmoud, H.H.; Orfan, S.S. Geophysical and geochemical studies to delineate seawater intrusion in Bagoush Area, Northwestern coast, Egypt. Afr. Earth Sci. 2016, 121, 365–381. [Google Scholar] [CrossRef]
- Hwang, S.; Shin, J.; Park, I.; Lee, S. Assessment of seawater intrusion using geophysical well logging and electrical soundings in a coastal aquifer, Youngkwang-gun, Korea. Explor. Geophys. 2004, 35, 99–104. [Google Scholar] [CrossRef]
- Costall, A.; Harris, B.; Pigois, J.P. Electrical Resistivity Imaging and the Saline Water Interface in High-Quality Coastal Aquifers. Surv. Geophys. 2018, 39, 753–816. [Google Scholar] [CrossRef] [Green Version]
- Goebel, M.; Pidlisecky, A.; Knight, A. Resistivity imaging reveals complex pattern of saltwater intrusion along Monterey coast. J. Hydrol. 2017, 551, 746–755. [Google Scholar] [CrossRef]
- Gemail, K.; Samir, A.; Oelsner, C.; Mousa, S.E.; Ibrahim, S. Study of saltwater intrusion using 1D, 2D and 3D resistivity surveys in the coastal depressions at the eastern part of Matruh area, Egypt. Near Surf. Geophys. 2004, 2, 103–109. [Google Scholar] [CrossRef]
- Beaujean, J.; Nguyen, F.; Kemna, A.; Antonsson, A.; Engesgaard, P. Calibration of seawater intrusion models: Inverse parameter estimation using surface electrical resistivity tomography and borehole data. Water Resour. Res. 2014, 50, 6828–6849. [Google Scholar] [CrossRef] [Green Version]
- Comte, J.C.; Banton, O. Cross-validation of geo-electrical and hydrogeological models to evaluate seawater intrusion in coastal aquifers. Geophys. Res. Lett. 2007, 34, 1–5. [Google Scholar] [CrossRef]
- Hermans, T.; Vandenbohede, A.; Lebbe, L.; Martin, R.; Kemna, A.; Beaujean, J.; Nguyen, F. Imaging artificial salt water infiltration using electrical resistivity tomography constrained by geostatistical data. J. Hydrol. 2012, 438, 168–180. [Google Scholar] [CrossRef] [Green Version]
- de Franco, R.D.; Biella, G.; Tosi, L.; Teatini, P.; Lozej, A.; Chiozzotto, B.; Giada, M.; Rizzetto, F.; Claude, C.; Mayer, A.; et al. Monitoring the saltwater intrusion by time lapse electrical resistivity tomography: The Chioggia test site (Venice Lagoon, Italy). J. Appl. Geophys. 2009, 69, 117–130. [Google Scholar] [CrossRef]
- Department of Mineral Resources (DMR). Geological and Geo-Resources Classification for Management in Phuket; Onpa Co., LTD: Bangkok, Thailand, 2013. [Google Scholar]
- Institute for Social and Environmental Transition-International (ISET); Thailand Environmental Institute (TEI); Vietnam National Institute for Science and Technology Policy and Strategy Studies (VNISTPSS). Urban Vulnerability in Southeast Asia: Summary of Vulnerability Assessments in Mekong-Building Climate Resilience in Asian Cities (M-BRACE); ISET: Bangkok, Thailand, 2013. [Google Scholar]
- NOAA. Andaman Sea Level Rising during 1992–2016. Available online: https://www.star.nesdis.noaa.gov/sod/sa/SeaLevelRise/LSA_SLR_timeserie_regional.php (accessed on 26 August 2017).
- Giambastiani, B.M.S.; Antonellini, M.; Essink, G.H.P.O.; Stuurman, R.J. Saltwater intrusion in the unconfined coastal aquifer of Ravenna (Italy): A numerical model. J. Hydrol. 2007, 340, 91–104. [Google Scholar] [CrossRef]
- Werner, A.D.; Bakker, M.; Post, V.E.A.; Vandenbohede, A.; Lu, C.; Ataie-Ashtiani, B.; Barry, D.A. Seawater intrusion processes, investigation and management: Recent advances and future challenges. Adv. Water Resour. 2013, 51, 3–26. [Google Scholar] [CrossRef]
- Giao, P.H.; Chung, S.G.; Kim, D.Y.; Tanaka, H. Electric imaging and laboratory resistivity testing for geotechnical investigation of Pusan clay deposits. J. Appl. Geophys. 2003, 52, 157–175. [Google Scholar] [CrossRef]
- Park, S.; Yi, M.J.; Kim, J.H.; Shin, S.W. Electrical resistivity imaging (ERI) monitoring for groundwater contamination in an uncontrolled landfill, South Korea. J. Appl. Geophys. 2016, 135, 1–7. [Google Scholar] [CrossRef]
- Baharuddin, M.F.T.; Taib, S.; Hashim, R.; Abidin, M.H.Z.; Ishak, M.F. Time-lapse resistivity investigation of salinity changes at an ex-promontory land: A case study of Carey Island, Selangor, Malaysia. Environ. Monit. Assess. 2011, 180, 345–369. [Google Scholar] [CrossRef] [PubMed] [Green Version]
- Advanced Geosciences, Inc. (AGI). Instruction Manual for Earthimager2D Version 2.4.2: Resistivity and IP Inversion Software; Advanced Geoscience Inc.: Austin, TX, USA, 2014. [Google Scholar]
- Carey, A.M.; Paige, G.B.; Carr, B.J.; Dogan, M. Forward modeling to investigate inversion artifacts resulting from time-lapse electrical resistivity tomography during rainfall simulations. J. Appl. Geophys. 2017, 145, 39–49. [Google Scholar] [CrossRef]
- LaBrecque, D.; Yang, X. Difference inversion of ERT data: A fast inversion method for 3-D in situ monitoring. J. Environ. Eng. Geophys. 2001, 6, 83–89. [Google Scholar] [CrossRef]
- Nassir, A.S.S.; Loke, M.H.; Lee, C.Y.; Nawawi, M.N.M. Salt-water intrusion mapping by geoelectrical imaging surveys. Geophys. Prospect. 2000, 48, 647–661. [Google Scholar] [CrossRef]
- White, P.A. Handbook on hydro geological applications of earth resistivity measurements. Water Soil Dir. 1985, 90, 41. [Google Scholar]
- Advanced Geosciences, Inc. (AGI). Instruction Manual: Resistivity; Advanced Geoscience Inc.: Austin, TX, USA, 2016. [Google Scholar]
Figure 1.
Geochemistry data analyses on investigating seawater intrusion in Kamala: (a) historical trend of chlorides (Cl) and total dissolved solids (TDS) and (b) cross-plot between Cl and TDS (modified from Puttiwongrak et al. [6]).
Figure 1.
Geochemistry data analyses on investigating seawater intrusion in Kamala: (a) historical trend of chlorides (Cl) and total dissolved solids (TDS) and (b) cross-plot between Cl and TDS (modified from Puttiwongrak et al. [6]).

Figure 2.
Study area showing electrical resistivity imaging (ERI) line surveys, soil sampling, cross-section lines, and groundwater wells.
Figure 2.
Study area showing electrical resistivity imaging (ERI) line surveys, soil sampling, cross-section lines, and groundwater wells.

Figure 3.
Subsurface stratigraphy of Kamala along Line AA’ and BB’.

Figure 4.
Schematic of sand beach sample measurement in laboratory.

Figure 5.
Cross-correlation between: (a) formation resistivity and TDS and (b) formation and fluid resistivity.
Figure 5.
Cross-correlation between: (a) formation resistivity and TDS and (b) formation and fluid resistivity.

Figure 6.
Two-dimensional (2D) ERI result: (a) Line-1 and (b) Line-2.

Figure 7.
Two-dimensional (2D) ERI result: (a) Line-3 and (b) Line-4.

Figure 8.
Time-lapse ERI inversion: (a) ERI-Line-2 in dry season, (b) ERI Line-2 in rainy season, and (c) TL-ERI Line-2.
Figure 8.
Time-lapse ERI inversion: (a) ERI-Line-2 in dry season, (b) ERI Line-2 in rainy season, and (c) TL-ERI Line-2.

Figure 9.
Time-lapse ERI inversion: (a) ERI-Line-4 in dry season, (b) ERI Line-4 in rainy season, and (c) TL-ERI Line-4.
Figure 9.
Time-lapse ERI inversion: (a) ERI-Line-4 in dry season, (b) ERI Line-4 in rainy season, and (c) TL-ERI Line-4.


Table 1.
Soil sample measurement to determine the resistivity for seawater intrusion in Kamala.
| Line | Starting Point (X, Y) | Ending Point (X, Y) | Spacing (m) | Total Length (m) | Array | 1st Measurement Date | 2nd Measurement Date |
|---|---|---|---|---|---|---|---|
| 1 | 420,985 879,600 | 421,028, 879,812 | 4 | 220 | Dipole–Dipole | 25 December 2018 | None |
| 2 | 421,089, 879,558 | 421,126, 879,720 | 3 | 165 | Dipole–Dipole | 25 December 2018 | 8 June 2019 |
| 3 | 421,216, 879,114 | 421,263, 878,955 | 3 | 165 | Wenner | 6 February 2019 | None |
| 4 | 421,227, 879,116 | 421,273, 878,960 | 3 | 165 | Wenner | 6 February 2019 | 8 June 2019 |
Table 2.
Soil sample measurement to determine the resistivity for seawater intrusion in Kamala.
| Sample Number | Andaman Seawater Concentration (%) | Tap Water Concentration (%) | ρformation (Ohm-m) | ρfluid (Ohm-m) | TDS (mg/L) | ||
|---|---|---|---|---|---|---|---|
| Proportion (%) | Volume (mL) | Proportion (%) | Volume (mL) | ||||
| 1 | 0 | 0 | 0 | 0 | 216 | None | None |
| 2 | 0 | 0 | 100 | 250 | 149 | 55.82 | 121 |
| 3 | 4 | 10 | 96 | 240 | 72.14 | 7.41 | 875 |
| 4 | 6 | 15 | 94 | 235 | 55.6 | 6.02 | 910 |
| 5 | 8 | 20 | 92 | 230 | 49.8 | 3.71 | 1072 |
| 6 | 10 | 25 | 90 | 225 | 41.8 | 3.13 | 1110 |
| 7 | 20 | 50 | 80 | 200 | 22 | 2.01 | 1930 |
| 8 | 40 | 100 | 60 | 150 | 9.85 | 1.42 | >2000 * |
| 9 | 50 | 125 | 50 | 125 | 6.66 | 1.19 | >2000 * |
| 10 | 75 | 187.5 | 25 | 62.5 | 5.04 | 1.12 | >2000 * |
| 11 | 100 | 250 | 0 | 0 | 3.64 | 1.08 | >2000 * |
* The HANNA HI 9813-6 portable pH/EC/TDS/Temperature meter is not capable to detect the TDS exceeding 2000 mg/L.
© 2020 by the authors. Licensee MDPI, Basel, Switzerland. This article is an open access article distributed under the terms and conditions of the Creative Commons Attribution (CC BY) license (http://creativecommons.org/licenses/by/4.0/).
Share and Cite
MDPI and ACS Style
Vann, S.; Puttiwongrak, A.; Suteerasak, T.; Koedsin, W. Delineation of Seawater Intrusion Using Geo-Electrical Survey in a Coastal Aquifer of Kamala Beach, Phuket, Thailand. Water 2020, 12, 506. https://doi.org/10.3390/w12020506
AMA Style
Vann S, Puttiwongrak A, Suteerasak T, Koedsin W. Delineation of Seawater Intrusion Using Geo-Electrical Survey in a Coastal Aquifer of Kamala Beach, Phuket, Thailand. Water. 2020; 12(2):506. https://doi.org/10.3390/w12020506
Chicago/Turabian StyleVann, Sakanann, Avirut Puttiwongrak, Thongchai Suteerasak, and Werapong Koedsin. 2020. "Delineation of Seawater Intrusion Using Geo-Electrical Survey in a Coastal Aquifer of Kamala Beach, Phuket, Thailand" Water 12, no. 2: 506. https://doi.org/10.3390/w12020506
Note that from the first issue of 2016, this journal uses article numbers instead of page numbers. See further details here.