Metagenomics Uncovers a Core SAR11 Population in Brackish Surface Waters of the Baltic Sea


1
School of Civil and Environmental Engineering, Nanyang Technological University, Singapore 639798, Singapore
2
Department of Civil Engineering, Kyung Hee University 1732, Yongin-si, Gyeonggi-do 17104, Korea
*
Authors to whom correspondence should be addressed.
Water 2020, 12(2), 501; https://doi.org/10.3390/w12020501
Submission received: 20 December 2019
/
Revised: 24 January 2020
/
Accepted: 9 February 2020
/
Published: 12 February 2020
Abstract
:The Baltic Sea represents one of the largest brackish ecosystems where various environmental factors control dynamic seasonal shifts in the structure, diversity, and function of the planktonic microbial communities. In this study, despite seasonal fluctuations, several bacterial populations (<2% of the total OTUs) that are highly dominant (25% of relative abundance) and highly frequently occurring (>85% of occurrence) over four seasons were identified. Mathematical models using occurrence frequency and relative abundance data were able to describe community assembly persisting over time. Further, this work uncovered one of the core bacterial populations phylogenetically affiliated to SAR11 subclade IIIa. The analysis of the hypervariable region of 16S rRNA gene and single copy housekeeping genes recovered from metagenomic datasets suggested that the population was unexpectedly evolutionarily closely related to those inhabiting a mesosaline lacustrine ecosystem rather than other marine/coastal members. Our metagenomic results further revealed that the newly-identified population was the major driver facilitating the seasonal shifts in the overall community structure over the brackish waters of the Baltic Sea. The core community uncovered in this study supports the presence of a brackish water microbiome distinguishable from other marine and freshwater counterparts and will be a useful sentinel for monitoring local/global environmental changes posed on brackish surface waters.
1. Introduction
The Baltic Sea represents a semi-enclosed aquatic environment that receives high freshwater load but has limited connection to the ocean. The Baltic Sea thus displays a horizontal salinity gradient over geographical distance, while the major part is largely characterized by brackish conditions. Studies have documented the abundance and activity of microbial taxa associated with various environmental factors, advancing the understanding of community composition and diversity upon various stressors [1,2,3,4,5,6,7]. Microorganisms tend to grow faster with a smaller genome size relative to macroorganisms, facilitating rapid shifts in community structure and diversity upon anthropogenic perturbations (e.g., eutrophication, pollution, and global warming) as well as natural environmental gradients. With the changing environmental conditions under global warming scenarios, aquatic microbial communities may exhibit dynamic shifts in microbial composition and diversity, which ultimately impacts the large scale alterations of carbon and nutrient cycles [8]. Examining microbial community composition, diversity, and assembly in this environment has important implications for not only microbial ecology but also diagnosis/monitoring of the type and degree of anthropogenic pressures being posed on the marine ecosystems.
Transitions in microbial composition along the salinity gradient are well described in the Baltic Sea and other coastal/marine environments. In contrast to the lateral salinity gradient, salinity remains quite stable in a given area of the Baltic Sea over time. Studies have reported temporal variation of community structure and diversity from short-term (hours to days) to long-term (months to years) time scales. Among others, temperature, seasonal stratification/mixing, and phosphorous concentration are found to drive the strong seasonal community dynamics. Turnover in winter enriches members of Epsilonproteobacteria and Archaea to the surface waters from the deep habitat [1]. Actinobacteria, Flavobacteria, and Planctomycetes populations are highly enriched in autumn [1]. Cyanobacterial blooms in summer are highly correlated with the level of phosphorus [2]. These works documented how deterministic environmental factors affect community structure/dynamics and specific taxa, particularly in response to distinct environmental factors.
Microbial community composition, structure, and diversity greatly vary in a range of spatial and temporal scales, where it is hypothesized that there are major drivers that largely contribute to the shifts in community structure and function. Among others, a core community consists of organisms (and/or genes) that are ubiquitous or frequently occurring in a given habitat with variable environmental conditions. Recent studies have shown core members across many different ecosystems such as gut microbiomes, aquatic environments, and biological wastewater treatment plants where the core community plays critical roles in ecosystem functions [9]. For example, among thousands of microbial operational taxonomic units (OTUs) revealed through deep sequencing studies, the SAR11 clade is found to be frequently occurring and highly abundant in planktonic microbial communities in marine environments including the Baltic Sea. The genome streamlining and cellular phenotypes conferring fitness in oligotrophic environments help SAR11 be particularly competitive in the ocean [10]. The organisms sustain the ecosystem functions and services in not only the local habitats (e.g., Baltic Sea) but also global scales through carrying out essential roles in biogeochemical cycles of carbon, nitrogen, and sulfur [10]. Earlier studies report the ubiquity and numerical dominance of SAR11 bacteria in the Baltic Sea surface waters, implying their core membership [5,6]. However, these studies determined the abundance and occurrence of SAR11 bacteria at various taxonomic levels (e.g., from the entire SAR11 to the sub-lineage level). Since SAR11 bacteria (Pelagibacterales) are an Alphaproteobacteria order, consisting of members with diverse phylogenetic and functional diversity, it remains to be clearly elucidated at what taxonomic level the SAR11 bacteria hold the core membership in the Baltic Sea surface waters. Further, the previous studies documented the entire or sub-lineages of SAR11 as being frequently occurring in various ranges of habitats/periods. Since the Baltic Sea surface waters exhibit a variety of environmental conditions over the range of different spatiotemporal scales, where (e.g., a relatively narrow range of habitats/periods vs. all geographical/temporal sites) the core membership of the SAR11 bacteria is valid remains to be further described.
In the present study, we performed a comprehensive survey of exploring core members of planktonic microbial communities in the Baltic Sea surface waters using metagenomic datasets obtained a wide range of spatial (32 locations with a greatly varied salinity from freshwater to eusaline) and temporal (over four seasons in one location) scales. Our metagenomic approach using various target sequences (e.g., hypervariable 16S rRNA gene regions and single copy marker genes) could determine the core community at different taxonomic levels (from order down to sub-species population) and specify the range of spatial atlas and temporal scales where the core membership could be valid. Our findings not only provide quantitative insights into planktonic members making up the core community but also help researchers focus on the key drivers, other than numerous transient organisms (satellites), shaping the community structure and function, which will be a useful basis for manipulating ecosystem services and monitoring anthropogenic environmental changes.
2. Materials and Methods
2.1. Retrieving and Analyzing 16S rRNA Gene Sequences from Metagenomics Datasets
A total of 42 metagenomic datasets (Table S1 and Figure S1) that were obtained from Baltic Sea surface waters in the previous studies [1,4,5] were collected and analyzed in this study. Raw metagenomic reads were trimmed with a Q = 20 Phred quality score cutoff using SolexaQA2 [11]. To identify 16S rRNA gene-encoding sequences, metagenomic reads were searched using BLASTn with a cutoff of >70% nucleotide identity and ≥95 match length as described in [12], against the 16S rRNA gene database (hypervariable V6 region) [13]. Only the V6-encoding region of a read was considered, and the other regions of the read were trimmed for further analysis. The V6-encoding reads were analyzed using the MOTHUR pipeline [14], as described previously [15,16]. In brief, the read data were pre-processed using the following parameters: maxambig = 0, maximum length of homopolymer = 8, and other parameters at default settings. The pre-processed sequences were chimera-checked and classified using the commands chimera.vsearch and classify.seqs. The chimeric sequences and those assigned to chloroplast, mitochondria, unknown, archaea, and eukaryote were removed, after which 119-898 V6-encoding sequences were eventually obtained across all metagenomic datasets used in this study. A total of 100 sequences per dataset was randomly drawn for normalization across datasets. The sequences were clustered into representative OTUs based on a 97% nucleotide identity cutoff, using UCLUST (v9.2) [17]. The relative abundance of an OTU was estimated based on the number of sequences clustered into an OTU among the 100 sequences per dataset. Statistical testing for differential community characteristics (e.g., community composition) was conducted using the Mann-Whitney U test.
2.2. Modeling the Relationship between Occurrence Frequency and Relative Abundance
Five models (Nachman, Hanski-Gyllenberg, Power, Poisson, and Negative Binomial) were employed to describe the quantitative relationship between the observed occurrence frequency and relative abundance of OTUs across 31 samples taken in one location (LMO) over the four seasons. The model parameter and the sum of absolute differences for the goodness of fit were estimated as described previously [18,19].
2.3. Phylogenetic Identification and Relative Abundance of SAR11 Populations
This study used 22 genomes (e.g., by isolate genome or single-cell genome sequencing) well characterized in terms of evolution, phylogeny, and their ecological niches, as the references at the time of investigation. Predicted genes of the 22 SAR11 genomes (complete or partial) were collected from GenBank: HTCC1002 (NZ_AAPV00000000.1), HTCC1062 (NC_007205.1), HTCC1016 (NZ_ARCW00000000.1), HTCC7211 (NZ_ABVS00000000.1), HIMB5 (NC_018643.1), AAA288-G21 (AZYC01000001.1), AAA240-E13 (AZHR01000001.1), AAA288-E13 (AZHQ01000001.1), AAA288-N07 (AZYB01000001.1), IMCC9063 (NC_015380.1), HIMB114 (NZ_A- DAC00000000.2), AAA027-C06 (AQPD01000001.1), AAA280-B11 (AQUH01000001.1), AAA024-N17 (AQZA01000001.1), AAA028-D10 (AZOF01000001.1), QL1 (JPLS00000000.1), AAA023-L09 (ATTD00000000.1), AAA027-J10 (AQUF00000000.1), AAA027-L15 (AQUG00000000.1), AAA028-C07 (ATTB00000000.1), AAA280-P20 (AQUE00000000.1), and AAA487-M09 (ATTC00000000.1). The predicted genes of the 22 SAR11 genomes were searched using HMMER3 against 107 single-copy marker genes widely conserved in bacterial genomes, as described previously [20]. Among 107 single-copy marker genes, nine single copy genes encoding Ribosomal protein L4/L1 family (Ribosomal_L4), Ribosomal protein S16 (TIGR00002), glycine-tRNA ligase, alpha subunit (TIGR00388), serine-tRNA ligase (TIGR00414), translation initiation factor IF-2 (TIGR00487), ribosomal protein uS5 (TIGR01021), transcription termination factor NusA (TIGR01953), DNA-directed RNA polymerase, alpha subunit (TIGR02027), synthetases class I (tRNA-synt_1d) were found to be present on the 12 genomes covering four different SAR11 subclades: subclade Ia (HIMB5, HTCC1002, HTCC1016, HTCC1062, and HTCC7211), subclade Ic (AAA240-E13 and AAA288-G21), subclade IIIa (HIMB114, IMCC9063 and QL1), and subclade IIIb (AAA027-C06 and AAA028-D10). Note that some genomes were partially constructed and thus 12 out of a total 22 genomes were used for analysis, and 12 genes were retrieved from the corresponding 12 genomes and were aligned using ClustalW [21]. To assess the relative abundance (expressed as coverage) of a SAR11 population, metagenomics reads were searched against the 12 genes (aligned regions) using BLASTn with a cutoff of >70% nucleotide identity and >95 match length. The length of all mapped metagenomic reads was summed and divided by the total length of the 12 genes, as described previously [22,23,24]. The value was subsequently normalized to one Gb of metagenomics sequence, which was expressed as coverage (×).
3. Results and Discussion
3.1. The Baltic Sea Planktonic Ecosystem Contains the Core Microbial Community
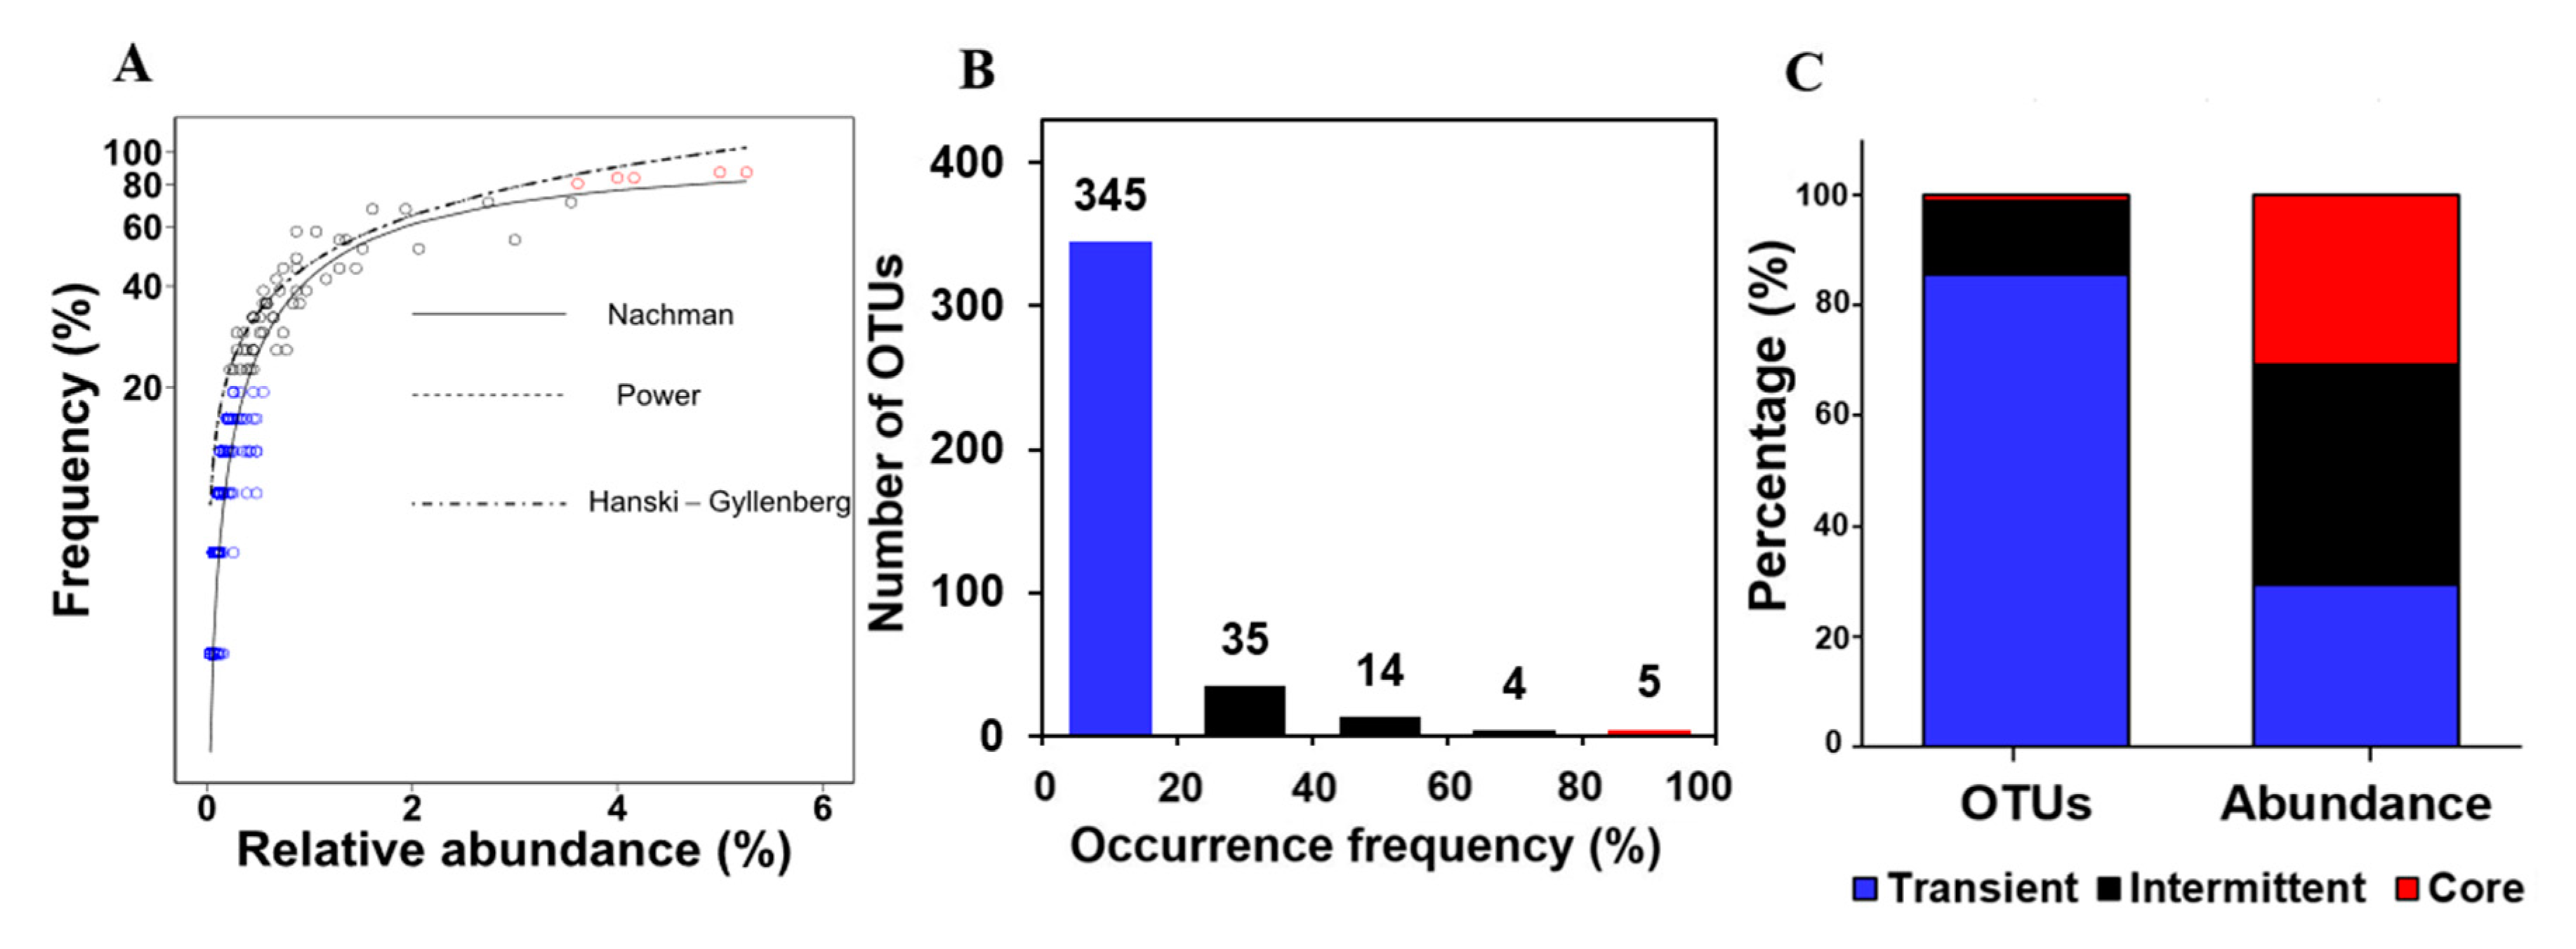
A total of 31 metagenomic datasets originating from the same location (LMO)3 in the central area of the Baltic Sea over the four seasons (Figure S1) were first analyzed. All 31 samples displayed the oligotrophic and mesosaline condition (Table 1). The observed occurrence frequency and relative abundance of OTUs across the 31 datasets were fitted to the five predictive models (Table S2). While the occurrence frequency-abundance data fit relatively well to the Nachman, Hanski-Gyllenberg, and Power models (Figure 1A), the Nachman model was found to best describe (based on sub of absolute difference) the community assembly of the planktonic bacterial communities taken over seasons based on the lower sum of absolute difference (i.e., higher goodness of fit) (Table 1). Particularly, this analysis identified several OTUs (with red color) that were highly frequently occurring and abundant and many others (with blue color) with low occurrence frequency and low abundance.
The occurrence frequency–abundance relationship model is often used to describe the spatial distribution patterns rather than the temporal ones [25]. The core-satellite hypothesis describes the spatial distribution pattern of organisms with evolutionary processes including colonization, extinction, and immigration [26]. A positive correlation between the two variables has been generally observed in macroecology (e.g., various taxa such as insects, birds, and plants) [18]. Core members are shaped by interactions between taxa and niche specialization, whereas satellite ones result from random dispersal. The present and other recent studies [27] expanded the predictive framework to quantitatively describe the bacterial community assembly over time.
Figure 1B shows the number of OTUs in relation to the occurrence frequency. Among a total of 403 OTUs, the majority (345) of OTUs were associated with low occurrence frequency (<20%). The number rapidly decreased with the increase of occurrence frequency: 35 (20–40% occurrence frequency), 14 (40–60%), 4 (60–80%), and 5 (80–100%). Despite a slight increase detected at the 80–100% occurrence frequency compared to that at 60–80%, the number of OTUs did not follow a bimodal distribution pattern (p > 0.05 by Mitchell-Olds and Shaw test). The OTUs were clustered using the occurrence frequency criteria used in previous studies [28]: core (≥80% occurrence frequency), intermittent (20–80%), and transient (≤20%) OTUs. Figure 1C displays the number and relative abundance of OTUs associated with the three defined OTU groups. Of the OTUs, 85% were affiliated to the transient group that occupied 31% of the communities over seasons. Of note was that the core group consisted of 1.3% of the total OTUs but accounted for a significant fraction (25%) of the communities in terms of average relative abundance.
A number of bacterial planktons occur intermittently/transiently, associated with seasonal selection as previously described [3]. A previous study documented a contrasting seasonal pattern in microbial communities at the same site: predominant members (e.g., Bacteroidetes) feeding on complex carbohydrates in spring-early summer and specific lineages of Actinobacteria capable of utilizing Cyanobacteria-derived metabolites in autumn [3]. Despite the seasonal selection (e.g., fluctuating temperature) shaping the community assembly as previously reported, our modeling approach revealed the presence of a few core bacterial populations persisting on surface waters over seasons.
Some caveats can exist in identifying the core members using sequence datasets, which include but not limited to, biases associated with the PCR steps and choices of primers, databases, and target sequence regions [9]. The metagenomic datasets used in this study are without the PCR amplification of a target single gene (e.g., 16S rRNA gene), bypassing the biases related to the PCR steps and primers. A full-length 16S rRNA gene includes at least nine hypervariable sequence regions (V1 to V9), which have been popularly used for microbial community composition profiling. Although the V6 region-based results (as used in this study) is found to be comparable to those using full-length sequences [29], we also compared the V6 region-based results with those using another hypervariable region (V9), showing that both results were highly consistent with each other (data not shown). A frequently used approach in defining the core community utilizes the relative abundance or the presence/absence of microbial taxa, although other approaches benefitting from the information about phylogeny and species-species interaction are also described in [9]. Sequencing depth is an important factor affecting the identification of core bacteria. The sequencing depth directly influences the presence/absence of a taxon, since the current sequencing depth used for surveying many microbial communities can highly likely miss the rare components. Accordingly, many studies establish a cutoff (e.g., 50–90%) for the relative abundance and occurrence frequency (e.g., 80%) to circumvent the issue associated with the limited sequencing depth, as in the present study. The use of the larger sequencing depth would increase the number of core members, as described previously [9,30]. Accordingly, although future studies with increasing sequencing depth (e.g., with more than thousands of OTU sequences) may capture some more core members than those in this study, the core membership of the OTUs revealed in this study will still be valid, regardless of the relatively smaller dataset size.
3.2. The Core SAR11 Population is Distinct from Other Marine Counterparts
The presence of the frequently occurring and abundant OTUs over the four seasons led us to further determine the taxonomic identity. Five OTUs (OTU_01 through OTU_05) with 4–5% of average relative abundance and 80–87% of occurrence frequency was taxonomically analyzed (Table S2). OTU_01, OTU_02, and OTU_04 were related to Pelagibacteraceae, OTU_03 with Halomonadaceae, and OTU_05 with Flavobacteriaceae. The family-level taxonomic affiliation using the MOTHUR package was consistent with the sequence homology search results using BLASTn against the 16S ribosomal RNA sequences database (NCBI). The most abundant bacterial population (OTU_01) showed > 99% nucleotide sequence identity to members of the SAR11 subclade IIIa.
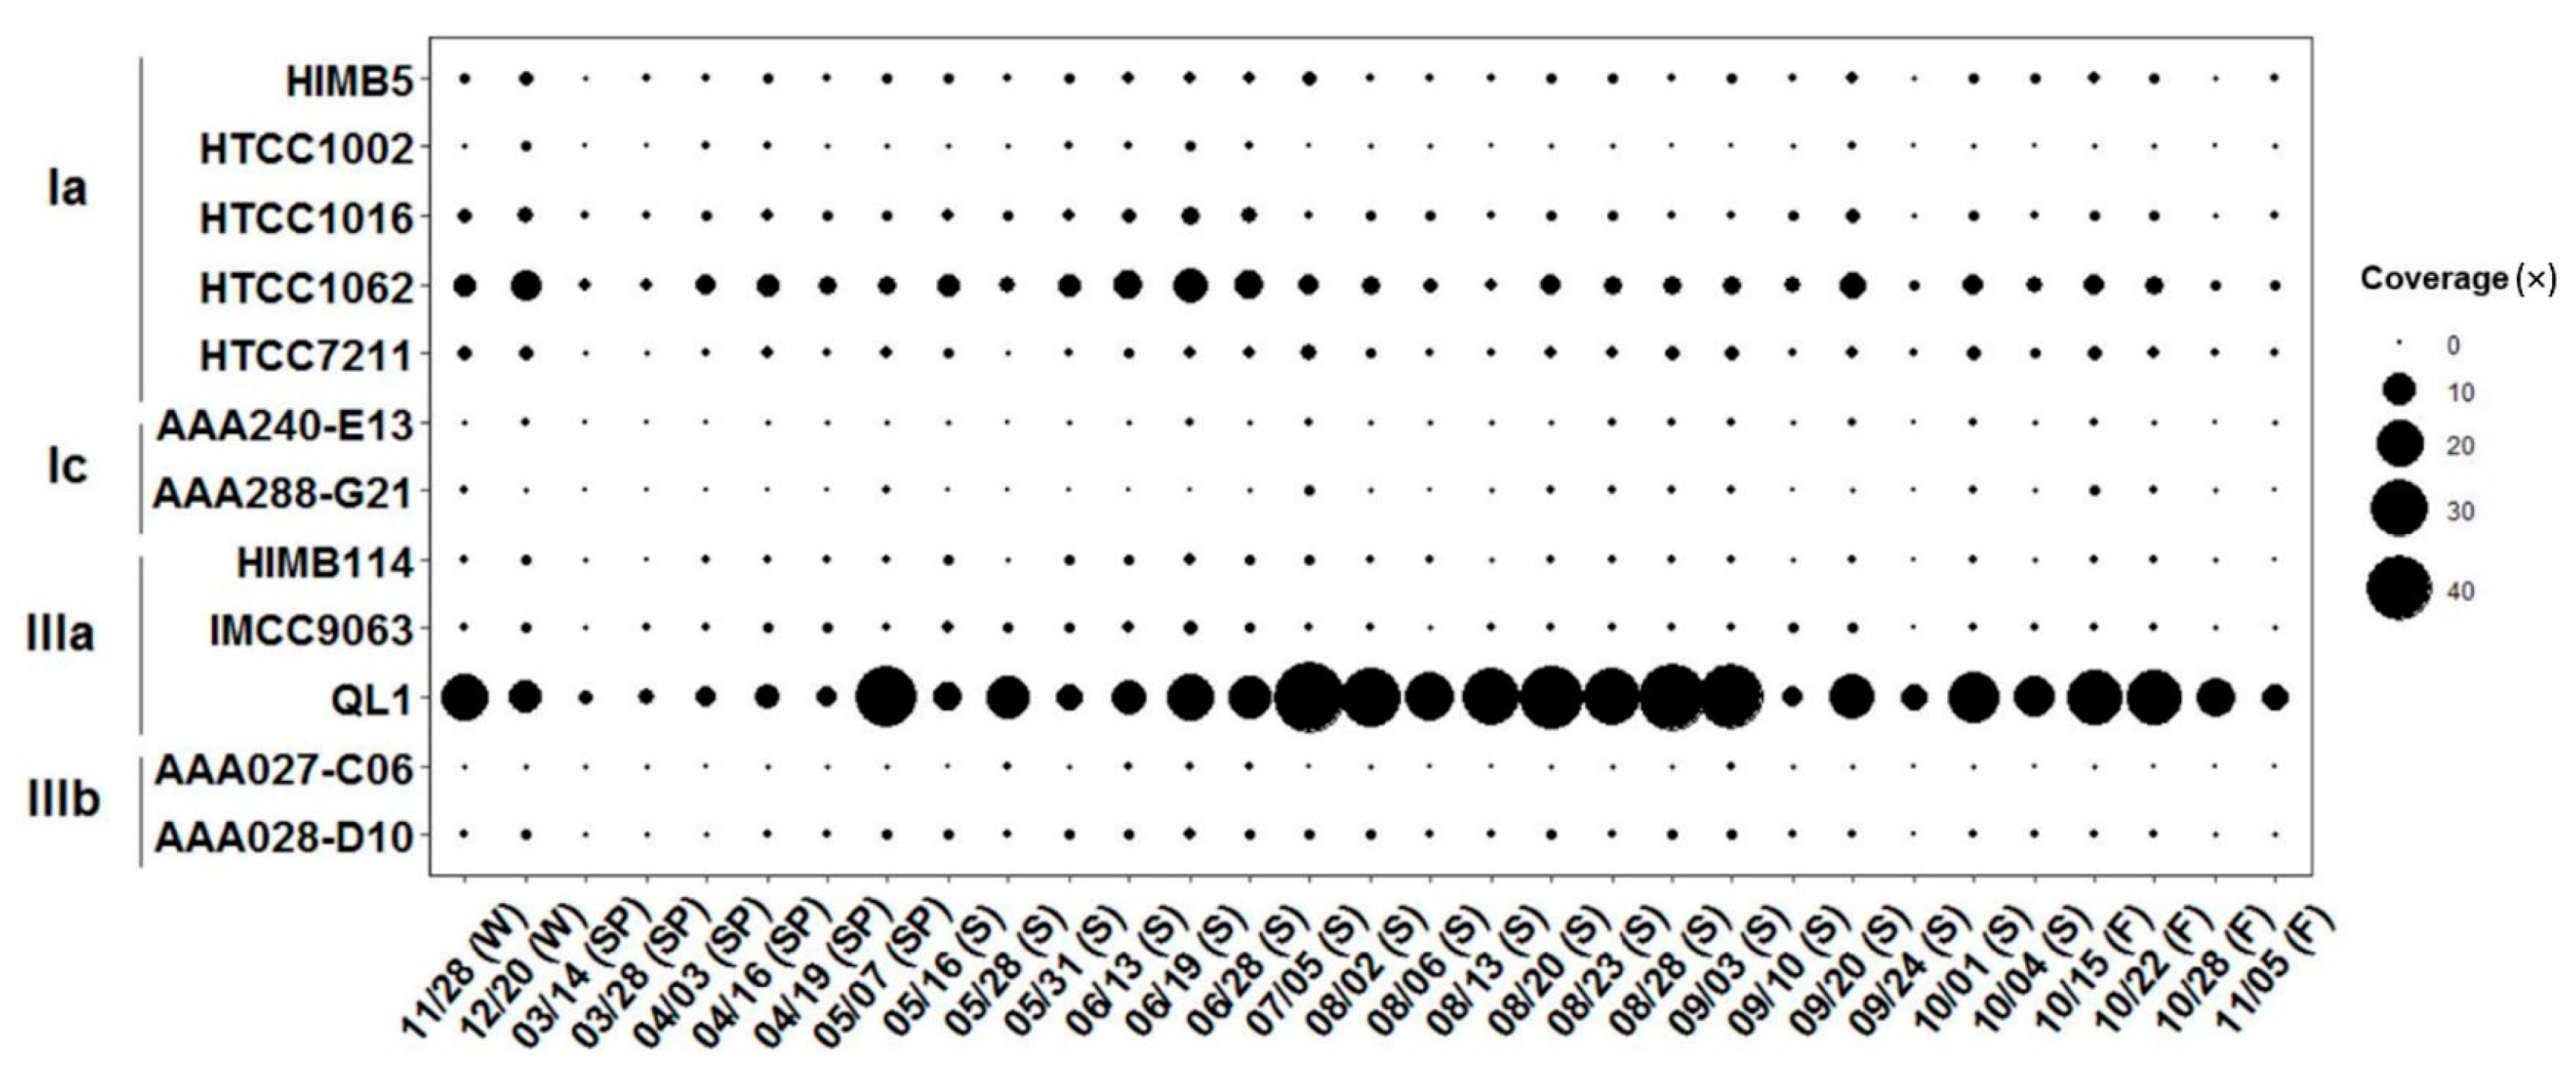
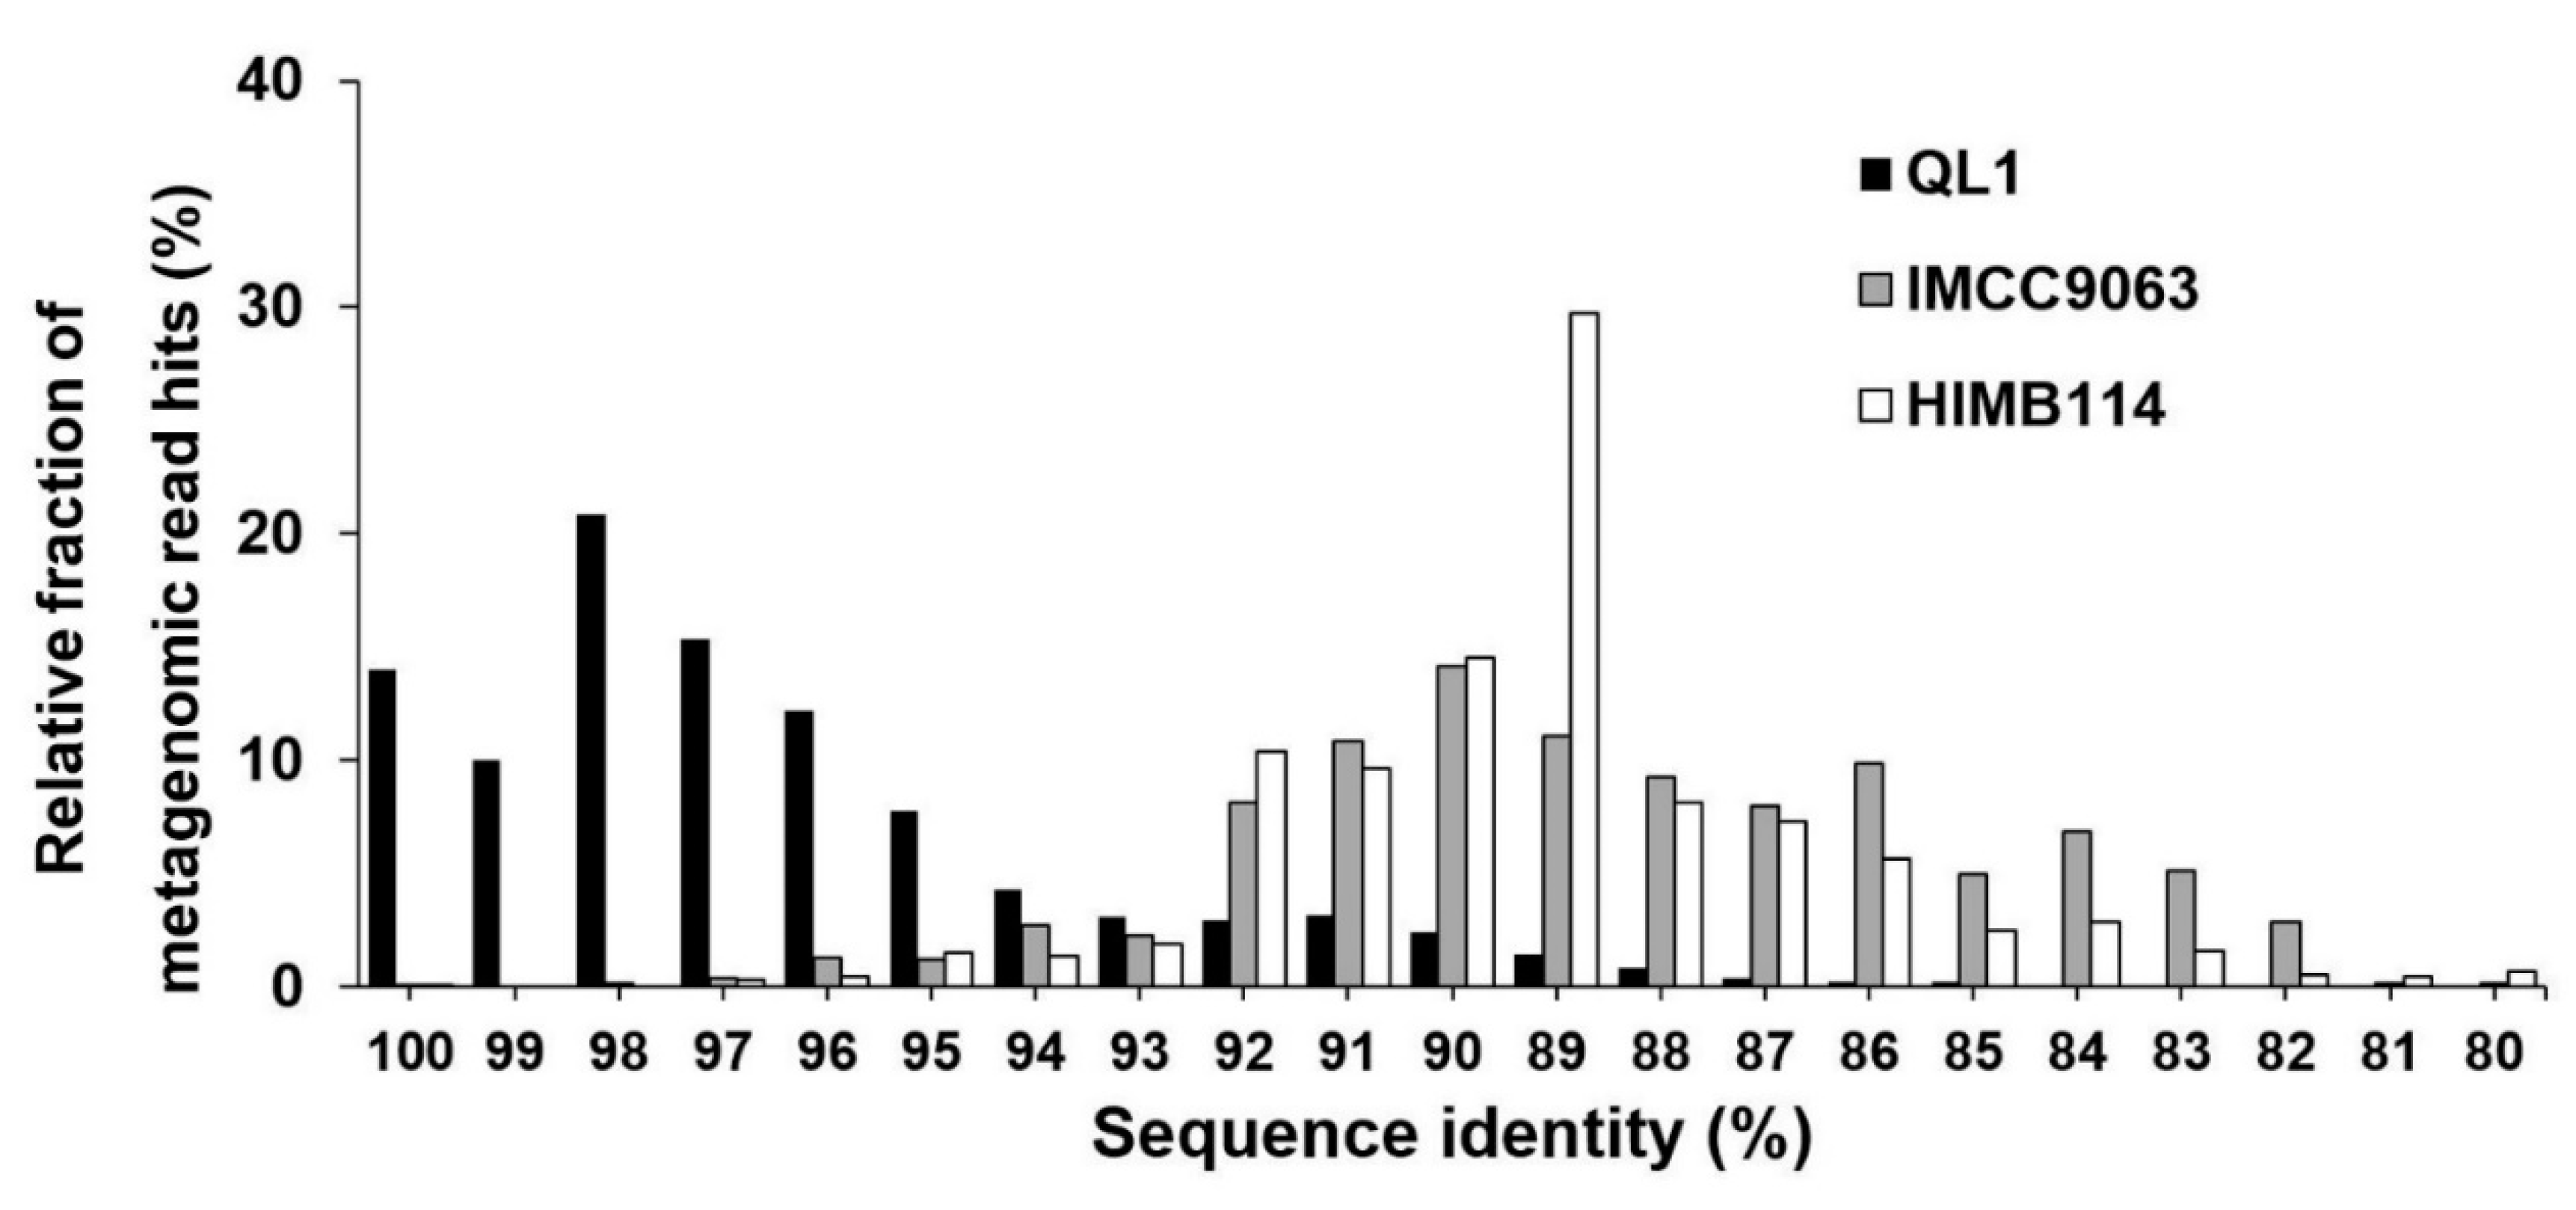
The intra-population structure of the Pelagibacterales was examined further. All metagenomic reads originating from one location (LMO) were mapped using >70% nucleotide identity on the nine single copy gene markers retrieved from the representative SAR11 bacteria. Figure 2 shows the marker gene coverage across the 31 datasets. The coverage of a representative subclade IIIa (QL1) was the highest (18.6 ± 13.2×), followed by subclade Ia populations: HTCC1062 (3.4 ± 2.2×), HTCC7211 (0.9 ± 0.5×), HTCC1016 (0.9 ± 0.6×), HIMB5 (0.7 ± 0.3×), and HTCC1002 (0.2 ± 0.2×). Other SAR11 populations showed less than 0.5× on average. Figure 3 illustrates the relative fraction of the read nucleotide identity (i.e., those mapped on the nine single-copy marker genes) against subclade IIIa (QL1, IMCC9063, and HIMB114). The majority of the reads mapped on HIMB114 and IMCC9063 showed 87–92% nucleotide identity. In contrast to a moderate level of genomic relatedness, the majority of the metagenomic read identity to QL1 was 95–100% (97% on average). It thus appeared that the highly frequently occurring (87% of occurrence frequency) and most abundant (5.3% of average relative abundance) populations in the Baltic Sea surface waters (LMO) were closely genomically related to QL1-like populations.
SAR11 bacteria include four major ecotypes (subclade I, II, IIIa, and IIIb). Among subclade III, IIIb (freshwater LD12) dominates the planktonic microbial communities in some inland waters [31] whereas subclade IIIa (IMCC9063 and HIMB114) were thought to inhabit coastal/oceanic surface waters. Recent works have shown the assembly of metagenomic sequences into genomes, which helps improve the current understanding of the ecology of microorganisms that are hardly cultivable in laboratory settings such as SAR11 bacteria. Our previous work constructed a metagenome-assembled genome (MAG) of a novel SAR11 population, QL1, dominating a mesohaline lacustrine ecosystem on the Tibetan plateau [23,32]. Both 16S rRNA genes and representative single copy genes demonstrated the close genomic relatedness of the core population occurring in the site (LMO) to QL1.
To attempt the recovery of the metagenome-assemble genomes (QL1-like populations), we performed metagenome assembly with several metagenomic datasets that showed high genome coverage of QL1, using IDBA-UD [33] with a range of k-mer from 20 to 100 with a step increase of 20. Genome bins were then obtained based on the metagenome sequence read coverage, occurrence of unique marker genes, and tetranucleotide frequency, using MaxBin as described previously [34]. In contrast to the successful recovery of draft genomes using a similar approach in previous studies [23,32] the genome bins obtained using the metagenomic datasets used in this study showed low genome completeness, unfortunately. Assembling metagenomic data into high-quality genomes can be a complex task, which can be attributable to the inherent biological complexity (e.g., intra-species level genomic diversity and mobile genetic elements) as well as the highly demanding requirement of computer memory [33]. The analysis using housekeeping genes (e.g., more than five) that encode essential cellular functions has become a commonly used tool for determining the phylogenetic and taxonomic relationships among bacteria [35]. The analysis using several housekeeping genes could define clear species boundaries, which has a much higher discrimination power than those using small subunit ribonucleic acid (SSU rRNA) genes (16S rRNA gene) [36]. Further, the results of the analysis was found to be potentially comparable to the whole genome sequencing data [37] and highly correlated to many DNA–DNA hybridization results when assessing the degree of genetic relatedness and gene content conservation at down to intraspecies levels [38]. Hence, although the draft genome recovery of the core population was not successful, both 16S rRNA gene and nine housekeeping genes consistently supported the taxonomic/genomic relatedness of the core population in the Baltic Sea surface waters to the QL1 population, distinguishable from other coastal/marine SAR11 representatives.
3.3. Spatiotemporal Distribution of the QL1-Like Population in the Baltic Sea
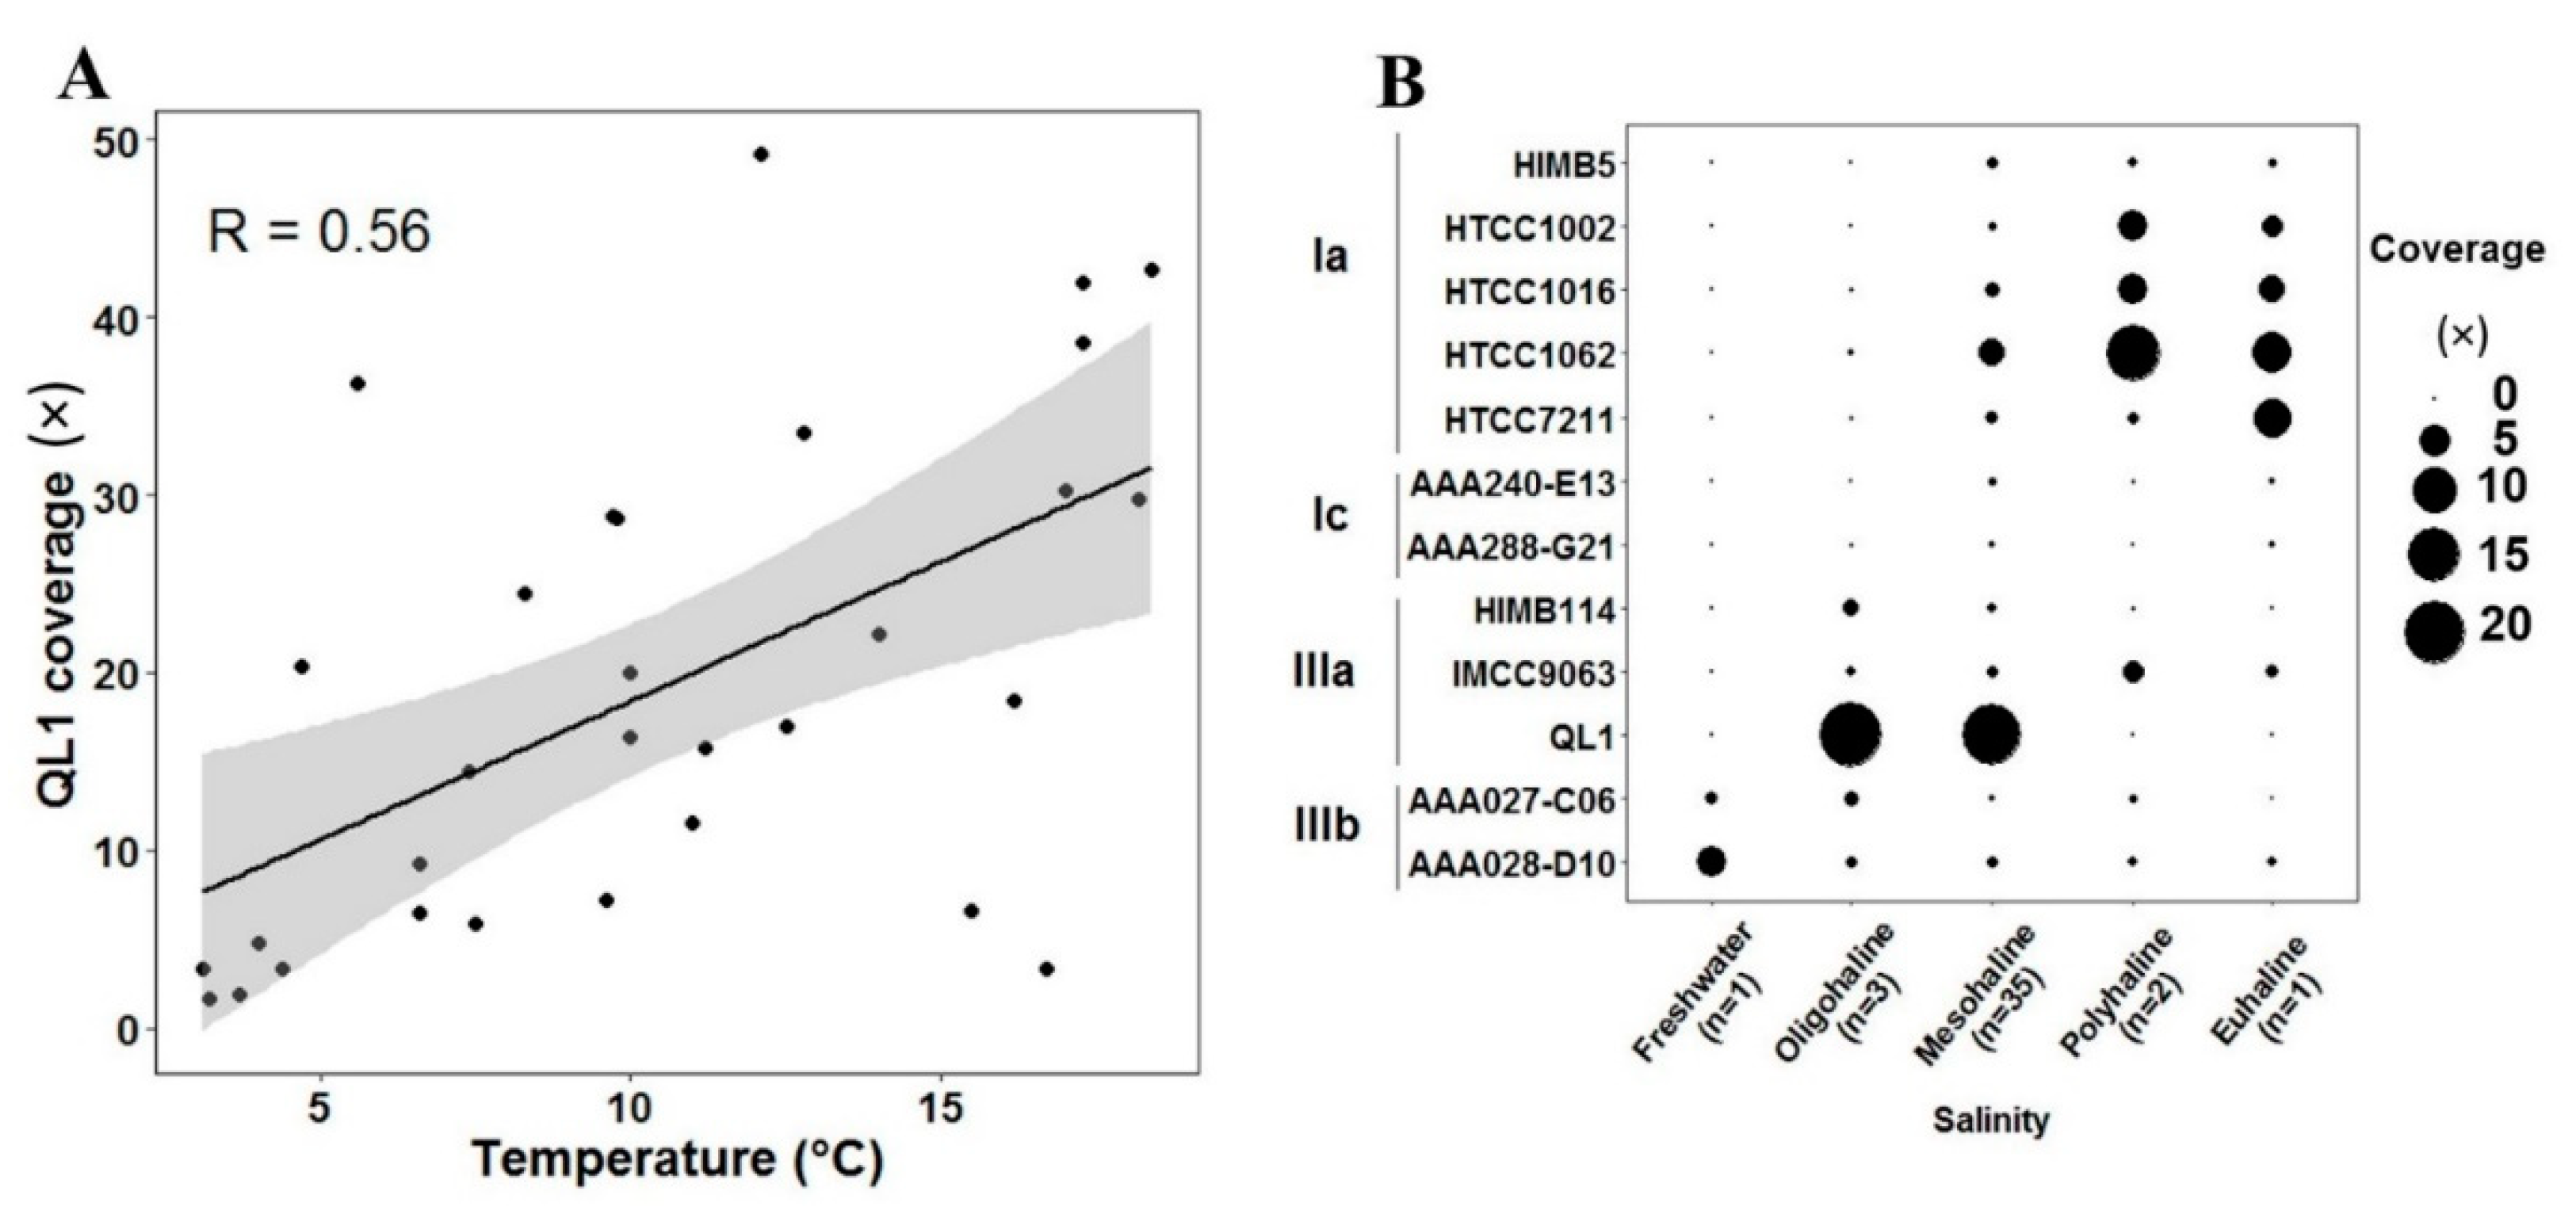
The time-series distribution pattern of the QL1-like population in one same place (LMO) was characterized first. Figure 4 shows the marker gene coverage of the representative SAR11 bacteria over seasons. The temperature in winter and spring (3–7 °C) clearly differed from summer (7–19 °C) (Table S1) in the LMO. Figure S2 shows the seasonal variation of the total SAR11, subclade IIIa, and QL1, respectively, between winter-spring and summer. The total SAR11, subclade IIIa, and QL1 populations were significantly (p < 0.05 by Mann-Whitney U test) enriched in summer. No other SAR11 subclades/species were differentially abundant between the two seasons, suggesting that the differential abundance of the total SAR11 bacteria was attributable to that of subclade IIIa, particularly, QL1. Ordinary least squares regression (OSLR) analysis also suggested that QL1 coverage was positively correlated with the increase of temperature (Pearson correlation = 0.56 with p < 0.05) (Figure 4A).
We next carried out marker gene survey spanning over a wide spatial scale, using other 11 metagenomic datasets (GS659–GS694 and S80704) across 11 sites [3,4], in addition to the 31 datasets (LMO). The sample sites exhibited a salinity gradient range from freshwater to eusaline (up to 32 PSU) (Table S1 and Figure S1). Figure 4B shows the relative abundance of representative SAR11 bacteria along the salinity gradient. Subclade IIIb, IIIa, and Ia showed higher gene coverage (0.9, 2.8, and 2.1×) in the metagenomic datasets originating from freshwater, oligosaline-mesosaline, and polysaline-eusaline water samples, respectively. Herlemann [5] reported the three ecotypes of SAR11 bacteria dominating the freshwater, brackish, and marine environments in the Baltic Sea, using 454 pyrosequencing analysis of partial 16S rRNA gene sequences. Herlemann [5] later could narrow the taxonomic identity of the brackish SAR11 ecotype down to the SAR11 subclade IIIa using catalyzed reporter deposition fluorescence in situ hybridization (CARD-FISH). Dupont [4] also reported the dominance of SAR11 subclade IIIa in the brackish region using metagenomic datasets. The previous metagenomic study reported that the dominant IIIa population shares moderate-level genomic relatedness to a SAR11 IIIa representative (IMCC9063) with 70–80% nucleotide identity [4,5,6]. Since the genomic relatedness was far below 95% of average nucleotide identity often used for the current bacterial species demarcation [38], the metagenomic finding implied the presence of a novel SAR11 species in the oligosaline-mesosaline waters, closely related to Subclade IIIa, despite the unclear taxonomic identity of the population at the moment. The present work clearly showed high genomic relatedness (>95%) between the core SAR11 population and QL1 (Figure 3), revealing that the subclade IIIa population with seasonal fluctuations that dominate over the wide brackish surface areas of the Baltic Sea was a QL1-like population. A complete genome sequence of SAR11 reported recently [39] was not included in this analysis. Nevertheless, our conclusion on the dominance of the subclade IIIa population on the Baltic Sea surface waters would not be affected, since the organism that was whole-genome sequenced recently is clearly a member of subclade IIIb [39].
16S rRNA gene-based surveys reported that the QL1-like population is globally found in various marine and lacustrine environments [31]. In particular, a recent study revealed the dominance of the QL1-like population (>95% genomic relatedness) in the Caspian Sea [40], in addition to other brackish waters globally distributed (e.g., the Baltic Sea, Chesapeake Bay, Delaware Bay, Lake Nam Co, and Lake Qinghai) [23,31,41,42]. Metagenomics uncovered distinct features in phylogenetic diversity and gene content between freshwater and oceanic communities [43]. Taking the finding one step further, the present and other studies [3,5] collectively support the hypothesis that brackish waters exert strong selective pressure shaping community assembly, including selective enrichment of core populations (e.g., QL1) that are frequently occurring and highly abundant.
In the present study, our metagenomic analysis (e.g., using the hypervariable region of SSU rRNA gene and many single-copy housekeeping genes) revealed a SAR11 species population in the Baltic Sea. This study provided the atlas (i.e., brackish waters) of the population noticeably conserved over the Baltic Sea surface waters and revealed that the population was the key driver causing the seasonal shifts in the SAR11 community structure at higher taxonomic levels (e.g., the total SAR11 clade and the subclade IIIa). The results of this study thus can help researchers focus on the core member persistent in the given habitat, which is thought to be tightly linked to the resilience and function of the ecosystem, rather than temporary and instable members. However, we still lack the understanding of how the population ecologically sustain the ecosystem functioning and health, therefore suggesting further studies particularly focusing on the gene content/expression and ecological role of the core community. For example, what metabolism genes/proteins constitute the functions of the core community and how much essential the degree/redundancy of the functions is for maintaining the ecosystem functioning and health and recovering from external perturbations such as local and global environmental stressors. Although cultivating SAR11 bacteria in laboratory settings were thought to be extremely difficult, the successful cultivation of SAR11 bacteria using a distinction-to-extinction method has emerged [39]. We therefore suggest future isolation of more representative SAR11 ecotypes persistent in the brackish waters and their genomic, transcriptomic, and phenotypic characterizations in relation to their ecological attributes. Ecological insight into the core community can be enriched by multi-omics techniques that can assess in situ activities, which will help expand our understanding beyond the taxonomically characterized identity to the ecosystem functioning/resilience. The genomic, transcriptomic, and phenotypic findings will also advance the current understanding of the distinct evolutionary path (i.e., ecological specialization of the brackish condition) undertaken by the brackish bacteria and allow a more systematic assessment of their roles in the local and global brackish ecosystems.
Supplementary Materials
The following are available online at https://www.mdpi.com/2073-4441/12/2/501/s1, Table S1: Metagenomic datasets used in this study, Table S2: Taxonomic affiliation of core OTUs at family level, Figure S1: Sampling location associated with metagenomic datasets used in this study, Figure S2: Seasonal variation in relative abundance of SAR11 populations.
Author Contributions
S.O. and S.-O.K. conceived and designed the research. P.W.V. and S.O. performed data analyses and wrote the manuscript. All authors have read and agreed to the published version of the manuscript.
Funding
This work was supported by a National Research Foundation of Korea (NRF) grant (NRF-2019R1A2C2007820).
Acknowledgments
Poorna Weerarathna Vidanage was supported by a start-up grant (to Seungdae Oh) and NTU research scholarship from Nanyang Technological University.
Conflicts of Interest
The authors declare no competing interests.
References
- Lindh, M.V.; Sjöstedt, J.; Andersson, A.F.; Baltar, F.; Hugerth, L.W.; Lundin, D.; Muthusamy, S.; Legrand, C.; Pinhassi, J. Disentangling seasonal bacterioplankton population dynamics by high-frequency sampling. Environ. Microbiol. 2015, 17, 2459–2476. [Google Scholar] [CrossRef] [PubMed]
- Andersson, A.F.; Riemann, L.; Bertilsson, S. Pyrosequencing reveals contrasting seasonal dynamics of taxa within Baltic Sea bacterioplankton communities. ISME J. 2010, 4, 171–181. [Google Scholar] [CrossRef] [PubMed] [Green Version]
- Hugerth, L.W.; Larsson, J.; Alneberg, J.; Lindh, M.V.; Legrand, C.; Pinhassi, J.; Andersson, A.F. Metagenome-assembled genomes uncover a global brackish microbiome. Genome Biol. 2015, 16, 279. [Google Scholar] [CrossRef] [PubMed] [Green Version]
- Dupont, C.L.; Larsson, J.; Yooseph, S.; Ininbergs, K.; Goll, J.; Asplund-samuelsson, J.; McCrow, J.P.; Celepli, N.; Allen, L.Z.; Ekman, M.; et al. Functional Tradeoffs Underpin Salinity-Driven Divergence in Microbial Community Composition. PLoS ONE 2014, 9, e89549. [Google Scholar] [CrossRef] [PubMed]
- Herlemann, D.P.R.; Labrenz, M.; Ju, K.; Bertilsson, S.; Waniek, J.J.; Andersson, A.F. Transitions in bacterial communities along the 2000 km salinity gradient of the Baltic Sea. ISME J. 2011, 5, 1571–1579. [Google Scholar] [CrossRef] [PubMed] [Green Version]
- Herlemann, D.P.R.; Woelk, J.; Labrenz, M.; Jürgens, K. Diversity and abundance of “Pelagibacterales” (SAR11) in the Baltic Sea salinity gradient. Syst. Appl. Microbiol. 2014, 37, 601–604. [Google Scholar] [CrossRef] [Green Version]
- Ininbergs, K.; Bergman, B.; Larsson, J.; Ekman, M. Microbial metagenomics in the Baltic Sea : Recent advancements and prospects for environmental monitoring. Ambio 2015, 44, 439–450. [Google Scholar] [CrossRef] [Green Version]
- Hutchins, D.A.; Fu, F. Microorganisms and ocean global change. Nat. Microbiol. 2017, 2, 17058. [Google Scholar] [CrossRef]
- Shade, A.; Handelsman, J. Beyond the Venn diagram : The hunt for a core microbiome. Environ. Microbiol. 2012, 14, 4–12. [Google Scholar] [CrossRef]
- Giovannoni, S.J. SAR11 Bacteria : The Most Abundant Plankton in the Oceans. Ann. Rev. Mar. Sci. 2017, 9, 1–25. [Google Scholar] [CrossRef]
- Cox, M.P.; Peterson, D.A.; Biggs, P.J. SolexaQA: At-a-glance quality assessment of Illumina second-generation sequencing data. BMC Bioinformatics 2010, 11, 485. [Google Scholar] [CrossRef] [PubMed] [Green Version]
- Oh, S.; Hammes, F.; Liu, W. Metagenomic characterization of biofilter microbial communities in a full-scale drinking water treatment plant. Water Res. 2018, 128, 278–285. [Google Scholar] [CrossRef] [PubMed]
- Huse, S.M.; Mark Welch, D.B.; Voorhis, A.; Shipunova, A.; Morrison, H.G.; Eren, A.M.; Sogin, M.L. VAMPS: A website for visualization and analysis of microbial population structures. BMC Bioinformatics 2014, 15, 41. [Google Scholar] [CrossRef] [PubMed] [Green Version]
- Kozich, J.J.; Westcott, S.L.; Baxter, N.T.; Highlander, S.K.; Schloss, P.D. Development of a Dual-Index Sequencing Strategy and Curation Pipeline for Analyzing Amplicon Sequence Data on the MiSeq. Appl. Environ. Microbiol. 2013, 79, 5112–5120. [Google Scholar] [CrossRef] [Green Version]
- Oh, S.; Choi, D. Microbial Community Enhances Biodegradation of Bisphenol A Through Selection of Sphingomonadaceae. Microb. Ecol. 2018, 77, 631–639. [Google Scholar] [CrossRef]
- Mai, D.T.; Stuckey, D.C.; Oh, S. Effect of ciprofloxacin on methane production and anaerobic microbial community. Bioresour. Technol. 2018, 261, 240–248. [Google Scholar] [CrossRef]
- Edgar, R.C. Search and clustering orders of magnitude faster than BLAST. Bioinformatics 2010, 26, 2460–2461. [Google Scholar] [CrossRef] [Green Version]
- He, F.; Gaston, K.J.; Wu, J. On species occupancy-abundance models. Eco Sci. 2002, 9, 119–126. [Google Scholar] [CrossRef]
- Pinto, A.J.; Schroeder, J.; Lunn, M.; Raskin, L. Spatial-Temporal Survey and Occupancy-Abundance Modeling To Predict Bacterial Community Dynamics in the Drinking Water Microbiome. MBio 2014, 5, e01135-14. [Google Scholar] [CrossRef] [Green Version]
- Albertsen, M.; Hugenholtz, P.; Skarshewski, A.; Nielsen, K.L.; Tyson, G.W.; Nielsen, P.H. Genome sequences of rare, uncultured bacteria obtained by differential coverage binning of multiple metagenomes. Nat. Biotechnol. 2013, 31, 533–538. [Google Scholar] [CrossRef]
- Thompson, J.D.; Higgins, D.G.; Gibson, T.J. CLUSTAL W: Improving the sensitivity of progressive multiple sequence alignment through sequence weighting, position-specific gap penalties and weight matrix choice. Nucleic Acids Res. 1994, 22, 4673–4680. [Google Scholar] [CrossRef] [PubMed] [Green Version]
- Oh, S.; Yoo, D.; Liu, W. Metagenomics Reveals a Novel Virophage Population in a Tibetan Mountain Lake. Microbes Environ. 2016, 31, 173–177. [Google Scholar] [CrossRef] [PubMed] [Green Version]
- Oh, S.; Zhang, R.; Wu, Q.L.; Liu, W.T. Evolution and adaptation of SAR11 and Cyanobium in a saline Tibetan lake. Environ. Microbiol. Rep. 2016, 8, 595–604. [Google Scholar] [CrossRef] [PubMed]
- Oh, S.; Yap, G.C.; Hong, P.; Huang, C.; Aw, M.M.; Shek, L.P.; Liu, W.; Lee, B.W. Immune-modulatory genomic properties differentiate gut microbiota of infants with and without eczema. PLoS ONE 2017, 12, e0184955. [Google Scholar] [CrossRef] [Green Version]
- Ehrlén, J.; Morris, W.F. Predicting changes in the distribution and abundance of species under environmental change. Ecol. Lett. 2015, 18, 303–314. [Google Scholar] [CrossRef] [PubMed]
- Hanski, I. Dynamics of Regional Distribution : The Core and Satellite Species Hypothesis. Oikos 1982, 38, 210–221. [Google Scholar] [CrossRef]
- Lindh, M.V.; Sjostedt, J.; Ekstam, B.; Casini, M.; Lundin, D.; Hugerth, L.W.; Hu, Y.O.O.; Andersson, A.F.; Andersson, A.; Legrand, C.; et al. Metapopulation theory identifies biogeographical patterns among core and satellite marine bacteria scaling from tens to thousands of kilometers. Environ. Microbiol. 2017, 19, 1222–1236. [Google Scholar] [CrossRef] [Green Version]
- Ju, F.; Zhang, T. Bacterial assembly and temporal dynamics in activated sludge of a full-scale municipal wastewater treatment plant. ISME J. 2015, 9, 683–695. [Google Scholar] [CrossRef]
- Huse, S.M.; Dethlefsen, L.; Huber, J.A.; Welch, D.M.; Relman, D.A.; Sogin, M.L. Exploring microbial diversity and taxonomy using SSU rRNA hypervariable tag sequencing. PLoS Genet. 2008, 4. [Google Scholar] [CrossRef]
- Sweet, M.J.; Bulling, M.T. On the Importance of the Microbiome and Pathobiome in Coral Health and Disease. Front. Mar. Sci. 2017, 4, 1–11. [Google Scholar] [CrossRef] [Green Version]
- Zaremba-Niedzwiedzka, K.; Viklund, J.; Zhao, W.; Ast, J.; Sczyrba, A.; Woyke, T.; McMahon, K.; Bertilsson, S.; Stepanauskas, R.; Andersson, S.G.E. Single-cell genomics reveal low recombination frequencies in freshwater bacteria of the SAR11 clade. Genome Biol. 2013, 14, R130. [Google Scholar] [CrossRef] [PubMed]
- Oh, S.; Zhang, R.; Wu, Q.L.; Liu, W.-T. Draft Genome Sequence of a Novel SAR11 Clade Species Abundant in a Tibetan Lake. Genome Announc. 2014, 2, e01137-14. [Google Scholar] [CrossRef] [PubMed] [Green Version]
- Peng, Y.; Leung, H.C.M.; Yiu, S.M.; Chin, F.Y.L. IDBA-UD: A de novo assembler for single-cell and metagenomic sequencing data with highly uneven depth. Bioinformatics 2012, 28, 1420–1428. [Google Scholar] [CrossRef] [PubMed] [Green Version]
- Wu, Y.-W.; Tang, Y.-H.; Tringe, S.G.; Simmons, B.A.; Singer, S.W. MaxBin: An automated binning method to recover individual genomes from metagenomes using. Microbiome 2014, 2, 4904–4909. [Google Scholar] [CrossRef] [Green Version]
- Sangwan, N.; Xia, F.; Gilbert, J.A. Recovering complete and draft population genomes from metagenome datasets. Microbiome 2016, 4, 1–11. [Google Scholar] [CrossRef] [PubMed] [Green Version]
- Glaeser, S.P.; Kämpfer, P. Multilocus sequence analysis (MLSA) in prokaryotic taxonomy. Syst. Appl. Microbiol. 2015, 38, 237–245. [Google Scholar] [CrossRef]
- Patiño, L.H.; Camargo, M.; Muñoz, M.; Ríos-Chaparro, D.I.; Patarroyo, M.A.; Ramírez, J.D. Unveiling the multilocus sequence typing (MLST) schemes and core genome phylogenies for genotyping chlamydia trachomatis. Front. Microbiol. 2018, 9, 1–16. [Google Scholar] [CrossRef]
- Oh, S.; Buddenborg, S.; Yoder-Himes, D.R.; Tiedje, J.M.; Konstantinidis, K.T. Genomic Diversity of Escherichia Isolates from Diverse Habitats. PLoS ONE 2012, 7, e47005. [Google Scholar] [CrossRef] [PubMed] [Green Version]
- Henson, M.W.; Lanclos, V.C.; Faircloth, B.C.; Thrash, J.C.; Michael Winslow Henson, V. Celeste Lanclos, Brant, C.; Faircloth, J.C.T. Cultivation and genomics of the first freshwater SAR11 (LD12) isolate. ISME J. 2018, 11, 1–15. [Google Scholar] [CrossRef] [Green Version]
- Richter, M.; Rossello, R. Shifting the genomic gold standard for the prokaryotic species definition. PNAS 2009, 106, 19126–19131. [Google Scholar] [CrossRef] [PubMed] [Green Version]
- Mehrshad, M.; Amoozegar, M.A.; Ghai, R.; Shahzadeh Fazeli, S.A.; Rodriguez-valera, F.; Amoozegar, A.; Ghai, R.; Shahzadeh, A.; Rodriguez-valera, F. Genome Reconstruction from Metagenomic Data Sets Reveals Novel Microbes in the Brackish Waters of the Caspian Sea. Appl. Environ. Microbiol. 2016, 82, 1599–1612. [Google Scholar] [CrossRef] [PubMed] [Green Version]
- Shaw, A.K.; Halpern, A.L.; Beeson, K.; Tran, B.; Venter, J.C.; Martiny, J.B.H. It ’ s all relative : Ranking the diversity of aquatic bacterial communities. Environ. Microbiol. 2008, 10, 2200–2210. [Google Scholar] [CrossRef] [PubMed]
- Zhang, R.; Wu, Q.; Piceno, Y.M.; Desantis, T.Z.; Saunders, F.M.; Andersen, G.L.; Liu, W.T. Diversity of bacterioplankton in contrasting Tibetan lakes revealed by high-density microarray and clone library analysis. FEMS Microbiol. Ecol. 2013, 86, 277–287. [Google Scholar] [CrossRef] [PubMed] [Green Version]
Figure 1.
Mathematical modeling for the occurrence frequency and abundance of OTUs. (A) Model simulations, using the Nachman, Hanski-Gyllenberg, and Power model are shown. (B) Number of OTUs in relation to occurrence frequency. (C) Average relative abundance of three arbitrary groups: core (occurrence frequency > 80% with red color), intermittent (20–80% with black color), and transient (<20% with blue color).

Figure 2.
Temporal variation of representative SAR11 bacteria. The circle size represents the relative coverage over the seasons: spring (SP), summer (S), fall (F), and winter (W).
Figure 2.
Temporal variation of representative SAR11 bacteria. The circle size represents the relative coverage over the seasons: spring (SP), summer (S), fall (F), and winter (W).

Figure 3.
Intrapopulation structure of subclade IIIa. Relative fraction (y-axis) is shown at a given unit of nucleotide identity (x-axis) among the total metagenomic reads mapped on each set of marker genes (QL1, IMCC9063, and HIMB114).
Figure 3.
Intrapopulation structure of subclade IIIa. Relative fraction (y-axis) is shown at a given unit of nucleotide identity (x-axis) among the total metagenomic reads mapped on each set of marker genes (QL1, IMCC9063, and HIMB114).

Figure 4.
Spatiotemporal variation of SAR11 populations. (A) Correlation of relative QL1 abundance with temperature. (B) Relative abundance of representative SAR11 bacteria along the salinity gradient over the Baltic Sea surface waters: freshwater (<0.5 PSU), oligosaline (0.5–5), mesosaline (5–18), polysaline, (18–30), and eusaline (>30). The number of datasets used is shown in parentheses.


Table 1.
Modelling parameters for the occupancy-abundance relationship.
| Model | Equation | Parameter | Maximum Likelihood | Sum of Absolute Difference |
|---|---|---|---|---|
| Nachman | α = 23.40 β = 0.82 | −1523.26 | 8.0692 | |
| Hanski-Gyllenberg | α = 115.59 β = 1.10 | −1529.98 | 11.5658 | |
| Power | α = 4.24 β = 0.48 | −1469.07 | 28.6076 | |
| Poisson | NA | −417.73 | 44.5245 | |
| Negative Binomial | −359.75 | 46.5086 |
© 2020 by the authors. Licensee MDPI, Basel, Switzerland. This article is an open access article distributed under the terms and conditions of the Creative Commons Attribution (CC BY) license (http://creativecommons.org/licenses/by/4.0/).
Share and Cite
MDPI and ACS Style
Vidanage, P.W.; Ko, S.-O.; Oh, S. Metagenomics Uncovers a Core SAR11 Population in Brackish Surface Waters of the Baltic Sea. Water 2020, 12, 501. https://doi.org/10.3390/w12020501
AMA Style
Vidanage PW, Ko S-O, Oh S. Metagenomics Uncovers a Core SAR11 Population in Brackish Surface Waters of the Baltic Sea. Water. 2020; 12(2):501. https://doi.org/10.3390/w12020501
Chicago/Turabian StyleVidanage, Poorna Weerarathna, Seok-Oh Ko, and Seungdae Oh. 2020. "Metagenomics Uncovers a Core SAR11 Population in Brackish Surface Waters of the Baltic Sea" Water 12, no. 2: 501. https://doi.org/10.3390/w12020501
Note that from the first issue of 2016, this journal uses article numbers instead of page numbers. See further details here.