Rainfall Event–Duration Thresholds for Landslide Occurrences in China

1
Nansen-Zhu International Research Centre, Institute of Atmospheric Physics, Chinese Academy of Sciences, Beijing 100029, China
2
Collaborative Innovation Center on Forecast and Evaluation of Meteorological Disasters/Key Laboratory of Meteorological Disaster, Ministry of Education, Nanjing University of Information Science and Technology, Nanjing 210044, China
*
Author to whom correspondence should be addressed.
Water 2020, 12(2), 494; https://doi.org/10.3390/w12020494
Submission received: 13 November 2019
/
Revised: 8 February 2020
/
Accepted: 8 February 2020
/
Published: 12 February 2020
(This article belongs to the Special Issue Rainfall Thresholds and Other Approaches for Landslide Prediction and Early Warning)
Abstract
:A rainfall threshold for landslide occurrence at a national scale in China has rarely been developed in the early warning system for landslides. Based on 771 landslide events that occurred in China during 1998–2017, four groups of rainfall thresholds at different quantile levels of the quantile regression for landslide occurrences in China are defined, which include the original rainfall event–duration (E–D) thresholds and normalized (the accumulated rainfall is normalized by mean annual precipitation) (EMAP–D) rainfall thresholds based on the merged rainfall and the Climate Prediction Center Morphing technique (CMORPH) rainfall products, respectively. Each group consists of four sub-thresholds in rainy season and non-rainy season, and both are divided into short duration (<48 h) and long duration (≥48 h). The results show that the slope of the regression line for the thresholds in the events with long durations is larger than that with short durations. In addition, the rainfall thresholds in the non-rainy season are generally lower than those in the rainy season. The E–D thresholds defined in this paper are generally lower than other thresholds in previous studies on a global scale, and a regional or national scale in China. This might be due to there being more landslide events used in this paper, as well as the combined effects of special geological environment, climate condition and human activities in China. Compared with the previous landslide model, the positive rates of the rainfall thresholds for landslides have increased by 16%–20%, 10%–17% and 20%–38% in the whole year, rainy season and non-rainy season, respectively.
1. Introduction
Landslides are one of the most devastating geo-hazards that cause heavy casualties and great economic losses around the world every year. China is one of the countries that are most prone to landslides due to its geological, geomorphological and climate conditions [1,2]. According to the National Geological Disaster Bulletin issued by the Ministry of Natural Resources of the People’s Republic of China from 2007 to 2016, an average of 762 people are reported dead or missing per year due to landslides, debris flows and other geological disasters, resulting in direct economic losses of 4.2 billion Chinese yuan. Since precipitation is the main trigger factor for landslides, the frequency and intensity changes of precipitation, which are caused by the global warming [3], will probably lead to an increase in the potential occurrence of landslides in the future [4,5,6]. In addition, as China is currently experiencing economic booming and developing rapidly, the early warning of landslides is crucial in China.
Rainfall thresholds can be used to predict the possible occurrence of slope failures in an area [7]. Currently, many countries and regions have developed the early warning systems (EWSs) based on rainfall thresholds to provide geological hazard information for the public [8,9,10].
By using the global rainfall threshold, combined with the landslide and debris flow susceptibility in China, a real-time EWS has been established for landslides and debris flows in China [11]. The EWS was verified by using 106 events in China during 2016–2017, and the results showed that the early or delayed warning is effective for 69% of the total events, while 72% of landslide events in the rainy season (May to September) can be warned, but only 35% of landslide events in the non-rainy season can be warned in advance. Some landslide events which did not reach the critical value of rainfall triggering the landslide and debris flow cannot be predicted, which may be due to the fact that these rainfall thresholds are not applied for China [12]. Thus, it is necessary to establish rainfall thresholds suitable for China to improve the positive prediction rate for landslides.
In fact, some rainfall thresholds have been developed in China, but most of them were established with few events or just suitable for specific areas. For example, Huang et al. (2015) have calculated the rainfall thresholds with 50 landslide events in Huangshan region of Anhui Province [13]. Zhou and Tang (2013) have defined a rainfall threshold with 11 rainfall events inducing debris flows in the Wenchuan earthquake-stricken area in Sichuan Province [14]. Li et al. (2017) have established a rainfall intensity–duration threshold in China, but only with 60 landslide events happening during 2005–2011 [15]. By far, few studies have used a large amount of historical data of landslides to establish rainfall thresholds in China.
Rainfall thresholds can be established by using both physical and empirical methods. Rainfall infiltrates into the slope and changes the pore water pressure, reducing the shear stress and thus may result in the slope failure [16]. Based on the physical methods, these physical processes can be analyzed and the critical value of rainfall can be calculated out [17,18]. However, such methods require an extensive data collection of geological information that requires high spatial resolution, so it’s not feasible for threshold calculation at large regional or global scales [19]. Based on the rainfall information of historical landslide events, the empirical methods can determine the low boundary with statistical methods for the rainfall conditions that result in slope failures. Several statistical methods have been applied to obtain the rainfall thresholds, such as Bayesian statistics [20], logistical regression [21], confidence level [22] and quantile regression [23,24]. Thus, the empirical methods are more suitable for larger areas.
Guzzetti et al. (2008) have classified the rainfall thresholds into four categories: (i) rainfall intensity–duration (I–D) thresholds, (ii) thresholds based on the total rainfall of the events, (iii) rainfall event–duration (E–D) thresholds and (iv) rainfall event–intensity (E–I) thresholds [25]. The I–D and E–D thresholds are the most commonly, world-widely used among them. The E–D thresholds are equivalent to the I–D thresholds, while the E–D thresholds can avoid unnecessary conversions. Therefore, the E–D thresholds are selected in this paper.
This paper aims to calculate the E–D and normalized (the accumulated rainfall is normalized by mean annual precipitation, MAP) (EMAP–D) thresholds in the whole of China, and to validate the thresholds for early warning of landslides. A landslide inventory with more landslide events covering the whole region of China will be used. The rest of this paper is organized as follows. Section 2 describes the landslides inventory, rainfall dataset and quantile regression method to calculate the rainfall thresholds, and the thresholds established in this study are shown in Section 3. In Section 4, the thresholds defined in this paper are compared with the existed thresholds and validated with those from the previous analysis [11]. Finally, the main conclusions are summarized in Section 5.
2. Data and Methods
2.1. Landslide Inventory
The landslide information is obtained from four sources: (i) China Geological Environment Information site (http://www.cigem.cgs.gov.cn/), which provide the reports of geological disasters occurred in China; (ii) a global landslide catalog developed by Kirschbaum et al. (2015 [1]), available at https://catalog.data.gov/dataset/global-landslide-catalog-export; (iii) literatures including annual reports published by related institutions and/or government departments and local news report related to landslides, and (iv) other reports online. 771 landslide events were collected in a period covering 20 years from 1998 to 2017.
For each landslide, the corresponding information includes location, time, type of failure and triggering reason. Not all of this information is complete for every single event, i.e., some information is unknown. There are four kinds of spatial resolutions with the collected landslide events, namely, S1—province, S2—prefecture-level region, S3—county or district, and S4—town, village, country or site. As is shown in Table 1, 24 landslides (accounting for 3.1% of the total landslide events) are collected at the resolution of S1, 87 (11.3%) at S2, 286 (37.1%) at S3 and 374 (48.5%) at S4. In addition, there are also two kinds of temporal resolutions with the collected data, which are T1—the occurrence dates for 623 (80.8%) landslide events are known, and T2—the occurrence time (hour) for 148 (19.2%) landslide events are known.
In addition, information about the landslide types is also collected, which can be classified into debris-flow, rock fall and generic shallow landslide. Usually the mechanisms among them are considered to be similar, but in fact, it’s not easy to distinguish them clearly, because sometimes the report uses imprecise language to describe the landslides. Thus, most of them are classified as generic shallow landslides (581, 75.36%). In fact, whether the landslide occurs for the first time or reactivates is very important in the landslide prediction, because the corresponding geological conditions would definitely change after the slope failure occurred. However, the collected landslide information does not contain this specific information, and the landslide model used here cannot simulate those processes. So, this paper mainly concentrates on the rainfall thresholds, and only the shallow landslides which occurred at the first time are considered. The above information of landslide inventory is listed in Table 1, including the number of landslide events with different spatio-temporal resolutions and landslide types in each year.
Landslide events used to reconstruct the rainfall thresholds are selected based on criteria as follows: (i) the location of the landslide has a spatial resolution of S3 or higher; (ii) the occurrence time of the landslide is known at least with a daily resolution (T1). The landslides which are not triggered by rainfall are excluded. Based on these requirements, 660 landslide events are selected to construct the rainfall thresholds.
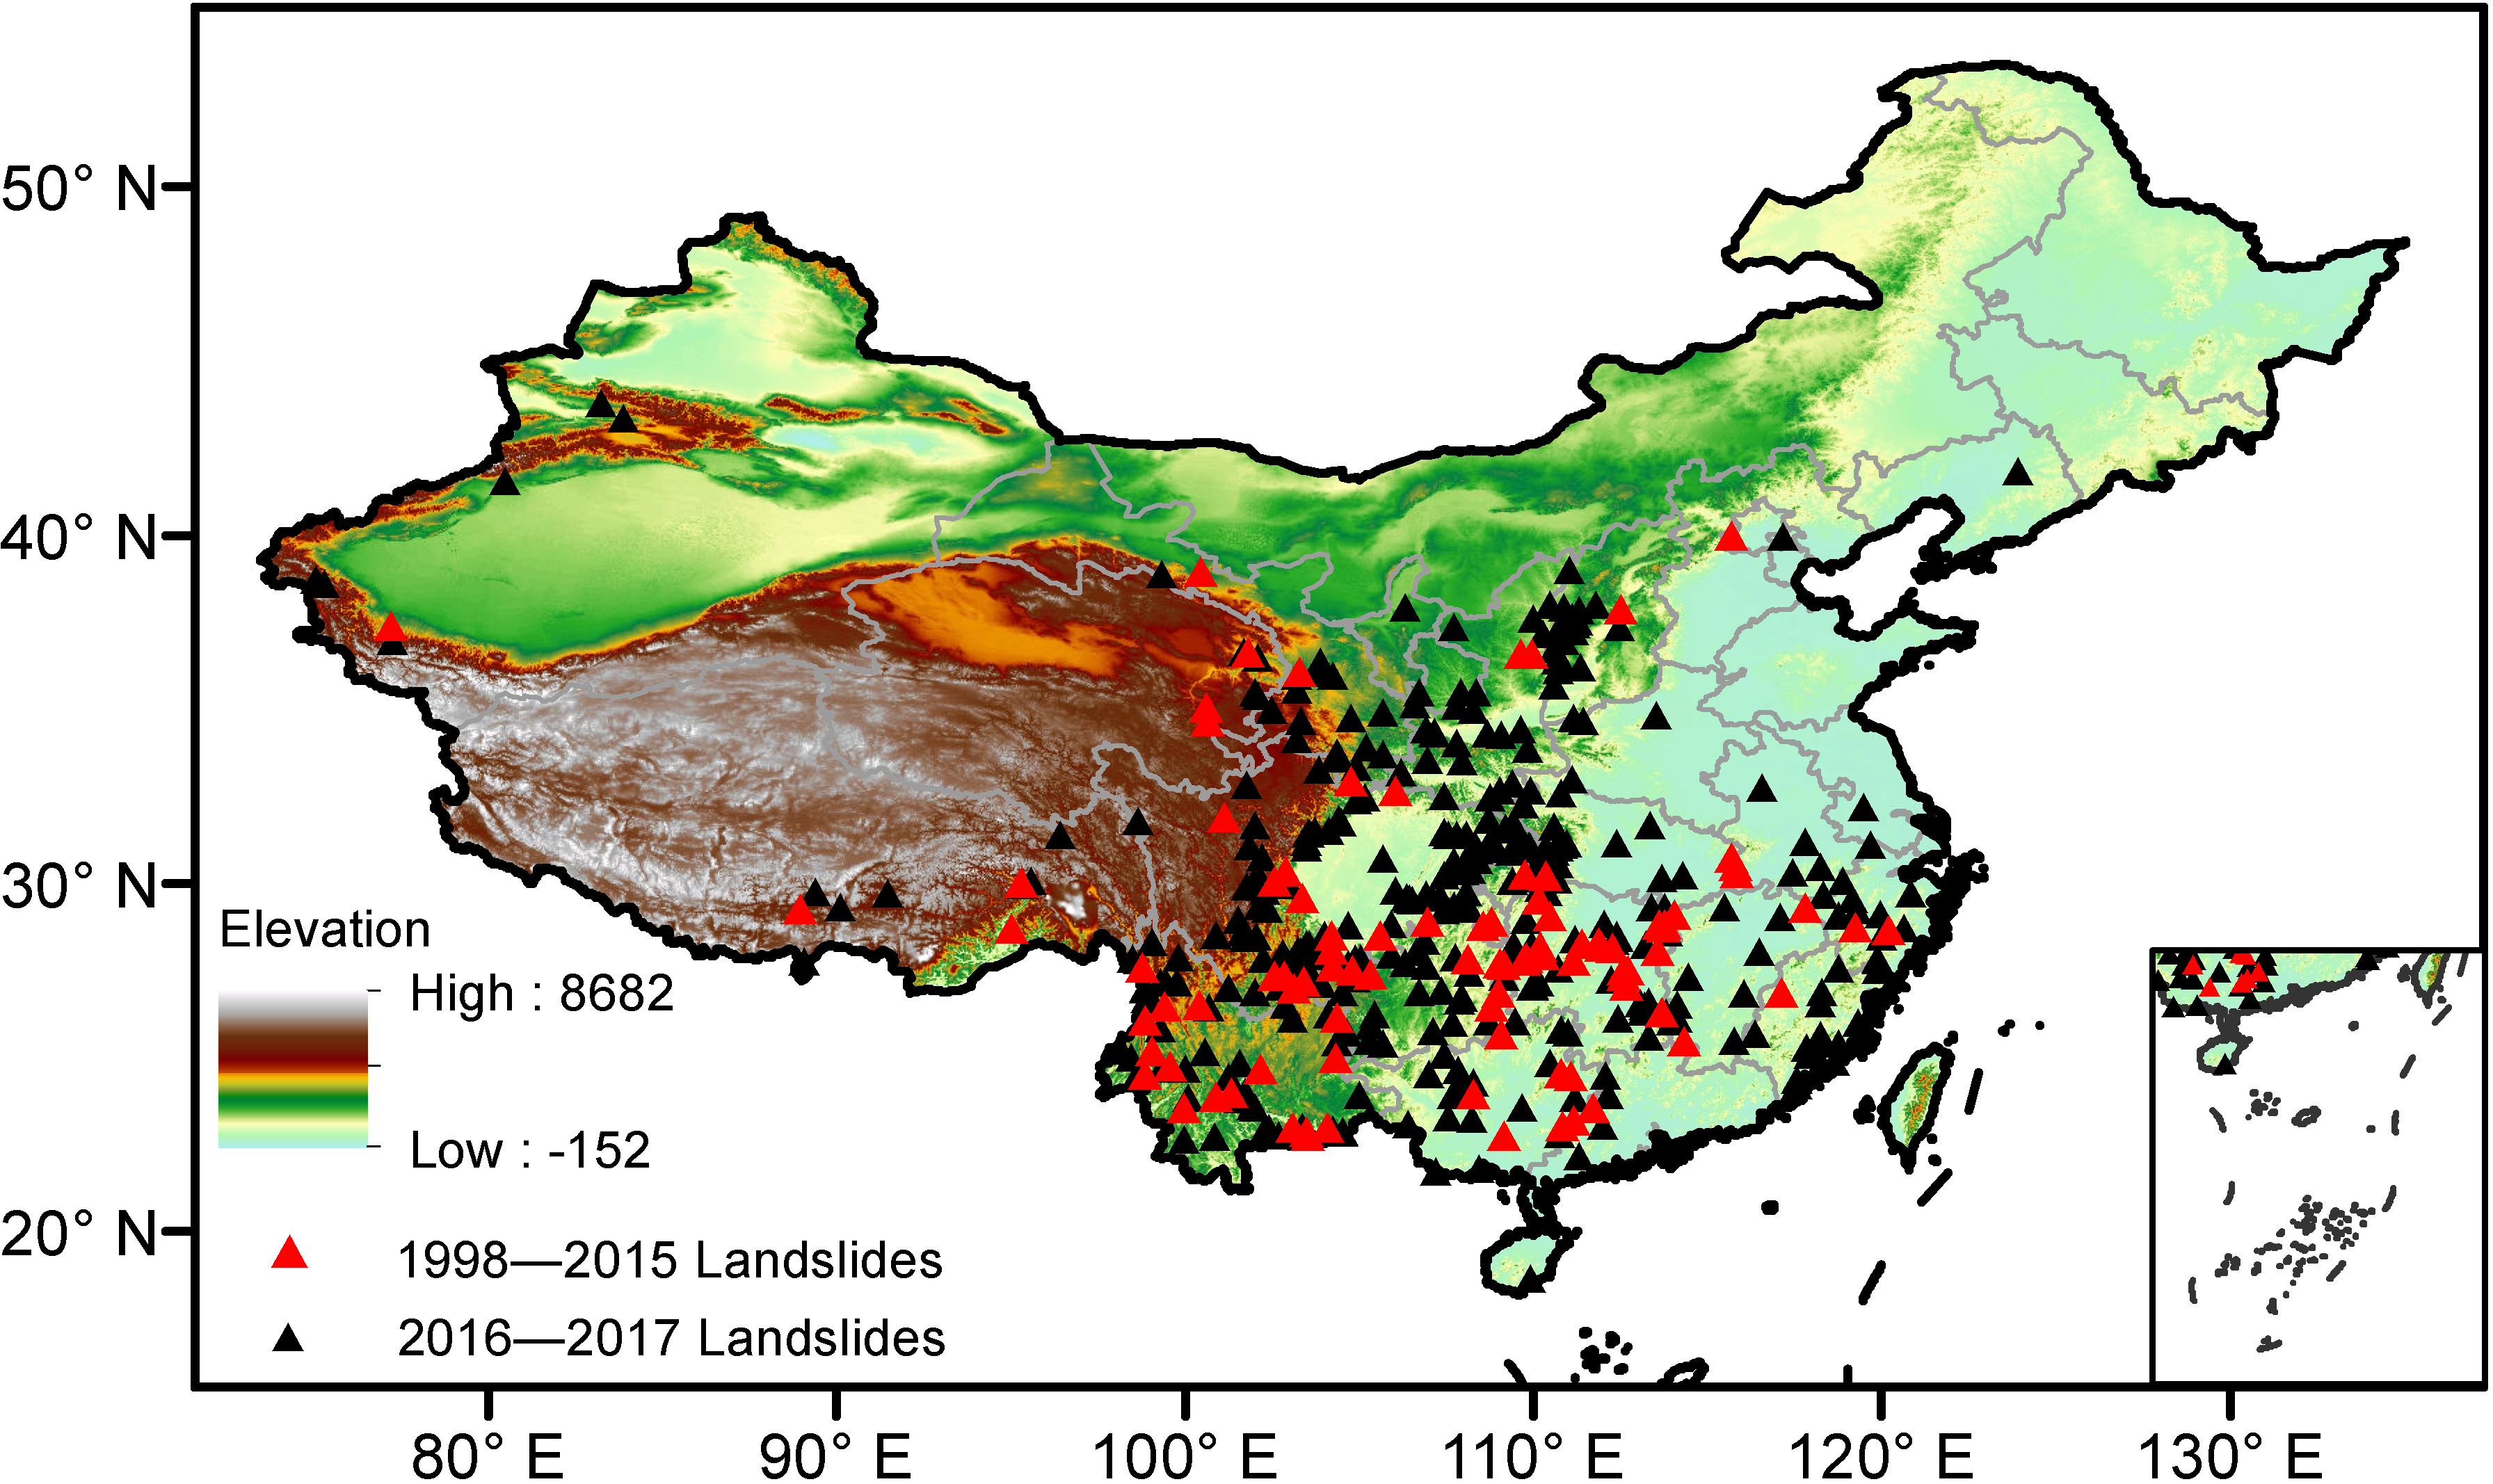
The latitude and longitude of the landslide events can be acquired by map tool. Figure 1 shows the locations of landslide events and elevation distribution in China. The elevation data are derived from HydroSHEDS—Hydrological data and maps based on SHuttle Elevation Derivatives at multiple Scales, with a spatial resolution of 3 arc-seconds, which can be downloaded at http://hydrosheds.cr.usgs.gov [26]. Most of the landslides are distributed in transitional regions from high altitude to low altitude and hilly areas in the southern China, where heavy precipitation occurs frequently due to monsoon and typhoon activities. Landslides occurred in 1998–2015 (black triangle in Figure 1) are used to construct the rainfall thresholds, and those occurred in 2016–2017 (red triangle in Figure 1) are used for validation.
2.2. Rainfall Data
Three kinds of precipitation products are used to calculate the rainfall thresholds: (i) the merged precipitation product in China [27], and it is the main precipitation data used in this paper, (ii) satellite precipitation product produced by the NOAA Climate Prediction Center Morphing technique (CMORPH) [28], and (iii) CN05.1 [29] are also used in this paper. The hourly CMORPH and merged precipitation products are used to acquire the rainfall information when landslides occur, and daily CN05.1 is used to obtain the MAP for the normalization of the rainfall thresholds.
It has been pointed out that the development of satellite and ground-based radar technology has provided great support for the studies of rainfall thresholds [30]. The estimated precipitation from satellite-based data has a high spatio-temporal resolution, and the comprehensive quality evaluation in China is also good. In particular, the CMORPH performs better among the satellite precipitation products [31,32,33].
The CMORPH is developed by the National Oceanic and Atmospheric Administration (NOAA) Climate Prediction Center (CPC) in the United States. By using the geostationary satellite IR data to detect cloud systems and the associated motion characteristics, the cloud system advection vector is calculated, which is then used to deduct the instantaneous precipitation estimated by low orbiter satellite microwave observations. Finally, the continuous precipitation distribution is obtained. There are two versions of CMORPH: the original version (CMOPRH V0.x) and the new version (CMOPRH V1.0, used here). CMORPH V1.0 has provided near-real-time and bias-corrected products named CMORPH-RAW and CMORPH-CRT, respectively. CMORPH-RAW is satellite only precipitation and is provided in near-real-time so is suitable for real-time application. CMORPH-CRT is adjusted through matching the PDF of daily CMORPH-RAW against that for the CPC unified daily gauge analysis at each month over land, thus the CMORPH-CRT data is provided months delay. In this study, CMORPH-RAW with a temporal resolution of 30 min and a spatial resolution of −8 km, covering 60° S–60° N is used.
Based on the hourly precipitation observed by more than 30,000 automatic weather stations (AWS) in China and the satellite precipitation data retrieved from CMORPH, a merged rainfall product is developed through a two-step merging algorithm of PDF (Probability Density Function) and OI (Optimal Interpolation). The merged rainfall combines the advantages of both the AWS and satellite products, so the spatio-temporal distributions of precipitation is more accurate and reasonable. The gauge stations used in this data are far more than which used in CMORPH-CRT, and it updates more rapidly than CMORPH-CRT, so that we use merged data in China rather than CMORPH-CRT. The spatial resolution of the merged rainfall is 0.1° × 0.1°, with a temporal resolution of 1 h. The dataset is available from 1 January 2008 to date, which can be downloaded online (available at http://data.cma.cn/data/detail/dataCode/SEVP_CLI_CHN_MERGE_CMP_PRE_HOUR_GRID_0.10/).
The CN05.1 dataset has been developed with observations at more than 2400 stations in China [29]. It is constructed by the “anomaly approach” [34], that is, first calculating a gridded climatology and then adding a gridded daily anomaly to the climatology to obtain the final dataset. The CN05.1 includes daily and monthly precipitation data and the period is from 1961 to 2017, with a spatial resolution of 0.25° × 0.25°. Here, the monthly data in 1981–2010 is adopted to calculate the MAP for 30 years.
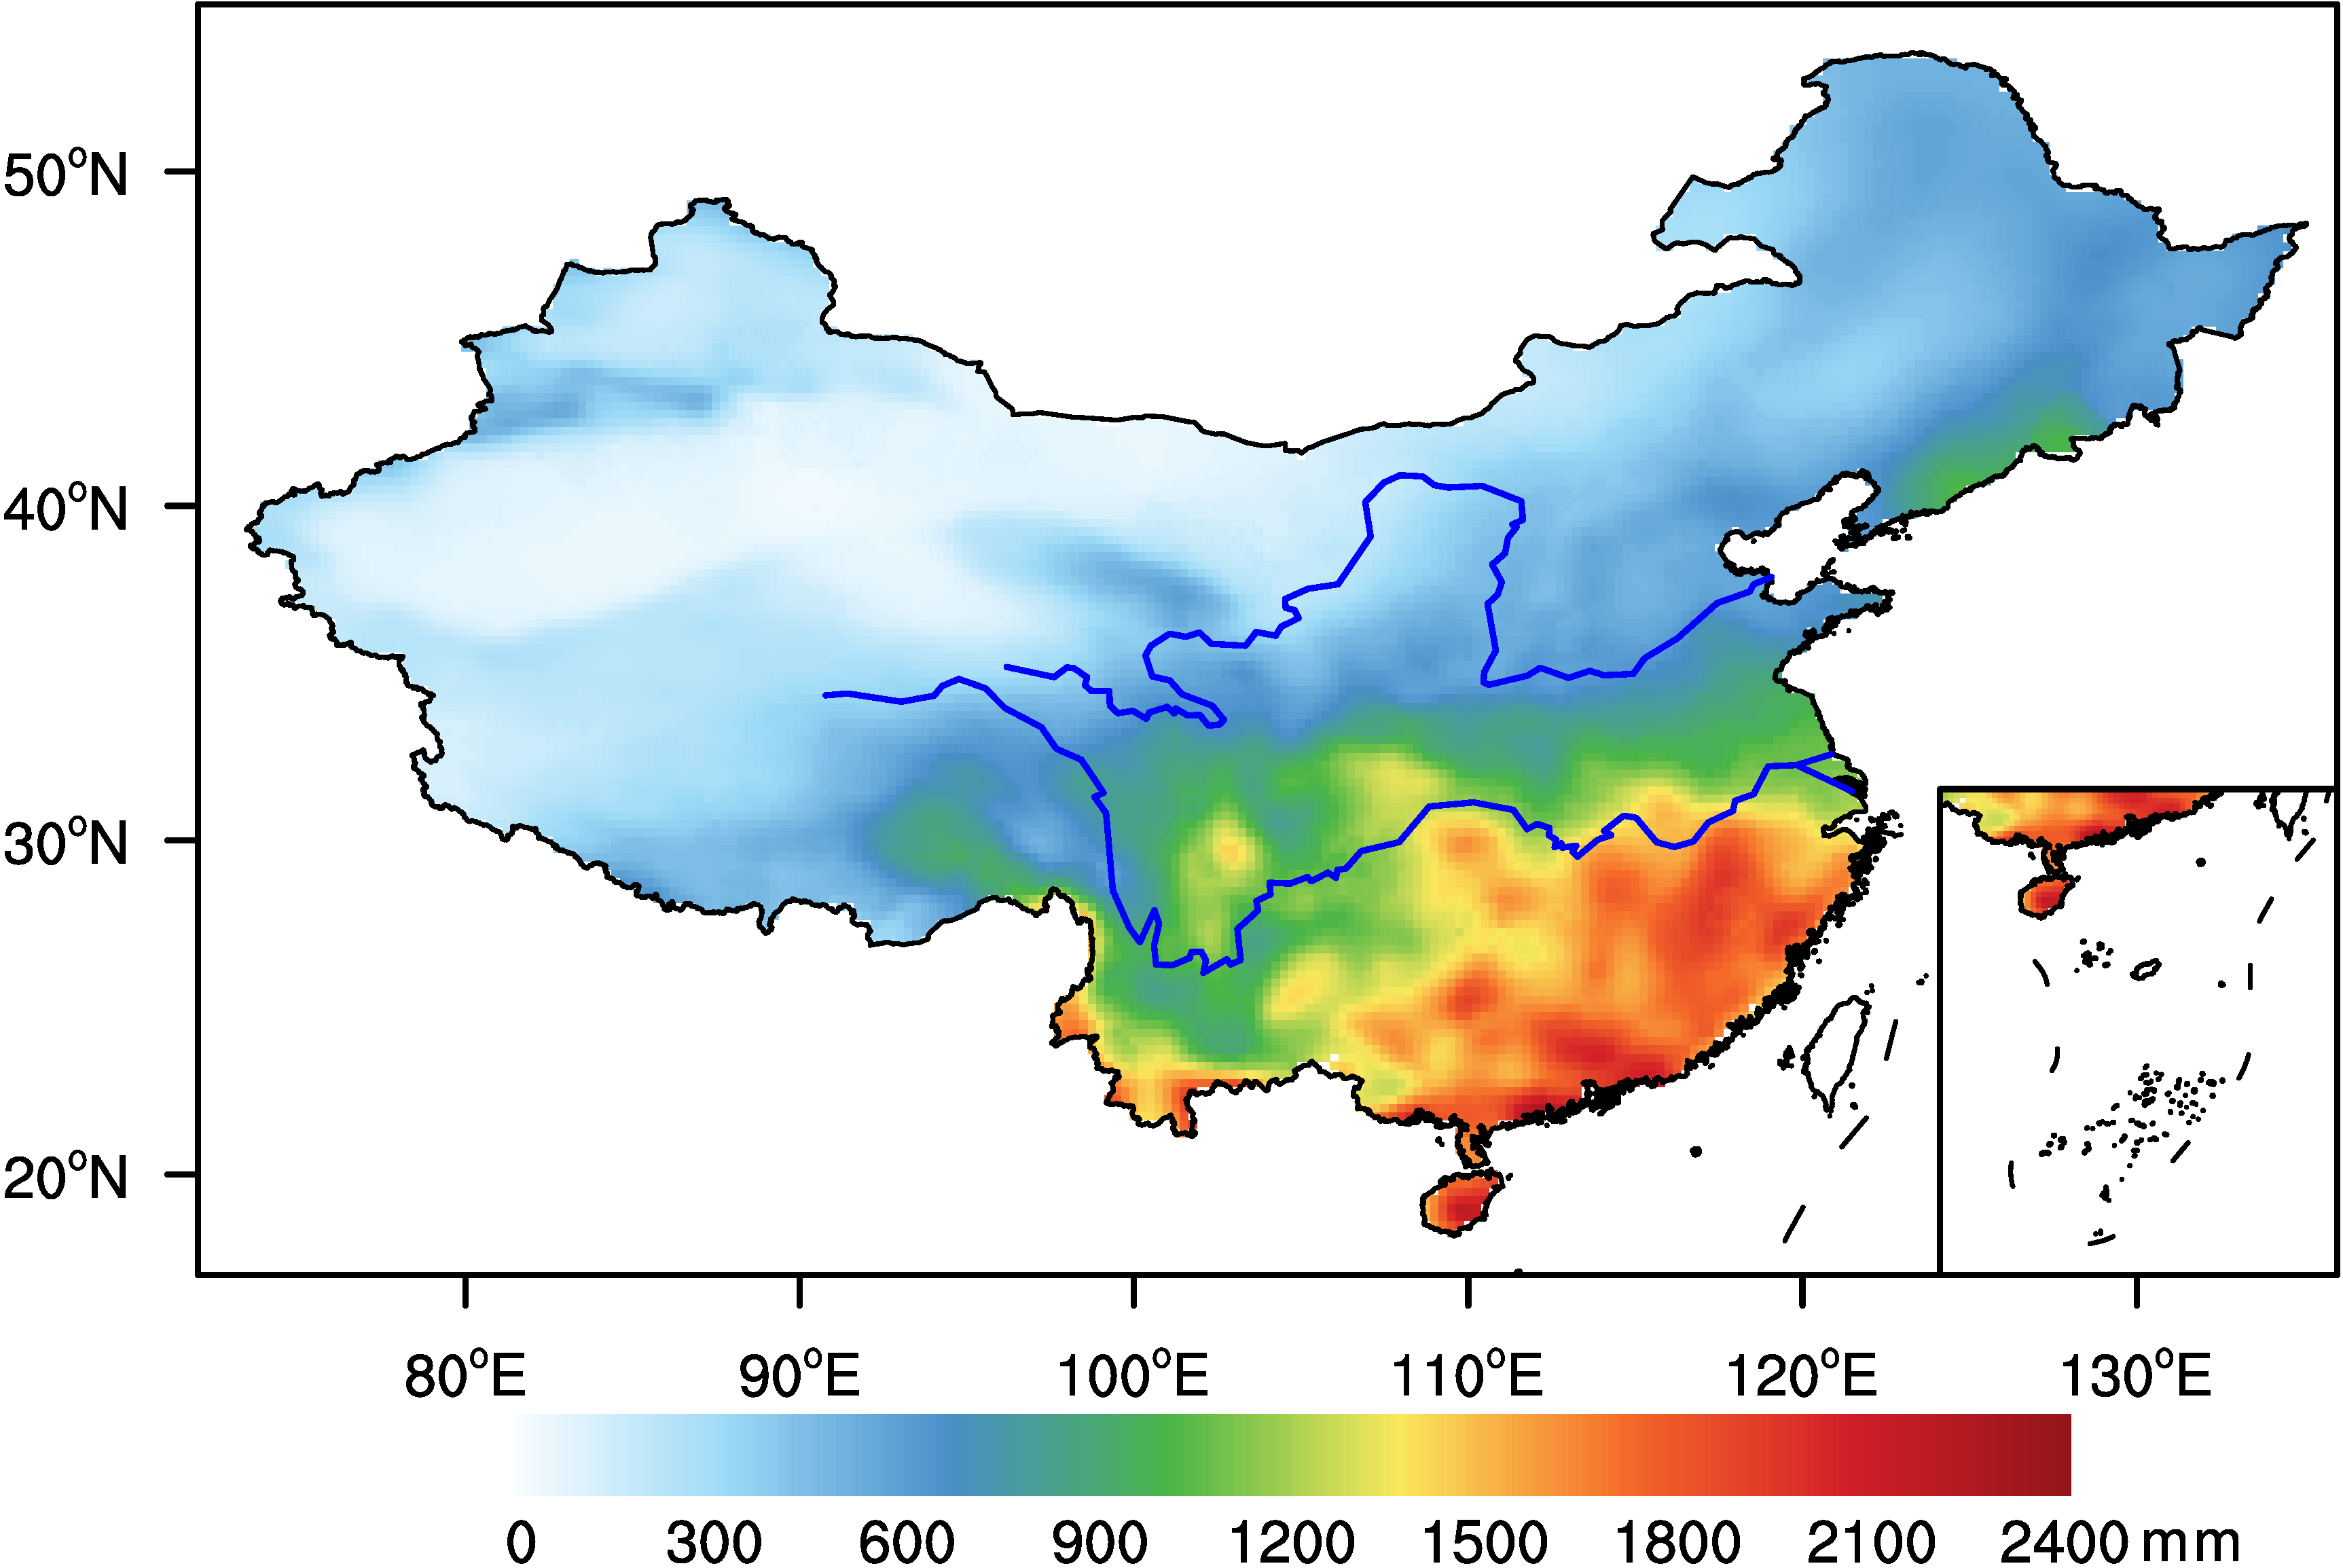
As is shown in Figure 2, the MAP in China ranges from 24.62 to 2315.27 mm, which is high in the southeast of the Yangtze River and gradually decreases from the southeast to northwest, as it is known that heavy rainfall occurs frequently in the southern China during the summer monsoon season. Furthermore, typhoons from the Northwest Pacific Ocean land in these areas frequently from June to October and bring abundant rainfall. The high MAP in the southeastern China could partly explain why this region with low topographic relief is prone to landslides. As the MAP varies greatly in China, and the climate affects the meteorological conditions that can result in landslides, there is a need to reduce the effects of climate diversity. Commonly, due to the differences of rainfall thresholds in different climatic regions, the MAP as a climatic index is selected to normalize the rainfall thresholds [20,24,35,36]. Therefore, the accumulated rainfall is divided by MAP in this paper to acquire the EMAP–D thresholds.
2.3. Inventory Methodology
The formula of the E–D rainfall threshold is expressed as follow:
where is the duration (unit: h) from the beginning of the rainfall () to the occurrence time of the landslide (), is the accumulated rainfall (unit: mm) during this duration, and are constant parameters calculated by the regression method. means the time when the landslide event occurred; but for the landslide event with a temporal resolution of the day at S3, is the time when the rainfall ended on that day, and is the time when the rainfall event began. A rainfall event is defined by a no-rainfall period. Saito et al. (2010) used 24 h to define the rainfall event in Japan [24]; Brunetti et al. (2010) used 48 h in May–September, and 96 h in October–April in Italy [37]; Segoni et al. (2014) did several runs using different no rain periods to get the lowest number of false alarms; the no rain period varies 18–36 h for different alert zones [22]. In this study, a rainfall event is defined as continuous rainfall separated from the preceding and the following events by a no-rainfall period of no less than 24 h.
Firstly, the rainfall information (E and D) relevant to landslides needs to be acquired. As CMORPH and merged rainfall data are both gridded data, the grid whose center is closest to the location of the landslide event is selected to reconstruct the rainfall information for landslides.
Then, Formula (1) is log-transformed to a linear equation:
log10 (E) = log10 (α) + γlog10 (D)
For each landslide event, E–D values are plotted on the log10-log10 graph. In this process, it has been found that the rainfall durations of some landslide events are 0 h, which may be due to the fact that part of the landslides are not triggered by short-term rainfall, but by earthquake, snow melt or antecedent rainfall. Moreover, the AWSs coverage is not wide enough in China, especially in the mountain areas, therefore, such landslides are excluded when calculating rainfall thresholds. Finally, based on the CMORPH products, 367 landslides are selected to calculate the rainfall thresholds; based on the merged rainfall products (available from 2008), 276 landslides are used to construct the rainfall thresholds.
To calculate the rainfall thresholds for landslides, the quantile regression [38] is adopted to determine the rainfall E–D threshold in this study. R software has a package called “quantreg”, which implements the quantile regression [39,40]. It has been proposed that different levels of early warning information can be issued by the EWS with probability levels of 5%, 20% and 50%, categorized as “Null” (below the 5th percentile), “Alert” (5–20th percentiles), “Warning” (20–50th percentiles) and “Evacuation” (above the 50th percentiles), respectively. In this paper, the 10th, 20th, 30th, 40th, 50th, 60th, 70th, 80th and 90th percentile values are calculated for quantile regression lines at different levels, and the values of intercept α and slope β are returned by the linear regression method.
The main procedures for calculating the thresholds are summarized as follows.
- (1)
- Collect information of landslides, including time, latitude and longitude of events.
- (2)
- Screen the event that satisfies the criteria of spatio-temporal resolution.
- (3)
- Define the rainfall event that is separated by a no-rainfall period of no less than 24 h, which means the period between two rainfall events is more than 24 h.
- (4)
- Find the grid of the rainfall data whose center is closest to the location of the landslide event.
- (5)
- Get the E and D of the landslide events and plot them as dots in the log10-log10 graph.
- (6)
- Calculate the thresholds (including E–D and EMAP–D thresholds) by using the quantile regression.
- (7)
- Compare with thresholds in other published literatures and validate the rainfall thresholds.
In addition, China is affected by the monsoon system. With the onset of the summer monsoon in May, the mainland of China becomes wet and rainy from south to north. When it comes to September, the summer monsoon retreats rapidly, followed by the establishment of the winter monsoon, and then the mainland of China is controlled by the Siberia high in winter. During this period, the soil is dry due to less rain. Considering the special climate conditions in China, the rainfall characteristics and soil moisture are different between the two periods in each year. Thus, the periods of May–September and October–April are selected as the rainy season and non-rainy season, respectively [41]. Moreover, as mentioned in Section 1, the existing landslide warning system shows different warning effects in rainy and non-rainy seasons [11], so the rainfall thresholds for the rainy and non-rainy seasons are calculated respectively in this paper.
3. Results
By using the landslide events occurred during 1998–2015 in China which satisfy the requirements mentioned above, that is, the spatial resolution at the levels of county, district or higher, and the temporal resolution at the level of day or finer, the D and E for each landslide event are inferred from the merged and CMOPRH rainfall data.
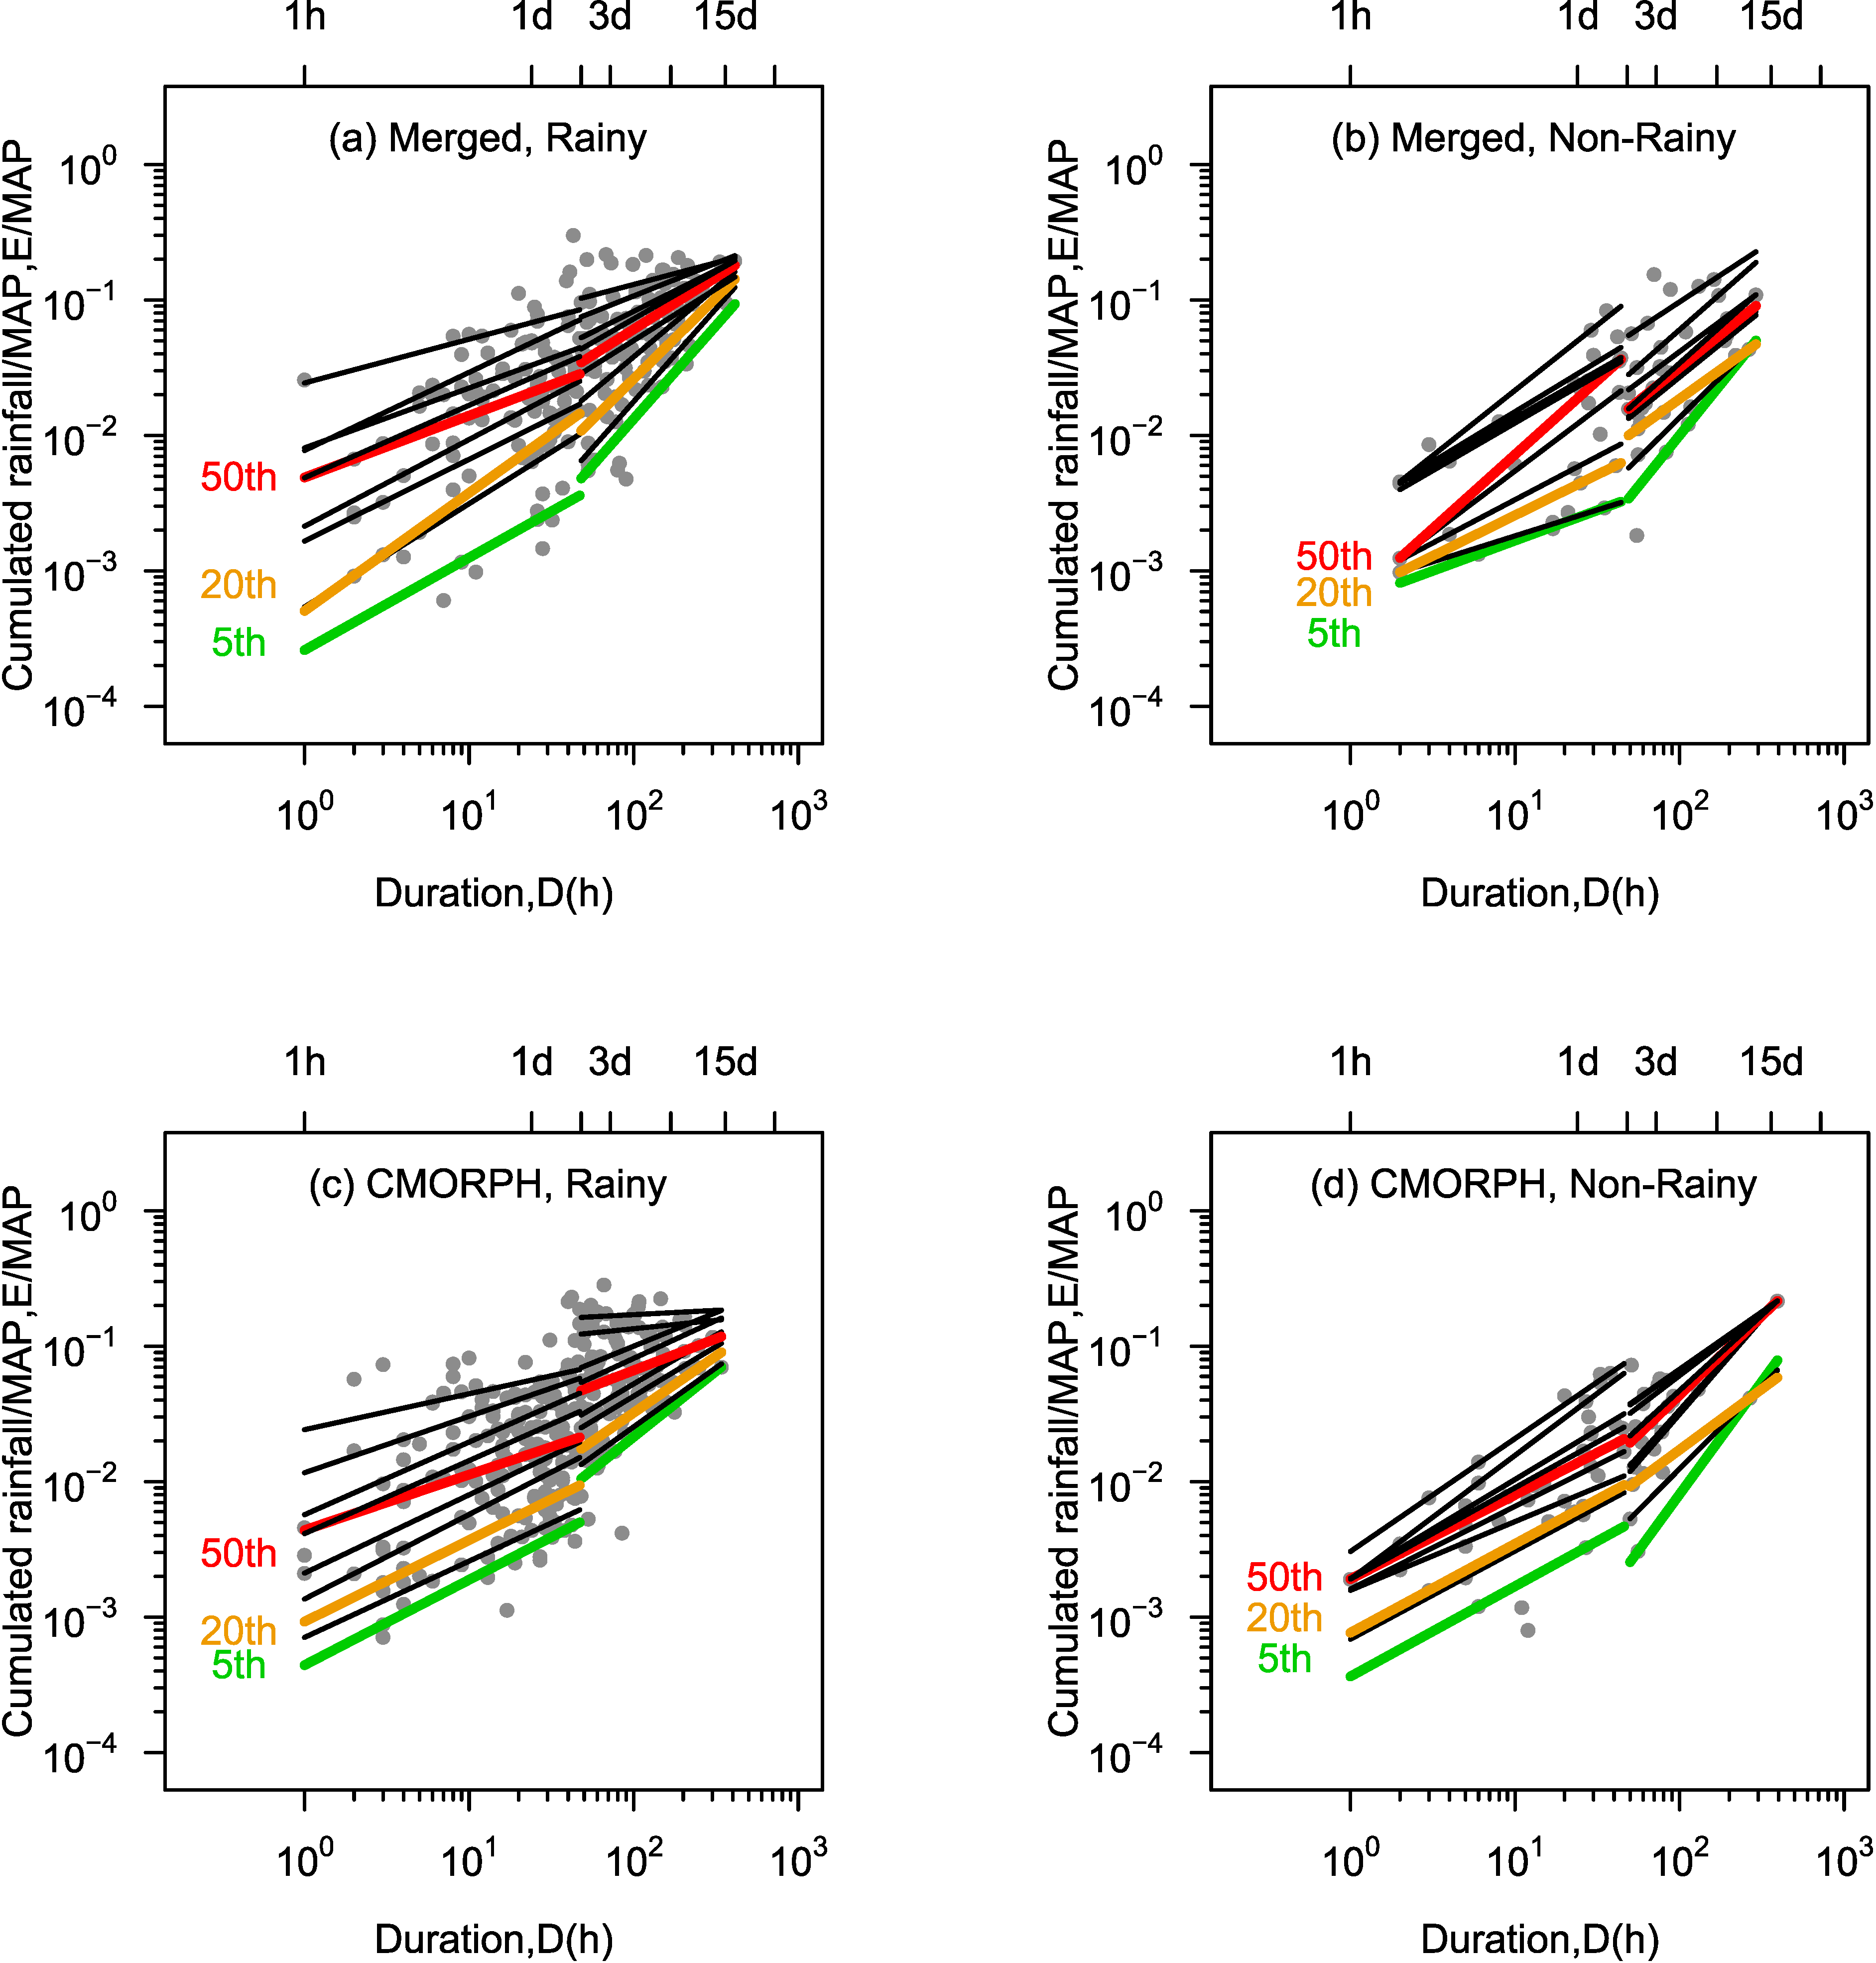
Figure 3 shows the distribution of the rainfall conditions for each landslide event in the log10-log10 graph. Roughly taking 48 h as a split point, the trend seems different in the two parts, which can be seen in both the CMORPH and merged rainfall data during the rainy season and non-rainy season. Thus, the duration can be divided into two periods: short duration (1 ≤ D < 48 h) and long duration (D > 48). This may be because the mechanisms of landslide and debris flow triggered by long-term rainfall and short-term rainfall are different. In the long-term rainfall, the threshold is affected by the antecedent precipitation and soil moisture, and the evaporation is also an important factor [25]. In Figure 3a, for the merged data, in the rainy season, the range of the accumulated rainfall is 1.02–388.68 mm and the duration is 1–412 h (around 17 days); in the non-rainy season (Figure 3b), the range of the accumulated rainfall is 1.04–271.39 mm and the duration is 2–291 h (around 12 days). For the CMORPH data, in the rainy season (Figure 3c), the range of the accumulated rainfall is 1–394.8 mm and the duration is 1–341 h (around 14 days); in the non-rainy season (Figure 3d), the range of the accumulated rainfall is 1.2–179.4 mm and the duration is 1–393 h (around 16 days).
The coefficients of intercept α and slope γ at different levels of quantile regression lines obtained by combining precipitation and CMORPH precipitation are listed in Table 2. By using thresholds at different levels of quantile regression, different levels of warnings can be established in the EWS [42]. Generally, the threshold at the 5% quantile level is used as a lower safety threshold. If the threshold exceeds the value at the 5% quantile level, relevant tracking, monitoring and prediction should be carried out; if the threshold exceeds the value at the 20% quantile level, attention should be paid; and if the threshold exceeds the value at the 50% quantile level, people should be evacuated.
It can be found that for the thresholds at the quantile level of 50% or below, the slope of the regression line for the thresholds in the events with long durations is bigger than those with short durations, which means for long duration events much more rainfall is required to trigger landslide than. The possible reason might be that the evaporation plays an important role in the events with long durations, while for those with short durations, the evaporation can be ignored. Furthermore, the antecedent precipitation, soil moisture and climate condition also influence the rainfall thresholds in the initiation of landslides, and we will discuss this later in this article.
Considering that the MAP varies greatly in China (Figure 2), the accumulated rainfall is normalized by MAP. Figure 4 shows the scatter diagram of the relationship between EMAP and D on the logarithmic coordinates and the quantile regression lines at different levels. In addition, the corresponding coefficients of slope γ and intercept α for quantile regression lines at different levels are shown in Table 3. Similar to the E–D formula, split by 48 h, the formulas for both short-term and long-term rainfall thresholds are established, respectively. It can be seen that for the EMAP–D thresholds at the 50% quantile level or below established by the merged and CMORPH rainfall products, the slope of the regression line on rainfall threshold for the landslide and debris flow triggered by short-term rainfall is generally smaller than or close to that triggered by long-term rainfall, while the intercept is higher than that triggered by the long-term rainfall. The difference in the mechanisms for landslide and debris flow triggered by long-term rainfall and short-term rainfall is reflected in the rainfall thresholds.
4. Discussions
So far, four groups of rainfall thresholds in China have been established. Each group consists of four sub-thresholds in rainy season and non-rainy season (both are divided into short duration and long duration), respectively. For thresholds below the quantile level of 50% derived from both the merged and CMORPH rainfall products, the slope of the regression line of the rainfall threshold for long durations is higher than that for short durations, which may be attributed to different mechanisms in triggering landslides by long- and short-duration rainfall.
In our previous study, a statistical model for landslide has been established by using the landslide susceptibility and a global rainfall threshold, showing that around 70% of the landslide events occurred in China during 2016–2017 can be warned in advance by the model [11,12]. In addition, when the rainfall threshold exceeds the value at the quantile level of 20%, attention should be paid. Therefore, the rainfall threshold at the quantile level of 30% is compared to other existing thresholds, and it is validated by using the landslides occurred in 2016–2017. Finally, the warning ability is compared with the previous statistical model for landslide.
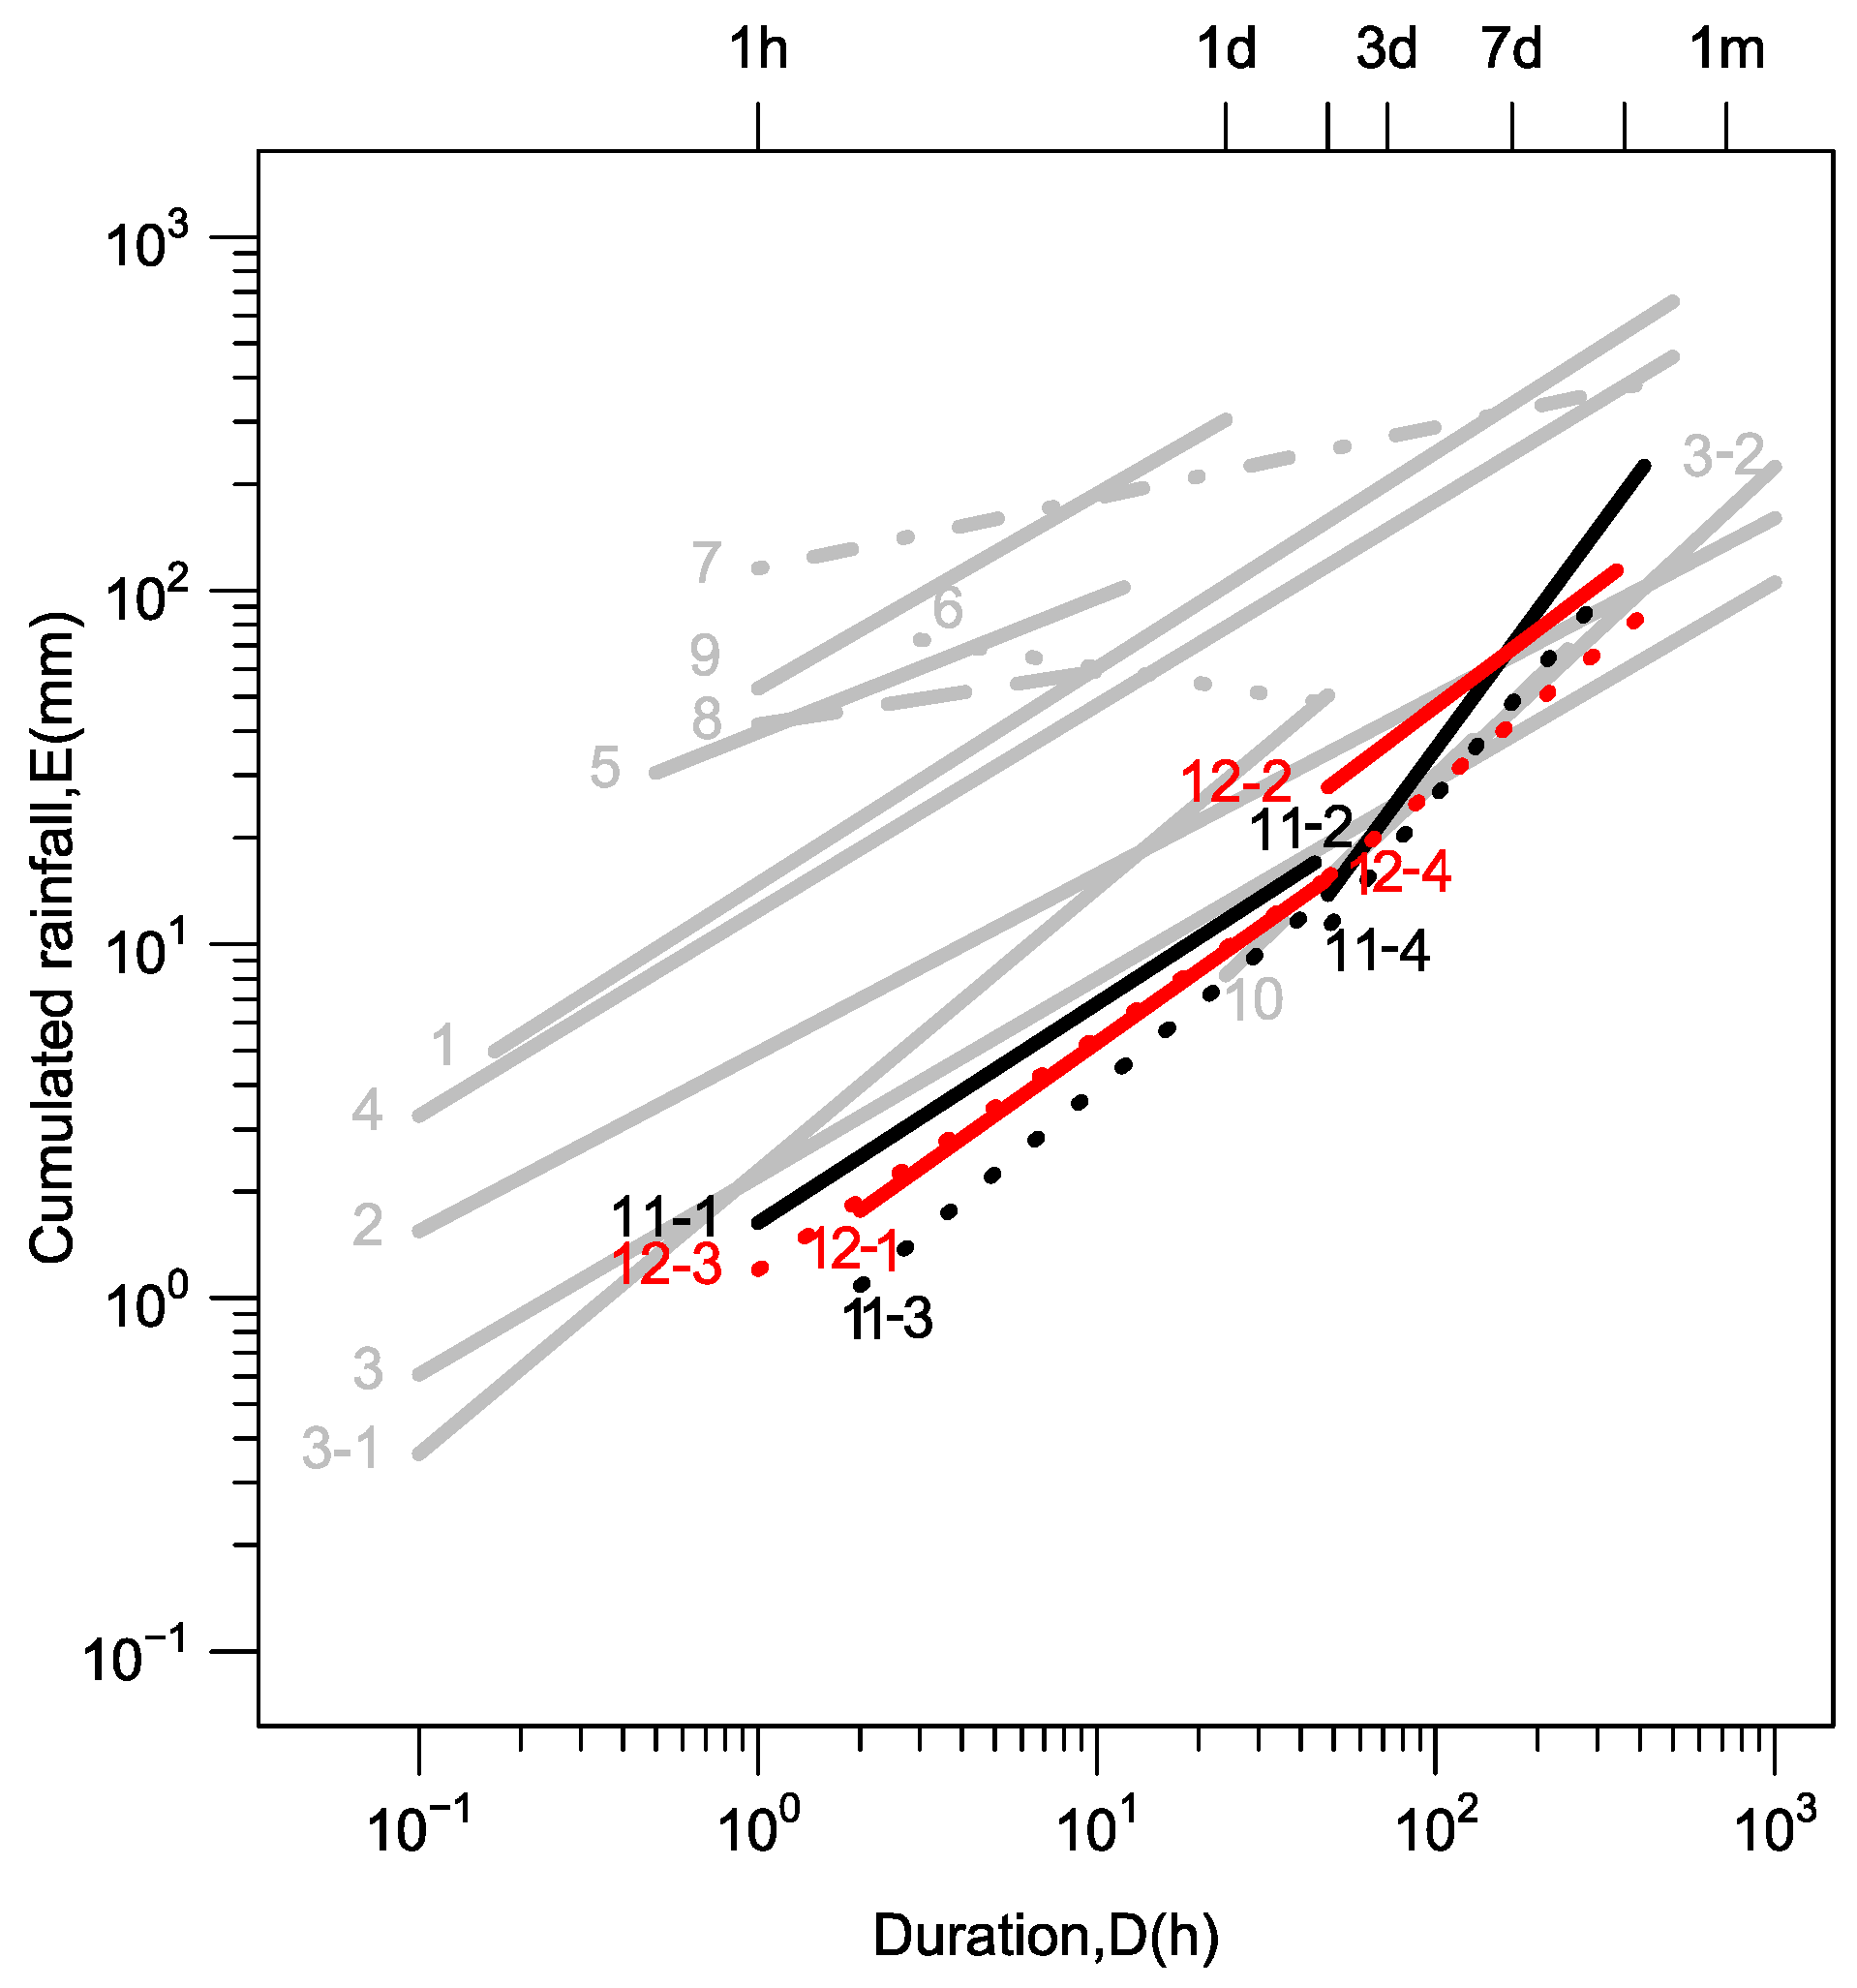
The E–D thresholds with other global and regional thresholds in the literature are listed in Table 3. The I–D rainfall thresholds are converted to the E–D thresholds, and then all these thresholds are plotted on the log10-log10 graph (Figure 5). For the long duration, the thresholds derived from both the merged and CMORPH rainfall products are higher in the rainy season than those in the non-rainy season. For the short duration, the thresholds derived from the merged rainfall product are higher in the rainy season than those in the non-rainy season, but the thresholds from the CMORPH rainfall product in the rainy season are similar to those in the non-rainy season.
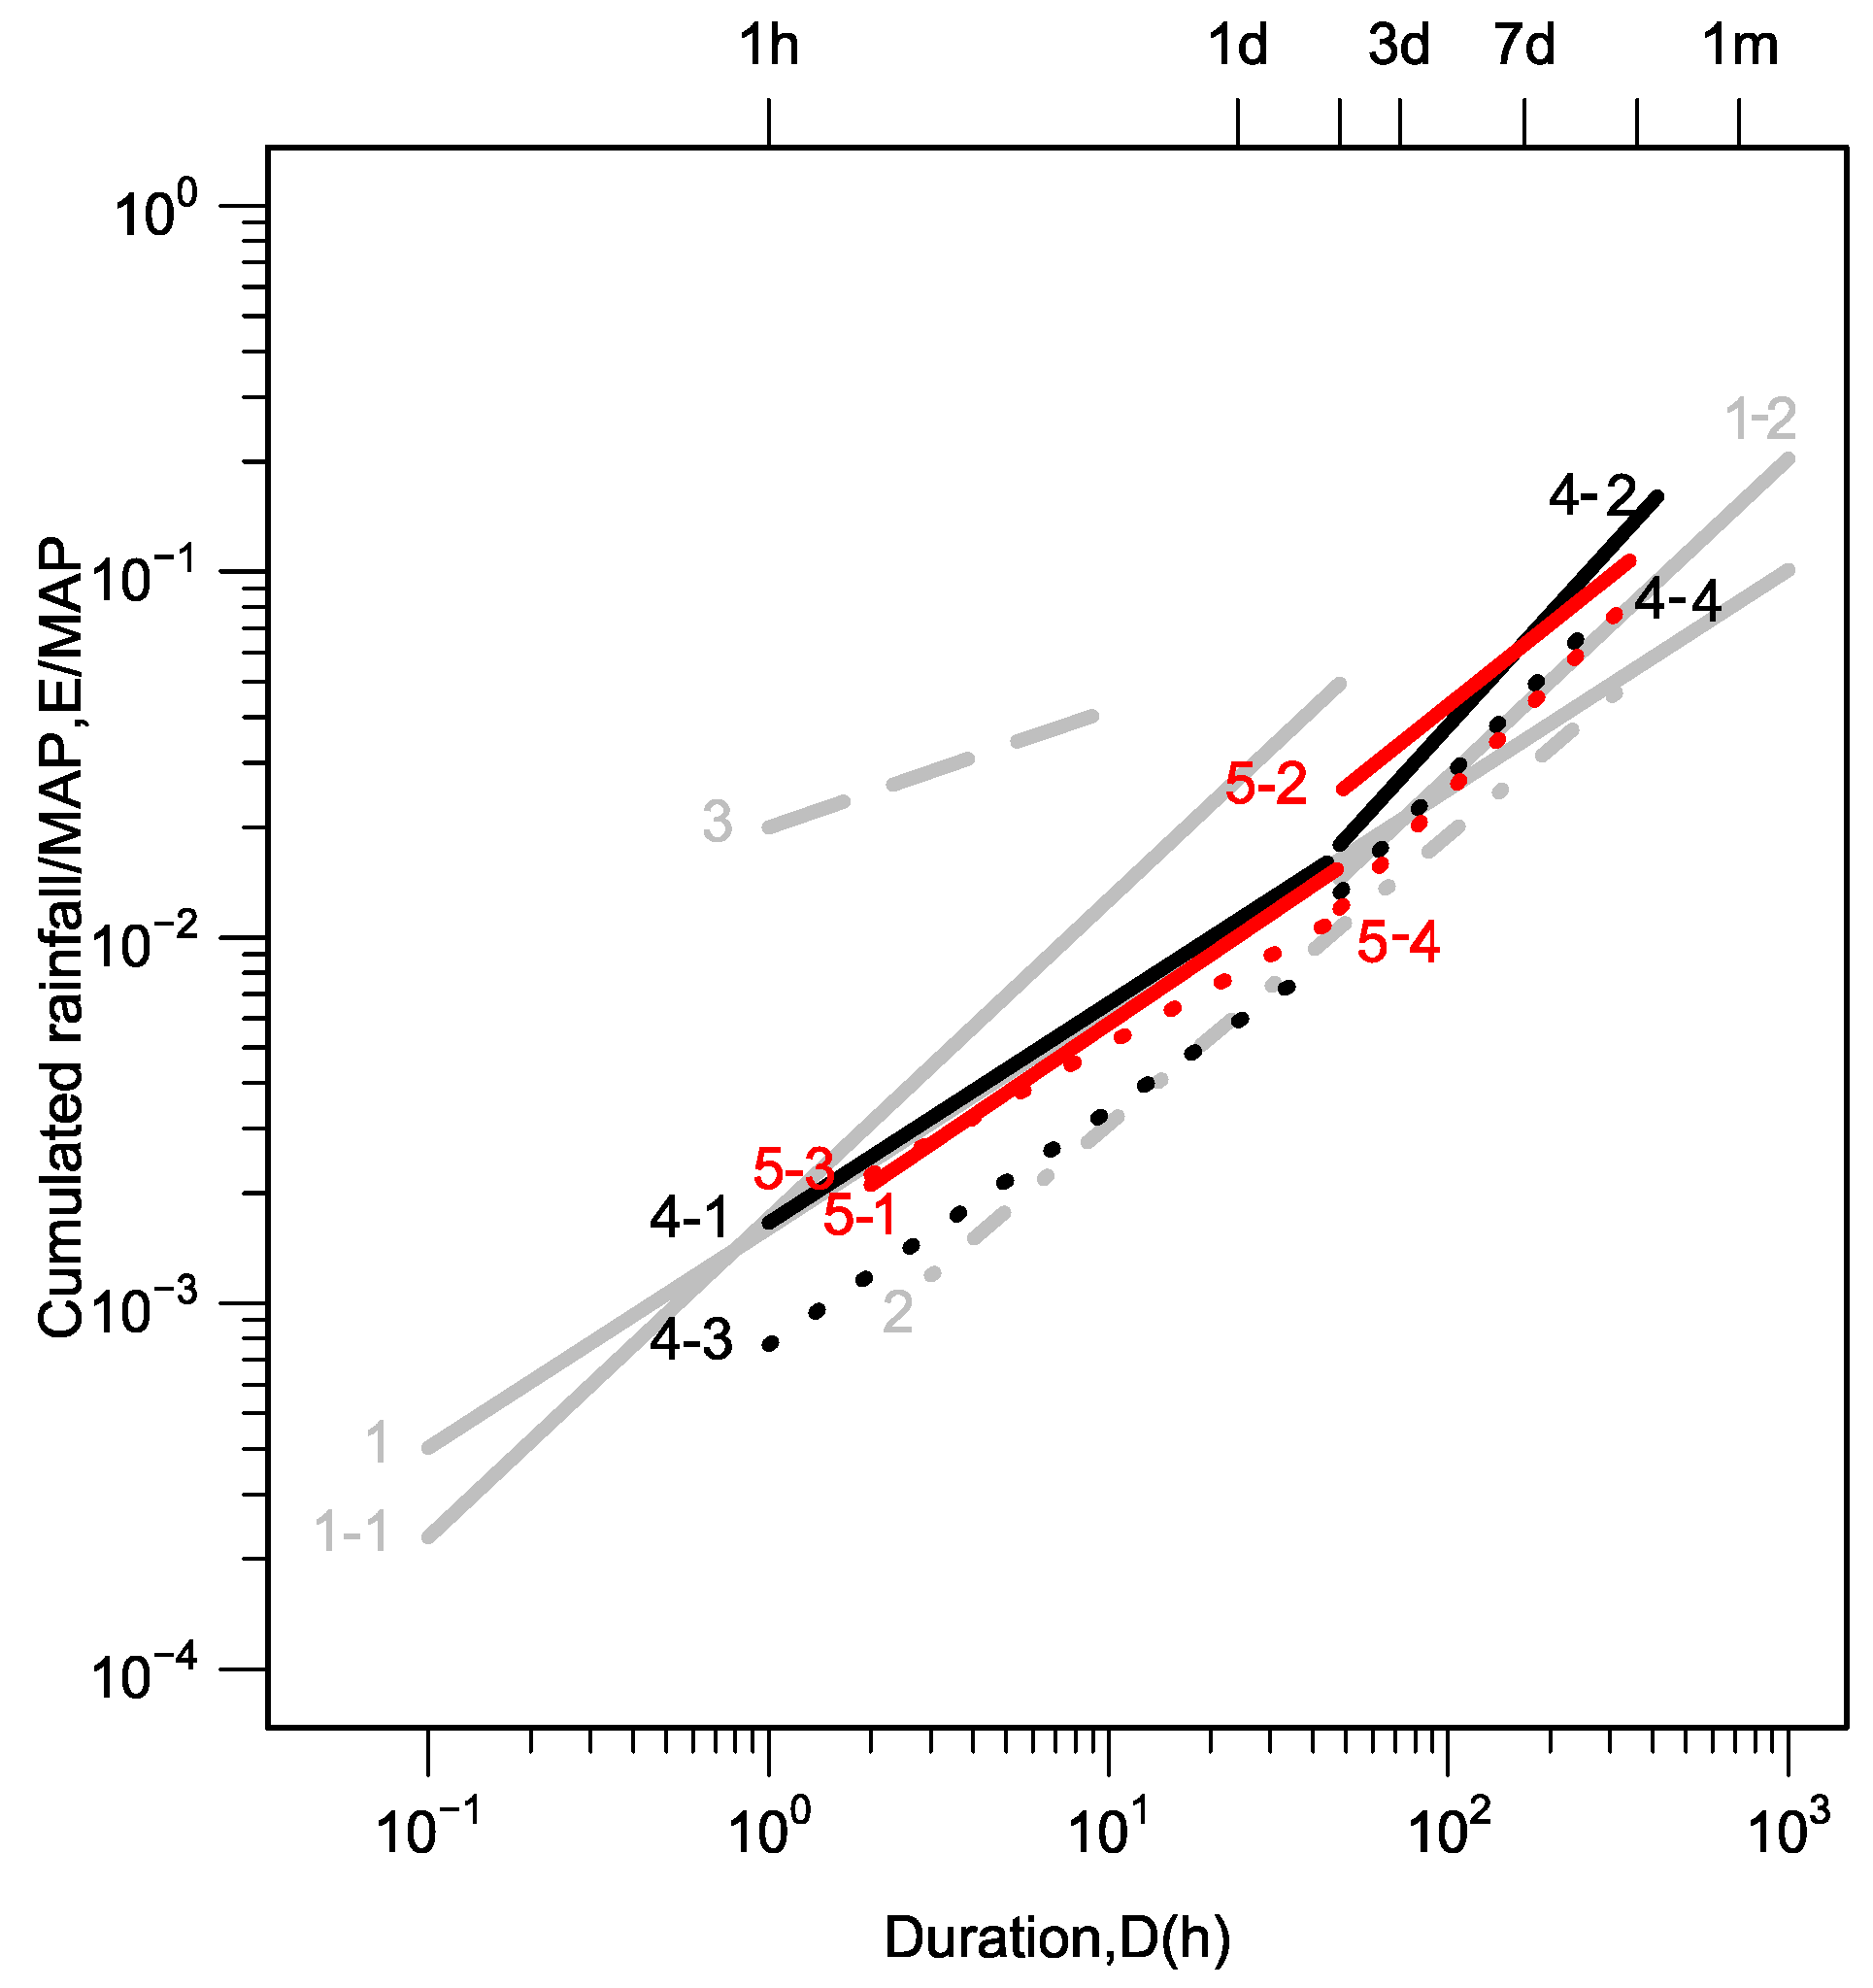
It can be seen that the thresholds established in this study are lower than most of the thresholds in previous studies shown here, especially for the short duration, including the global thresholds [43,44,45], the regional thresholds in Puerto Rico [46], Taiwan as well as Zhejiang of China [47,48]. This provides important information for the early warning of landslides in China, that is, the landslides occurred in China might be triggered by lower rainfall thresholds than that recognized before, which might result in missing alarms. The long-duration thresholds established in this study are close to the global thresholds defined by Guzzetti et al. (2008) (the line indicated by number 3-2 in Figure 5) [25] and the regional thresholds for Yan’an in China (the line indicated by number 10 in Figure 5) defined by Chen and Wang (2014) [49]. In addition, Li et al. (2017) defined a rainfall threshold (the line indicated by number 6 in Figure 5) for the whole China with 60 landslide events occurred in June to September during 2005–2011. This threshold is higher than the threshold defined in this study in the rainy season (May to September) [15]. It might because more landslide events (60 versus 660 events) were used in this study to obtain the warning thresholds.
The EMAP–D thresholds are also compared with other thresholds defined in previous studies, as listed in Table 5, and these thresholds are plotted in Figure 6. The thresholds in rainy season calculated by using merged and CMORPH rainfall products are all higher than those in the non-rainy season. For short duration, the thresholds in this study are close to the thresholds calculated by Guzzetti et al. (2008) [25], higher than the Japan threshold established by Saito et al. (2010) [24]. For the long duration, the thresholds are higher than or very close to the thresholds calculated by Guzzetti et al. (2008) and Saito et al. (2010) [24,25].
The comparison with other thresholds indicates that the landslides in China can be triggered by less severe rainfall conditions than previously recognized, which provides important information for the assessment of landslide hazards. In other words, China is highly prone to landslides compared with most other regions in the world. This may be caused by the large areas of mountains and hills, the monsoon climate and active human activities (constructions) of China.
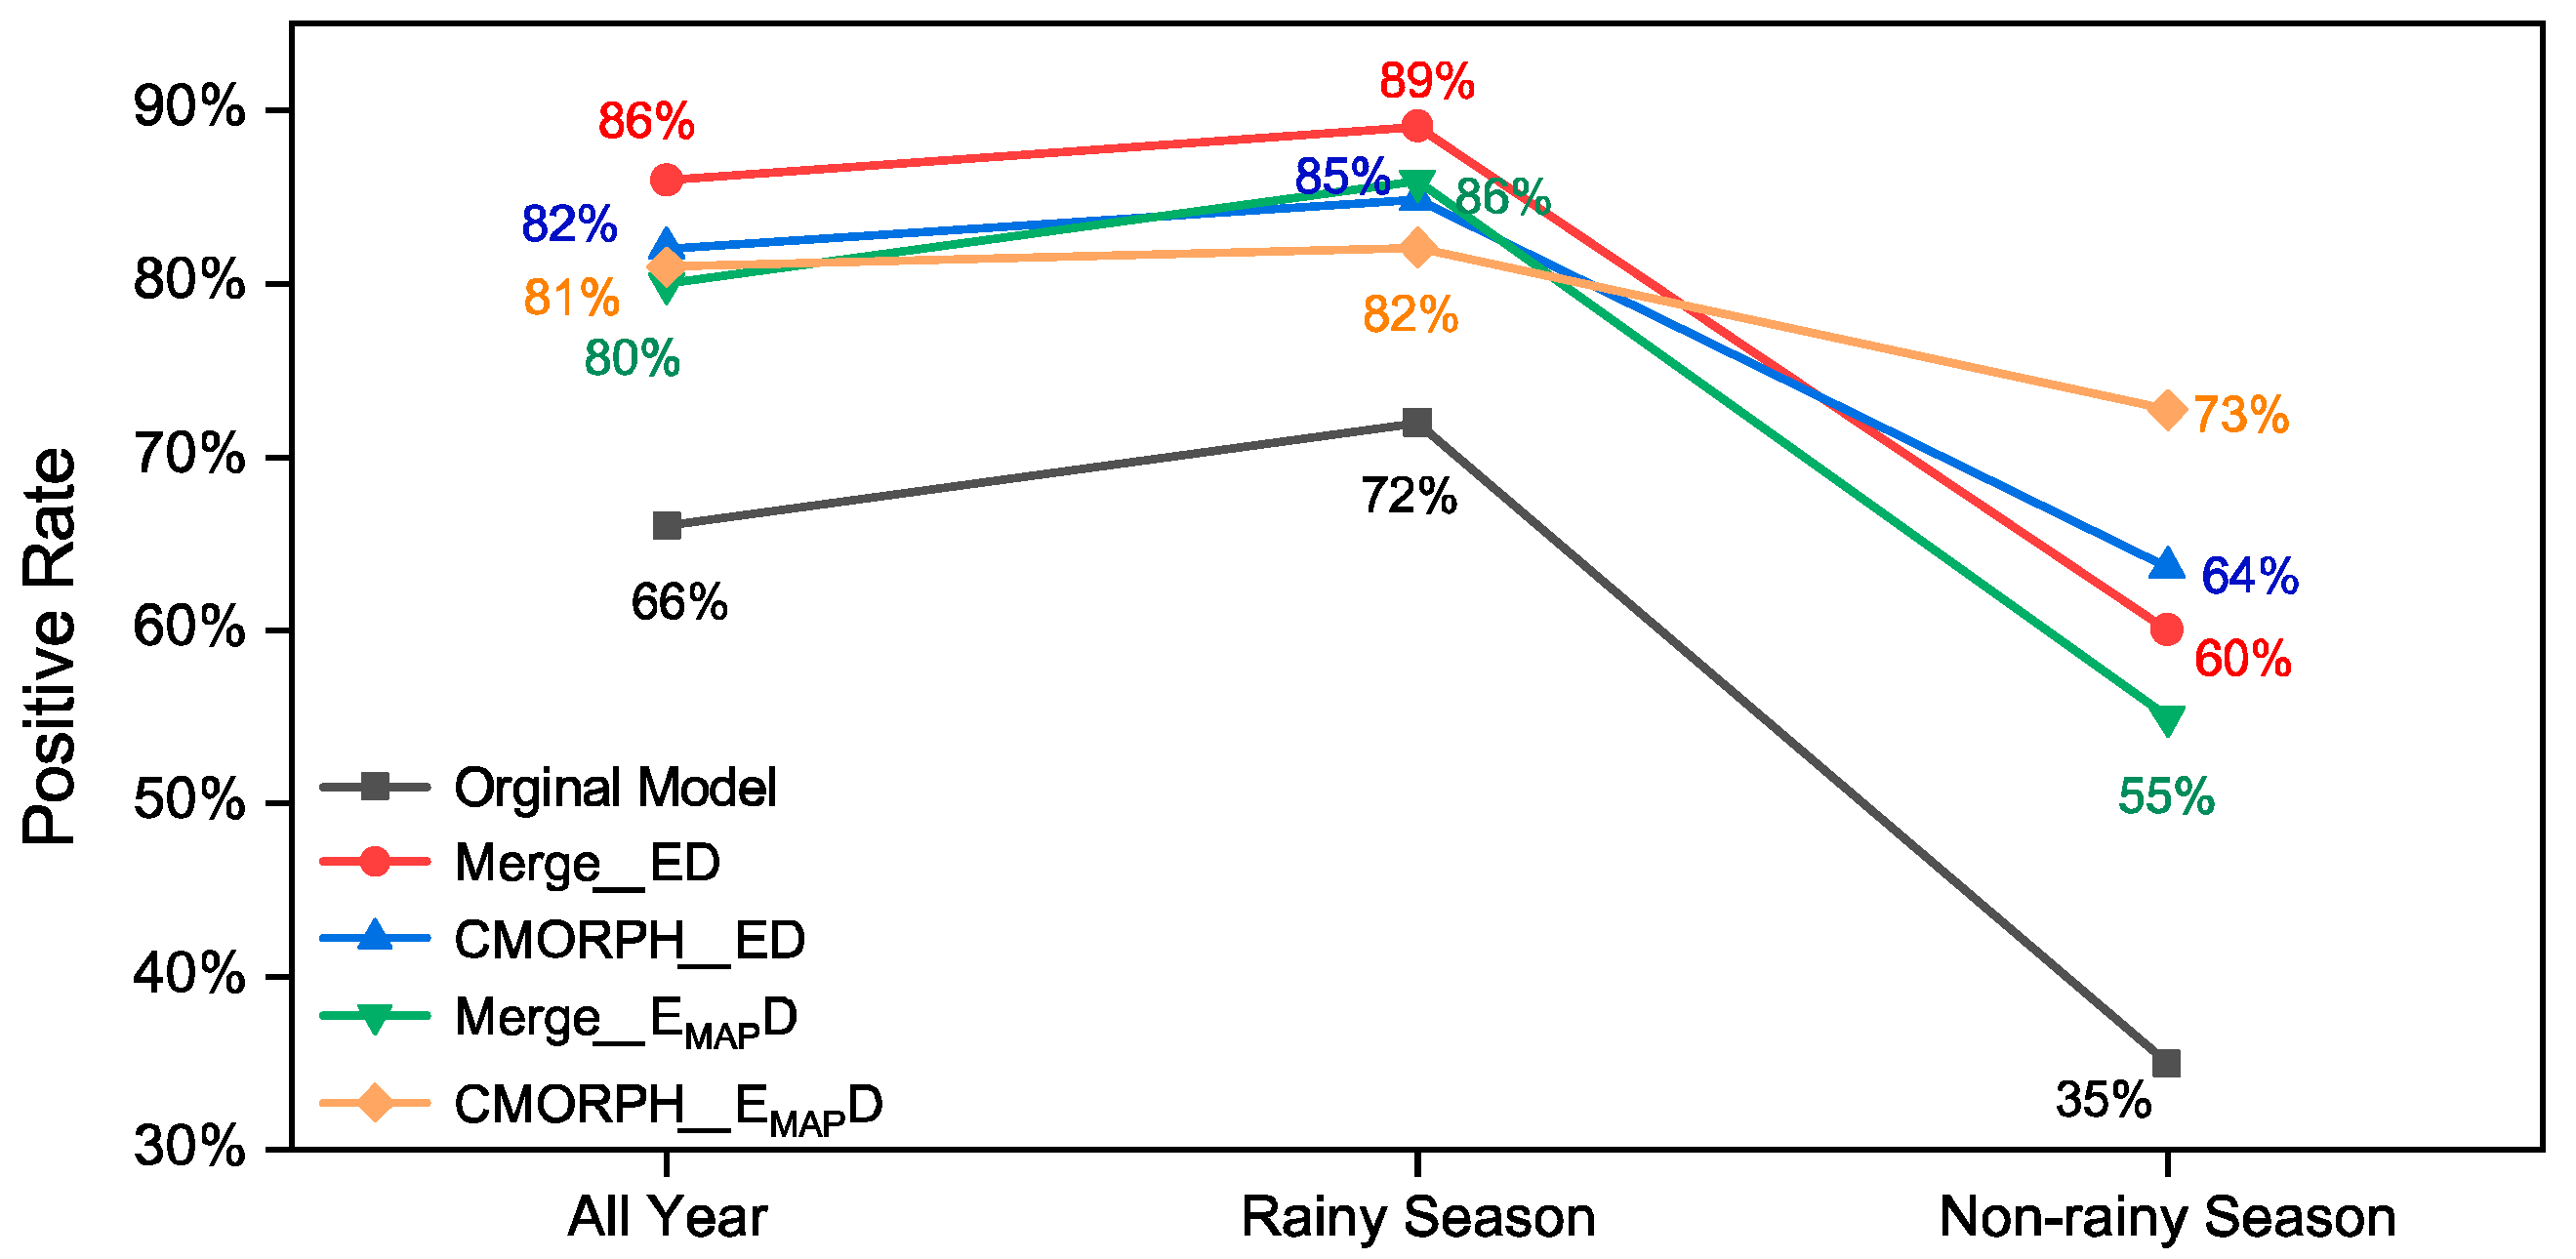
The rainfall thresholds are validated by the 106 landslide and debris flow events occurred during 2016–2017, and the rates of these events, which can be warned in advance by the thresholds in this paper or the original landslide model developed by Wang et al. (2016), is called a “positive rate” here [11]. As shown in Figure 7, it can be seen that the positive rate of the original statistical model for the landslide events in 2016–2017 is 66%, and that of the rainfall thresholds established in this paper is 80–86%. In the rainy season, the positive rate of the original model is 72%, while that of the improved rainfall thresholds is 82%–89%. In the non-rainy season, the positive rate of the original model is only 35%, while that of the improved rainfall thresholds reaches 55%–73%. The positive rates in the whole year, the rainy season and the non-rainy season have increased by 16%–20%, 10%–17% and 20%–38%, respectively. Thus, if these thresholds can be applied in the EWS, more landslides can be warned in advance.
Moreover, the “positive rate” is significantly improved if the thresholds in this study are adopted, however, a higher positive rate does not mean the threshold is better, because higher “positive rate” usually means the false alarm might also be higher, thus in real world application, the threshold defined in this paper should be carefully tested in real-time warning application. Actually, it’s impossible to calculate the false alarms because the landslide inventory collected in this study is incomplete. Although the number of events in the catalog is much more than that in previous studies, it’s still far from enough. For instance, according to the National Geological Disaster Bulletin, there is an average of 12,126 landslides per year during 2007–2016, but only a total of 771 events in 1998–2017 are collected through reports and the news online. So the false alarms would be inaccurate even if the calculation is conducted on them, which is one of the limitations in this study. In the future work, a more complete dataset of landslides and debris flows will be collected to find the most suitable rainfall thresholds for the warning of landslides and debris flows in the regression threshold lines at different quantile levels.
Furthermore, the differences between thresholds in different durations and seasons suggest that soil moisture plays an important role in the rainfall conditions triggering the landslides, and thus the antecedent rainfall is also important for landslides triggered by long-duration rainfall events. A detailed analysis of these factors, which is related to the physical process of landslide dynamic, is not provided in this study. The rainfall thresholds represent an empirical relationship between the landslides and rainfall that is generally similar to the parameterization of cloud processes in the weather model. Thus, it is still effective for the early warning of landslides. The uncertainty of forecasted precipitation in weather models has an important impact on the early warning of landslides. Recently, the ensemble forecast has been developed to cope with this uncertainty in weather models, which provides a new train of thought for the early warning of landslides. In further studies, based on the rainfall thresholds in this study and others, a landslide ensemble forecasting system (LEFS) is expected to be established to improve the prediction for landslides.
5. Conclusions
In this study, based on the landslide events occurred in China during 1998–2017, four groups of rainfall thresholds for landslide occurrence are defined by using the regression values at different quantile levels of the quantile regression. Based on both the merged rainfall product and the CMORH rainfall product, two kinds of rainfall thresholds—the cumulated event rainfall-rainfall duration thresholds (E–D) and the thresholds normalized by MAP (EMAP–D) are established respectively. Each group consists of four sub-thresholds in rainy season and non-rainy season (both are divided into short duration and long duration).
The slope of thresholds in the events with long durations is higher than that with short durations for thresholds below the quantile level of 50%, which may be due to different mechanisms of landslides triggered by long duration rainfall and short duration rainfall. The evaporation and antecedent rainfall become more important for landslides triggered by long duration rainfall events. Besides, the rainfall thresholds in the non-rainy season are generally lower than those in the rainy season.
The thresholds defined in this study are compared with those in previous studies. The E–D thresholds in this study are generally lower than most of the other thresholds, including the global thresholds, the regional and national thresholds in China, which may be because more landslide events in China were used in this study. Moreover, it also suggests that the combined effects of special geological environment, topographical relief and climate conditions make China suffer landslides more frequently and severely than other regions in the world. The landslide events occurred in 2016–2017 are used to validate the rainfall thresholds. Compared with the previous statistical model for landslides, based on the improved rainfall thresholds, the positive rates for the landslide and debris flow events have increased by 16%–20%, 10%–17% and 20%–38% in the whole year, rainy season and non-rainy season, respectively.
This paper aims to establish rainfall thresholds for its application in landside early warning systems. In addition to the triggering factors, the geological environment is also important, which decides the landslide susceptibility in a specific region. Thus, combining multiple rainfall thresholds with the landslide susceptibility map, and by using the real-time rainfall produced by CMORPH (CMORPH-RAW) and the forecasted rainfall from ensemble numerical weather prediction models, the LEFS will be established in future work. We expect it will contribute to saving lives and mitigating property damages caused by landslide disasters.
Author Contributions
Conceptualization, J.W.; methodology, J.W. and S.H.; software, J.W. and S.H.; validation, S.H. and S.L.; formal analysis, S.H.; investigation, S.H.; resources, J.W.; data curation, S.H.; writing—original draft preparation, S.H.; writing—review and editing, J.W.; visualization, S.H. and S.L.; supervision, J.W.; project administration, J.W.; funding acquisition, J.W. All authors have read and agreed to the published version of the manuscript.
Funding
This work was supported by the National Key Research and Development Program of China (Grant No. 2016YFA0600703) and the National Natural Science Foundation of China (Grant No.41605084).
Acknowledgments
We thank Wu Jia and Gao Xuejie for providing CN05.1 data. And we acknowledge the NOAA CPC for providing the CMORPH data and the Conservation Science Program of World Wildlife Fund for providing DEM. We thank Nanjing Hurricane Translation for reviewing the English language quality of this paper.
Conflicts of Interest
The funders had no role in the design of the study; in the collection, analyses, or interpretation of data; in the writing of the manuscript, or in the decision to publish the results.
References
- Kirschbaum, D.; Stanley, T.; Zhou, Y. Spatial and temporal analysis of a global landslide catalog. Geomorphology 2015, 249, 4–15. [Google Scholar] [CrossRef]
- Lin, Q.; Wang, Y. Spatial and temporal analysis of a fatal landslide inventory in China from 1950 to 2016. Landslides 2018, 15, 2357–2372. [Google Scholar] [CrossRef]
- Fischer, E.M.; Knutti, R. Anthropogenic contribution to global occurrence of heavy-precipitation and high-temperature extremes. Nat. Clim. Chang. 2015, 5, 560–564. [Google Scholar] [CrossRef]
- Crozier, M.J. Deciphering the effect of climate change on landslide activity: A review. Geomorphology 2010, 124, 260–267. [Google Scholar] [CrossRef]
- Gariano, S.L.; Guzzetti, F. Landslides in a changing climate. Earth Sci. Rev. 2016, 162, 227–252. [Google Scholar] [CrossRef] [Green Version]
- Saez, J.L.; Corona, C.; Stoffel, M.; Berger, F. Climate change increases frequency of shallow spring landslides in the French Alps. Geology 2013, 41, 619–622. [Google Scholar] [CrossRef]
- Campbell, R.H. Soil slopes, debris flows, and rainstorms in the Santa Monica Mountains and vicinity, southern California. U.S. U.S. Government Printing Office: Washington, DC, USA, 1975; Geological Survey professional paper volume 851, pp. 1–51. [Google Scholar]
- Baum, R.L.; Godt, J.W. Early warning of rainfall-induced shallow landslides and debris flows in the USA. Landslides 2009, 7, 259–272. [Google Scholar] [CrossRef]
- Devolo, G.; Kleivane, I. Landslide Early Warning System and Web Tools for Real-Time Scenarios and for Distribution of Warning Messages in Norway. Engineering Geology for Society and Territory; Graziella, D., Ingeborg, K., Monica, S., Nils-Kristian, O., Ragnar, E., Erik, J., Hervé, C., Eds.; Springer: Berlin, Germany, 2015; Volume 2, pp. 625–629. [Google Scholar]
- Osanai, N.; Shimizu, T.; Kuramoto, K.; Kojima, S.; Noro, T. Japanese early-warning for debris flows and slope failures using rainfall indices with Radial Basis Function Network. Landslides 2010, 7, 325–338. [Google Scholar] [CrossRef]
- Wang, J.; Wang, H.J.; Hong, Y. A Realtime Monitoring and Dynamical Forecasting System for Floods and Landslides in China; China Meteorological Press: Beijing, China, 2016; pp. 111–152. [Google Scholar]
- He, S.S.; Wang, J.; Wang, H.J. Projection of landslides in China during the 21st century under the RCP8.5 Scenario. J. Meteor. Res. 2019, 33, 138–148. [Google Scholar] [CrossRef]
- Huang, J.; Ju, N.P.; Liao, Y.J. Determination of rainfall thresholds for shallow landslides by a probabilistic and empirical method. Nat. Hazards Earth Syst. Sci. 2015, 15, 2715–2723. [Google Scholar] [CrossRef] [Green Version]
- Zhou, W.; Tang, C. Rainfall thresholds for debris flow initiation in the Wenchuan earthquake-stricken area, southwestern China. Landslides 2014, 11, 877–887. [Google Scholar] [CrossRef]
- Li, W.; Liu, C.; Scaioni, M.; Sun, W.; Chen, Y.; Yao, D.; Chen, S.; Hong, Y.; Zhang, K.; Cheng, G. Spatio-temporal analysis and simulation on shallow rainfall-induced landslides in China using landslide susceptibility dynamics and rainfall I-D thresholds. Sci. China Earth Sci. 2017, 60, 720–732. [Google Scholar] [CrossRef]
- Iverson, R.M. Landslide triggering by rain infiltration. Water Resour. Res. 2000, 36, 1897–1910. [Google Scholar] [CrossRef] [Green Version]
- Chung, M.-C.; Tan, C.-H.; Chen, C.-H. Local rainfall thresholds for forecasting landslide occurrence: Taipingshan landslide triggered by Typhoon Saola. Landslides 2016, 14, 19–33. [Google Scholar] [CrossRef]
- Wu, S.-J.; Hsiao, Y.-H.; Yeh, K.-C.; Yang, S.-H. A probabilistic model for evaluating the reliability of rainfall thresholds for shallow landslides based on uncertainties in rainfall characteristics and soil properties. Nat. Hazards 2017, 87, 469–513. [Google Scholar] [CrossRef]
- Posner, A.J.; Georgakakos, K.P. Soil moisture and precipitation thresholds for real-time landslide prediction in El Salvador. Landslides 2015, 12, 1179–1196. [Google Scholar] [CrossRef]
- Guzzetti, F.; Peruccacci, S.; Rossi, M.; Stark, C.P. Rainfall thresholds for the initiation of landslides in central and southern Europe. Meteorol. Atmos. Phys. 2007, 98, 239–267. [Google Scholar] [CrossRef]
- Giannecchini, R.; Yuri, G.; Michele, B. Rainfall Intensity-Duration Thresholds for Triggering Shallow Landslides in the Eastern Ligurian Riviera (Italy); Engineering Geology for Society and Territory; Graziella, D., Ingeborg, K., Monica, S., Nils-Kristian, O., Ragnar, E., Erik, J., Hervé, C., Eds.; Springer: Berlin, Germany, 2015; Volume 2, pp. 1581–1584. [Google Scholar]
- Segoni, S.; Rosi, A.; Rossi, G.; Catani, F.; Casagli, N. Analysing the relationship between rainfalls and landslides to define a mosaic of triggering thresholds for regional-scale warning systems. Nat. Hazards Earth Syst. Sci. 2014, 14, 2637–2648. [Google Scholar] [CrossRef] [Green Version]
- Rossi, M.; Luciani, S.; Valigi, D.; Kirschbaum, D.; Brunetti, M.T.; Peruccacci, S.; Guzzetti, F. Statistical approaches for the definition of landslide rainfall thresholds and their uncertainty using rain gauge and satellite data. Geomorphology 2017, 285, 16–27. [Google Scholar] [CrossRef]
- Saito, H.; Nakayama, D.; Matsuyama, H. Relationship between the initiation of a shallow landslide and rainfall intensity—Duration thresholds in Japan. Geomorphology 2010, 118, 167–175. [Google Scholar] [CrossRef]
- Guzzetti, F.; Rossi, M.P.; Stark, C.P. The rainfall intensity-duration control of shallow landslides and debris flows: An update. Landslides 2008, 5, 3–17. [Google Scholar] [CrossRef]
- Lehner, B.; Verdin, K.; Jarvis, A. HydroSHEDS Technical Documentation; User’s Guide; Lehner, B., Verdin, K., Jarvis, A., Eds.; World Wildlife Fund US: Washington, DC, USA, 2006. [Google Scholar]
- Shen, Y.; Pan, Y.; Yu, J.; Zhao, P.; Zhou, Z. Quality assessment of hourly merged precipitation product over China. Trans. Atmos. Sci. 2013, 36, 37–46. [Google Scholar]
- Joyce, R.J.; Janowiak, J.E.; Arkin, P.A.; Xie, P. CMORPH: A method that produces global precipitation estimates from passive microwave and infrared data at high spatial and temporal resolution. J. Hydrometeorol. 2004, 5, 487–503. [Google Scholar] [CrossRef]
- Wu, J.; Gao, X. A gridded daily observation dataset over China region and comparison with the other datasets. Chin. J. Geophys. 2013, 56, 1102–1111. [Google Scholar]
- Segoni, S.; Piciullo, L.; Gariano, S.L. A review of the recent literature on rainfall thresholds for landslide occurrence. Landslides 2018, 15, 1483–1501. [Google Scholar] [CrossRef]
- Chen, S.; Hu, J.J.; Zhang, A.; Min, C.; Huang, C.Y.; Liang, Z.Q. Performance of near real-time Global Satellite Mapping of Precipitation estimates during heavy precipitation events over northern China. Theor. Appl. Climatol. 2019, 135, 877–891. [Google Scholar] [CrossRef]
- Li, C.M.; Tang, G.Q.; Hong, Y. Cross-evaluation of ground-based, multi-satellite and reanalysis precipitation products: Applicability of the Triple Collocation method across Mainland China. J. Hydrol. 2018, 562, 71–83. [Google Scholar] [CrossRef]
- Wei, G.H.; Lu, H.S.; Crow, W.T.; Zhu, Y.H.; Wang, J.Q.; Su, J.B. Comprehensive evaluation of GPM-IMERG, CMORPH, and TMPA precipitation products with gauged rainfall over mainland China. Adv. Meteorol. 2018, 2018, 1–18. [Google Scholar] [CrossRef] [Green Version]
- Xu, Y.; Gao, X.; Shen, Y.; Xu, C.; Shi, Y.; Giorgi, F. A daily temperature dataset over China and its application in validating a RCM simulation. Adv. Atmos. Sci. 2009, 26, 763–772. [Google Scholar] [CrossRef]
- Aleotti, P. A warning system for rainfall-induced shallow failures. Eng. Geol. 2004, 73, 247–265. [Google Scholar] [CrossRef]
- Giannecchini, R. Rainfall triggering soil slips in the southern Apuan Alps (Tuscany, Italy). Adv. Geosci. 2005, 2, 21–24. [Google Scholar] [CrossRef] [Green Version]
- Brunetti, M.T.; Peruccacci, S.; Rossi, M.; Luciani, S.; Valigi, D.; Guzzetti, F. Rainfall thresholds for the possible occurrence of landslides in Italy. Nat. Hazards Earth Syst. Sci. 2010, 10, 447–458. [Google Scholar] [CrossRef]
- Koenker, R.; Hallock, K.F. Quantile regression. J. Econ. Perspect. 2001, 15, 143–156. [Google Scholar] [CrossRef]
- Team, R.C. R: A Language and Environment for Statistical Computing; User’s Guide; R Core Team: R Foundation for Statistical Computing: Vienna, Austria, 2017. [Google Scholar]
- Koenker, R. Quantile Regression in R: A Vignette. In Quantile Regression (Econometric Society Monographs); Cambridge University Press: Cambridge, UK, 2005; pp. 295–316. [Google Scholar] [CrossRef]
- Ding, Y.; Wang, Z. A study of rainy seasons in China. Meteorol. Atmos. Phys. 2008, 100, 121–138. [Google Scholar]
- Pradhan, A.M.S.; Lee, S.R.; Kim, Y.T. A shallow slide prediction model combining rainfall threshold warnings and shallow slide susceptibility in Busan, Korea. Landslides 2018, 16, 647–659. [Google Scholar] [CrossRef]
- Caine, N. The rainfall intensity: Duration control of shallow landslides and debris flows. Geografiska annaler. Ser. A Phys. Geogr. 1980, 62, 23–27. [Google Scholar]
- Hong, Y.; Robert, F. Adle; J.G. Evaluation of the potential of NASA multi-satellite precipitation analysis in global landslide hazard assessment. Geophys. Res. Lett. 2007, 33, L22402. [Google Scholar] [CrossRef]
- Innes, J.L. Debris flows. Prog. Phys. Geogr. 1983, 7, 469–501. [Google Scholar] [CrossRef]
- Jibson, R.W. Debris flows in southern Puerto Rico. Spec. Pap. Geol. Soc. Am. 1989, 236, 29–56. [Google Scholar]
- Ma, T.; Li, C.; Lu, Z.; Bao, Q. Rainfall intensity–Duration thresholds for the initiation of landslides in Zhejiang Province, China. Geomorphology 2015, 245, 193–206. [Google Scholar] [CrossRef]
- Chien-Yuan, C.; Tien-Chien, C.; Fan-Chieh, Y.; Wen-Hui, Y.; Chun-Chieh, T. Rainfall duration and debris-Flow initiated studies for real-time monitoring. Environ. Geol. 2005, 47, 715–724. [Google Scholar] [CrossRef]
- Chen, H.; Wang, J. Regression analyses for the minimum intensity-duration conditions of continuous rainfall for mudflows triggering in Yan’an, northern Shaanxi (China). Bull. Eng. Geol. Environ. 2014, 73, 917–928. [Google Scholar] [CrossRef]
- Dahal, R.K.; Hasegawa, S. Representative rainfall thresholds for landslides in the Nepal Himalaya. Geomorphology 2008, 100, 429–443. [Google Scholar] [CrossRef]
Figure 1.
Location of landslides collected during 1998–2017 in China and the elevation (unit: m) distribution.
Figure 1.
Location of landslides collected during 1998–2017 in China and the elevation (unit: m) distribution.

Figure 2.
Mean annual precipitation (MAP) distribution in China during the period of 1981–2010.

Figure 3.
Event–duration (E–D) conditions of landslides calculated by the merged rainfall in the (a) rainy season and (b) non-rainy season, and by the Climate Prediction Center Morphing (CMORPH) rainfall in the (c) rainy season and (d) non-rainy season with different quantile regression lines (5%, 10%, 20%, 30%, 40%, 50%, 60%, 70%, 80% and 90% from bottom to top).

Figure 4.
Same as Figure 3, but for normalized E–D thresholds (EMAP–D).
Figure 4.
Same as Figure 3, but for normalized E–D thresholds (EMAP–D).

Figure 5.
Comparison between E–D thresholds defined in this work and previous published thresholds. The numbers refer to No. in Table 4.
Figure 5.
Comparison between E–D thresholds defined in this work and previous published thresholds. The numbers refer to No. in Table 4.

Figure 6.
Comparison between the EMAP–D thresholds defined in this study and previous published thresholds. The numbers refer to No. in Table 4.
Figure 6.
Comparison between the EMAP–D thresholds defined in this study and previous published thresholds. The numbers refer to No. in Table 4.

Figure 7.
Comparison of positive rates between the improved thresholds and those in the original model [11].
Figure 7.
Comparison of positive rates between the improved thresholds and those in the original model [11].


Table 1.
Information of landslide inventory in China during 1998–2017. NE: number of landslide events; S1: province; S2: prefecture-level region; S3: county/district; S4: village/town/country/site; T1: day; T2: hour; L: landslides; DF: debris flow; RF: rock fall.
Table 1.
Information of landslide inventory in China during 1998–2017. NE: number of landslide events; S1: province; S2: prefecture-level region; S3: county/district; S4: village/town/country/site; T1: day; T2: hour; L: landslides; DF: debris flow; RF: rock fall.
| Year | NE | Spatial Accuracy | Temporal Accuracy | Landslide Types | ||||||
|---|---|---|---|---|---|---|---|---|---|---|
| S1 | S2 | S3 | S4 | T1 | T2 | L | DF | RF | ||
| 1998 | 24 | 0 | 1 | 1 | 22 | 24 | 0 | 24 | 0 | 0 |
| 1999 | 19 | 0 | 0 | 0 | 19 | 19 | 0 | 19 | 0 | 0 |
| 2000 | 17 | 0 | 1 | 2 | 14 | 17 | 0 | 17 | 0 | 0 |
| 2001 | 7 | 0 | 2 | 0 | 5 | 7 | 0 | 7 | 0 | 0 |
| 2002 | 4 | 0 | 0 | 1 | 3 | 1 | 3 | 3 | 1 | 0 |
| 2003 | 35 | 5 | 13 | 12 | 5 | 35 | 0 | 35 | 0 | 0 |
| 2004 | 10 | 0 | 2 | 2 | 6 | 10 | 0 | 10 | 0 | 0 |
| 2005 | 11 | 0 | 1 | 2 | 8 | 8 | 3 | 9 | 2 | 0 |
| 2006 | 15 | 0 | 0 | 0 | 15 | 7 | 8 | 7 | 6 | 2 |
| 2007 | 65 | 10 | 13 | 10 | 32 | 57 | 8 | 45 | 17 | 3 |
| 2008 | 73 | 7 | 19 | 16 | 31 | 73 | 0 | 61 | 11 | 1 |
| 2009 | 80 | 1 | 5 | 26 | 48 | 59 | 21 | 60 | 14 | 6 |
| 2010 | 73 | 0 | 11 | 38 | 24 | 57 | 16 | 63 | 6 | 4 |
| 2011 | 39 | 0 | 0 | 25 | 14 | 34 | 5 | 28 | 6 | 5 |
| 2012 | 49 | 1 | 5 | 21 | 22 | 49 | 0 | 23 | 13 | 13 |
| 2013 | 58 | 0 | 6 | 38 | 14 | 58 | 0 | 36 | 5 | 17 |
| 2014 | 40 | 0 | 3 | 34 | 3 | 40 | 0 | 20 | 3 | 17 |
| 2015 | 29 | 0 | 1 | 22 | 6 | 29 | 0 | 14 | 5 | 10 |
| 2016 | 75 | 0 | 4 | 34 | 37 | 29 | 46 | 62 | 13 | 0 |
| 2017 | 48 | 0 | 0 | 2 | 46 | 10 | 38 | 38 | 10 | 0 |
| Total | 771 | 24 | 87 | 286 | 374 | 623 | 148 | 581 | 112 | 78 |
| Percent | 100 | 3.1% | 11.3% | 37.0% | 48.6% | 80.8% | 19.2% | 75.4% | 14.5% | 10.1% |
Table 2.
Coefficients of intercept α and slope γ at different levels of quantile regression lines obtained by combining precipitation and CMORPH precipitation.
Table 2.
Coefficients of intercept α and slope γ at different levels of quantile regression lines obtained by combining precipitation and CMORPH precipitation.
| Season | Rainy Season | Non-Rainy Season | ||||||
|---|---|---|---|---|---|---|---|---|
| Duration | D < 48 h | D ≥ 48 h | D < 48 h | D ≥ 48 h | ||||
| Coefficient | α | γ | α | γ | α | γ | α | γ |
| Merged-5% | 0.49 | 0.47 | 0.01 | 1.48 | 0.45 | 0.68 | 0.01 | 1.61 |
| 10% | 0.53 | 0.69 | 0.03 | 1.33 | 0.38 | 0.78 | 0.06 | 1.20 |
| 20% | 0.98 | 0.70 | 0.11 | 1.22 | 0.65 | 0.67 | 0.28 | 0.96 |
| 30% | 1.63 | 0.62 | 0.09 | 1.30 | 0.62 | 0.80 | 0.12 | 1.17 |
| 40% | 1.41 | 0.75 | 0.46 | 1.03 | 0.72 | 0.90 | 0.19 | 1.13 |
| 50% | 1.69 | 0.79 | 0.88 | 0.93 | 1.24 | 0.79 | 0.29 | 1.07 |
| 60% | 2.50 | 0.76 | 1.81 | 0.83 | 1.10 | 0.96 | 0.36 | 1.05 |
| 70% | 3.42 | 0.73 | 2.71 | 0.77 | 2.26 | 0.83 | 0.42 | 1.10 |
| 80% | 3.77 | 0.82 | 2.83 | 0.78 | 4.98 | 0.66 | 0.19 | 1.33 |
| 90% | 4.07 | 1.00 | 18.94 | 0.46 | 4.36 | 0.85 | 6.81 | 0.67 |
| CMORPH-5% | 0.53 | 0.53 | 0.28 | 0.96 | 1.20 | 0.07 | 0.00 | 1.94 |
| 10% | 0.55 | 0.61 | 0.32 | 1.00 | 1.20 | 0.30 | 0.16 | 1.01 |
| 20% | 0.78 | 0.65 | 1.55 | 0.71 | 1.20 | 0.49 | 0.58 | 0.78 |
| 30% | 1.10 | 0.67 | 1.71 | 0.72 | 1.20 | 0.68 | 0.12 | 1.22 |
| 40% | 1.54 | 0.66 | 0.59 | 1.02 | 1.26 | 0.73 | 0.74 | 0.92 |
| 50% | 1.88 | 0.72 | 2.22 | 0.79 | 1.61 | 0.73 | 1.13 | 0.85 |
| 60% | 3.10 | 0.62 | 5.02 | 0.65 | 2.06 | 0.76 | 1.61 | 0.79 |
| 70% | 5.00 | 0.59 | 13.93 | 0.48 | 2.14 | 0.78 | 4.92 | 0.60 |
| 80% | 6.73 | 0.62 | 12.76 | 0.56 | 2.47 | 0.84 | 6.54 | 0.55 |
| 90% | 9.52 | 0.67 | 37.00 | 0.38 | 2.41 | 0.99 | 11.73 | 0.46 |
Table 3.
Same as Table 2, but for the coefficients of EMAP–D thresholds. (EMAP–D: E–D thresholds normalized by mean annual precipitation).
Table 3.
Same as Table 2, but for the coefficients of EMAP–D thresholds. (EMAP–D: E–D thresholds normalized by mean annual precipitation).
| Season | Rainy Season | Non-Rainy Season | ||||||
|---|---|---|---|---|---|---|---|---|
| Duration | D < 48 h | D ≥ 48 h | Duration | D < 48 h | ||||
| Coefficient | α | γ | α | γ | α | γ | α | γ |
| Merged-5% | 0.00026 | 0.68 | 0.00002 | 1.38 | 0.00060 | 0.45 | 0.00001 | 1.51 |
| 10% | 0.00054 | 0.76 | 0.00003 | 1.37 | 0.00075 | 0.38 | 0.00005 | 1.20 |
| 20% | 0.00051 | 0.87 | 0.00010 | 1.20 | 0.00064 | 0.60 | 0.00034 | 0.87 |
| 30% | 0.00166 | 0.60 | 0.00034 | 1.02 | 0.00077 | 0.64 | 0.00029 | 0.99 |
| 40% | 0.00213 | 0.64 | 0.00149 | 0.76 | 0.00066 | 0.92 | 0.00027 | 1.01 |
| 50% | 0.00489 | 0.46 | 0.00178 | 0.77 | 0.00058 | 1.09 | 0.00034 | 0.98 |
| 60% | 0.00486 | 0.54 | 0.00292 | 0.70 | 0.00244 | 0.70 | 0.00023 | 1.09 |
| 70% | 0.00808 | 0.44 | 0.00499 | 0.61 | 0.00274 | 0.69 | 0.00064 | 0.91 |
| 80% | 0.00774 | 0.58 | 0.01156 | 0.48 | 0.00273 | 0.74 | 0.00044 | 1.07 |
| 90% | 0.02439 | 0.32 | 0.02960 | 0.32 | 0.00234 | 0.96 | 0.00245 | 0.80 |
| CMORPH-5% | 0.00044 | 0.63 | 0.00025 | 0.97 | 0.00036 | 0.67 | 0.00000 | 1.66 |
| 10% | 0.00071 | 0.56 | 0.00046 | 0.87 | 0.00069 | 0.65 | 0.00004 | 1.23 |
| 20% | 0.00093 | 0.60 | 0.00068 | 0.84 | 0.00077 | 0.66 | 0.00028 | 0.90 |
| 30% | 0.00136 | 0.62 | 0.00147 | 0.73 | 0.00158 | 0.51 | 0.00005 | 1.41 |
| 40% | 0.00211 | 0.58 | 0.00191 | 0.72 | 0.00161 | 0.61 | 0.00007 | 1.36 |
| 50% | 0.00439 | 0.41 | 0.00770 | 0.47 | 0.00191 | 0.62 | 0.00020 | 1.17 |
| 60% | 0.00414 | 0.54 | 0.00623 | 0.56 | 0.00191 | 0.67 | 0.00028 | 1.11 |
| 70% | 0.00570 | 0.54 | 0.01022 | 0.50 | 0.00193 | 0.73 | 0.00085 | 0.93 |
| 80% | 0.01165 | 0.42 | 0.07585 | 0.12 | 0.00191 | 0.91 | 0.00129 | 0.86 |
| 90% | 0.02423 | 0.27 | 0.12788 | 0.06 | 0.00305 | 0.83 | 0.00136 | 0.85 |
Table 4.
Rainfall thresholds for landslide occurrence in this work compared with those in previous publications.
Table 4.
Rainfall thresholds for landslide occurrence in this work compared with those in previous publications.
| No. | Reference | Equation | Range(h) | Area |
|---|---|---|---|---|
| 1 | (Caine, 1980) [43] | I = 14.84D−0.39 | 0.167 < D < 240 | world |
| 2 | (Innes, 1983) [45] | E = 4.93D0.504 | 0.1 < D < 1000 | world |
| 3 | (Guzzetti et al., 2008) [25] | I = 2.20D−0.44 | 0.1 < D < 1000 | world |
| 3-1 | (Guzzetti et al., 2008) [25] | I = 2.28D−0.2 | 0.1 < D < 48 | world |
| 3-2 | (Guzzetti et al., 2008) [25] | I = 0.48D−0.11 | 48 ≤ D < 1000 | world |
| 4 | (Hong et al., 2007) [44] | I = 12.45D−0.42 | 0.1 < D < 500 | world |
| 5 | (Jibson, 1989) [46] | I = 39.71D−0.62 | 0.5 < D < 12 | Japan |
| 6 | (Li et al., 2017) [15] | I = 85.72D−1.15 | 3 < D < 45 | China |
| 7 | (Chien-Yuan et al., 2005) [48] | I = 115.47D−0.8 | 1 < D < 400 | Taiwan |
| 8 | (Jibson, 1989) [46] | I = 41.83D−0.85 | 1 < D < 12 | Hong Kong |
| 9 | (Ma et al., 2015) [47] | I = 52.86D−0.45 | 1 ≤ D ≤ 24 | Zhejiang, China |
| 10 | (Chen and Wang, 2014) [49] | I = 0.448D−0.08654 | 24 < D < 336 | Yanan, Shanxi, China |
| (Dahal et al., 2008) [50] | I = 73.90D−0.79 | 5 < D | Himalaya, Nepal | |
| 11-1 | This work | E = 0.53D0.7 | 1 ≤ D ≤ 44 | China, rainy season, merge rainfall |
| 11-2 | This work | E = 0.032D1.33 | 48 ≤ D ≤ 412 | China, rainy season, merge rainfall |
| 11-3 | This work | E = 0.45D0.68 | 2 ≤ D ≤ 44 | China, non-rainy season, merge rainfall |
| 11-4 | This work | E = 0.064D1.18 | 49 ≤ D ≤ 291 | China, non-rainy season, merge rainfall |
| 12-1 | This work | E = 0.86D0.48 | 1 ≤ D ≤ 47 | China, rainy season, CMORPH rainfall |
| 12-2 | This work | E = 0.18D1.07 | 48 ≤ D ≤ 602 | China, rainy season, CMORPH rainfall |
| 12-3 | This work | E = 0.48D0.65 | 1 ≤ D ≤ 47 | China, non-rainy season, CMORPH rainfall |
| 12-4 | This work | E = 0.59D0.84 | 48 ≤ D ≤ 248 | China, non-rainy season, CMORPH rainfall |
Table 5.
EMAP–D rainfall thresholds for landslide occurrence in this study compared with those in previous publications.
Table 5.
EMAP–D rainfall thresholds for landslide occurrence in this study compared with those in previous publications.
| No. | Reference | Equation | Range(h) | Area |
|---|---|---|---|---|
| 1 | (Guzzetti et al., 2008) [25] | IMAP = 0.0016D−0.4 | 0.1 < D < 1000 | world |
| 1-1 | (Guzzetti et al., 2008) [25] | IMAP = 0.0017D−0.13 | 0.1 < D < 48 | world |
| 1-2 | (Guzzetti et al., 2008) [25] | IMAP = 0.0005D−0.13 | 48 ≤ D < 1000 | world |
| 2 | (Saito et al., 2010) [24] | IMAP = 0.0007D−0.21 | 3 < D < 357 | Japan |
| 3 | (Jibson, 1989) [46] | IMAP = 0.02D−0.68 | 1 < D < 12 | Hong Kong |
| 4-1 | this work | EMAP = 0.00053D0.78 | 1 ≤ D ≤ 44 | China, rainy season, Merge rainfall |
| 4-2 | this work | EMAP = 0.00005D1.28 | 48 ≤ D ≤ 412 | China, rainy season, Merge rainfall |
| 4-3 | this work | EMAP = 0.00074D0.4 | 2 ≤ D ≤ 44 | China, non-rainy season, Merge rainfall |
| 4-4 | this work | EMAP = 0.000054D1.2 | 49 ≤ D ≤ 291 | China, non-rainy season, Merge rainfall |
| 5-1 | this work | EMAP = 0.00057D0.6 | 1 ≤ D ≤ 47 | China, rainy season, CMORPH rainfall |
| 5-2 | this work | EMAP = 0.00024D1 | 48 ≤ D ≤ 602 | China, rainy season, CMORPH rainfall |
| 5-3 | this work | EMAP = 0.00089D0.41 | 1 ≤ D ≤ 47 | China, non-rainy season, CMORPH rainfall |
| 5-4 | this work | EMAP = 0.00017D1.05 | 48 ≤ D ≤ 248 | China, non-rainy season, CMORPH rainfall |
© 2020 by the authors. Licensee MDPI, Basel, Switzerland. This article is an open access article distributed under the terms and conditions of the Creative Commons Attribution (CC BY) license (http://creativecommons.org/licenses/by/4.0/).
Share and Cite
MDPI and ACS Style
He, S.; Wang, J.; Liu, S. Rainfall Event–Duration Thresholds for Landslide Occurrences in China. Water 2020, 12, 494. https://doi.org/10.3390/w12020494
AMA Style
He S, Wang J, Liu S. Rainfall Event–Duration Thresholds for Landslide Occurrences in China. Water. 2020; 12(2):494. https://doi.org/10.3390/w12020494
Chicago/Turabian StyleHe, Shuangshuang, Jun Wang, and Songnan Liu. 2020. "Rainfall Event–Duration Thresholds for Landslide Occurrences in China" Water 12, no. 2: 494. https://doi.org/10.3390/w12020494
Note that from the first issue of 2016, this journal uses article numbers instead of page numbers. See further details here.