Environmental Sustainability Assessment of a New Sewage Treatment Plant in China Based on Infrastructure Construction and Operation Phases Emergy Analysis


1
School of Architecture, Southeast University, Nanjing 210096, China
2
State Key Laboratory of Biogeology and Environmental Geology, Environmental School, China University of Geosciences, Wuhan 430070, China
*
Author to whom correspondence should be addressed.
Water 2020, 12(2), 484; https://doi.org/10.3390/w12020484
Submission received: 30 January 2020
/
Accepted: 7 February 2020
/
Published: 11 February 2020
(This article belongs to the Section Wastewater Treatment and Reuse)
Abstract
:Due to excessive resource consumption and pressing environmental issues of the sewage treatment industry, there is extensive attention in China. Given the unique craft production process in the sewage treatment system, a series of integral emergy indicators have been used to evaluate the environmental sustainability based on infrastructure construction and operation stage emergy analysis. Taking a new typical sewage treatment plant as an example, this paper performed a case study. The results illustrate that (1) the infrastructure construction process emergy (approximate 92.6%) is more critical than sewage treatment process emergy; (2) nonrenewable resource is the primary factor for the emergy analysis, followed by energy (23.5%) and purchased supply (7%); (3) cement, steel, and gravel have dominant impacts on the nonrenewable resource emergy; (4) the emergy sustainability index is 0.001101, which displays weak environmental sustainability; (5) the unit emergy value (UEV) of the new sewage treatment plant is 3.40 × 10¹² sej/m3; (6) sensitivity analysis results of the hypothesis demonstrate that nonrenewable resources have significant fluctuations (6.903%) while, for the indicators, emergy sustainability index (ESI) (4.8072%) has the most significant impact; and (7) wastewater is a major contributor. In light of comprehensive discussions, two positive measures are proposed in order to ameliorate the environmental sustainability.
1. Introduction
As the world’s largest developing country, there is massive sewage discharge every year in order to meet the needs of life and economic development in China. For example, 73.53 billion tons of wastewater was treated in 2015, such as 22.235 million tons of Chemical Oxygen Demand (COD) and 2.299 million tons of NH3-N in China [1]. Total sewage treatment depends on the sewage treatment plant in China. As a manually designed system, sewage treatment plants need to consume a lot of resources and energy for sewage treatment; meanwhile, a large number of pollutants will be discharged, including exhaust gas, wastewater, and sludge waste [2]. Therefore, a series of resource, energy, and environmental issues will be generated; meanwhile, they can bring environmentally severe load and items for China, especially since China’s economy has entered a period of rapid growth from the reform in the 1980s [3,4]. Under such a circumstance, it is necessary to evaluate the environmental sustainability in the sewage treatment industry.
Until now, several sustainable studies have been considered widely in view of different analysis perspectives for the sewage treatment industry. Many scholars have studied the relationship between the environment in the sewage treatment industry using biological perspective analysis [5,6,7,8], lifecycle assessment (LCA) perspective [9], ecology models perspective [10], energy and economy performances [11], sewage treatment and water supply efficiency [12], chemical and physical angles [13,14], construction in the wastewater treatment plants [15], integrating wastewater treatment and incineration plants for energy-efficient study [16], sampling strategy for the sewage sludge survey [17], soil and the treatment of sewage treatment plant [18], and systematic assessment framework [19].
However, these studies have the following drawbacks: (1) for the isolated angles analysis, only one or some perspectives are chosen to demonstrate the interaction between environmental issues and the sewage treatment industry, resulting in a few unilateral conclusions; (2) ignorance of natural resources assessment leads to a negative impact on sustainability in the sewage treatment industry; (3) undifferentiated contribution degrees from different resource types could cause deviation inaccuracy to some extent; (4) there is a lack of a unified platform to evaluate sustainability in the sewage treatment industry, for example, an integrated method assessment should comprise resources, energy, labor, and others; and (5) some studies are unable to consider multiple pollutant emissions simultaneously, such as exhaust gas, wastewater, and solid waste. It will have a harmful effect on sustainability in the sewage treatment industry. In summary, the above studies cannot display the entire evaluated result in the sewage treatment industry.
Compared to the methodologies mentioned above, the emergy analysis (EMA) can improve these shortcomings and was put forward by Odum [20]. EMA could realize a unified platform to compare different types of input through unit emergy values (UEVs), involving natural resources, energy, labor, and environmental pollutants. Therefore, it can be selected to assess the various types of natural, artificial, and complex systems effectively. Meanwhile, natural resource efficiency, environmental issue, and sustainable degree can be illustrated clearly through a series of emergy indicators to finally obtain an authoritative assessment result for the targeted system. Sustainability assessments are hot topics based on emergy analysis (EMA) and contain a large quantity of different types related to agricultural studies [21,22], city assessments [23,24], green building field [25,26], production systems [27,28], national research [29], pollutant treatment [30], and traffic range [31].
Until now, several studies have been investigated to use the emergy approach in the sewage treatment industry. Yan et al. used an example of the Chinese sewage treatment industry to analyze the environmental sustainability issues based on the emergy method [32]. Based on the municipal sewage treatment ecosystem, XiaoHong et al. evaluated the sustainable degree by making use of the emergy method [33]. In view of four different wastewater treatment plants, sustainability and feasibility have been assessed using improved emergy indicators in the sewage treatment industry by F.L. da et al. [34]. Taking the wastewater treatment in Happy Farmer’s Home as an example, Junsheng et al. confirmed several influencing factors on sustainability in China [35]. Natalia et al. conducted the emergy assessment in a wastewater treatment plant, which compared two management alternatives of biosolids [36]. The wastewater treatment system from a sugar factory in Sweden was assessed on the basis of the emergy theory [37]. Paolo et al. proposed a preliminary evaluation of a wastewater treatment plant system by considering the environmental costs of natural fluxes [38]. The ecological and economic effect of a decentralized sewage treatment plant was been surveyed by some authors [39]. Through a sewage treatment system before and after implementing a cleaner production measure, XiaoHong et al. executed two emergy evaluations to assess sustainability [40].
Several weak points can be found in these papers (shown in Table 1), including (1) a lack of infrastructure emergy consideration, in which, through the collation of current literature, the infrastructure emergy has not been taken into account in the sewage treatment system to assess environmental sustainability (shown in Table 1); (2) the use of an old emergy baseline, in which some articles use past emergy baselines rather than the latest emergy baseline; (3) the lack of pollutant evaluations, in which, in most items in Table 1, pollutants are not considered for the sewage treatment industry, such as exhaust gas, wastewater, and solid waste; for environmental sustainability in the sewage treatment industry, it is necessary to assess the pollutant effect on the system; and (4) incomplete emergy indicators, in which only fundamental indicators had been computed in these papers and have no improved indexes based on infrastructure emergy, running emergy, and pollutant emergy for sewage treatment system evaluation. The above four disadvantages indicate that it is necessary to have a sustainable assessment for the sewage treatment industry based on emergy analysis (EMA) in China.
This paper aims to assess the environmental sustainability degree of the sewage treatment industry system through the EMA method. A new sewage treatment plant has been chosen for evaluation as an example, and all essential data can be obtained by investigation and calculation. Its contributions depend on several views, as follows: (1) considering the complete angles to assess the sewage treatment system, including infrastructure emergy, running emergy, and pollutant emergy; (2) establishing an improved and integral emergy analysis (EMA) and sustainable indicator group to evaluate the sewage treatment industry system; (3) calculating the unit emergy value of sewage treatment industry in China based on the environmental severity situation; and (4) proposing the corresponding strategies as reference for the factory manager.
Finally, the structure of the entire article is organized as follows: After the introduction section, Section 2 shows the methodology, including primary data and situation of the new sewage treatment plant, emergy analysis group, and industrial pollutant emergy details. Section 3 presents the results and discussion, containing main emergy calculated tables, emergy analysis, emergy indicators analysis, UEVs, sensitivity analysis, and industrial pollutant analysis. Section 4 discusses preventive strategies and positive suggestions. Finally, the main conclusions are summed up in Section 5.
2. Data and Methods
2.1. Basic Situation and Data of the New Sewage Treatment Plant
The new sewage treatment plant is in Shanghai city, along the Yangtze River in China. Shanghai is located between 120°52’ to 122°12’ east longitude and 30°40’ to 31°53’ north latitude and has a subtropical monsoon climate, with an annual temperature of 17.6 °C and a yearly wind speed of 3.25 m/s based on meteorological data of 2019 [41]. The land area is 6340.5 square kilometers. As China’s largest and most developed city, Shanghai’s gross domestic product was 474.6 billion US dollars [42].
The purpose of the new sewage treatment plant is to increase Shanghai’s sewage treatment capacity. The new plant covers an area of 31.8 hectares, can process about 250,000 tons of sewage per day, and depends on 500 employees. As the core process, the A-O (Anaerobic-Oxic) wastewater treatment technology mainly uses the oxidation of microorganisms to degrade organic matter in wastewater and to achieve the effect of wastewater treatment. Total investments of the new sewage treatment plant contain 54.5 million US dollars of construction fee and 1.37 million US dollars of operation fee per year. The wastewater comes from municipal sewage and industrial wastewater of Shanghai, of which the details of wastewater has been shown in Table 2, Table 3, Table 4, Table 5 and Table 6, and the wastewater treatment technology must meet the mandatory national standards [43]. In addition to the treated water, there are two byproducts, including dewatered sludge and exhaust gas pollutants. The dewatered sludge is sent to a landfill factory, and the amounts of exhaust gas pollutants are needed to be calculated. The treatment technology selected in the new plant represents the widely adopted type in the sewage treatment plant of China, which has universal applicability for China’s sewage treatment plants.
2.1.1. Infrastructure Construction Process
In this building project, five sections need to be computed, including primary building materials, auxiliary engineering costs, energy consumption, labor cost, and government service charges. The specific data have been shown in Table 2, Table 3, Table 4 and Table 5. The type of energy consumption is mainly electricity. According to statistics of the entire sewage treatment plant project, electricity costs are approximately 4.22 × 10⁶ US dollars. All expenses have been converted into US dollars based on an exchange rate (6.87 RMB = 1 US$).
2.1.2. Sewage Treatment Process
The Data of Sewage Treatment Plant
(1) Water-quality sample selection
According to the standard measurement [43], water samples from the plant inlet and outlet have been measured. The central monitoring indicators are Chemical Oxygen Demand (COD), Total Oxygen Demand (BOD), Suspended Solids (SS), total phosphorus, total nitrogen, ammonia nitrogen, etc. (shown in Table 6).
(2) Power operation system
The total capacity of the two main transformers is 16,000 KW in the new sewage treatment plant area, which can meet the power requirements of the entire sewage treatment plant area.
(3) Sludge treatment data
According to the statistics of the sewage treatment plant, the sludge volume is 55.8 tons per day (10 km transport distance by truck), and the incineration service fee of sludge treatment is $18.76 per ton.
The Primary Process of the Sewage Treatment Plant
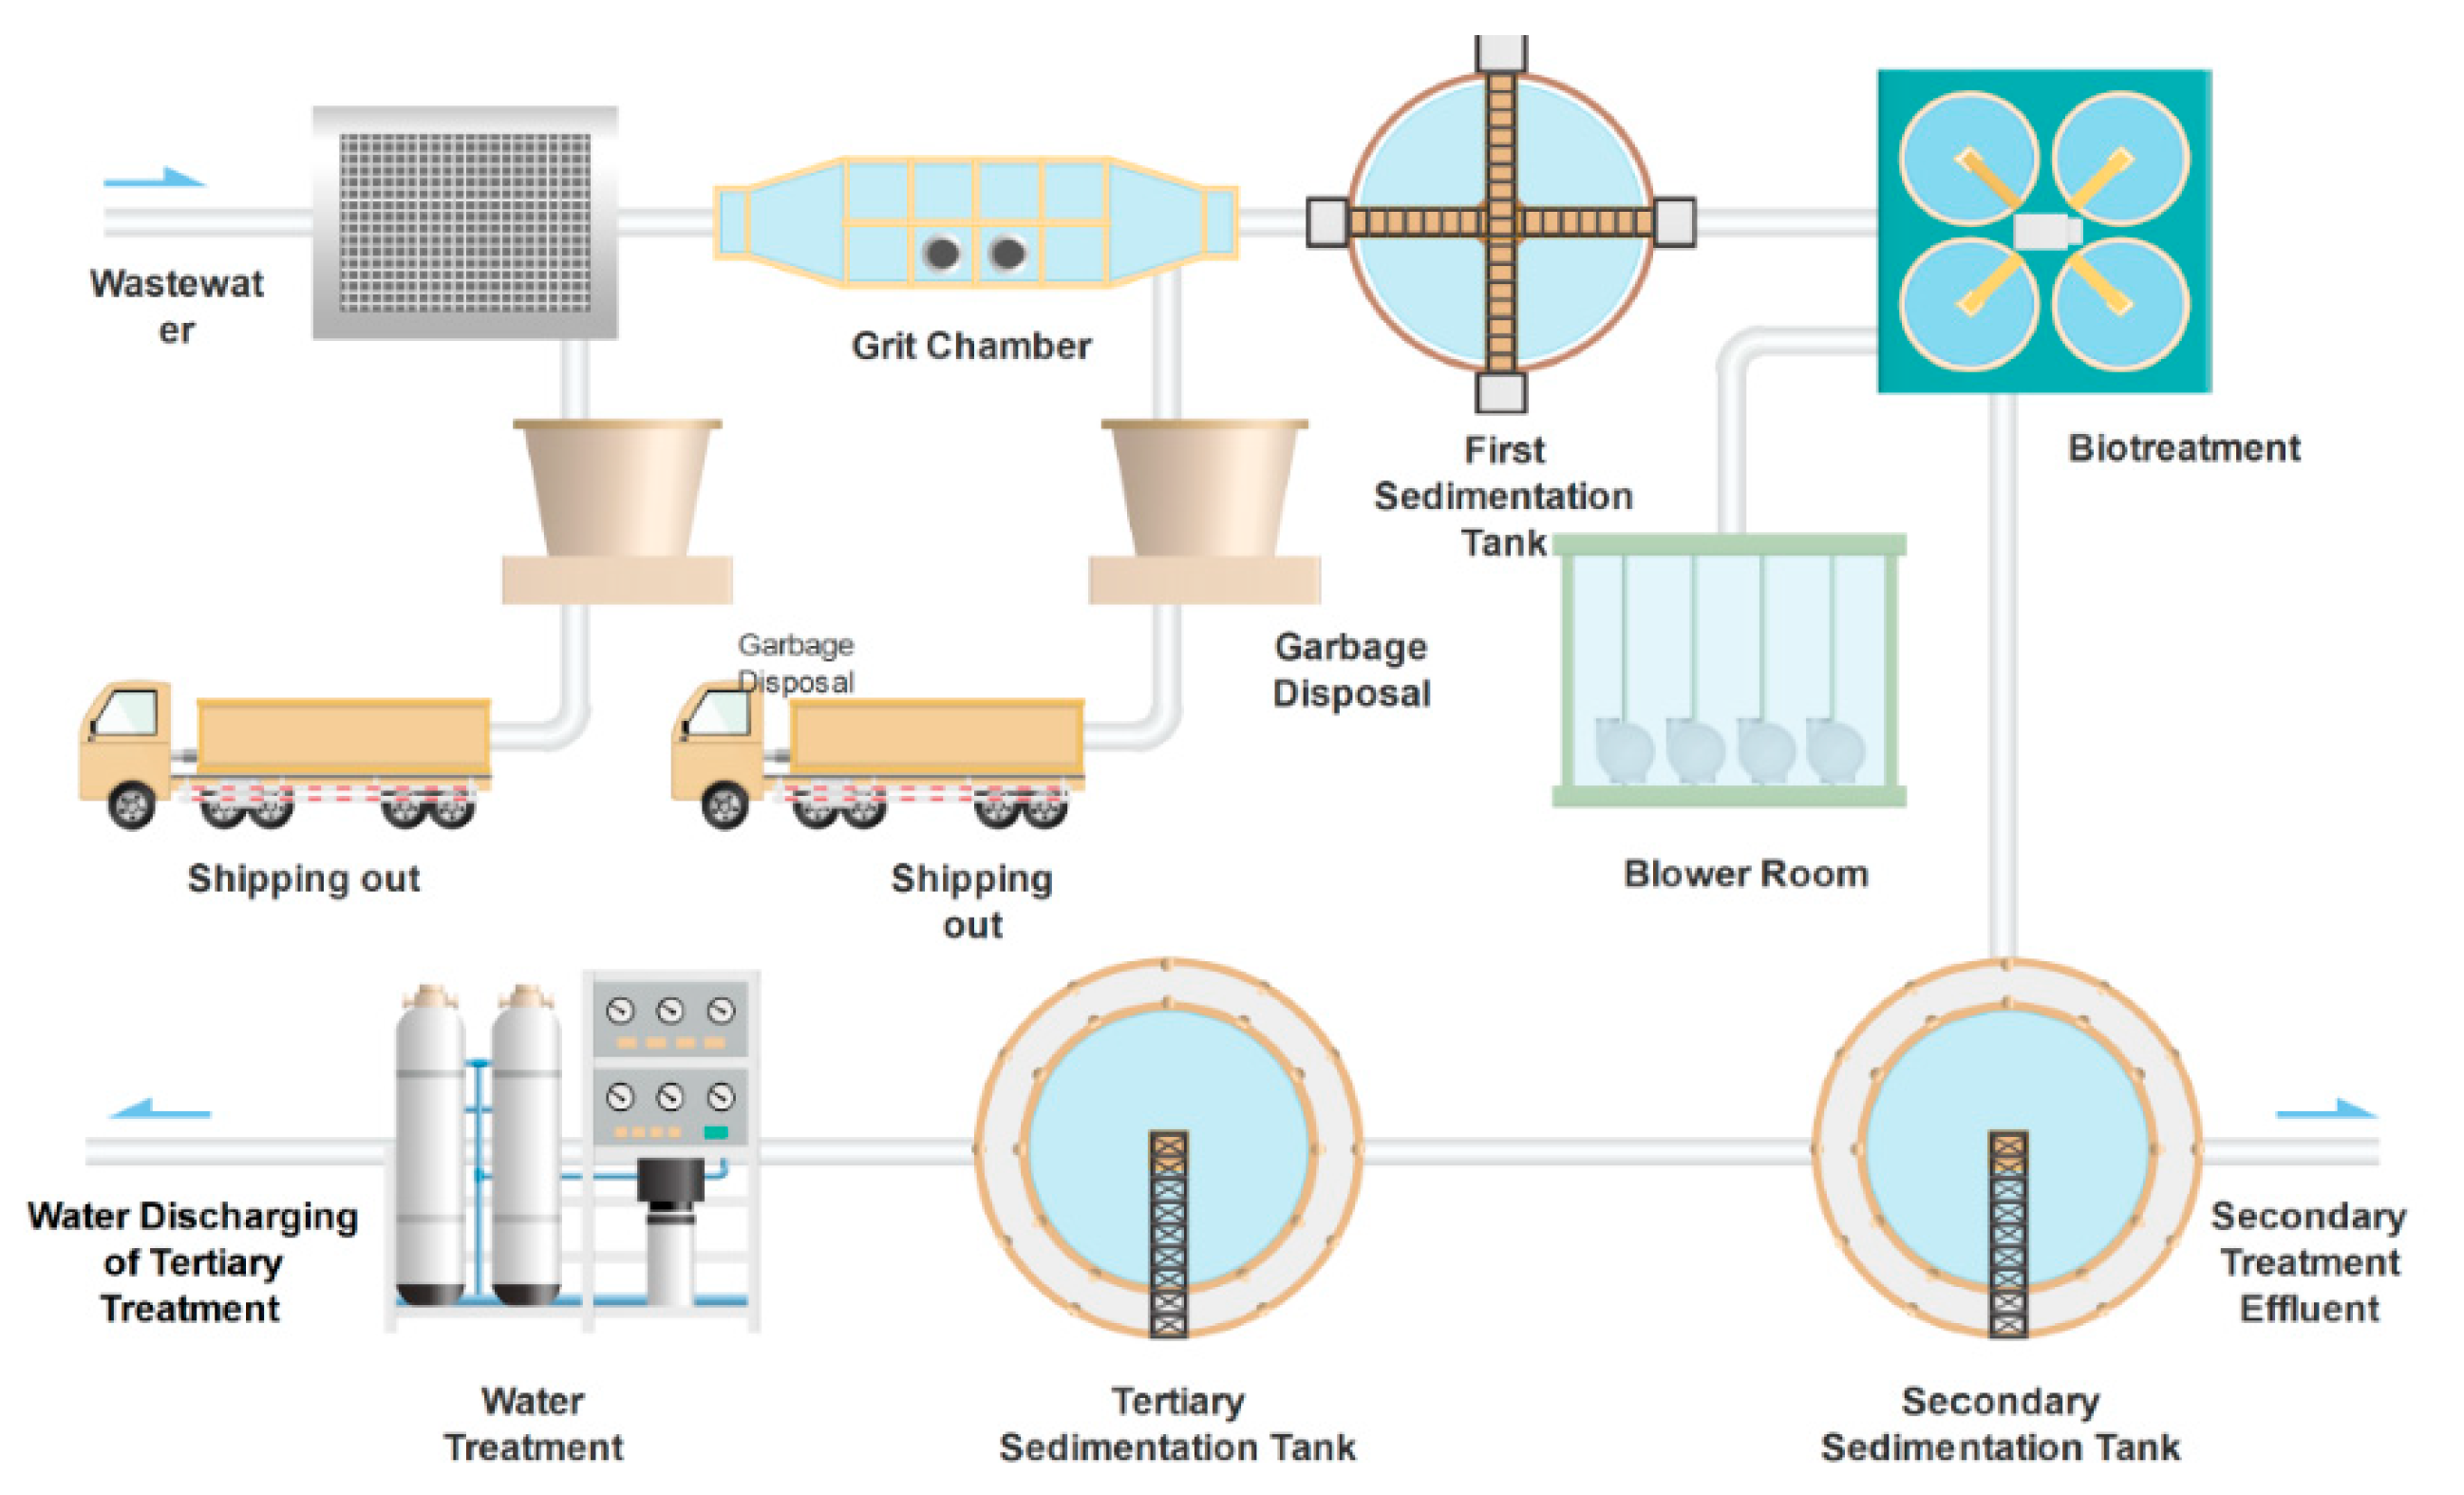
Core technologies of the sewage treatment plant contain a mechanical grid filtration system, grit chamber, first sedimentation tank, biotreatment, secondary sedimentation tank, tertiary sedimentation tank, and water treatment. The specific wastewater treatment process has been illustrated in Figure 1.
2.2. Emergy Approach
2.2.1. Emergy Analysis (EmA)
As a comprehensive concept, emergy method comprises a direct part, the indirect part, the energy part, and labor and service. Its unit is solar emergy (sej), which was proposed by H.T. Odum [20] first. The most important superiority of emergy is that it can integrate environment resources, products, and services into a unified platform in order to assess the impact of sustainability [44].
By calculating the renewable resources, nonrenewable resources, economic investment, labor and service, and environmental emission consideration by transforming different physical units, including energy (J), mess (kg), and finance ($), the sustainability of the sewage treatment plant system can be assessed and analyzed quantitatively [27].
The specific calculation of the emergy method involves the multiplication result by quantity and unit emergy values (UEVs). In more detail, mass, energy, and money can be converted into solar emergy (sej) by way of unit emergy values (UEVs) [45]. Therefore, unit emergy values (UEVs) are the pivotal item of the emergy method. In general, when emergy is computed, there are three types of UEVs, which are emergy/energy (sej/j), specific emergy (sej/g), and emergy/money (sej/$) [32].
Before executing the emergy process, the selection of emergy baseline is a vital issue which can profoundly impact the accuracy of the sewage treatment plant sustainability. Emergy baseline explains emergy values in the biosphere, consisting of solar, tidal, and geothermal energy. Because of constant correction by lots of researchers, five emergy baselines have been put forward until now, including 9.44 × 1024 sej/year [20], 9.26 × 1024 sej/year [46], 15.83 × 1024 sej/year [47], 15.2 × 1024 sej/year [48], and 12 × 1024 sej/year [49]. Compared to the five standards of emergy baseline, Brown et al. (2016) studied the newest baseline standard (12 × 1024 sej/year). In this paper, the latest emergy baseline (12 × 1024 sej/year) was adopted for the sustainable assessment of the sewage treatment plant.
2.2.2. Emergy Diagram of the New Sewage Treatment Plant
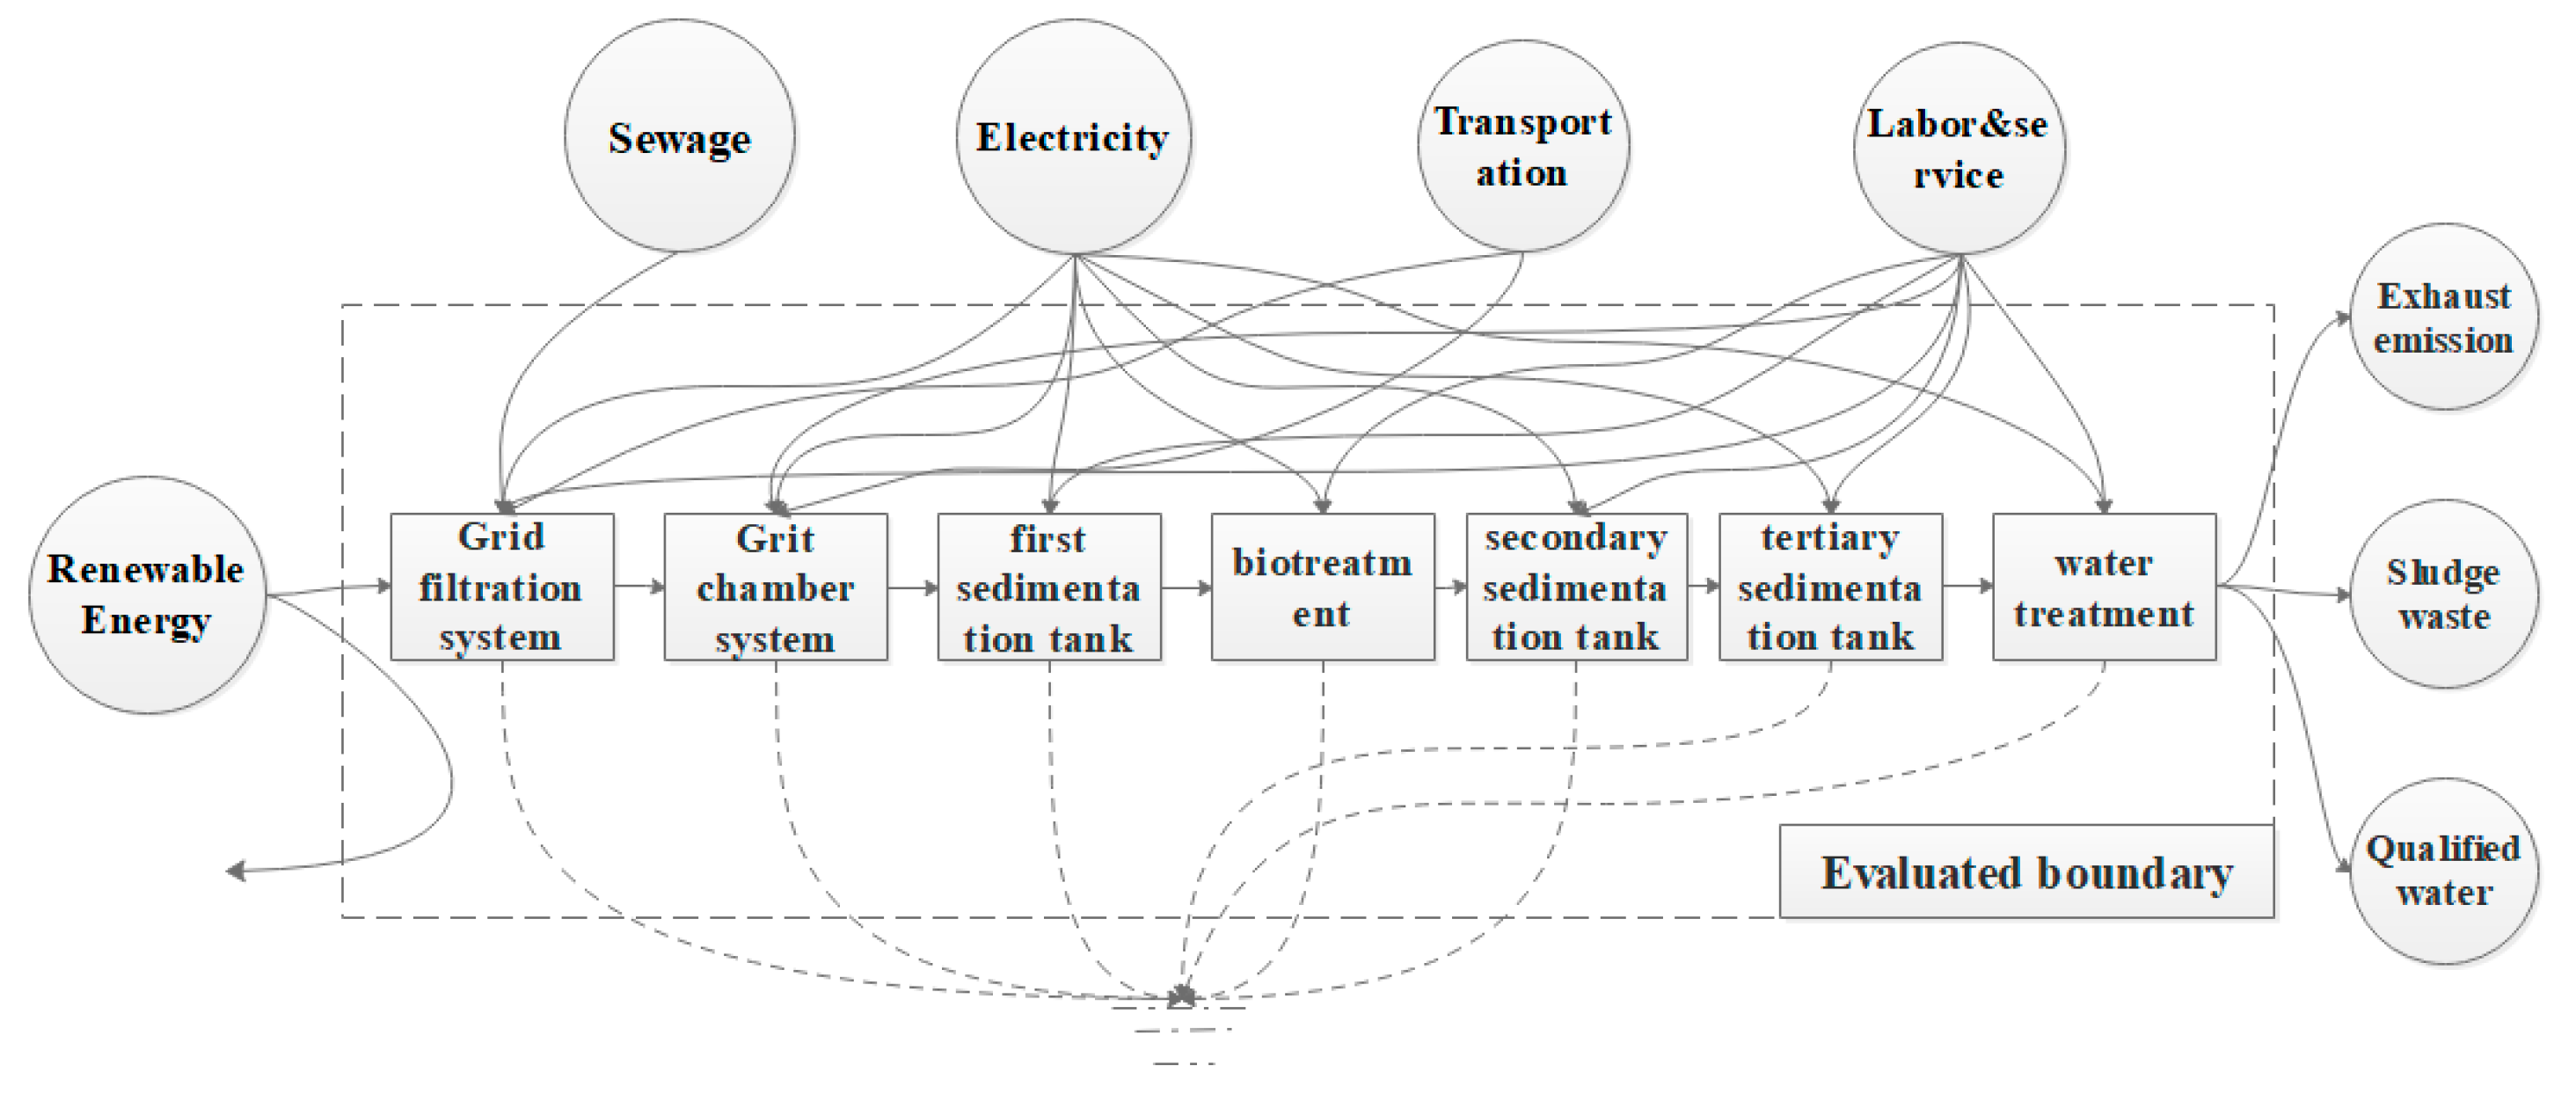
In Figure 2, there are three sections to connect the new sewage treatment plant, including renewable energy, nonrenewable input, pollutant emissions, and qualified water. The upper part consists of sewage, electricity, transportation, and labor and service. The left part is the renewable energy, containing sunlight, rain (chemical potential), rain (geopotential), wind (kinetic energy), and geothermal heat. The right section is composed of pollutant emissions (exhaust gas and sludge waste) and qualified water.
2.2.3. Ecological Indicators
In this paper, there are a series of emergy-improved indicators to be adopted for the new sewage treatment plant assessment, as follows (shown in Table 7).
- (1)
- Renewability rate (Rr): it is a ratio between the renewable element and the total element. A higher renewability rate means a better ecological level;
- (2)
- Nonrenewability rate of local resource (Nr) displays the ratio within the local resource emergy and total emergy. Higher Nr demonstrates worse ecological degrees;
- (3)
- Nonrenewability rate of purchased resource (Np) reveals the proportion among purchased resource emergy and whole emergy. Lower Np shows a better sustainable level;
- (4)
- Emergy personal density (Ed) means the emergy per person, and the unit is sej/person. It reveals that the higher value represents better sustainability;
- (5)
- Emergy intensity (Ei) is defined as the emergy per unit area, which also enunciates the emergy production level;
- (6)
- Pollutant environmental impact rate (PEIR) represents the emergy proportion of pollutants in the entire assessment system. Large values indicate poor environmental sustainability;
- (7)
- Purchased emergy dependence level (PEDL) explains the competitiveness of the evaluated system. The smaller the PEDL is, the weaker the competitive strength is;
- (8)
- Emergy investment ratio (EIR): Emergy investment ratio delegates the proportion of purchased emergy to the sum of renewable emergy and nonrenewable emergy. EIR interprets the relationship between the individual economic input section and the natural input section [50]. The higher the EIR is, the stronger the economic development degree of the system is;
- (9)
- Emergy yield ratio (EYR): EYR can be computed in light of the total emergy section and imported emergy section, which shows an ability that can generate emergy. The higher the EYR is, the better the consequence of the new sewage treatment plant is. The higher input of purchased emergy could bring about lower EYR, revealing the competitive ability of the new sewage treatment plant. Several results can be referenced in Reference [51];
- (10)
- Environmental loading ratio (ELR): As the ratio of nonrenewable emergy and purchased emergy, EIR is defined, which can be used to elaborate the ecological load of the evaluated ecosystem, including non-resource emergy pressure, purchased emergy pressure, and others, such as exhaust emission and sludge waste, etc. Several studies have already conducted some standards for various environmental load degrees [52], including low values (ELR < 2), medium intensity (3 < ELR < 10), and high environmental load (ELR > 10);
- (11)
- Emergy sustainability index (ESI): ESI demonstrates the ratio between EYR and ELR. It expresses the far-reaching effect of the environment and economy for the evaluated system. Generally speaking, because of the literature in Reference [52], three standards were adopted to explain the sustainability status, which contain ESI < 1 (Unsustainable), 1 < ESI < 5 (Medium situation), and ESI > 5 (Sustainable) in the long term;
- (12)
- Unit emergy values (UEVs) explains the emergy value of one unit of mass, energy, service, or money. UEVs mentions the efficiency of the evaluated system [53].
2.2.4. Sensitivity Analysis
Sensitivity analysis has a noticeable effect on the accuracy of emergy assessment result. To improve the efficiency, sensitivity analysis has been performed in this paper through the main contributor error changes of emergy calculation in the new sewage treatment plant. Generally speaking, the calculated formula of emergy can be shown by Equation (1):
where Em is emergy; E represents energy (J), mess (kg), and economics ($); T means unit emergy values (UEVs); signifies the error of E; and shows the failure of T [54].
2.3. Industrial Pollutant Emergy Calculation
2.3.1. Exhaust Gas Emergy Calculation
Basic Emission Situation of Exhaust Gas
Seven processes mainly produce exhaust gas released by the new sewage treatment production. The process flow details can be found in Figure 1.
Based on the national mandatory standard [55], there are mainly three exhaust gases (power generation process) in the new sewage treatment plant, which are dust, sulfur dioxide (SO2), and nitrogen oxides (NOx). Human health and ecosystem sustainability can be affected by these exhaust emissions, specifically causing respiratory disease and disrupting the ecological balance aspect [56]. In order to achieve comprehensive considerations, the ecological service calculation and economic loss calculation should be investigated in this study. The untreated exhaust emissions contain 110 mg/m3 dust, 250 mg/m3 SO2, and 300 mg/m3 NOx in the new sewage treatment plant. After exhaust gas treatment (details are shown in Table 8), the corresponding data reduces to 35 μg/m3 dust, 50 μg/m3 SO2, and 80 μg/m3 NOx in view of the GB 3095-2012 standard (national mandatory standard in China) [57].
Economic Loss Accounting
In this paper, the financial loss should be considered and computed, which was caused by exhaust emission of a new sewage treatment plant. According to the study of Bakshi (2002) [58], the human health effect has been adopted on the basis of the DALY (Table 8), and the calculated Equation (2) [59] has been displayed, as follows:
where L is the emergy loss that was produced by a human health effect and the unit is sej/a; I represents the gas type, containing dust, SO2, and NOx; Wi illustrates the exhaust amount; DALY means the impact element, a/kg emission; and displays emergy value to humans per year and is 1.68 × 10¹⁶ sej/(a·person) based on the baseline 12.0 × 1024 sej/a [32].
Ecological Services Calculation
Ecological services calculation of exhaust gas reflects the negative impact of environmental issues. Therein, three air pollutants need to be calculated for emergy assessment of the new sewage treatment plant. For calculation of the ecological service, two steps need to advance. On the one hand, the exhaust gas amount must be computed based on Equation (3).
where Mi shows the dilution air mass (Kg/a); I is the gas type, including dust, SO2, and NOx; c displays the air density (1.23 Kg/m3); Ui represents the annual mass of air pollutants from the sewage treatment process, Kg/a; si is the acceptable concentration from agreed regulations, mg/m3; and the three exhaust gases of acceptable concentration are dust (0.08 mg/m3), SO2 (0.02 mg/m3), and NOx (0.05 mg/m3) [60]. On the other hand, the emergy of ecological service can be obtained on the basis of Equation (4).
where Rair,i is the emergy of environmental service, sej/a; v is the local annual average wind speed (3.25 m/s); and is the unit emergy value of wind (1.86 × 10³ sej/J) according to baseline 12.0 × 1024 sej/a [32].
2.3.2. Wastewater Emergy Calculation
The emergy of wastewater in the new sewage treatment plant can be calculated as follows, including two procedures. Firstly, the freshwater consumption can be computed based on Equation (5), as follows:
where Qi represents the freshwater consumption amount, Kg/a; i is 1 based on COD; d signifies the water density (1.00 × 10³ Kg/m3); Hi shows the annual amount of the water pollutant disposal from the new sewage treatment plant and the collected data is 2.5 × 10⁸ kg/a; ei reveals the acceptable concentration (15 mg/L) based on national standard in China [61]; and Mwater is the discharged wastewater in the new sewage treatment plant, and the value is 4.51 × 10³ m3/a.
Secondly, the emergy of wastewater can be obtained from Equation (6).
where Ewater,i shows the emergy from the evaluated system (sej/a) and where Tn represents the unit emergy value of surface runoff in China. Here, it is 2.85 × 10⁷ sej/kg based on the baseline of 12 × 1024 sej/a [49].
The wastewater treatment process of building new sewage treatment is displayed in Figure 1.
2.3.3. Sludge Waste Emergy Calculation
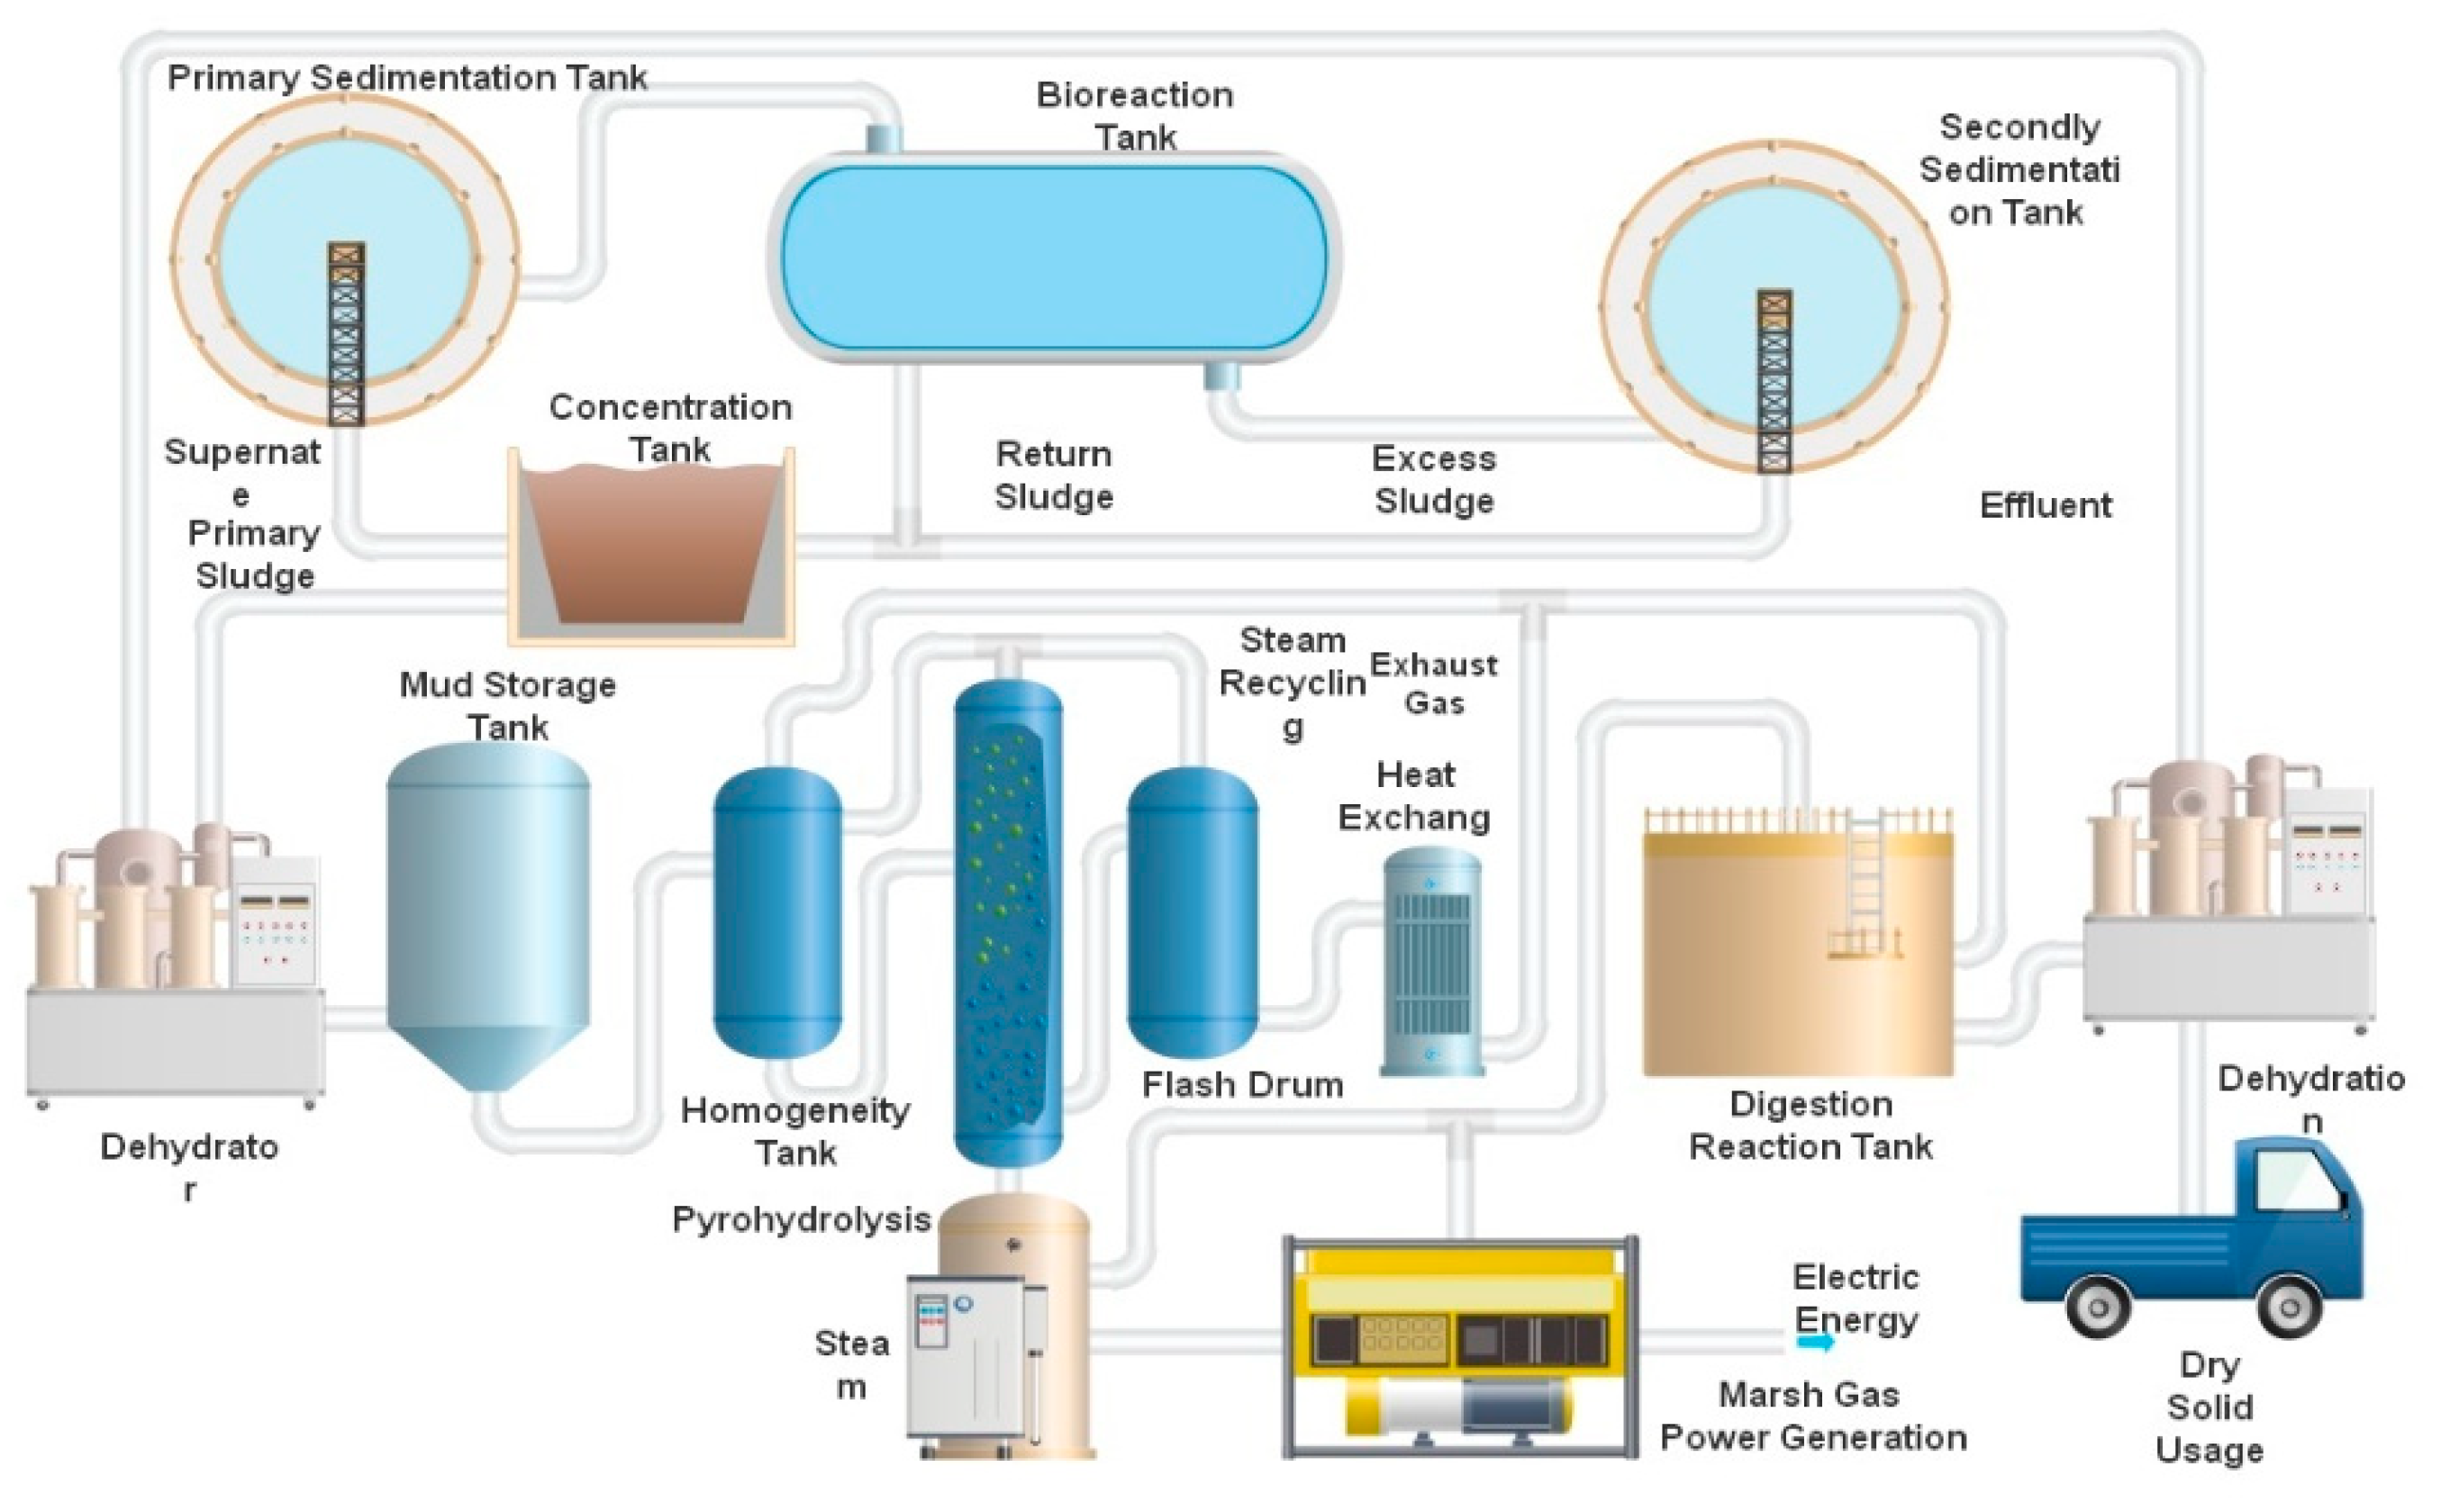
The consideration of sludge waste emergy is mainly concentrated on land occupation, which can be calculated based on Equation (7) [62]. Figure 3 shows the sludge treatment process of the new sewage treatment plant.
where SLM represents the emergy of sludge waste for the new sewage treatment plant; Zsludge is a total dry sludge (2.5 × 10⁵ t/year), which has been dehydrated in the system; PL shows the land requirement per unit sludge landfill and it is 2.85 × 10⁴ t/1 ha [63]; and is the unit emergy value of local land, which is 0.8 × 10¹⁵sej/ha based on the latest baseline (12.0 × 1024 sej/a). The details of the sludge treatment process have been revealed in Figure 3.
3. Results and Discussions
3.1. Emergy Calculated Table of the Sewage Treatment Plant in China
Emergy Calculated Table of the Sewage Treatment Plant in China are listed as followings:
All calculated emergy baseline is 12.00 × 1024 sej/yr [52] and the UEVs have been corrected in Table 9.
1—Renewable Energy calculation:
- (1)
- Solar energy calculation: Area of ceramic plant = 3.18 × 10⁵ m2; insolation (Hubei Province, China) = 5.43 × 10⁹ J/ m2/y [70]; albedo = 0.30 [70]; energy = (insolation) × (1 − albedo) × (area) = (5.43 × 10⁹ J/ m2/y) × (1 − 0.30) × (3.18 × 105 m2) = 1.32 × 10⁸ J/y; UEV = 1.00 sej/J by definition; emergy of one year = 1.32 × 10⁸ J/y × 1 y × 1.00 sej/J = 1.32 × 10⁸ sej;
- (2)
- Rain (chemical potential energy) calculation: Area of ceramic plant = 3.18 × 10⁵ m2; rainfall (annual average, n = 5) = 0.68 m/y [70]; water density = 1.00 kg/ m3; evapotranspiration rate = 60% [69,71]; Gibbs free energy of water = 4.94 × 10³ J/kg; energy = (area) × (rainfall) × (evapotranspiration rate) × (water density) × (Gibbs free energy of water) = (3.18 × 10⁵ m2) × (0.68 m/y) × (60%) × (1 × 10³ kg/m3) × (4.94 × 103 J/kg) = 6.41 × 10¹¹ J/y; UEV = 2.35 × 10⁴ sej/J [65]; emergy of one year = 6.41 × 10¹¹ J/y × 1 y × 2.35 × 104 sej/J = 1.51 × 10¹⁶ sej;
- (3)
- Rain (geopotential energy) calculation: Area of ceramic plant = 3.18E × 105 m2; rainfall (annual average, n = 5) = 0.68 m/y [72]; average elevation = 316 m [73]; water density = 1.00 × 10³ kg/m3; runoff rate = 40.00% [69,71]; energy = (area) × (rainfall) × (runoff rate) × (water density) × (average elevation) × (gravity) = (3.18 × 10⁵ m2) × (0.71 m/y) × (40%) × (1 × 10³ kg/m3) × (316 m) × (9.8 kg/m2) = 2.80 × 10¹¹ J/y; UEV = 2.79 × 10⁴ sej/J [72]; emergy of one year = 2.80 × 10¹¹ J/y × 1 y × 2.79 × 104 sej/J = 7.81 × 10¹⁵ sej;
- (4)
- Wind energy calculation: Area of ceramic plant = 3.18E × 105 m2; air density = 1.29 kg/m3; wind velocity (annual average, n = 2) = 3.25 m/s [73]; velocity of geostrophic wind = 3.25 m/s (surface winds are considered as 0.6 of geostrophic wind [74]; drag coefficient = 1.00 × 10⁻³ [75]; energy = (area) × (air density) × (drag coefficient) × (velocity of geostrophic wind)3 = (3.18 × 10⁵ m2) × (1.29 kg/m3) × (1.00 × 10−3) × (3.25 m/s)3 × (3.15 × 107 s/y) = 4.43 × 10¹¹ J/y; UEV = 1.90 × 10³ sej/J [65]; emergy of one year = 4.43 × 10¹¹ J/y × 1 y × 1.90 × 103 sej/J = 8.42 × 10¹⁴ sej;
- (5)
- Geothermal heat calculation: Area of ceramic plant = 3.18 × 10⁵ m2; heat flow (average) = 3.50 × 10⁻² J/m2/s. energy = (area) × (heat flow) = (3.18 × 10⁵ m2) × (3.50 × 10-2 J/m2/s) × (3.15 × 10⁷ s/y) = 3.51 × 10¹¹ J/y; UEV = 3.44 × 10⁴ sej/J [72]; emergy of one year = 3.51 × 10¹¹ J/y × 1 y × 3.44 × 104 sej/J = 1.27 × 10¹⁴ sej.
2—Nonrenewable resources:
- The amount emergy: Cement = 5.44 × 107 × 1.93 × 1012 = 1.05 × 10²⁰ sej;
- steel = 2.83 × 107 × 2.75 × 1012 = 7.78 × 10¹⁹ sej; limestone = 1.31 × 105 × 1.27 × 1012 = 1.66 × 10¹⁷ sej;
- gravel = 2.03 × 107 × 1.42 × 1012 = 2.28 × 10¹⁹ sej; wood = 5.79 × 105 × 2.67 × 1012 = 1.55 × 10¹⁸ sej;
- brick = 1.97 × 106 × 2.82 × 1012 = 5.56 × 10¹⁸ sej; tap water = 1.45 × 106 × 2.56 × 1012 = 3.71 × 10¹⁸ sej.
3—Purchased resources:
- The amount emergy: Tile = 7.36 × 105 × 3.89 × 1012 = 2.86 × 10¹⁸ sej;
- asphalt = 1.40 × 105 × 3.49 × 1012 = 4.89 × 10¹⁷ sej; aluminum = 1.14 × 106 × 1.61 × 1013 = 1.84 × 10¹⁹ sej.
4—Wastewater treatment chemicals
The emergy calculations:
- Polyaluminium chloride = 6.52 × 109 × 3.37 × 106 = 2.20 × 10¹⁶sej;
- Cl2 liquid = 3.86 × 107 × 3.37 × 106 = 1.30 × 10¹⁴sej;
- polyacrylamide = 2.49 × 107 × 3.37 × 106 = 8.39 × 10¹³ sej;
- potassium permanganate = 3.04 × 107 × 3.37 × 106 = 1.02 × 10¹⁴sej.
5—Labor and services:
(1) Auxiliary engineering labor costs:
Scaffolding project labor cost + concrete formwork and bracket labor cost + equipment installation and disassembly labor cost + night construction labor cost + special season construction (rain and winter) labor cost = $7,329,560 + $16,784,840 + $2,306,530 + $999,011 + $482,690 = $2.79E × 107.
(2) Engineering Service fee:
Construction engineering service fee + installation engineering service fee + decoration engineering service fee + municipal engineering service fee = $917,390 + $213,873 + $628,545 + $136,947 = $1.89 × 10⁶.
(3) Management service fees for the government:
Environmental protection fee + civilization construction fee + temporary facility fee + safety construction fee + engineering sewage charges + dangerous work accident insurance = $54,547.2 + $184,536.7 + $37,435.68 + $86,615.89 + $43,999.70 = $4.18 × 10⁵.
(4) The amount of emergy of labor and services: ($2.79 × 10⁷ + $1.89 × 10⁶ + $4.18 × 105) × 1.14 × 1010 = 3.44 × 10¹⁷sej.
6—Energy:
Construction electricity per kWh in China = 1 kwh/REM × 0.687 = 0.687 kwh/$.
- (1)
- Infrastructure electricity of the new sewage treatment plant: (4.22 × 10⁶$/0.687 kwh/$) × 3.6 × 10⁶j = 2.21 × 10¹³j;
- (2)
- annual electricity operation cost of sewage treatment plant: 16,000 kwh × 24 h × 365 d × 3.6 × 106j = 1.40 × 10¹⁴j;
- (3)
- the amount of emergy of electricity = (2.21 × 10¹³ + 1.40 × 1014) × 4.50 × 105 = 7.29 × 10¹⁹sej.
7—Transportation:
Transportation emergy of annual sludge treatment = (55.8 tons × 10 km × 365d) × (7.61 × 10¹¹) = 1.55 × 10¹⁷ sej.
8—Industrial pollutant emissions:
(1) Exhaust gas emergy of the new sewage treatment plant
- (1)
- The economic loss emergy:
- (2)
- The ecological services emergy:
- (3)
- The sum of economic loss emergy and ecological services emergy:
(2) Wastewater emergy of the new Sewage Treatment Plant
(3) Sludge waste emergy of the new Sewage Treatment Plant
3.2. Emergy Analysis (EmA)
Table 10 is a comprehensive evaluated platform which integrates the infrastructure construction process emergy calculation and the sewage treatment process emergy calculation. There are eight sections for calculating emergy to assess the sustainability in the evaluated system, including renewable energy, nonrenewable resource, purchased resource, wastewater treatment chemicals, labor and service, energy, transportation, and industrial pollutant emissions.
Based on the emergy calculations of nonrenewable resources and purchased resources, the infrastructure construction process emergy (at least 92.6% of the entire emergy in the new sewage treatment plant) is more critical than the sewage treatment process emergy and has a self-evident superiority.
According to the proportion of emergy in Table 10, nonrenewable resource is the primary contributor, which accounts for 69.1% of the total emergy amount, followed by energy (23.5%), purchased resource (7%), industrial pollutant emissions (0.15%), labor and services (0.11%), transportation (0.05%), wastewater treatment chemicals (0.01%), and renewable energy (0.01%).
From Table 10, the nonrenewable resource has the dominant effect for the evaluated result, which is made up of cement (33.9%), steel (25.1%), gravel (7.36%), brick (1.79%), wood (0.50%), tap water (0.42%), and limestone (0.05%). Therein, the cement, steel, and gravel have dominant impacts on the nonrenewable resource emergy, and the proportions are 66.36% of the total emergy and 92.19% of the nonrenewable resource emergy. The energy holds a secondary influence for the complete result, and the main energy type is electricity. The purchased resource is the third most influential factor, and it is composed of aluminum (5.94%), tile (0.92%), and asphalt (0.16%). Among them, aluminum is the crucial part and has an 84.6% ratio for the entire purchased resource emergy.
Industrial pollutant emission consists of three factors, involving exhaust gas (0.00%), wastewater (0.15%), and solid waste (0.00%). Therein, the wastewater possesses the pivotal consequence in light of industrial pollutant emission emergy, far greater than exhaust gas and wastewater. The exhaust gas is a three-part composition, including dust, SO2, and NOX, which has hardly any impact on the emergy assessment.
Labor and service (0.11%) plays a small role in the sustainability of the new sewage treatment plant based on real productivity of China.
Finally, transportation (0.05%), wastewater treatment chemicals (0.01%), renewable energy (0.01%), and renewable energy (0.00%) have small effects on the entire evaluated system of the new sewage treatment plant.
3.3. Emergy Indicators Analysis
All the ecological indicators of the new sewage treatment plant are displayed in Table 11.
- (1)
- The renewability rate (Rr) is 0.000077, which demonstrates the weak sustainability and ecological level.
- (2)
- Nonrenewability rate of local resource (Nr) reveals the ratio (0.690323), and the result illustrates the excessive local resource input and has caused considerable pressure on the local environment.
- (3)
- Nonrenewability rate of purchased resource (Np) is 0.07. The result shows that the entire evaluation process requires considerable economic resource input, which hurts a sustainable level.
- (4)
- Emergy personal density (Ed) is 6.20 × 10¹⁷sej/person, which represents the relatively high degree of automated production in the new sewage treatment plant.
- (5)
- Emergy intensity (Ei) is 9.75 × 10¹⁷sej/m2, and it enunciates the better effect of land utilization to a certain degree.
- (6)
- Purchased emergy dependence level (PEDL) is 0.101402, which explains the competitiveness of the evaluated system. Because of the lower economic input, the competitive strength is unqualified and needs to be improved.
- (7)
- Pollutant environmental impact rate (PEIR) is 0.001535. It decides the poor influence on the whole system and could generate real sustainability.
- (8)
- Emergy investment ratio (EIR) is 0.101391, which interprets low investment in the system. Compared to the natural input section, the proportion of the individual economic input section needs to be enhanced to improve the sustainable degree.
- (9)
- The environmental loading ratio (ELR) is 9881.841, which shows the excessive pressure on the system. According to several standards of the study [55], the high environmental load (>5) has been displayed and should carefully consider some measures to decrease the ELR. Through the integrated infrastructure construction process and sewage treatment process, the system has severe stress and should consider mitigation carefully.
- (10)
- Emergy yield ratio (EYR) is 10.88479, representing the competitive ability of the evaluated system. It needs to balance the relationship between the total emergy section and purchased emergy for sustainability of the new sewage treatment plant.
- (11)
- The emergy sustainability index (ESI) is 0.001101. It expresses the weak comprehensive effect of the environment on the evaluated system. Based on the literature in Reference [55], the ESI of the new sewage treatment plant has an unsustainable status (<1) in the long term.
3.4. Unit Emergy Values (UEVs)
According to the statistics in Table 12, some articles have been investigated for the UEVs of sewage treatment plants in China. In the last five years, there are two papers related to UEVs of sewage treatment in China, which are XiaoHong et al.; 2015 (6.79 × 10¹¹sej/m3) and Yan et al., 2018 (9.03 × 10¹¹sej/m3). In order to compare the UEVs, the unified emergy baseline should be adopted, and in view of 12.00 × 1024sej/y, 6.79 × 10¹¹sej/m3 can be corrected to 5.15 × 10¹¹sej/m3. Based on running emergy calculations of an old sewage treatment plant, Xiaohong (2015) calculated the UEVs (5.15 × 10¹¹ sej/m3), which is smaller than 9.03 × 10¹¹sej/m3, on the basis of running emergy calculation and pollutant emergy calculation by Yan (2018).
In this paper, the UEVs (3.40 × 10¹²sej/m3) of a new sewage treatment plant have been computed based on infrastructure emergy, running emergy, and pollutant emergy. Higher UEVs illustrate the worst sustainable level, and it demonstrates the low efficiency of the new sewage treatment plant system due to the infrastructure emergy input. Several studies have been executed to enhance the environmental sustainability of a similar system by making better UEVs.
Energy-saving strategies have been considered carefully by Lemos et al., (2013) [76] and Amores et al., (2013) [77] and can reduce the UEVs of the sewage treatment plant. XiaoHong et al. (2018) has suggested sewage treatment process optimization [40] in order to improve the water treatment efficiency and to lower the UEVs of the sewage treatment plant. Moreover, several comprehensive measures can also be conducted to enhance the UEVs of the sewage treatment plant, including replacement of renewable materials [78], adjustment of industrial structure [79], and development of renewable energy [80,81].
3.5. Sensitivity Analysis
As shown in Table 10, the total emergy input is divided into eight sections, involving renewable energy, nonrenewable resource, purchased resource, wastewater treatment chemicals, labor and service, energy, transportation, and industrial pollutant emissions. Based on Table 13, there are three main contributors to the entire emergy of the new sewage treatment plant, which are a nonrenewable resource, energy, and purchased resource. It is necessary to run a sensitivity analysis for these three parts in Table 10. Here, a hypothesis is used to verify the sensitivity analysis: each of the three items changes by 10%, and other input items are forced to remain constant to test the changes of total emergy and indicators.
The sensitivity analysis of all details has been calculated in the paper, which has been displayed in Table 14 and in Figure 4 and Figure 5.
Table 13 demonstrates sensitivity analysis situations in the hypothesis. Within −10% changes in the three sections, it can be concluded that the nonrenewable resources have the most significant fluctuation (6.903%), followed by energy (2.352%) and purchased resources (0.700%). The reason for the tendency is that nonrenewable resources play a significant consequence, more critical than others, and this can be known from the emergy contribution ratio, accounting for 69.1% of total emergy in the evaluated system. The same explanations can be for purchased resources and energy. The higher the emergy ratio, the greater the sensitivity results. This result explains that the staple emergy contributor exerts the foremost impact on sensitivity analysis.
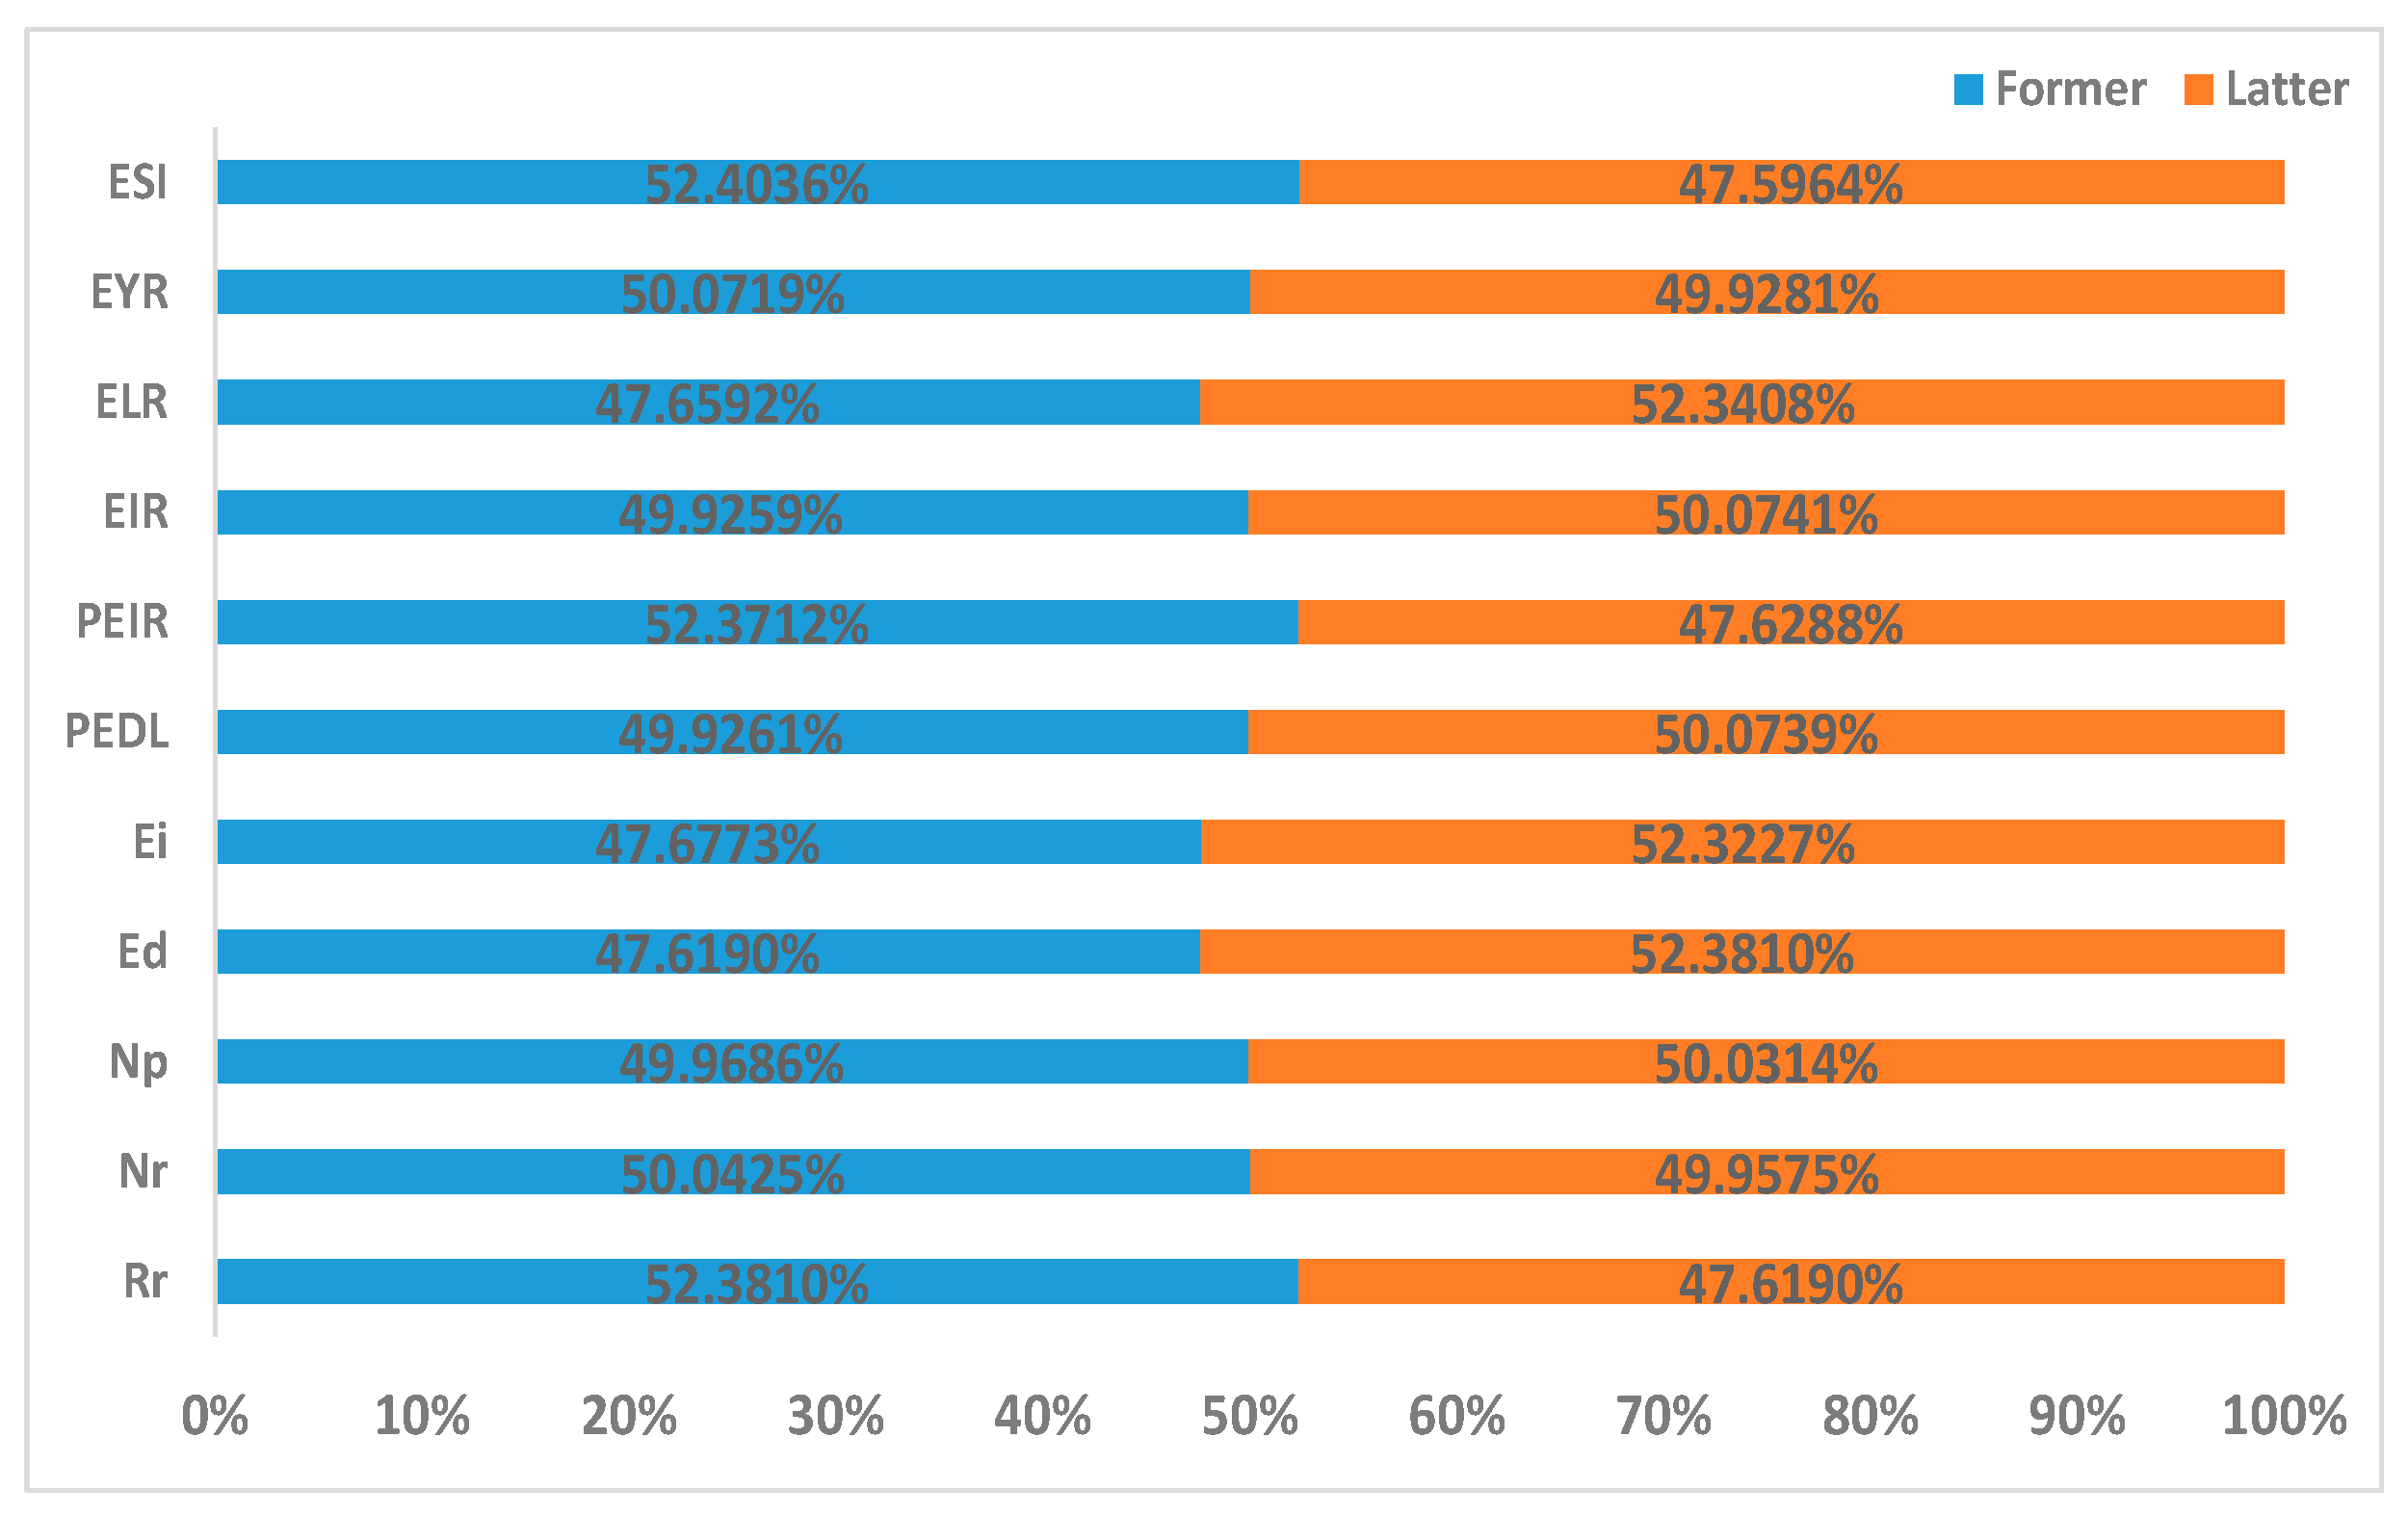
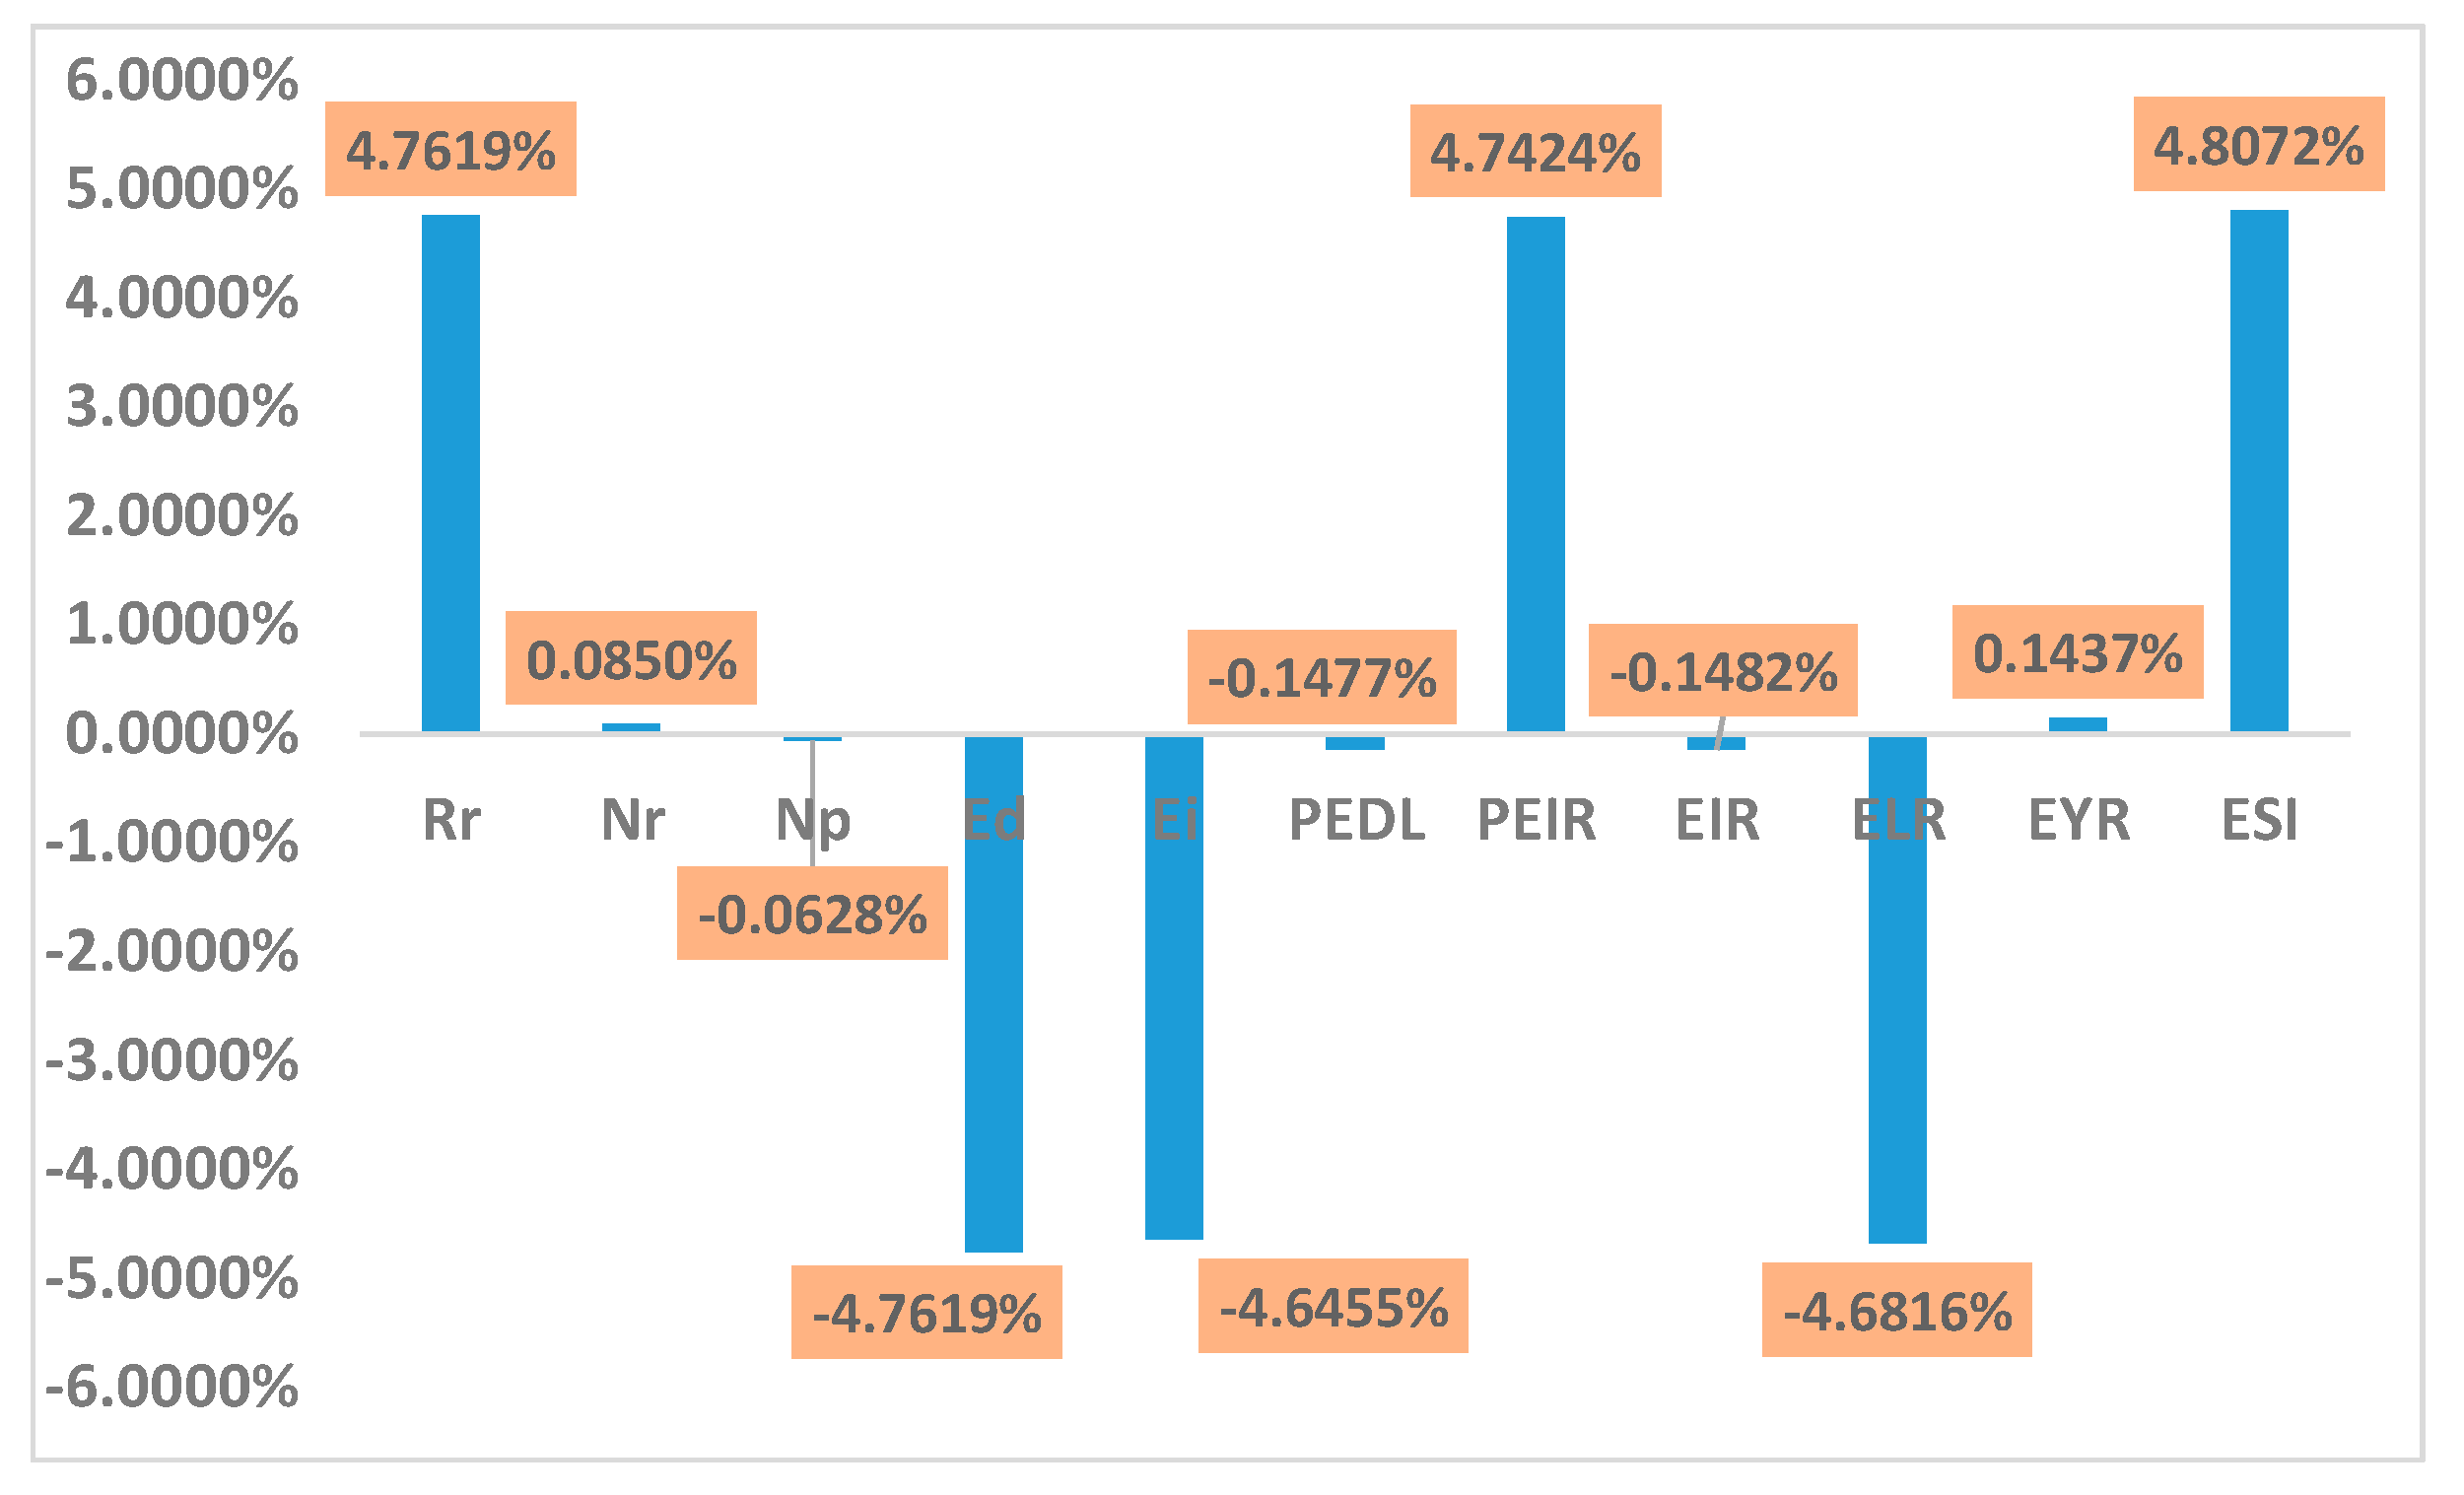
Sensitivity analysis of all indicators has been illustrated in Figure 4 and Figure 5 for Rr (4.7619%), Nr (0.0850%), Np (−0.0628%), Ed (−4.7619%), ELR (−4.6816%), PEDL (−0.1477%), PEIR (4.7424%), EIR (−0.1482%), ELR (−4.6816%), EYR (0.1437%), ESI (4.8072%). It is found that ESI (4.8072%) has the biggest impact, followed by Rr (4.7619%), Ed (−4.7619%), PEIR (4.7424%), ELR (−4.6816%), and ELR (−4.6816%).
3.6. Industrial Pollutant Analysis
In the new sewage treatment plant system, there are three main types of pollutant emissions in Table 8, including exhaust gas, wastewater, and solid waste. Specific details have been displayed in the note of Table 10. According to Table 10, wastewater is the major contributor and accounts for 0.15% of the entire emergy and almost 100% of the industrial pollutant emergy. Therein, exhaust gas and wastewater have virtually no impact on the system. It is clear that sludge treatment technology (Figure 3) is feasible and has a better effect than wastewater treatment technology (Figure 1).
4. Strategies and Suggestions
Based on the aforementioned results, several strategies and recommendations have been provided to make better sustainable and comprehensive performance.
4.1. Improving the Proportion of Renewable Energy Use
Unreasonable energy structures should be responsible for the negative effect on the sustainability of the new sewage treatment plant in China. The small percentage of renewable energy leads to low sustainability for the evaluated system. To adjust the energy structure, several new renewable energy types should be adopted in this paper, including solar power, hydropower, and wind power, which are the familiar sources of renewable energy in China. However, a few weak points obstruct their usages as renewable energy sources, such as enormous investment, professional and technical barriers, and geographical conditions. For example, financial subsidies and favorable tax policies should be considered carefully to improve the applied proportion of clean energy. Based on the development status, many researchers have performed related studies involving solar power [82,83], hydropower [84,85], and wind power [86,87].
4.2. Recycling Material Replacement
Due to the excessive dependence on nonrenewable resources in the new sewage treatment plant, there is a substantial environmental load for the evaluated system. Taking cement as an example, it accounts for the most significant consumption (33.9% of total emergy in the system). It hampers the sustainable improvement of the new sewage treatment plant in this study. Related material substitution is currently proven effective, primarily focusing on industrial waste and byproducts, like industrial slag, construction waste, metallurgical waste, mining waste, fuel waste, and chemical waste, etc.
Currently, many scholars have done some research on material substitution for cement so as to improve sustainability [88,89]. Gonçalves et al. (2020) used the recycled concrete aggregate and reactive magnesium oxide to replace the cement material, which can promote the mechanical and environmental performance. In view of the new treatment technology, the wet-milling concrete slurry waste can be adopted to substitute cement according to the study of Xingyang et al. (2020).
5. Conclusions
Based on emergy methodology, the sustainable assessment of China’s new sewage treatment factory has been investigated, calculated, and analyzed in this paper. The main conclusions are summarized as follows.
According to the emergy calculations of nonrenewable resources and purchased resources, the infrastructure construction process emergy (at least 92.6% of the entire emergy in the new sewage treatment plant) is more critical than the sewage treatment process emergy and has a self-evident superiority.
Emergy contributor orders: nonrenewable resource accounts for 69.1% of the total emergy amount, followed by energy (23.5%), purchased resource (7%), industrial pollutant emissions (0.15%), labor and services (0.11%), transportation (0.05%), wastewater treatment chemicals (0.01%), and renewable energy (0.01%).
The cement, steel, and gravel have dominant impacts on the nonrenewable resource emergy, and the proportions are 66.36% of the total emergy and 92.19% of the nonrenewable resource emergy. The energy holds a secondary influence on the complete result, and the primary energy type is electricity. The purchased resource is the third most influential factor.
A series of indicators are 0.000077 (renewability rate); 0.690323 (nonrenewability rate of local resource); 0.101402 (purchased emergy dependence level); 0.001535 (pollutant environmental impact rate); 0.101391 (emergy investment ratio); 10.88479 (emergy yield ratio); 9881.841 (environmental loading ratio); and 0.001101 (emergy sustainability index). All indicator groups illustrate poor sustainability in the new sewage treatment plant and need to adopt some measures to improve the state.
In this paper, the UEVs (3.40 × 10¹² sej/m3) of a new sewage treatment plant have been computed based on infrastructure emergy, running emergy, and pollutant emergy. Higher UEVs illustrate the worst sustainable level, and it demonstrates the low efficiency of the new sewage treatment plant system due to the infrastructure emergy input.
A hypothesis is used to verify the sensitivity analysis. The results show that the nonrenewable resources have the most significant fluctuation (6.903%), followed by energy (2.352%) and purchased resources (0.700%). For the indicators, ESI (4.8072%) has the most significant impact, followed by Rr (4.7619%), Ed (−4.7619%), PEIR (4.7424%), ELR (−4.6816%), and ELR (−4.6816%).
The wastewater is the major contributor and accounts for 0.15% of the entire emergy and almost 100% of the industrial pollutant emergy. Therein, exhaust gas and wastewater have practically no impact on the system.
To sum up, the new sewage treatment plant holds an excessive environmental loading ratio and poor emergy sustainability index. Hence, it cannot maintain sustainable growth; however, some positive measures are considered and implemented so as to ameliorate the sustainability, including enhancing the proportion of renewable energy input and recycling material replacement.
Author Contributions
Conceptualization, J.Z.; investigation, L.M.; formal analysis, J.Z.; methodology, J.Z.; resources, J.Z.; writing—review and editing, J.Z.; All authors have read and agreed to the published version of the manuscript.
Funding
This research was funded by the Postgraduate Research & Practice Innovation Program of Jiangsu Province (KYCX18_0104).
Conflicts of Interest
The authors declare no conflict of interest.
References
- China Environmental Statistics Annual Report. 2015. Available online: http://www.mee.gov.cn/hjzl/sthjzk/sthjtjnb/ (accessed on 20 January 2020).
- GB 18920-2002. Urban Sewage Recycling. Ministry of Construction: China, 2002. Available online: http://www.doc88.com/p-3814241483107.html (accessed on 20 January 2020).
- Liu, K.; Lin, B. Research on influencing factors of environmental pollution in China: A spatial econometric analysis. J. Clean. Prod. 2019, 206, 356–364. [Google Scholar]
- Zhou, W.; Chen, L.; Feng, L. Effectiveness evaluation on third-party governance model for environmental pollution in China. Environ. Sci. Pollut. Res. 2019, 26, 17305–17320. [Google Scholar]
- Pazda, M.; Kumirska, J.; Stepnowski, P.; Mulkiewicz, E. Antibiotic resistance genes identified in wastewater treatment plant Systems-A review. Sci. Total Environ. 2019, 697, 134023. [Google Scholar] [PubMed]
- Nannou, C.; Ofrydopoulou, A.; Evgenidou, E.; Heath, D.; Heath, E.; Lambropoulou, D. Antiviral drugs in aquatic environment and wastewater treatment plants: A review on occurrence, fate, removal and ecotoxicity. Sci. Total Environ. 2020, 699, 134322. [Google Scholar] [PubMed]
- Zheng, W.; Huyan, J.; Tian, Z.; Zhang, Y.; Wen, X. Clinical class 1 integron-integrase gene-A promising indicator to monitor the abundance and elimination of antibiotic resistance genes in an urban wastewater treatment plant. Environ. Int. 2020, 135, 105372. [Google Scholar]
- Solé-Bundó, M.; Garfí, M.; Ferrer, I. Pretreatment and co-digestion of microalgae, sludge and fat oil and grease (FOG) from microalgae-based wastewater treatment plants. Bioresour. Technol. 2020, 298, 122563. [Google Scholar]
- Teoh, S.K.; Li, L.Y. Feasibility of alternative sewage sludge treatment methods from a lifecycle assessment (LCA) perspective. J. Clean. Prod. 2020, 247, 119495. [Google Scholar]
- Grönlund, S.E. Indicators and methods to assess sustainability of wastewater sludge management in the perspective of two systems ecology models. Ecol. Indic. 2019, 100, 45–54. [Google Scholar]
- Zhang, X.; Cao, J.; Li, J.; Deng, S.; Zhang, Y.; Wu, J. Influence of sewage treatment on China’s energy consumption and economy and its performances. Renew. Sustain. Energy Rev. 2015, 49, 1009–1018. [Google Scholar]
- Yang, J.; Liu, X.; Ying, L.; Chen, X.; Li, M. Correlation analysis of environmental treatment, sewage treatment and water supply efficiency in China. Sci. Total Environ. 2020, 708, 135128. [Google Scholar]
- Nolte, T.M.; Chen, G.; Van Schayk, C.S.; Pinto-Gil, K.; Hendriks, A.J.; Peijnenburg, W.J.; Ragas, A.M. Disentanglement of the chemical, physical, and biological processes aids the development of quantitative structure-biodegradation relationships for aerobic wastewater treatment. Sci. Total Environ. 2020, 708, 133863. [Google Scholar]
- Zhang, Z.; Chen, Y. Effects of microplastics on wastewater and sewage sludge treatment and their removal: A review. Chem. Eng. J. 2020, 382, 122955. [Google Scholar]
- Morera, S.; Santana, M.V.; Comas, J.; Rigola, M.; Corominas, L. Evaluation of different practices to estimate construction inventories for life cycle assessment of small to medium wastewater treatment plants. J. Clean. Prod. 2020, 245, 118768. [Google Scholar]
- Nakatsuka, N.; Kishita, Y.; Kurafuchi, T.; Akamatsu, F. Integrating wastewater treatment and incineration plants for energy efficient urban biomass utilization: A life cycle analysis. J. Clean. Prod. 2020, 243, 118448. [Google Scholar]
- Xu, Y.; Naidoo, A.R.; Zhang, X.F.; Meng, X.Z. Optimizing sampling strategy for Chinese National Sewage Sludge Survey (CNSSS) based on urban agglomeration, wastewater treatment process, and treatment capacity. Sci. Total Environ. 2019, 696, 133998. [Google Scholar]
- Brunsch, A.F.; Florez, P.Z.; Langenhoff, A.A.; ter Laak, T.L.; Rijnaarts, H.H. Retention soil filters for the treatment of sewage treatment plant effluent and combined sewer overflow. Sci. Total Environ. 2020, 699, 134426. [Google Scholar] [PubMed]
- Laura, F.; Tamara, A.; Müller, A.; Hiroshan, H.; Christina, D.; Serena, C. Selecting sustainable sewage sludge reuse options through a systematic assessment framework: Methodology and case study in Latin America. J. Clean. Prod. 2020, 242, 118389. [Google Scholar]
- Odum, H.T. Environmental Accounting: Emergy and Environmental Decision Making; John Wiley and Sons: New York, NY, USA, 1996. [Google Scholar]
- Zhao, H.; Zhai, X.; Guo, L.; Liu, K.; Huang, D.; Yang, Y.; Li, J.; Xie, S.; Zhang, C.; Tang, S.; et al. Assessing the efficiency and sustainability of wheat production systems in different climate zones in China using emergy analysis. J. Clean. Prod. 2019, 235, 724–732. [Google Scholar]
- Zhang, X.H.; Zhang, R.; Wu, J.; Zhang, Y.Z.; Lin, L.L.; Deng, S.H.; Li, L.; Yang, G.; Yu, X.Y.; Qi, H.; et al. An emergy evaluation of the sustainability of Chinese crop production system during 2000–2010. Ecol. Indic. 2016, 60, 622–633. [Google Scholar]
- Pan, H.; Zhuang, M.; Geng, Y.; Wu, F.; Dong, H. Emergy-based ecological footprint analysis for a mega-city: The dynamic changes of Shanghai. J. Clean. Prod. 2019, 210, 552–562. [Google Scholar]
- Chen, W.; Zhong, S.; Geng, Y.; Chen, Y.; Cui, X.; Wu, Q.; Pan, H.; Wu, R.; Sun, L.; Tian, X. Emergy based sustainability evaluation for Yunnan Province, China. J. Clean. Prod. 2017, 162, 1388–1397. [Google Scholar]
- Srinivasan, R.S.; Braham, W.W.; Campbell, D.E.; Curcija, C.D. Re (De) fining Net Zero Energy: Renewable Emergy Balance in environmental building design. Build. Environ. 2012, 47, 300–315. [Google Scholar]
- Luo, Z.; Zhao, J.; Yao, R.; Shu, Z. Emergy-based sustainability assessment of different energy options for green buildings. Energy Convers. Manag. 2015, 100, 97–102. [Google Scholar]
- Chen, W.; Liu, W.; Geng, Y.; Ohnishi, S.; Sun, L.; Han, W.; Tian, X.; Zhong, S. Life cycle based emergy analysis on China’s cement production. J. Clean. Prod. 2016, 131, 272–279. [Google Scholar]
- Zhang, X.; Shen, J.; Wang, Y.; Qi, Y.; Liao, W.; Shui, W.; Li, L.; Qi, H.; Yu, X. An environmental sustainability assessment of China’s cement industry based on emergy. Ecol. Indic. 2017, 72, 452–458. [Google Scholar]
- Yu, X.; Geng, Y.; Dong, H.; Fujita, T.; Liu, Z. Emergy-based sustainability assessment on natural resource utilization in 30 Chinese provinces. J. Clean. Prod. 2016, 133, 18–27. [Google Scholar]
- Wang, Y.; Zhang, X.; Liao, W.; Wu, J.; Yang, X.; Shui, W.; Deng, S.; Zhang, Y.; Lin, L.; Xiao, Y.; et al. Investigating impact of waste reuse on the sustainability of municipal solid waste (MSW) incineration industry using emergy approach: A case study from Sichuan province, China. Waste Manag. 2018, 77, 252–267. [Google Scholar]
- Tian, X.; Geng, Y.; Ulgiati, S. An emergy and decomposition assessment of China-Japan trade: Driving forces and environmental imbalance. J. Clean. Prod. 2017, 141, 359–369. [Google Scholar]
- Qi, Y.; Zhang, X.; Yang, X.; Lv, Y.; Wu, J.; Lin, L.; Xiao, Y.; Qi, H.; Yu, X.; Zhang, Y. The environmental sustainability evaluation of an urban tap water treatment plant based on emergy. Ecol. Indic. 2018, 94, 28–38. [Google Scholar]
- Zhang, X.; Deng, S.; Wu, J.; Jiang, W. A sustainability analysis of a municipal sewage treatment ecosystem based on emergy. Ecol. Eng. 2010, 36, 685–696. [Google Scholar]
- Shao, S.; Mu, H.; Yang, F.; Zhang, Y.; Li, J. Application of Emergy Analysis to the Sustainability Evaluation of Municipal Wastewater Treatment Plants. Sustainability 2017, 9, 8. [Google Scholar] [CrossRef] [Green Version]
- Yue, J.; Jiang, X.; Yuan, X.; Wang, X.; Li, B.; Liu, S. Design of a multiplexed system for domestic wastewater of Happy Farmer’s Home (HFH) and environmental evaluation using the emergy Analysis. J. Clean. Prod. 2017, 156, 729–740. [Google Scholar]
- Londoño, N.A.C.; Suárez, D.G.; Velásquez, H.I.; Ruiz-Mercado, G.J. Emergy analysis for the sustainable utilization of biosolids generated in a municipal wastewater treatment plant. J. Clean. Prod. 2017, 141, 182–193. [Google Scholar] [CrossRef] [PubMed]
- Grönlund, E.; Billgren, C.; Tonderski, K.S.; Raburu, P.O. Emergy Assessment of a Wastewater Treatment Pond System in the Lake Victoria Basin. J. Environ. Account. Manag. 2017, 5, 11–26. [Google Scholar]
- Vassallo, P.; Paoli, C.; Fabiano, M. Emergy required for the complete treatment of municipal Wastewater. Ecol. Eng. 2009, 35, 687–694. [Google Scholar]
- Yang, L.; Kong, F.L.; Xi, M.; Li, Y.; Wang, S. Environmental economic value calculation and sustainability assessment for constructed rapid infiltration system based on emergy analysis. J. Clean. Prod. 2017, 167, 582–588. [Google Scholar]
- Zhang, X.; Wei, Y.; Pan, H.; Xiao, H.; Wu, J.; Zhang, Y. The comparison of performances of a sewage treatment system before and after implementing the cleaner production measure. J. Clean. Prod. 2015, 91, 216–228. [Google Scholar] [CrossRef]
- Shanghai Meteorological Bureau. 2019. Available online: http://sh.cma.gov.cn/sh/ (accessed on 20 January 2020).
- National Economic and Social Development Statistics Report in Shanghai; National Bureau of Statistics: Beijing, China, 2018. Available online: http://www.stats.gov.cn/ (accessed on 20 January 2020).
- Discharge Standard of Pollutants for Municipal Wastewater Treatment Plant; GB 18918-2002; Ministry of Environmental Protection: Beijing, China, 2012. Available online: http://www.doc88.com/p-2408779822397.html (accessed on 20 January 2020).
- Luís, P.A.; Nélson, M.; Joaquim, B.G. A review of emergy theory, its application and latest developments. Renew. Sustain. Energy Rev. 2016, 54, 882–888. [Google Scholar]
- Zhou, J.B.; Jiang, M.M.; Chen, B. Emergy evaluations for constructed wetland and conventional wastewater treatment. Commun. Nonlinear Sci. Numer. Simul. 2009, 14, 1781–1789. [Google Scholar]
- Campbell, D.E. Emergy analysis of human carrying capacity and regional sustainability: An example using the State of Maine. Env. Monit. Assess. 1998, 51, 531–569. [Google Scholar] [CrossRef]
- Odum, H.T. Handbook of Emergy Evaluation (Folio #2): Emergy of Global Processes; Center for Environmental Policy, Environmental Engineering Sciences, University of Florida Gainesville: Gainesville, FL, USA, 2000; pp. 17–18. [Google Scholar]
- Brown, M.T.; Ulgiati, S. Updated evaluation of exergy and emergy driving the geobiosphere: A review and refinement of the emergy baseline. Ecol. Model. 2010, 221, 2501–2508. [Google Scholar] [CrossRef]
- Brown, M.T.; Ulgiati, S. Assessing the global environmental sources drivingthe geobiosphere: A revised emergy baseline. Ecol. Model. 2016, 339, 126–132. [Google Scholar] [CrossRef] [Green Version]
- Song, D.; Lin, L.; Wu, Y. Emergy analysis of a typical New Suspension Preheaters cement plant in China. J. Clean. Prod. 2019, 222, 407–413. [Google Scholar] [CrossRef]
- Ulgiati, S.; Brown, M.T. Quantifying the environmental support for dilutionand abatement of process emissions: The case of electricity production. J. Clean. Prod. 2002, 10, 335–348. [Google Scholar] [CrossRef]
- Cao, C.; Feng, X. Distribution of emergy indices and its application. Energy Fuels 2007, 21, 1717–1723. [Google Scholar] [CrossRef]
- Brown, M.T.; Raugei, M.; Ulgiati, S. On boundaries and ‘investments’ inEmergy Synthesis and LCA: A case study on thermal vs. photovoltaicelectricity. Ecol. Indic. 2012, 15, 227–235. [Google Scholar] [CrossRef]
- Yi, H.; Braham, W.W. Uncertainty characterization of building emergy analysis (BEmA). Build. Environ. 2015, 92, 538–558. [Google Scholar] [CrossRef]
- GB 13223-2011. Emission Standard of Air Pollutants for Thermal Power Plants; National Mandatory Standard in China; Ministry of Environmental Protection: Beijing, China, 2011. Available online: http://blog.sina.com.cn/s/blog_53e6b71d0102vlk0.html (accessed on 20 January 2020).
- Zhang, X.H.; Jiang, W.J.; Deng, S.H.; Peng, K. Emergy evaluation of the sustainability of Chinese steel production during 1998–2004. J. Clean. Prod. 2009, 17, 1030–1038. [Google Scholar] [CrossRef]
- GB 3095-1996. Ambient Air Quality Standards; National Mandatory Standard in China; Ministry of Environmental Protection: Beijing, China, 2012. Available online: https://www.doc88.com/p-1843464179404.html (accessed on 20 January 2020).
- Bakshi, B.R. A thermodynamic framework for ecologically conscious process systems engineering. Comput. Chem. Eng. 2002, 26, 269–282. [Google Scholar] [CrossRef]
- Liu, G.; Yang, Z.; Chen, B.; Zhang, L. Modelling a thermodynamic-based comparative framework for urban sustainability: Incorporating economic and ecological losses into emergy analysis. Ecol. Model. 2013, 252, 280–287. [Google Scholar] [CrossRef]
- Ministry of Environmental Protection of the People’s Republic of China. Ambient Air Quality Standard (GB3095-2012); Ministry of Environmental Protection: Beijing, China, 2012. Available online: http://www.doc88.com/p-4485083460418.html (accessed on 20 January 2020).
- Ministry of Environmental Protection of the People’s Republic of China. Environmental Quality Standards for Surface Water (GB3838-2002); Ministry of Environmental Protection: Beijing, China, 2002. Available online: http://www.doc88.com/p-9502940207186.html (accessed on 20 January 2020).
- Zhang, X.; Qi, Y.; Wang, Y.; Wu, J.; Lin, L.; Peng, H.; Qi, H.; Yu, X.; Zhang, Y. Effect of the tap water supply system on China’s economy and energy consumption, and its emissions’ impact. Renew. Sustain. Energy Rev. 2016, 64, 660–671. [Google Scholar] [CrossRef]
- Wang, J.N.; Yu, F.; Cao, D. Study report 2004 for green national economic accounting. China Popul. Resour. Environ. 2006, 16, 11–17. [Google Scholar]
- Brown, M.T.; Campbell, D.E.; De Vilbiss, C.; Ulgiati, S. The geobiosphere emergy baseline: A synthesis. Ecol. Model. 2016, 339, 92–95. [Google Scholar] [CrossRef]
- Lee, J.M.; Braham, W.W. Building emergy analysis of Manhattan: Density parameters forhigh-density and high-rise developments. Ecol. Model. 2017, 363, 157–171. [Google Scholar] [CrossRef]
- Pan, H.; Zhang, X.; Wu, J.; Zhang, Y.; Lin, L.; Yang, G.; Deng, S.; Li, L.; Yu, X.; Qi, H.; et al. Sustainability evaluation of a steel production system in China based on emergy. J. Clean. Prod. 2016, 112, 1498–1509. [Google Scholar] [CrossRef]
- Cabezas, H.D.; Campbell, T.; Eason, A.S.; Garmestani, M.T.; Herberling, M.E.; Hopton, J. San Luis Basin Sustainability Metrics Project: A Methodology for Evaluating Regional Sustainability; Heberling, M.T., Hopton, M.E., Eds.; United States Environmental Protection Agency (US EPA): Washington, WA, USA, 2010.
- Vorasun, B. Evaluation of Recycling and Reuse of Building Materials Using the Emergy Analysis Method. Gainesville, FL, USA, 1998. Available online: https://www.mendeley.com/catalogue/evaluation-recycling-reuse-building-materials-using-emergy-analysis-method/ (accessed on 20 January 2020).
- Lou, B.; Ulgiati, S. Identifying the environmental support and constraints to the Chinese economic growth-an application of the Emergy Accounting method. Energy Policy 2013, 55, 217–233. [Google Scholar] [CrossRef]
- Jiangsu Provincial Bureau of Statistics, China, 2012–2016. Jiangsu Statistical Yearbook; Statistics Press: Beijing, China, 2012–2016. [Google Scholar]
- Gao, G.; Chen, D.L.; Xu, C.Y.; Simelton, E. Trend of estimated actual evapotranspiration over China during 1960–2002. J. Geophys. Res. 2007, 112, D11120. [Google Scholar] [CrossRef] [Green Version]
- Brown, M.T.; Bardi, E. Handbook of Emergy Evaluation: A Compendium of Data for Emergy Computation in a Series of Folios, Folio; Center for Environmental Policy, University of Florida: Gainesville, FL, USA, 2001. [Google Scholar]
- Wu, M.Q.; Zhang, A.D.; Kan, Z.Q.; Sun, X.B.; Lin, X. Land surface temperature retrieved using MODIS data in Shandong Province. In Proceedings of the Geoinformatics, 21st International Conference on IEEE, Kaifeng, China, 22 June 2013. [Google Scholar]
- CMA of Surface Winds Geostrophic, China Meteorological Administration. 2015. Available online: http://www.cma.gov.cn/2011qxfw/2011qtqyb/ (accessed on 20 January 2020).
- Miller, B.I. A study of the filling of hurricane Donna over land (2000). Mon. Weather Rev. 1964, 92, 389–406. [Google Scholar] [CrossRef] [Green Version]
- Lemos, D.; Dias, A.C.; Gabarrell, X.; Arroja, L. Environmental assessment of an urban water system. J. Clean. Prod. 2013, 54, 157–165. [Google Scholar] [CrossRef]
- Amores, M.J.; Meneses, M.; Pasqualino, J.; Antón, A.; Castells, F. Environmental assessment of urban water cycle on Mediterranean conditions by LCA approach. J. Clean. Prod. 2013, 43, 84–92. [Google Scholar] [CrossRef]
- Zhang, C.; Chen, J.; Wen, Z. Alternative policy assessment for water pollution control in China’s pulp and paper industry. Resour. Conserv. Recycl. 2012, 66, 15–26. [Google Scholar] [CrossRef]
- Wang, Z.; Huang, K.; Yang, S.; Yu, Y. An input-output approach to evaluate the water footprint and virtual water trade of Beijing, China. J. Clean. Prod. 2013, 42, 172–179. [Google Scholar] [CrossRef]
- Ma, Z.; Xue, B.; Geng, Y.; Ren, W.; Fujita, T.; Zhang, Z.; Puppim de Oliveira, J.A.; Jacques, D.A.; Xi, F. Co-benefits analysis on climate change and environmental effects of wind-power: A case study from Xinjiang, China. Renew Energy 2013, 57, 35–42. [Google Scholar] [CrossRef]
- Li, X.; Feng, K.; Siu, Y.L.; Hubacek, K. Energy-water nexus of wind power in China: The balancing act between CO2 emissions and water consumption. Energy Policy 2012, 45, 440–448. [Google Scholar] [CrossRef]
- Peronato, G.; Rastogi, P.; Rey, E.; Andersen, M. A toolkit for multi-scale mapping of the solar energy-generation potential of buildings in urban environments under uncertainty. Sol. Energy 2018, 173, 861–874. [Google Scholar] [CrossRef] [Green Version]
- Liu, T.; Bai, Z.; Zheng, Z.; Liu, Q.; Lei, J.; Sui, J.; Jin, H. 100 kWe power generation pilot plant with a solar thermochemical process: Design, modeling, construction, and testing. Appl. Energy 2019, 251, 113217. [Google Scholar] [CrossRef]
- Gaudard, L.; Romerio, F.; Dalla Valle, F.; Gorret, R.; Maran, S.; Ravazzani, G.; Stoffel, M.; Volonterio, M. Climate change impacts on hydropower in the Swiss and Italian Alps. Sci. Total Environ. 2014, 493, 1211–1221. [Google Scholar] [CrossRef]
- Tang, S.; Chen, J.; Sun, P.; Li, Y.; Yu, P.; Chen, E. Current and future hydropower development in Southeast Asia countries (Malaysia, Indonesia, Thailand and Myanmar). Energy Policy 2019, 129, 239–249. [Google Scholar] [CrossRef]
- Wang, Y.; Zhao, M.; Chang, J.; Wang, X.; Tian, Y. Study on the combined operation of a hydro-thermal-wind hybrid power system based on hydro-wind power compensating principles. Energy Convers. Manag. 2019, 194, 94–111. [Google Scholar] [CrossRef]
- Said, S.; Aly, M.; Hartmann, B. A robust SMES control for enhancing stability of distribution systems fed from intermittent wind power generation. Turk. J. Electr. Eng. Comput. Sci. 2019, 27, 3883–3898. [Google Scholar] [CrossRef]
- Gonçalves, T.; Silva, R.V.; de Brito, J.; Fernandez, J.M.; Esquinas, A.R. Mechanical and durability performance of mortars with fine recycled concrete aggregates and reactive magnesium oxide as partial cement replacement. Cem. Concr. Compos. 2020, 105, 103420. [Google Scholar] [CrossRef]
- He, X.; Zheng, Z.; Ma, M.; Su, Y.; Yang, J.; Tan, H.; Wang, Y.; Strnadel, B. New treatment technology: The use of wet-milling concrete slurry waste to substitute cement. J. Clean. Prod. 2020, 242, 118347. [Google Scholar] [CrossRef]
Figure 1.
The wastewater treatment process in the sewage treatment plant.

Figure 2.
The emergy diagram of the new sewage treatment plant.

Figure 3.
Sludge treatment process flow diagram of the new sewage treatment plant.

Figure 4.
Comparison of all indicators between former and latter.

Figure 5.
The indicator changes between former and latter.


Table 1.
Comparison of existing articles in the sewage treatment industry based on emergy.
| Author | Year | Basic Data | Emergy Baseline | Emergy Analysis Angles | Country | ||
|---|---|---|---|---|---|---|---|
| Infrastructure Emergy | Running Emergy | Pollutant Emergy | |||||
| Paolo et al. | 2009 | Old Plant | Old | × | √ | × | Italy |
| XiaoHong et al. | 2010 | Old Plant | Old | × | √ | √ | China |
| XiaoHong et al. | 2015 | Old Plant | Old | × | √ | × | China |
| Erik et al. | 2017 | A Pond | New | × | √ | × | Sweden |
| Shuai et al. | 2017 | Old Plant | Old | × | √ | √ | China |
| Natalia et al. | 2017 | Grass system | Old | × | √ | × | USA |
| Junsheng et al. | 2017 | A farm | New | × | √ | √ | China |
| Ling et al. | 2017 | Old Plant | New | × | √ | × | China |
| Yan et al. | 2018 | Old Plant | New | × | √ | √ | China |
| This paper | Now | New plant | New | √ | √ | √ | China |
Table 2.
main building materials types.
| No. | Item | Data | Unit | Source |
|---|---|---|---|---|
| 1 | Cement | 5.44 × 10⁷ | kg | Investigation |
| 2 | Steel | 2.83 × 10⁷ | kg | Investigation |
| 3 | Tap water | 1450 | M3 | Investigation |
| 4 | Wood | 5.79 × 10⁵ | kg | Investigation |
| 5 | Brick | 1.97 × 10⁶ | kg | Investigation |
| 6 | Limestone | 1.31 × 10⁵ | kg | Investigation |
| 7 | Gravel | 2.03 × 10⁷ | kg | Investigation |
| 8 | Tile | 7.36 × 10⁵ | kg | Investigation |
| 9 | Asphalt | 1.40 × 10⁵ | kg | Investigation |
| 10 | Aluminum | 1.14 × 10⁶ | kg | Investigation |
Table 3.
Auxiliary engineering costs.
| No. | Project Types | Expenditure | Unit | Source |
|---|---|---|---|---|
| 1 | Scaffolding project | 7,329,560 | US $ | Investigation |
| 2 | Concrete formwork and bracket | 16,784,840 | US $ | Investigation |
| 3 | Equipment installation and disassembly | 2,306,530 | US $ | Investigation |
| 4 | Night construction | 999,011 | US $ | Investigation |
| 5 | Special season construction (Rainy and winter) | 482,690 | US $ | Investigation |
Table 4.
Comprehensive labor cost.
| No. | Comprehensive Labor Type | Cost | Unit | Source |
|---|---|---|---|---|
| 1 | Construction Engineering Branch | 917,390 | US $ | Investigation |
| 2 | Installation Engineering Branch | 213,873 | US $ | Investigation |
| 3 | Decoration Engineering Branch | 628,545 | US $ | Investigation |
| 4 | Municipal Engineering Branch | 136,947 | US $ | Investigation |
Table 5.
Service and management fees for the government.
| No. | Types | Fees | Unit | Source |
|---|---|---|---|---|
| 1 | Environmental protection fee | 54,547.2 | US $ | Investigation |
| 2 | Civilization Construction Fee | 184,536.7 | US $ | Investigation |
| 3 | Temporary facility fee | 37,435.68 | US $ | Investigation |
| 4 | Safety construction fee | 86,615.89 | US $ | Investigation |
| 5 | Engineering sewage charges | 10,964.02 | US $ | Investigation |
| 6 | Dangerous work accident insurance | 43,999.70 | US $ | Investigation |
Table 6.
Water-quality discharge from import and export concentration.
| No. | Items | Inlet | Ref. | Outlet | Ref. | Unit |
|---|---|---|---|---|---|---|
| 1 | Chemical Oxygen Demand (COD) | 120 | Detected | 50 | GB 18918-2002 | mg/L |
| 2 | Total Oxygen Demand (BOD) | 40 | Detected | 10 | GB 18918-2002 | mg/L |
| 3 | Suspended Solids (SS) | 130 | Detected | 10 | GB 18918-2002 | mg/L |
| 4 | P | 2 | Detected | 0.5 | GB 18918-2002 | mg/L |
| 5 | N | 30 | Detected | 15 | GB 18918-2002 | mg/L |
| 6 | NH3-N | 25 | Detected | 5 | GB 18918-2002 | mg/L |
Table 7.
All indicators of emergy for the new sewage treatment plant.
| No. | Items | Index | Expression | Implication |
|---|---|---|---|---|
| 1 | Renewable energy emergy | R | R | Basic emergy input |
| 2 | Nonrenewable resource emergy | F | F | Basic emergy input |
| 3 | Purchased emergy | P | P | Basic emergy input |
| 4 | Wastewater treatment chemicals emergy | C | C | Basic emergy input |
| 5 | Labor and service emergy | L | L | Basic emergy input |
| 6 | Energy emergy | E | E | Basic emergy input |
| 7 | Transportation emergy | S | S | Basic emergy input |
| 8 | Pollutant emergy | Pe | Pe | Basic emergy input |
| 9 | Total emergy of the system | T | R + F + P + C + L+ E + S + Pe | The total emergy of the system |
| 10 | Renewability rate | Rr | R/T | renewable proportion |
| 11 | Nonrenewability rate of local resource | Nr | F/T | local resource proportion |
| 12 | Nonrenewability rate of purchased resource | Np | P/T | Outside economic impact |
| 13 | Emergy personal density | Ed | T/person | Emergy per person |
| 14 | Emergy intensity | Ei | T/area | Emergy per area |
| 15 | Purchased emergy dependence level | PEDL | P/N | Competitiveness of the system |
| 16 | Pollutant environmental impact rate | PEIR | Pe/T | Pollutant degree |
| 17 | Emergy investment ratio | EIR | P/(R + F) | Economic development level |
| 18 | Environmental loading ratio | ELR | (F + P + Pe)/R | Environmental pressure |
| 19 | Emergy yield rate | EYR | (R + F + P + Pe)/P | Economic benefit |
| 20 | Emergy Sustainability Index | ESI | EYR/ELR | System sustainability |
Table 8.
DALY data of exhaust gas emission emissions in this article [32].
Table 8.
DALY data of exhaust gas emission emissions in this article [32].
| Name of Gas | Damage Impact on Human Health | DALY (a/Kg of Discharge) |
|---|---|---|
| Dust | respiratory | 5.46 × 10⁻⁵ |
| SO2 | respiratory | 8.87 × 10⁻⁵ |
| NOX | respiratory | 3.75 × 10⁻⁴ |
Note: DALY means disability adjusted life year (unit: a/Kg of Discharge).
Table 9.
Unit emergy values (UEVs) correction based on 12.00 × 1024 sej/year [64].
Table 9.
Unit emergy values (UEVs) correction based on 12.00 × 1024 sej/year [64].
| No. | Item | Raw UEVs | Emergy baseline(sej/a) | Ref. | Corrected UEVs | Unit |
|---|---|---|---|---|---|---|
| 1 | Sunlight | 1 | 12.00 × 1024 | [65] | 1 | sej/j |
| 2 | Rain (chemical) | 2.35 × 10⁴ | 12.00 × 1024 | [65] | 2.35 × 10⁴ | sej/j |
| 3 | Rain (geopotential) | 1.31 × 10⁴ | 12.00 × 1024 | [65] | 1.31 × 10⁴ | sej/j |
| 4 | Wind (kinetic energy) | 1.90 × 10³ | 12.00 × 1024 | [65] | 1.90 × 10³ | sej/j |
| 5 | Geothermal heat | 4.37 × 10⁴ | 12.00 × 1024 | [27] | 4.37 × 10⁴ | sej/j |
| 6 | Gravel | 1.42 × 10¹² | 12.00 × 1024 | [27] | 1.42 × 10¹² | sej/kg |
| 7 | Limestone | 1.27 × 10¹² | 12.00 × 1024 | [27] | 1.27 × 10¹² | sej/kg |
| 8 | Cement | 1.93 × 10¹² | 12.00 × 1024 | [27] | 1.93 × 10¹² | sej/kg |
| 9 | Steel | 2.75 × 10¹² | 9.44 × 1024 | [66] | 3.49 × 10¹² | sej/kg |
| 10 | Wood | 2.67 × 10¹² | 12.00 × 1024 | [67] | 2.67 × 10¹² | sej/kg |
| 11 | Brick | 2.82 × 10¹² | 12.00 × 1024 | [68] | 2.82 × 10¹² | sej/kg |
| 12 | Tap water | 9.03 × 10¹¹ | 12.00 × 1024 | [32] | 9.03 × 10¹¹ | sej/m3 |
| 13 | Tile | 3.89 × 10¹² | 12.00 × 1024 | [68] | 3.89 × 10¹² | sej/kg |
| 14 | Asphalt | 3.49 × 10¹² | 12.00 × 1024 | [67] | 3.49 × 10¹² | sej/kg |
| 15 | Aluminum | 1.61 × 10¹³ | 12.00 × 1024 | [68] | 1.61 × 10¹³ | sej/kg |
| 16 | Polyaluminium chloride | 3.37 × 10⁶ | 12.00 × 1024 | [32] | 3.37 × 10⁶ | sej/kg |
| 17 | Cl2 liquid | 3.37 × 10⁶ | 12.00 × 1024 | [32] | 3.37 × 10⁶ | sej/kg |
| 18 | Polyacrylamide | 3.37 × 10⁶ | 12.00 × 1024 | [32] | 3.37 × 10⁶ | sej/kg |
| 19 | Potassium permanganate | 3.37 × 10⁶ | 12.00 × 1024 | [32] | 3.37 × 10⁶ | sej/kg |
| 20 | Labor & services | 1.51 × 10¹⁰ | 15.83 × 1024 | [69] | 1.14 × 10¹⁰ | sej/$ |
| 21 | Electricity | 4.50 × 10⁵ | 12.00 × 1024 | [27] | 4.50 × 10⁵ | sej/j |
Table 10.
Comprehensive emergy calculation form of the sewage treatment plant.
| Name | Formula Ratio | Basic Data | Unit | Ref. for the Data | UEVs sej/unit | Ref. for the UEVs | Emergy (sej) | % |
|---|---|---|---|---|---|---|---|---|
| 1—Renewable Energy (See note 1 for the specific calculation process) | 2.39 × 10¹⁶ | 0.01 | ||||||
| Sunlight | 1.32 × 10⁸ | J/y | Calculated | 1 | [65] | 1.32 × 10⁸ | 0.00 | |
| Rain (chemical potential) | 6.41 × 10¹¹ | J/ y | Calculated | 2.35 × 10⁴ | [65] | 1.51 × 10¹⁶ | 0.01 | |
| Rain (geo potential) | 2.80 × 10¹¹ | J/ y | Calculated | 2.79 × 10⁴ | [65] | 7.81 × 10¹⁵ | 0.00 | |
| Wind (kinetic energy) | 4.43 × 10¹¹ | J/ y | Calculated | 1.90 × 10³ | [65] | 8.42 × 10¹⁴ | 0.00 | |
| Geothermal heat | 3.51 × 10¹¹ | J/ y | Calculated | 3.44 × 10⁴ | [27] | 1.27 × 10¹⁴ | 0.00 | |
| 2—Nonrenewable resources (For construction infrastructure of the plant) | 2.14 × 10²⁰ | 69.1 | ||||||
| Cement | 5.44 × 10⁷ | kg | Collected | 1.93 × 10¹² | [27] | 1.05 × 10²⁰ | 33.9 | |
| Steel | 2.83 × 10⁷ | kg | Collected | 2.75 × 10¹² | [66] | 7.78 × 10¹⁹ | 25.1 | |
| Gravel | 2.03 × 10⁷ | kg | Collected | 1.42 × 10¹² | [27] | 2.28 × 10¹⁹ | 7.36 | |
| Brick | 1.97 × 10⁶ | kg | Collected | 2.82 × 10¹² | [68] | 5.56 × 10¹⁸ | 1.79 | |
| Wood | 5.79 × 10⁵ | kg | Collected | 2.67 × 10¹² | [67] | 1.55 × 10¹⁸ | 0.50 | |
| Tap water | 1.45 × 10⁶ | M3 | Collected | 9.03 × 10¹¹ | [32] | 1.31 × 10¹⁸ | 0.42 | |
| Limestone | 1.31 × 10⁵ | kg | Collected | 1.27 × 10¹² | [27] | 1.66 × 10¹⁷ | 0.05 | |
| 3—Purchased resources (For construction infrastructure of the sewage plant) | 2.17 × 10¹⁹ | 7.00 | ||||||
| Aluminum | 1.14 × 10⁶ | kg | Collected | 1.61 × 10¹³ | [68] | 1.84 × 10¹⁹ | 5.94 | |
| Tile | 7.36 × 10⁵ | kg | Collected | 3.89 × 10¹² | [68] | 2.86 × 10¹⁸ | 0.92 | |
| Asphalt | 1.40 × 10⁵ | kg | Collected | 3.49 × 10¹² | [67] | 4.89 × 10¹⁷ | 0.16 | |
| 4—Wastewater treatment chemicals (For operational requirements of the plant) | 2.23 × 10¹⁶ | 0.01 | ||||||
| Polyaluminium chloride | 6.52 × 10⁹ | kg | Collected | 3.37 × 10⁶ | [32] | 2.20 × 10¹⁶ | 0.01 | |
| Cl2 liquid | 3.86 × 10⁷ | kg | Collected | 3.37 × 10⁶ | [32] | 1.30 × 10¹⁴ | 0.00 | |
| Polyacrylamide | 2.49 × 10⁷ | kg | Collected | 3.37 × 10⁶ | [32] | 8.39 × 10¹³ | 0.00 | |
| Potassium permanganate | 3.04 × 10⁷ | kg | Collected | 3.37 × 10⁶ | [32] | 1.02 × 10¹⁴ | 0.00 | |
| 5—Labor and services (The sum of construction infrastructure and operational) | 3.44 × 10¹⁷ | 0.11 | ||||||
| Labor and services | 3.02 × 10⁷ | $ | Collected | 1.14 × 10¹⁰ | [69] | 3.44 × 10¹⁷ | 0.11 | |
| 6—Energy (The sum of construction infrastructure and operational requirements) | 7.29 × 10¹⁹ | 23.5 | ||||||
| Electricity | 1.62 × 10¹⁴ | J | Collected | 4.50 × 10⁵ | [27] | 7.29 × 10¹⁹ | 23.5 | |
| 7—Transportation (For sludge transportation of the plant) | 1.55 × 10¹⁷ | 0.05 | ||||||
| Transportation (truck) | 2.04 × 10⁵ | t·km | Collected | 7.61 × 10¹¹ | [27] | 1.55 × 10¹⁷ | 0.05 | |
| 8—Industrial pollutant emissions (For operational pollutants of the plant) | 4.76 × 10¹⁷ | 0.15 | ||||||
| Exhaust gas | Dust | 35 μg/m3 | [60] | ~ | See note 8-1 | 2.49 × 10¹³ | 0.00 | |
| SO2 | 50 μg/m3 | [60] | ~ | See note 8-1 | 4.46 × 10¹³ | 0.00 | ||
| NOX | 80 μg/m3 | [60] | ~ | See note 8-1 | 1.11 × 10¹⁴ | 0.00 | ||
| Wastewater | ~ | See note 8-2 | 4.75 × 10¹⁷ | 0.15 | ||||
| Sludge waste | ~ | See note 8-3 | 5.84 × 10¹⁴ | 0.00 | ||||
| Total | ~ | 3.10 × 10²⁰ | 100 | |||||
| UEVs | UEVs = 3.40 × 10¹²sej/m3 for the new sewage treatment plant | |||||||
Table 11.
Calculated results of ecological indicators.
| No. | Items | Index | Expression | Results |
|---|---|---|---|---|
| 1 | Renewable energy emergy | R | R | 2.39 × 10¹⁶ sej |
| 2 | Nonrenewable resource emergy | F | F | 2.14 × 10²⁰sej |
| 3 | Purchased emergy | P | P | 2.17 × 10¹⁹ sej |
| 4 | Wastewater treatment chemicals emergy | C | C | 2.23 × 10¹⁶ sej |
| 5 | Labor and service emergy | L | L | 3.44 × 10¹⁷sej |
| 6 | Energy emergy | E | E | 7.29 × 10¹⁹sej |
| 7 | Transportation emergy | S | S | 1.55 × 10¹⁷sej |
| 8 | Pollutant emergy | Pe | Pe | 4.76 × 10¹⁷ sej |
| 9 | Total emergy of the system | T | R + F + P + C + L + E + S + Pe | 3.10 × 10²⁰sej |
| 10 | Renewability rate | Rr | R/T | 0.000077 |
| 11 | Non-renewability rate of local resource | Nr | F/T | 0.690323 |
| 12 | Non-renewability rate of purchased resource | Np | P/T | 0.070000 |
| 13 | Emergy personal density | Ed | T/person | 6.20 × 10¹⁷sej/per |
| 14 | Emergy intensity | Ei | T/area | 9.75 × 10¹⁷sej/m2 |
| 15 | Purchased emergy dependence level | PEDL | P/F | 0.101402 |
| 16 | Pollutant environmental impact rate | PEIR | Pe/T | 0.001535 |
| 17 | Emergy investment ratio | EIR | P/(R + F) | 0.101391 |
| 18 | Environmental loading ratio | ELR | (F + P + Pe)/R | 9881.841 |
| 19 | Emergy yield rate | EYR | (R + F + P + Pe)/P | 10.88479 |
| 20 | Emergy Sustainability Index | ESI | EYR/ELR | 0.001101 |
Table 12.
Comparison of existing articles on unit emergy values (UEVs) in China.
| Author | Basic Data | Emergy Baseline (Sej/y) | UEVs | Unit | Emergy Analysis Angles | Country | ||
|---|---|---|---|---|---|---|---|---|
| Infrastructure Emergy | Running Emergy | Pollutant Emergy | ||||||
| XiaoHong et al., 2015 | An old Plant | 15.83 × 1024 | 6.79 × 10¹¹ | Sej/m3 | × | √ | × | China |
| Yan et al., 2018 | An old Plant | 12.00 × 1024 | 9.03 × 10¹¹ | Sej/m3 | × | √ | √ | China |
| This paper | A new plant | 12.00 × 1024 | 3.40 × 10¹² | Sej/m3 | √ | √ | √ | China |
Table 13.
The sensitivity changes in three main contributors of the evaluated system.
| No. | Items | Former (sej) | Latter (sej) | Changes (%) |
|---|---|---|---|---|
| 1 | Nonrenewable resources | 2.14 × 10²⁰ | 2.35 × 10²⁰ | 6.903% |
| 2 | Purchased resources | 2.17 × 10¹⁹ | 2.39 × 10¹⁹ | 0.700% |
| 3 | Energy | 7.29 × 10¹⁹ | 8.02 × 10¹⁹ | 2.352% |
Table 14.
The indicators changes between former and latter.
| No. | Items | Index | Former | Latter | Unit |
|---|---|---|---|---|---|
| 1 | Renewability rate | Rr | 0.000077 | 0.000070 | ~ |
| 2 | Nonrenewability rate of local resource | Nr | 0.690323 | 0.689150 | ~ |
| 3 | Nonrenewability rate of purchased resource | Np | 0.070000 | 0.070088 | ~ |
| 4 | Emergy personal density | Ed | 6.20 × 10¹⁷ | 6.82 × 10¹⁷ | sej/per |
| 5 | Emergy intensity | Ei | 9.75 × 10¹⁴ | 1.07 × 10¹⁵ | sej/m2 |
| 6 | Purchased emergy dependence level | PEDL | 0.101402 | 0.101702 | ~ |
| 7 | Pollutant environmental impact rate | PEIR | 0.001535 | 0.001396 | ~ |
| 8 | Emergy investment ratio | EIR | 0.101391 | 0.101692 | ~ |
| 9 | Environmental loading ratio | ELR | 9881.841 | 10852.55 | ~ |
| 10 | Emergy yield rate | EYR | 10.88479 | 10.85355 | ~ |
| 11 | Emergy Sustainability Index | ESI | 0.001101 | 0.001000 | ~ |
© 2020 by the authors. Licensee MDPI, Basel, Switzerland. This article is an open access article distributed under the terms and conditions of the Creative Commons Attribution (CC BY) license (http://creativecommons.org/licenses/by/4.0/).
Share and Cite
MDPI and ACS Style
Zhang, J.; Ma, L. Environmental Sustainability Assessment of a New Sewage Treatment Plant in China Based on Infrastructure Construction and Operation Phases Emergy Analysis. Water 2020, 12, 484. https://doi.org/10.3390/w12020484
AMA Style
Zhang J, Ma L. Environmental Sustainability Assessment of a New Sewage Treatment Plant in China Based on Infrastructure Construction and Operation Phases Emergy Analysis. Water. 2020; 12(2):484. https://doi.org/10.3390/w12020484
Chicago/Turabian StyleZhang, Junxue, and Lin Ma. 2020. "Environmental Sustainability Assessment of a New Sewage Treatment Plant in China Based on Infrastructure Construction and Operation Phases Emergy Analysis" Water 12, no. 2: 484. https://doi.org/10.3390/w12020484
Note that from the first issue of 2016, this journal uses article numbers instead of page numbers. See further details here.