Performance Evaluation of Bias Correction Methods for Climate Change Monthly Precipitation Projections over Costa Rica


1
Instituto Tecnológico de Costa Rica, Escuela de Ingeniería en Construcción, Cartago 159-7050, Costa Rica
2
Faculty of Geo-Information Science and Earth Observation (ITC), Department of Water Resources, University of Twente, 99 7514 AE Enschede Hengelosestraat, The Netherlands
3
Department of Geography, University of Exeter, Exeter EX4 4PS, UK
4
Instituto Meteorológico Nacional, Departamento de Climatología e Investigaciones Aplicadas, San José 5383-1000, Costa Rica
*
Author to whom correspondence should be addressed.
Water 2020, 12(2), 482; https://doi.org/10.3390/w12020482
Submission received: 20 January 2020
/
Revised: 4 February 2020
/
Accepted: 7 February 2020
/
Published: 11 February 2020
(This article belongs to the Section Hydrology)
Abstract
:Six bias correction (BC) methods; delta-method (DT), linear scaling (LS), power transformation of precipitation (PTR), empirical quantile mapping (EQM), gamma quantile mapping (GQM) and gamma-pareto quantile mapping (GPQM) were applied to adjust the biases of historical monthly precipitation outputs from five General Circulation Models (GCMs) dynamically downscaled by two Regional Climate Models (RCMs) for a total of seven different GCM-RCM pairs over Costa Rica. High-resolution gridded precipitation observations were used for the control period 1951–1980 and validated over the period 1981–1995. Results show that considerable biases exist between uncorrected GCM-RCM outputs and observations, which largely depend on GCM-RCM pair, seasonality, climatic region and spatial resolution. After the application of bias correction, substantial biases reductions and comparable performances among most BC methods were observed for most GCM-RCM pairs; with EQM and DT marginally outperforming the remaining methods. Consequently, EQM and DT were selectively applied to correct the biases of precipitation projections from each individual GCM-RCM pair for a near-future (2011–2040), mid-future (2041–2070) and far-future (2071–2100) period under Representative Concentration Pathways (RCPs) 2.6, 4.5 and 8.5 using the control period 1961–1990. Results from the bias-corrected future ensemble-mean anticipate a marked decreasing trend in precipitation from near to far-future periods during the dry season (December, January, February (DJF) and March, April, May (MAM)) for RCP4.5 and 8.5; with pronounced drier conditions for those climatic regions draining towards the Pacific Ocean. In contrast, mostly wetter conditions are expected during the dry season under RCP2.6, particularly for the Caribbean region. In most of the country, the greatest decrease in precipitation is projected at the beginning of the rainy season (June, July, August (JJA)) for the far-future period under RCP8.5, except for the Caribbean region where mostly wetter conditions are anticipated. Regardless of future period, slight increases in precipitation with higher radiative forcing are expected for SON excluding the Caribbean region, where precipitation is likely to increase with increasing radiative forcing and future period. This study demonstrates that bias correction should be considered before direct application of GCM-RCM precipitation projections over complex territories such as Costa Rica.
1. Introduction
Global warming caused by anthropogenic increases of greenhouse gases concentrations in the atmosphere is associated with climate change around the world [1]. Higher temperatures will increase atmospheric moisture holding capacity, which can lead to increases in precipitation [2]. Changes in precipitation patterns will alter the world’s terrestrial hydrological systems, strongly influencing water resources availability, which will directly impact natural ecosystems along with critical socioeconomic sectors such as water supply, energy, crop production, animal raising and fishery [3]. Furthermore, rises in temperature along with future changes in precipitation patterns will be highly variable at regional and local scales, with some regions becoming drier while other regions are becoming wetter [4]. Managing water resources at local and regional scales under changing climate is a major challenge faced by societies today, especially due to considerable uncertainties regarding future atmospheric greenhouse gas emissions scenarios [5,6]. Central America is a region of the world that could increase its vulnerability to extreme climatic events in the future [7]. The region has been identified as a climate change “hot-spot,” where decreasing trends in precipitation have already been highlighted [8,9]. Central America is well-known for its climatic fluctuations including major droughts [10], impact of hurricanes [11] and increasing temperature trends [12] and it is expected to be the most responsive tropical region to future climate change [13]. Moreover, future changes in precipitation extremes and characteristics are among the most critical factors determining the overall impact of climate change on the hydrology and the water resources of the Central American region [14].
Relevant sectors such as hydropower generation, food production and cattle ranching are especially vulnerable to future climate extremes due to the strong dependence on the availability and distribution of water resources in Central America, especially for countries like Costa Rica and Panama [15,16]. Therefore, there is a need to produce reliable high-quality projections of future changes in precipitation due to climate change in the region.
The General Circulation Models (GCMs) developed in the fifth phase of the Coupled Model Intercomparison Project (CMIP5) of the Intergovernmental Panel on Climate Change (IPCC) are the most advanced tools currently available for understanding the mechanisms of past climate, investigating the relative contributions of anthropogenic and natural drivers and projecting possible future climate changes under idealized emission or concentration assumptions [17,18]. General Circulation Models (GCMs) are mathematical representations of physical processes in the atmosphere, ocean and land surface, which generate meteorological variables such as precipitation, temperature, wind speed, relative humidity and solar radiation among others [19]. GCMs meteorological variables are generated by solving the primitive equations of thermodynamics, mass and momentum [20]. However, GCMs outputs remain relatively coarse in terms of their spatial and temporal resolutions [21]. Systematic biases caused by imperfect conceptualization, spatial averaging and non-inclusion of local features make the direct use of GCMs outputs unreliable to force fine-scale impact assessment models [22]. Furthermore, GCMs can only provide limited spatial details in regions that feature narrow continental extensions, high mountains and steep slopes because the altitude-dependence of precipitation is not properly represented [23]. Specifically, most of the CMIP5 GCM models show less skill in precipitation simulation over regions with complex topography [24]. The Central America region for instance, has considerable topographic relief, which implies the existence of large gradients in climate variables such as precipitation, temperature, humidity and wind [25,26]. The interactions between the complex topography, narrow land configuration and climate patterns determined by the Pacific and Atlantic oceans give rise to numerous climate and ecological zones both horizontally and vertically that no single coarse-resolution GCM is capable of resolving, due in part to locally intense convective activity [27,28]. Moreover, GCMs do not provide reliable information for most hydrological relevant variables (e.g., precipitation and temperature) on resolutions below 200 km at monthly or daily scales, which is notably crude compared to that of hydrologic processes [29].
In light of the abovementioned constraints, higher temporal and spatial resolution precipitation projections that better represent key aspects of weather systems as demanded by local climate change studies must be produced to overcome the limitations of GCMs outputs, especially for geographically complex regions such as Central America. One approach to bridge this gap is the use of dynamical downscaling, which preserves the physical coherence of GCMs outputs [30,31].
Dynamical downscaling techniques transfer information from GCMs to finer scales by applying higher resolution Regional Climate Models (RCMs) over a limited area with initial boundary conditions taken from a driving GCM [32]. The RCMs added value is related to their ability to providing additional climate change signals that are not resolved in the coarser resolution GCMs [33,34]. Compared to GCMs, RCMs are more reliable at reproducing relevant patterns of local precipitation, since they explicitly solve mesoscale atmospheric processes so that the topographic effects on precipitation can be much better represented at a regional scale [35].
RCMs future projections of precipitation have extensively been used to assess the impact of climate change on various water resources systems including aquifer recharge [36,37], hydrological modelling [38,39,40], extreme river flows and flood analysis [30], water infrastructure systems design [41,42], land use and forestry [43,44] and tracking of tropical cyclones [45,46]. The improved performance of RCMs over GCMs is mainly due to (1) better representation of geographical features such as orography related to higher spatial resolutions (12.5–50 km) and (2) better description of physical processes by means of sub-grid scale parameterization and more detailed land surface schemes, providing spatially and physically consistent outputs for operational use on climate timescales [47,48]. The use of RCMs is preferable since they have proven to provide more reliable results for impact study of climate change on regional and local scales than GCMs [49]. However, RCMs model outputs may still produce considerable systematic biases; hence their direct use as input for impact models is inadvisable since they might lead to inaccurate conclusions [50,51,52]. Biases are defined as long term average deviations between simulations and observations [53].
RCMs biases originate from various sources including (1) boundary errors transferred from GCMs to RCMs, (2) insufficiently resolved surface properties related to spatial resolution (3) errors due to numeric resolutions and (4) internal model parameterization [54,55]. RCMs biases also depend on GCMs simulated variables, which could be significant for precipitation due to its highly nonlinear nature and large spatial variability, making them highly dependent on model resolution [56,57]. RCMs accuracy is seasonally and regionally dependent, showing diminished accuracy at representing summer precipitation than autumn and winter precipitation due to difficulties in modelling convective rainfall [58]. Furthermore, RCMs perform better in regions with temperate climate conditions than tropical regions, since tropical rainfall is often predominantly convective in nature and occurs at a sub daily time scale [59]. On the other hand, RCMs local feedbacks and forcings can lead to significantly different climate change responses in different parts of the world [39]. For instance, to address the uncertainty associated with model outputs, it is advisable to consider the use of multiple GCM-RCMs and different emission scenarios [60,61]. For scenario uncertainty, the spread across the Representative Concentration Pathway (RCP) emission scenarios, as proposed in the Fifth Assessment Report (AR5) by Intergovernmental Panel on Climate change (IPCC) [7], is the dominant source of uncertainty for projections to the end of the century [62]. Therefore, even though RCMs considerably improve the temporal and spatial resolutions of GCMs outputs, there is still a scale gap between the simulated grid cell values of precipitation and point-scale data [63].
As a consequence, postprocessing of RCMs outputs through the application of bias correction (BC) methods is generally a prerequisite step for most climate change impact studies [64,65]. Bias correction is the adjustment of biased simulated data to observations [66]. BC methods aim to add value to RCMs outputs by removing systematic biases of simulated data so that they can be used in climate change impact modelling [67]. Several bias correction methods have been developed to adjust meteorological variables from the RCMs ranging from simple scaling approaches to sophisticated distribution mapping [58,68,69]. BC methods are not expected to modify the original climate change signals [34] but most of them assume that the statistical relationship between the historic model simulation and observations will remain stable in the future period. Nevertheless, it has been found that this assumption may not be true because of the nonstationarity of the climate change processes [15]. Even though BC methods are capable of reducing biases from RCM outputs [55], their performances are most likely regionally dependent and should be evaluated and validated over a recent-past period prior to any climate change application [21]. Bias correction of precipitation is equally sensitive to the selection of a particular time period, so a good temporal structure of original observations is imperative [38,70]. Located in the Central America region, this study focuses on Costa Rica where most of the territory has experienced some degree of precipitation change during the period 1961–1990, showing increases on the north-western Caribbean side and decreases on the Pacific side [12,71]. As well as its vulnerability to perturbations and fluctuations in precipitation associated with climate change and its importance to ecology and relevance for the hydrological cycle, the performance of six bias correction methods, used to adjust the biases of two RCMs driven by five GCMs is evaluated over the recent past period 1951–1995.
Since the applicability of bias correction methods has not been sufficiently investigated in Costa Rica, this study aims at answering the following research questions regarding precipitation: (1) Can significant biases be identified between uncorrected GCM-RCMs outputs and observations? (2) Is the performance of the various bias correction methods spatially, regionally and seasonally dependent? (3) What are the best bias correction methods for the selected GCM-RCMs? (4) What are the projected bias-corrected impacts of climate change over each climatic region of Costa Rica considering the various RCPs emission scenarios and future periods considered? Projecting the impact of future climate change on precipitation and its effects on water resources is of paramount importance to the sustainable development of the country.
2. Materials and Methods
2.1. Study Area
Costa Rica is located across the Central American isthmus between Panama and Nicaragua and occupies an area of 51,060 km2 (Figure 1b). The country is bordered by the Caribbean Sea to the east and the Pacific Ocean to the west, which favors oceanic and climatological influences from both oceans. Precipitation variability in Costa Rica is driven by interactions between the local topography and a combination of the seasonal migration within the Intertropical Convergence Zone (ITCZ), which includes sea breeze effects, monsoonal circulations, strong easterly trade winds such as the Caribbean Low-Level Jet (CLLJ) [72], cold air masses from high and mid-latitudes during winter and perturbing influences of hurricanes and tropical cyclones in the Atlantic Ocean, all of which promotes a strong seasonal cycle and regional variability [73]. Moreover, the Central American isthmus is surrounded by one of the warmest body of waters known as the Western Hemisphere warm pool (WHWP) that covers the eastern tropical Pacific, the Gulf of Mexico, the Caribbean Sea and the western tropical North Atlantic [74]. The seasonal cycle of sea surface temperatures (SSTs) within this region affects the annual cycle of precipitation, convective activity and storm development [75]. Additionally, the temporal and spatial variability of precipitation in Costa Rica is heavily influenced by El Niño-Southern Oscillation (ENSO), which complex warm or wet responses vary in terms of their signs, magnitudes, duration and seasonality between those areas draining towards the Pacific and those draining towards the Caribbean [76].
On the other hand, the Costa Rica territory is meridionally divided by northwest-southeast trending cordilleras of high complexity, characterized by mountainous topographies and elevations ranging from sea-level to around 3400 m (Figure 1). Since the climate in Costa Rica is equally dependent on geographical altitude, it has been divided into six separate climatic regions (North-Pacific, Central-Pacific, South-Pacific, Central-Valley, North and Caribbean), which domains are determined by the position and elevation of the abovementioned cordilleras (Figure 1). These climatic regions act as individual domains and reflect the separation that elevation imposes between Caribbean (northeastern) and Pacific (southwestern) sources of moisture, revealing the important role played by elevation in controlling the circulation patterns of local precipitation [77]. The northeastern side of the country covers the Caribbean and North climatic regions.
Runoff from the North region flows towards the San Juan River, which represents the border between Costa Rica and Nicaragua and ultimately discharges in the Caribbean. The Caribbean region as its names suggests, drains directly towards the Caribbean Sea (Figure 1). Precipitation along these two climatic regions is year-round persistent as accumulated precipitation averages over 100 mm/month during December, January, February (DJF), even though the rest of the country experiences the driest period during this season (Figure 2). Peaks for the Caribbean and North regions are present in summer (June, July, August (JJA)) and autumn (September, October, November (SON)), when the northeast trade winds are strongest and easterly wave and tropical cyclone activity is most frequent [78]. Conversely, spring (March, April, May (MAM)) exhibits a transitional precipitation pattern from drier to wetter conditions, with May already approaching the summer peak. Precipitation during DJF is mainly associated with cold air outbreaks and frontal systems that pick up moisture over the Caribbean and advect precipitation on the North and Caribbean regions [79].
The southwestern side of the country on the other hand, includes the North-Pacific, Central-Pacific and South-Pacific regions, which directly drain towards the Pacific Ocean; whereas the Central-Valley region drains into the Tárcoles River, which ultimately discharges into the Pacific Ocean (Figure 1). Precipitation on the southwestern Pacific coast peaks during summer (JJA) and autumn (SON), as sea surface temperature (SST) also peaks and the ITCZ progresses through the region (Figure 2). During JJA, SSTs in the WHWP get considerably higher (above 28.5 C), resulting in intense convection and precipitation [80]. Atlantic tropical cyclones also drive onshore winds on the west side of the cordilleras during late summer (August) and early autumn (SON), which promote heavy precipitation events along the Pacific coast [71]. Precipitation on the southwestern Pacific coast considerably decreases during boreal winter (DJF) when surrounding SSTs are lowest and trade winds are weaker with a transitional dry to wet pattern during MAM, being May the wettest month during spring (Figure 2). There is also evidence of the Mid-Summer Drought (MSD) that essentially impacts the regions on the southwestern Pacific coast (Figure 2) and which manifests as a relative minimum within the overall JJA precipitation peak [81].
2.2. Datasets and Experimental Setup
A 1x1 km gridded monthly precipitation climatology based on rain-gauge historical observations (Figure 1) provided by Instituto Meteorológico of Costa Rica (IMN) [82,83] was selected as the observational dataset for the period 1951–1995. The Global Precipitation Climatology Centre (GPCC) [84] dataset was used on a comparative basis to evaluate the overall spatial and temporal coherence of the locally generated IMN climatology. Monthly precipitation totals from five General Circulation Models (GCMs), dynamically downscaled by the RCA4 Regional Climate Model [85] available in the context of the Coordinated Regional Climate Downscaling Experiment (CORDEX) over Central America (CA) were used in this study (Table 1).
Data from CORDEX-CA models, which covers the period 1950 to 2100 have a 0.44° × 0.44° (~50 km) spatial resolution and its domain aims to adequately simulate key large-scale circulation features that affect regional climate in Central America including the Intertropical Convergence Zone (ITCZ) displacements, the Caribbean Low-Level Jet (CLLJ), the occurrence of northerly cold fronts and the seasonal changes of the Western Hemisphere warm pool (WHWP). Additionally, monthly precipitation totals from the HadGEM2-ES GCM were dynamically downscaled by the Met Office Hadley Centre HadRM3P Regional Climate Model [42] (also referred to as PRECIS) were run at a 0.22° × 0.22° (~25 km) spatial resolution over the CA domain for the period 1950 to 2100. The Representative Concentration Pathway (RCP) emission scenarios, as proposed in the Fifth Assessment Report (AR5) by Intergovernmental Panel on Climate change (IPCC) were adopted in this study. RCPs refer to the possible range of radiative forcing values in the year 2100 relative to pre-industrial values (+2.6, +4.5, +6.0 and +8.5 W/m2, respectively), depending on how much greenhouse gases are eventually emitted in the years to come.
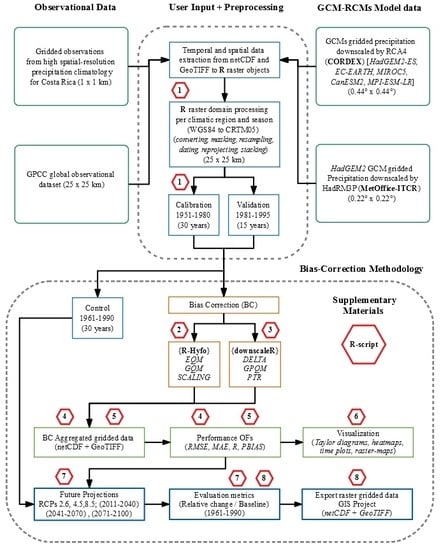
Since emissions trends can vary significantly from gradual development to rapid industrialized growth, RCPs 2.6, 4.5 and 8.5 were considered in this study to provide a wider picture of possible climate change impacts over the coming century. The RCP2.6 is a low emission scenario representing an equivalent concentration of CO2 of 440 ppm by mid-century. The RCP4.5 is an intermediate stabilization emission scenario with an equivalent concentration of CO2 ranging from 580 to 720 ppm in 2100, whereas the RCP8.5 is a rising pathway scenario leading to an equivalent concentration of CO2 larger than 1000 ppm in 2100. It is worth noticing that CanESM2-RCA4 was only run under RCP8.5, whereas MIROC5-RCA4 excluded RCP4.5 (Table 1). For instance, the multimodel ensemble-mean (EM) was calculated based on the total number of GCM-RCMs pairs available for specific periods. Because of the various spatial resolutions adopted by different GCM-RCM pairs, all model outputs, including the local climatology were resampled to a common 25 × 25 km grid using the bilinear interpolation method to match the spatial resolution of the gridded PRECIS and GPCC outputs. All data processing and spatial interpolation, including data-converting, masking, resampling, dating, reprojecting and raster-stacking were executed using the R programming language (v3.5.2) [86] by combining functionalities of the gstat (v2.0.3), sp (v1.3.1), raster (v3.0.7), ncdf4 (v1.16.1) rgdal (v1.4.6) and rgeos packages. Reprojection from WGS84 followed the official Costa-Rica Transverse-Mercator (CRTM05) projected-coordinate-system (Figure 3).
2.3. Bias Correction Methods
Six bias correction (BC) methods covering the major types of existing methods were compared in this study to adjust the biases of precipitation GCM-RCM outputs over Costa Rica (Table 1). The BC methods consist of delta-method (DT) linear scaling (LS), power transformation of precipitation (PTR), empirical quantile mapping (EQM), gamma quantile mapping (GQM) and gamma-pareto quantile mapping (GPQM). All of them are conducted on a monthly basis for each calendar month. A detailed explanation of these methods can be found in literature [2,6,22,29,32,43,69,87]. A brief description is provided below.
2.3.1. Delta-Change (DT)
The delta-change method [88,89,90] generates climate scenarios by adding the future change signal (anomalies) from GCM-RCM simulations for a perturbation of the observational datasets rather than to use the GCM-RCM simulations of future conditions directly according to:
where P is precipitation, contr is GCM-RCM simulated time series during the control period, obs is the observational time series during the control period, frc is the future forecast time series to be corrected, BC is the final bias-corrected time series, t is the time step and µm is the long-term monthly mean.
For the future forecast scenarios, the GCM-RCM-simulated anomalies between control and scenario runs are superimposed upon the observational time series, which is commonly done on a monthly basis using a multiplicative correction precipitation. In the delta-change method, observational time series are used as baseline which makes it a robust method capable of correcting the mean values. Nevertheless, standard deviation (variance), wet frequencies and intensities are not corrected. By definition, the DT perfectly adjusts GCM-RCM simulated time series during the calibration but potential future changes in climate dynamics and variability are not accounted for due to its simple transfer nature.
2.3.2. Linear Scaling (LS)
The linear scaling (LS) method aims to perfectly match the long-term monthly mean of corrected values with those of observed values [59]. Precipitation is typically adjusted with a multiplier factor. By definition, corrected GCM-RCM simulations will perfectly agree in their monthly mean values with the observations. The LS method operates with monthly correction values based on the differences between observed control and uncorrected data:
2.3.3. Power Transformation of Precipitation (PTR)
Since transformation methods like DT and LS account for a bias in the mean, they do not correct standard deviation (variance), wet frequencies or intensities. Consequently, a non-linear correction can be used to adjust the variance statistics of precipitation time series. The power transformation of precipitation method (PTR) applies an exponential correction factor in the form aPb [30,91]. The Parameter b is estimated with a distribution-free approach on a monthly basis using a 90 time steps window centered on the interval. Initially, b is identified by matching the coefficient of variation (CV) of the corrected GCM-RCM precipitation (Pb) with the CV of observed precipitation (Pobs) for each month (m) using a root-finding algorithm based on Brent’s method [92] finding bm such that:
Afterwards, the long-term monthly mean of observed precipitation is matched with the monthly mean of the intermediary series precipitation BC,1 using the standard linear scaling parameter abovementioned:
In PTR, a precipitation threshold can be introduced a priori to minimize drizzle events (very low but non-zero precipitation).
2.3.4. Empirical Quantile Mapping (EQM)
Quantile mapping (QM) attempts to correct the distribution of the GCM-RCM simulated data so that it matches the distribution of the observational dataset [93,94], which is done by applying a transfer function (TF). The TF maps the GCM-RCM simulated data to the observations based statistical moments of their respective cumulative distribution functions (CDF):
QM non-linearly corrects the mean, standard deviation (variance), quantiles, wet frequencies and intensities preserving the extremes. Therefore, the variability of corrected data is more consistent with the original GCM-RCM data. Similar to PTR, a precipitation threshold can be introduced to avoid substantial distortion of the distribution caused by drizzle events. However, QM lies on the assumption that both the observed and GCM-RCM datasets follow the same proposed distribution, which may introduce potential new biases. If empirical non-parametric CDFs are used without any assumption on precipitation distribution, the method is referred to as empirical quantile mapping (EQM) [55,64,95].
2.3.5. Gamma Quantile Mapping (GQM)
Quantile mapping (QM) can also be used to correct the biases of GCM-RCM projections by replacing the empirical CDFs with a parametric distribution. Similar to EQM, it is assumed that both the GCM-RCM simulated and observed precipitation follow a specific frequency distribution. The gamma distribution is commonly used for representing the CDF of precipitation and the method is referred as to gamma quantile mapping (GQM) [50]. The gamma distribution depends on a shape parameter α and a scale parameter β:
2.3.6. Gamma-Pareto Quantile Mapping (GPQM)
The combination of a gamma distribution and a Generalized Pareto distribution in quantile mapping is referred to as gamma-Pareto quantile mapping (GPQM) [36]. By this combination, a better correction of higher percentiles (extremes) is expected. It is assumed that the lower 95% of the distribution follow the gamma distribution. The upper 5% are assumed to follow the General Pareto distribution. GPQM has successfully been applied for the correction of climate change scenarios [63,97].
2.4. Bias Correction Implementation and Performance Assessment
The evaluation of the various bias correction (BC) methods was based on a two-sample cross-validation approach [21,29], where observed and GCM-RCMs precipitation outputs were split into a 30-year calibration period (1951–1980) and a 15-years validation period (1981–1995), defined mainly on the basis of the observational database temporal extension and data quality and consistency (Figure 3). The R programming language (v3.5.2) [86] package hyfo (v1.4.0) was used to execute the empirical quantile mapping (EQM), gamma quantile mapping (GQM) and linear scaling (LS) methods, whereas the downscaleR (v3.0.5), loadeR (v1.4.12) and transformeR (v1.4.7) packages were used to execute the delta-method (DT), gamma-pareto quantile mapping (GPQM) and power transformation of precipitation (PTR) methods independently for each grid cell within the various climatic regions (Figure 1). Bias correction parameters were generated and applied separately for each month of the year for each of the GCM-RCMs [22].
In the execution of the various BC methods, specialized R functions processed observed and GCM-RCMs simulated gridded time series data of the same duration for the calibration period (1951–1980) to adjust the biases of the validation period (1981–1995) time series. Afterwards, during the performance evaluation stage, the root-mean square error (RMSE), the mean absolute error (MAE), the percentage bias (PBIAS) and the correlation coefficient (R) objective functions were applied to quantify the bias between each individual BC method output and the observations for the validation period (1981–1995) according to:
where: Mi and Oi are the modelled and observed values respectively.
The RMSE ranges from 0 to +∞ and it is used for checking the estimation accuracy between observed and modelled values. A RMSE value close to 0 indicates a higher accuracy in estimation. The MAE is an absolute measure of bias that varies between 0 to +∞. A MAE value close to 0 indicates an unbiased prediction. Both the root mean square error (RMSE) and the mean absolute error (MAE) have extensively been employed in climate change and hydrological model evaluation studies [2,6,29,98,99,100,101,102].
The PBIAS on the other hand, calculates the relative volume difference between modelled and observed volume. A negative value indicates under-prediction whereas a positive value indicates over-prediction. Additionally, the standard deviation (SD) and the correlation coefficient (R) were also used to check the performance of each BC method mainly through the use of Taylor diagrams and heatmaps. Complementarily, quantile- quantile plots (Q-Q plots) were used to compare the uncorrected and bias-corrected CDFs against observations for the multimodel ensemble-mean (EM) during the validation period. Metrics from uncorrected GCM-RCMs and GPCC outputs were also included in the cross-validation process for comparison purposes. Based on the validation (1981–1995) period performance, selected BC methods were applied to correct the biases of precipitation projections from each individual GCM-RCM pair (Table 1) for a near-future (2011–2040), mid-future (2041–2070) and far-future (2071–2100) period under IPCC Representative Concentration Pathways (RCPs) 2.6, 4.5 and 8.5 (Figure 3). As suggested by the World Meteorological Organization [103], the standard 30-year control period (1961–1990) was used for the observed and GCM-RCM simulated gridded time series data, whereas the forecast time series are associated with future periods. After the bias corrected future time series were obtained using the abovementioned R functions, the percentage-change (PC) between the mean values of the observed control period (1961–1990) and the bias corrected ensemble-mean future projections were compared for each RCP scenario and future period. After standardization from the various netCDFs internal classes, future gridded time series products were exported to GeoTIFF format.
3. Results and Discussion
3.1. Historical Simulation
The spatially-averaged annual precipitation cycle over Costa Rica (Figure 4) shows that considerable biases exist between uncorrected GCM-RCM outputs and observations, which ultimately advise against the direct application of GCM-RCM precipitation projections in local climate change studies over the Costa Rica territory. The GCM-RCM pair ability to reproduce the shape of the observed bimodal annual precipitation cycle largely depends on seasonality, climatic region and spatial resolution. During DJF, when the lower surrounding sea surface temperatures (SSTs) and weaker trade winds within the intertropical convergence zone (ITCZ) mark the beginning of the dry season for most of the country; the majority of GCM-RCM pairs exhibit a systematic dry bias except for the Central-Valley region, where most GCM-RCM pairs overestimate precipitation. The same dry bias is observed during the transitional period from dry to wet conditions (MAM), when sea breeze effects and monsoonal circulations are triggered within the ITCZ although less evident for the Caribbean region.
During JJA, when all climatic regions experience a summer precipitation peak as northeast trade winds get stronger and SSTs also increase through the ITCZ, most GCM-RCM pairs overestimate precipitation in all regions but the North, where the majority of simulations substantially underestimate precipitation. Large wet biases can also be observed during the period of extreme precipitation (SON), when Atlantic tropical cyclone activity is most frequent and hurricanes and tropical storms drive onshore winds on the west side of the cordilleras promoting heavy precipitation along the Pacific and Atlantic coasts. Once again, the opposite applies for the North region by late SON, as most models exhibit a tendency to underestimate precipitation. Notwithstanding, CanESM2, MIROC5 and in many instances HadGEM2-ES, exhibit a systematic dry bias throughout the year, with CanESM2 reproducing only one of the two precipitation peaks commonly seen during JJA-SON. At the same time, MIROC5 exhibits an unexpected minimum during September in most of the country. The mid-summer drought of July-August however, is only captured by PRECIS, HadGEM2-ES and MIROC5 but exaggerated in most cases.
In general terms, GCM-RCM pairs downscaled by RCA4 exhibit higher biases when compared against PRECIS (HadGEM2-ES/HadRM3P) regardless of climatic region. Most RCA4 models face difficulties in representing the observed wetter conditions experienced by climatic regions along the Pacific coast, together with specific climate processes operating in those region, including complex land and coastal configurations between the northeastern and southwestern parts of the country, which ultimately renders a very location-dependence performance. In addition, the fact that GCMs dynamically downscaled by RCA4 show such extreme variations suggests that the performance of individual model pairs largely depends on GCMs simulations themselves rather than the conceptualization of RCA4, indicating that local processes and relevant parameterizations are important in determining RCMs responses to boundary forcing. As pointed out by Kotlarski et al. [57], biases related to parameterization schemes and unresolved processes thus remain, in addition to systematic biases related to the large-scale circulation patterns as part of GCMs outputs that later propagate into RCMs. The fact that the two RCMs considered (HadRM3P and RCA4) driven by the same GCM (HadGEM2-ES) exhibit considerably different biases suggests that RCMs spatial resolution and internal parameterization are equally important.
The lower spatial resolution (50 km), convection schemes and surface flux parameterization of the RCA4 could also be associated with such a tendency, particularly over Central America and especially Costa Rica, which narrowest part is barely 125 km wide (Figure 1) between the Pacific and Atlantic oceans. Unwanted marine influence from both oceans could collaterally be incorporated into land cells during the bilinear resampling process to 25 km due to spatial averaging.
A similar tendency was found by Diro et al. [40] using the RegCM4 Regional Climate Model to conduct an analysis over the Central America CORDEX domain at 50 km × 50 km spatial resolution to evaluate the sensitivity of rainfall to land and sea surface schemes. Their results identified a marked underestimation of precipitation mainly related to an erroneous numerical misplacement of the location of the Caribbean Low Level Jet (CLLJ) by the GCM-RCM.
In their study of the CORDEX Central America domain using the RegCM4 Regional Climate Model, Fuentes-Franco et al. [104] concluded that the representation of topography over the narrow Central America isthmus critically depends on GCM-RCM model spatial resolution. The authors also highlighted the relevance of resolving coastal topography for a better simulation of tropical cyclone activity in the region. The complex physiographical features of Costa Rica, which include complicated mountainous terrain in a relatively small area, highlight the need for higher resolution GCM-RCM models.
Olsson et al. [105] also encountered limitations on the 50 km × 50 km CORDEX spatial resolution as it seems too course for small scale hydrological modelling. Conversely, the higher spatial resolution (25 km) and scheme parameterization of PRECIS, which more clearly describes the boundary between land and ocean cells, seems to capture more of the spatiotemporal variability of precipitation over most climatic regions of Costa Rica, especially during the rainy season. This indicates that as individual GCM-RCM pairs; precipitation variability is better reproduced by PRECIS, as higher resolution outcomes add improvement over the coarser RCA4 50 km simulations in most cases. Furthermore, the year-round persistent and complex precipitation regime of the North and Caribbean regions, which are associated with cold air outbreaks and frontal systems, is better described by PRECIS than any RCA-RCM pair.
Similarly, Karmalkar et al. [25] analyzed two sets of experiments at 25 km × 25 km spatial resolution over Central America using PRECIS and found a reasonable representation of the key regional climate features for recent climate conditions. Nevertheless, the authors underline that a better representation of the Mid-Summer Drought (MSD), the Caribbean Low Level Jet (CLLJ), cold surges and tropical cyclones dynamics are needed to improved reliability on GCM-RCM projections. It is worth noticing that the uncorrected model ensemble-mean generally performed better than individual RCA4 pairs and in many instances even better than PRECIS. Such is the case of the North-Pacific, Central-Pacific and South-Pacific regions, as the ensemble-mean simulations get closer to observations across most seasons.
For the remaining climatic regions however, the uncorrected model ensemble-mean seems to overestimate precipitation during the rainy season and underestimates precipitation during the dry season. This is possibly related to the severe dry biases incorporated by CanESM2 and MIROC5 within the spatially-averaged mean, especially over the Central-Valley and North regions. In spite of clear inabilities of individual GCM-RCM pairs to properly reproduce the magnitude of historical precipitation, all models except CanESM2 and MIROC5 generally simulate well the annual cycle of precipitation over most climatic regions of Costa Rica. For instance, the outcomes of these models could be used for climate change impact studies after the application of bias correction methods. In addition, observations from the GPCC dataset are generally in good agreement with the high resolution local precipitation climatology except for the Central-Valley region, where GPCC slightly overestimates precipitation during most of the rainy season. However, on a comparative basis, the overall spatial and temporal coherence between the local climatology and the GPCC products is considered satisfactory, which gives sufficient assurance that the local climatology can be used for bias correction purposes over the Costa Rica territory.
3.2. Evaluation of Bias Correction Methods
Taylor diagrams (Figure 5) summarize the results of the various BC methods applied to all GCM-RCM pairs during the validation period (1981–1995) for each climatic region of Costa Rica in terms of root mean square error (RMSE), correlation coefficient (R) and standard deviation (SD). Results show that most BC methods considerably improve GCM-RCM simulations as RMSE values clearly decrease, SD values get closer to observations and R values get higher after the application of BC methods. Nonetheless, in most cases the extent of improvements is fairly comparable.
Uncorrected GCM-RCM R values are generally lower than their bias corrected counterparts, suggesting than BC values better represent the temporal and spatial patterns of precipitation over Costa Rica. Moreover, SD values of uncorrected GCM-RCM pairs vary significantly across climatic regions, showing marked spatial and temporal heterogeneity. The uncorrected ensemble-mean usually exhibits better performance compared to individual uncorrected GCM-RCM pairs. The ensemble-mean also benefit from bias correction application but there is a tendency to over-adjust SD values by most BC methods in the South-Pacific region. Reasonably higher R values (between 0.70 and 0.85) and lower RMSE values (100 to 125 mm/month) are achieved after bias corrected for most climatic regions except for the Caribbean, where R values in fact decrease from a range of 0.60–0.70 to values below 0.50, even though RMSE values are substantially reduced. This indicates that uncorrected GCM-RCM pairs encounter limitations in properly capturing the spatiotemporal variability of precipitation over the Caribbean climatic region and BC methods are for instance even less effective. In addition, uncorrected RMSE and MAE values are also usually higher for RCA4 models, particularly along the Caribbean coast where the year-round persistent precipitation pattern, associated with cold air outbreaks and frontal systems advect precipitation is clearly not properly described by RCA4 models. Since BC methods results vary substantially across temporal and scales, seasonal heatmaps of performance metrics are presented in terms of root mean square error (RMSE), mean absolute deviation (MAE), correlation coefficient (R) and percentage bias (PBIAS) for the entire dataset (Figure 6, Figure 7, Figure 8 and Figure 9), along with Q-Q plots of uncorrected and bias corrected ensemble-mean data against observations (Figure 10).
3.2.1. DJF
At the beginning of the dry season (DJF), the uncorrected model ensemble-mean (EM) generally outperforms individual GCM-RCM pairs, exhibiting lower RMSE, MAE and PBIAS values and higher R values regardless of climatic region or spatial resolution, which suggests that the ensemble-mean is more effective in capturing the seasonal pattern of precipitation over Costa Rica during DJF. Improvements for the ensemble-mean and individual GCM-RCM pairs are clearly achieved for the North-Pacific, Central-Pacific, Central-Valley and North regions after the application of bias correction methods, with EQM and DT showing marginally lower RMSE, MAE and PBIAS values than the remaining methods. For the North-Pacific, the ensemble-mean PBIAS was reduced from -32% to 3% using EQM, 73% to −5% for the Central-Valley using DT, −62% to 14% for the North region using DT and 16% to 4% for the Central-Pacific using DT as well. Nonetheless, PTR, GQM and GPQM provide similar performances as well. Reductions in terms of RMSE range from 8% to 78% after bias correction; in terms of MAE such reductions range from 24% to 66% depending on the GCM-RCM pair, climatic region and BC method.
Similar to uncorrected values, the bias corrected model ensemble-mean is generally better than individual bias corrected GCM-RCM pairs, only slightly exceeded by PRECIS in some cases. Q-Q plots for the ensemble-mean also support the application of BC methods, since bias corrected quantiles are closer to observed values than their uncorrected counterparts, regardless of the BC method. It can also be noted that uncorrected quantiles show larger variations across climatic regions, especially for the North and Central-Valley regions.
Notwithstanding, for the South-Pacific and Caribbean regions improvements are mainly achieved on RCA4 models in terms of RMSE MAE and R when bias corrected by EQM and DT respectively but biases from PRECIS and the ensemble-mean were generally amplified after bias correction. PBIAS values in both regions also increase when compared to uncorrected values for PRECIS and the ensemble-mean. It can be seen for example that PRECIS PBIAS increases from −1% when uncorrected to 38% after bias corrected by DT in the Caribbean region and from −19% to 49% for the South-Pacific using EQM. A similarly tendency is shown by the ensemble-mean in the Caribbean region, probably driven by PRECIS influence.
Concerning R, the application of most BC methods ultimately decreases correlation for PRECIS and the ensemble-mean. In addition to that, the ensemble-mean bias corrected PBIAS generally shows a systematic wet bias for these two regions, which can be observed in the Q-Q plots.
It is clear that the added value of bias correction on these two regions is considerably limited and even detrimental for PRECIS during DJF, which indicates that all bias correction methods fail to correct the spatial and temporal pattern of precipitation. In this case in particular, bias correction may introduce unnecessary variances compared to those already delivered by HadRM3P itself during the dynamical downscaling process of HadGEM2, which evidently discourages the use of BC methods and promotes the use of uncorrected PRECIS data instead. Consequently, the uncorrected PRECIS outcomes are preferred over their bias corrected counterparts over the South-Pacific and Caribbean climatic regions during DJF. Contrastingly, during DJF the GPCC climatology generally benefited from bias correction for all climatic regions except for the South-Pacific regions, an issue that has been previously identified and analyzed Mendez et al. [82]. In this case, EQM scores slightly higher in terms of RMSE, MAE and R but PTR yields equally satisfactory performances. In terms of PBIAS however, EQM and GQM score comparably well, with corrected PBIAS below 5 mm/month for all climatic regions except the Caribbean, which exhibits a corrected BIAS value in the order of 12 mm/month. Positive PBIAS values indicate over-estimation, whereas negative values indicate under-estimation. Overall, a significant value is added to the GPCC climatology after bias correction for all regions except the South-Pacific.
3.2.2. MAM
The transitional pattern from dry to wet conditions experienced during MAM, when sea breeze effects and monsoonal circulations are triggered within the intertropical convergence zone (ITCZ) promoting precipitation along the Atlantic and Pacific coasts, results in lower variations of performance and ranking among the various BC methods within each climatic region when compared to DJF. Similar to DJF, uncorrected ensemble-mean RMSE, MAE values are generally lower than individual uncorrected GCM-RCM pairs. After bias correction, the ensemble-mean performs as good as or even better than individual RCA4 models or PRECIS in terms of RMSE, MAE and PBIAS, with EQM and DT slightly outperforming the remaining BC methods. In some instances, the bias corrected ensemble-mean ranks moderately lower than its uncorrected counterpart but many individual GCM-RCM pairs perform better than the ensemble-mean as a whole. On the other hand, Q-Q plots prove the added value of bias correction over the ensemble-mean, as the distance between model and observation is reduced and the adjusted distributions better match the observations, especially for the North-Pacific, South-Pacific and North regions. RCA4 models perform as good as or even better than PRECIS before or after bias correction, implying than the higher spatial resolution of PRECIS is of little advantage during MAM. In terms of PBIAS, EQM usually yields lower values when compared to the remaining BC methods for most climatic regions; for the North and Caribbean regions however, DT scores better, passing from −47% to 1% and from 1% to 7% respectively.
Similar to DFJ, the application of most BC methods results in lower R values for the ensemble-mean but generally improved individual GCM-RCM pairs including PRECIS. Concerning GPCC, the Central-Valley and Caribbean regions do exhibit improvements in terms of RMSE, MAE and PBIAS after bias correction, mainly EQM and PTR. For the Central-Valley, GPCC PBIAS is reduced from 21% to 3% by EQM, in the Caribbean region, from 14% to −2% by PTR. Nevertheless, for all other regions bias correction resulted in an adverse effect over most metrics considered.
3.2.3. JJA
During JJA, all climatic regions in Costa Rica experience a precipitation peak, as northeast trade winds get stronger and sea surface temperature (SST) also increase through the ITCZ, promoting heavy convective activity and storm development. As a result, uncorrected and bias corrected RMSE and MAE values get remarkably higher than those shown by either the ensemble-mean or individual GCM-RCM pairs during DJF or MAM. Percentage reductions on these two metrics also increase notably, in particular for the Central-Pacific, Central-Valley and Caribbean regions, with values well above 50% in many cases. Significant reductions and less variability in terms of PBIAS are accomplished by most BC methods for all climatic regions, which indicate that BC methods are substantially more beneficial for GCM-RCM pairs during the rainy season than during the dry season.
For most of the country, EQM, PTR and GPQM yield comparable results, with EQM marginally outperforming the remaining methods. The fact that EQM moderately ranks higher than the remaining BC in so many instances, is most likely related to the fact that the nonparametric transformation technique implemented by this method adjusts the quantiles variabilities with those of the observed data; matching the quantiles of regional empirical cumulative distribution functions (CDFs) of GCM-RCM pairs with those of the local climatology. The superior performance of EQM could also be attributable to the adopted monthly approach used in the BC methods application, which takes different precipitation levels into account on individual basis. Various bias correction evaluation studies have also concluded that EQM is typically superior when compared to other BC methods [21,22,32,50,52,53,55,87,106,107,108]. Contrarily, the distribution-based parametric methods (GQM and GPQM) show slightly larger bias when compared to empirical distributions (EQM), as these methods are based on the assumption that both GCM-RCM and observed data approximate the corresponding theoretical distributions functions [29,35], which could not always be the case for the temporal and spatial precipitation distribution within most climatic regions, especially during the dry season.
Gudmundsson et al. [87] argues that non-parametric methods usually produce a better performance as compared to the parametric methods in the context of QM bias adjustment. For the Caribbean region however, DT is superior to the remaining methods in terms of RMSE and MAE. Once more, after bias correction, the ensemble-mean mean exhibits RMSE, MAE and PBIAS values as low as or lower than individual GCM-RCM pairs. Q-Q plots reveal large variations for the uncorrected ensemble-mean across all climatic regions, particularly for the Caribbean and South Pacific regions, which also exhibit the largest RMSE and MAE uncorrected or bias corrected values. Substantial improvements in terms of CDFs can be observed for all climatic regions after bias correction, nevertheless there are still some discrepancies in the spatial-temporal distribution of biases between uncorrected and bias corrected quantiles relative to the observations for the South-Pacific and North regions, since bias corrected model curves line far from the theoretical dashed line, indicating that GCM-RCM data have different distributions when compared to observed data.
Contrary to DJF and MAM, bias corrected ensemble-mean R values effectively increased for most BC methods the Pacific regions and Central-Valley but R values are substantially lower (below 30%) when compared to DFJ or JJA. For the North and Caribbean region however, bias corrected PBIAS values are generally higher than those of the remaining regions, with a noticeable dry-bias which ranges from −5% to −25%. Furthermore, R exhibits predominantly low (lower than 0.3) close to zero or even negative values, suggesting a reversal of the observed annual precipitation cycle regardless of BC method or GCM-RCM pairs.
One of the factors contributing to such a tendency is the locally intense convective activity of JJA precipitation across most of the Central-American Caribbean coast [27,109], which in this case most GCM-RCM models fail to capture and for instance, BC methods render less effective. In general terms, the diminished R and PBIAS performances for these two regions are most likely related to GCM-RCMs difficulties at representing predominantly convective precipitation during JJA; a situation that has largely been identified and investigated [21,58,70,80]. On the other hand, GCM-RCM pairs can also suffer from considerable systematic biases of the precipitation field in orographic terrain such as Costa Rica due to the windward and leeward effects imposed by the northwest-southeast trending cordilleras, producing overestimation on the windward side and underestimation on the lee side [57,59].
The full amount of these complex factors could also explain why DT, being simpler than the remaining BC methods, normally exhibits better performances than more complex methods such as EQM or GPQM for the North and Caribbean regions, which could also be limited to monthly temporal resolution data as suggested by Yang et al. [47], Shrestha et al. [110] and Hanel et al. [111]. Nevertheless, the diminished GCM-RCM model performances in terms of R and PBIAS does not necessarily indicate severe model biases but rather shows that GCM-RCM pairs cannot properly reproduce JJA monthly deviations within the annual precipitation distribution cycle. In relation to the GPCC dataset, only the Central-Valley region shows clear improvements in terms of RMSE, MAE and PBIAS when corrected by EQM, PTR or GPQM, all of which yield comparable results. For the remaining climatic regions however, GPCC does not benefit from bias correction irrespectively of the BC method applied, this indicates that bias correction is more effective for the GPCC during the dry season and little added value is gained during the rainy season.
3.2.4. SON
During SON uncorrected RMSE and MAE values for most RCA4 models are generally higher than those experienced during the first precipitation peak of JJA. As previously mentioned, SON represents the rainiest period for all climatic regions, evidencing that biases increase as precipitation also increases in the case of RCA4. For PRECIS however, uncorrected RMSE and MAE values during SON are not only lower than any RCA4 model but also lower compared to JJA their counterpart, suggesting that PRECIS is more effective in describing cyclonic-related precipitation than convective precipitation. After BC nonetheless, comparable performances between RCA4 pairs and PRECIS can be observed, with EQM and PTR slightly outperforming the remaining BC methods for most climatic regions except for the North and Caribbean regions, where once more DT seems to better describe the precipitation dynamics. Regardless of RCA4 or PRECIS, RMSE and MAE percentage reductions values accomplished by these BC methods (well above 50% in some cases) are usually higher than those obtained during JJA, indicating once again that the wetter the season the more effective bias correction is. Much like JJA, RCA4 models benefit more from bias correction than PRECIS. For most climatic regions, the bias corrected ensemble-mean exhibit RMSE and MAE values as low as or even lower than individual GCM-RCM pairs. Marginally higher RMSE and MAE values can be observed for PRECIS and the ensemble-mean after bias correction when compared to uncorrected values for all Pacific climatic regions. Nevertheless, such RMSE and MAE performances are still as good as individual bias corrected GCM-RCM pairs.
Contrary to JJA, bias corrected PBIAS values during SON exhibit a predominantly wet-shift (between 5% and 20%) for all climatic regions regardless of GCM-RCM pair or BC method, which could also be related to the primarily cyclonic nature of precipitation during SON. Still, such wet biases are clearly lower for EQM, PTR and DT. In terms of R, significant added value can be observed for North-Pacific, Central-Pacific, South-Pacific and Central-Valley regions, as increasingly positive values are obtained after bias correction irrespectively of GCM-RCMs pairs. Meanwhile, predominantly negative values still remain after the application of bias correction for the North and Caribbean regions. The ensemble-mean Q-Q plots show considerable added value as bias corrected quantile get much closer to observations than uncorrected values, especially for EQM, PTR and DT.
On the other hand, LS generally proved less effective in terms of RMSE, MAE, PBIAS and R when compared to the remaining BC methods during SON irrespectively of climatic region. Similar results were obtained by Teutschbein and Seibert [69] in their evaluation of several bias correction methods over five Swedish catchments using 15 different RCMs driven by ERA40, where LS resulted in slightly larger model error growth and deviations compared to more advanced correction methods such as QM, which makes LS the least reliable method under changed conditions. In contrast, Shrestha et al. [110] found no significant differences between the performances of LS and EQM bias corrected outputs for the Kaligandaki River Basin in Nepal. Such discrepancies however, are most likely related to substantial climatic differences between the Himalayas, Sweden and the Central-American tropics. It also must be noted that LS is essentially used to scale the GCM-RMCs model values with the multiplicative differences between the observed and model means during the validation period.
Under the present configuration, LS also uses unique scaling factors during specific months where no extreme precipitation is specifically considered, often leading to heavy precipitation being greatly underestimated [52,112]. Similar to JJA, GPCC clearly benefits from bias correction mainly for the Central-Valley region, with most BC rendering similar performances. For all other climatic regions however, GPCC gains little from bias correction and for the South-Pacific, the performance in fact decreases in terms of all metrics considered.
3.3. Future Projections
Based on the validation period (1981–1995) results, it can be stated that in the case of Costa Rica bias correction methods considerably decrease the uncertainty of monthly precipitation projections compared to uncorrected GCM-RCM outputs. It can also be stated that the ensemble-mean outperforms individual GCM-RCM pairs in most cases. Therefore, EQM and DT were selectively applied to correct the biases of precipitation projections from each GCM-RCM pair (Table 1) for three 30-year future periods namely, near-future (2011–2040), mid-future (2041–2070) and far-future (2071–2100) under IPCC Representative Concentration Pathways (RCPs) 2.6, 4.5 and 8.5 using the 30-year control period 1961–1990 (Table 2).
The abovementioned methods were selected on the basis of marginally higher performances, which should not discourage the use of the remaining BC methods such as GQM, GPQM and PTR. In the case of PRECIS however, DJF uncorrected values were used instead of bias corrected projections for the South-Pacific and Caribbean regions. After individual bias correction of future GCM-RCM pairs, the bias corrected ensemble-mean was selected to provide future projections of precipitation over Costa Rica. This approach has repeatedly been implemented in literature [5,57,64,93,113,114]. For future projections, the monthly averaged precipitation anomalies between the mean values of the observed control period (1961–1990) and the bias corrected multimodel ensemble-mean were calculated and expressed as percentage-change (PC). Results, expressed as spatially-averaged (Figure 11) and spatially-distributed (Figure 12) percentage-changes (PC) for each RCP scenario and future period contain mixed features, with both increasing and decreasing precipitation trends, with mostly well-defined common features for each climatic region and season. Similar to BC evaluation, future projections are analyzed seasonally.
3.3.1. DJF
During DJF, results from the bias-corrected future ensemble-mean anticipate a marked decreasing trend in precipitation with increasing radiative forcing and future period for most of the country under RCP4.5 and 8.5. Pronounced drier conditions are expected for those climatic regions draining towards the Pacific Ocean which also coincides with the driest season, exhibiting percentage-change (PC) values between −10% and −20% for the far-future period. Fairly comparable tendencies between RCP4.5 and 8.5 are appreciated for the North-Pacific, Central-Pacific and South-Pacific regions but a considerably higher decrease and more spatial variation is shown by RCP4.5 during the mid-future period for the Central-Valley region, reaching PC values as low as −25%. The magnitudes of changes in precipitation however, are less significant for those climatic regions draining towards the Caribbean Sea. For the North region, PC changes range between 5% and −5% regardless of radiative forcing or future period. For the Caribbean region, changes are more evident for RCP4.5 and 8.5 and far-future period, with spatially-averaged PC mean values in the order of −10% (+/− 5%). It must be noted that precipitation in these two climatic regions is year-round persistent and evidently humid during DJF when the rest of the country experiences the driest period (Figure 2). A similar decreasing trend in precipitation but of different magnitude can be observed under RCP2.6 when compared to RCP4.5 and 8.5 in all climatic regions as future period also increases. Nevertheless, for the near and mid-future periods changes in fact anticipate wetter conditions, with PC values as high as 10% at the beginning of the century and as low as −5% at the end of the century along the Pacific Coast regions. Once again, the decreases in precipitation are less significant for the North and Caribbean regions under RCP2.6.
3.3.2. MAM
During the transitional period from dry to wet conditions (MAM), decreasing precipitation patterns of higher magnitude can be observed for the North-Pacific, Central-Pacific and South-Pacific regions with increasing radiative forcing (RCP4.5 and 8.5) and future period, with spatially-averaged PC mean values ranging between −15% and −20% under RCP8.5 and far-future period. For the Central-Valley region, the projected decrease in precipitation is more extreme for RCP4.5 and mid-future period, reaching PC mean values of around −15%.
The North and Caribbean regions decreasing precipitation trends with increasing radiative forcing are less extreme when compared to those climatic regions draining towards the Pacific Ocean. RCP4.5 however, tends to anticipate slightly drier conditions than RCP8.5 for these two regions, with PC mean values between −5% and −10% for the far-future period. RCP8.5 on the other hand, anticipates slightly wetter conditions (PC mean values between 0% and 5%) for these two regions for the near and mid-future periods but dryer conditions at the end of the century. Furthermore, considerable spatial variations in precipitation changes are clear for the far-future period between drier mountainous areas and wetter coastal areas of the Caribbean region under RCP8.5, with PC mean values ranging from 5% to −10% respectively (Figure 12). As for RCP2.6, a slightly less significant decreasing trend is expected for those climatic regions draining towards the Pacific ocean as radiative forcing increases with future period, with PC mean values ranging between −3% and 3% in most cases.
On the other hand, mostly wetter conditions are expected for the North and Caribbean regions with increasing radiative force and future periods under RCP2.6, with PC values well above 10% at the end of the century. Historically, drier conditions in the Pacific coast during DJF and MAM are associated with a southernmost displacement of the ITCZ, a decrease in SSTs in the eastern Pacific and the Inter-American Seas (values lower than 28 °C) and an increase in trade winds strength, which results in substantially lower convective activity in most of the WHWP region [80].
Future climate change projections executed by Karmalkar et al. [25] using PRECIS under IPCC Scenario SRES-A2 (quasi-equivalent to RCP8.5) for a far-future period (2070–2100), also suggest large reductions in precipitation (around −15%) along the Pacific Coast of Costa Rica during the dry season (DJF and MAM), which the authors associate to a decrease in low mean sea level pressure (MSLP) in the Caribbean Sea and a more drastic southward shift of the Intertropical Convergence Zone (ITCZ) band, which ultimately alters trade winds magnitudes and directions. The authors also suggest that the general decrease in precipitation along the Pacific Coast of Central America and the subsequent wetter conditions along the Caribbean coast during the dry season is most likely a consequence of orographic uplift of modified north-easterly/easterly trade encountering the Cordilleras, resulting in orographic precipitation along the Caribbean slopes of the region.
Fuentes-Franco et al. [115] used RegCM4 forced by HadGEM-ES and MPI to investigate Inter-annual variability of precipitation over southern Mexico and Central America and its relationship to sea surface temperature for a far-future period (1970–2100) under RCP8.5. The authors found that future drier conditions during the dry season are most likely linked to a greater warming of the of the Tropical Northeastern Pacific (TNP) compared to the Tropical North Atlantic (TNA), which causes stronger wind fluxes from the TNA to the TNP through the Caribbean Low Level Jet and is identified as the main process responsible for these drier conditions.
3.3.3. JJA
At the beginning of the rainy season (JJA), when convective mechanisms dominates precipitation in most of the country, fairly comparable trends can be observed for RCP2.6 and 8.5 during the near and mid-future periods for the Central-Pacific, South-Pacific, Central-Valley and North climatic regions, with noticeably small changes with respect to the 1961–1990 baseline period (PC mean values between −3% and 3%) and RCP2.6 showing no significant deviation towards the end of the century. Nevertheless, these four regions experience an extreme decrease in precipitation at the end of the century with RCP8.5 (PC mean values around −20%), with higher spatial variation for the North region. RCP4.5 on the other hand, suggests drier conditions for these four climatic regions for the mid-future period (PC mean values around −10%) when compared to RCP2.6 and 8.5, which decreasing trend seems to be less extreme for the far-future period when compared to RCP8.5 (PC mean values slightly above −10%). This shows marked heterogeneity in the projected precipitation changes as per the emission scenarios and in different future periods during JJA, which could also be related to the fact that fewer GCM-RCM pairs were run under RCP4.5 (Table 1). The most extreme decrease in precipitation can be observed for the North-Pacific region as radiative forcing increases with future period, with PC mean values in the order of −35% for the far-future period and RCP8.5. Moreover, in this case RCP 4.5 and 8.5 changes in precipitation for near and mid-future periods are fairly comparable. Similar to the remaining Pacific regions, RCP2.6 remains relatively stable regardless of future period.
Remarkably complex trends among the various RCPs and future periods can be observed for the Caribbean region, as precipitation changes do not respond uniformly to radiative forcing and there is considerably less sensitivity to the various RCP scenarios. Despite the initial chaotic appearance of these patterns, RCP2.6 predicts mostly wetter conditions regardless of future period (PC mean values around 10%). RCP4.5 suggests mean drier conditions only for the mid-future period but also presents high spatial variations, with PC mean values as low as −15% and as high as 5%. For the near and far-future periods, RCP4.5 suggests mostly wetter conditions for the Caribbean region. RCP8.5 on the contrary, follows a very similar wet pattern when compared to RCP2.6 up to mid-future period, nevertheless for the far-future period, there are extreme spatial changes between mountainous regions and coastal areas, with PC mean values raging between −20% and 15%. Therefore, for the Caribbean region it is difficult to find any readily apparent long-term trend in the evolution of the various RCPs considered.
Generally, precipitation is projected to decrease during JJA with increasing radiative forcing and future period for most of the country except the Caribbean region, which dry or wet trend tend to significantly vary with future period and RCP scenarios.
3.3.4. SON
During SON, changes for all climatic regions except the Caribbean are fairly similar under RCP2.6, 4.5 and 8.5 regardless of future period, with slightly drier conditions for the near-future period (below −5%) characterized by a minor increase of precipitation mostly towards the end of the century (below 5% as PC mean values in most cases). In contrast, precipitation is expected to considerably increase for the coastal and mountainous areas of the Caribbean with radiative forcing and future period, with PC mean values well above 20% for RCP8.5 towards the end of the century. This trend is consistent with findings by Campbell et al. [19] in their analysis of 2071–2100 future climate change over the Caribbean region using PRECIS forced with HadAM3 under the A2 and B2 SRES scenarios, where the authors suggest an intensification of a gradient pattern in November–January in which the Costa Rica Caribbean region gets wetter (between 10% and 30%) and the Pacific shows a robust drying signal during June-October (between −25% and −30%).
Similarly Karmalkar et al. [25] suggest large reductions in precipitation (between −15% and −30%) along the Pacific Coast of Mexico and the Central American region during the rainy season, with a slight increase in precipitation in the Caribbean regions of Costa Rica and Panama also during the rainy season. They associate these changes to a southward shift of the Intertropical Convergence Zone (ITCZ) band, which is also related with an increase in the low mean sea level pressure (MSLP) in the Caribbean Sea and dominated by the North Atlantic subtropical high (NASH) pressure system variability. Rauscher et al. [116] suggest that the precipitation decrease in Central America is associated with an intensification and early onset of the Mid-Summer Drought (MSD) over the region driven by regional variations in SST over the surrounding equatorial ocean areas.
In their analysis of high spatial-resolution future climate change scenarios for Central America, comparable results over the Costa Rica territory were obtained by Imbach et al. [16], where projections from the HadGEM2-ES/ ETA-RCM under RCP4.5 and the mid-future period (2021–2050) suggest a general decrease in precipitation in all seasons but particularly during the rainy season (JJA and SON) for those climatic regions draining towards the Pacific Ocean. Additionally, they projected strengthening of the Mid-Summer Drought and rather wetter conditions for the Caribbean and North climatic regions. They also found a slight increase in precipitation across the Caribbean coast of Central America, especially Costa Rica and Nicaragua. Hidalgo et al. [14] found significant reductions in precipitation (between −5% and −10%) in Central America through their future climate change projections for the period 2050–2099 using a 30-member General Circulation Model (GCM) model-ensemble for the A1B emission scenario in a 0.5° × 0.5° grid over Central America. The authors also relate the projected dry pattern with a southward displacement of the Intertropical Convergence Zone (ITCZ), suggesting that the prevalence of severe drought may increase significantly in the future with higher emission scenarios.
4. Conclusions
In this study, monthly precipitation outputs from five General Circulation Models (GCMs) dynamically downscaled by two Regional Climate Models (RCMs) were evaluated over all climatic regions of Costa Rica for the period 1951–1995. Results show that the GCM-RCMs ability to reproduce the magnitude and shape of the observed bimodal annual precipitation cycle over Costa Rica largely depends on seasonality, climatic region, spatial resolution and model parameterization but pronounced spatial and temporal heterogeneities are evident between RCA4 models and PRECIS. The complex physiographical features of Costa Rica, which includes a complicated mountainous terrain in a relatively small geographical area highlights the need for a higher resolution GCM-RCM models such as PRECIS. In general, significant biases can be identified between uncorrected GCM-RCM outputs and observations, which highlight the need for the evaluation and application of BC methods over complex territories such as Costa Rica before forcing climatic data into specific climate change impact assessments. Consequently, six bias correction (BC) methods were applied to adjust the biases of historical monthly precipitation outputs from all GCM-RCM pairs using for the control period 1951–1980 and validated over the period 1981–1995. Results show that most BC methods considerably improve GCM-RCM model simulations even though the performance of the various methods clearly varies across spatial and temporal scales.
In many instances, EQM, DT and PTR performed marginally better than parametric quantile mapping (QM) techniques such as GQM and GPQM. LS however, proved less effective than the remaining methods irrespectively of season and climatic region, which clearly prevents its use over the Costa Rica territory. Bias corrections methods are noticeably more beneficial for GCM-RCMs during the rainy season than during the dry season and at the same time more beneficial for lower spatial-resolution models such as RCA4. In addition, both the uncorrected and bias-corrected multimodel ensemble-mean generally exhibit better performances when compared to individual GCM-RCM pairs, which suggests that multimodel ensembles using a range of RCMs driven by different GCMs provides an solid approach in the generation of climate change scenarios over Costa Rica. Since the application of BC methods considerably decreased the uncertainty of monthly precipitation projections over Costa Rica compared to uncorrected GCM-RCM outputs, EQM and DT were selectively applied to correct the biases of precipitation projections from each individual GCM-RCM pair for a near-future (2011–2040), mid-future (2041–2070) and far-future (2071–2100) period under Representative Concentration Pathways (RCPs) 2.6, 4.5 and 8.5 using the control period 1961–1990.
Overall, results from the bias-corrected future ensemble-mean anticipate a decreasing trend in precipitation from near to far-future periods during the dry season (DJF and MAM) for most of the country under RCP4.5 and 8.5, with pronounced drier conditions for those climatic regions draining towards the Pacific Ocean. In contrast, mostly wetter conditions are expected during the dry season under RCP2.6, particularly for the Caribbean and North regions. The greatest decrease in precipitation is projected at the beginning of the rainy season (JJA) for the far-future period under RCP8.5 for all climatic regions except the Caribbean, where mostly wetter conditions are anticipated under RCP8.5, 4.5 and 2.6 for the near and mid-future periods with large spatial variations under RCP8.5 between coastal and mountainous areas.
Regardless of future period, slight increases in precipitation with higher radiative forcing are expected during SON for most of the country excluding the Caribbean region, where precipitation is expected to substantially increase with increasing radiative forcing and future period. The results of this study, in terms of future precipitation changes are mostly in agreement with previous climate change studies over the Central America region, which most authors relate to an extreme southward shift of the Intertropical Convergence Zone (ITCZ) band and an increase in the low mean sea level pressure (MSLP) in the Caribbean Sea. This gives sufficient assurance that the future climate change precipitation scenarios produced by this study can be used in local climate change studies over the Costa Rica territory. Future variability of precipitation due to climate change will most likely impose water management challenges in Costa Rica under global warming in terms of both magnitude and spatial distribution. For instance, uncertainty associated with such projections should permeate across institutional and political structures in such a way that potential implications can be included on national climate change mitigation and adaptation plans. In the future, the authors will focus on the dynamical downscaling of a larger set of GCMs using locally-parameterized higher-resolution RCMs that better represent key aspect of the Central America climate such as the Mid-Summer Drought (MSD), the Caribbean Low Level Jet (CLLJ), northern cold surges and tropical cyclones as to provide more robust statements and higher confidence associated with future climate change precipitation projections over Costa Rica.
Supplementary Materials
The following are available online at https://www.mdpi.com/2073-4441/12/2/482/s1, uncorrected GCM-RCM, observed precipitation and GPCC data for the period 1951–1995, the complete R computational code, the ggplot2-graphical code and all GeoTIFF generated maps can be access at the following Github repository: https://github.com/maikelonu/Research_Future_Precipitation_Ensemble_GCM_RCM_RCP. All R scripts have been clearly commented so any one can reproduce the Results presented in this manuscript.
Author Contributions
M.M. designed the project and drafted the manuscript. M.M. coded the entire R code. B.M., D.H.-G. and L.-F.A.-G. provided writing ideas and supervised the study. M.M., B.M. and D.H.-G. edited and finalized the manuscript. M.M. and L.-F.A.-G. collected and curated observed and simulated data. All authors reviewed the manuscript. All authors have read and agreed to the published version of the manuscript.
Acknowledgments
This research was supported by Vicerrectoría de Investigación & Extensión, Instituto Tecnológico de Costa Rica (TEC) specifically for the research project entitled “Evaluación del impacto del Cambio Climático futuro sobre cuencas hidrológicas destinadas al abastecimiento de agua potable en Costa Rica”.
Conflicts of Interest
The authors declare no conflict of interest in any aspect of the data collection, analysis or the preparation of this paper.
References
- Hagemann, S.; Göttel, H.; Jacob, D.; Lorenz, P.; Roeckner, E. Improved regional scale processes reflected in projected hydrological changes over large European catchments. Clim. Dyn. 2009, 32, 767–781. [Google Scholar] [CrossRef] [Green Version]
- Yang, X.; Wood, E.F.; Sheffield, J.; Ren, L.; Zhang, M.; Wang, Y. Bias Correction of Historical and Future Simulations of Precipitation and Temperature for China from CMIP5 Models. J. Hydrometeorol. 2018, 19, 609–623. [Google Scholar] [CrossRef]
- Dore, M.H. Climate change and changes in global precipitation patterns: What do we know? Environ. Int. 2005, 31, 1167–1181. [Google Scholar] [CrossRef]
- Im, E.S.; Ahn, J.B.; Jo, S.R. Regional climate projection over South Korea simulated by the HadGEM2-AO and WRF model chain under RCP emission scenarios. Clim. Res. 2015, 63, 249–266. [Google Scholar] [CrossRef] [Green Version]
- Diallo, I.; Sylla, M.B.; Giorgi, F.; Gaye, A.T.; Camara, M. Multimodel GCM-RCM Ensemble-Based Projections of Temperature and Precipitation over West Africa for the Early 21st Century. Int. J. Geophys. 2012, 19. [Google Scholar] [CrossRef] [Green Version]
- M’Po, Y.N.; Lawin, A.E.; Oyerinde, G.T.; Yao, B.K.; Afouda, A.A. Comparison of Daily Precipitation Bias Correction Methods Based on Four Regional Climate Model Outputs in Ouémé Basin, Benin. Hydrology 2016, 4, 58–71. [Google Scholar] [CrossRef] [Green Version]
- IPCC. Climate Change 2014: Synthesis Report. Contribution of Working Groups I, II and III to the Fifth Assessment Report of the Intergovernmental Panel on Climate Change; IPCC: Geneva, Switzerland, 2014; p. 151. ISBN 978-92-9169-143-2. [Google Scholar]
- Giorgi, F. Climate change hot-spots. Geophys. Res. Lett. 2006, 33, L08707. [Google Scholar] [CrossRef]
- Nakaegawa, T.; Kitoh, A.; Murakami, H.; Kusunoki, S. Annual maximum 5-day rainfall total and maximum number of consecutive dry days over Central America and the Caribbean in the late twenty-first century projected by an atmospheric general circulation model with three different horizontal resolutions. Theor. Appl. Climatol. 2014, 116, 155–168. [Google Scholar] [CrossRef]
- Stahle, D.W.; Diaz, J.V.; Burnette, D.J.; Paredes, J.; Heim, R.R.; Fye, F.K.; Acuna-Soto, R.; Therrell, M.D.; Cleaveland, M.K.; Stahl, D.K. Major Mesoamerican droughts of the past millennium. Geophys. Res. Lett. 2011, 38. [Google Scholar] [CrossRef]
- Amador, J.A.; Alfaro, E.J.; Rivera, E.R.; Calderon, B. Climatic features and their relationship with tropical cyclones over the Intra-Americas seas. In Hurricanes and Climate Change; Springer: Dordrecht, The Netherlands, 2010; pp. 149–173. [Google Scholar] [CrossRef]
- Aguilar, E.; Peterson, T.C.; Obando, P.R.R.; Frutos, R.; Retana, J.A.; Solera, M. Changes in precipitation and temperature extremes in Central America and northern South America, 1961–2003. J. Geophys. Res. 2005, 110, 1–15. [Google Scholar] [CrossRef]
- Cabos, W.; Sein, D.V.; Durán-Quesada, A.; Liguori, G.; Koldunov, N.V.; Martínez-López, B.; Alvarez, F.; Sieck, K.; Limareva, N.; Pinto, J.G. Dynamical downscaling of historical climate over CORDEX Central America domain with a regionally coupled atmosphere–ocean model. Clim. Dyn. 2019, 52, 4305. [Google Scholar] [CrossRef] [Green Version]
- Hidalgo, H.G.; Amador, J.A.; Alfaro, E.J.; Quesada, B. Hydrological Climate Change Projections for Central America. J. Hydrol. 2013, 495, 94–112. [Google Scholar] [CrossRef]
- IPCC. Climate Change 2007: The Physical Science Basis. Contribution of Working Group I to the Fourth Assessment Report of the Intergovernmental Panel on Climate Change; Cambridge University Press: Cambridge, UK; New York, NY, USA, 2007. [Google Scholar]
- Imbach, P.; Chou, S.C.; Lyra, A.; Rodrigues, D.; Rodriguez, D.; Latinovic, D.; Siqueira, G.; Silva, A.; Garofolo, L.; Georgiou, S. Future climate change scenarios in Central America at high spatial resolution. PLoS ONE 2018, 13, e0193570. [Google Scholar] [CrossRef] [PubMed] [Green Version]
- Taylor, K.E.; Stouffer, R.J.; Meehl, G.A. An Overview of CMIP5 and the experiment design. Bull. Am. Meteorol. Soc. 2012, 93, 485–498. [Google Scholar] [CrossRef] [Green Version]
- Miao, C.; Su, L.; Sun, Q.; Duan, Q. A nonstationary bias-correction technique to remove bias in GCM simulations. J. Geophys. Res. Atmos. 2016, 121, 5718–5735. [Google Scholar] [CrossRef]
- Campbell, J.D.; Taylor, M.A.; Stephenson, T.S.; Watson RAWhyte, F.S. Future climate of the Caribbean from a regional climate model. Int. J. Climatol. 2011, 31, 1866–1878. [Google Scholar] [CrossRef]
- Teixeira, J.; Taylor, M.; Persson, A.; Matheou, G. Atmospheric General Circulation Models. In Encyclopedia of Remote Sensing. Encyclopedia of Earth Sciences Series; Njoku, E.G., Ed.; Springer: New York, NY, USA, 2014. [Google Scholar]
- Chen, J.; Brissette, F.P.; Chaumont, D.; Braun, M. Finding appropriate bias correction methods in downscaling precipitation for hydrologic impact studies over North America. Water Resour. Res. 2013, 49, 4187–4205. [Google Scholar] [CrossRef]
- Ghimire, U.; Srinivasan, G.; Agarwal, A. Assessment of rainfall bias correction techniques for improved hydrological simulation. Int. J. Climatol. 2019, 39, 2386–2399. [Google Scholar] [CrossRef]
- Seager, R.; Vecchi, G. Greenhouse warming and the 21st century hydroclimate of southwestern North America. Proc. Natl. Acad. Sci. USA 2010, 107, 21277–21282. [Google Scholar] [CrossRef] [Green Version]
- Mehran, A.; AghaKouchak, A.; Phillips, T.J. Evaluation of CMIP5 continental precipitation simulations relative to satellite-based gauge-adjusted observations. J. Geophys. Res. Atmos. 2014, 119, 1695–1707. [Google Scholar] [CrossRef] [Green Version]
- Karmalkar, A.V.; Bradley, R.S.; Diaz, H.F. Climate change in Central America and Mexico: Regional climate model validation and climate change projections. Clim. Dyn. 2011, 37, 605–629. [Google Scholar] [CrossRef] [Green Version]
- Karmalkar, A.V.; Taylor, M.A.; Campbell, J.; Stephenson, T.; New, M.; Centella, A.; Charlery, J. A review of observed and projected changes in climate for the islands in the Caribbean. Atmósfera 2013, 26, 283–309. [Google Scholar] [CrossRef] [Green Version]
- Gamble, D.W.; Curtis, S. Caribbean precipitation: Review, model and prospect. Prog. Phys. Geogr. 2008, 32. [Google Scholar] [CrossRef]
- Rauscher, S.A.; Giorgi, F.; Diffenbaugh, N.S.; Seth, A. Extension and intensification of the Meso-American mid-summer drought in the twenty-first century. Clim. Dyn. 2008, 31, 551–571. [Google Scholar] [CrossRef]
- Fang, G.H.; Yang, J.; Chen, Y.N.; Zammit, C. Comparing bias correction methods in downscaling meteorological variables for a hydrologic impact study in an arid area in China. Hydrol. Earth Syst. Sci. 2015, 19, 2547–2559. [Google Scholar] [CrossRef] [Green Version]
- Leander, R.; Buishand, T.A. Resampling of regional climate model output for the simulation of extreme river flows. J. Hydrol. 2007, 332, 487–496. [Google Scholar] [CrossRef]
- Turco, M.; Llasat, M.C.; Herrera, S.; Gutiérrez, J.M. Bias correction and downscaling of future RCM precipitation projections using a MOS-Analog technique. J. Geophys. Res. Atmos. 2017, 122. [Google Scholar] [CrossRef] [Green Version]
- Teutschbein, C.; Seibert, J. Bias correction of regional climate model simulations for hydrological climate-change impact studies: Review and evaluation of different methods. J. Hydrol. 2012, 456, 12–29. [Google Scholar] [CrossRef]
- Di Luca, A.; de Elía, R.; Laprise, R. Potential for added value in precipitation simulated by high-resolution nested Regional Climate Models and observations. Clim. Dyn. 2012, 38, 1229–1247. [Google Scholar] [CrossRef] [Green Version]
- Ngai, S.T.; Tangang, F.; Juneng, L. Bias correction of global and regional simulated daily precipitation and surface mean temperature over Southeast Asia using quantile mapping method. Glob. Planet. Chang. 2017, 149, 79–90. [Google Scholar] [CrossRef] [Green Version]
- Chen, J.; Brissette, F.P.; Chaumont, D.; Braun, M. Performance and uncertainty evaluation of empirical downscaling methods in quantifying the climate change impacts on hydrology over two North American river basins. J. Hydrol. 2013, 479, 200–214. [Google Scholar] [CrossRef]
- Pardo-Igúzquiza, E.; Collados-Lara, A.J.; Pulido-Velazquez, D. Potential future impact of climate change on recharge in the Sierra de las Nieves (southern Spain) high-relief karst aquifer using regional climate models and statistical corrections. Environ. Earth Sci. 2019, 78, 598. [Google Scholar] [CrossRef]
- El Asri, H.; Larabi AFaouzi, M. Climate change projections in the Ghis-Nekkor region of Morocco and potential impact on groundwater recharge. Theor. Appl. Climatol. 2019, 138, 713–727. [Google Scholar] [CrossRef]
- Lafon, T.; Dadson, S.; Buys, G.; Prudhomme, C. Bias correction of daily precipitation simulated by a regional climate model: A comparison of methods. Int. J. Climatol. 2013, 33, 1367–1381. [Google Scholar] [CrossRef] [Green Version]
- Barkhordarian, A.; von Storch, H.; Zorita, E.; Gómez-Navarro, J.J. An attempt to deconstruct recent climate change in the Baltic Sea basin. J. Geophys. Res. Atmos. 2016, 121. [Google Scholar] [CrossRef] [Green Version]
- Diro, G.T.; Rauscher, S.A.; Giorgi, F.; Tompkins, A.M. Sensitivity of seasonal climate and diurnal precipitation over Central America to land and sea surface schemes in RegCM4. Clim. Res. 2012, 52, 31–38. [Google Scholar] [CrossRef] [Green Version]
- Cook, L.M.; Anderson, C.J.; Samaras, C. Framework for Incorporating Downscaled Climate Output into Existing Engineering Methods: Application to Precipitation Frequency Curves. J. Infrastruct. Syst. 2017, 23, 4. [Google Scholar] [CrossRef] [Green Version]
- Jones, R.G.; Nouger, M.; Hassell, D.C.; Hassell, D.; Wilson, S.S.; Jenkins, G.J.; Mitchell, J.F.B. Generating High Resolution Climate Change Scenarios Using PRECIS; Met Office Hadley Centre: Exeter, UK, 2004; p. 40. [Google Scholar]
- Mair, L.; Jönsson, M.; Räty, M.; Bärring, L.; Strandberg, G.; Lämås, T. Snäll. Land use changes could modify future negative effects of climate change on old-growth forest indicator species. Divers. Distrib. 2018, 24, 1416–1425. [Google Scholar] [CrossRef] [Green Version]
- Wang, J.; Wang, Y.; Feng, J.; Chen, C.; Chen, J.; Long, T.; Li, J.; Zang, R.; Li, J. Differential Responses to Climate and Land-Use Changes in Threatened Chinese Taxus Species. Forests 2019, 10, 766. [Google Scholar] [CrossRef] [Green Version]
- Diro, G.T.; Giorgi, F.; Fuentes-Franco, R.; Walsh, K.J.E.; Giuliani, G.; Coppola, E. Tropical cyclones in a regional climate change projection with RegCM4 over the CORDEX Central America domain. Clim. Chang. 2014, 125, 79. [Google Scholar] [CrossRef]
- Massey, N.; Jones, R.; Otto, F.E.L.; Aina, T.; Wilson, S.; Murphy, J.M.; Hassell, D.; Yamazaki, Y.H.; Allen, M.R. weather@home—Development and validation of a very large ensemble modelling system for probabilistic event attribution. Q. J. R. Meteorol. Soc. 2015, 141, 1528–1545. [Google Scholar] [CrossRef]
- Yang, W.; Andréasson, J.; Graham, L.P.; Olsson, J.; Rosberg, J.; Wetterhall, F. Distribution-based scaling to improve usability of regional climate model projections for hydrological climate change impacts studies. Hydrol. Res. 2010, 41, 211–229. [Google Scholar] [CrossRef]
- Thoeun, H.C. Observed and projected changes in temperature and rainfall in Cambodia. Weather Clim. Extremes 2015, 7, 61–71. [Google Scholar] [CrossRef] [Green Version]
- Buytaert, W.; Vuille, M.; Dewulf, A.; Urrutia, R.; Karmalkar, A.; Célleri, R. Uncertainties in climate change projections and regional downscaling in the tropical Andes: Implications for water resources management. Hydrol. Earth Syst. Sci. 2010, 14, 1247–1258. [Google Scholar] [CrossRef] [Green Version]
- Piani, C.; Haerter, J.O.; Coppala, E. Statistical bias correction for daily precipitation in regional climate models over Europe. Theor. Appl. Climatol. 2010, 99, 187–192. [Google Scholar] [CrossRef] [Green Version]
- Switanek, M.B.; Troch, P.A.; Castro, C.L.; Leuprecht, A.; Chang, H.I.; Mukherjee, R.; Demaria, E.M.C. Scaled distribution mapping: A bias correction method that preserves raw climate model projected changes. Hydrol. Earth Syst. Sci. 2017, 21, 2649–2666. [Google Scholar] [CrossRef] [Green Version]
- Luo, M.; Liu, T.; Meng, F.; Duan, Y.; Frankl, A.; Bao, A.; De Maeyer, P. Comparing Bias Correction Methods Used in Downscaling Precipitation and Temperature from Regional Climate Models: A Case Study from the Kaidu River Basin in Western China. Water 2018, 10, 1046. [Google Scholar] [CrossRef] [Green Version]
- Wilcke, R.; Mendlik, T.; Gobiet, A. Multi-variable error correction of regional climate Models. Clim. Chang. 2013, 120, 871–887. [Google Scholar] [CrossRef] [Green Version]
- Fowler, H.J.; Ekstrom, M. Multi-model ensemble estimates of climate change impacts on UK seasonal precipitation extremes. Int. J. Climatol. 2009, 29, 385–416. [Google Scholar] [CrossRef]
- Themeßl, M.J.; Gobiet, A.; Heinrich, G. Empirical-statistical downscaling and error correction of regional climate models and its impact on the climate change signal. Clim. Chang. 2012, 112, 449–468. [Google Scholar] [CrossRef]
- Fowler, H.J.; Blenkinsop, S.; Tebaldi, C. Linking climate change modelling to impacts studies: Recent advances in downscaling techniques for hydrological modelling. Int. J. Climatol. 2007, 27, 1547–1578. [Google Scholar] [CrossRef]
- Kotlarski, S.; Keuler, K.; Christensen, O.B.; Colette, A.; Déqué, M.; Gobiet, A.; Goergen, K.; Jacob, D.; Lüthi, D.; van Meijgaard, E.; et al. Regional climate modeling on European scales: A joint standard evaluation of the EURO CORDEX RCM ensemble. Geosci. Model Dev. 2014, 7, 1297–1333. [Google Scholar] [CrossRef] [Green Version]
- Maraun, D.; Wetterhall, F.; Ireson, A.M.; Chandler, R.E.; Kendon, E.J.; Widmann, M.; Brienen, S.; Rust, H.W.; Sauter, T.; Themeßl, M.; et al. Precipitation downscaling under climate change: Recent developments to bridge the gap between dynamical models and the end user. Rev. Geophys. 2010, 48. [Google Scholar] [CrossRef]
- Lenderink, G.; Buishand, A.; van Deursen, W. Estimates of future discharges of the river Rhine using two scenario methodologies: Direct versus delta approach. Hydrol. Earth Syst. Sci. 2007, 11, 1145–1159. [Google Scholar] [CrossRef]
- Johnson, F.; Sharma, A. A nesting model for bias correction of variability at multiple time scales in general circulation model precipitation simulations. Water. Resour. Res. 2012, 48. [Google Scholar] [CrossRef] [Green Version]
- Shrestha, S.; Htut, A.Y. Modelling the potential impacts of climate change on hydrology of the Bago River Basin, Myanmar. Int. J. River Basin Manag. 2016, 14, 287–297. [Google Scholar] [CrossRef]
- Hawkins, E.; Sutton, R. The potential to narrow uncertainty in projections of regional precipitation change. Clim. Dyn. 2011, 37, 407–418. [Google Scholar] [CrossRef]
- Volosciuk, C.; Maraun, D.; Vrac, M.; Widmann, M. A combined statistical bias correction and stochastic downscaling method for precipitation. Hydrol. Earth Syst. Sci. 2017, 21, 1693–1719. [Google Scholar] [CrossRef] [Green Version]
- Ines, A.V.M.; Hansen, J.W. Bias correction of daily GCM rainfall for crop simulation studies. Agric. Forest Meteorol. 2006, 138, 44–53. [Google Scholar] [CrossRef] [Green Version]
- Teng, J.; Potter, N.J.; Chiew, F.H.S.; Zhang, L.; Wang, B.; Vaze, J.; Evans, J.P. How does bias correction of regional climate model precipitation affect modelled runoff? Hydrol. Earth Syst. Sci. 2015, 19, 711–728. [Google Scholar] [CrossRef] [Green Version]
- Reiter, P.; Gutjahr, O.; Schefczyk, L.; Heinemann, G.; Casper, M. Bias correction of 332 ENSEMBLES precipitation data with focus on the effect of the length of the calibration period. Meteorol. Z. 2016, 25, 85–96. [Google Scholar] [CrossRef]
- Halmstad, A.; Najafi, M.R.; Moradkhani, H. Analysis of precipitation extremes with the assessment of regional climate models over the Willamette River Basin, USA. Hydrol. Process. 2013, 27, 2579–2590. [Google Scholar] [CrossRef]
- Graham, L.P.; Andréasson, J.; Carlsson, B. Assessing climate change impacts on hydrology from an ensemble of regional climate models, model scales and linking methods- A case study on the Lule River basin. Clim. Chang. 2007, 81, 293–307. [Google Scholar] [CrossRef]
- Teutschbein, C.; Seibert, J. Is bias correction of Regional Climate Model (RCM) simulations possible for non-stationary conditions? Hydrol. Earth Syst. Sci. 2013, 17, 5061–5077. [Google Scholar] [CrossRef] [Green Version]
- Luo, M.; Liu, T.; Meng, F.; Duan, Y.; Bao, A.; Xing, W. Identifying climate change impacts on water resources in Xinjiang, China. Sci. Total Environ. 2019, 676, 613–626. [Google Scholar] [CrossRef]
- Vargas, A.B.; Trejos, V.F.S. Changes in the general circulation and its influences on precipitation trends in Central America: Costa Rica. Ambio 1994, 23, 87–90. [Google Scholar]
- Amador, J.A. The Intra-Americas Sea low-level jet: Overview and future research. Ann. N. Y. Acad. Sci. 2008, 1146, 153–188. [Google Scholar] [CrossRef] [Green Version]
- Rapp, A.D.; Peterson, A.G.; Frauenfeld, O.W.; Quiring, S.M.; Roark, E.B. Climatology of Storm Characteristics in Costa Rica using the TRMM Precipitation Radar. J. Hydrometeorol. 2014, 15, 2615–2633. [Google Scholar] [CrossRef]
- Wang, C.; Enfield, D.B. The tropical Western Hemisphere warm pool. Geophys. Res. Lett. 2001, 28, 1635–1638. [Google Scholar] [CrossRef]
- Wang, C.; Fiedler, P.C. ENSO variability and the eastern tropical Pacific: A review. Prog. Oceanogr. 2006, 69, 239–266. [Google Scholar] [CrossRef]
- Waylen, P.R.; Quesada, M.E.; Caviedes, C.N. Temporal and spatial variability of annual precipitation in Costa Rica and the southern oscillation. Int. J. Climatol. 1996, 16, 173–193. [Google Scholar] [CrossRef]
- Waylen, P.R.; Harrison, M. The coincidence of daily rainfall events in Liberia, Costa Rica and tropical cyclones in the Caribbean basin. Int. J. Climatol. 2005, 25, 1665–1674. [Google Scholar] [CrossRef]
- Grandoso, H.; de Montero, V.; Castro, V. Caracteristicas de la atmósfera libre sobre Costa Rica y sus relaciones con la precipitación; Tech. Rep.; Instituto Geográfico Nacional, Ministerio de Obras Públicas y Transportes: San José, Costa Rica, 1981. [Google Scholar]
- Fernandez, W.; Barrantes, J.A. The Central American temporal: A long-lived tropical rain-producing system. Top. Meteor. Oceanogr. 1996, 3, 73–88. [Google Scholar]
- Wang, C.; Lee, S.K. Atlantic warm pool, Caribbean low-level jet, and their potential impact on Atlantic hurricanes. Geophys. Res. Lett. 2007, 34, L02703. [Google Scholar] [CrossRef] [Green Version]
- Magaña, V.; Amador, J.A.; Medina, S. The midsummer drought over Mexico and Central America. J. Clim. 1999, 12, 1577–1588. [Google Scholar] [CrossRef]
- Mendez, M.; Calvo-Valverde, L.A.; Maathuis, B.; Alvarado-Gamboa, L.F. Generation of Monthly Precipitation Climatologies for Costa Rica Using Irregular Rain-Gauge Observational Networks. Water 2019, 11, 70. [Google Scholar] [CrossRef] [Green Version]
- Mendez, M.; Calvo-Valverde, L.A. Assessing the Performance of Several Rainfall Interpolation Methods as Evaluated by a Conceptual Hydrological Model. Procedia Eng. 2016, 154, 1050–1057. [Google Scholar] [CrossRef]
- Schneider, U.; Becker, A.; Finger, P.; Meyer-Christoffer, A.; Ziese, M. GPCC Full Data Monthly Product Version 2018 at 0.25°: Monthly Land-Surface Precipitation from Rain-Gauges built on GTS-based and Historical Data; GPCC: Offenbach, Germany, 2018. [Google Scholar] [CrossRef]
- Jones, C.G.; Willén, U.; Ullerstig, A.; Hansson, U. The Rossby Centre Regional Atmospheric Climate Model part I: Model climatology and performance for the present climate over Europe. Ambio 2004, 33, 199–210. [Google Scholar] [CrossRef]
- R Core Team. R: A Language and Environment for Statistical Computing; R Foundation for Statistical Computing: Vienna, Austria, 2019; Available online: https://www.R-project.org (accessed on 11 February 2020).
- Gudmundsson, L.; Bremnes, J.; Haugen, J.; Engen-Skaugen, T. Technical Note: Downscaling RCM precipitation to the station scale using statistical transformations—A comparison of methods. Hydrol. Earth Syst. Sci. 2012, 16, 3383–3390. [Google Scholar] [CrossRef] [Green Version]
- Shabalova, M.V.; van Deursen, W.P.; Buishand, T.A. Assessing future discharge of the river Rhine using regional climate model integrations and a hydrological model. Clim. Res. 2003, 23, 233–246. [Google Scholar] [CrossRef] [Green Version]
- Middelkoop, H.; Daamen, K.; Gellens, D.; Grabs, W.; Kwadijk, J.C.; Lang, H.; Parmet, B.W.; Schädler, B.; Schulla, J.; Wilke, K. Impact of climate change on hydrological regimes and water resources management in the Rhine basin. Clim. Chang. 2001, 49, 105–128. [Google Scholar] [CrossRef]
- Räty, O.; Räisänen, J.; Ylhäisi, S. Evaluation of delta change and bias correction methods for future daily precipitation: Intermodel cross-validation using ENSEMBLES simulations. Clim. Dyn. 2014, 42, 2287–2303. [Google Scholar] [CrossRef]
- Leander, R.; Buishand, T.; Vandenhurk, B.; Dewit, M. Estimated changes in flood quantiles of the river Meuse from resampling of regional climate model output. J. Hydrol. 2008, 351, 331–343. [Google Scholar] [CrossRef]
- Brent, R.P. An algorithm with guaranteed convergence for finding a zero of a function. Comput. J. 1971, 14, 422–425. [Google Scholar] [CrossRef]
- Block, P.J.; Souza-Filho, F.A.; Sun, L.; Kwon, H.H. A Stream-flow Forecasting Framework using Multiple Climate and Hydrological Models. JAWRA J. Am. Water Resour. Assoc. 2009, 45, 828–843. [Google Scholar] [CrossRef]
- Déqué, M.; Rowell, D.P.; Lüthi, D.; Giorgi, F.; Christensen, J.H.; Rockel, B.; Jacob, D.; Kjellström, E.; de Castro, M.; van den Hurk, B. An intercomparison of regional climate simulations for Europe: Assessing uncertainties in model projections. Clim. Chang. 2007, 81, 53–70. [Google Scholar] [CrossRef]
- Li, H.; Sheffield, J.; Wood, E.F. Bias correction of monthly precipitation and temperature fields from Intergovernmental Panel on Climate Change AR4 models using equidistant quantile matching. J. Geophys. Res. 2010, 115, D10101. [Google Scholar] [CrossRef]
- Watterson, I.G. Simulated changes due to global warming in daily precipitation means and extremes and their interpretation using the gamma distribution. J. Geophys. Res. 2003, 108, 4379. [Google Scholar] [CrossRef]
- Kim, D.I.; Kwon, H.H.; Han, D. Bias correction of daily precipitation over South Korea from the long-term reanalysis using a composite Gamma-Pareto distribution approach. Hydrol. Res. 2019, 50, 1138–1161. [Google Scholar] [CrossRef]
- Willmott, C.; Matsuura, K. Advantages of the mean absolute error (MAE) over the root mean square error (RMSE) in assessing average model performance. Clim. Res. 2005, 30, 79–82. [Google Scholar] [CrossRef]
- Chai, T.; Draxler, R.R. Root mean square error (RMSE) or mean absolute error (MAE)?—Arguments against avoiding RMSE in the literature. Geosci. Model Dev. 2014, 7, 1247–1250. [Google Scholar] [CrossRef] [Green Version]
- Mendez, M.; Calvo-Valverde, L.A. Comparison of global and local optimization methods for the calibration and sensitivity analysis of a conceptual hydrological model. Tecnol. Marcha 2019, 32, 24–36. [Google Scholar] [CrossRef]
- Tegegne, G.; Park, D.K.; Kim, Y.O. Comparison of hydrological models for the assessment of water resources in a data-scarce region, the Upper Blue Nile River Basin. J. Hydrol. 2017, 14, 49–66. [Google Scholar] [CrossRef]
- Reiter, P.; Gutjahr, O.; Schefczyk, L.; Heinemann GCasper, M. Does applying quantile mapping to subsamples improve the bias correction of daily precipitation? Int. J. Climatol. 2018, 38, 1623–1633. [Google Scholar] [CrossRef]
- WMO. Guidelines on the Calculation of Climate Normals; WMO Publisher No. 1203: Geneva, Switzerland, 2017; ISBN 978-92-63-11203-3. [Google Scholar]
- Fuentes-Franco, R.; Giorgi, F.; Coppola, E.; Kucharski, F. The role of ENSO and PDO in variability of winter precipitation over North America from twenty first century CMIP5 projections. Clim. Dyn. 2016, 46, 3259–3277. [Google Scholar] [CrossRef]
- Olsson, J.; Arheimer, B.; Borris, M.; Donnelly, C.; Foster, K.; Nikulin, G.; Persson, M.; Perttu, A.M.; Uvo, C.B.; Viklander, M.; et al. Hydrological Climate Change Impact Assessment at Small and Large Scales: Key Messages from Recent Progress in Sweden. Climate 2016, 4, 39. [Google Scholar] [CrossRef]
- Ajaaj, A.; Mishra, A.K.; Khan, A.A. Comparison of BIAS correction techniques for GPCC rainfall data in semi-arid climate. Stoch. Environ. Res. Risk Assess. 2015, 30, 1659–1675. [Google Scholar] [CrossRef]
- Heo, J.-H.; Ahn, H.; Shin, J.-Y.; Kjeldsen, T.R.; Jeong, C. Probability Distributions for a Quantile Mapping Technique for a Bias Correction of Precipitation Data: A Case Study to Precipitation Data Under Climate Change. Water 2019, 11, 1475. [Google Scholar] [CrossRef] [Green Version]
- Sun, F.; Roderick, M.L.; Lim, W.H.; Farquhar, G.D. Hydroclimatic projections for the Murray-Darling Basin based onan ensemble derived from Intergovernmental Panel on ClimateChange AR4 climate models. Water. Resour. Res. 2011, 47, W00G02. [Google Scholar] [CrossRef]
- Magaña, V.; Caetano, E. Temporal evolution of summer convective activity over the Americas warm pools. Geophys. Res. Lett. 2005, 32, L02803. [Google Scholar] [CrossRef]
- Shrestha, M.; Acharya, S.C.; Shrestha, P.K. Bias correction of climate models for hydrological modeling. Are simple methods still useful? Meteorol. Appl. 2017, 24, 531–539. [Google Scholar] [CrossRef] [Green Version]
- Hanel, M.; Mrkvicková, M.; Máca, P.; Vizina, A.; Pech, P. Evaluation of simple statistical downscaling methods for monthly regional climate model simulations with respect to the estimated changes in runoff in the Czech Republic. Water Resour. Manag. 2013, 27, 5261–5279. [Google Scholar] [CrossRef]
- Haerter, J.; Hagemann, S.; Moseley, C.; Piani, C. Climate model bias correction and the role of timescales. Hydrol. Earth Syst. Sci. 2011, 15, 1065–1079. [Google Scholar] [CrossRef] [Green Version]
- Trinh-Tuan, L.; Matsumoto, J.; Tangang, F.T. Application of Quantile Mapping Bias Correction for Mid-Future Precipitation Projections over Vietnam. SOLA 2019, 15, 1–6. [Google Scholar] [CrossRef] [Green Version]
- Gallardo, C.; Gil, V.; Hagel, E.; Tejeda, C.; Castro, M. Assessment of climate change in Europe from an ensemble of regional climate models by the use Köppen-Trewartha classification. Int. J. Climatol. 2013, 33, 2157–2166. [Google Scholar] [CrossRef]
- Fuentes-Franco, R.; Coppola, E.; Giorgi, F.; Graef, F.; Pavia, E.G. Assessment of RegCM4 simulated inter-annual variability and daily-scale statistics of temperature and precipitation over Mexico. Clim. Dyn. 2014, 42, 629–647. [Google Scholar] [CrossRef] [Green Version]
- Rauscher, S.A.; Kucharski, F.; Enfeld, D.B. The role of regional SST warming variations in the drying of Meso-America in future projections. J. Clim. 2011, 24, 2003–2016. [Google Scholar] [CrossRef]
Figure 1.
(a) Rain-gauge observational network and Digital Elevation Model (DEM) for each climatic region in Costa Rica during the period 1951–1995. (b) Position of the Costa Rica within the Central American isthmus.
Figure 1.
(a) Rain-gauge observational network and Digital Elevation Model (DEM) for each climatic region in Costa Rica during the period 1951–1995. (b) Position of the Costa Rica within the Central American isthmus.

Figure 2.
(a) Spatially-averaged mean monthly precipitation for each climatic region of Costa Rica based on 1951–1995 grid climatology. Error bars represent the standard deviation. (b) Same as (a) but spatially-distributed.
Figure 2.
(a) Spatially-averaged mean monthly precipitation for each climatic region of Costa Rica based on 1951–1995 grid climatology. Error bars represent the standard deviation. (b) Same as (a) but spatially-distributed.

Figure 3.
Flowchart of data processing and implementation of the bias correction (BC) methodology utilized. Hexagons represent the corresponding R-script included in Supplementary Materials.
Figure 3.
Flowchart of data processing and implementation of the bias correction (BC) methodology utilized. Hexagons represent the corresponding R-script included in Supplementary Materials.

Figure 4.
Spatially-averaged observed and uncorrected GCM-RCM annual cycle of precipitation during the period 1951–1995 for all climatic regions of Costa Rica.
Figure 4.
Spatially-averaged observed and uncorrected GCM-RCM annual cycle of precipitation during the period 1951–1995 for all climatic regions of Costa Rica.

Figure 5.
Taylor diagrams of spatially-averaged observed, uncorrected and bias-corrected precipitation during the period 1981–1995 for all climatic regions of Costa Rica.
Figure 5.
Taylor diagrams of spatially-averaged observed, uncorrected and bias-corrected precipitation during the period 1981–1995 for all climatic regions of Costa Rica.

Figure 6.
Spatially-averaged root mean square error (RMSE) performance of uncorrected and bias-corrected precipitation during the validation period 1981–1995 for all climatic regions of Costa Rica. Bold cell numbers represent absolute RMSE values (mm/month), whereas italic numbers and scale-color represent the RMSE relative percentage change after bias correction (%). Negative values are presented in grey.

Figure 7.
Spatially-averaged mean absolute deviation (MAE) performance of uncorrected and bias-corrected precipitation during the validation period 1981–1995 for all climatic regions of Costa Rica. Bold cell numbers represent absolute MAE values (mm/month), whereas italic numbers and scale-color represent the MAE relative percentage change (%) after bias correction. Negative values are presented in grey.

Figure 8.
Spatially-averaged R performance of uncorrected and bias-corrected precipitation during the validation period 1981–1995 for all climatic regions of Costa Rica. Bold cell numbers represent absolute R values (unitless), whereas italic numbers and scale-color represent the R relative percentage change (%) after bias correction. Negative values are presented in grey.

Figure 9.
Spatially-averaged percentage bias (PBIAS) performance of uncorrected and bias-corrected precipitation during the validation period 1981–1995 for all climatic regions of Costa Rica. Scale-color represents the PBIAS absolute percentage change (%) after bias correction. Negative values are presented in grey.

Figure 10.
Spatially-averaged seasonal Q-Q plots comparing the cumulative distribution functions (CDFs) of observed and bias corrected ensemble-mean precipitation during the validation period 1981–1995 for all climatic regions of Costa Rica.
Figure 10.
Spatially-averaged seasonal Q-Q plots comparing the cumulative distribution functions (CDFs) of observed and bias corrected ensemble-mean precipitation during the validation period 1981–1995 for all climatic regions of Costa Rica.

Figure 11.
Spatially-averaged percentage-change (PC) in precipitation of the bias corrected ensemble-mean with respect to baseline period (1961–1990) under RCPs 2.5, 4.5 and 8.5 for near-future, mid-future and far-future periods over all climatic regions of Costa Rica.
Figure 11.
Spatially-averaged percentage-change (PC) in precipitation of the bias corrected ensemble-mean with respect to baseline period (1961–1990) under RCPs 2.5, 4.5 and 8.5 for near-future, mid-future and far-future periods over all climatic regions of Costa Rica.

Figure 12.
Spatially-distributed percentage-change (PC) in precipitation of the bias corrected ensemble-mean with respect to baseline period (1961–1990) under RCPs 2.5, 4.5 and 8.5 for near-future, mid-future and far-future periods over all climatic regions of Costa Rica.
Figure 12.
Spatially-distributed percentage-change (PC) in precipitation of the bias corrected ensemble-mean with respect to baseline period (1961–1990) under RCPs 2.5, 4.5 and 8.5 for near-future, mid-future and far-future periods over all climatic regions of Costa Rica.


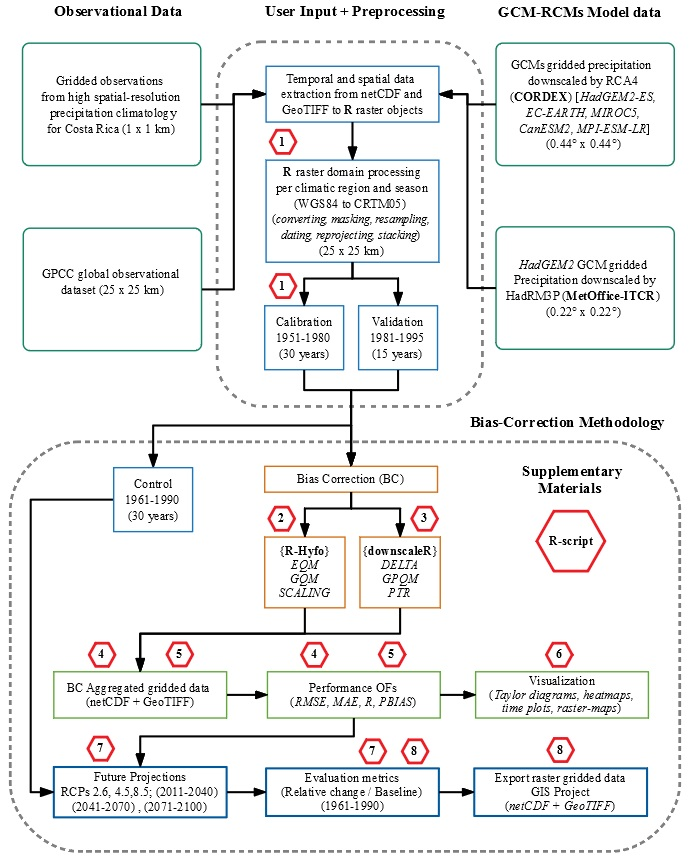
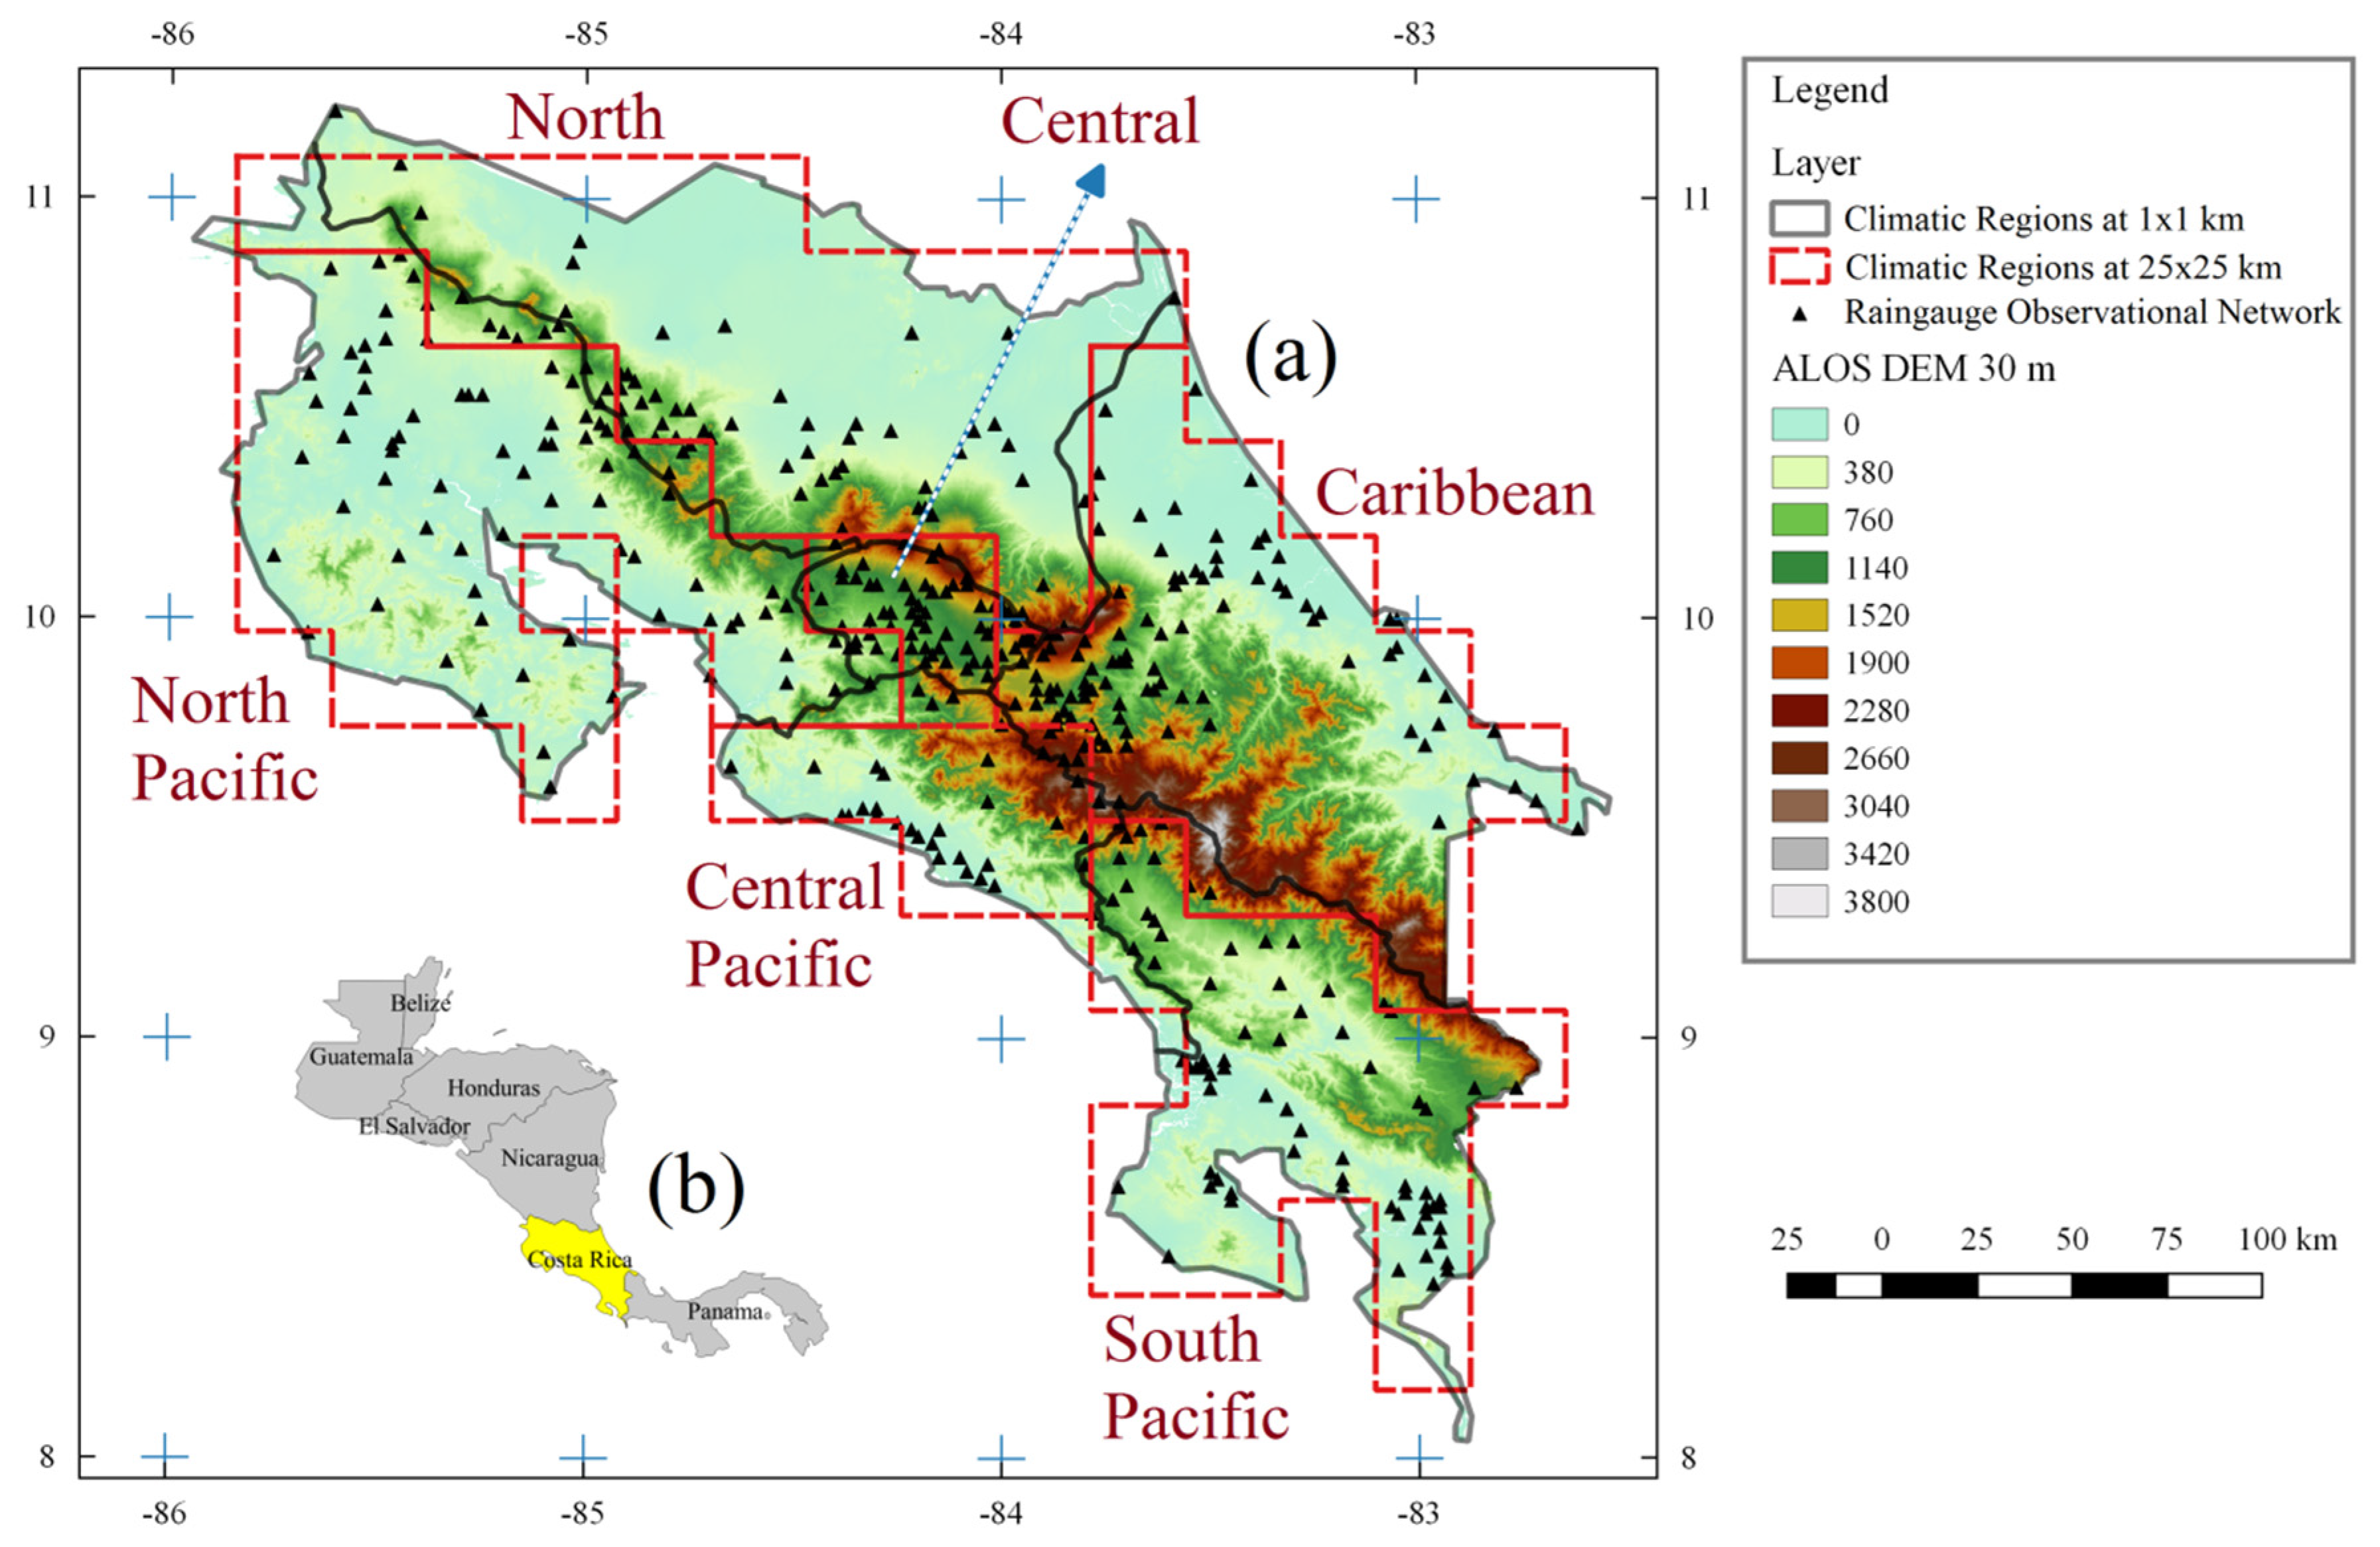
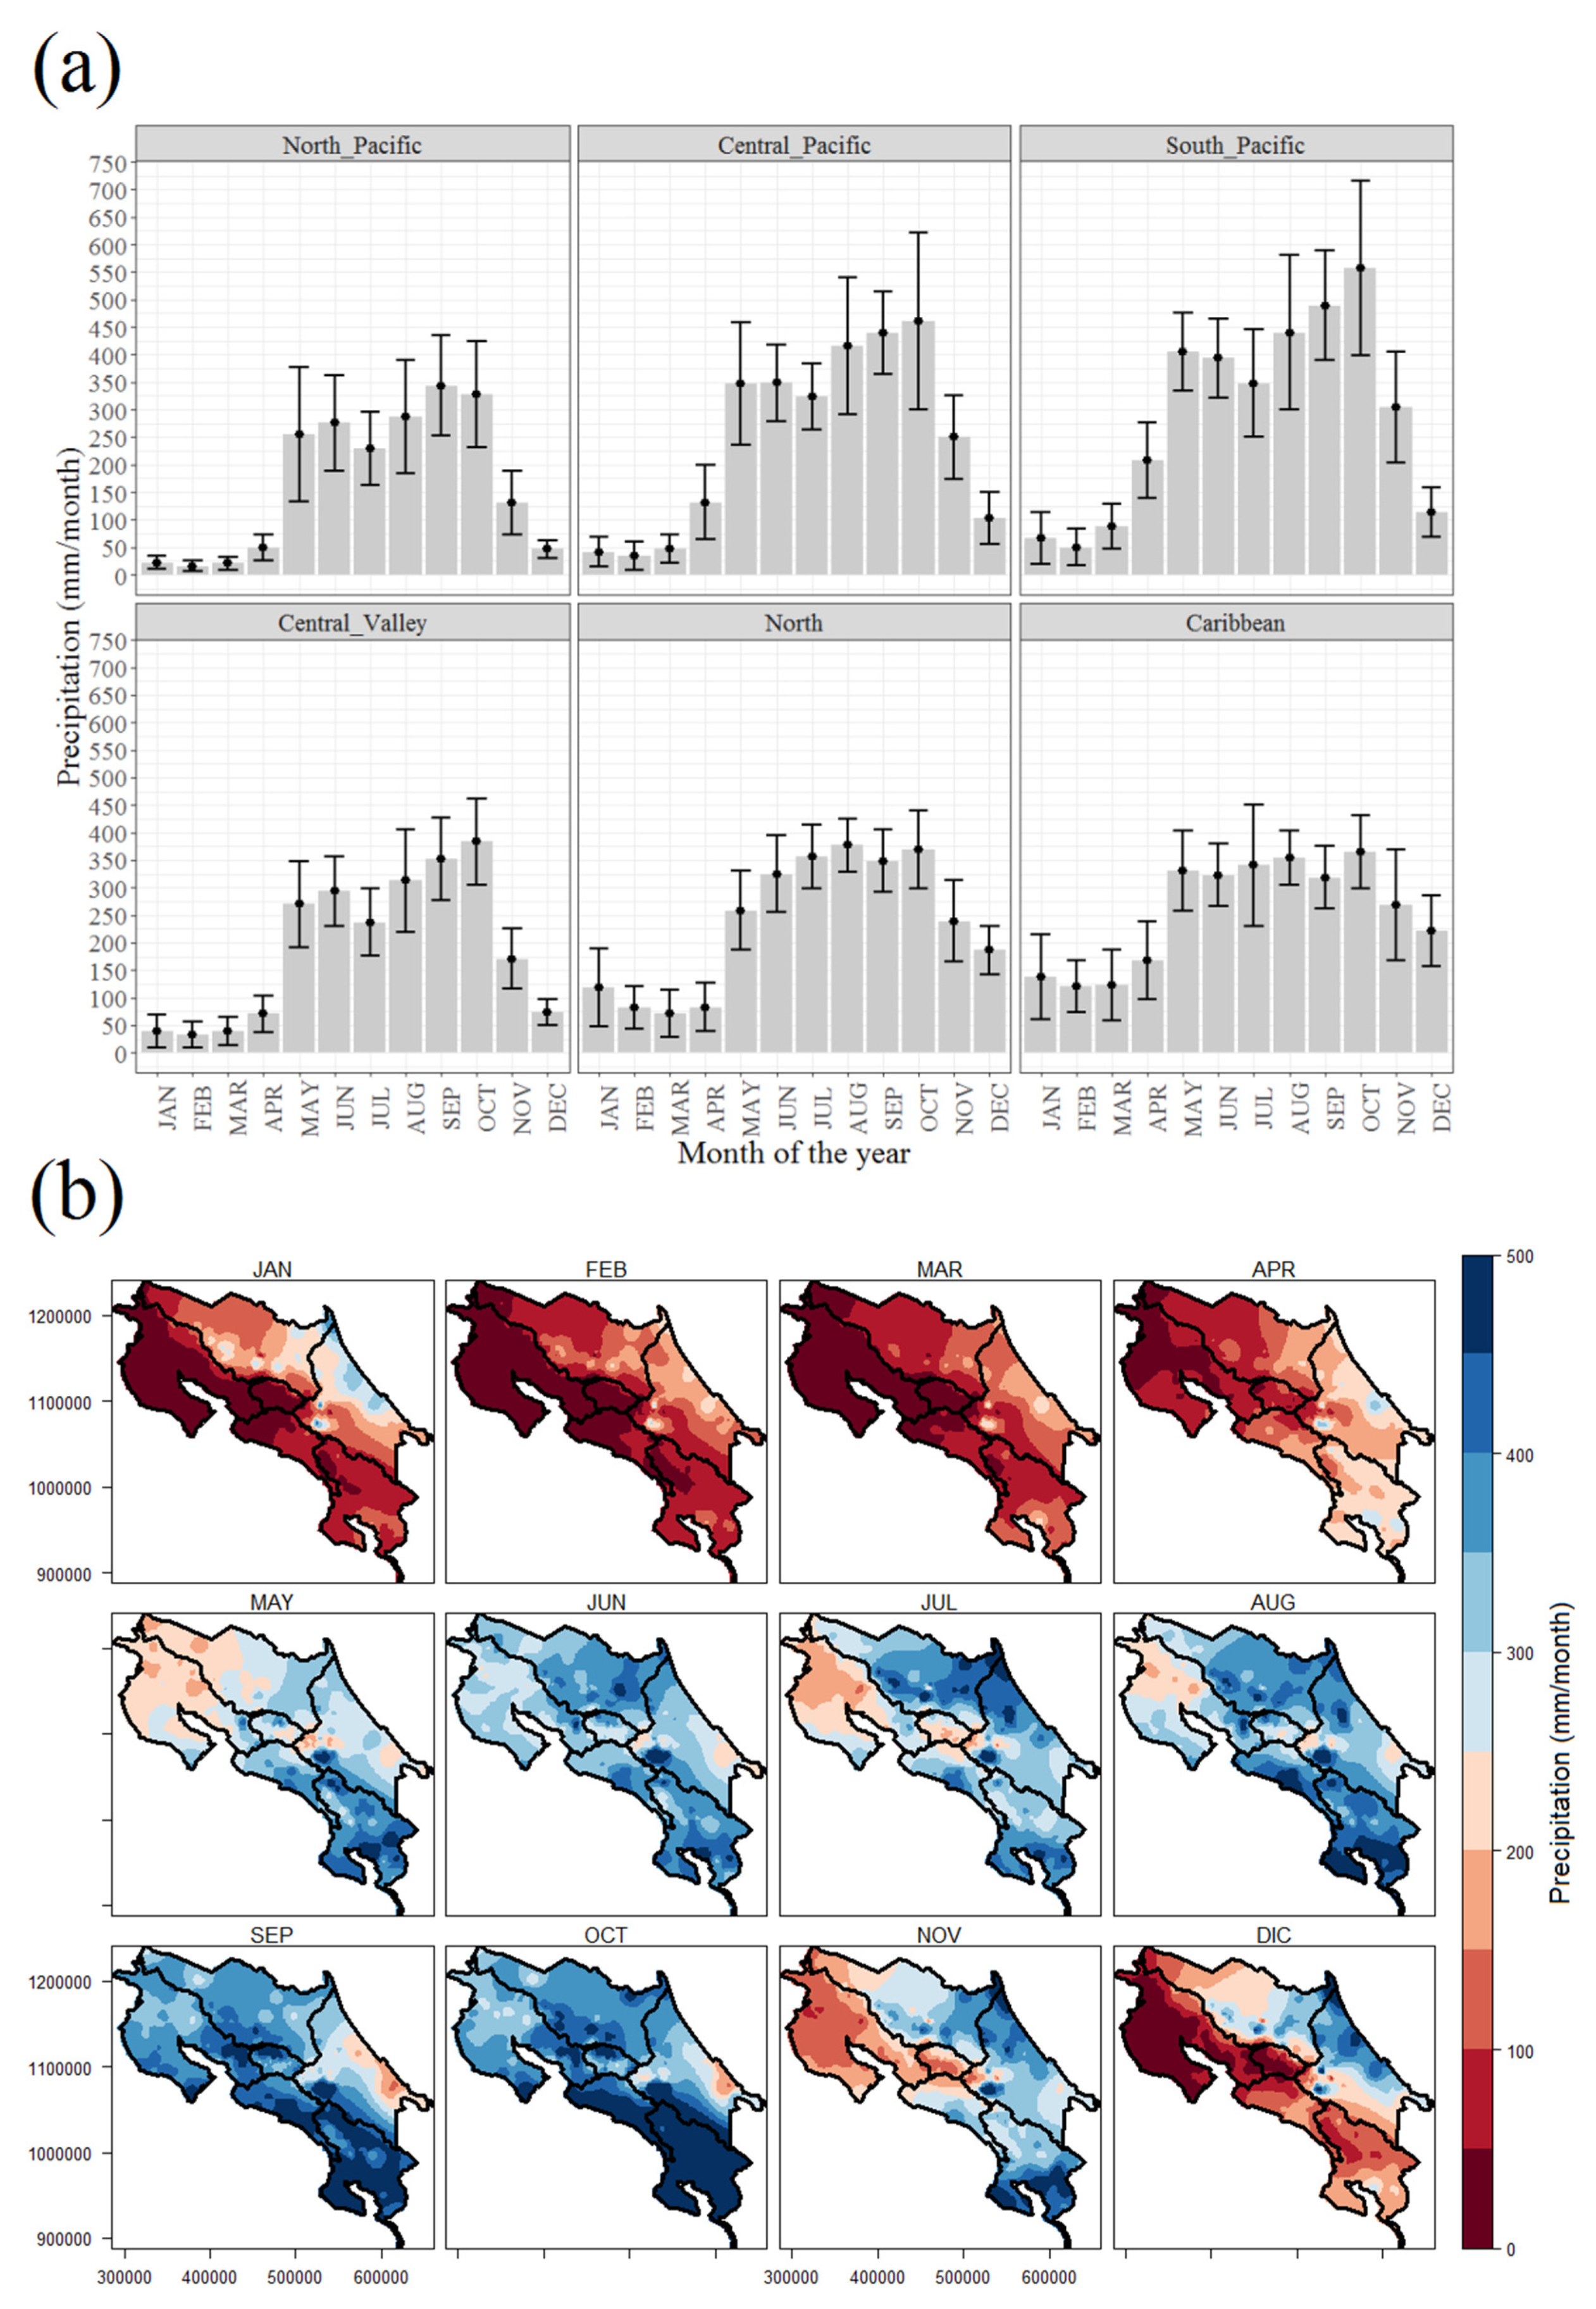
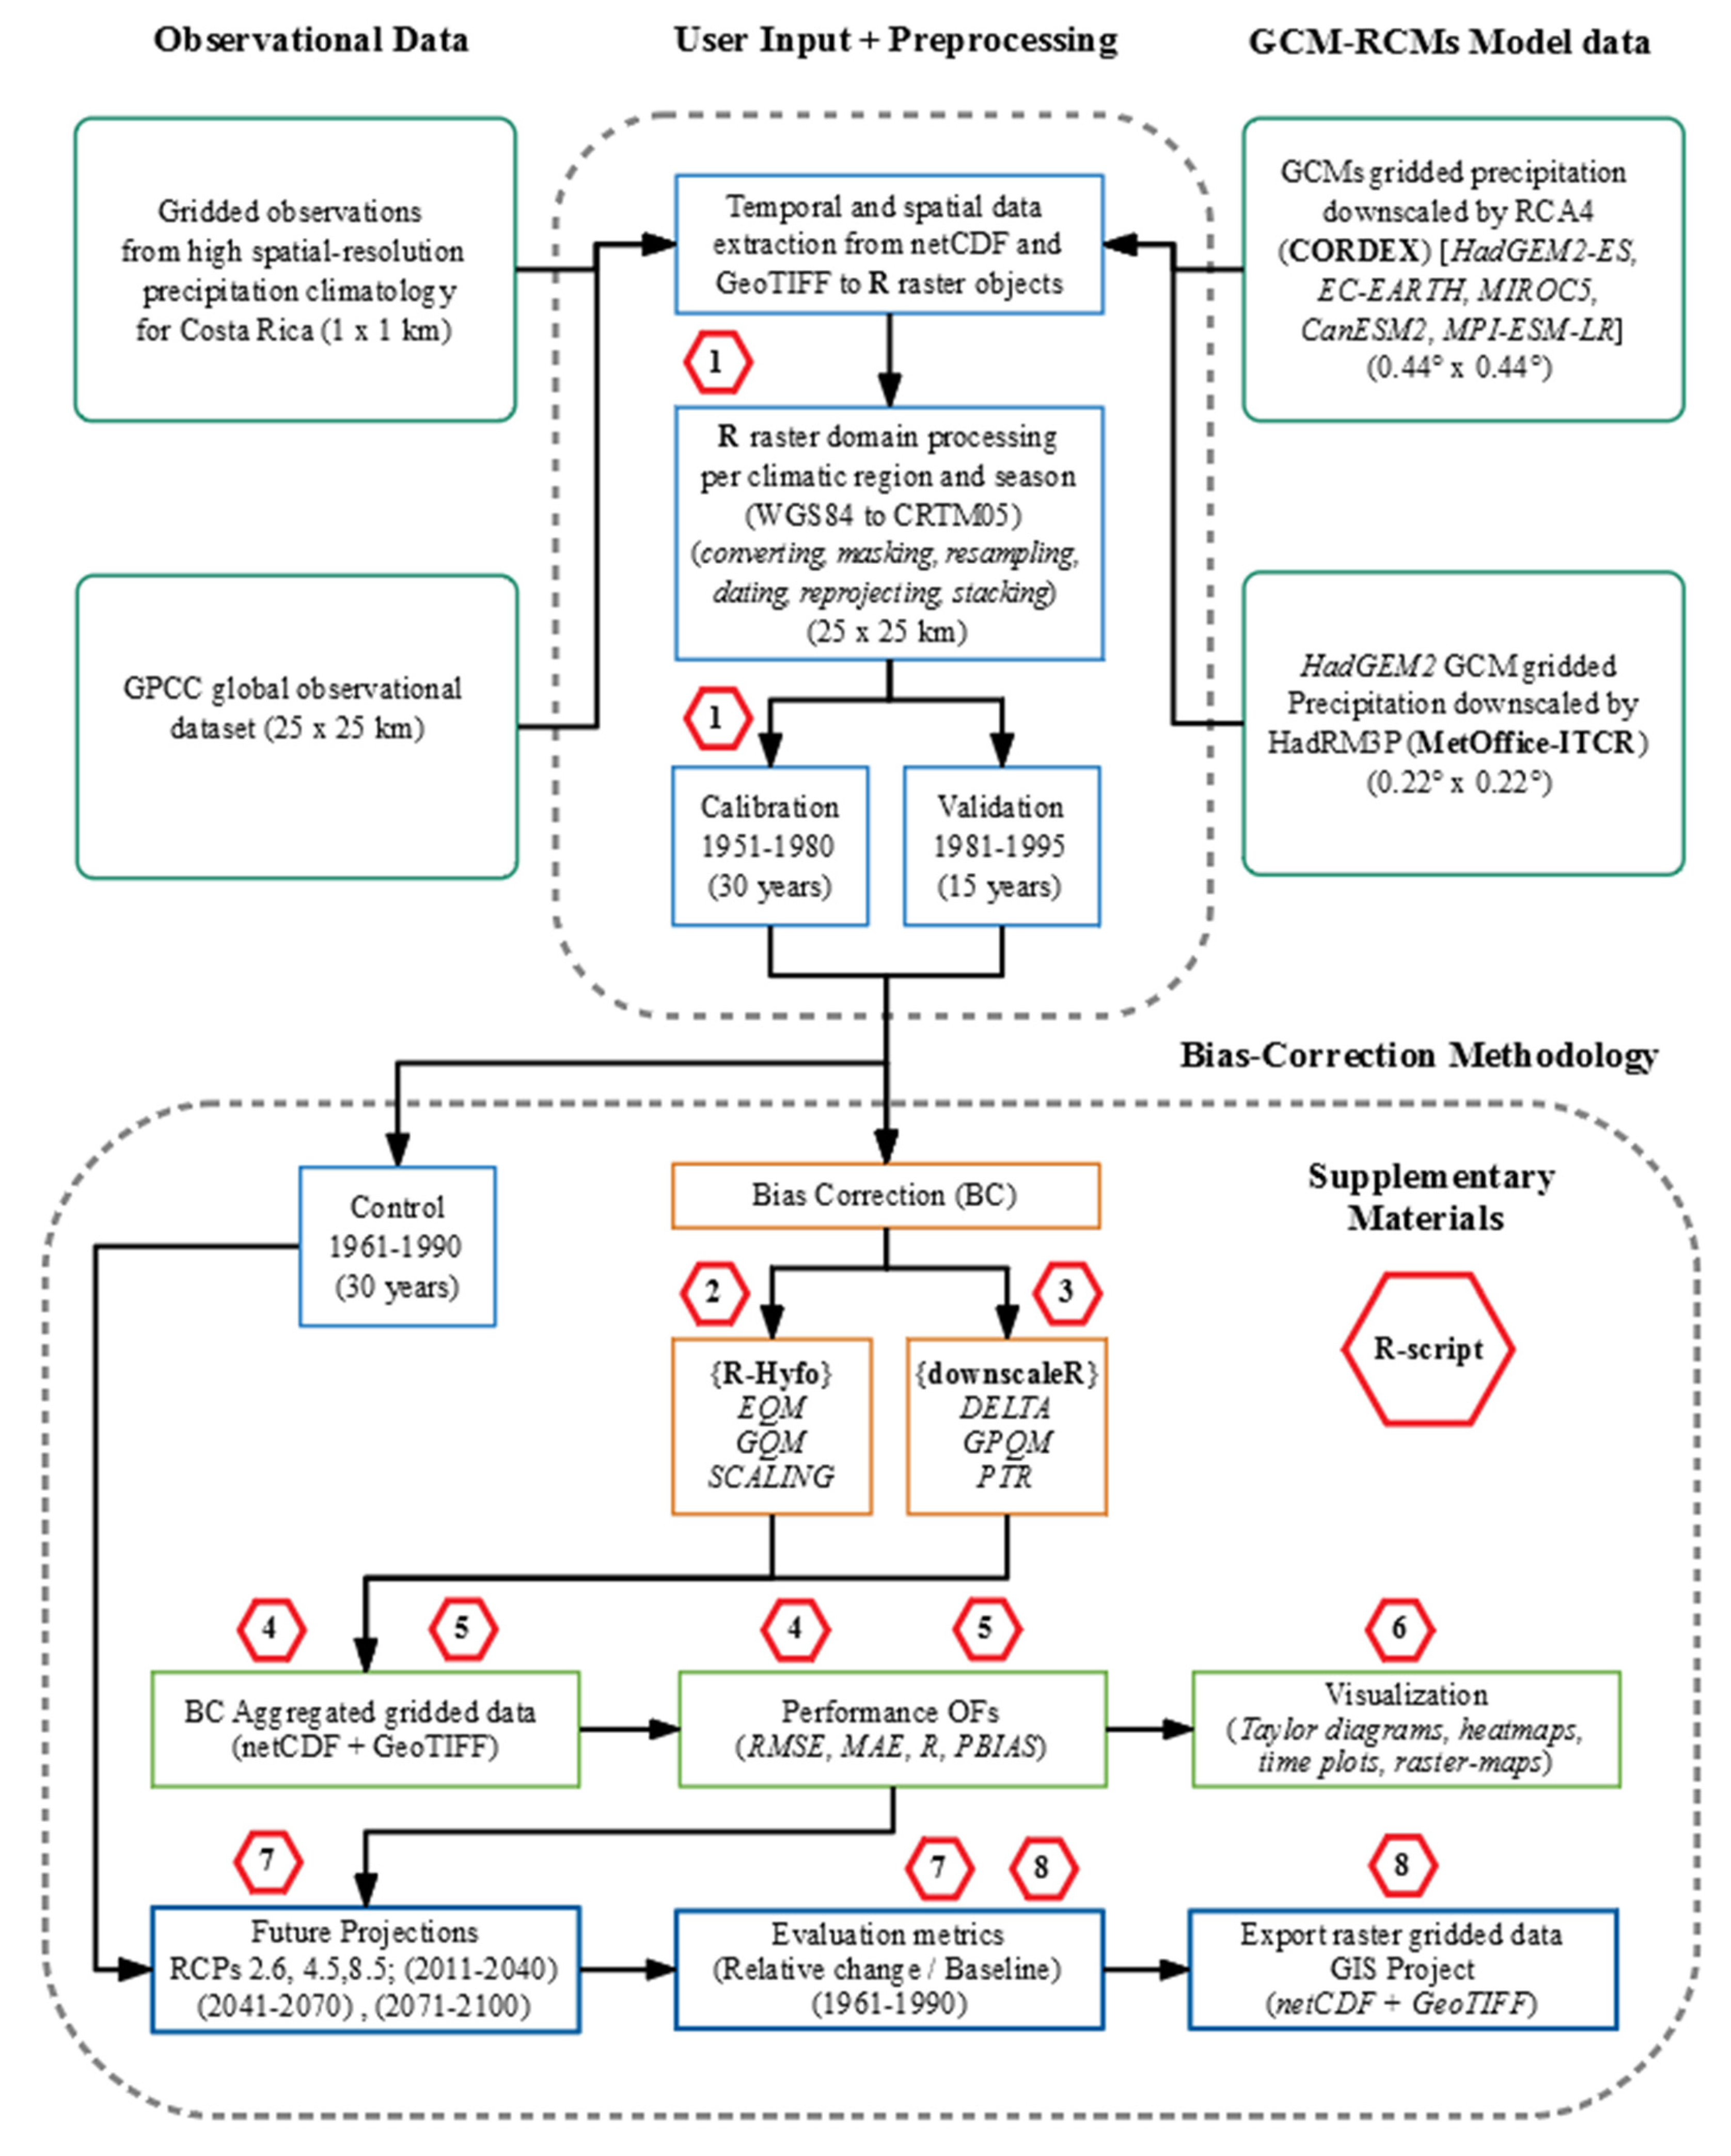
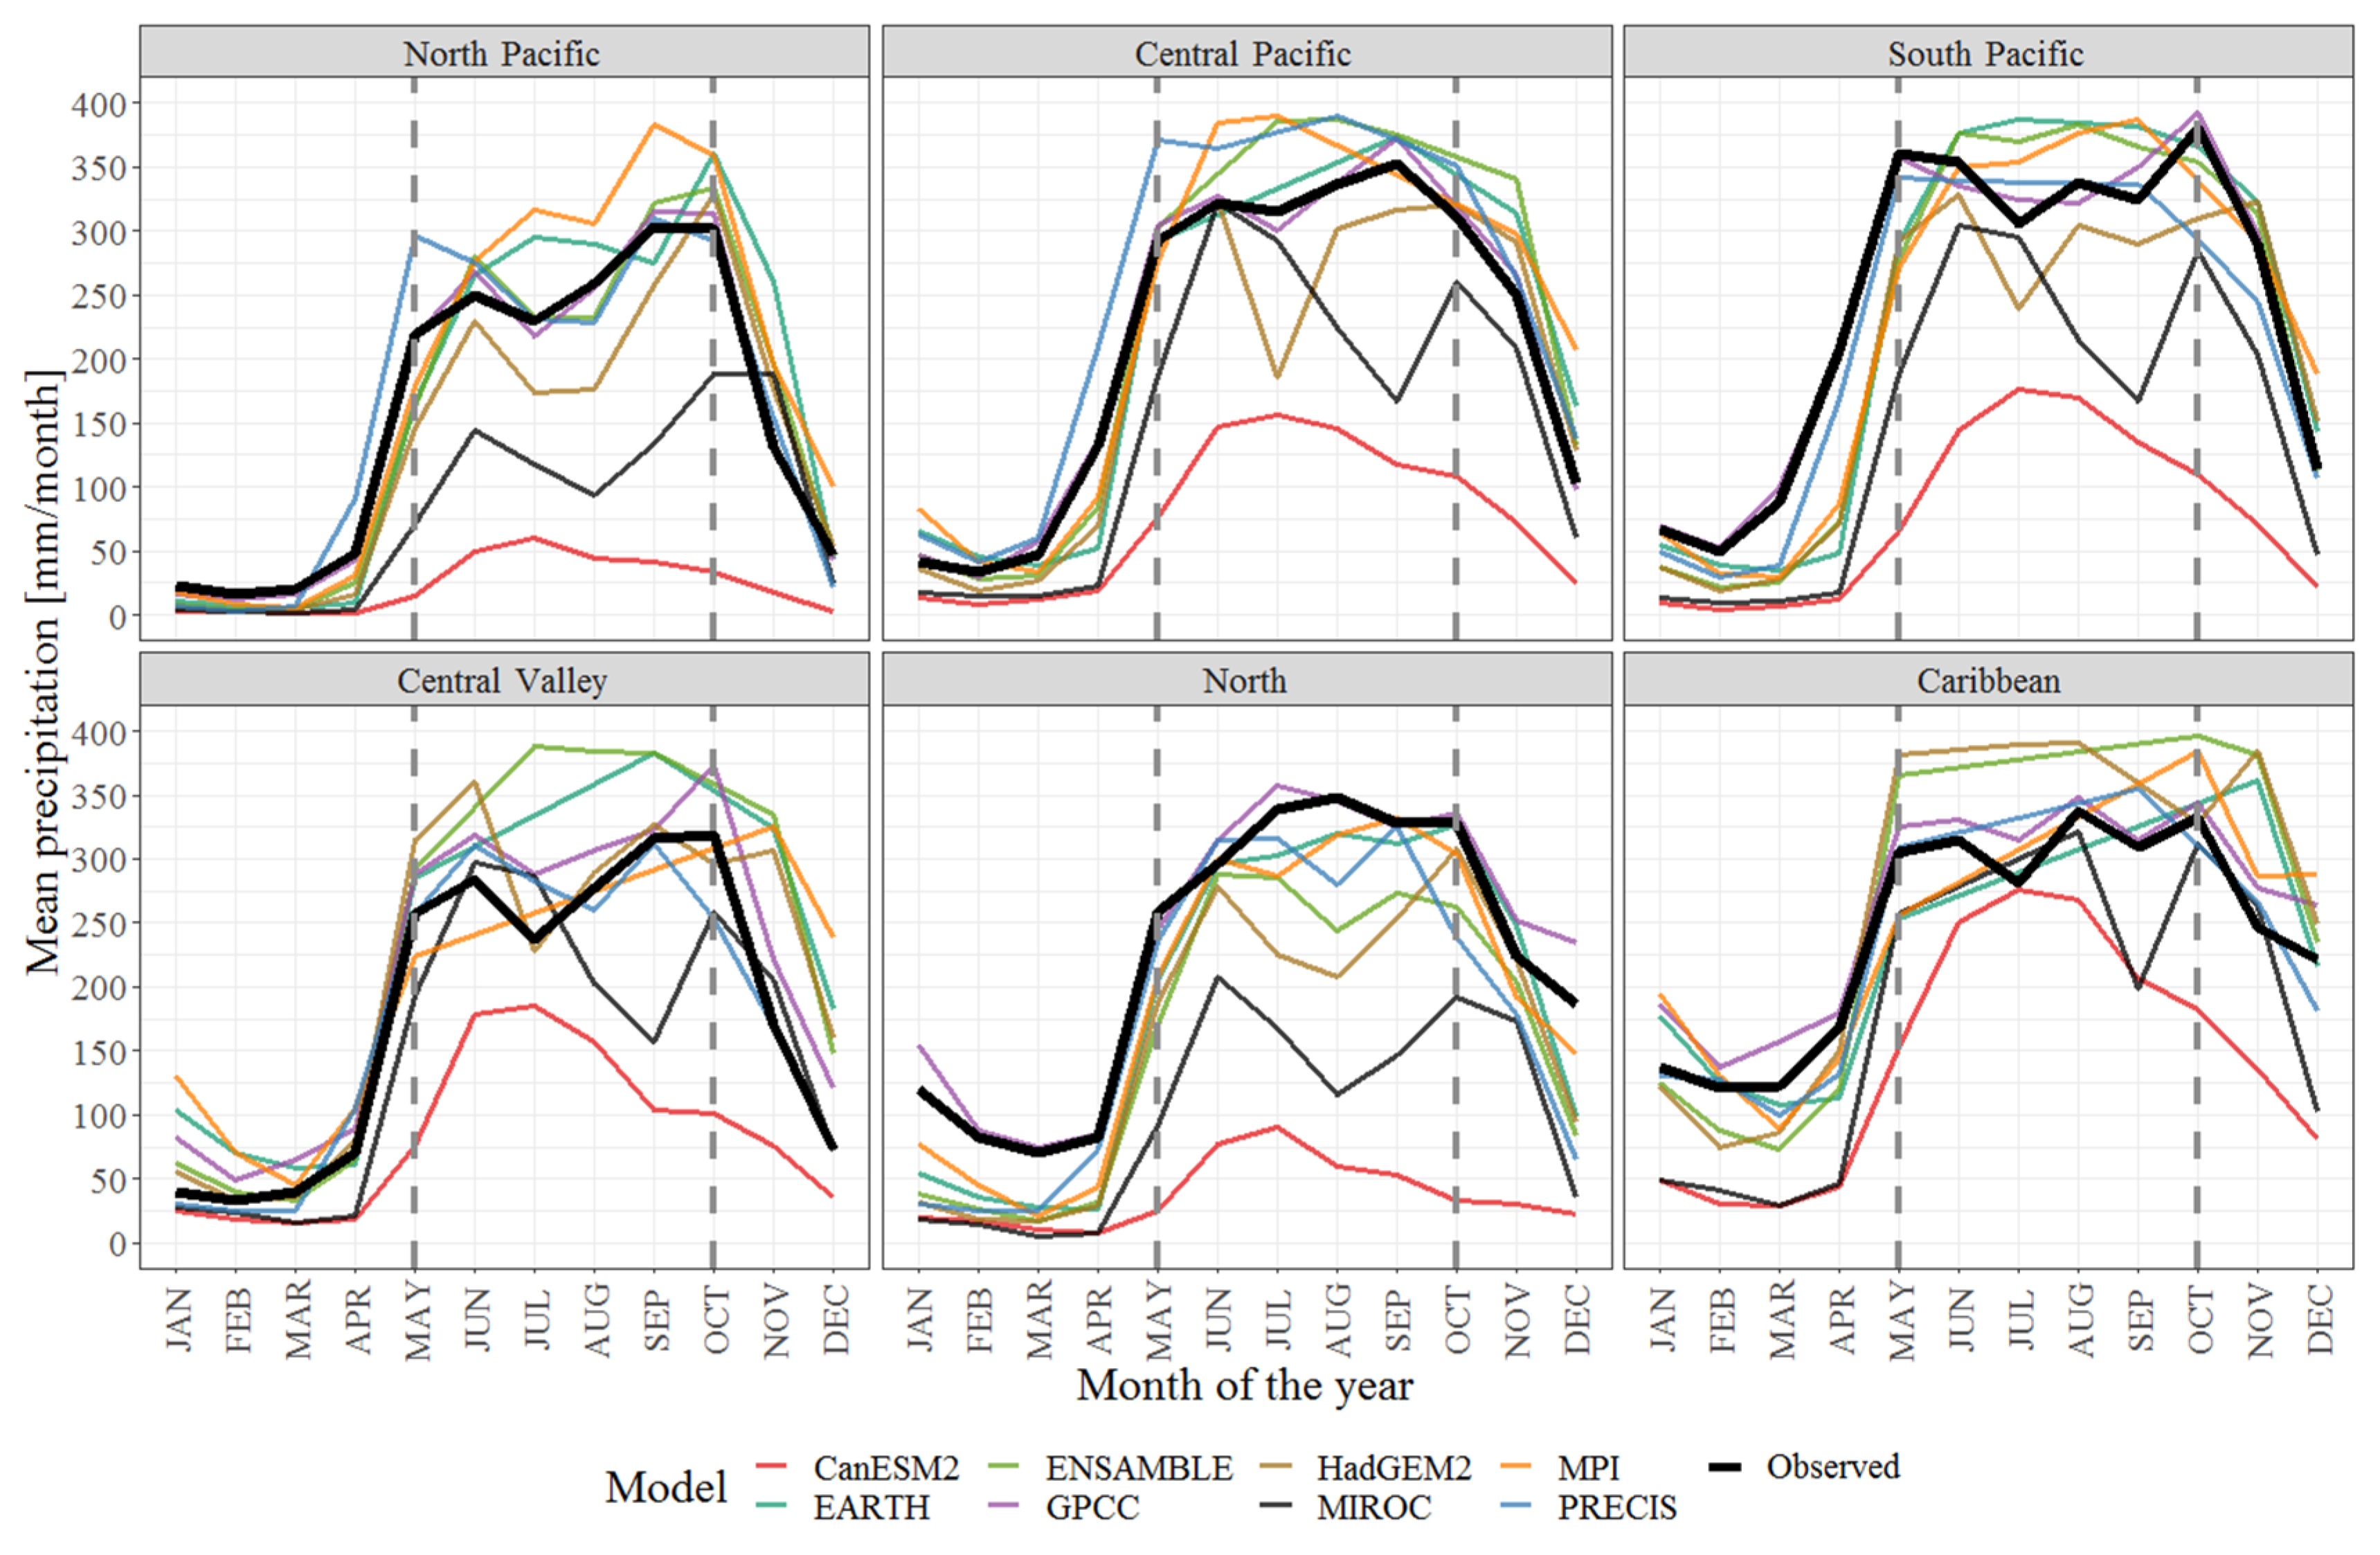
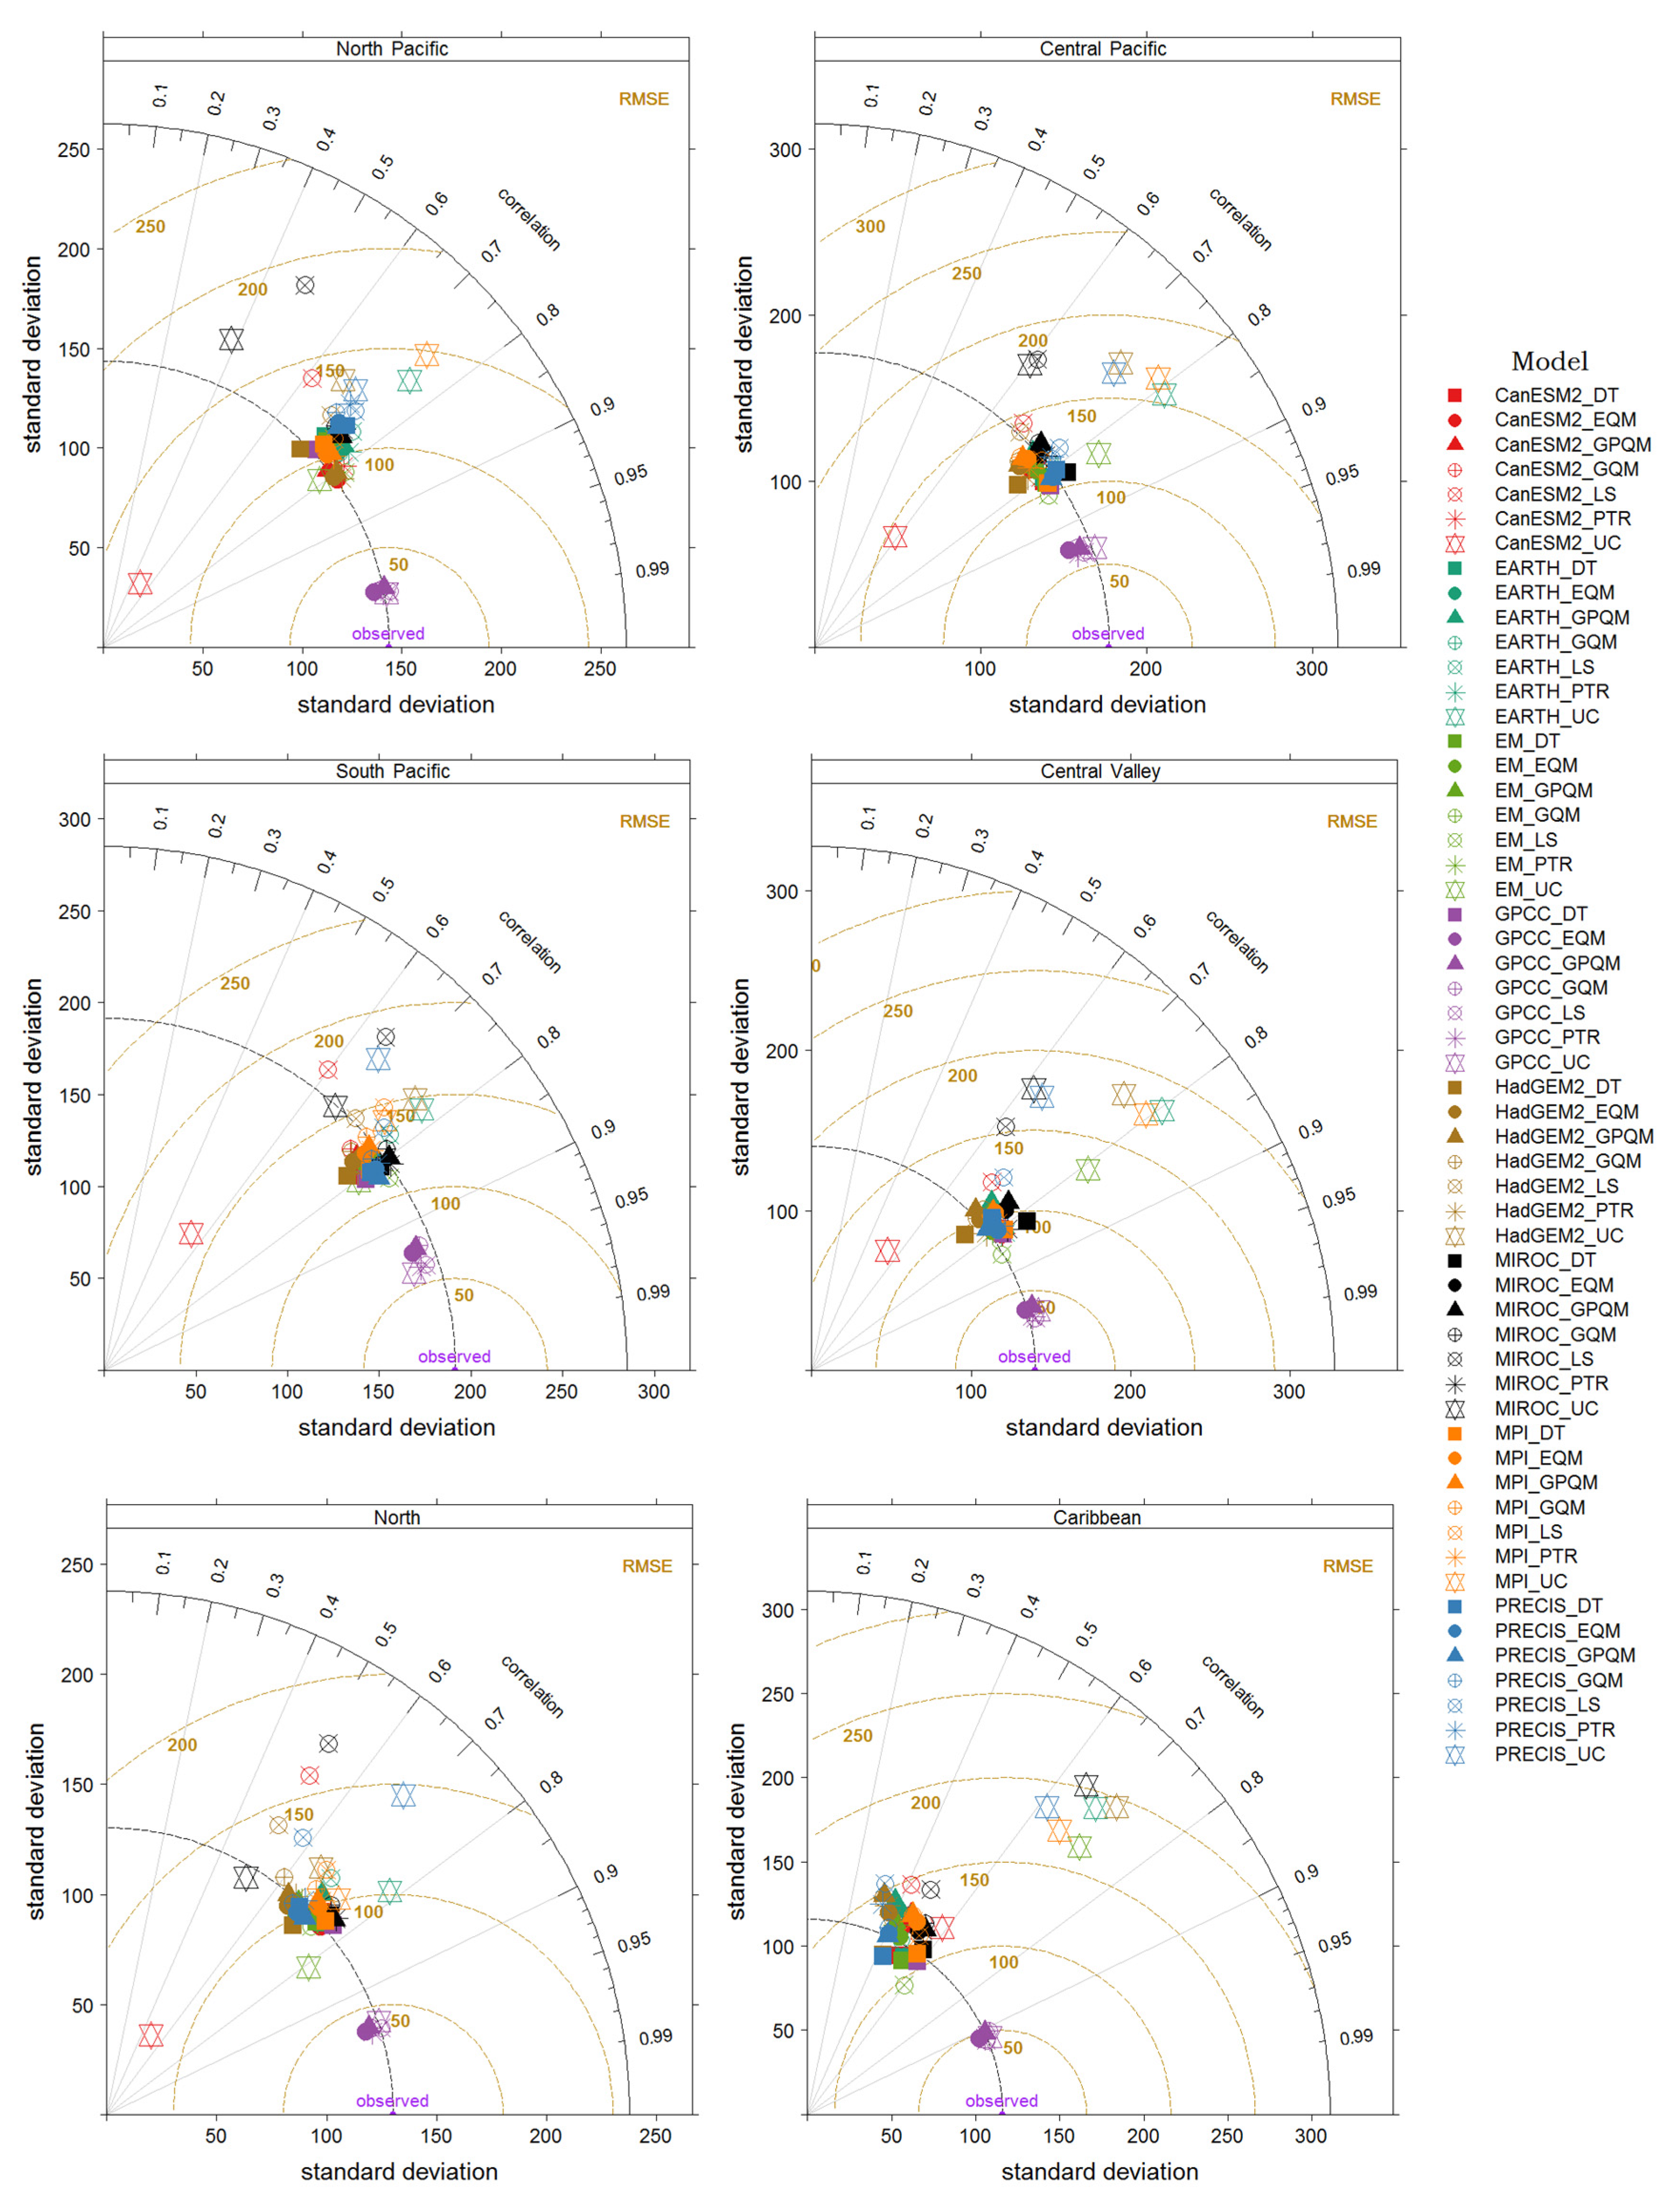
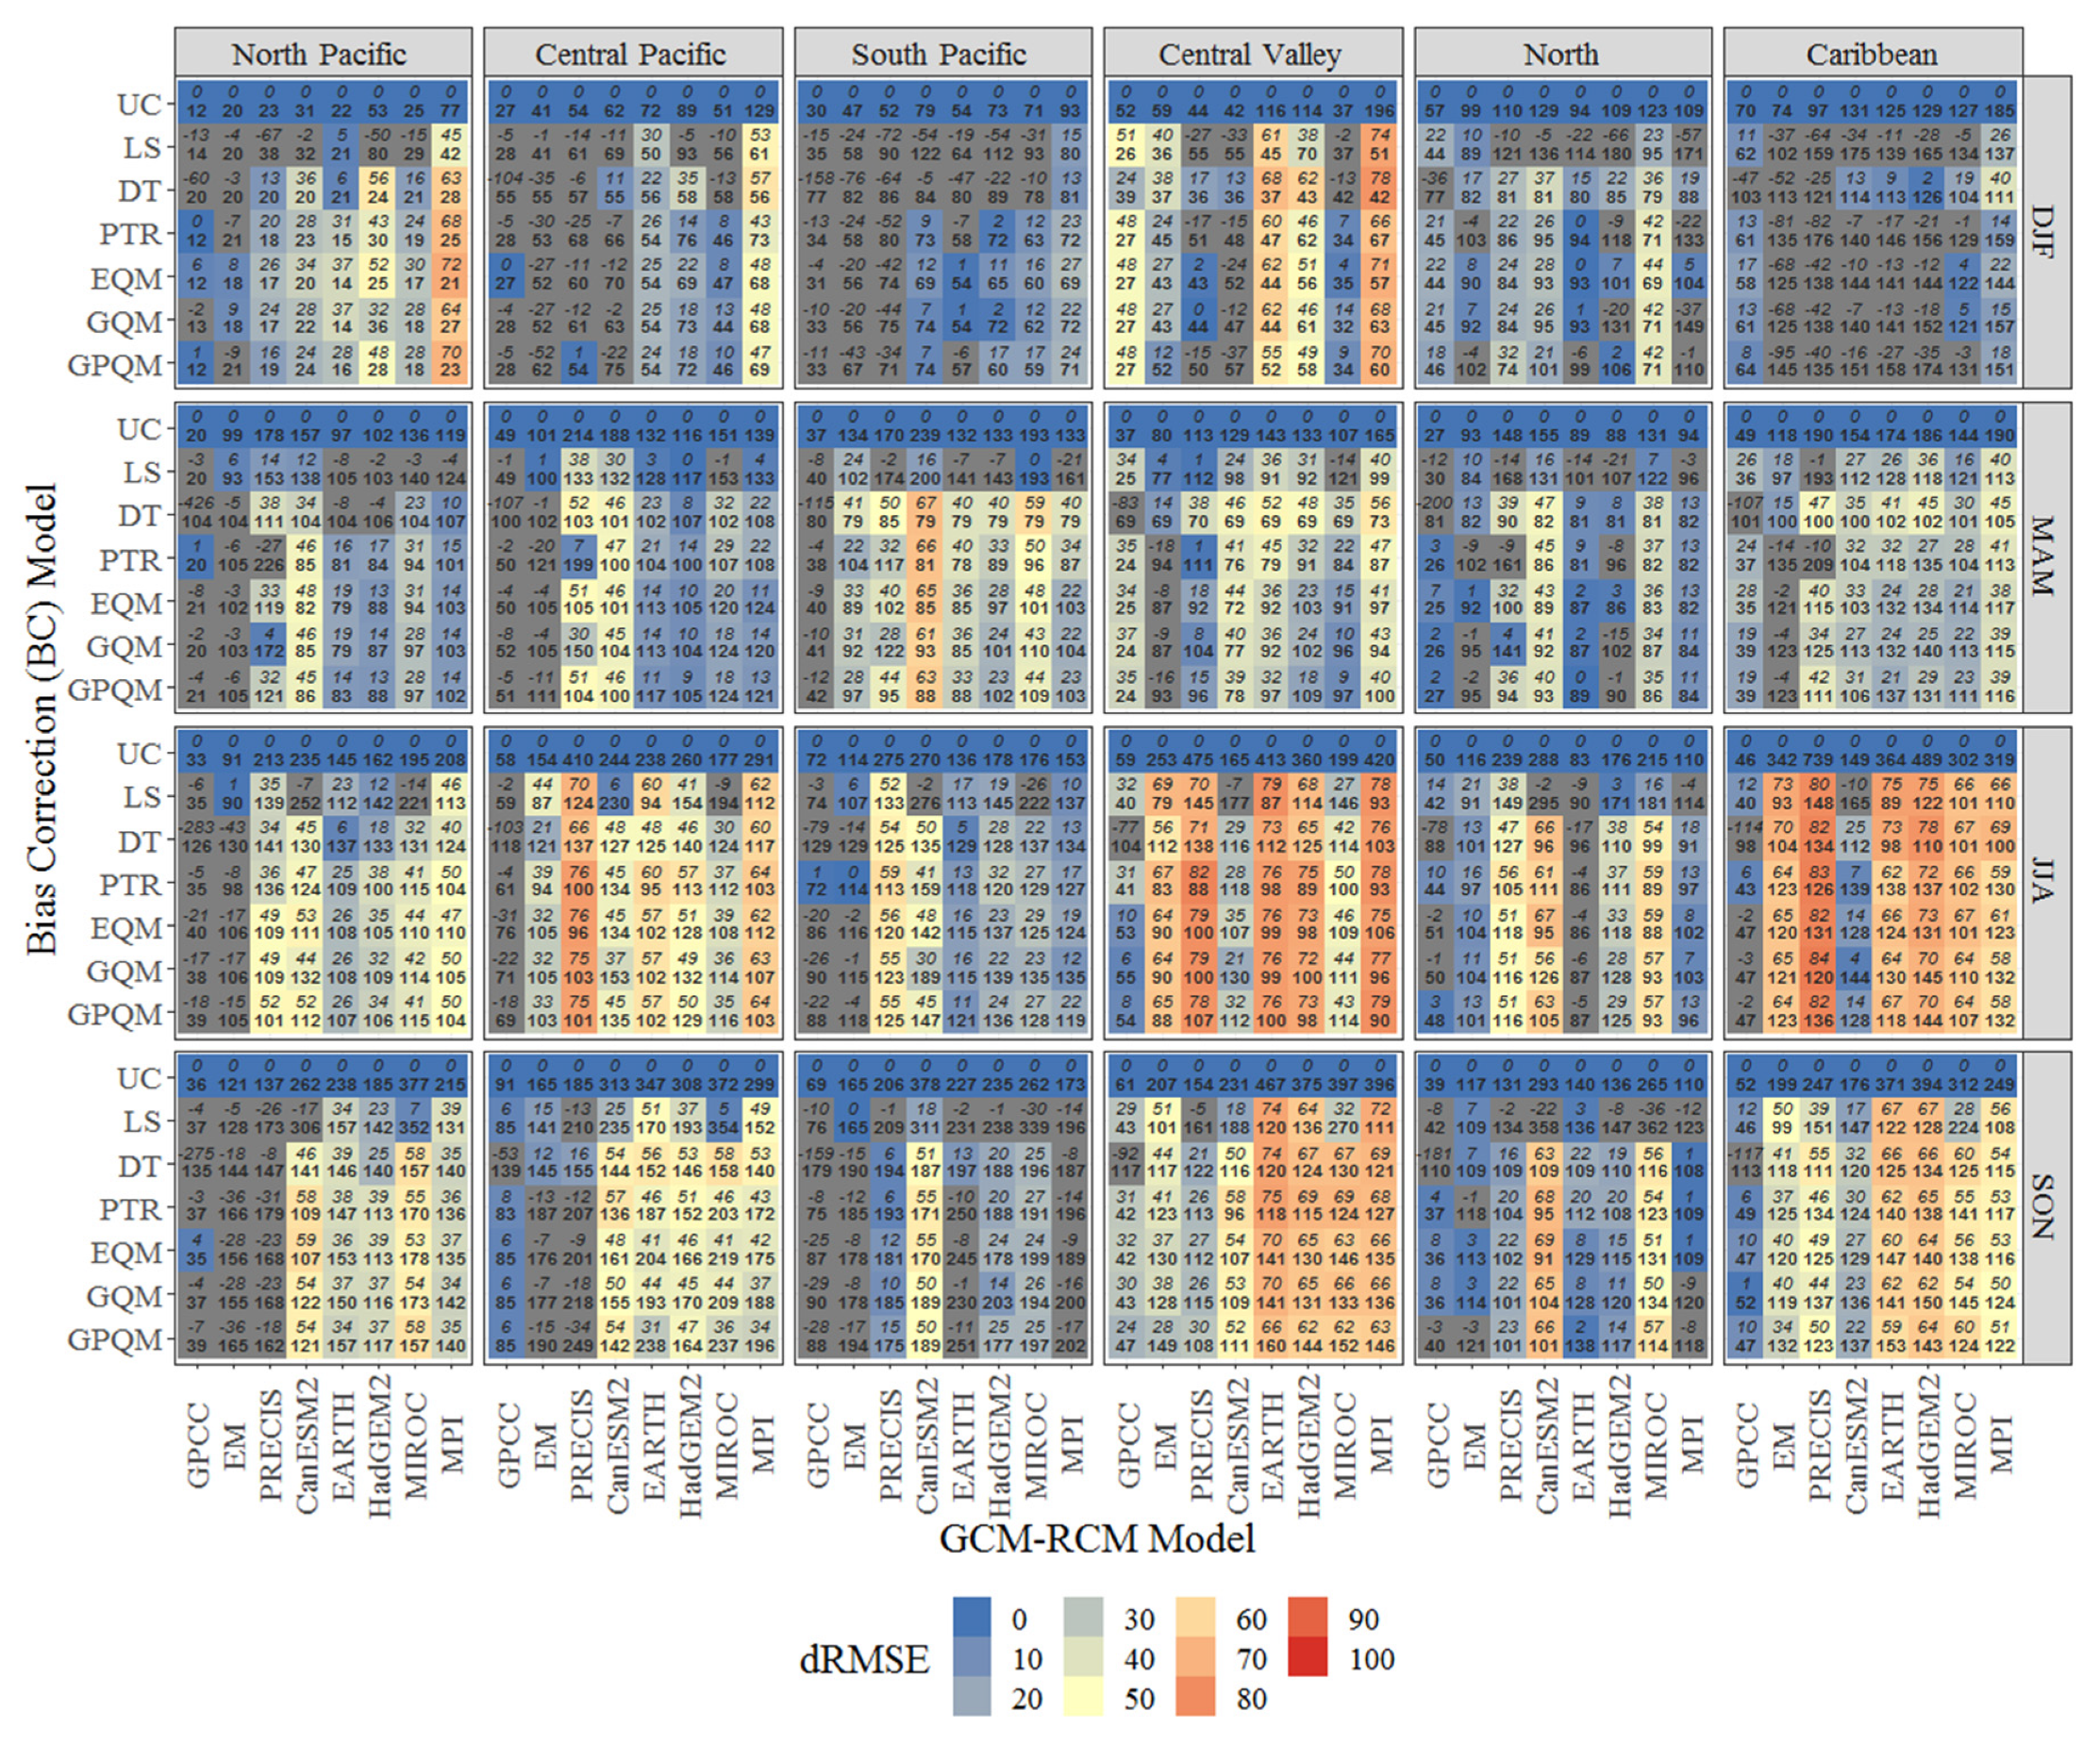
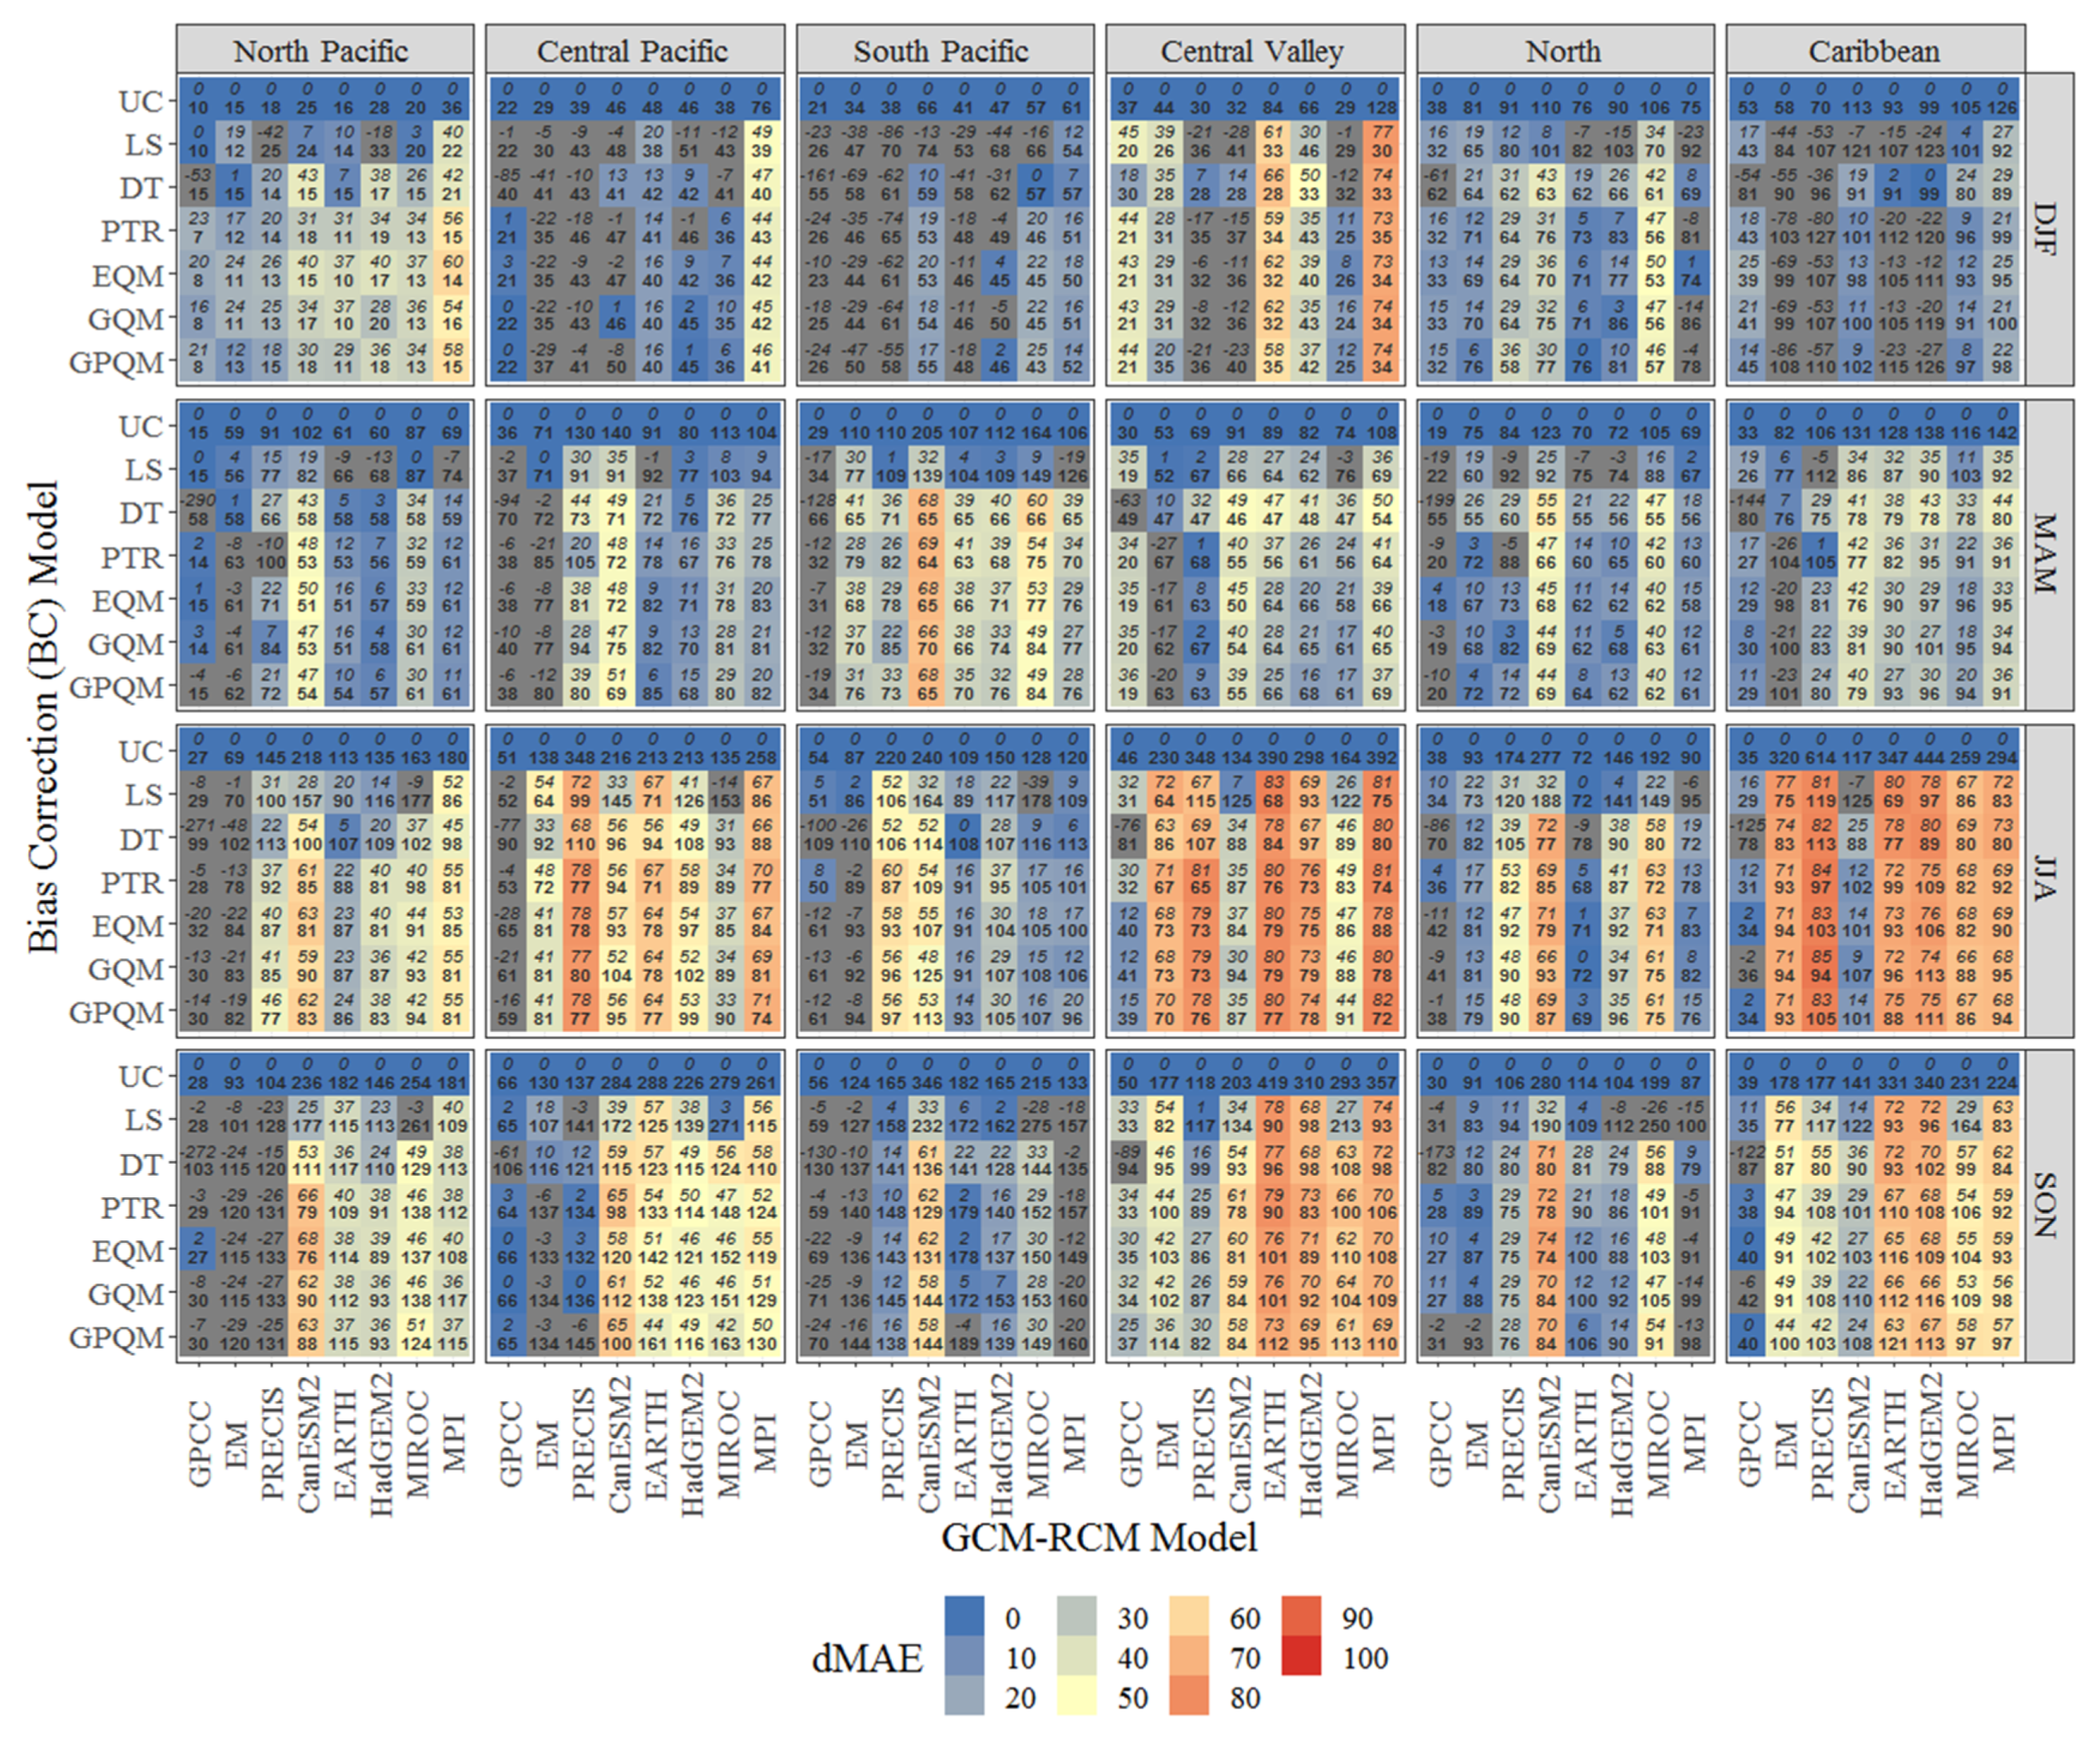
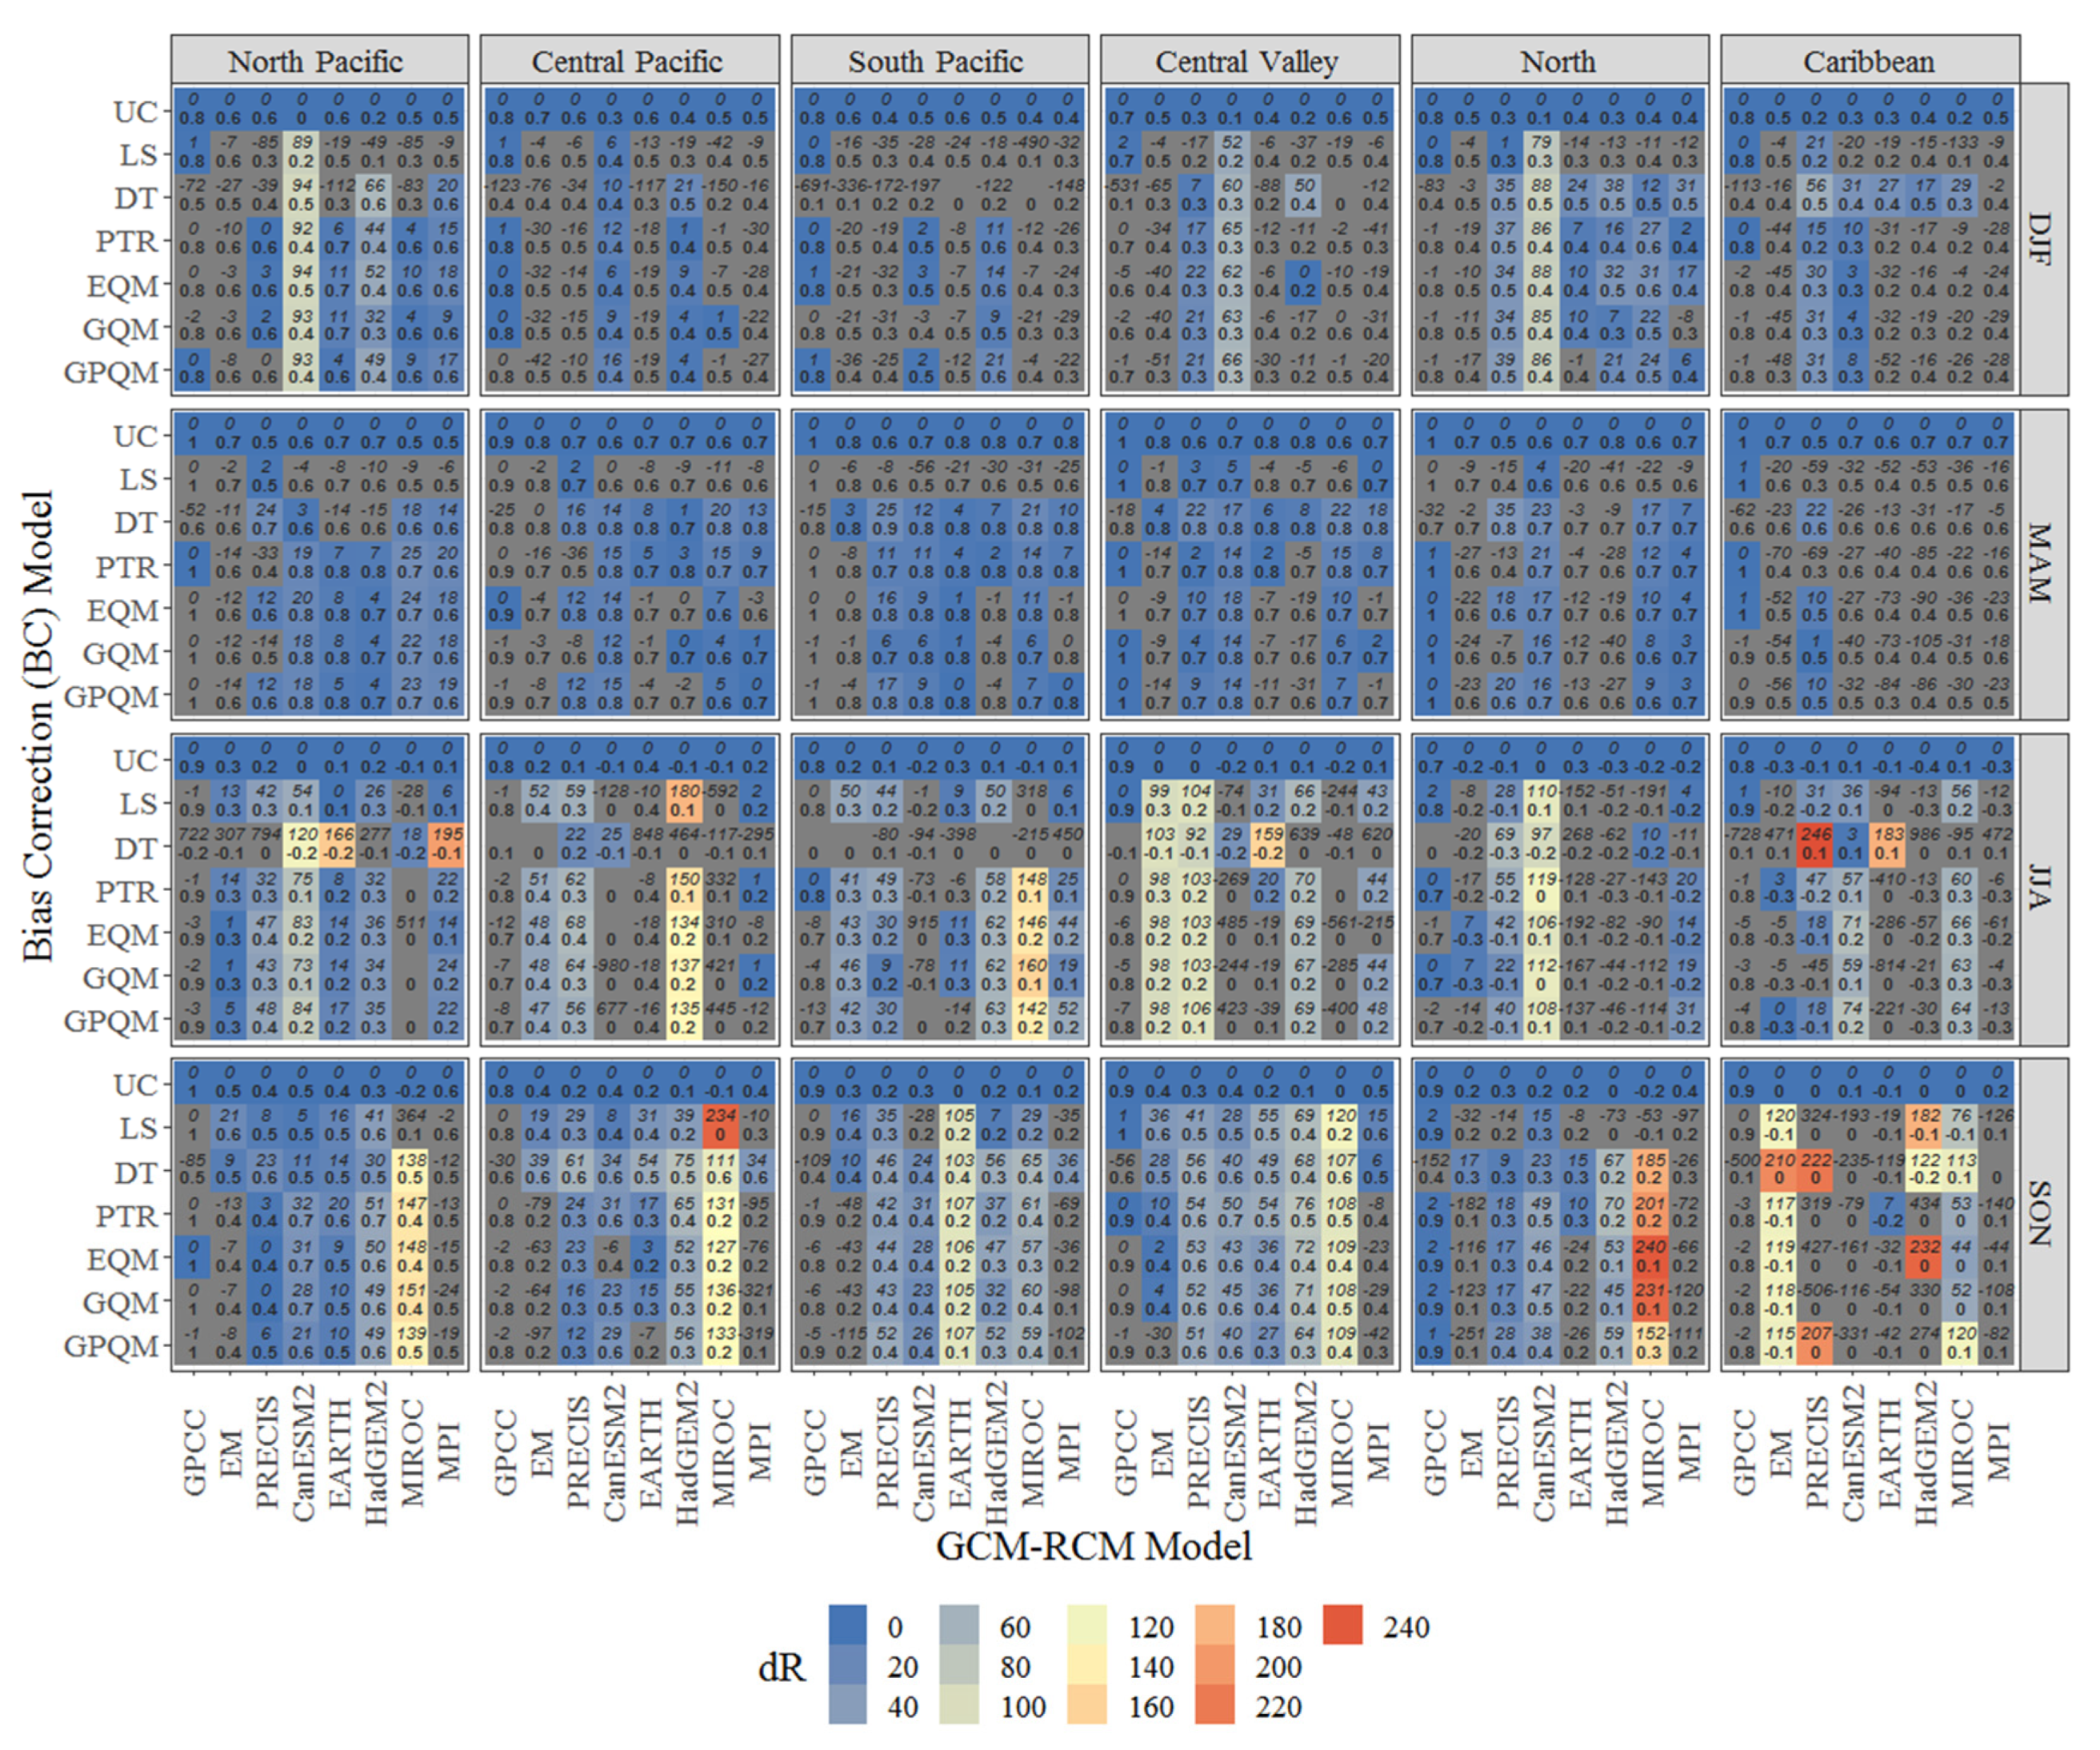
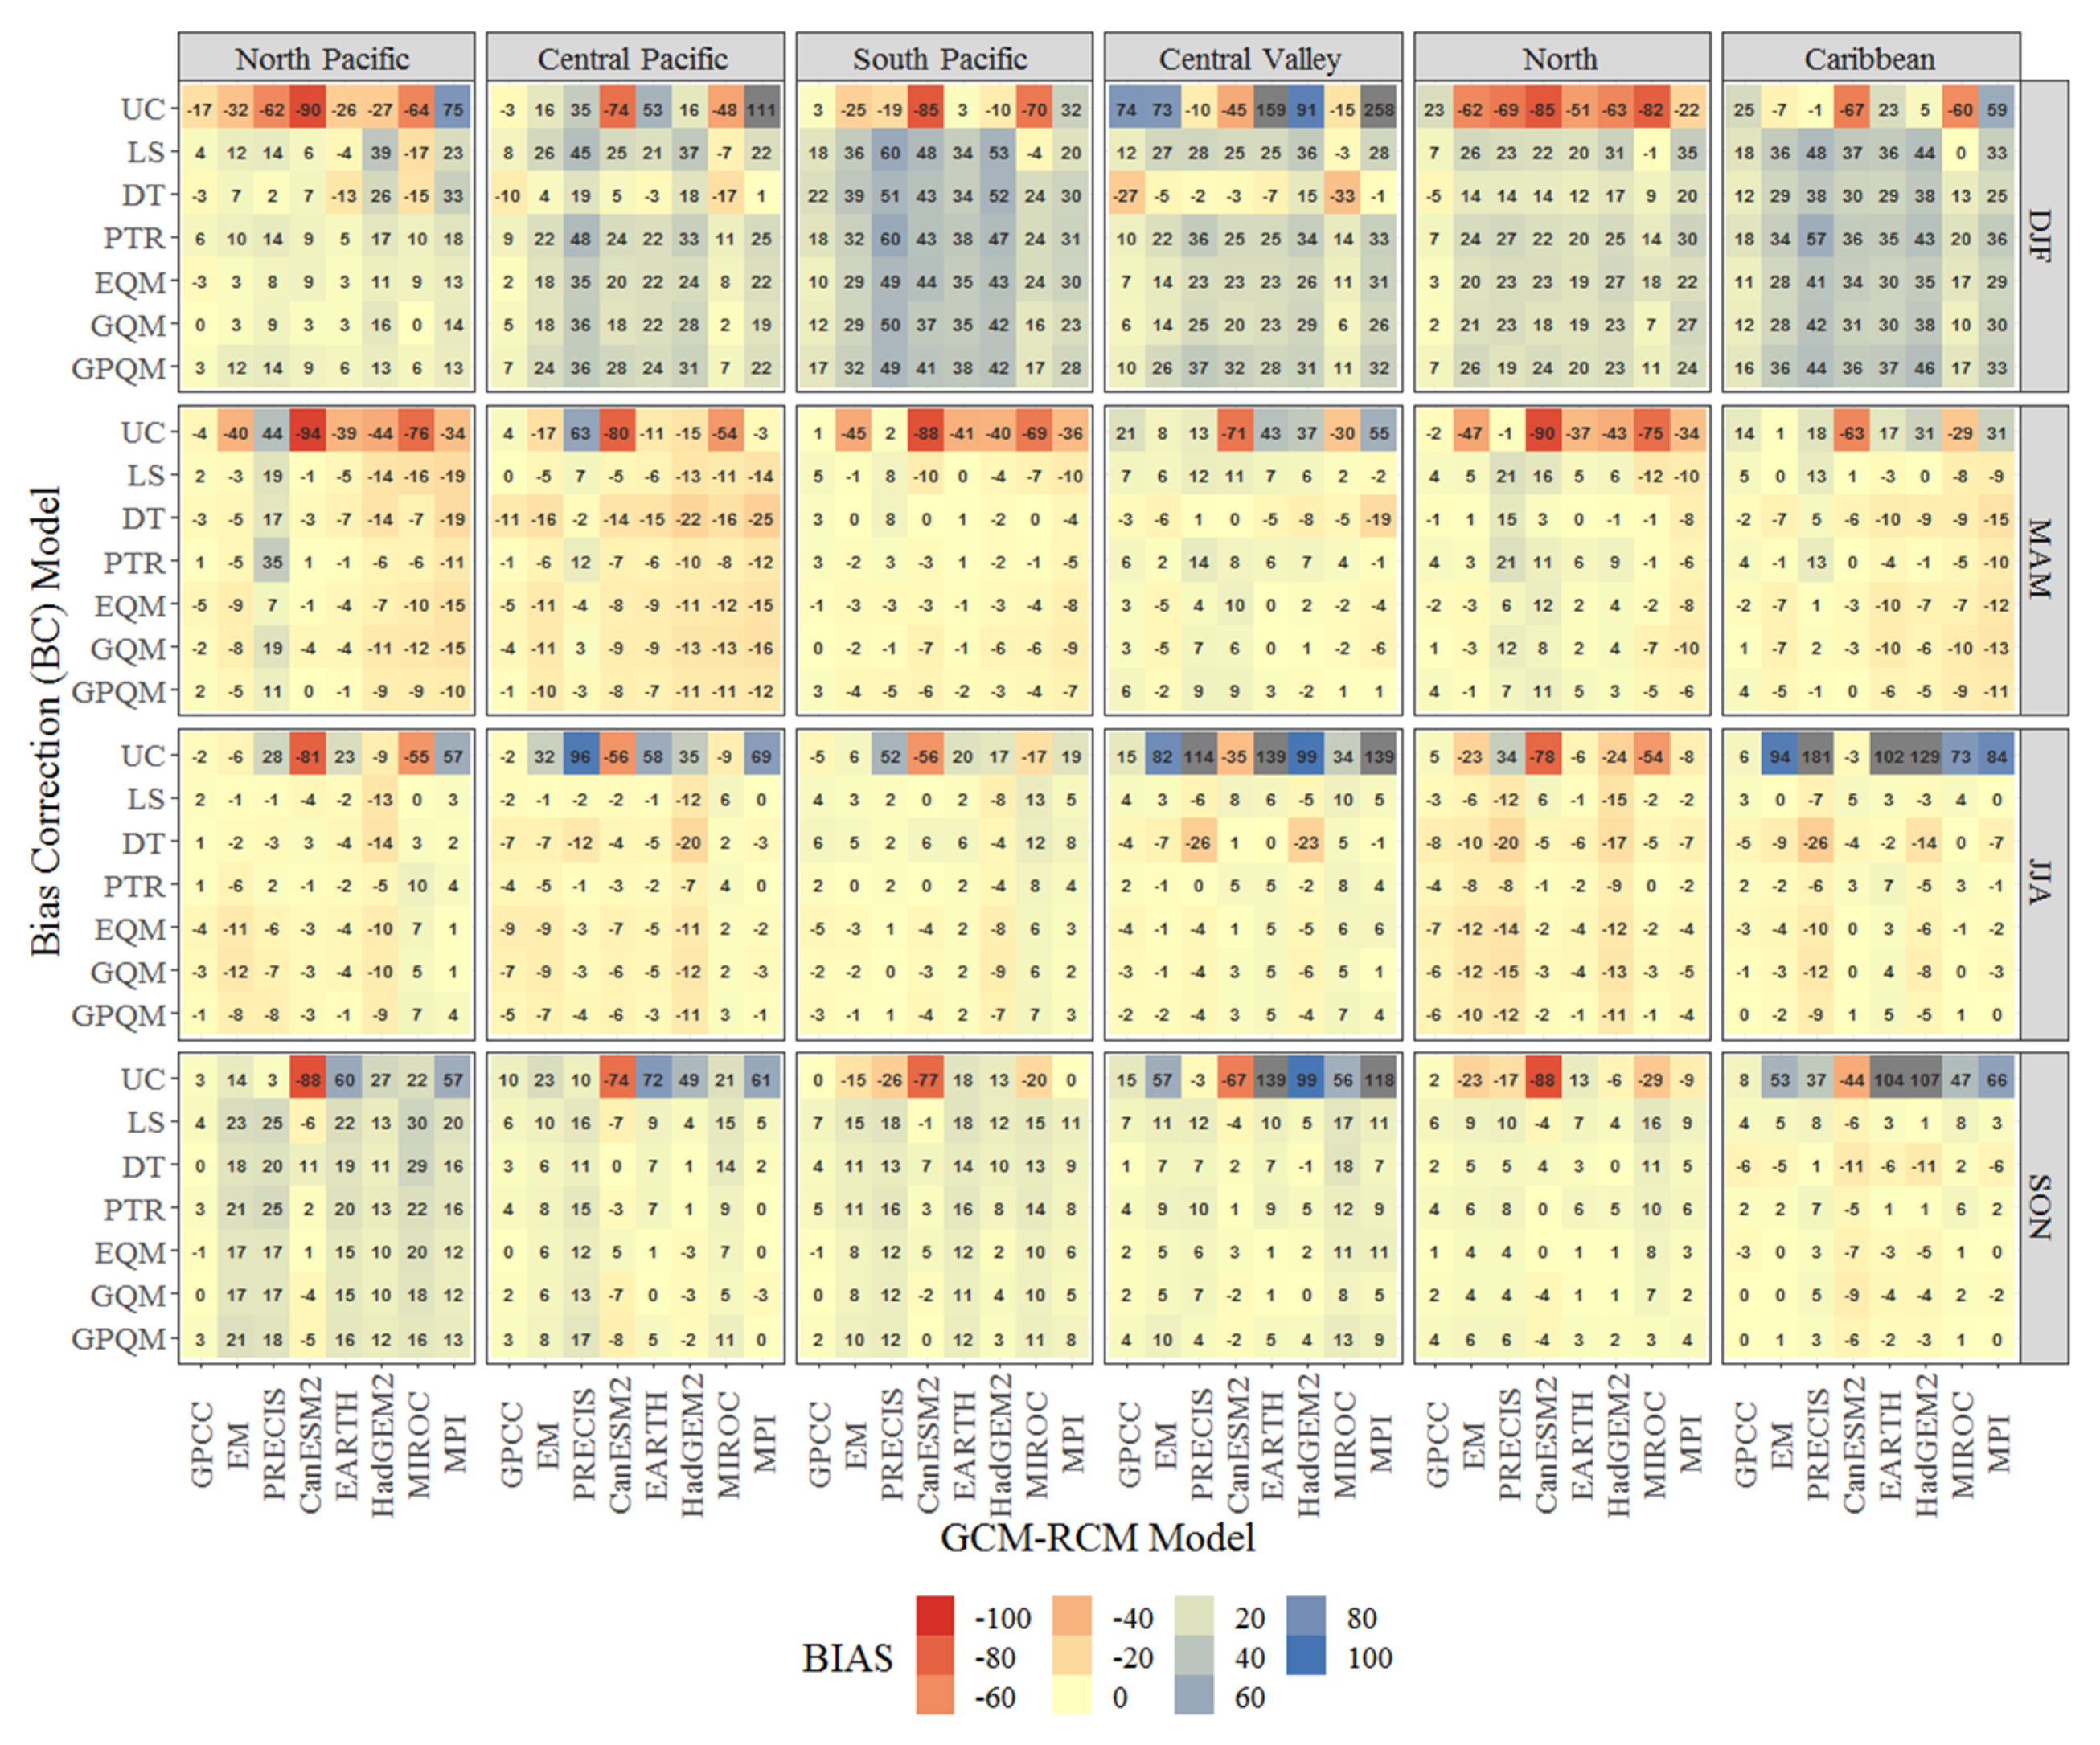
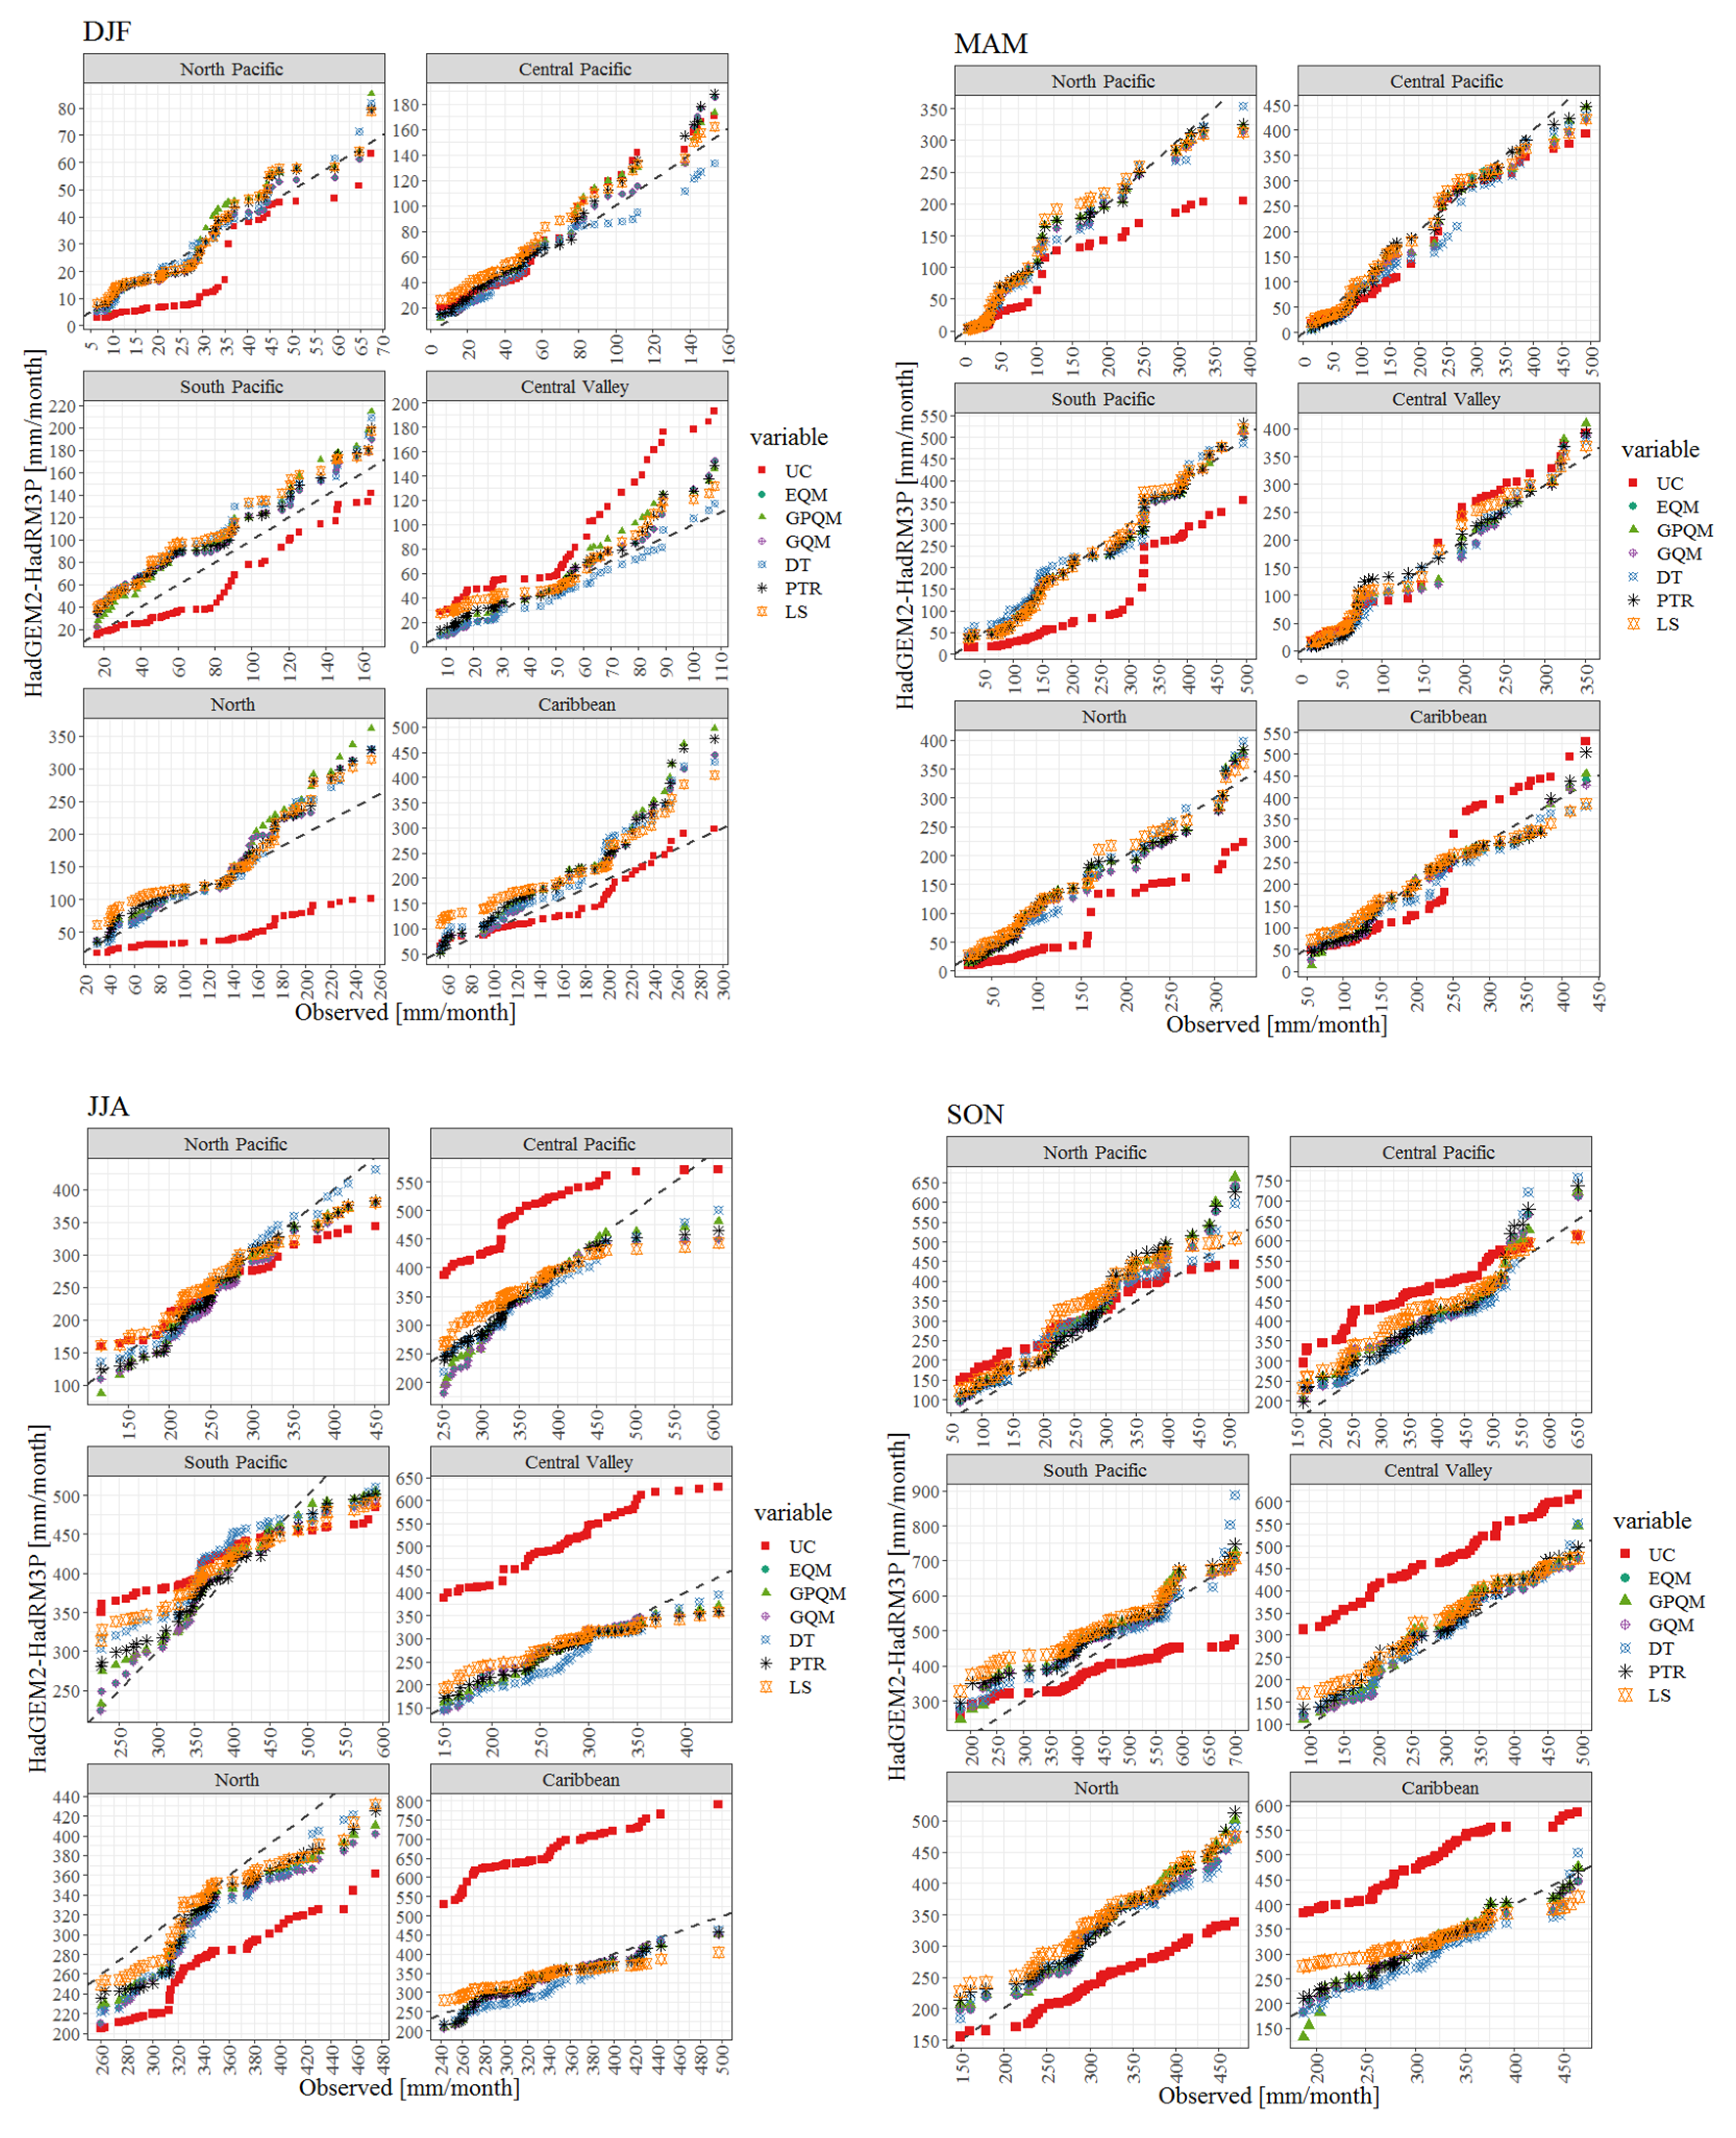
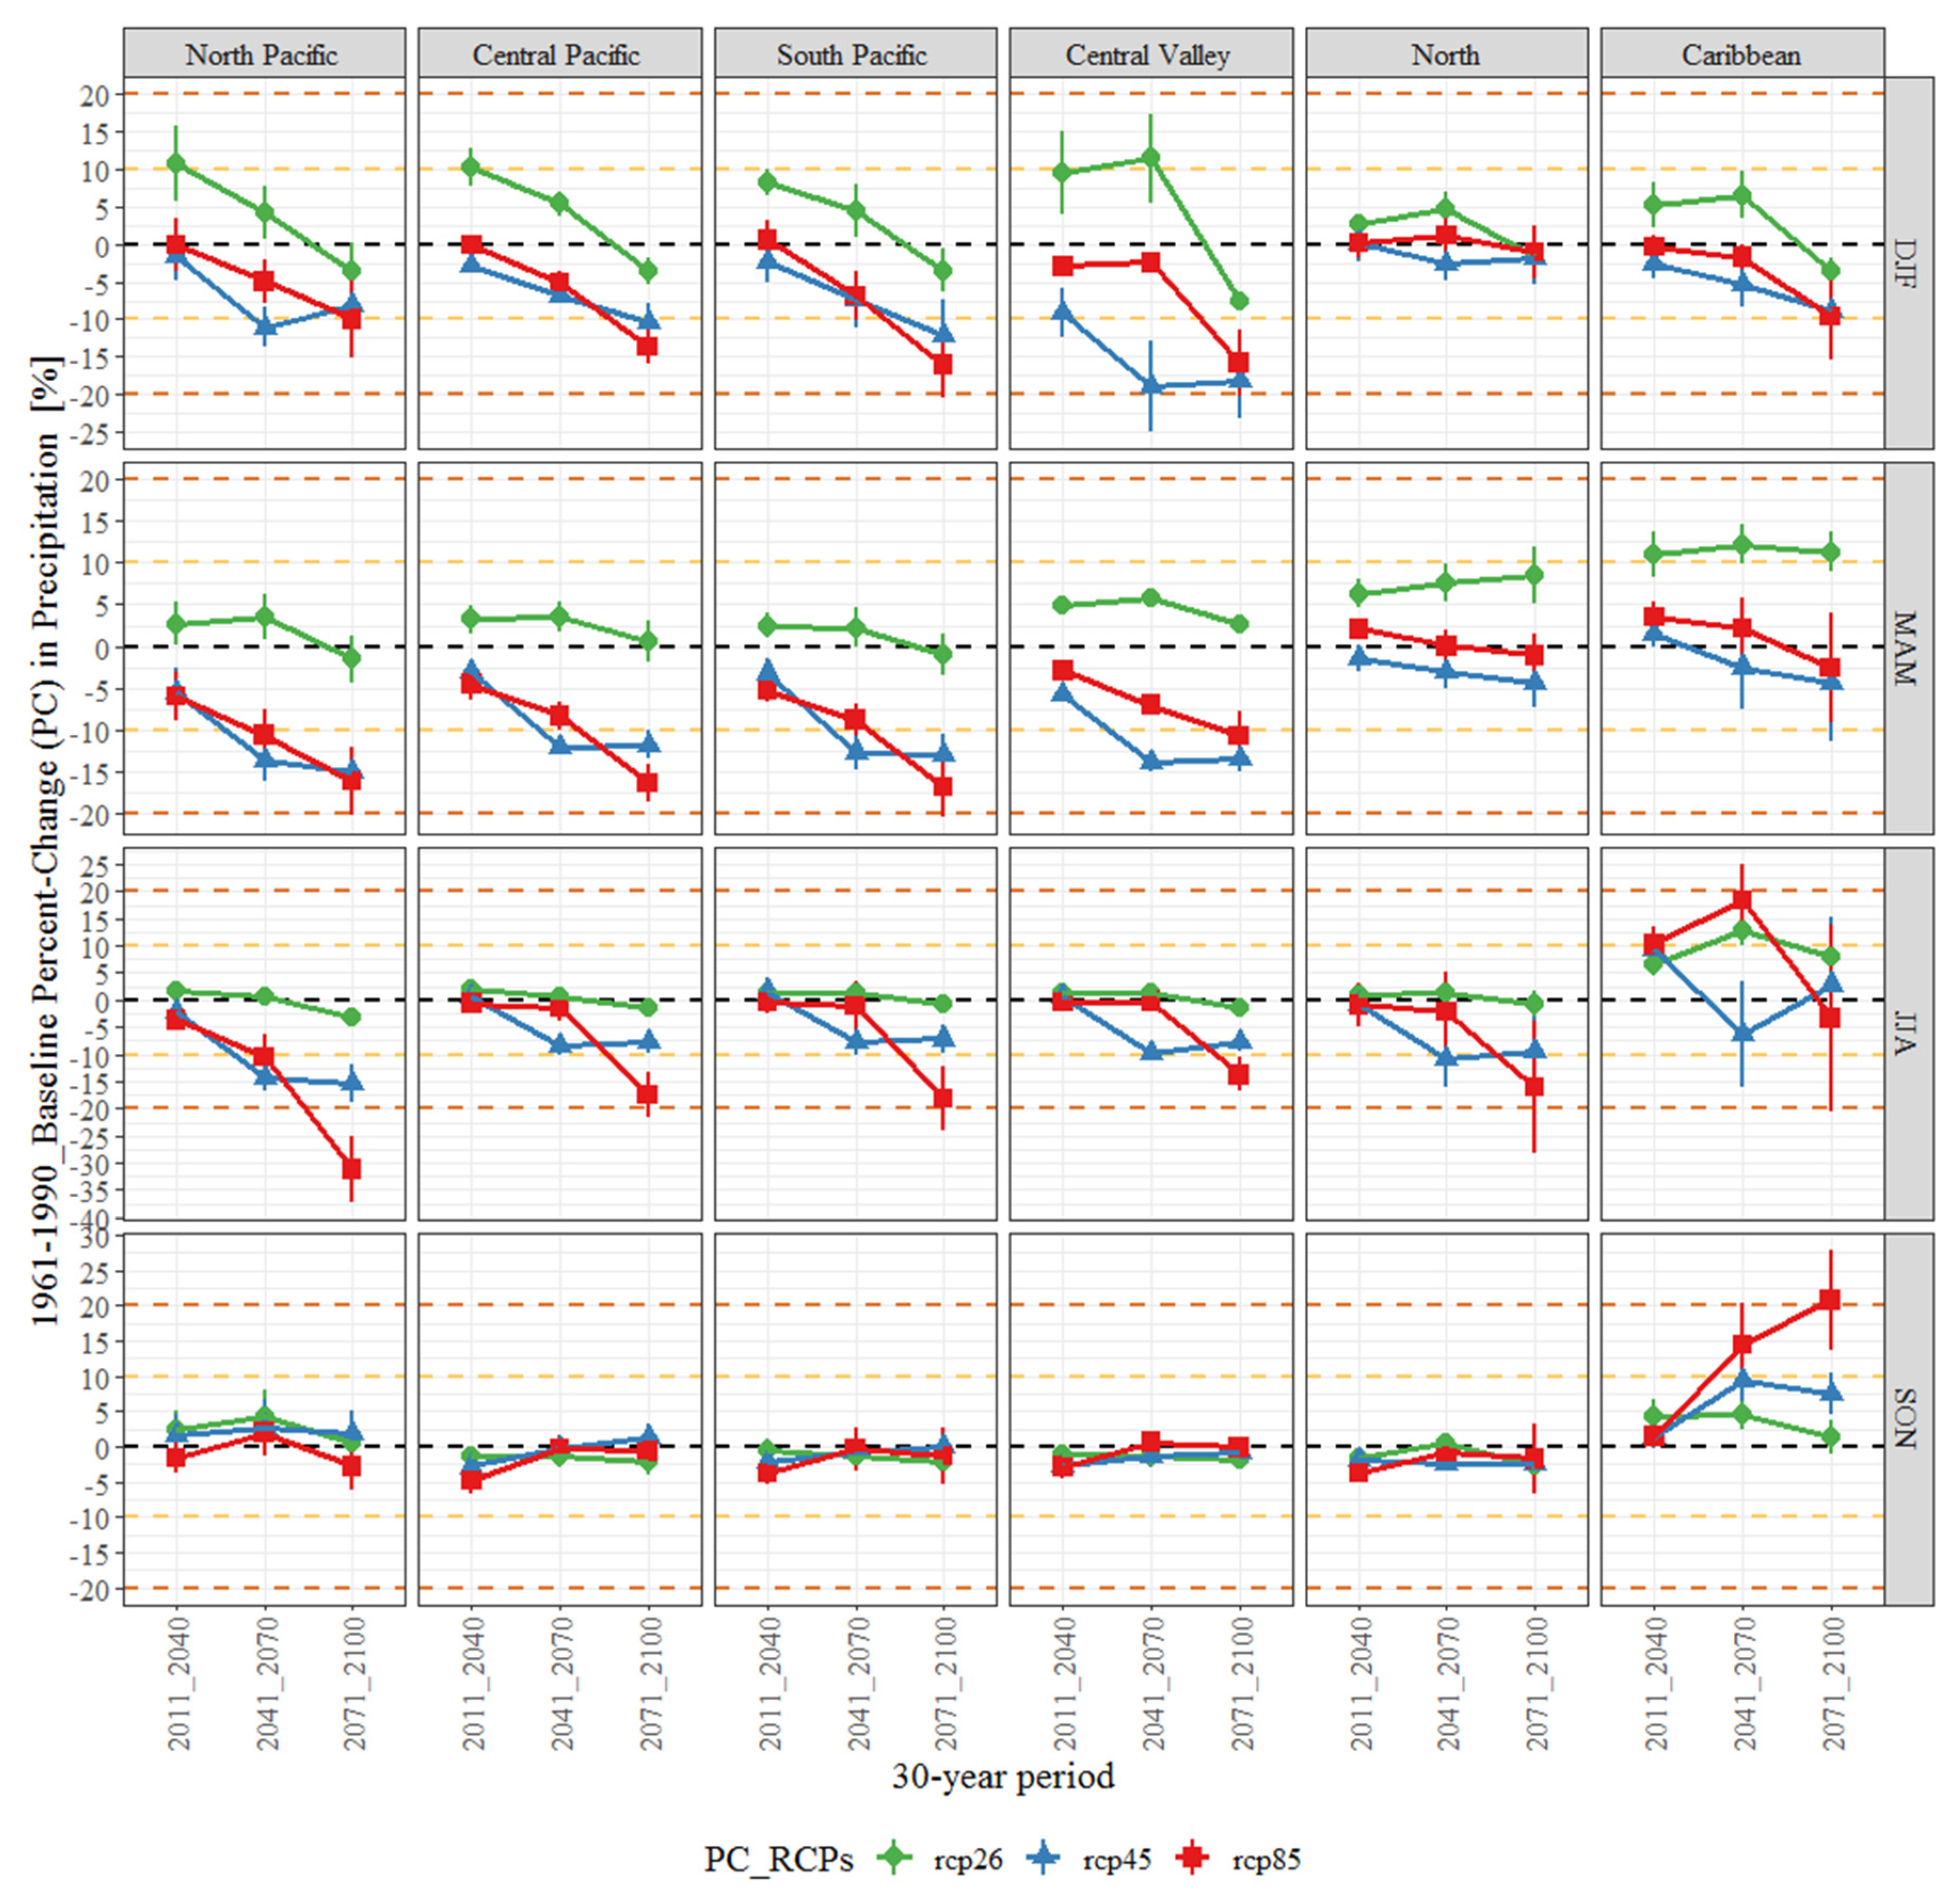
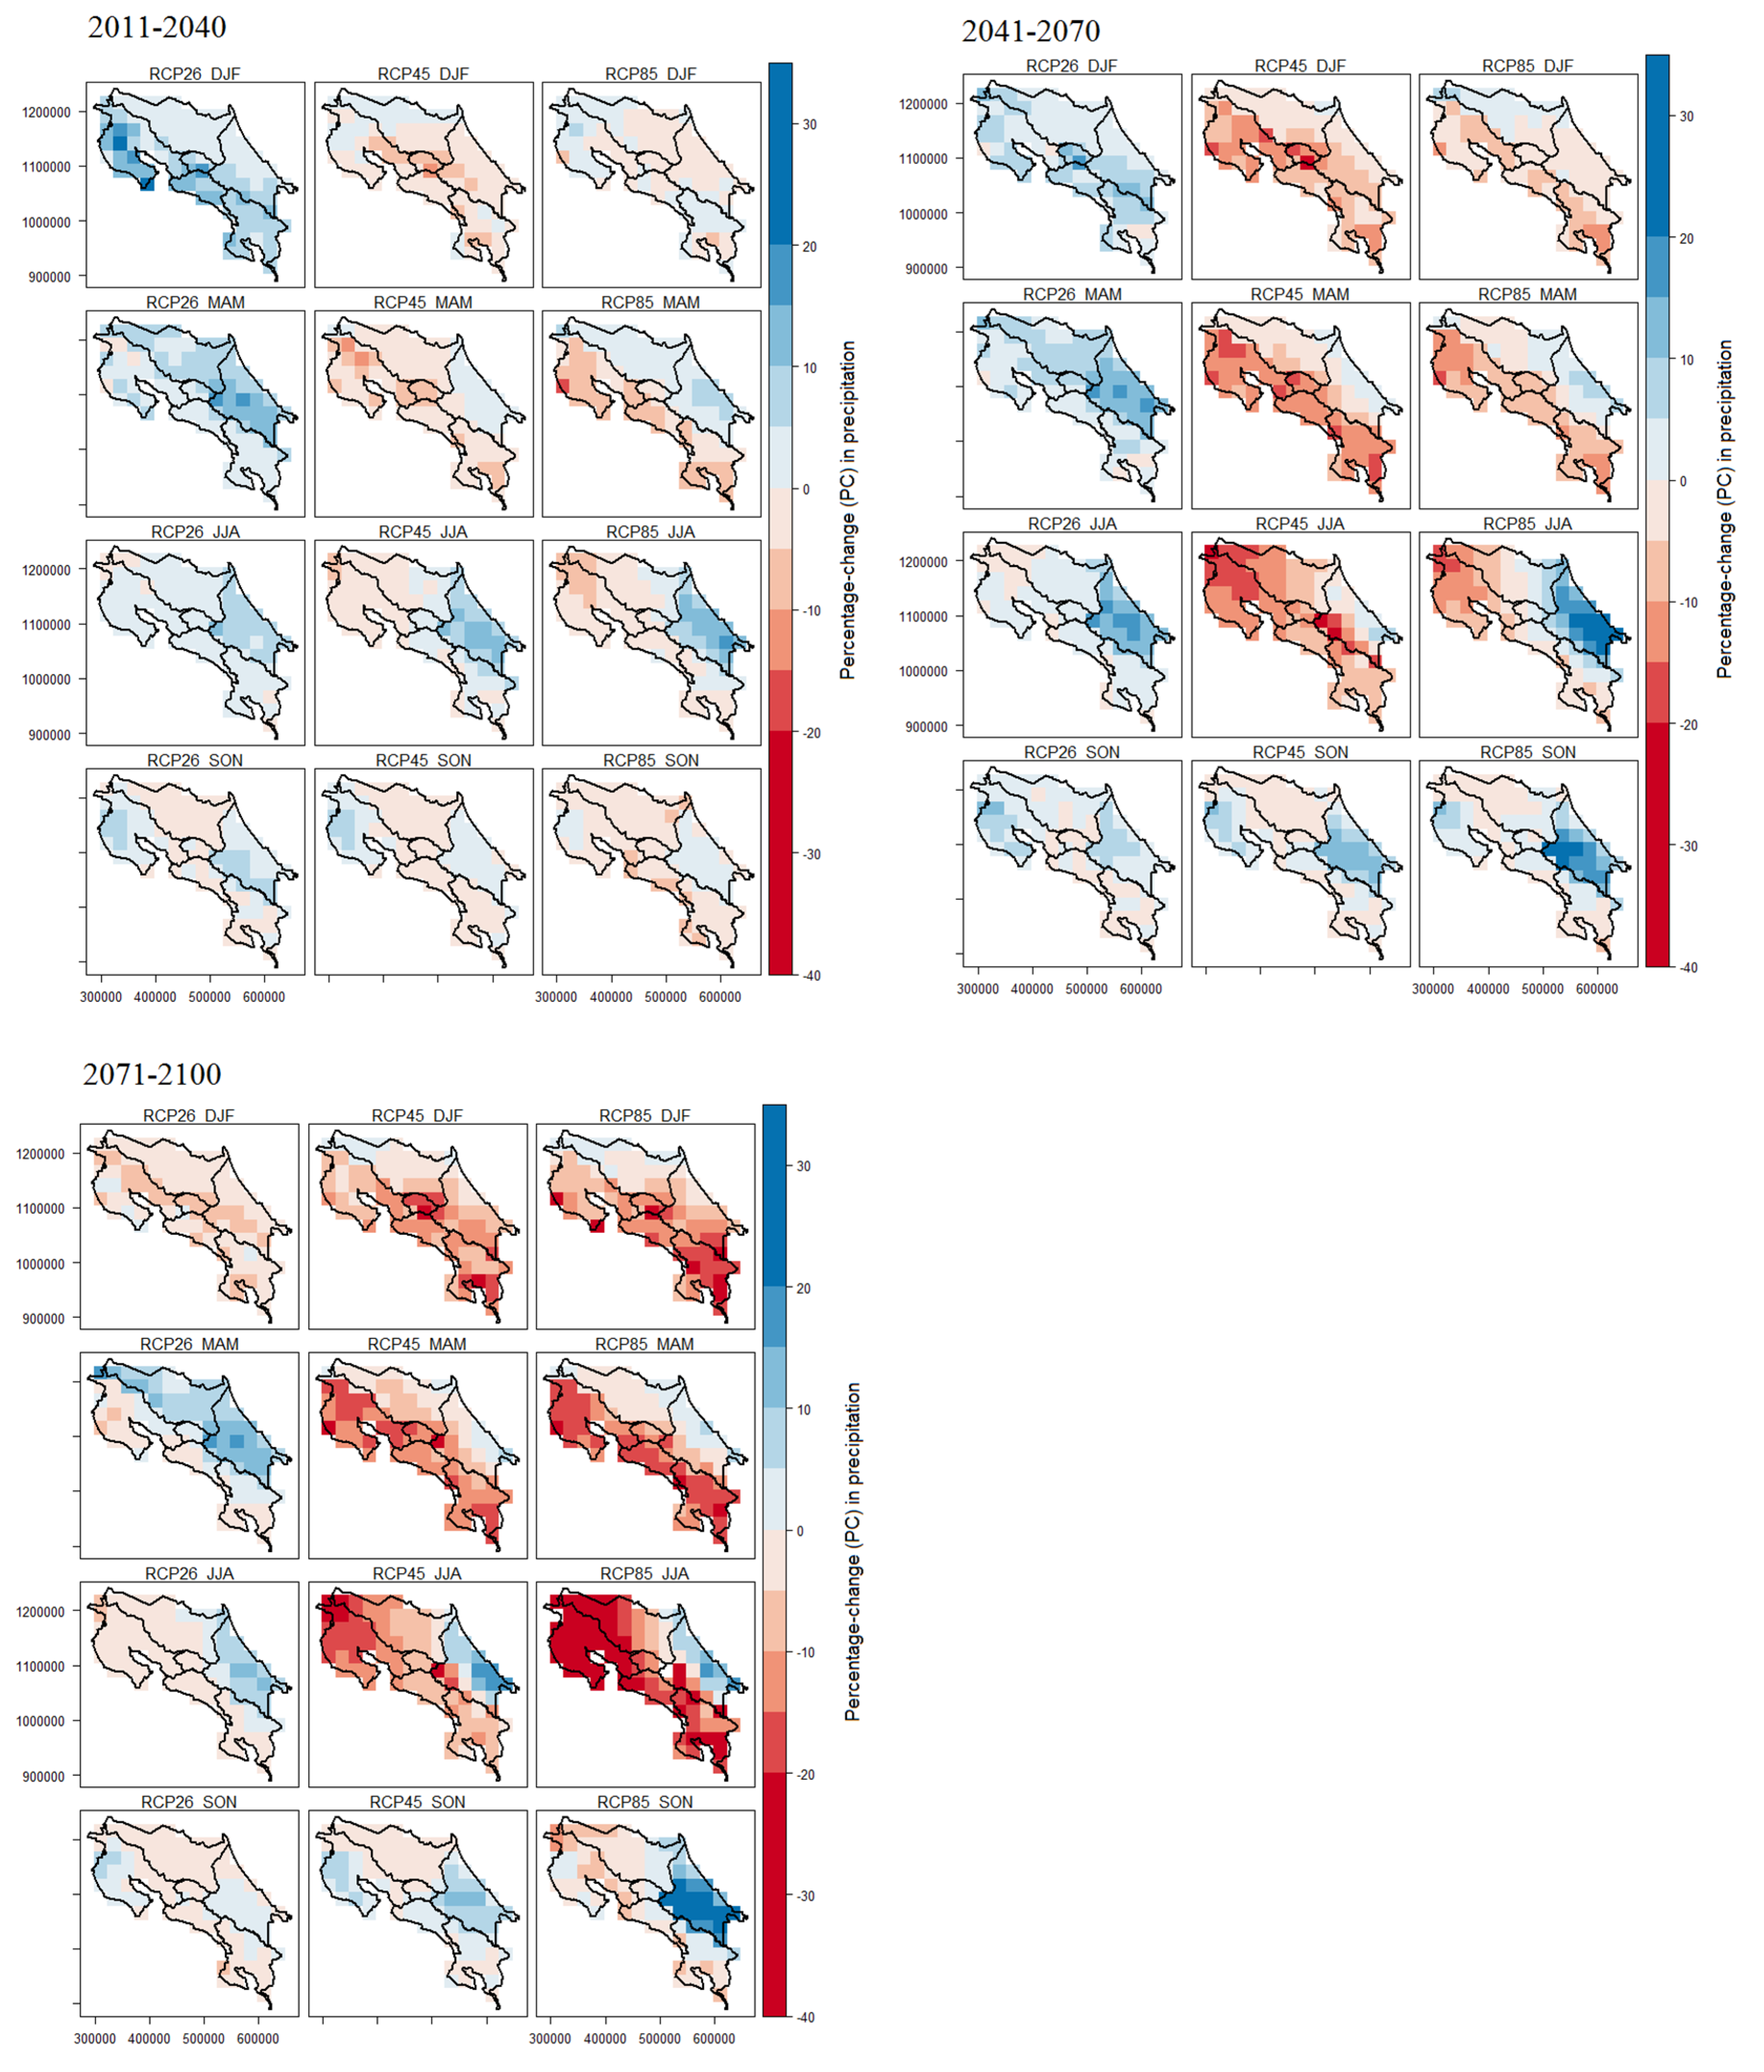
Table 1.
General Circulation Models (GCMs) and Regional Climate Models (RCMs) configuration. Included Representative Concentration Pathways (RCPs) are marked with a X symbol, whereas excluded RCPs are marked with an O symbol.
Table 1.
General Circulation Models (GCMs) and Regional Climate Models (RCMs) configuration. Included Representative Concentration Pathways (RCPs) are marked with a X symbol, whereas excluded RCPs are marked with an O symbol.
| Driving GCM-Model | GCM Model-Center | RCM Model-Center | RCM Resolution | RCP2.6 | RCP 4.5 | RCP 8.5 |
|---|---|---|---|---|---|---|
| PRECIS | Met Office Hadley Centre | HadRM3P Met Office Hadley Centre | 0.22° × 0.22° | X | X | X |
| CanESM2 | Canadian Centre for Climate Modelling and Analysis | RCA4 Swedish (SHMI) | 0.44° × 0.44° | O | O | X |
| EC-EARTH | Irish Centre For High-End Computing | RCA4 Swedish (SHMI) | 0.44° × 0.44° | X | X | X |
| HadGEM2-ES | Met Office Hadley Centre | RCA4 Swedish (SHMI) | 0.44° × 0.44° | X | X | X |
| MIROC5 | Tokyo Center for Climate System Research | RCA4 Swedish (SHMI) | 0.44° × 0.44° | X | O | X |
| MPI-ESM-LR | Max Planck Institute for Meteorology | RCA4 Swedish (SHMI) | 0.44° × 0.44° | X | X | X |
Table 2.
Selection of bias correction methods applied to individual GCM-RCM pairs for future periods over all climatic regions of Costa Rica with respect to baseline (1961–1990).
Table 2.
Selection of bias correction methods applied to individual GCM-RCM pairs for future periods over all climatic regions of Costa Rica with respect to baseline (1961–1990).
| BC-Method/Season | North-Pacific | Central-Pacific | South-Pacific | Central-Valley | North | Caribbean |
|---|---|---|---|---|---|---|
| DJF | EQM | EQM | EQM | DELTA | DELTA | DELTA |
| MAM | EQM | EQM | EQM | EQM | DELTA | DELTA |
| JJA | EQM | EQM | EQM | EQM | EQM | DELTA |
| SON | EQM | EQM | EQM | EQM | EQM | DELTA |
© 2020 by the authors. Licensee MDPI, Basel, Switzerland. This article is an open access article distributed under the terms and conditions of the Creative Commons Attribution (CC BY) license (http://creativecommons.org/licenses/by/4.0/).
Share and Cite
MDPI and ACS Style
Mendez, M.; Maathuis, B.; Hein-Griggs, D.; Alvarado-Gamboa, L.-F. Performance Evaluation of Bias Correction Methods for Climate Change Monthly Precipitation Projections over Costa Rica. Water 2020, 12, 482. https://doi.org/10.3390/w12020482
AMA Style
Mendez M, Maathuis B, Hein-Griggs D, Alvarado-Gamboa L-F. Performance Evaluation of Bias Correction Methods for Climate Change Monthly Precipitation Projections over Costa Rica. Water. 2020; 12(2):482. https://doi.org/10.3390/w12020482
Chicago/Turabian StyleMendez, Maikel, Ben Maathuis, David Hein-Griggs, and Luis-Fernando Alvarado-Gamboa. 2020. "Performance Evaluation of Bias Correction Methods for Climate Change Monthly Precipitation Projections over Costa Rica" Water 12, no. 2: 482. https://doi.org/10.3390/w12020482
Note that from the first issue of 2016, this journal uses article numbers instead of page numbers. See further details here.