Article

Assessment Framework for Natural Groundwater Contamination in Arid Regions: Development of Indices and Wells Ranking System Using Fuzzy VIKOR Method

by
Husnain Haider
1,
Abdul Razzaq Ghumman
1,*,
Ibrahim Saleh Al-Salamah
1 and
Hussein Thabit
2
1
Department of Civil Engineering, College of Engineering, Qassim University, Buraydah, AlQassim 51452, Saudi Arabia
2
Graduate Student, Department of Civil Engineering, College of Engineering, Qassim University, Buraydah, AlQassim 51452, Saudi Arabia
*
Author to whom correspondence should be addressed.
Water 2020, 12(2), 423; https://doi.org/10.3390/w12020423
Submission received: 8 January 2020 / Revised: 29 January 2020 / Accepted: 31 January 2020 / Published: 5 February 2020
(This article belongs to the Section Water Quality and Contamination)

Abstract

:
Limited groundwater resources in arid regions have been found polluted for drinking purpose due to the presence of natural minerals and radioactive substances, in the sub-soils, higher than the drinking water quality standards. Municipalities in these regions are spending extensive resources to transport (from well fields) and treat this raw water to provide safe water to the community. Regular monitoring of various physical, chemical, and radioactive water quality parameters (WQPs) in raw water generates large datasets, which makes it difficult to come up with convenient findings for both the decision-makers and general public. A hierarchical water quality assessment framework develops three sub-indices, an overall water quality index, and a system for ranking of groundwater wells. Fuzzy analytical hierarchy process (fuzzy-AHP) establishes the importance weights of different WQPs and the sub-indices based on their impacts on human health, treatment processes, distribution system infrastructure, and irrigation applications. Fuzzy VIekriterijumsko KOmpromisno Rangiranje (fuzzy-VIKOR) method aggregates the WQPs’ performance for each well and ranks all the wells in a well field based on their overall pollution levels, i.e., remoteness from the applicable standards. For evaluating the pragmatism of the framework, data of 11 WQPs were obtained for 39 wells operating in three different well fields located along the boundaries and the central part of Buraydah, Qassim, Saudi Arabia. Spatial water quality maps showing physical, chemical, radioactive, and overall water quality assessment results revealed that the oldest well field located in the middle of the city outperforms the other two more recently developed well fields with lesser anthropogenic activities in their catchments. These findings testify that the primary source of contamination in deep aquifers is the natural sub-soil condition. The water quality indices will be useful to demonstrate the current situation of groundwater quality in Qassim Region and will facilitate the decision-makers for defining the intended uses of raw water sources (i.e., drinking, unrestricted irrigation, and restricted irrigation) and rehabilitation and renewal planning of the groundwater wells. The framework is applicable in the Kingdom of Saudi Arabia (KSA), Gulf Region, and elsewhere for groundwater quality assessment with desired modifications.

1. Introduction

Climate change, agricultural withdrawals, and increasing municipal demands have led to a situation of water scarcity in the Kingdom of Saudi Arabia (KSA) and other Gulf countries. According to the map developed by the World Resource Institute, KSA lies in the list of extremely high water stressed countries based on ratio of withdrawals to the renewable supply of water (i.e., 80%) [1]. In addition to quantity, limited groundwater resources in the country have been found polluted (for drinking purposes) due to the presence of high levels of natural compounds in the confined (deep) aquifers [2], while unconfined (shallow) aquifers have been affected by the anthropogenic activates, such as land disposal of wastewater and agricultural runoffs [3]. Past studies reported higher concentrations of various water quality parameters (WQPs) than the drinking water quality standards (DWQS), such as total dissolved solids (TDS), iron (Fe), and radionuclides, in different parts of KSA, including Qassim region [1,2,3,4,5,6].
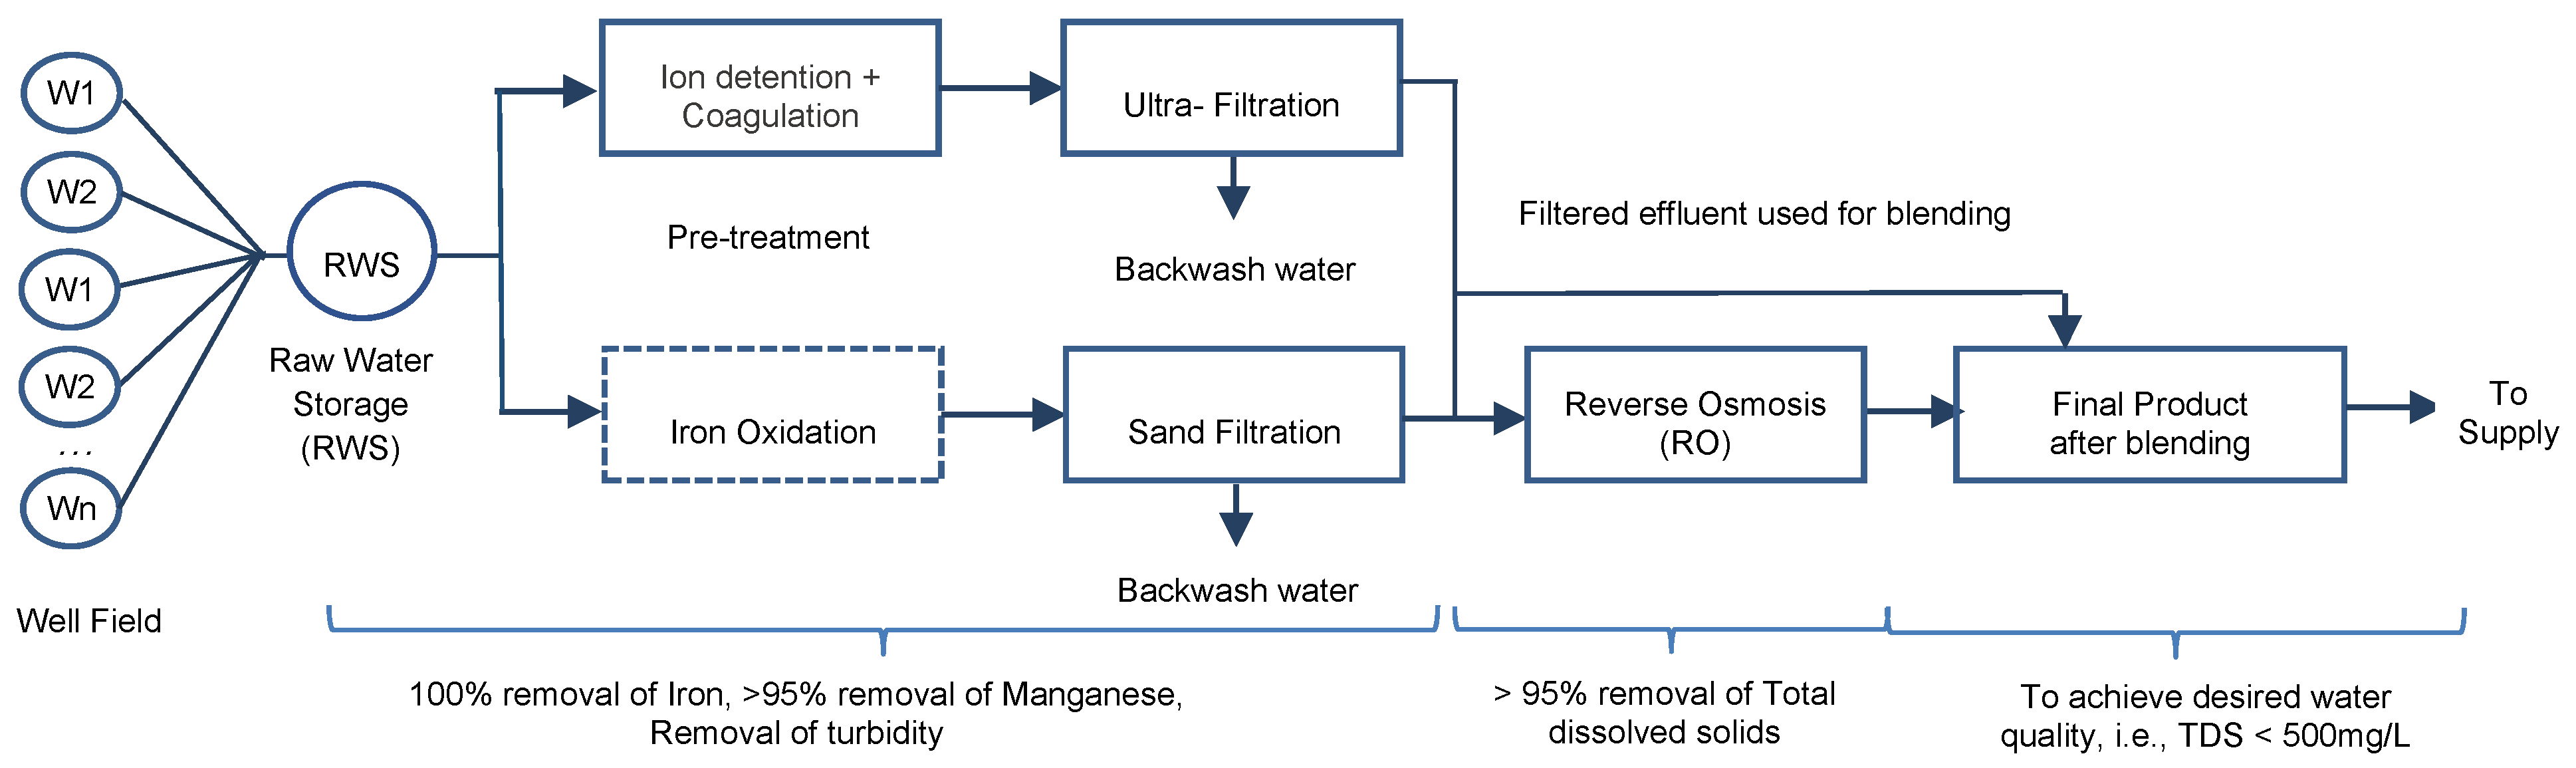
The top priority objective of the Water Directorate in KSA is to provide safe water to the community. Consequently, regular monitoring of raw water quality is mandatory to protect the public health and operate the treatment facilities at their highest efficiency. Raw water transmitted from the well fields (WF) is treated through several treatment processes, where each treatment process is designed to treat a maximum level of a given pollutant. In addition to the health impacts, very high concentrations of different WQPs may affect the efficiency of the treatment processes [7]. However, there are numerous circumstances when raw groundwater is being used for agricultural and domestic uses in Qassim Region, such as private wells, fuel stations along highways, parks, and some mosques outside the boundaries of cities. Hence, knowing the overall state of raw water quality is essential for both the public and decision-makers working in concerned organizations.
For large-sized urban water supply systems, the groundwater source is essentially a well field (WF) drawing water through multiple wells. The collected water is then conveyed through large transmission main to the water treatment facility. Deep confined aquifers are generally free from microbial contamination; however, physical, chemical, and radioactive WQPs need to be regularly monitored. As a result, large datasets originate, which are difficult to evaluate and to come up with useful insights. A robust water quality index (WQI) can develop the spatial maps and rank the wells in a well field to facilitate the decision-makers (municipality managers, field engineers) and can inform the general public on the state of natural water resources in their regions. The same indices with appropriate performance levels can simultaneously help in defining the water quality for more than one use, e.g., drinking, unrestricted irrigation (URI), and restricted irrigation (RI). Nevertheless, the indices should be able to incorporate uncertainties due to monitoring inaccuracies, variations in DWQS and health-based guidelines, and subjectivity in expert opinion to linguistically define the resultant water quality.
In an old study conducted (in 1996) on assessment of water quality in Saq aquifer, Sharaf and Hussein [8] found the range of TDS from less than 500 to higher than 3500 mg/L in Qassim region, based on samples of well water. According to their study, the main water type in this region is Na-Ca-Cl-SO4. They reported high salt concentration and designated the water quality from “fair” to rarely “poor” in Qassim region in comparison with Tabuk and Hail regions. Soil characteristics and agricultural activities were mentioned as the main sources of pollution in the region.
In some studies, efforts were made to develop water quality indices by aggregating various physico-chemical water quality parameters in KSA. Mohammad et al. [9] developed a WQI, without considering the inherent uncertainties in the data, for 12 groundwater and desalination points in Riyadh, KSA. They developed the WQI, for drinking water quality assessment, based on temperature and dissolved oxygen variations at the sampling points instead of the values of 15 other physico-chemical WQPs measured. Aly et al. [10] and Al-Omran et al. [11] also employed simple weighted sum method (WSM) to aggregate various parameters for developing the WQI to check the suitability of ground water for domestic use in Hafar Albatin and Riyadh, KSA. The above-stated uncertainties were not considered in these studies.
Other studies accommodated the uncertainties by using fuzzy logic in the development of groundwater quality index. Although a detailed review cannot be included in this text, a brief summary of some recent and relevant works has been outlined in Table 1. Most of the studies on development of fuzzy-based WQIs were carried out in India and Iran using fuzzy interference (or rule-based) systems. One of the possible reasons could be their primary reliance on groundwater in comparison with developed countries where treated surface water in mostly used for municipal water supplies. For example, surface water accounts for 74% of all water withdrawals in USA [12].
In the development of a water quality index, there are certain challenges which the fuzzy inference system (FIS) approach does not handle. Although FIS is simple to use after the inclusion of fuzzy logic toolbox in MATLAB, it does not precisely compare the monitored concentration of a WQP with its applicable standard value, as one of the membership functions is actually containing the standard somewhere in its range. Consider a situation when two or more samples have much lower concentrations of one or more WQPs than the standards while the rest are higher (with varying degrees) than the standards, here the minimum pollution level (e.g., “very low”) will be defined for values equal to or less than DWQS. Now, all the samples with parameters values less than DWQS will achieve the same result, i.e., “very low” pollution. The same is true for other performance levels, e.g., “low”, “medium”, and “very high”. This problem is more highlighted while ranking the alternatives with the same linguistic outcomes, e.g., two, three, or more samples with “medium” water quality. Allocating equal weights to all the parameters is another limitation in FIS; particularly for defining higher pollution levels when the higher concentration of a less important parameter (for instance, chlorides) also results in the same index which is otherwise expected to be due to the violation of more important WQPs, such as Iron. It can also be noticed in the Table 1 that most of the studies evaluated the water quality using a combined WQI; sub-indices can provide more insights on water quality and facilitate in decision-making for well ranking and infrastructure assets management (see results and discussions section for details).
Recently, Haider et al. [1] developed a water quality index using fuzzy analytical hierarchy process (fuzzy-AHP) for weight estimation and fuzzy technique for order of preference by similarity to ideal solution (TOPSIS) for parameter aggregation for the city of Buraydah. The main limitation of their study is that only three WQPs (i.e., radium, iron, and total dissolved solids) were used due to data limitations at the time of study. A total of 24 wells were ranked, based on WQI ranging from “very low” to “very high”. Finally, based on the average values, an overall water quality index was developed. However, this WQI does not represent the overall situation of physical (e.g., turbidity and electrical conductivity), chemical (e.g., pH and hardness), and radioactive water quality in the groundwater. In their study, the water quality of a well was compared with the best and the worst water quality in the available data. Whereas the best alternative could itself be not the best performer, similarly the worst might also have few parameters which meet the DWQS. Such limitation can be resolved by considering many WQPs, WQIs, and using an approach in which the wells water quality is compared with the alternative having absolute best and worst water quality. Moreover, they [
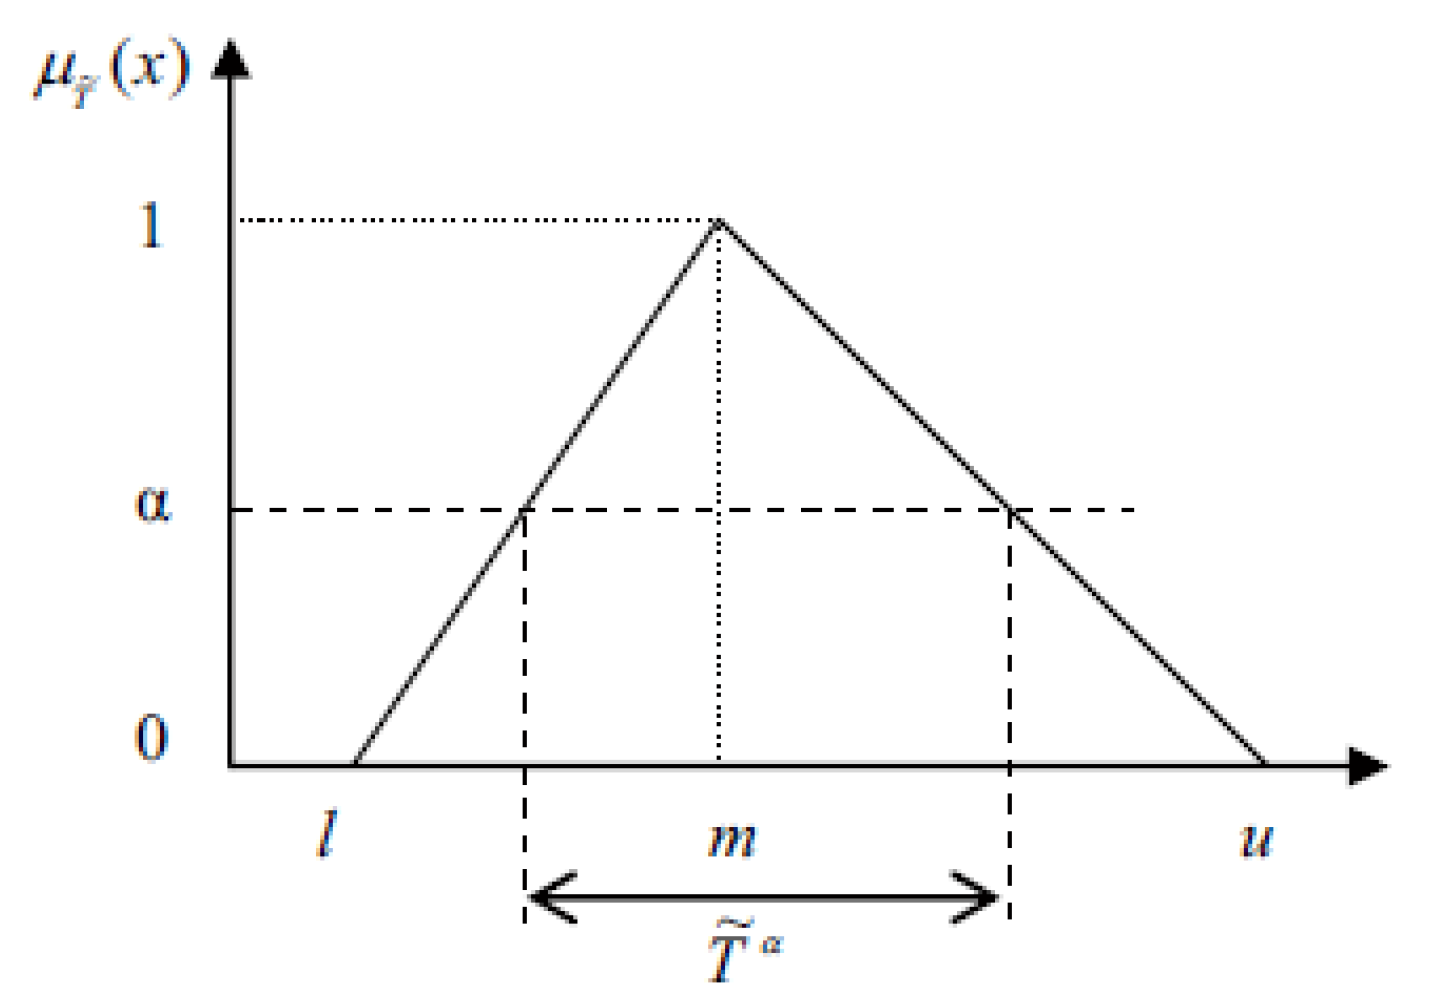
1] used simple fuzzy-AHP method for weight estimation, which does not account for the uncertainties that lie in the fuzzy range selected by the decision-makers. The α-cut-based fuzzy-AHP accounts for these challenges and gives more precise weights for the criteria. Application of fuzzy-AHP and fuzzy VIekriterijumsko KOmpromisno Rangiranje (fuzzy-VIKOR) methods can resolve the above-stated limitations in the existing WQI with the help of fuzzy triangular functions corresponding to different concentrations of WQPs in each well.
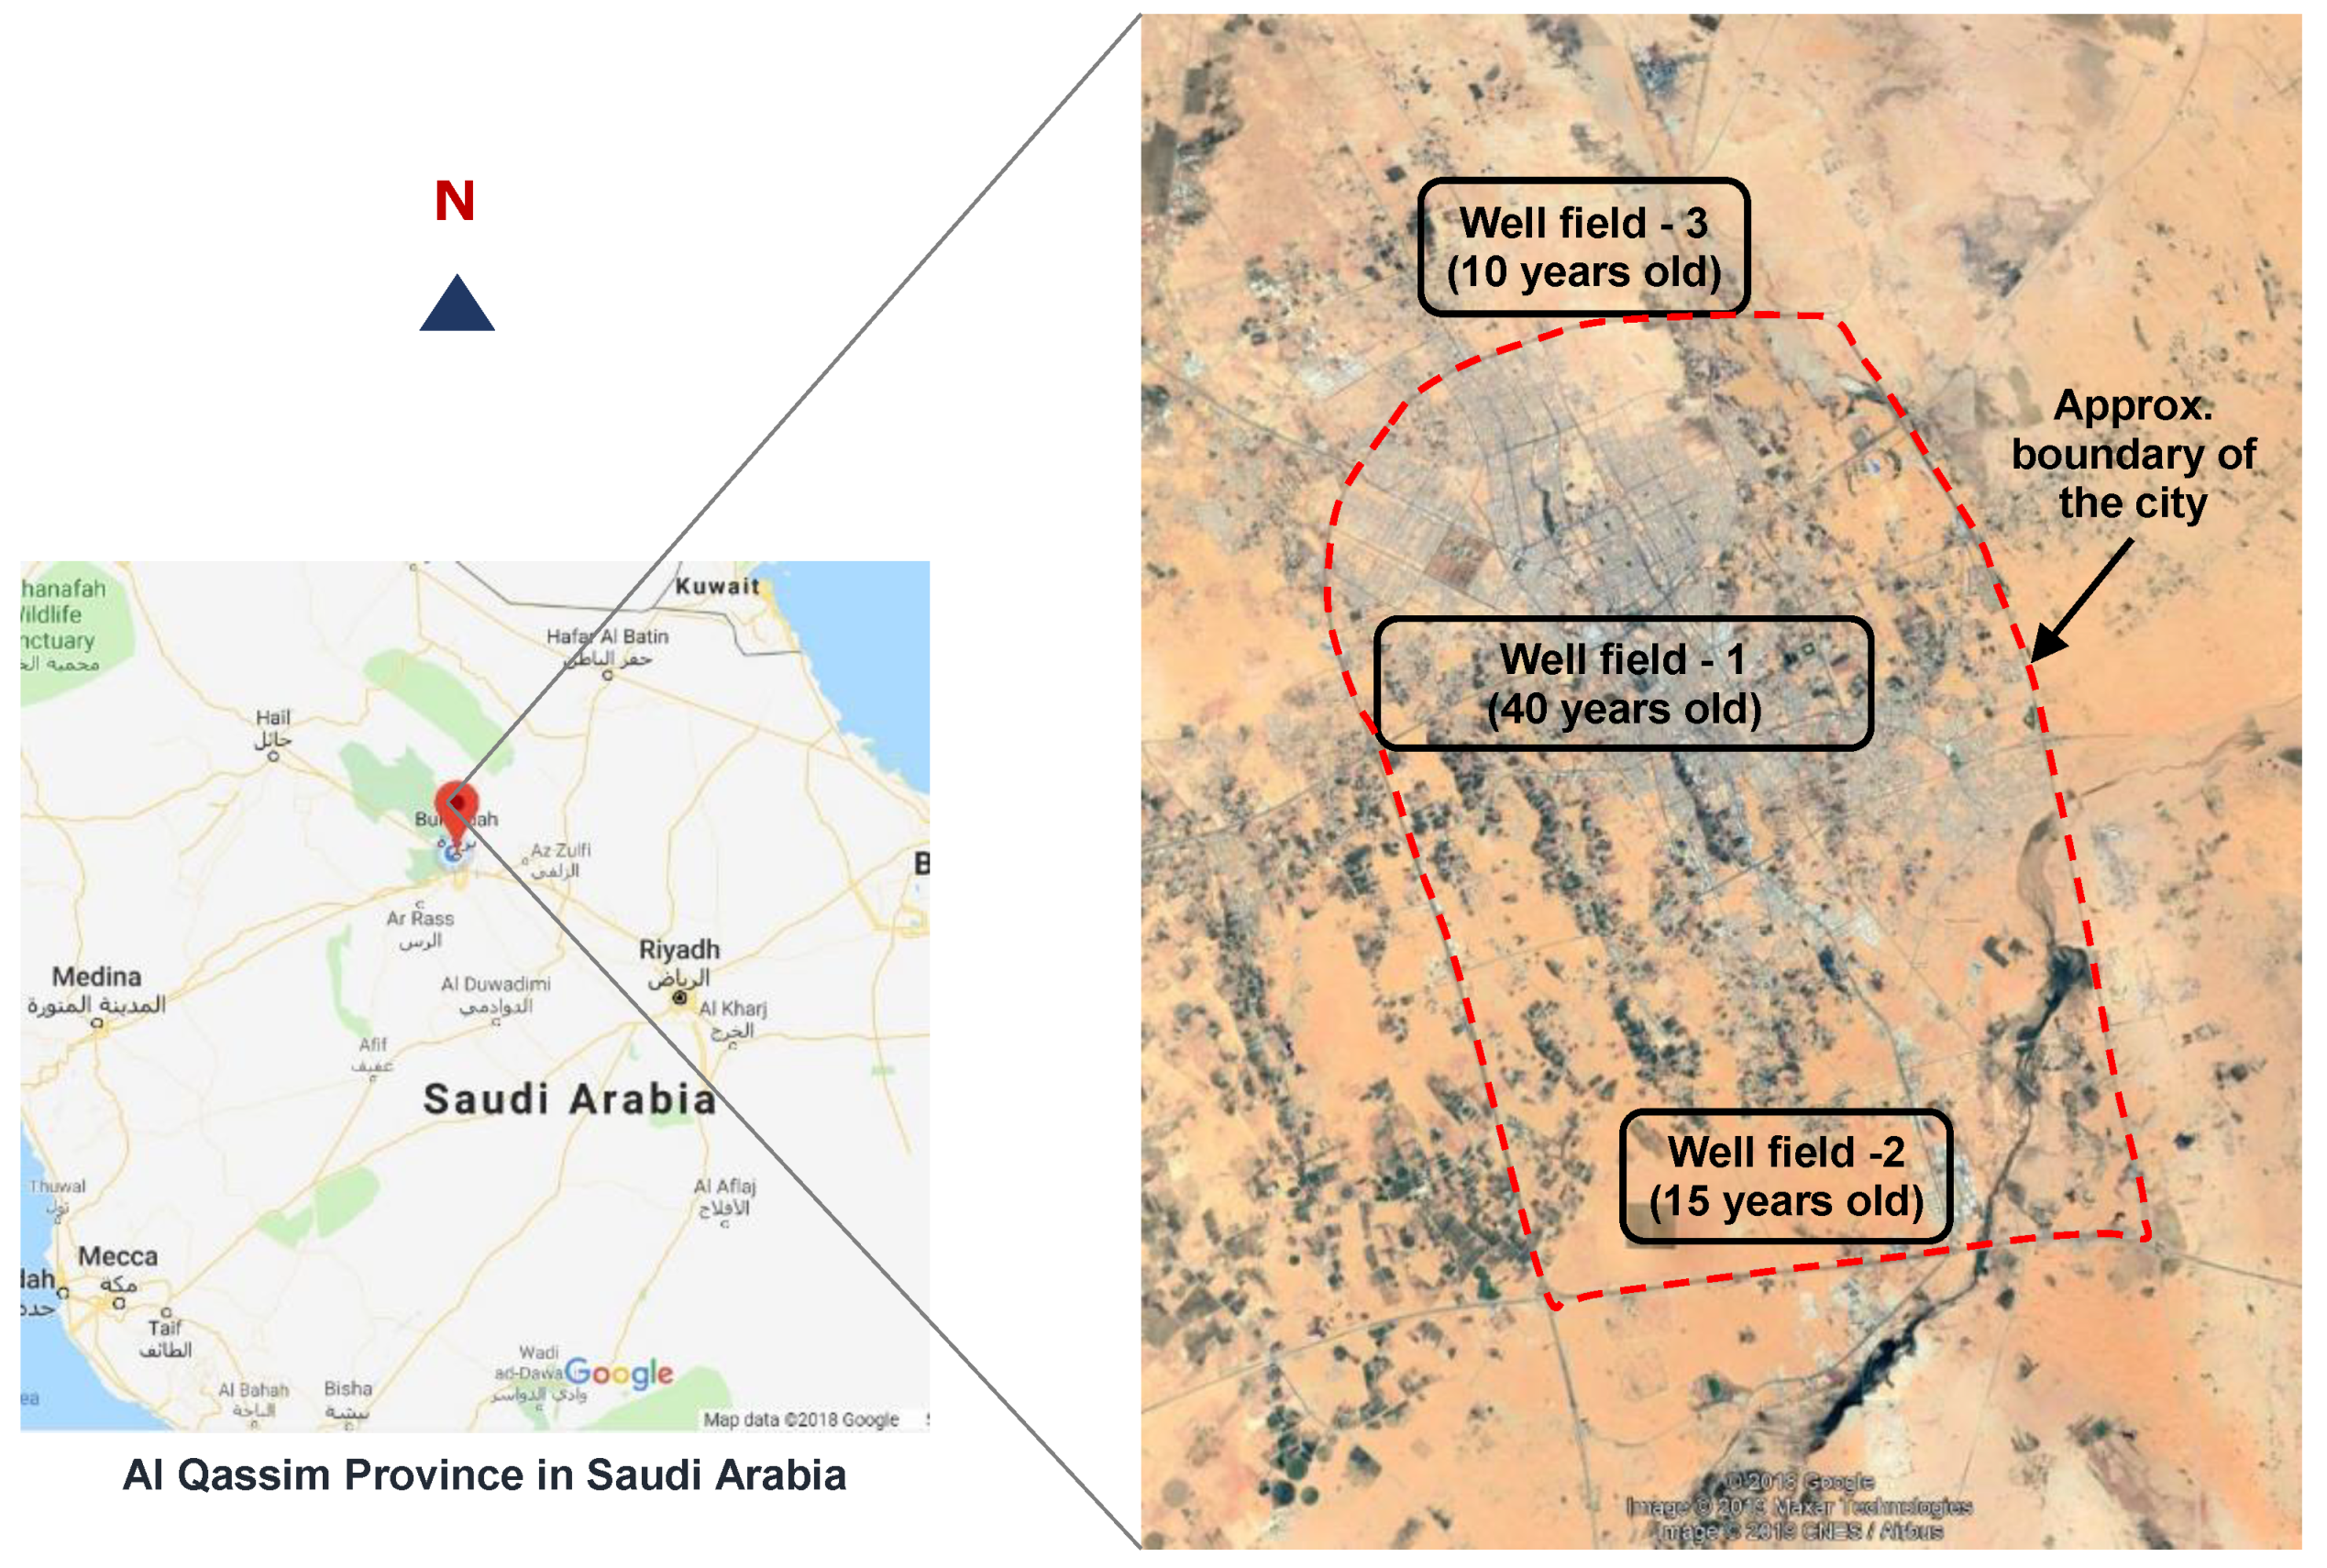
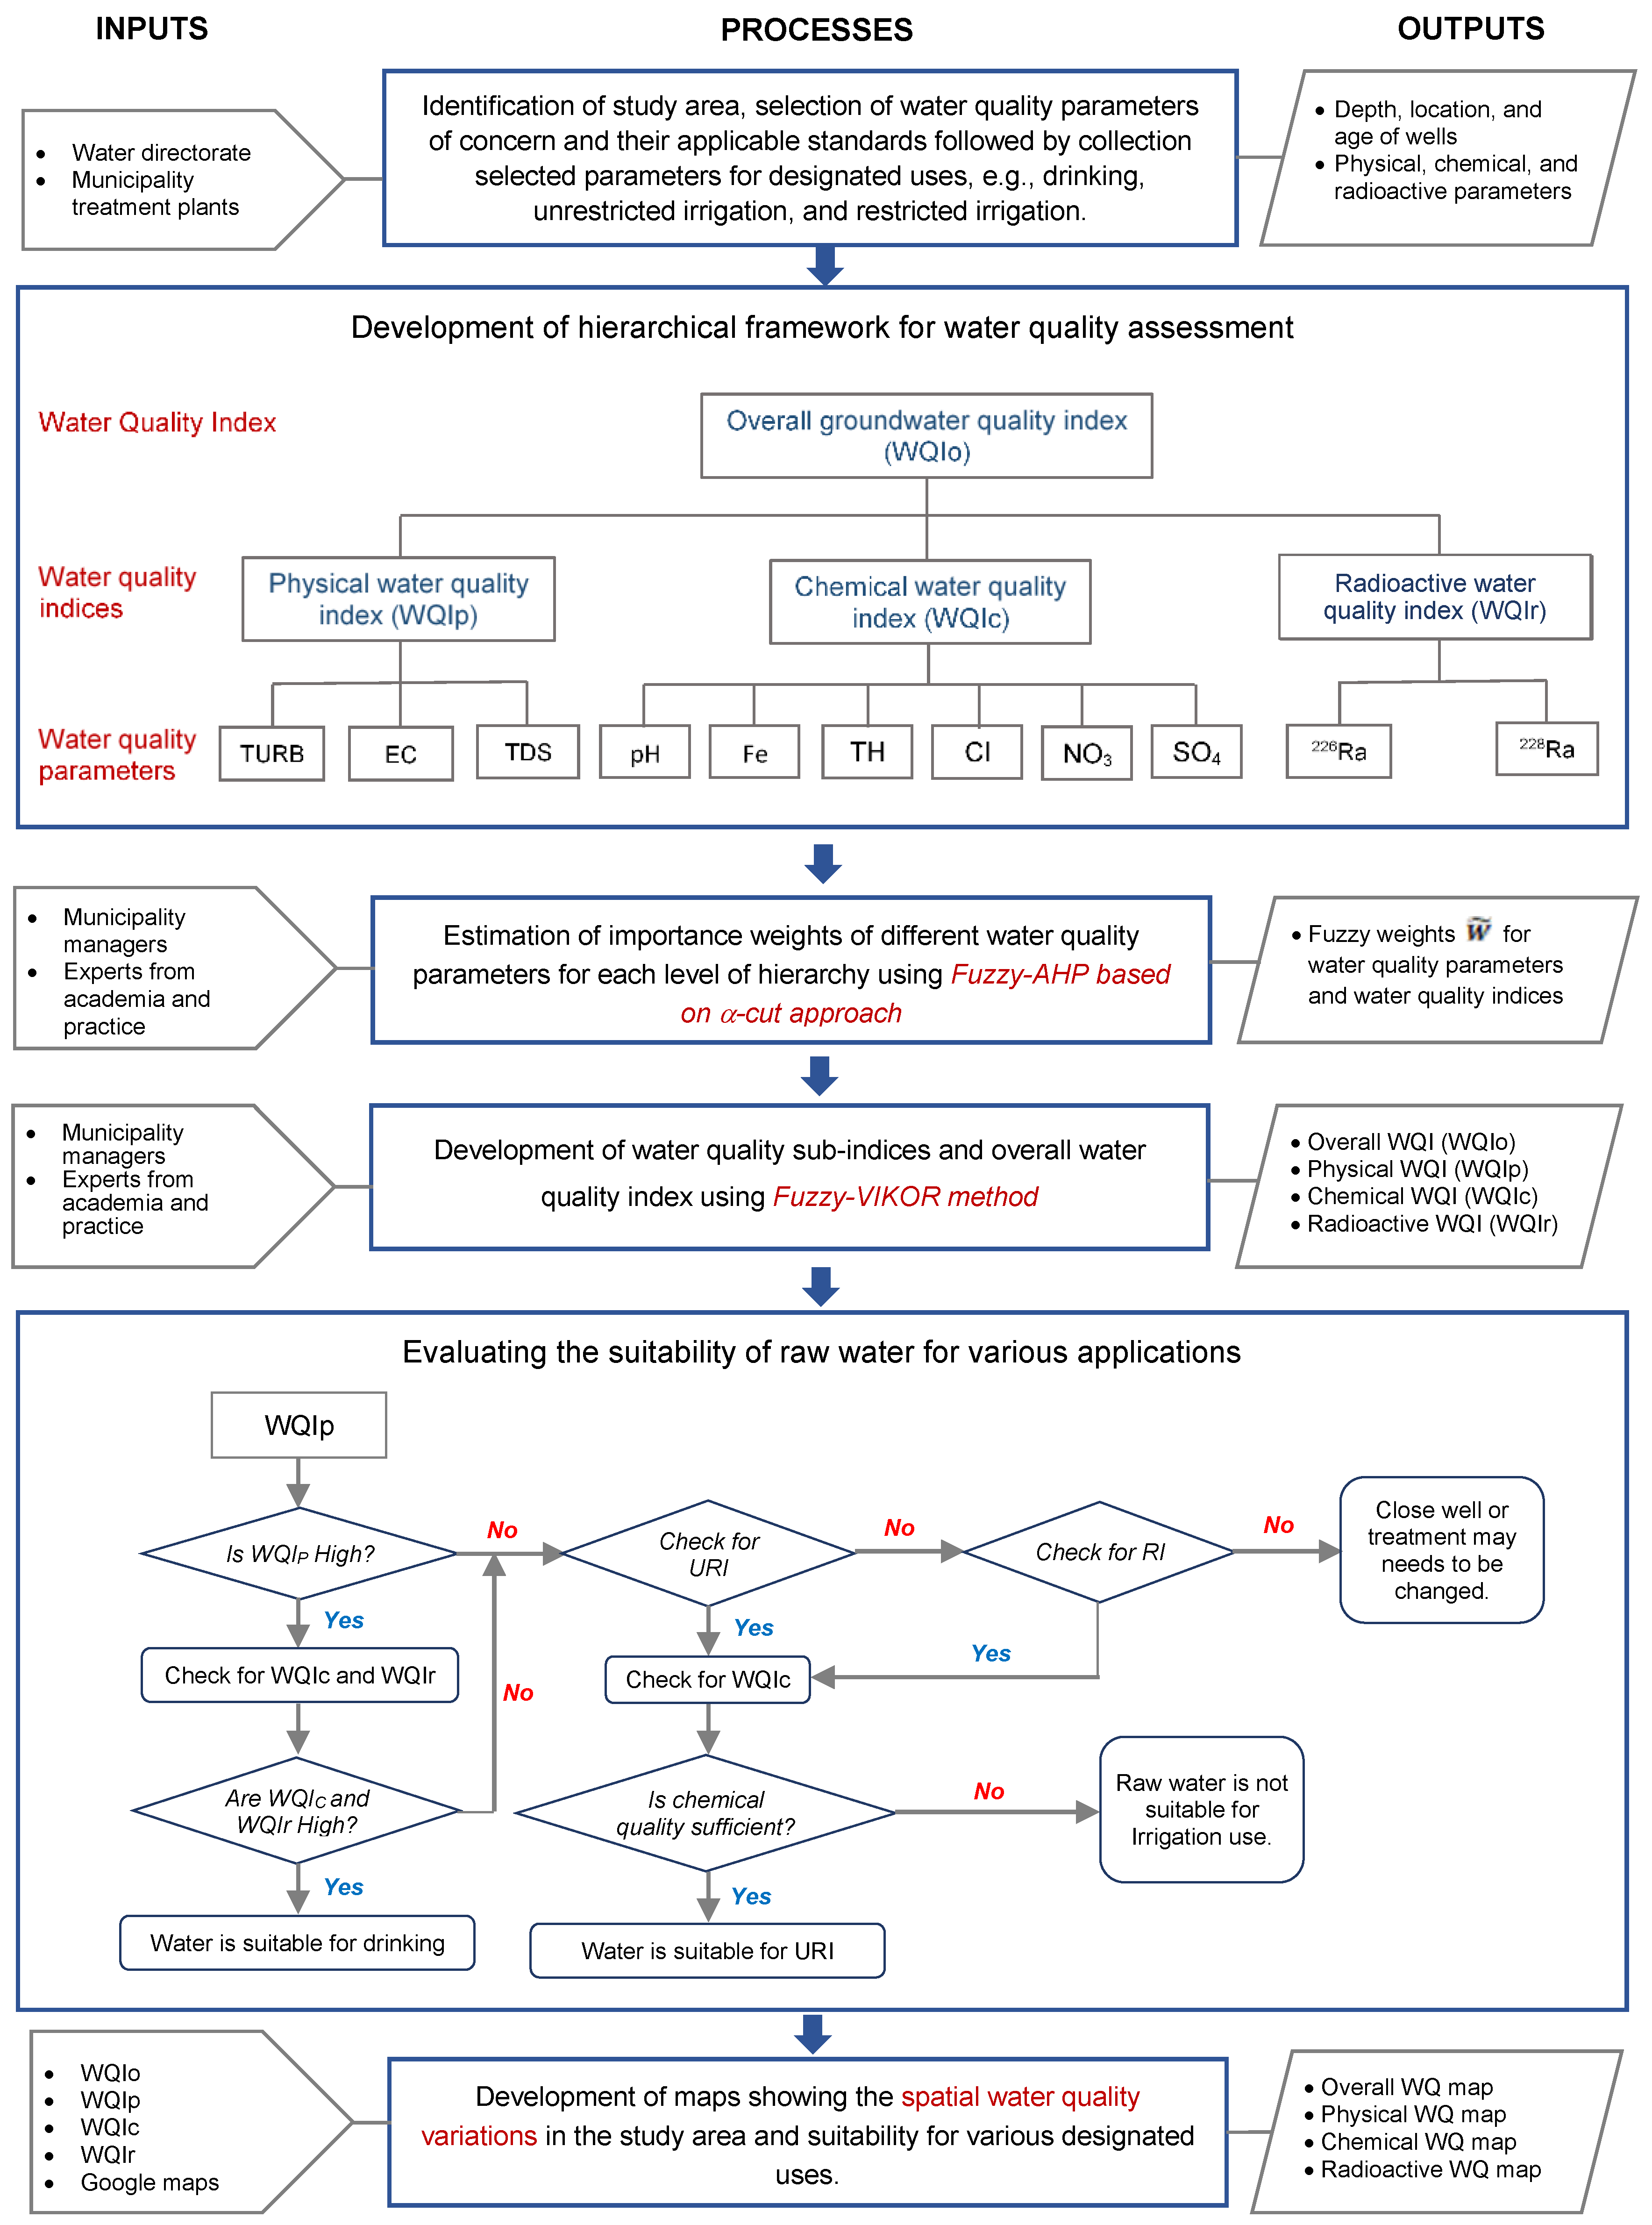
The main objective of the proposed research is to develop a framework for assessing the impact of natural contamination of groundwater in arid regions. The framework is applied on the study area of Buraydah City, Qassim, KSA. A methodology based on hierarchical approach is developed to aggregate the performance levels of different WQPs for developing the sub-indices, i.e., physical, chemical, and radioactive WQIs. Finally, sub-indices are aggregated to develop an overall water quality index (WQIo) at the top of the hierarchy. Uncertainties in data limitations, subjectivity in decision-makers opinion, and monitoring errors are addressed by integrating fuzzy logic with the conventional multicriteria analysis. The proposed approach is implemented on 39 wells in three WFs located in the center and periphery of the city’s boundaries. The indices will be useful for water directorates in KSA to assess the overall groundwater quality and take future planning decisions on rehabilitation and renewal of aged wells and installation of new wells. Moreover, the WQI will provide convenient and simplified information on the underground water quality to the public in urban areas, agricultural consumers, and other concerned agencies.

2. Methodology

2.1. Study Area

The northeastern region of KSA primarily relies on the Saq aquifer for its municipal and agricultural water supplies. The groundwater in this region is confined in Paleozoic and Mesozoic sedimentary rocks formations with high concentrations of TDS and implementing membrane treatment to meet DWQS [22]. Buraydah, located at 26°19′16′′ N and 43°57′32′′ E, is the capital of Qassim region of KSA (see Figure 1). The community water supply mainly relies on the Saq Aquifer. With the highest population share (42%) of the province, domestic and industrial water demands in the city are exponentially increasing. The oldest well field (i.e., WF-1) constructed 40 years ago, around the old city center, is now located in the center of existing periphery of the city. Around 38% of the wells analyzed in this study are located in well field 1. The WF-2, consisting of 42% of the wells, was developed around 15 years ago, shown at the bottom of Figure 1. Operations of the most recent well field-3 were started almost 10 years ago; in this field, 40% of the wells are just 5 years old. This well field consists of 20% of the wells evaluated in present study. The average depth of the wells in well fields 1 and 2 is 650 m, while the depth of wells in WF-3 varies between 650 m and 760 m. Municipalities perform detailed water quality tests for each well annually, however the parameters which can be checked using meters are performed on a monthly basis, e.g., TDS, electrical conductivity (EC), pH, and Turbidity. The wells are drawing water from a deep confined aquifer, no microbiological contamination was observed in any of the wells, and hence the bacteriological parameters were not included in the analysis.
The raw water transmitted from WF-1 and WF-2 is being treated at a common water treatment facility, while raw water from WF-3 has a new treatment plant. Turbidity, TDS, Iron, individual salts (e.g., Cl, NO3, and SO4), and radionuclides are the common naturally occurring pollutants in the groundwater of the study area. The schematic of the two water treatment facilities in the study area (one for WF-1 and WF-2 and one for WF-3), showing different treatment processes, is illustrated in Figure 2 [7]. Plain sedimentation occurs at raw water storage. In the old treatment plant, installed for WF-1 and WF-2, some percentage of raw water goes to the conventional process for removal of iron using oxidation followed by sand filtration, while the remaining goes to the more recently introduced iron removal process consisting of ion detention and ultrafiltration. The later system is being used in the new plant for WF-3. High removals of iron, manganese, and turbidity are achieved through sand or ultrafiltration. Reverse osmosis (RO) is the subsequent process for removal of salts. Finally, the RO product is blended with the filtered water to achieve a desired concentration of less than 500 mg/L. Ultrafiltration and RO are also being used for treating naturally occurring radionuclides in groundwater.
Several small and dispersed agricultural areas (farms) can be observed in the close vicinity around the study area boundary in Figure 1. Farmers in these areas are directly pumping raw groundwater for both restricted and unrestricted irrigation. Suitability of raw water quality for this purpose also needs to be assessed.

2.2. The Assessment Framework

The methodology developed in present research to develop the ground water quality index is presented in Figure 3. After defining the boundaries of study area, the raw water quality data for each well were obtained from the water directorate of Buraydah city. Locations, flows, depths, and hours of operations for each well were also gathered. Important WQPs were selected based on their concentrations (higher than the applicable DWQS), health significance, unrestricted and restricted irrigation uses, and effects on treatment (i.e., filters and membranes) and distribution (i.e., chlorination practice, and pipe material) systems infrastructure. DWQS in Saudi Arabia and World Health Organization (WHO) health-based guidelines were used to define the minimum desirable limits for the selected WQPs. However, the framework can include additional WQPs if found problematic in future or for other areas to be investigated.
The hierarchical-based framework proposed in the middle of Figure 3 develops different WQIs. The overall WQI at the top of hierarchy will be more desired by the senior management, policymakers, and general public. While the sub-indices will be more useful for the operational manger to rank the existing wells and plan new wells. The indices can also be applied on treated water quality to evaluate the efficiency of treatment plants [7]. The framework is robust enough to include additional WQPs, in future, depending on data availability, e.g., As and SiO2. It is worth mentioning that both the total coliforms and fecal coliforms were found absent in the groundwater of the study area and not included in present research.
Fuzzy logic is used to deal with uncertainties, including (i) possible errors in measurement of WQPs, (ii) low frequency of water quality monitoring, (iii) missing data, (iv) vagueness in expert opinion in establishing importance weights, and (v) subjective nature of WQI. Development of a WQI is a two-step process. The first step is the estimation of importance weights of the criteria, i.e., WQPs in the proposed research. Analytical hierarchy process (AHP) is a well-known method [3,13] and found appropriate to determine the weights of the parameters arranged in the hierarchical form, as shown in Figure 3. In the second step, the transformed values of different parameters are aggregated. To deal with the above-stated uncertainties, Fuzzy-AHP [23] and Fuzzy-VIKOR [24] methods are used for developing the groundwater quality index for the study area. Finally, geospatial maps are developed to illustrate the state of groundwater quality in the study area.

2.3. Water Quality Monitoring and Standards

2.3.1. Physical Parameters

TDS and electrical conductivity (EC) were selected to assess the concentrations of salts, while turbidity was used as a measure of suspended solids in raw well water. Although there are no health-based guidelines established by the World Health Organization (WHO), as per aesthetic guidelines, water having TDS level less than 600 mg/L tastes “Good”, water with TDS levels ranged between 600 and 900 mg/L tastes “Fair”, and “Poor” describes water with TDS higher than 900 mg/L. Concentrations higher than 1200 mg/L or lower than 100 mg/L make the water either “unacceptable for drinking” or “insipid” [7]. As per the drinking water quality standards in KSA, the highest acceptable limit for TDS is 600 mg/L [25]. Applicable irrigation water quality standards in KSA recommend TDS levels of 2000 mg/L for unrestricted irrigation and up to 2500 mg/L for restricted irrigation [26]. According to the Food and Agriculture Organization (FAO), there is no restriction of use for TDS levels less than 450 mg/L, slight to moderate restriction for 450–2000 mg/L, and severe restriction for levels higher than 2000 mg/L [27]. In a review conducted by Hussain et al. [28], TDS levels less than 1000 mg/L were recommended safe, 1000–2000 mg/L as marginal, and the levels higher than 2000 mg/L as hazardous for irrigation use.
EC is associated to the ionic content of water. There are essentially no health-based guidelines for this parameter. Various agencies have recommended maximum limits for EC in drinking water based on their experiences and end use of supplied water. Environmental protection agency of Ireland reported an indicator parametric value of 2500 μS/cm at 20 °C in drinking water, while as per Saudi Arabia Standards (SAS), the acceptable range is 160–1600 μS/cm at 20 °C.
Desired limit of turbidity as per most of the regulations is less than 1 NTU in drinking water; the same has been selected as the target concentration by the treatment facilities operating in Qassim Region. However, maximum guideline value of 5 NTU has also been recommended by WHO and KSA DWQS [25,29]. The same value has been recommended for both restricted and unrestricted irrigation in the country [26]. All the samples were collected, preserved, and transported following the Standard Methods for Examination of Water and Wastewater. TDS, EC, and pH were monitored using HACH multi-parameter meter. Turbidity was measured with the help of HACH turbidity meter.

2.3.2. Chemical Parameters

For chemical analysis of groundwater in the study area, the municipality regularly monitors pH, total hardness (TH), calcium (Ca), magnesium (Mg), iron (Fe), fluoride (F), chlorides (Cl), ammonia (NH3), nitrites (NO2), nitrates (NO3), and sulphates (SO4). Amongst these parameters, Ca, Mg, F, NH3, and NO2 were found well below the WHO and SAS in all the wells. As a result, pH, Fe, TH, Cl, NO3, and SO4 were selected to assess the chemical water quality of groundwater sources in the study area. Iron, chlorides (Cl), nitrates (NO3), and sulphates (SO4) were tested using HACH UV–VIS Spectrophotometer, Canada. The selection was done based on the monitoring frequency and significance of the parameters for the designated uses.
Although pH has no direct impact on drinking water quality, it is the most important WQP affecting the operations of treatment (e.g., ion detention, coagulation, and reverse osmosis) and distribution systems (e.g., formation of chloramines) [7,29]. As per SAS, pH of drinking water should range between 6.5 and 8.5. The recommended standards in Saudi Arabia for irrigation are pH range between 6 and 8.4 [26].
In KSA, the presence of Fe in the groundwater has been frequently reported in past studies [1,30,31]. In the most recent edition of WHO drinking water quality guidelines, no health-based limits were suggested for Fe in drinking water systems; nevertheless, accumulation of iron can occur in water supplied with values > 0.05 mg/L, which can lead to the growth of “Crenothrix”, i.e., an iron-based bacterium, and >0.3 mg/L can result in staining of fixtures and clothes at the consumer end [32]. As per both the SAS and WHO, the target value of Fe in drinking water supplies is 0.3 mg/L [25,29]. For irrigation, the standards for iron are 5 mg/L for both restricted and unrestricted irrigation [26].
There are no health-based guidelines established for ammonia; however concentrations up to 1.5 mg/L can lead to odor and 35 mg/L can cause taste problems [29]. The concentration of ammonia in Buraydah groundwater was found less than 1 mg/L, hence not included in water quality assessment. Although there are no health-related problems with hard water, due to utilization of more soap, taste complaints, and impacts on water infrastructure, hardness was included in the chemical parameters. The maximum tolerable concentration, as per both the SAS and WHO, is 500 mg/L for potable supplies; however, the values higher than 200 mg/L can lead to scaling problem in treatment units, water mains, and storage tanks. Conversely, very soft water with hardness less than 100 mg/L can be corrosive for water mains [26].
Similarly, the concentrations of natural chloride in deep aquifers higher than 250 mg/L may lead to objectionable taste in drinking water. To avoid soil salinity in KSA, the recommended chlorine concentration for irrigation use is 100 mg/L [26]; however, FAO reported chlorides higher than 350 mg/L (i.e., 10 me/L) should be avoided. Based on the epidemiological studies, NO3-N (nitrate as nitrogen) levels higher than 11 mg/L may lead to a risk of methaemoglobinaemia in infants. Both the SAS and WHO recommended 10 mg/L as the highest permissible concentration of NO3-N in drinking water; the same standards have been recommend for both the unrestricted and restricted irrigation. To avoid gastrointestinal effects from potable water, water sources with SO4 higher than 500 mg/L need to be carefully monitored [25]. As per both the SAS and WHO, the maximum allowable concentration of SO4 is 400 mg/L, while the permissible level for unrestricted irrigation is 600 mg/L [26].

2.3.3. Radioactive Parameters

A soluble form of natural Radium (Ra) generally exists in earth metal. Different combinations of three primary isotopes of Ra (i.e., 224Ra, 226Ra, and 228Ra) exist in groundwater [33]. Low levels of isotopes of natural radium also exist in the groundwater of some regions of Saudi Arabia [1,34,35,36]. Radium isotopes pose lesser risk to human health in comparison with chemical and biological contaminants [25]. The United Nations Scientific Committee on the Effects of Atomic Radiation (UNSCEAR) reported that around 90% of the radon present in water supply entered into human body through inhalation [37]. WHO recommended 30 pci/L for combined Radium (226+228Ra), which is significantly higher than the maximum contaminant level (MCL) of 5 pci/L (0.0075 mg/L) and MCL goal (MCLG) of 0 pci/L guided by the United States Environmental Protection Agency (USEPA) [38]. The debate on setting one permissible limit or even the limits in a more rational range is still going on. If found higher than 5 mg/L at the source, a complete removal of radium is being achieved at the treatment facility of the study area.
There are no standards available for radionuclides in irrigation water in KSA. Uptake of radionuclides by the plants depends on the transfer factor (ranging from 0.01 to 0.006 for raw vegetables), which is essentially the rate between the concentrations (as Bq kg−1) of radionuclides in the plant tissue and the dry soil [39]. This means that if raw water contains 100 pci/L, and even if the same concentration in assumed in soil, 1 pci/L will reach to the plant tissue. which is well below the acceptable limits for human health. Although no clear irrigation standards are available for radium, a lower transfer rate can be expected for crops.

2.4. Development of Water Quality Index

2.4.1. Fuzzy Analytic Hierarchy Process

Weights of WQPs and sub-indices were estimated using Fuzzy-AHP which is based on the pairwise comparison using linguistic terms (e.g., ‘extremely important’ and ‘moderate unimportance’) to define priorities and/ or posteriority amongst the criteria. In present research, triangular fuzzy numbers (TFN) were used for the linguistic terms for effectively approximating the subjective judgments of six decision-makers from practice and academia. Fuzzy-AHP based on the α-cut approach is used in present research. The approach further addresses the uncertainties in the fuzzy ranges selected by the decision-makers (see Figure 4).
The step-by-step procedure of -cut-based Fuzzy-AHP method is given in the following [40].
Step 1: Develop the pairwise comparison matrix.
K number of decision-makers were asked to complete the pairwise comparison matrix using the nine point ranting scale given in Table 2. The fuzzy reciprocal judgment matrix A ˜ k was developed for each decision maker as:
A ˜ k = [ a ˜ i j ] k
where i is the criteria and j is the number of the criteria in the matrix, j = 1, 2, …, n.
Complete fuzzy reciprocal matrix R ˜ k is defined as:
R ˜ k = [ r ˜ i j ] k
where r ˜ i j represents the relative importance difference between the criteria i and j and is a triangular fuzzy numbers (TFN) as r ˜ i j = ( l i j , m i j , u i j ) . Here, r ˜ 11 = ( 1 , 1 , 1 ) ,   i = j   and   r ˜ i j = 1 r ˜ i j   k ,   i = j = 1 , 2 , , n .  
Step 2: Perform consistency check.
R ˜ k = [ r ˜ i j ] is the fuzzy positive reciprocal matrix where r ˜ i j = ( α i j , β i j , γ i j ) . In α-cut approach the consistency of this matrix is checked for each decision maker with the help of the following equation:
C I = λ m a x n n 1
where λ m a x presents the dimension of the matrix and is the maximum eigenvalue.
Subsequently, the consistency ratio (CR) was calculated using Equation (4):
C R =   C I R I
where RI is the random index and its values were selected from Table 3 depending on the number of WQPs (i.e., n) under each sub-index. Calculated CR values less than ‘1’ are acceptable and shows the consistency in decision-makers’ judgment.
Step 3: Estimate the fuzzy weights.
Apply Equation (5) on the positive matrix ‘k’ for each decision maker:
T ˜ α = [ ( m 1 ) α + l ,   u ( u m ) α ] , 0 1
R ˜ m k = [ r ˜ i j ] m k can be calculated by setting   = 1 while the lower bound and the upper bound R ˜ l k = [ r ˜ i j ] l k and R ˜ u k = [ r ˜ i j ] u k can be estimated by setting   = 0 .
Now, estimate the criteria weights for all the decision-makers using Equations (1) and (6):
w i = ( j = 1 n a i j ) 1 / n j = 1 n ( j = 1 n a i j ) 1 / n
where w i is the criteria weight and the weight vector W = ( w i ) , i = 1,2,…,n.
By applying Equation (6) to l, m, and u bounds, corresponding weight vertices were calculated as W l k = ( w i ) l k , W m k = ( w i ) m k , W u k = ( w i ) u k . Calculate the smallest possible constant S l k   and the largest possible constant S l u k for minimizing the fuzziness of the weights with the help of Equations (7a,b):
S l k = m i n { ( w i m k w i l k | 1 i n ) }
S u k = m a x { ( w i m k w i u k | 1 i n ) }
Subsequently, the lower and upper bounds of the weight vector were estimated using Equation (8a,b):
w i l k = S l k w i l k , i = 1 , 2 , , n
w i u k = S u k w i u k , i = 1 , 2 , , n
Finally, develop the fuzzy weigh matrix for each decision-maker as:
W ˜ i k = ( w i l k , w i m k , w i u k ) ,   i = 1 , 2 , , n
Step 4: Combine the judgment of all the decision-makers.
In this step, the fuzzy weights matrices obtained from Equation (9) for each decision maker are integrated with the help of Equation (10):
W ¯ i ˜ = 1 K ( W ˜ i 1 W ˜ i 2   W ˜ i k )
where W ¯ i ˜ denotes the combined fuzzified weight of the criteria i estimated by accumulating the judgments of all the decision-makers K. Instead of finding the crisp weights for each criteria (i.e., sub-indices), the combined fuzzy weights from Equation (10) are used in the aggregation of WQPs’ performance for each well with the help of Fuzzy-VIKOR method as described in the following.

2.4.2. Fuzzy VIKOR Method for Aggregation and Wells’ Ranking

The VIKOR multicriteria decision-making method, first developed by Serafim Opricovic can deal with conflicting criteria [41]. This method ranks the alternatives (groundwater wells) by comparing closeness of each alternative (water quality) to the ideal alternative (desired water quality standards). Extension of the method to Fuzzy VIKOR can help in the situations with uncertain conditions [42]. In the following the step-by-step procedure to Fuzzy-VIKOR method is outlined [24]:
Step 1: Estimate the fuzzified weights using Fuzzy-AHP method, i.e., W i ˜ = ( w l i , w l m , w l u ) , where w l i , w l m , and   w l u are the lower, medium, and upper limits of the criteria (WQPs) weights represented as TFNs.
Step 2: The positive triangular ideal solution ( f ˜ i ) correspond to a hypothetical well with all the parameters meeting DWQS and the negative triangular ideal solution ( f ˜ i o ) correspond to a hypothetical well having all the parameter higher than the highest ranges of WQPs in the study area will be determined as:
f ˜ i = M A X j f ˜ i j ,   for   i   I c f ˜ i o = M I N j f ˜ i j ,   for   i   I c
where Ic represents the set of WQPs as the cost criteria.
Based on the discussion made in Section 2.2, f ˜ i and f ˜ i o values for all the WQPs are presented in Table 4. The parameters which are less than the DWQS (e.g., nitrates), lowest observed values are considered as the positive ideal solution.
Step 3: Calculate the normalized fuzzy difference ( d ˜ i j ,   j = 1 ,   ,   J   ,   i = 1 ,   ,   n ) using the following equation:
d ˜ i j = ( f ˜ i f ˜ i j ) ( r i l i o ) ,   for   i   I c
Step 4: Compute fuzzy weighted sum S ˜ and fuzzy operator MAX R ˜ by the following relationship:
S ˜ j = i = 1 n ( w ˜ i d ˇ i j )
R ˜ j = M A X i ( w ˜ i d ˇ i j )
Step 5: For ranking of wells, compute the value of Q ˜ j using the following equation:
Q ˜ j = v ( S ˜ j S ˜ ) / ( S o r S l ) ( 1 v ) ( R ˜ j R ˜ ) / ( R o r R l )
where S ˜ is the MIN S ˜ j , S o r is MAX S j r , R ˜ is the MIN R ˜ j , S R o r is MAXj R j r , and v is the weight of the strategy.
Step 6: Defuzzified all the fuzzy results to find out crisp Sj and Qj values for all the alternatives, i.e., groundwater wells, using the following equation:
P ( M ˜ ) = M = l + 4 m + u 6
Step 7: The groundwater pollution index (GWPI) for each well is essentially the crisp Sj scores. Subsequently, estimate the groundwater quality index (GWQI) using the following equation:
( G W Q I ) j = 1 S j
Step 8: Prioritize all the alternatives (i.e., wells) in descending order starting from the highest crisp Qj value, which correspond to the worst performance in terms of source water quality. The well with highest priority needs to be given more importance in terms of water quality monitoring, rehabilitation or renewal planning.
Step 9: Find out groundwater quality indices by averaging the indices for all the wells in each well field as:
G W Q I W F = 1 n j = 1 n ( G W Q I ) j
Note that (GWQI)j is the generic form of the index defined in the proposed methodology. In application, this will replace (WQI)p, WQIc, WQIr, and WQIo.
Step 10: Develop geospatial water quality maps for the study area using the water quality assessment scheme presented in Table 5. The table shows that WQIp (including TDS, Turbidity, and EC) is relatively more important to define the suitability of all the uses. As per the rationale for defining the performance levels, the water quality cannot be considered “High” if the TDS levels are not meting drinking water quality standards. Consequently, filtration followed by reverse osmosis (particle for groundwater sources) becomes inevitable to remove the salts and make the water potable. Another example is raw water with only high content of Fe with TDS levels less than 500 mg/L (i.e., drinking water quality standards), which will result in “high” WQIp but “Medium” or “low” WQIc and hence not suitable for drinking. These results will also come up with “Medium” or “Low” WQIo. However, the treatment system would be required to remove iron only through iron oxidation followed by filtration, but does not need reverse osmosis for TDS removal.
Moreover, significance of WQIc should not be overlooked to compare individual WQPs with the corresponding standards (e.g., nitrates, sulphates, hardness) as described in Table 5. WQIr has a primary significance for drinking water, because the levels in the study area are not too high to effect URI or RI (see discussion on transfer rate for raw vegetables in Section 2.3.2 and more details in [39]). Table 5 also shows that for RI, TDS is the primary parameter of concern.

3. Results and Discussion

3.1. Groundwater Quality Monitoring Results

Comprehensive water quality data for the selected physical, chemical, and radioactive WQPs were obtained for the year 2016 from Water Directorate of the City of Buraydah. For each well field, the calculated average (MEAN), minimum (MIN), maximum (MAX), standard deviation (SD), and coefficient of variation (CV) values for all the WQPs are presented in Table 6.
It can be seen in Table 6 that even the minimum TDS levels in WF-1 are higher than drinking water quality standards (600 mg/L) given in Table 4. Around 35% CV shows significant variations among 40 year olds wells in this well field. Average EC values are also very high and close to the upper limit of SAS. Turbidity ranging between 7.2 and 27.2 with a SD of 7.5 is also several times higher than the SAS. These results show that the physical water quality parameters of raw water (WF-1) do not meet SAS and need to be reduced through appropriate treatment (i.e., filtration followed by reverse osmosis) before domestic use. However, pH values remained within the desired range. An average concentration of iron higher than 0.3 mg/L also rationalizes the need of existing treatment facilities in the study area, i.e., iron oxidation and sand filtration or ion detention, coagulation, and ultrafiltration [7]. An average value of 339 mg/l shows that the hardness in WF-1 is not problematic, particularly after mixing of water (drawn from different wells) in the transmission main. Further, both the Cl and NO3 higher than the SAS further justify the need of membrane filtration. Although SO4 was found less than 400 mg/L, a maximum value of 324 justifies the inclusion of this parameter in the chemical WQI. Finally, average radium higher than 30 pci/L shows the presence of natural radioactivity in sub-soil strata, which needs to be treated using ultrafiltration and reverse osmosis [45].
Average TDS levels (1423 mg/L) in WF-2 are higher than those in WF-1, with lesser coefficient of variation of 18.3% in comparison with 35.4% in the case of WF-1. Mean turbidity is also higher than in WF-1. Mean and minimum values for pH lie in the desired range of SAS with an occasional value as high as 10.5. The reason for such high value could be instrumental or sampling error. Such results support the use of fuzzy logic in the aggregation process of different WQPs. Average Fe in WF-2 is also higher than that in both the WF-1 and SAS. A very high CV of 98.5% shows large variations between different wells; these findings show dissimilarities of the iron content in the geological and soil formation of this well field. Average concentrations of TH, Cl, and NO3 are also higher than both the required DWQS and those in the WF-1; however SO4 levels ranging between 71 mg/L and 233 mg/L are less than those in WF-1 and meet SAS as well. Radium levels are slightly higher than in WF-1 and thus need to be removed through similar types of treatment.
It can be seen in Table 6 that although the mean concentration of TDS in WF-3 meet the SAS for drinking water, such borderline values with maximum value higher than the standards and 153 mg/L of standard deviation identify the presence of natural salinity in groundwater. Average TDS levels were found to be almost one-third of those in the WF-1 and half of the TDS levels in WF-2. As we know that WF-3 is the newest among all the well fields in the study area, these results are in agreement with the findings of Kent and Landon [46], where they reported a notable increase in TDS levels with time in four groundwater sub basins in San Bernardino County, California. Overall, the turbidity values are higher than those in WF-1 and WF-2. Similar to other well fields, pH in WF-3 also meets SAS. Mean Fe levels are higher than those in WF-1 but lower than those in the WF-2. The levels of TH and Cl are much lower than those in the other two well fields and their entire ranges are below the desired SAS. Although average nitrates are slightly higher (i.e., 10.4 mg/l with maximum value of 15.5 mg/L) than the SAS, the values are less than those in the other two well fields. Similar to TDS, higher concentrations of NO3 can be expected with the aging of wells in future. Sulphates level are almost consistent with the rest of the study area. Radium levels are higher than in WF-1 but less than in WF-2.

3.2. Groundwater Quality Index using Fuzzy-VIKOR

Significant variations in the groundwater samples due to possible changing patterns of natural soil and geology of the study area validate the need of a fuzzy-based index. To estimate the importance weights of water quality parameters, pairwise matrices for physical, chemical, and the overall sub-indices were completed by six decision-makers. As only two parameters (i.e., 226Ra and 228Ra) define the WQIr, equal weights were allocated to both of them. Consistency ratios for 18 pairwise matrices were checked, using Equation (4), and found less than 1. Table 7 presents the average estimated weights, from Equation (10) with K = 6, using the methodology of fuzzy-AHP described in Section 2.3.1. As the fuzzified weights have to be subsequently used in fuzzy-VIKOR method, crisp weight are not presented in the table.
After the weight estimation process, the aggregation process using fuzzy-VIKOR was also extensively applied for development of water quality indices and ranking of wells. All the detailed results cannot be provided due to space limitations. As an example, the estimation of chemical water pollution index for WF-3 is presented in the following. The performance matrix given in Table 8 presents the values of fuzzified values of six chemical WQPs for the eight wells located in WF-3. The last two columns contain scenarios of two hypothetical wells. The first one is the “best case scenario” with all the parameters equal to or lower than the DWQS, while the second corresponds to the “worst case scenario” with all the parameters having highest possible values held by any other well in the field.
Table 9 presents the fuzzy results for Sj, Rj, and Qj, using the values for positive triangular ideal solution ( f ˜ i ) and the negative triangular ideal solution ( f ˜ i o ) given in Table 4 and Equations (11) to (13). Defuzzified scores using Equation (16) are also presented in Table 9. The defuzzified Sj scores are essentially the groundwater pollution index (GWPI) defined in Equation (13). Sj scores of 0.0 for “best case scenario” and 1.0 for “worst case scenario” validate the proposed methodology for the estimation of GWPI. Higher values of Sj correspond to higher pollution with larger number of water quality parameters violating the DWQS. After calculating the water pollution indices, Equation (17) was used to estimate the water quality indices for each well. Finally, WQIo for each well field was calculated by averaging the WQIo of all the wells using Equation (18).

3.3. Discussion

Very interesting results can be noticed in Table 8 and Table 9. Only one well in WF-3 (i.e., W3-77) obtained the “High” chemical water quality index (see second last row of Table 9), which corresponds to the case when “all the WQPs meet DWQS”, as per the subjective rating described in Table 5. These results can be confirmed from the performance data for these wells in Table 8. All the remaining wells obtained “Medium” WQIc with higher levels, primarily due to higher concentration of NO3 in addition to the highest concentration of Fe in the entire well field. In general, Fe concentration is less than the irrigation standard of 5 mg/L; it is important to compare NO3 with the standards of URI and RI for subsequent applications. Check wells obtained “High” and “Low” ratings for the best and worst case scenarios, i.e., WQIc values of 1.0 and 0.0. These results also support the subjective rating defined in Table 5 and the robustness of the proposed framework.
It can be seen in Figure 1 that all the three well fields are located quite uniformly in and around the study area, i.e., top, middle, and bottom. Therefore, tentative boundaries of the areas corresponding to the three well fields were marked by assuming the midpoints between the two respective well fields. Subsequently, the indices were generated by averaging different water quality indices for all the wells in each well field using Equation (18). The results in terms of spatial groundwater quality variations are presented in Figure 5. Figure 5a–c presents the over physical, chemical, and radioactive water quality indices for each spatial boundary. The central area corresponds to WF-1, the bottom to WF-2, and the area at the top is related to WF-1. Finally, the overall WQI (i.e., WQIo) was calculated by aggregating all the three sub-indices, and the results are presented in Figure 5d. Importance weights of the three indices are given in the last three rows of Table 7.
In Figure 5, Area-2 and Area-3 located on the periphery of the main city’s boundary are essentially important for the semi-urban and rural settings in the proximity of the study area. In these areas, most of the population use raw groundwater for general domestic use (excluding drinking) and agriculture. The findings presented in Figure 5b are helpful (if properly disseminated with appropriate details and limitations) for the consumers in these areas. For instance, “Medium” physical and chemical water quality confirms that water is generally suitable for agricultural applications in study area.
Another useful application of the water quality maps presented in Figure 5 is observing the changing in raw water quality. For example, “Medium” WQIp in the case of WF-3 (referring the top area of Figure 5a) is due to lesser TDS in comparison with the other two well fields. Increasing trends in TDS levels with time have been reported in literature [46]. It means that the field engineers need to keep an eye on such changes to note when the water quality becomes unsuitable for URI, i.e., changing from “Medium” to “Low”. It can be seen in Table 6 that the highest observed value in WF-2 is already higher than 2000 mg/L. It can also be seen that on the basis of WQIo, with highest value of 0.87 of the oldest WF-1 outperforms the other two well fields.
Type and cost of RO membranes vary with the concentration of TDS in raw water, so the municipality can take a more rational decision while selecting the type of membranes for this well field, instead of having the same for the entire study area. In addition, the backwashing period will be longer and the amount of RO reject water might be less and more suitable for reuse after appropriate treatment. The WQIc primarily represents the spatial water quality variations. Once the type of membrane is selected based on TDS levels in raw water, the variations in WQIc have practically no impact on treatment plants’ operations.
Finally, all the wells in each well field are ranked based on their overall water quality using Equation (15), i.e., crisp Qj values. The well are ranked in descending order as lower values of Qj correspond to less pollution. The wells with higher levels of pollution are ranked on the top, giving highest priority for their careful monitoring and preference for renewal or replacement activities. The results for all the well fields are listed in Table 10. For instance, in WF-1, W1-13 is ranked on the top because its WQIp is “Medium” and WQIr is “Low”. While W1-4 has been ranked at 14 with “Medium” performance level for all the indices. Some interesting wells also exist in the middle ranks, such as W1-5 with “High” WQIc, “Medium” WQIp, but “Low” WQIr. It is worth mentioning that the ranking has been done individually for each well field. If the same municipality is responsible for all the three well fields, managers need to establish the overall ranks of all the wells, which might be different than the ranks listed in Table 10. In the study area, WTP-1 receives raw water from WF-1 and WF-2 and the raw water from WF-3 is transmitted to WTP-2. Therefore, the decision-makers at WTP-1 need to identify the top-ranked wells collectively in both the well fields.
The application of the proposed framework for developing various WQIs and well ranking system on the case of Buraydah city shows its pragmatism to manage many operational difficulties by extracting useful information from the large water quality monitoring datasets. Firstly, the three sub-indices will be useful to comprehend the performance of each well in terms of its physical, chemical, and radioactive water quality, instead of having several parameters. Secondly, the spatial maps developed in Figure 5 are useful for all the field engineers, treatment plant managers, well field operators, senior municipality managers, and the general public. Finally, the well ranking system using fuzzy weighted sum and fuzzy operator MAX R ˜ of the WQPs prioritizes all the wells for their effective rehabilitation and renewal planning and also to assist with making decisions on their complete closure in case of low water quality affecting subsequent treatment operations.
The scenario analysis results presented in Figure 6 manifest the robustness of the water quality index. Both the WQIp and WQIc are higher than 0.95, when all the drinking water quality parameters meet drinking water quality standards, i.e., S1 and S5. In S2, only TDS levels are higher than DWQS but meet water quality standards for URI and RI (see Table 4). Scenario 6 and 7 evaluates the suitability of raw water in case of higher concentrations of hardness and Fe, individually. There are no established irrigation standards for hardness in KSA, so water is suitable for both the URI and RI for its value higher than DWQS, i.e., S6. Scenario 8 to 10 represents the raw water with several chemical parameters higher than the standards for all uses as described in Table 4. In S8, the water is suitable for RI followed by sedimentation, but not suitable for URI and drinking purposes. While in S7, if only Fe is higher than 0.3 but less than or equal to 5 mg/L, the raw water is suitable for both URI and RI. These results show that the indices developed in present research are useful to evaluate the raw water quality of individual wells as well as the corresponding well fields and command areas.

4. Conclusions and Recommendations

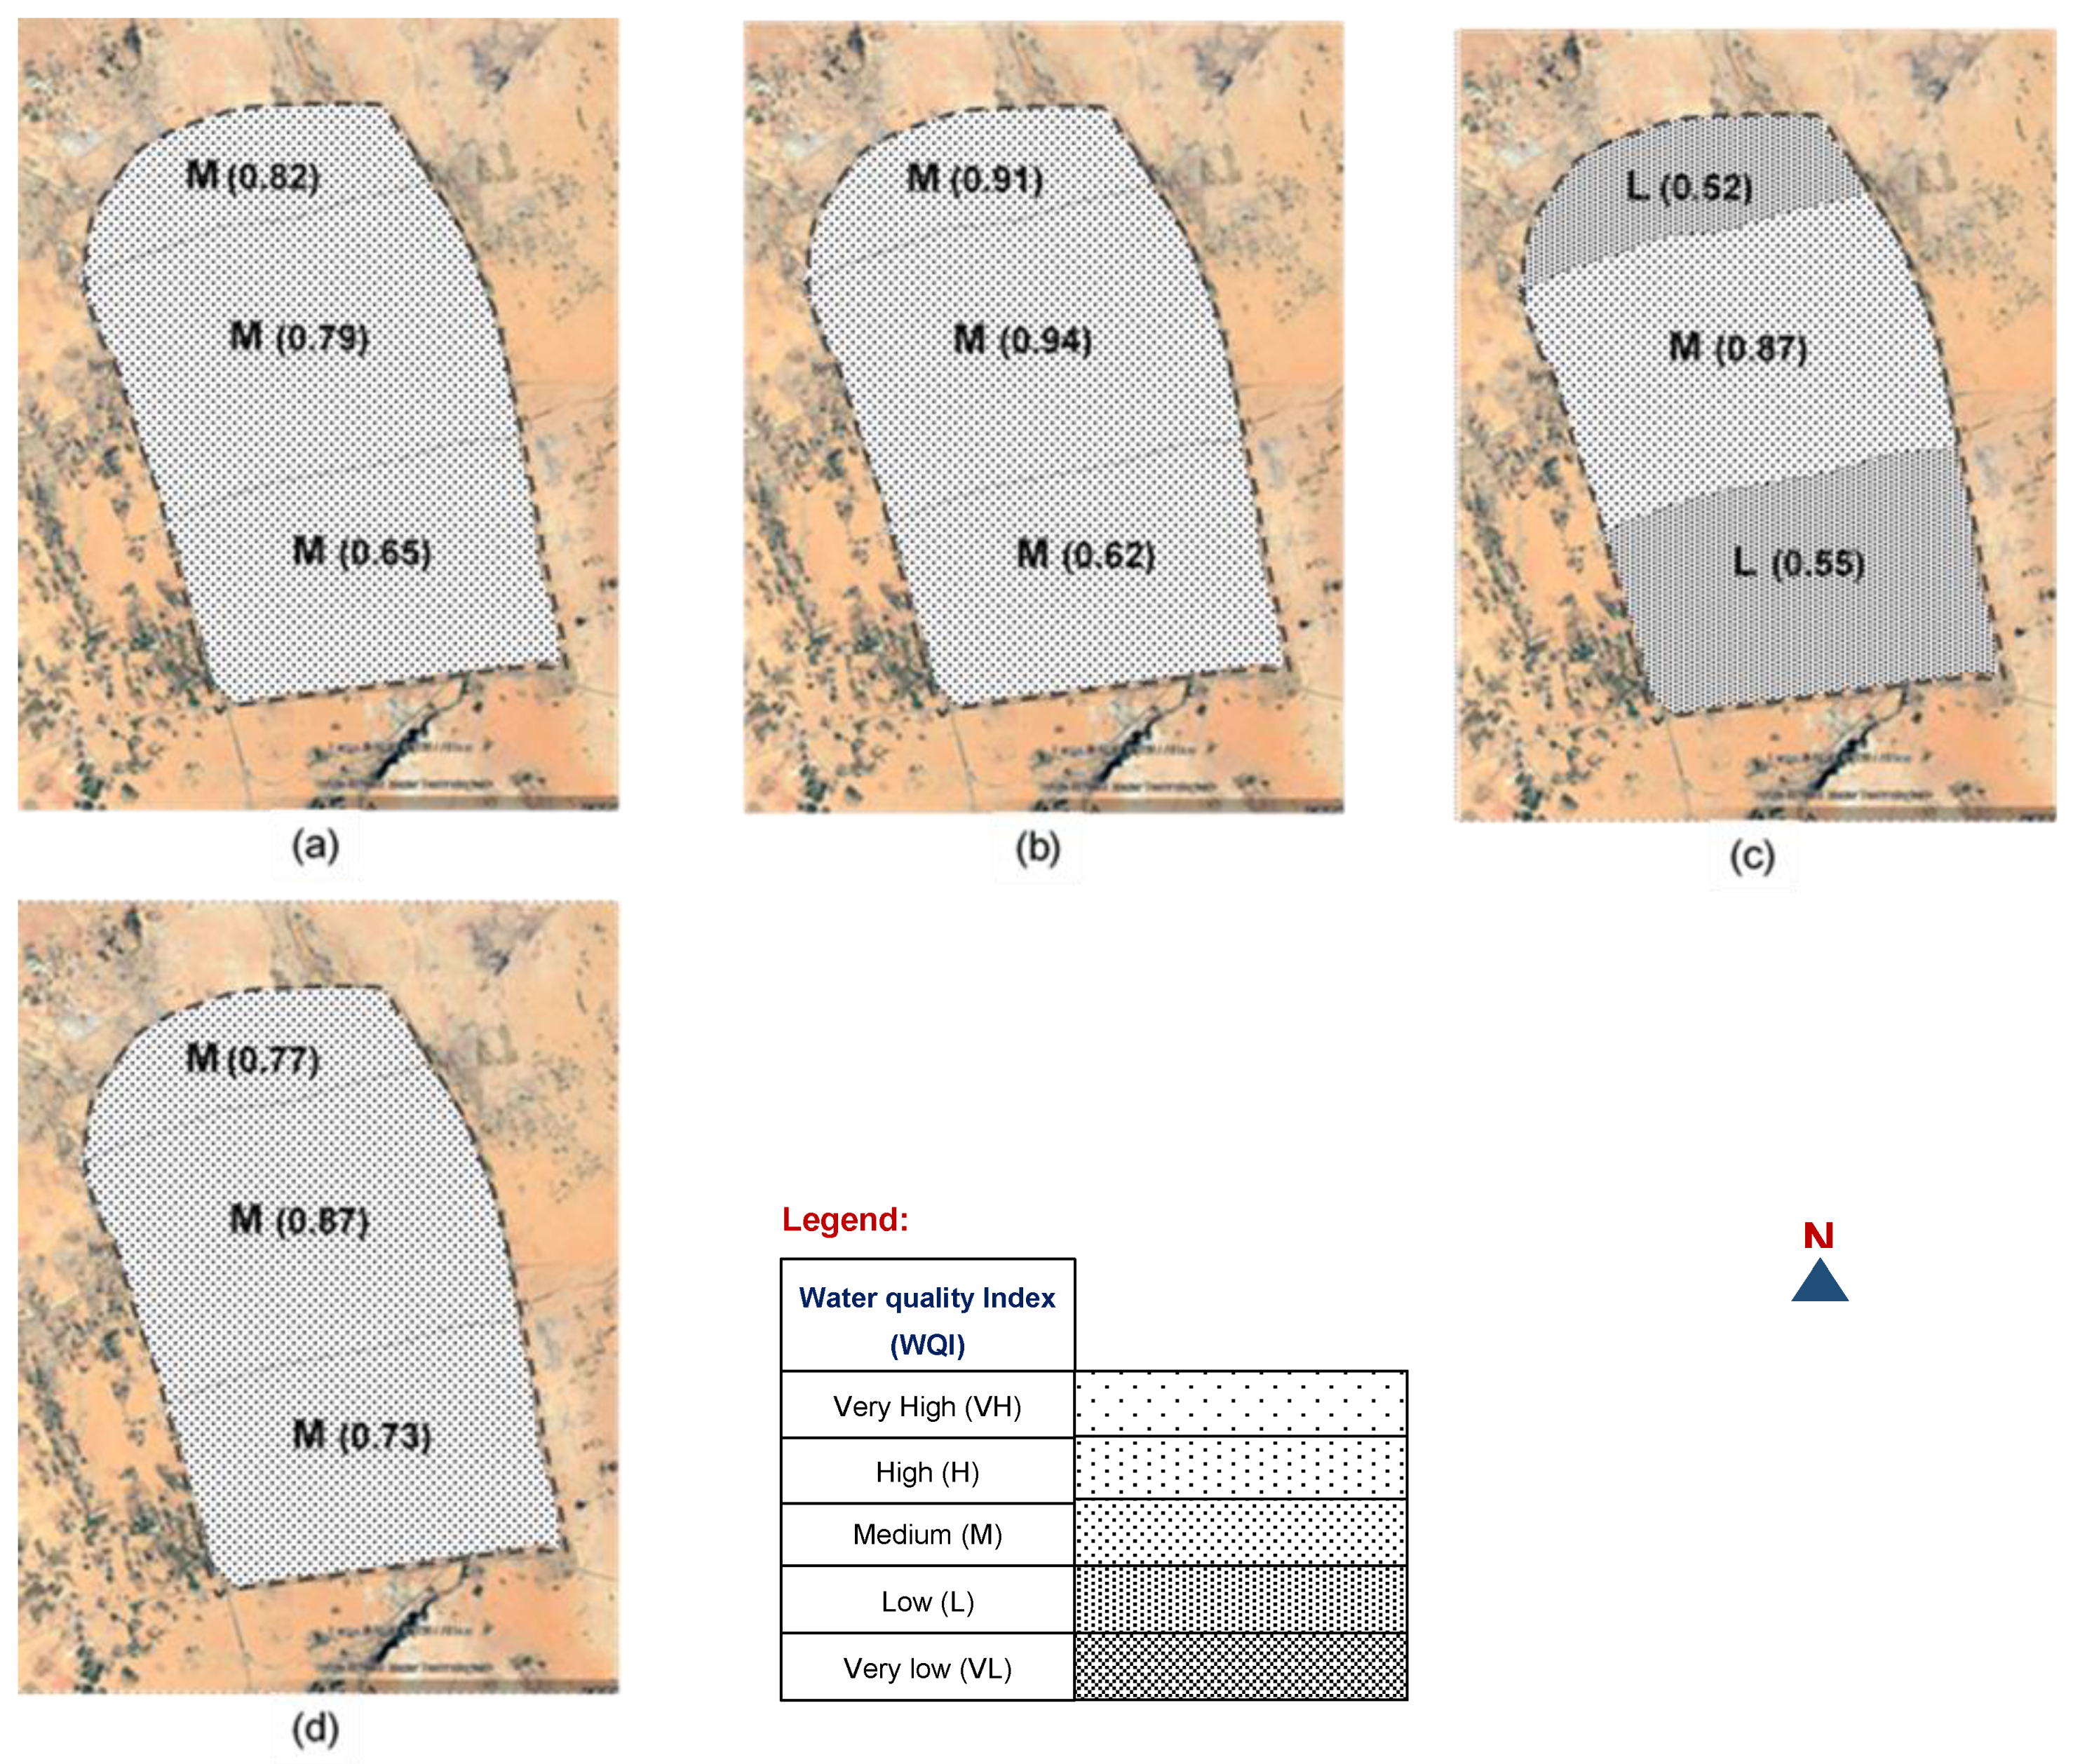
Groundwater in arid environments is diminishing and its water quality has also been deteriorating due to anthropogenic activities and the presence of natural substances in sub-soil strata. Groundwater quality assessment has gained importance in these regions for conservation of this limiting natural resource and planning and management of well field infrastructure. A hierarchical-based water quality assessment framework has been proposed to develop various WQIs and a system for ranking of groundwater wells. Three sub-indices developed in the middle of the hierarchy, including WQIp, WQIc, WQIr, deduce the physical, chemical, and radioactive water quality from 11 water quality parameters (3 physical, 6 chemical, and 2 radioactive). Subsequently, these sub-indices are aggregated using fuzzy-VIKOR method for assessing the overall water quality (i.e., WQIo) on the top of hierarchy. All the three sub-indices and WQIo elucidate the state of water quality in the well field and nearby areas with the help of spatial maps.
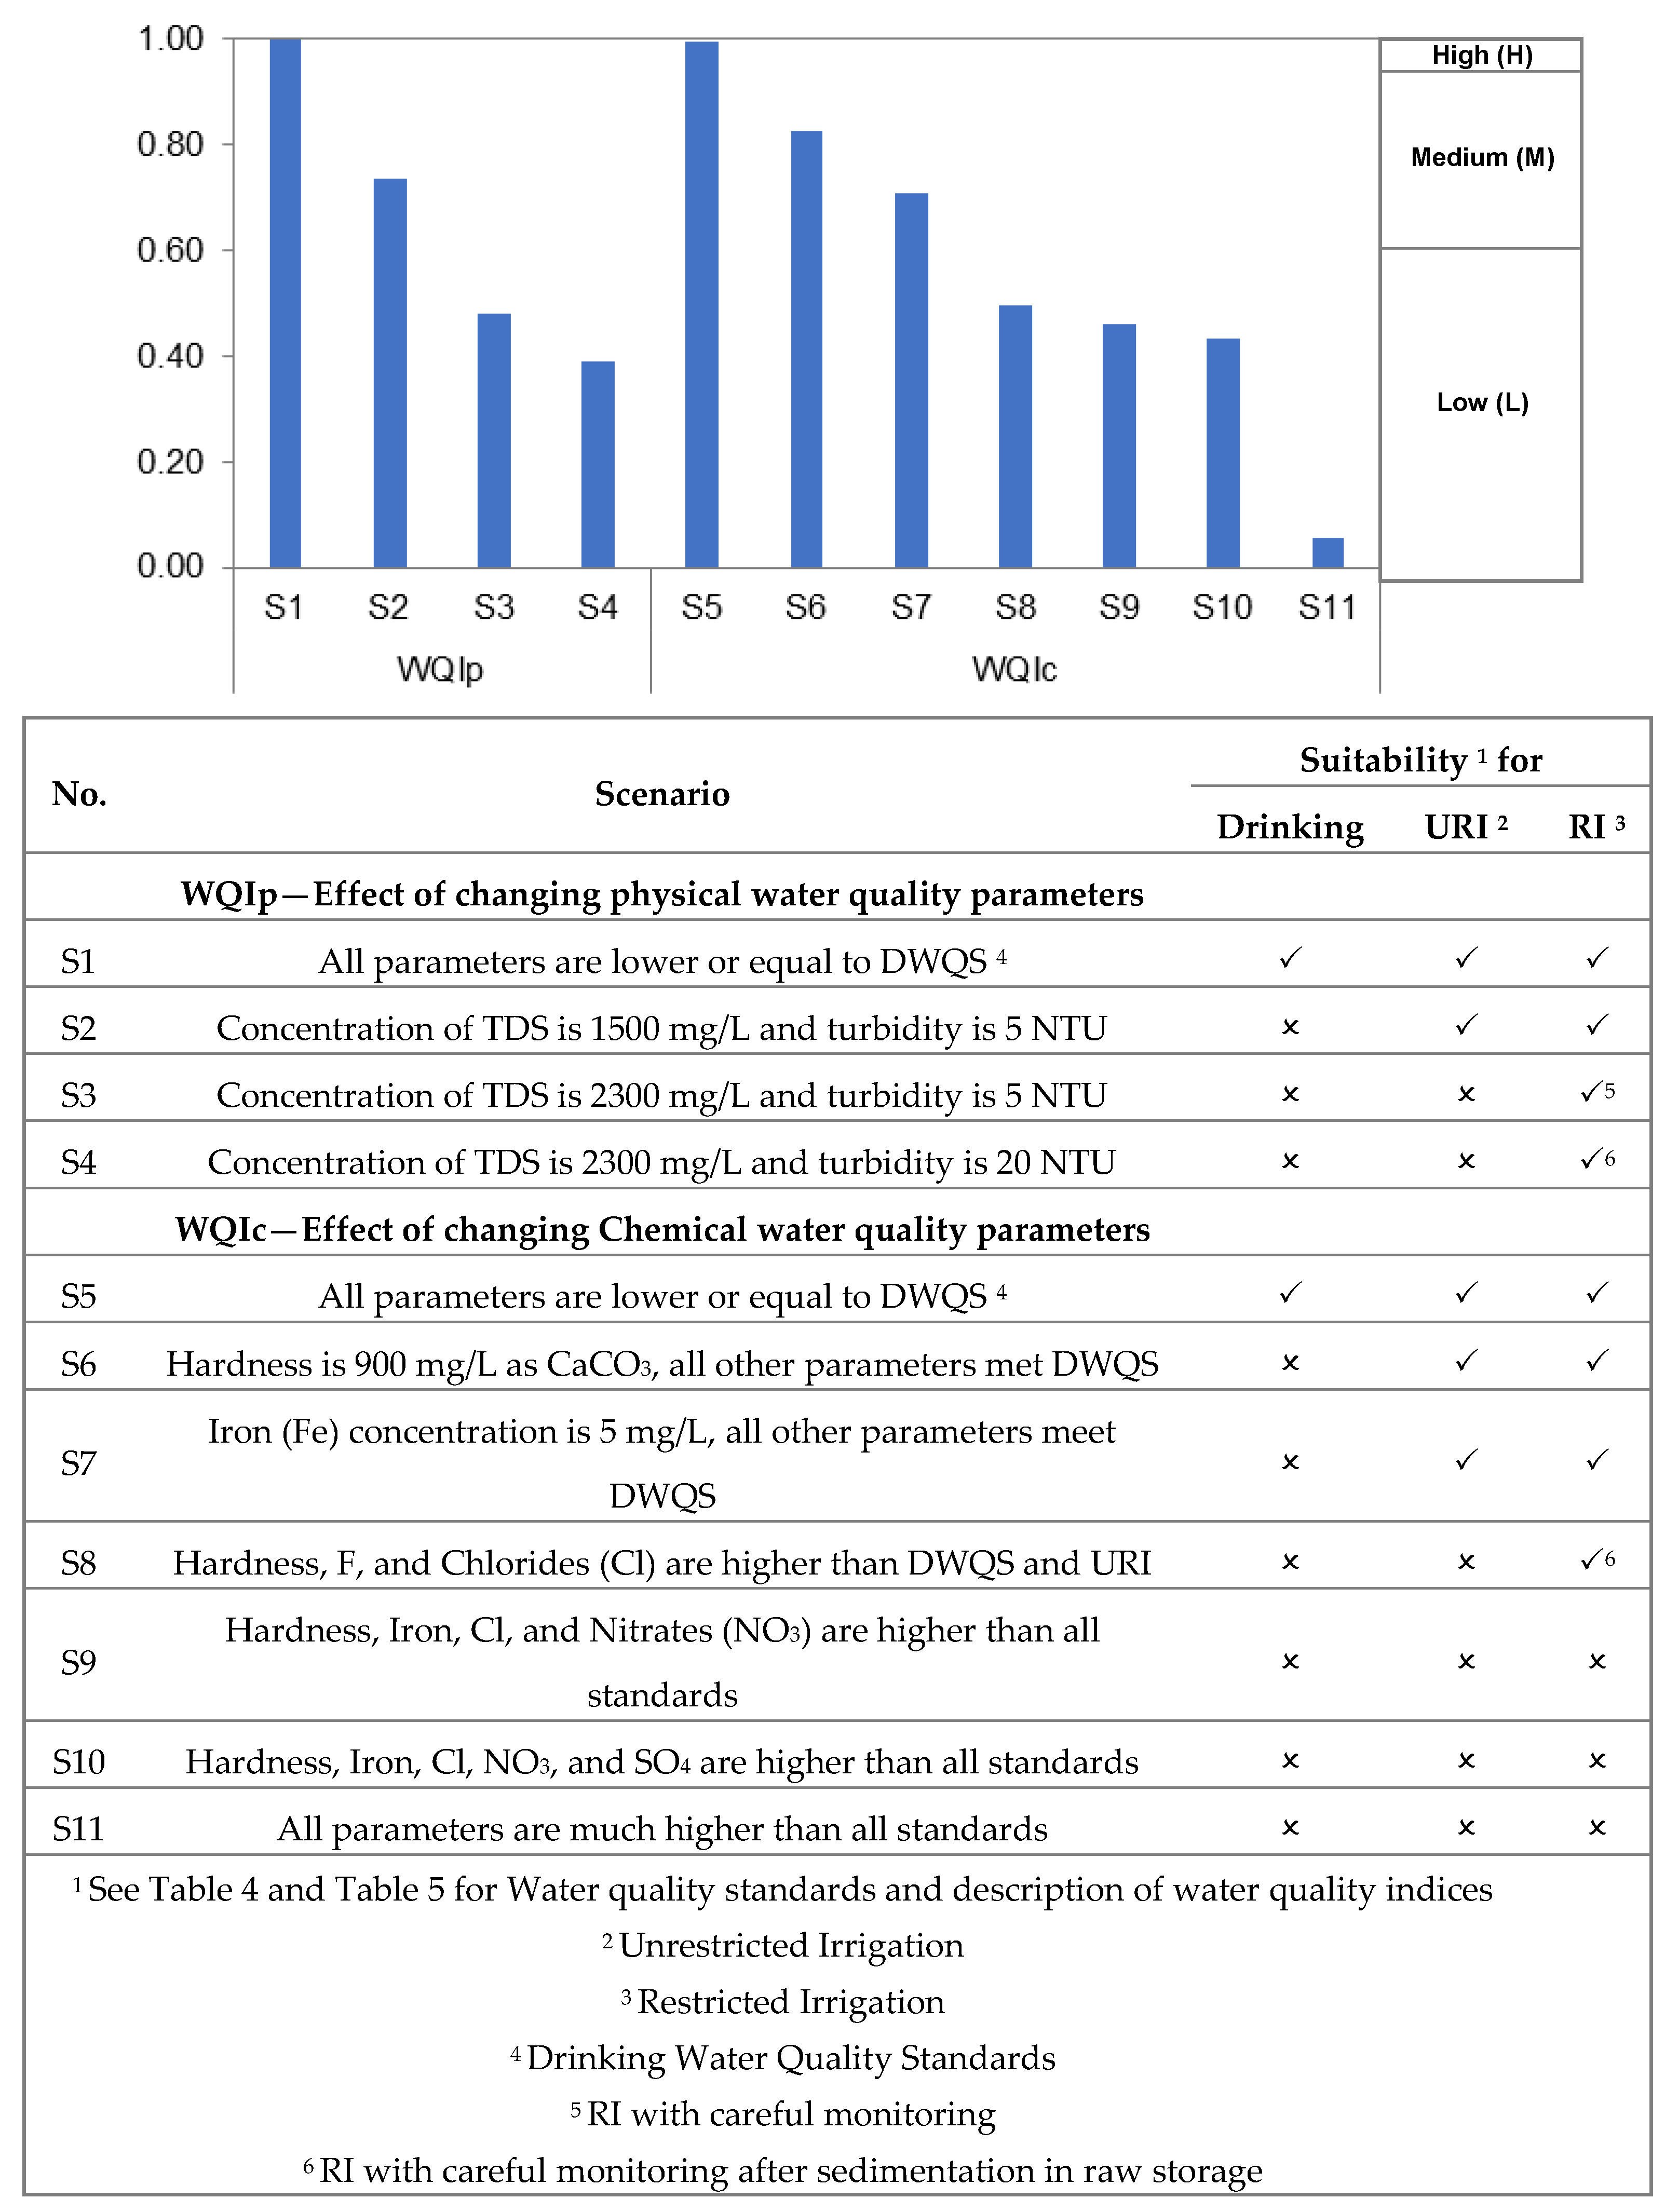
Application of the proposed framework on a case of 39 wells in Buraydah City (Qassim, KSA) found at least one or more WQPs higher than the drinking water quality standards in almost all the wells. A subjective rating scheme ranging from “High” to “Low” is proposed for linguistically defining different types of water quality indices. WQIp and WQIc were found “medium” for all the three well fields, while the WQIr varied from “low” to “medium”. However, the overall index (WQIo) was found “medium” for all the well fields. These results show that raw water is not potable without appropriate treatment. These assessment results justify the need of existing treatment processes in the study area. However, raw water can be used for both the unrestricted and restricted irrigation purposes with careful monitoring of individual water quality parameters. WQIo states the overall quality through a single measure for top-level management and public, while the sub-indices would be more useful for technical-level decision-making.
Application of fuzzy logic accommodates various possible uncertainties such as sampling and measurement errors, missing data, and difference of decision-makers opinions in the subjective weight estimation based on pairwise comparison. As small differences in concentrations cannot affect the type or cost of treatment, the results of WQIc cannot affect the existing treatment operations to meet the applicable drinking water quality standards.
Water quality assessment results revealed that the oldest well field located in the middle of the study area outperforms the remaining more recently developed well fields. Relatively new well fields located around the periphery of the city are supposed to be less affected by anthropogenic activities. Such observations affirm that the primary source of contamination in deep aquifers is the natural sub-soil condition.
The ranking of wells prioritizes the rehabilitation and renewal planning needs for underperforming wells in each well field. The spatial groundwater quality maps developed in present study are useful for the top-level management of the municipality, policymakers, operational personnel (water quality monitoring and engineering), as well as general public. The proposed framework provides a more structured approach for groundwater quality assessment in arid environmental regions. Future research may include additional WQPs (such as heavy metals) and data collected for a longer period in the assessment process. Moreover, prioritization of wells is based on their water quality performance, future research can include the cost implication in decision-making processes as well.

Author Contributions

H.H. developed the framework and methodology, data analysis, implementation of methods, and paper writing. A.R.G. was involved in development of framework and paper writing. I.S.A.-S. was primarily involved in data collection and framework development. H.T. collected and analyzed the water quality data obtained from the municipality. All authors have read and agreed to the published version of the manuscript.

Funding

This research was funded by Deanship of Scientific Research, Qassim University with Grant No. 3927-qec-2018-1-14-S.

Acknowledgments

The authors gratefully acknowledge Qassim University presented by Deanship of Scientific Research, on the material support for this research under the number (3927-qec-2018-1-14-S) during the academic year 1441 AH/ 2019 AD. Authors also acknowledge the municipalities in Qassim Region of Saudi Arabia for groundwater quality data sharing.

Conflicts of Interest

The authors declare no conflict of interest.

References

  1. Haider, H.; Al-Salamah, I.S.; Ghumman, A.R. Development of Groundwater Quality Index using Fuzzy-based Multicriteria Analysis for Buraydah, Qassim, Saudi Arabia. Arab. J. Sci. Eng. 2017, 49, 4033–4051. [Google Scholar] [CrossRef]
  2. Bamousa, A.O.; El Maghraby, M. Groundwater characterization and quality assessment, and sources of pollution in Madinah, Saudi Arabia. Arab J. Geosci. 2016, 9, 536. [Google Scholar] [CrossRef]
  3. Al-Ahmadi, M.E.; El-Fiky, A.A. Hydrogeochemical evaluation of shallow alluvial aquifer of Wadi Marwani, western Saudi Arabia. J. King Saud Univ. Sci. 2009, 21, 179–190. [Google Scholar] [CrossRef] [Green Version]
  4. Bob, M.; Abd Rahman, N.; Taher, S.; Elamin, A. Multi-objective Assessment of Groundwater Quality in Madinah City, Saudi Arabia. Water Qual. Expo. Health 2015, 7, 53–66. [Google Scholar] [CrossRef]
  5. Alhababy, A.M.; Al-Rajab, A.J. Groundwater Quality Assessment in Jazan Region, Saudi Arabia. Curr. World Environ. 2015, 10, 22–28. [Google Scholar] [CrossRef] [Green Version]
  6. Nazzal, Y.; Ahmed, I.; Al-Arifi, N.S.N.; Ghrefat, H.; Batayneh, A.; Abumarah, B.A.; Zaidi, F.K. A combined hydrochemical-statistical analysis of Saq aquifer, northwest part of Kingdom of Saudi Arabia. Geosci. J. 2015, 19, 145–155. [Google Scholar] [CrossRef]
  7. Haider, H. Performance assessment framework for groundwater treatment plants in Arid Environments: A case of Buraydah, Saudi Arabia. Environ. Monit. Assess. 2017, 189, 544. [Google Scholar] [CrossRef]
  8. Sharaf, M.A.; Hussein, M.T. Groundwater quality in the Saq aquifer, Saudi Arabia. Hydrol. Sci. J. 1996, 4, 683–696. [Google Scholar] [CrossRef] [Green Version]
  9. Mohamed, H.H.A.; Khairia, M.A.; Amani, S.A.; Lamia, A.A.; Khuloud, A.A. Estimation of Water Quality Index and Assessment of Some Heavy Metals in potable water at Kingdom Saudi Arabia. J. Appl. Sci. Res. 2012, 8, 3206–3210. [Google Scholar]
  10. Aly, A.A.; Al-Omran, A.M.; Alharby, M.M. The water quality index and hydrochemical characterization of groundwater resources in Hafar Albatin, Saudi Arabia. Arab. J. Geosci. 2015, 8, 4177–4190. [Google Scholar] [CrossRef]
  11. Al-Omran, A.; Al-Barakah, F.; Altuquq, A.; Aly, A.; Nadeem, M. Drinking water quality assessment and water quality index of Riyadh, Saudi Arabia. Water Qual. Res. J. Can. 2015, 50, 287–296. [Google Scholar] [CrossRef]
  12. Center for Sustainable Systems, University of Michigan. U.S. Water Supply and Distribution Factsheet; Pub. No. CSS05-17; University of Michigan: Ann Arbor, MI, USA, 2018. [Google Scholar]
  13. Minh, H.V.T.; Avtar, R.; Kumar, P.; Tran, D.Q.; Ty, T.V.; Behera, H.C.; Kurasaki, M. Groundwater Quality Assessment Using Fuzzy-AHP in an Giang Province of Vietnam. Geosciences 2019, 9, 330. [Google Scholar] [CrossRef] [Green Version]
  14. Gholami, V.; Khaleghi, M.R.; Sebghati, M. A method of groundwater quality assessment based on fuzzy network-CANFIS and geographic information system (GIS). Appl. Water Sci. 2017, 7, 3633–3647. [Google Scholar] [CrossRef] [Green Version]
  15. Vadiati, M.; Asghari-Moghaddam, A.; Nakhaei, M.; Adamowski, J.; Akbarzadeh, A.H. A fuzzy-logic based decision-making approach for identification of groundwater quality based on groundwater quality indices. J. Environ. Manag. 2016, 184, 255–270. [Google Scholar] [CrossRef]
  16. Srinivas, R.; Bhakar, P.; Singh, A.P. Groundwater quality assessment in some selected area of Rajasthan, India using fuzzy multi-criteria decision making tool. Aquat. Procedia 2015, 4, 1023–1030. [Google Scholar] [CrossRef]
  17. Hosseini-Moghari, S.M.; Ebrahimi, K.; Azarnivand, A. Groundwater quality assessment with respect to fuzzy water quality index (FWQI): An application of expert systems in environmental monitoring. Environ. Earth Sci. 2015, 74, 7229–7238. [Google Scholar] [CrossRef]
  18. Kiurski-Milosević, J.Ž.; Vojinović-Miloradov, M.B.; Ralević, N.M. Fuzzy model for determination and assessment of groundwater quality in the city of Zrenjanin, Serbia. Hemijska Industrija 2015, 69, 17. [Google Scholar] [CrossRef] [Green Version]
  19. Saberi Nasr, A.; Rezaei, M.; Dashti Barmaki, M. Groundwater contamination analysis using Fuzzy Water Quality index (FWQI): Yazd province, Iran. Geopersia 2013, 3, 47–55. [Google Scholar]
  20. Kumar, N.V.; Mathew, S.; Swaminathan, G. Multifactorial fuzzy approach for the assessment of groundwater quality. J. Water Resour. Prot. 2010, 2, 597. [Google Scholar] [CrossRef] [Green Version]
  21. Dahiya, S.; Singh, B.; Gaur, S.; Garg, V.K.; Kushwaha, H.S. Analysis of groundwater quality using fuzzy synthetic evaluation. J. Hazard. Mater. 2007, 147, 938–946. [Google Scholar] [CrossRef]
  22. Ahmed, I.; Nazzal, Y.; Zaidi, F.K.; Al-Arifi, N.S.N.; Ghrefat, H.; Naeem, M. Hydrogeological vulnerability and pollution risk mapping of groundwater in the Saq and overlying aquifers using the DRASTIC model and GIS techniques. Environ. Earth Sci. 2015, 74, 1303–1318. [Google Scholar] [CrossRef]
  23. Kabir, G.; Sumi, R.S. Power substation location selection using fuzzy analytic hierarchy process and PROMETHEE: A case study from Bangladesh. Energy 2014, 72, 717–730. [Google Scholar] [CrossRef]
  24. Serafim Opricovic, S. Fuzzy VIKOR with an application to water resources planning. Expert Syst. Appl. 2011, 38, 12983–12990. [Google Scholar] [CrossRef]
  25. The Water Treatments. Available online: https://www.thewatertreatments.com/water-treatment-news/water-quality-standards-saso-saudi/ (accessed on 10 July 2019).
  26. Al-Jasser, A.O. Saudi wastewater reuse standards for agricultural irrigation: Riyadh treatment plants effluent compliance. J. King Saud Univ. Eng. Sci. 2011, 23, 1–8. [Google Scholar] [CrossRef] [Green Version]
  27. Food and Agriculture Organization (FAO). Available online: http://www.fao.org/3/T0234E/T0234E01.htm#note1 (accessed on 1 December 2019).
  28. Hussain, G.; Alquwaizany, A.; Al-Zarah, A. Guidelines for irrigation water quality and water management in the Kingdom of Saudi Arabia: An overview. J. Appl. Sci. 2010, 10, 79–96. [Google Scholar] [CrossRef] [Green Version]
  29. WHO. Guidelines for Drinking Water Quality, 4th ed.; WHO Press: Geneva, Switzerland, 2011; p. 228. [Google Scholar]
  30. Abdel-Satar, A.M.; Al-Khabbas, M.H.; Alahmad, W.R.; Yousef, W.M.; Alsomadi, R.H.; Iqbal, T. Quality assessment of groundwater and agricultural soil in Hail region, Saudi Arabia. Egypt. J. Aquat. Res. 2017, 43, 55–64. [Google Scholar] [CrossRef]
  31. Haider, H.; Alkhowaiter, M.H.; Shafiquzzaman, M.; AlSaleem, S.S.; Almoshaogeh, M.; Alharbi, F. Spatiotemporal Water Quality Variations in Smaller Water Supply Systems: Using Modified CCME WQI from Groundwater Source to Distribution Networks. Water 2019, 11, 1884. [Google Scholar] [CrossRef] [Green Version]
  32. McGhee, T.J. Water Supply and Sewerage, 6th ed.; McGraw-Hill Publishing Company: New York, NY, USA, 2007. [Google Scholar]
  33. Havener, M. Radium Removal Technologies for Potable Groundwater Systems, Water World Website. 2016. Available online: http://www.waterworld.com (accessed on 6 November 2016).
  34. Althoyaib, S.S.; El-Taher, A. Natural radioactivity measurements in groundwater from Al-Jawa, Saudi Arabia. J. Radioanal. Nucl. Chem. 2015, 304, 547–552. [Google Scholar] [CrossRef]
  35. Shabana, E.I.; Abulfaraj, W.H.; Kinsara, A.A.; Abu Rizaiza, O.S. Natural radioactivity in the groundwater of Wadi Nu’man, Mecca Province, Saudi Arabia. Radiochim. Acta 2013, 101, 461–469. [Google Scholar] [CrossRef]
  36. El-Taher, A. Radon and its decay products in underground water from Qassim and its radiation hazards. J. Environ. Sci. Technol. 2012, 5, 475–481. [Google Scholar] [CrossRef] [Green Version]
  37. UNSCEAR. Report: Sources, Effects and Risks of Ionizing Radiation; United Nations Scientific Committee on the Effects of Atomic Radiation: New York, NY, USA, 2000; Available online: http://www.unscear.org/unscear/en/publications/2000_1.html (accessed on 15 September 2019).
  38. USEPA. Radionuclides Rule: A Quick Reference Guide; EPA 816-F-01-003, Office of Water (4606); Unites States Environmental Protection Agency: Washington, DC, USA, 2001.
  39. Lauria, D.C.; Ribeiro, F.C.A.; Conti, C.C.; Loureiro, F.A. Radium and uranium levels in vegetables grown using different farming management systems. J. Environ. Radioact. 2009, 100, 176–183. [Google Scholar] [CrossRef] [PubMed]
  40. Wang, C.; Chou, M.; Pang, C. Applying Fuzzy Analytic Hierarchy Process for Evaluating Service Quality of Online Auction. Int. J. Comput. Inf. Eng. 2012, 6, 586–593. [Google Scholar]
  41. Opricovic, S. Multicriteria Optimization of Civil Engineering Systems. Fac. Civ. Eng. Belgrade 1998, 2, 5–21. [Google Scholar]
  42. Opricovic, S. A fuzzy compromise solution for multicriteria problems. Int. J. Uncertain. Fuzziness Knowl. Based Syst. 2007, 15, 363–380. [Google Scholar] [CrossRef]
  43. MMRA. Technical Guidelines for the Use of Treated Sanitary Wastewater in Irrigation for Landscaping and Agricultural Irrigation, 1st ed.; Ministry of Municipal and Rural Affairs, Deputy Ministry for Technical Affairs, General Department for Infrastructure: Riyadh, Saudi Arabia, 2003. [Google Scholar]
  44. MWE. Technical Guidelines for the Use of Treated Sanitary Wastewater in Irrigation for Landscaping and Agricultural Irrigation; Ministry of Water and Electricity: Riyadh, Saudi Arabia, 2006. [Google Scholar]
  45. Montaña, M.; Camacho, A.; Serrano, I.; Devesa, R.; Matia, L.; Vallés, I. Removal of radionuclides in drinking water by membrane treatment using ultrafiltration, reverse osmosis and electrodialysis reversal. J. Environ. Radioact. 2013, 125, 86–92. [Google Scholar] [CrossRef]
  46. Kent, R.; Landon, M.K. Trends in concentrations of nitrate and total dissolved solids in public supply wells of the Bunker Hill, Lytle, Rialto, and Colton groundwater subbasins, San Bernardino County, California: Influence of legacy land use. Sci. Total Environ. 2013, 452, 125–136. [Google Scholar] [CrossRef]
Figure 1. Study area showing the three well fields constructed in different times. The boundary of the city shown in figure is tentative and was not defined by the municipality of Buraydah.
Water 12 00423 g001
Figure 2. Flow diagram of south water treatment plant in study area (modified from [7]).
Water 12 00423 g002
Figure 3. Methodological framework for groundwater quality assessment using various water quality indices for drinking, unrestricted irrigation (URI), and restricted irrigation (RI). Note: Turbidity (TURB), Total Dissolved Solids (TDS), Electrical Conductivity (EC), and Total Hardness (TH).
Water 12 00423 g003
Figure 4. α-cut of a triangular fuzzy number T ˜ (Source: Wang et al. [40]).
Water 12 00423 g004
Figure 5. Spatial water quality variations in three well fields of the study area: (a) physical water quality index (WQIp), (b) chemical water quality index (WQIc), (c) radioactive water quality index (WQIr), (d) overall water quality index (WQIo) (see geographical location of study area in Figure 1). Darker color tones correspond to higher concentrations of WQPs and thus a lower water quality.
Water 12 00423 g005
Figure 6. Scenario analysis results.
Water 12 00423 g006
Table 1. Summary of some relevant past studies on groundwater quality assessment.
No.Study ReferenceWeighting MethodAggregation MethodLocationNo. of WQPsNo. of Samples/WellsPhysical WQPsChemical WQPsRadioactive WQPsWell RankingSub-IndicesCombined Index
1.Minh et al. [13]Fuzzy-AHPSimple Weighted sumVietnam68--OO
2.Gholami et al. [14]Gradient descent methodNeuro-fuzzy hybridIran885-OO
3.Haider et al. [1]Fuzzy AHPFuzzy TOPSIS 1Saudi Arabia324O
4.Vadiati et al. [15]NoneFuzzy inference systemIran749-OO
5.Srinivas et al. [16]NoneFuzzy inference systemIndia1015-OO
6.Moghari et al. [17]NoneFuzzy inference systemIran917-OO
7.Milošević et al. [18]NoneFuzzy inference systemSerbia840--OO
8.Nasr et al. [19]NoneFuzzy inference systemIran1271-O
9.Kumar et al. [20]NoneFuzzy inference systemIndia1279-OO
10.Dahiya et al. [21]NoneFuzzy synthetic evaluation India1642-OO
1 Technique for Order of Preference by Similarity to Ideal Solution (TOPSIS). WQPs: water quality parameters; fuzzy AHP: fuzzy analytical hierarchy process.
Table 2. Fuzzy scales and triangular fuzzy numbers (TFN) used for linguistic variables.
Linguistic TermFuzzy NumberTFN (l, m, u)Linguistic TermFuzzy NumberTFN (l, m, u)
Extreme unimportance 9 ˜ 1 1/9, 1/9, 1/9Intermediate value between 1 ˜ and 3 ˜ 2 ˜ 1, 2, 3
Intermediate values between 7 ˜ 1 and 9 ˜ 1 8 ˜ 1 1/9, 1/8, 1/7Moderate importance 3 ˜ 2, 3, 4
Very unimportance 7 ˜ 1 1/8, 1/7, 1/6Intermediate value between 3 ˜ and 5 ˜ 4 ˜ 3, 4, 5
Intermediate value between 5 ˜ 1 and 7 ˜ 1 6 ˜ 1 1/7, 1/6, 1/5Essential importance 5 ˜ 4, 5, 6
Essential unimportance 5 ˜ 1 1/6, 1/5, ¼Intermediate value between 5 ˜ and 7 ˜ 6 ˜ 5, 6, 7
Intermediate value between 3 ˜ 1 and 5 ˜ 1 4 ˜ 1 1/5, 1/4, 1/3Very vital importance 7 ˜ 6, 7, 8
Moderate unimportance 3 ˜ 1 1/4, 1/3, ½Intermediate value between 7 ˜ and 9 ˜ 8 ˜ 7, 8, 9
Intermediate value between 1 ˜ and 3 ˜ 1 2 ˜ 1 1/3, 1/2, 1Extreme importance 9 ˜ 9, 9, 9
Equally importance 1 ˜ 1, 1, 1---
Table 3. Randomly generated values of consistency index (RI).
n12345688910
RI000.580.901.121.241.321.411.451.49
Table 4. Positive triangular ideal solution ( f i ˜ ) and the negative triangular ideal solution ( f i ˜ o )).
Water Quality Parameter (WQP) UnitsWater Quality Standards 1 f i ˜ f i ˜ o
DrinkingURI 2RI 3 l i m i r i l i o m i o r i o
Physical Water Quality Parameters
Total dissolved solids (TDS)mg/L60020002500400500600200022502500
Electrical conductivity (EC)μS/cm at 20 °C160–1600--6008001000300035004000
Turbidity (TURB)NTU155015205080
Chemical Water Quality Parameters
pH-6.5–8.56–8.4 6.578.588.59
Iron (Fe)mg/L0.3550.050.150.356.58
Total Hardness (TH)mg/L as CaCO3500--2003005008009001000
Chloride (Cl)mg/L250100-20022525080010001200
Nitrate–N (NO3)mg/L1010101.535203550
Sulphates (SO4)mg/L400600-50200350200400600
Radioactive Water Quality Parameters
Radium (226+228Ra)pci/L30--51530100120140
1 As per the WHO drinking water quality guidelines [17] and Saudi Arabian Standards (SAS) [25]; 2 unrestricted irrigation [43,44]; 3 restricted irrigation [43,44].
Table 5. Linguistic scheme for defining the groundwater quality index (GWQI).
Linguistic Performance LevelWater Quality Index (WQI)Suitability of WQIp for Remarks
DrinkingURI 1RI 2
Low (L)0.0 to <0.63
  • For WQIp, it might be a borderline situation for RI application.
  • For WQIc, careful monitoring is required for evaluating individual chemical water quality parameters for RI application.
  • High level of treatment is required to meet drinking water quality standards (DWQS).
Medium (M)0.6 to <0.96
  • Good water quality with most of the parameters meeting standards. But, some parameters are slightly higher than the drinking water quality standards. In general, water quality is suitable for irrigation applications.
  • Careful monitoring is required as the water quality is deteriorating with time, due to aging of wells and lowering of groundwater level, which may affect the effectiveness of existing treatment facilities.
  • High level of treatment is required to meet drinking water quality standards (DWQS).
High (H)≥0.96 to 1.0
  • For WQIp, WQIc, and WQIr, excellent water quality with all the parameters equal or lower than the target values stated in DWQS.
  • AND
  • For overall water quality index (WQIo) of the well field, all parameters meet DWQS after mixing of drawn water from different wells, i.e., impact of some small increase, of few WQPs, from DWQS in some wells vanishes due to dilution.
1 Unrestricted irrigation; 2 restricted irrigation; 3 Borderline situation requires careful monitoring, not applicable for WQIc.
Table 6. Summary of groundwater quality monitoring results for year 2016 in the study area.
Water Quality Parameters (WQPs)UnitsMIN 1MEANMAX 2SD 3CV 4
Well Field 1
Total dissolved solids (TDS)mg/L808981122234735.4
Electrical conductivity (EC)μS/cm at 20 °C11721471177250235.4
Turbidity (TURB)NTU7.218.827.27.540
pH-6.87.47.92.533.4
Iron (Fe)mg/L0.71.01.30.436.1
Total Hardness (TH)mg/L as CaCO323033960014342
Chloride (Cl)mg/L24630956812841
Nitrate – N (NO3)mg/L1.51234.51083.3
Sulphates (SO4)mg/L791623247848
Radium (226+228Ra)pci/L49.570.6951115.6
Well Field 2
Total dissolved solids (TDS)mg/L10801423202826118.3
Electrical conductivity (EC)μS/cm at 20 °C15662062294037818.3
Turbidity (TURB)NTU5.626.278.815.659.3
pH-6.97.310.50.911.7
Iron (Fe)mg/L0.22.07.62.098.5
Total Hardness (TH)mg/L as CaCO328447697421345
Chloride (Cl)mg/L312525110024046
Nitrate – N (NO3)mg/L0.728.9196.748.9169
Sulphates (SO4)mg/L711262334133
Radium (226+228Ra)pci/L2178.6121.127.134.5
Well Field 3
Total dissolved solids (TDS)mg/L47657393215327
Electrical conductivity (EC)μS/cm at 20 °C846111618573431
Turbidity (TURB)NTU11.232.713341125.6
pH-7.07.37.30.23.2
Iron (Fe)mg/L0.21.75.61.692.5
Total Hardness (TH)mg/L as CaCO32652943503010.1
Chloride (Cl)mg/L1101371782518
Nitrate – N (NO3)mg/L4.310.415.54.442.3
Sulphates (SO4)mg/L1131531962415.8
Radium (226+228Ra)pci/L47.781.998.818.722.9
1 Minimum (MIN); 2 Maximum (MAX); 3 Standard Deviation (SD); 4 Coefficient of Variation (CV).
Table 7. Estimated weights of WQPs and sub-indices using fuzzy-AHP.
Water Quality ParametersCombined Fuzzy Weights W ¯ l ˜
w i l w i m w i u
Physical water quality parameters---
Total dissolved solids (TDS)0.3910.5270.552
Electrical conductivity (EC)0.1570.1620.156
Turbidity (TURB)0.2610.3110.318
Chemical water quality parameters---
pH0.1160.1410.150
Iron (Fe)0.3310.3740.376
Total Hardness (TH)0.2230.2650.272
Chloride (Cl)0.1040.1250.132
Nitrate – N (NO3)0.0480.0570.062
Sulphates (SO4)0.0360.0370.041
Radioactive water quality parameters---
Radium (226+228Ra)1.001.001.00
Overall water quality index (WQIo)---
Physical water quality index (WQIp)0.4000.4510.455
Chemical water quality index (WQIc)0.2650.2950.300
Radioactive water quality index (WQIr)0.2550.2540.285
Table 8. Performance matrix for eight wells located in Well Field-3.
WQPsWells Located in Well Field No. 3Check Wells
W3-1W3-2W3-3W3-4W3-5W3-6W3-7W3-8Best Case ScenarioWorst Case Scenario
lmrlmrlmrlmrlmrlmrlmrlmrlmulmu
f1: pH6.967.067.167.17.27.37.027.127.226.917.017.117.077.177.277.367.467.567.567.667.767.47.57.66.578.588.59.3
f2: Fe1.231.251.280.981.001.031.341.361.391.551.571.605.565.585.611.771.791.820.180.200.231.221.241.270.150.150.37.588.5
f3: TH3103203302903003102662762862602702802552652753403503602892993092602702802003005009009501000
f4: Cl136146156146156166100110120102112122102112122141151161122132142168178188200225250100011001200
f5: NO33.34.35.313.714.715.78.49.410.45.36.37.314.515.516.513.814.815.85.56.57.51112131.535507090
f6: SO414114615113614114614114615115015516015015516016817317819119620110811311850100150250350500
Table 9. Results of fuzzy-VIKOR method.
WQPsWells Located in Well Field No. 3Check Wells
W3-1W3-2W3-3W3-4W3-5W3-6W3-7W3-8Best Case ScenarioWorst Case Scenario
lmrlmrlmrlmrlmrlmrlmrlmrlmulmu
S ˜ j −0.100.070.17−0.100.070.17−0.100.060.17−0.100.070.170.140.340.44−0.030.150.25−0.130.030.14−0.090.090.19−0.22−0.010.260.530.971.31
Sj Crisp 0.05 0.049 0.048 0.05 0.31 0.13 0.02 0.07 0.0 0.9
R ˜ j 0.160.180.210.180.240.290.070.130.180.210.240.260.880.910.930.180.240.29−0.380.260.50−0.440.200.44−0.040.000.800.961.151.34
Rj Crisp 0.18 0.24 0.13 0.24 0.91 0.24 0.16 0.10 0.19 1.15
Q ˜ j −0.370.000.49−0.370.010.51−0.40−0.020.48−0.360.010.500.110.511.00−0.290.100.60−0.57−0.020.54−0.540.020.58−0.56−0.140.760.551.262.06
Qj Crisp 0.03 0.04 0.01 0.04 0.53 0.13 −0.01 0.02 −0.02 1.28
(WQI)c0.949 0.951 0.952 0.950 0.687 0.870 0.983 0.932 1.0 0.0
M M M M M M H M H L
Table 10. Priority ranking of wells.
Well Field 1Well Field 2Well Field 3
QjWellPriority RankQjWellPriority RankQjWellPriority Rank
W1-130.2451W2-240.5861W3-50.3421
W1-30.1572W2-250.4212W3-60.2502
W1-150.1533W2-170.4043W3-20.2153
W1-60.1504W2-230.3534W3-70.1814
W1-100.1465W2-160.3505W3-80.1715
W1-140.1406W2-210.3366W3-10.0346
W1-50.1427W2-310.2787W3-40.0107
W1-20.1338W2-260.2728W3-3−0.0308
W1-10.1299W2-300.2689---
W1-70.12410W2-200.26610---
W1-80.12311W2-280.20011---
W1-110.10212W2-190.18112---
W1-120.09213W2-180.16013---
W1-40.07614W2-220.14614---
W1-9 *−0.048-W2-270.09315---
---W2-290.04716---
* excluded from ranking due to missing radioactive water quality data.

