Rethinking the Framework of Smart Water System: A Review


1
Department of Civil and Environmental Engineering, University of Utah, 201 Presidents’ Cir, Salt Lake City, UT 84112, USA
2
Department of Engineering Systems and Environment, University of Virginia, Charlottesville, VA 22903, USA
3
Unit of Environmental Engineering, University of Innsbruck, Innrain 52, 6020 Innsbruck, Austria
*
Author to whom correspondence should be addressed.
Water 2020, 12(2), 412; https://doi.org/10.3390/w12020412
Submission received: 19 December 2019
/
Revised: 28 January 2020
/
Accepted: 1 February 2020
/
Published: 4 February 2020
(This article belongs to the Special Issue Smart Urban Water Networks)
Abstract
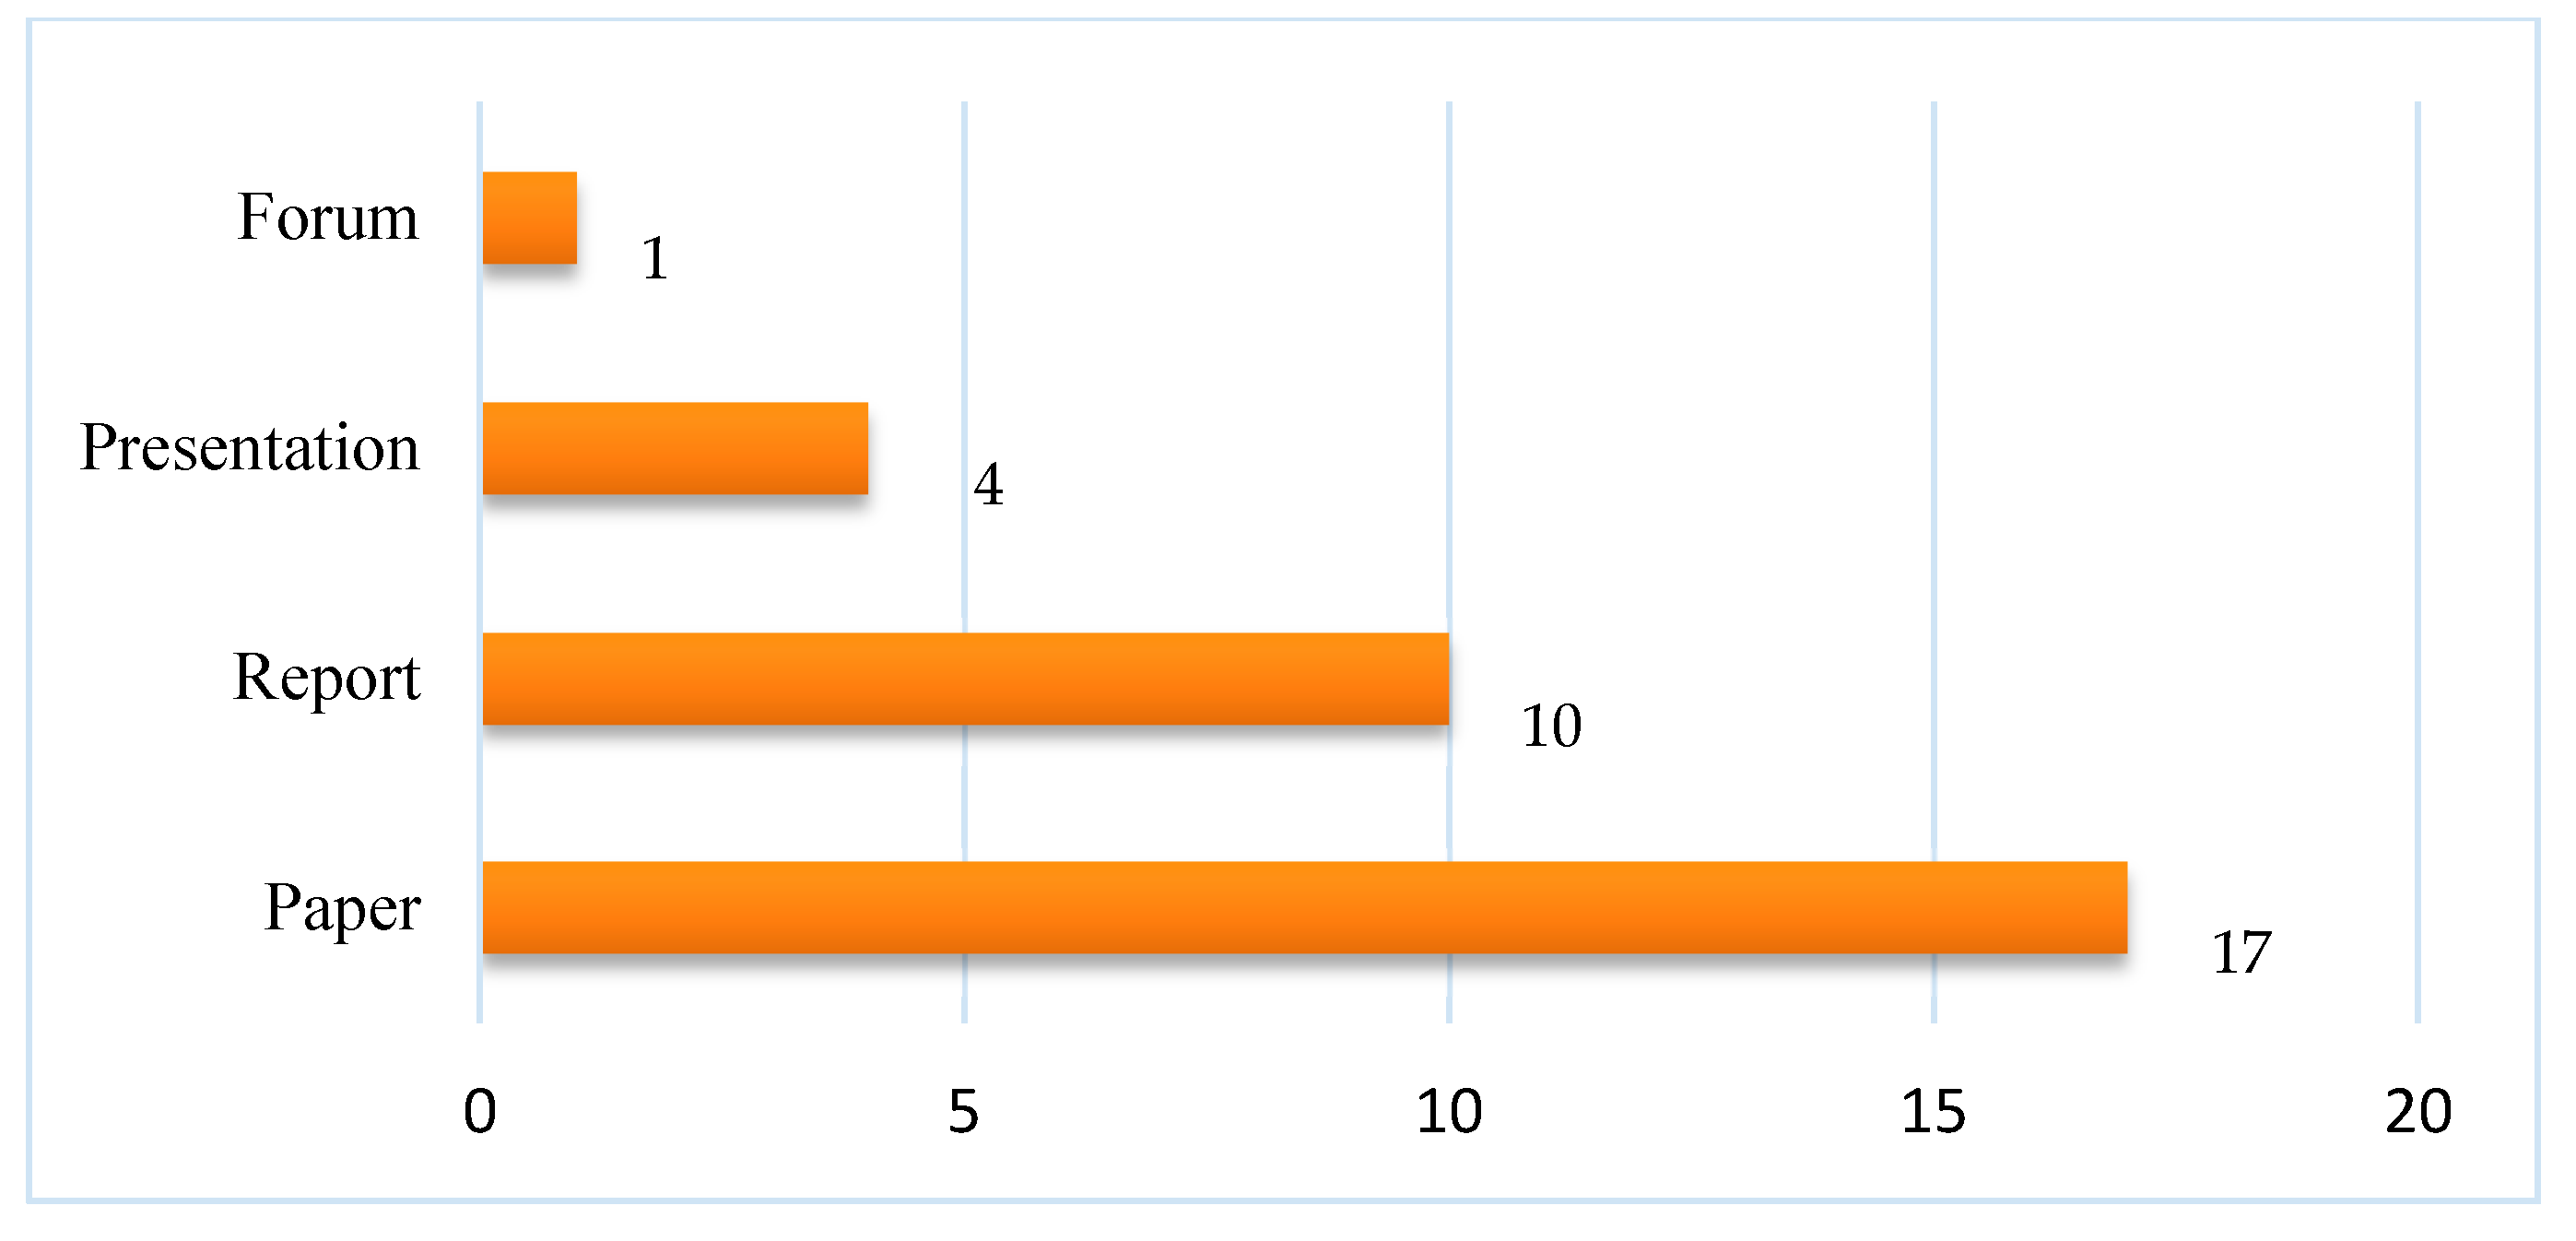
:Throughout the past years, governments, industries, and researchers have shown increasing interest in incorporating smart techniques, including sensor monitoring, real-time data transmitting, and real-time controlling into water systems. However, the design and construction of such a smart water system are still not quite standardized for massive applications due to the lack of consensus on the framework. The major challenge impeding wide application of the smart water network is the unavailability of a systematic framework to guide real-world design and deployment. To address this challenge, this review study aims to facilitate more extensive adoption of the smart water system, to increase effectiveness and efficiency in real-world water system contexts. A total of 32 literature pieces including 1 international forum, 17 peer-reviewed papers, 10 reports, and 4 presentations that are directly related to frameworks of smart water system have been reviewed. A new and comprehensive smart water framework, including definition and architecture, was proposed in this review paper. Two conceptual metrics (smartness and cyber wellness) were defined to evaluate the performance of smart water systems. Additionally, three pieces of future research suggestions were discussed, calling for broader collaboration in the community of researchers, engineers, and industrial and governmental sectors to promote smart water system applications.
1. Introduction
The world’s urban population has grown rapidly from 1.019 billion in 1960 to 4.117 billion in 2017 [1]. It is estimated that the population will reach 9.7 billion by 2050 [2]. The excessive population growth will cause urgent water problems like water shortage and water quality degradation in urban areas. In the 21st century, the global water sector faces quality and quantity challenges, which are highly related to climate change and population growth [3]. The 2018 Global Risk Report shows that most of the high risks (high-likelihood and high-impact) issues are water-related either directly or indirectly and are currently being exacerbated by climate change [4]. Water crises have become one of the five most significant risks in terms of their societal impacts. Additionally, the breaking of economic growth and unbalanced urbanization can also contribute to water shortage [5,6]. It is predicted that due to population and industrial growth the percentage of water scarcity will increase by 50% in developing countries and decrease by 18% in developed countries by 2025 [7]. One upcoming water scarcity event will occur in Cape Town, where it is supposed to be the first city to experience day zero but will not be the last if these threats still hold [8,9].
However, due to the growing complications of water-related issues such as water shortage, water deterioration, and aging infrastructure, traditional techniques, and management for drinking water supply have gradually shown their drawbacks and incapability to address these water issues [10]. Climate change and anthropic activities exacerbate the water issues by reducing water quantity and deteriorating water quality. Especially, the limited effort on ecological maintenance results in the pollution being increasingly found in the water distribution system for the public around the world. There is an urgent need for modernized water supply technologies to alleviate current water concerns by improving water supply efficiency and approaching sustainable water management globally [11]. Traditionally, engineers and researchers get used to re-sizing water supply systems. However, upgrading the existing water distribution network is time-consuming and costly. Instead, retrofitting the water system with smart components such as sensors, controllers, and a data center can achieve real-time monitoring, transmitting, and controlling in water systems for decision-makers, which is a more cost-effective and sustainable approach to address the water challenges [12].
To date, automated control technology (ACT) and information communication technology (ICT) are applied to tackle existing problems in water distribution networks, where both technologies play critical roles in large-scale ACT and ICT applications. A number of study cases around the world consider using smart water metering to monitor the water consumption and further track leakage and pipe burst issues in water distribution networks [7]. The real-time measurements can be utilized to improve the accuracy of hydraulic model calibration and forecasting. Real-time control is commonly applied in pumping, valve operation, and scheduling. The water supply efficiency significantly benefits from automatic control technology but the electricity energy efficiency needs optimization in practical applicability. If matched with appropriate and effective ICT or ACT solutions, in the form of a smart water system (SWS), city-wise water issues can be appropriately addressed and managed [13]. In SWS, progress can be made via smart metering (real-time monitoring that transmits data to the utility) and intelligent controlling (real-time feedback and action). For example, the Western Municipal Water District (WMWD) of California utilities have used the SCADA system to manage real-time alarms and automatically operate plants and networks [14]. The implementation of SCADA has been associated with 30% savings on energy use, a 20% decrease in water loss, and a 20% decline in disruption [15]. In Brisbane City, Australia, the web-based communication and information system tools are used by governments and municipalities to deliver relevant water information to the public, as well as to provide early warnings [16]. Another SWS case is in Singapore, where a real-time monitoring system called WaterWiSe was built, utilizing wireless sensor networks and data acquisition platforms to improve the operational efficiency of the water supply system [17]. Moreover, in San Francisco, the automated real-time water meters are installed among those communities for more than 98% of their 178,000 customers to transmit hourly water consumption data to the billing system via wireless sensing networks [18]. This access to frequently updated water consumption information allows engineers to detect water quality events and localize pipe leaks faster than traditional water systems that are still using existing manually-read meters [19]. Given these ACT and ICT applications in water sectors, smart water concepts therefore emerge and inspire SWS to be widely accepted by large amounts of stakeholders.
The terms “smart water grid,” “smart water supply system,” “smart water system” or “smart water network” have been widely spread. The concept of SWS in the urban water field is gaining great impetus among academia, government, and industry, drawing attention from international communities (SWAN, EWRI, HIC, and CCWI) to top-level organizations (IWA, AWWA, AWC-Asian Water Council). Other international collaboration projects (e.g., i-WIDGT from EU [20], CANARY from US [21], SEQ from the Australian water resources department [22], and Smart City reports [23]) are providing professional support to smart urban water infrastructure all over the world [24,25,26]. Although researches on SWS are speeding up to meet the demand of industry and government, the conceptual, technical and practical gaps between providers and clients are still not well bridged. The influences of SWS could be more significant and essential if priorities are precisely defined and implemented into sensing technology domains in water contexts [27]. As a consequence of the lack of a systematic consensus from conceptual, technical, and practical perspectives, investigating the current architectures, initiatives, and applications of SWS around the world must be required to help generate a better understanding of the definitions, characteristics, and future trends of SWS. While review studies related to SWS and smart grid areas have already been undertaken [28,29,30,31], a review of SWS in conceptual and comprehensive prospects, with a further notification on the definition, architecture, and metrics, is missing. To address this research gap, this paper is going to analyze the existing SWS concepts, identify the possible metrics for SWS, and establish a more systematic SWS architecture, to enlighten future research on its implementations.
This review paper is structured as follows: firstly, the current definitions and historical development of SWS are presented and discussed in the introduction section, reviewing the evolution of SWS from the past to the date and analyzing the weakness of the current water system. Secondly, given the previous literature of SWS, a new architecture of SWS with five layers is put forward and demonstrated explicitly. Then, by reconciling definitions and architectures, two metrics of SWS are proposed to characterize its properties. Finally, recommendations on future research directions are given for smart water system development.
2. Literature Review of SWS
SWS is a multidisciplinary term. A ScienceDirect search for “Smart” or “Intelligent” in the title, abstract, and keyword gave a total of 31,527 article results. However, most of them belong to smart transportation, smartphone, and smart grid fields. If “water” is included in the search, the number goes down to 9847. Further searching “Smart Water System” made the results decline to 9517. By adding “framework” to the “Smart water system” only 4026 articles remained. Given that searching results, we conducted the literature review by considering relevant references from the selected papers. The step-by-step literature searching rules were summarized below: (1) “Smart” or “Intelligent” in title, abstract, and keyword with 31,527 article results; (2) “Smart Water” in title, abstract, and keyword with 9517 article results; (3) “Framework” and “Smart Water” in title, abstract, keyword, and body with 4026 article results; (4) “Structure”, “Layer”, “Framework” and “Smart Water” by manual filtering with 32 article results. These 32 final pieces of literature, including four article forms such as forums, papers, reports, and presentations gain high popularity in multiple sources like Google Scholar, SCOPUS, and ScienceDirect. All the papers come from the recent 10–15 years; they provide a wide presentation of the smart water system for the readers, which include the typical arguments of the framework of SWS. With insight from these literatures in Table 1, there are 17 papers, 10 technical reports from different well-known organizations including the International Telecommunication Union [32], U.S Environment Protection Agency [33], UK Department for International Development [34], UN Global Opportunity Committee [35,36,37,38], and Colorado State University [39]. Four key presentations and one International forum [40,41] are also taken into consideration in this review. As the number of studies that we reviewed is limited, this paper does not cover all aspects of SWS.
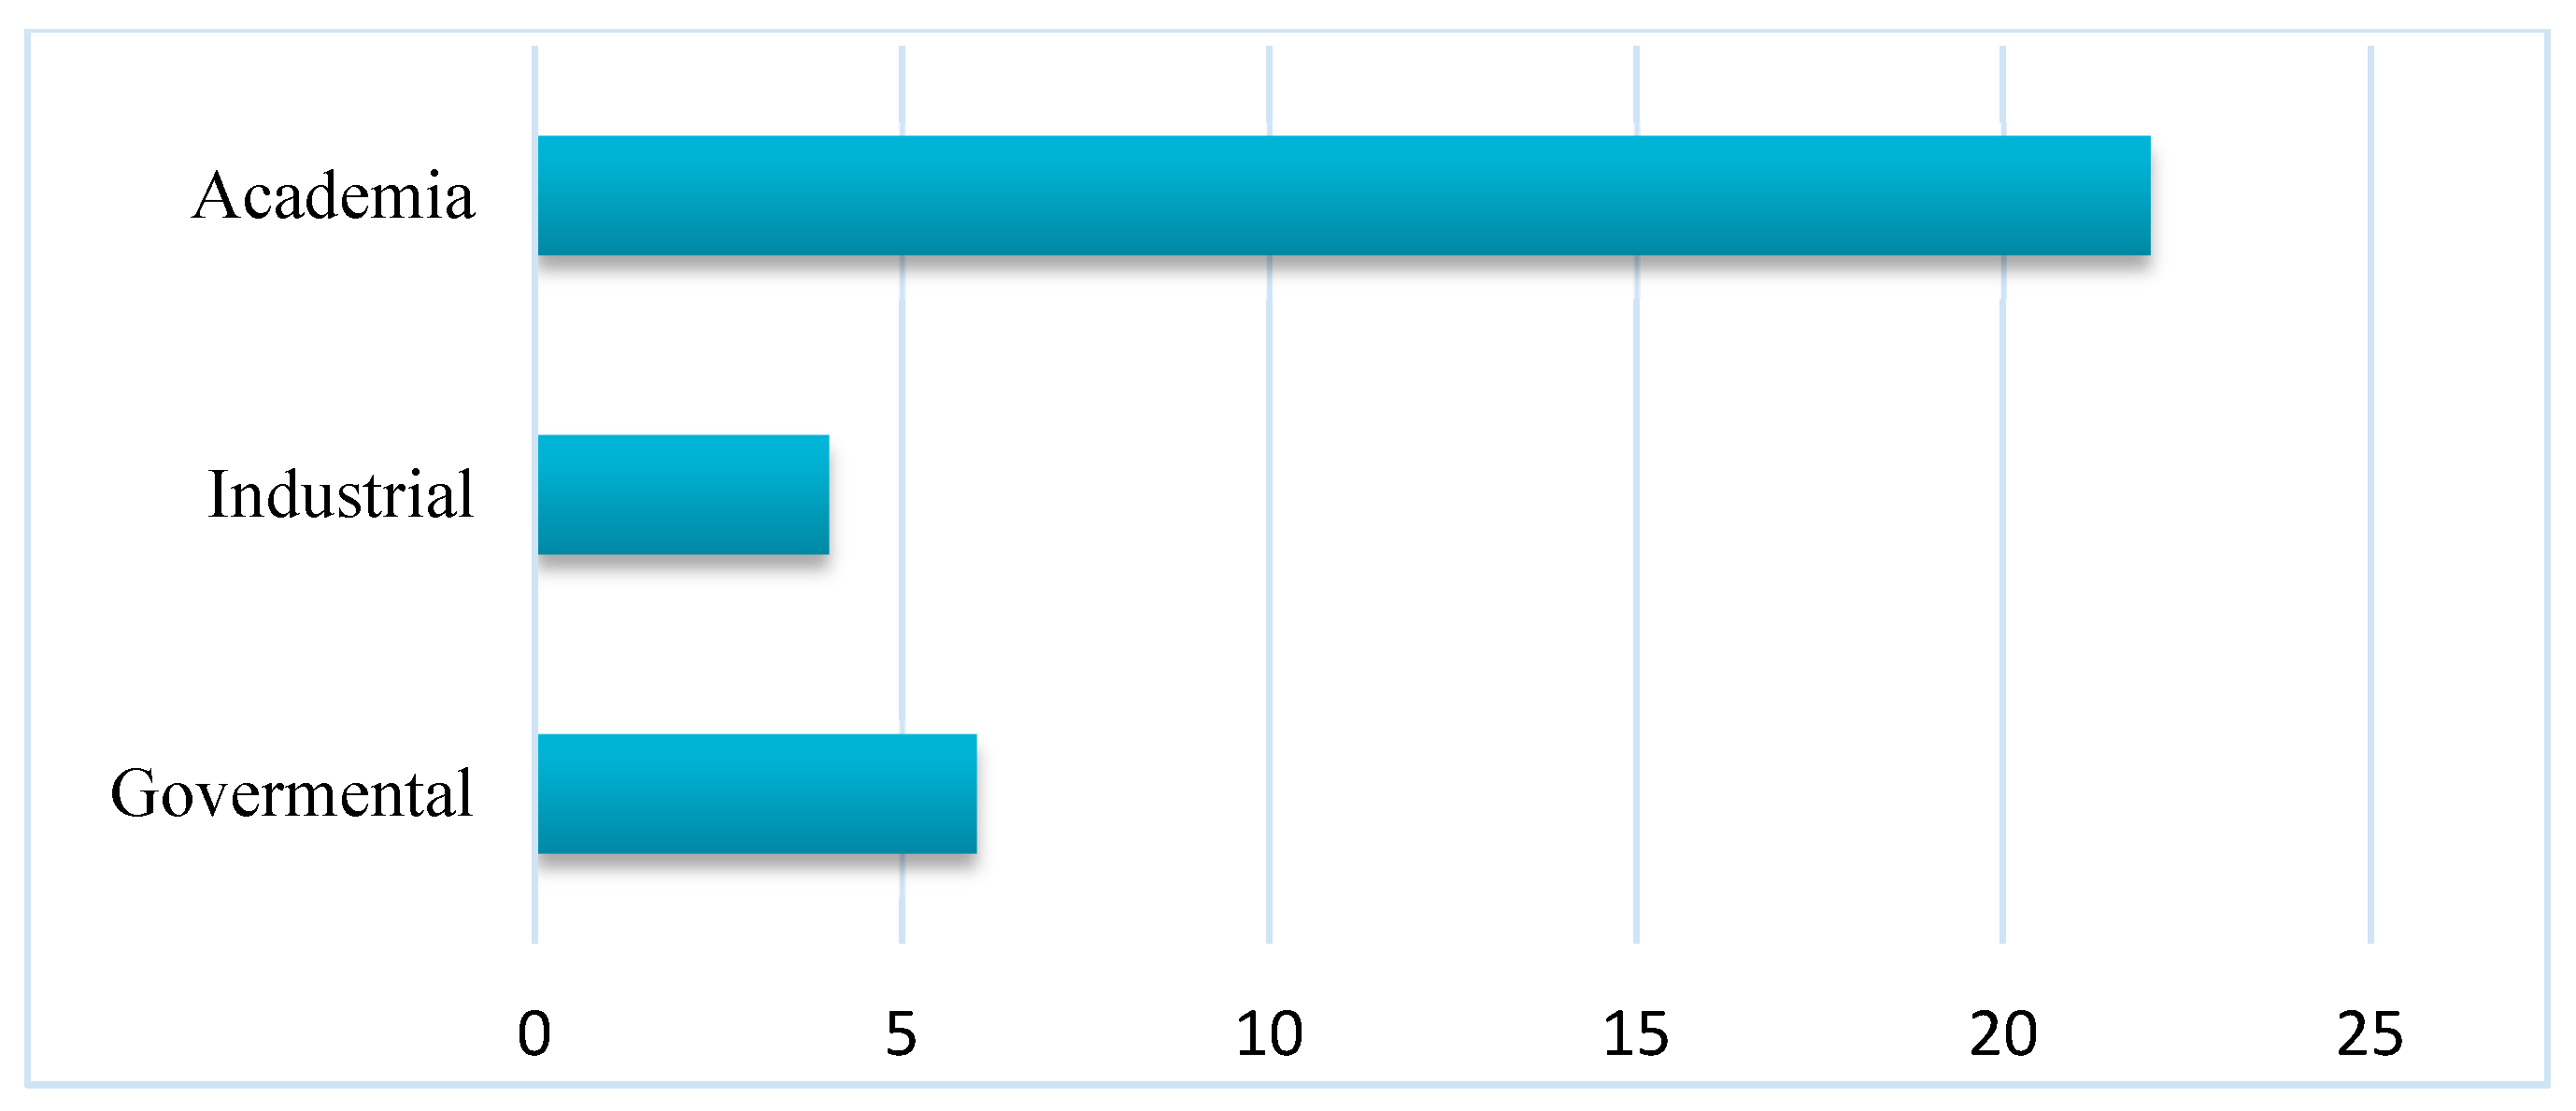
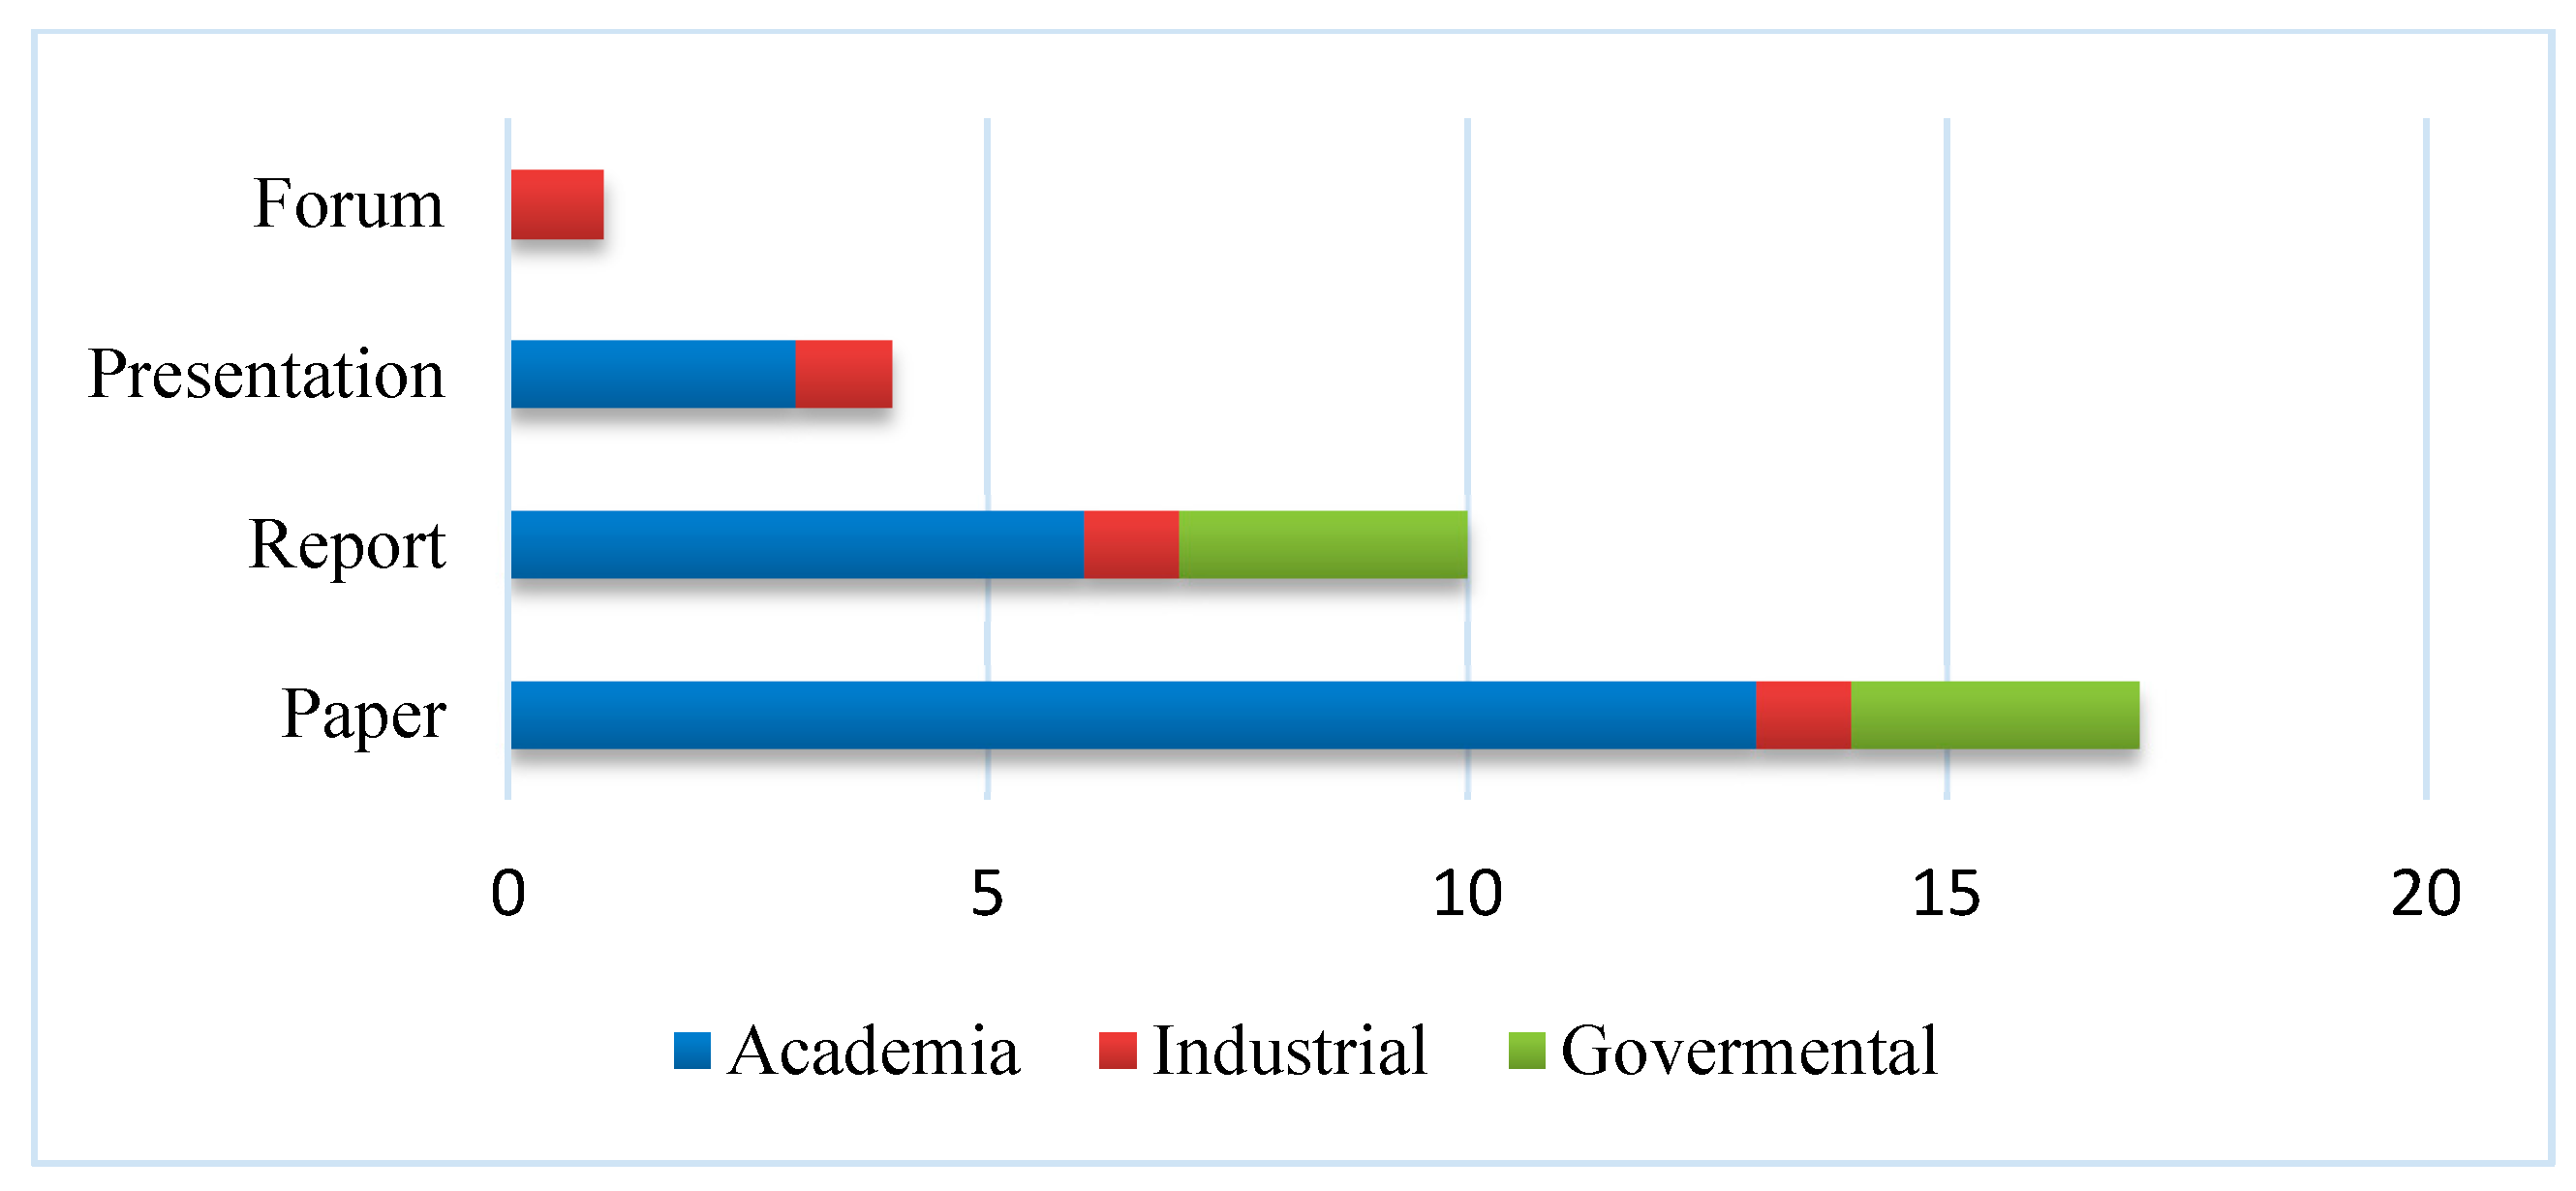
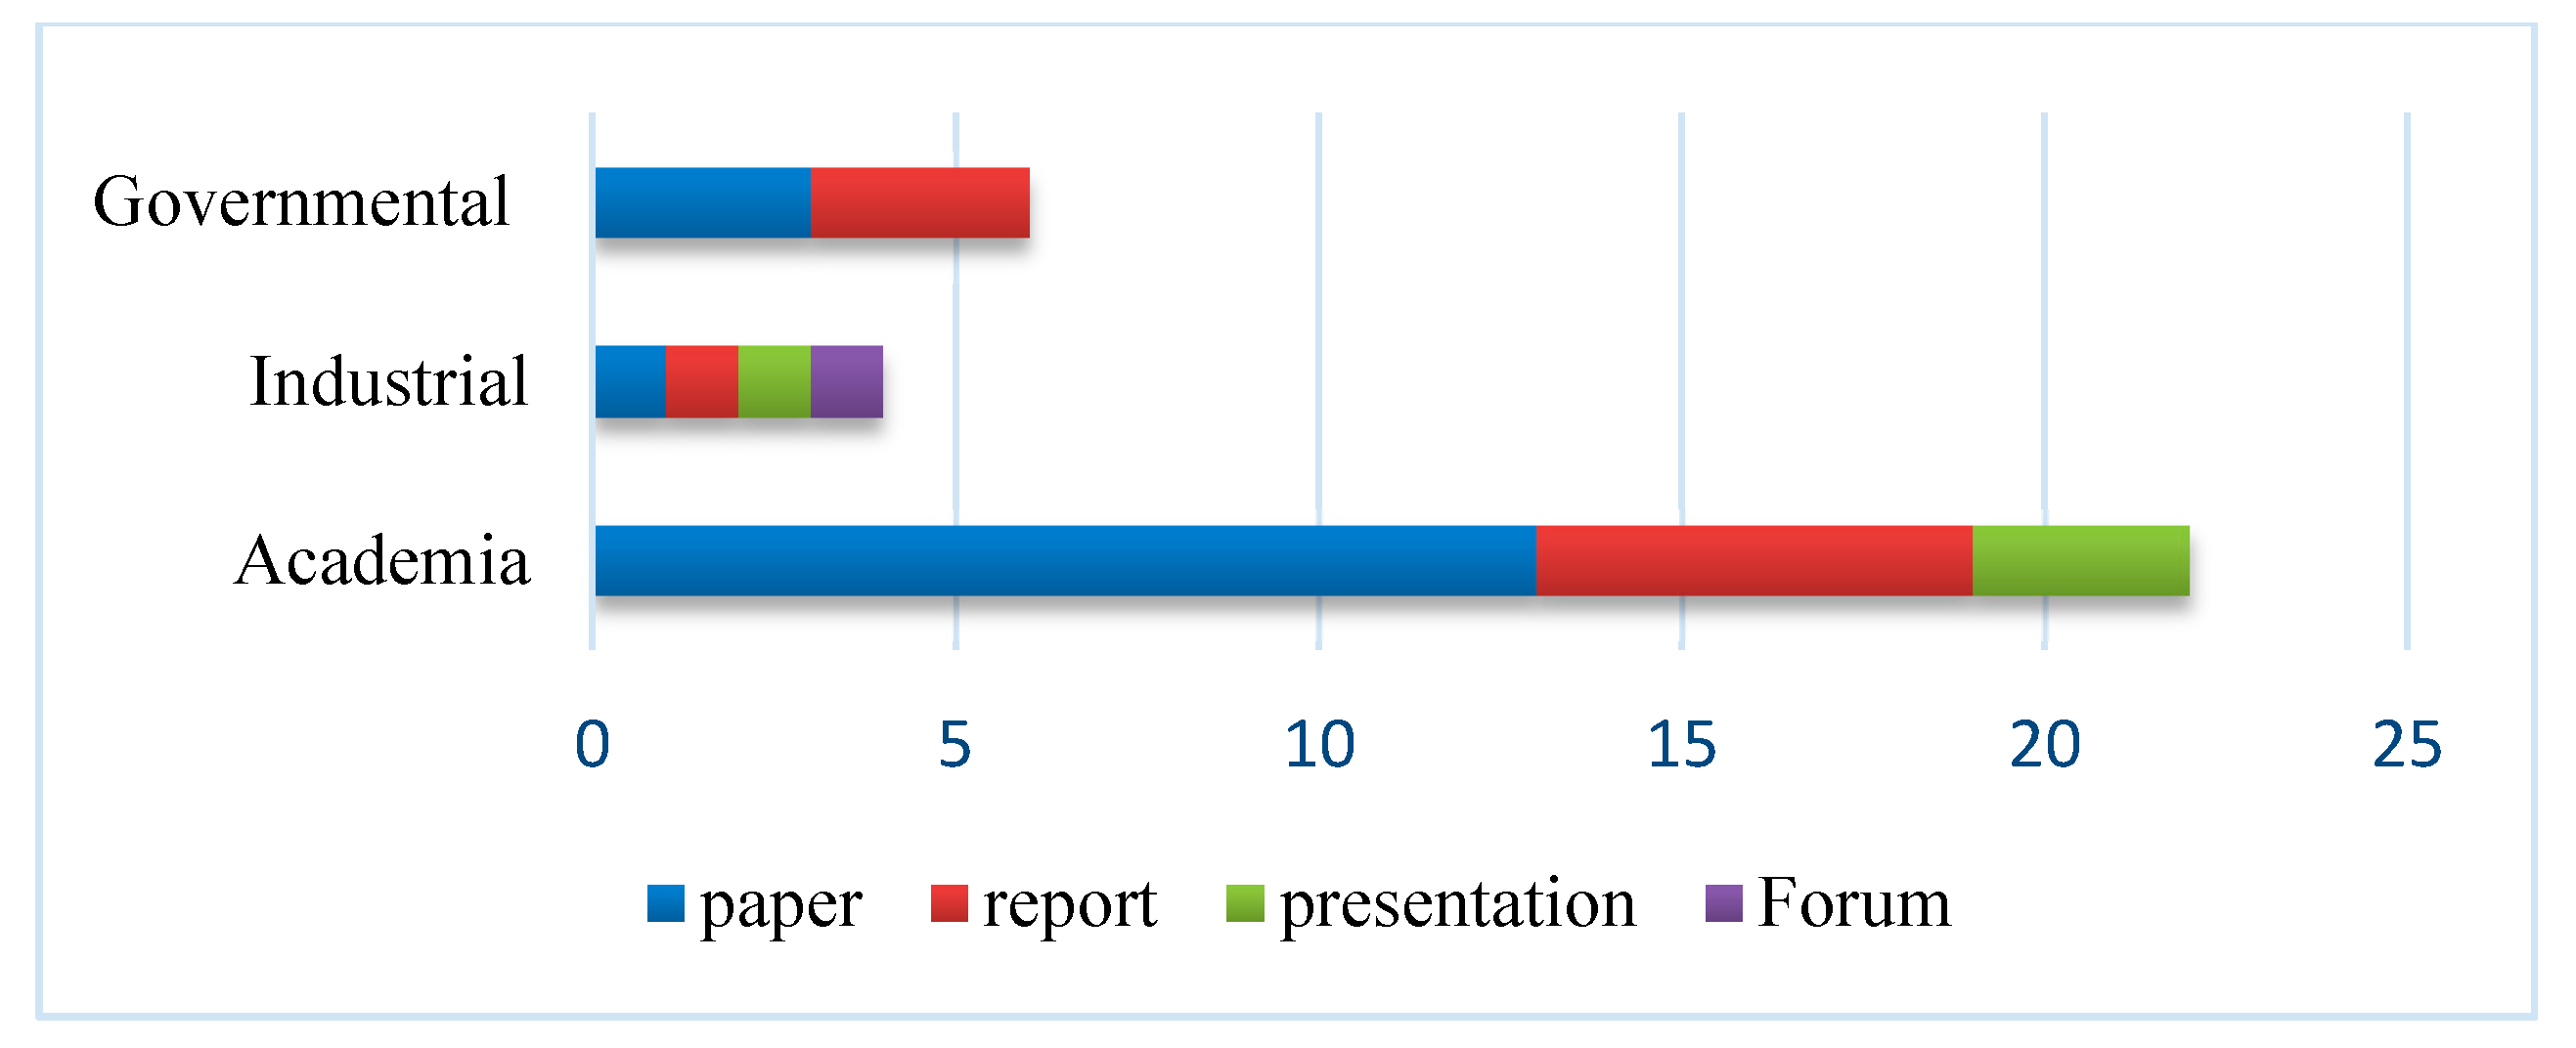
A graphical statistical data overview of the 32 selected literature is presented in Figure 1, Figure 2, Figure 3 and Figure 4. In Figure 1, these pieces of literature are classified into four types including the forum, presentation, report and paper based on their literature formats. In Figure 2, they are reclassified into three types—academia, industrial, and governmental based on their published organizations. As Figure 1 shows, paper and report take up the highest percentage while key presentations and forums occupy only a small portion, which shows that current SWS studies are mainly documented by papers and reports for efficient sharing. The 22 publications out of a total of 32 from academia in Figure 2 imply that most SWS researchers are from universities and academic research institutions. There is a lack of industrial and governmental inputs for such interdisciplinary work in the SWS field. In Figure 3 and Figure 4, it is clear how the percentages of each type of publication weight in each classification group. For example, in Figure 3, among those SWS papers, the highest percentage of publications are from academia. In contrast to the data presented in Figure 3, Figure 4 shows the different picture that there are equal numbers of all four literature formats in industrial publications.
The following is a list of works of literature related to the framework of the smart water system in Table 1. We categorized these papers according to the smart water definition, structures (Instrument layer, Property layer, Function layer, Benefit layer, Application layer), and metrics, which correspond with the components of the proposed SWS framework below. The definition provides theoretical support for SWS structures, and the metrics can be used to evaluate the SWS performance. These five basic layers inside structures consist of a comprehensive SWS architecture. The relationship among definitions, layers, and metrics make SWS work, which is considered as the reason for the literature classification in this study. In Table 1, “Instrument” represents the instrument layer of SWS including the physical and ACT and ICT components. “Property” means the property layer of SWS containing the components like systems attributes. “Function” represents the function layer of SWS such as data fusion in the data center. “Benefit” represents the benefit layer including features like water quality security and energy saving. “Application” represents the application layer such as commercial and educational applications. “Metrics” relate to the methods applied to evaluate the smart water system. “Future research” stands for research direction recommendations regarding the smart water system. Each reference might include but not all components (definition, layers, and metrics) of the smart water system. A black solid circle was used to mark the elements that references have covered. It can be found that most of the pieces of literature have definitions of SWS. However, none of them have covered all key layers. Since SWS is built for different purposes, the structure of SWS may vary from case to case. Furthermore, among all those pieces of literature that we reviewed, only 7 of them discussed metrics for SWS. How to assess the performance of SWS was not fully explored based on currently available literature. It was evident that there is still great potential to improve the consensus and understanding of SWS. Table 1 also shows that over 90% of the relevant literature has recommended future research directions for SWS. This paper will summarize these suggestions later in Section 5.
3. A Systematic Framework of SWS
A systematic architecture of SWS is comprised of various layers working synergistically to perform useful functions and applications [62]. Such a system can be represented as a set of components, with specific properties and benefits. In past years, previous studies proposed various versions of SWS to meet their particular demands. The combinations of SWS that are water management technologies and ICT distinguished from traditional water management technologies were put forward [54]. However, the scopes and characteristics of such SWS were not identified. Further, the term “SWG” refers to an advanced smart water grid that includes real-time information sharing through smart measurement and networking and a sustainable water distribution infrastructure [46]. The smart components in SWG imply that a smart water network should comprise smart meters, smart valves, and smart pumps by definition [28]. These smart elements including physical electronic parts, like sensors and microcontrollers, communication protocols, and embedded systems are all folded in the concept of the Internet of Things (IoT), which is the foundation of SWS [46]. The structure of SWS, therefore, should contain three frameworks: the hierarchy framework, technical system, and function framework [61].
In the hierarchy framework and technical system, there are also numerous pieces required. An easy-to-understand architecture of SWS would be preferred. The principals of the smart water network were then explained [44]. This research can be segmented in various layers: (1) physical layer (like pipes); (2) sensing and control layer (like flow) sensors and remote control; (3) data collection and communication layer (like data transfer); (4) data management and display; (5) data fusion and analysis (like analysis tool and even detection, leakage detection, and decision making). Nonetheless, these layers still only contain physical and cyber components and a lack of improvement to the service level. It was proposed that SWS contains 5 layers: physical layer, sensing layer, and control layer, collection and communication layer, data management and display layer, and data fusion and analysis layer [53]. They also put forward a bottom-up framework of SWS with 5 layers: sensing layer, transport layer, processing layer, application layer, and unified portal layer, which are based on IoT and cloud computing [53]. Another SWS composed of 4 stages was established to secure the vast amounts of high-resolution assumption data and customized information [20].
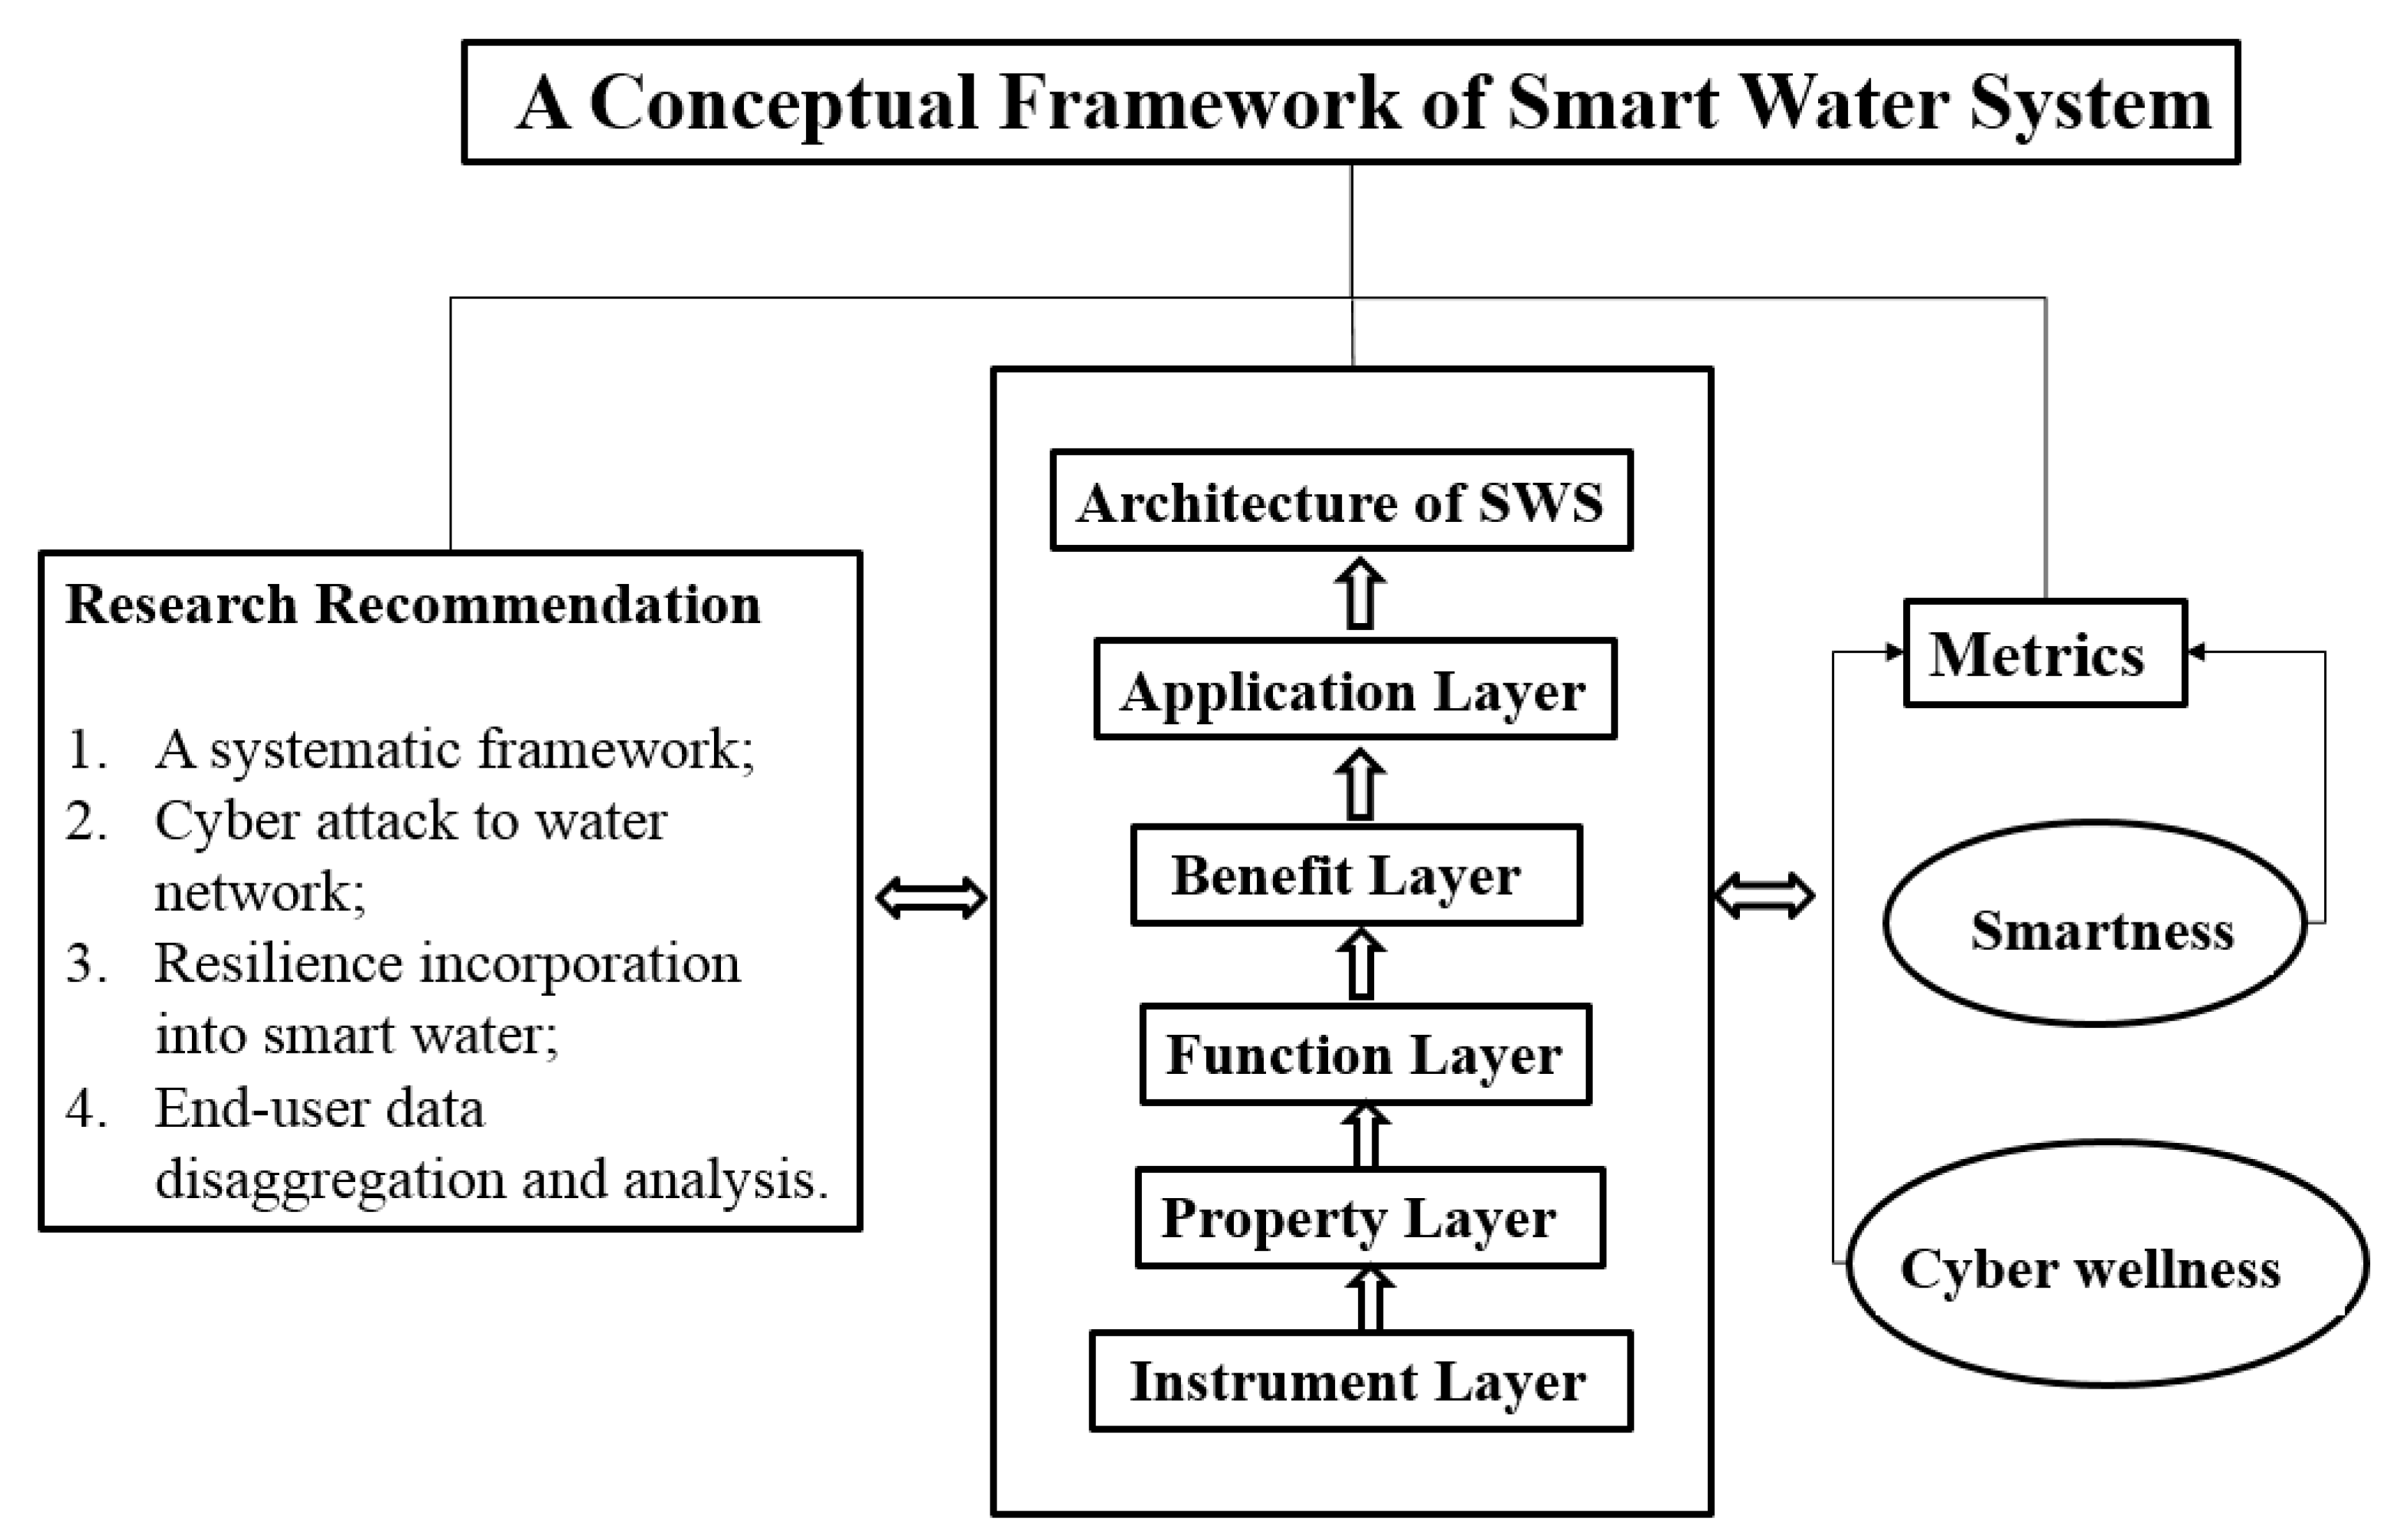
The most widely accepted smart water architecture is characterized by five layers: the physical layer, sensing, and control layer, collection and communication layer, data management and display layer, and data fusion and analysis layer. Each segment covers a distinct function in the network [62]. However, all SWS introduced above are under debate since most of them are defined for one particular purpose without complete demonstration. Some of them are for smart water targets, some stress the innovation of mechanism, while others emphasize the application of ICT. Very few of in situ frameworks for understanding SWS are comprehensive and directly applicable for education, research, and public. They lack some critical elements like properties, metrics and case studies, and the ability to guide future research directions. Hence, it is necessary to build a systematic framework of SWS to further the understanding of SWS and accelerate the implementation of SWS. In this study, we adopt and integrate some of the existing architectures to propose systematic architecture. Figure 5 illustrates the authors’ conceptual representation of an orderly architecture of SWS within a systematic smart water framework. There are five layers (from bottom to top: instruments layer, function layer, property layer, benefits layer, and application layer) that are proposed in order to understand how systematic architecture is implemented in the SWS framework. Although such a conceptual framework has not been tested in the field, this provides the guidance for engineers to replicate the SWS according to their purposes and application. For instance, a smart water test-bed for educational purposes can be built on the lab by following the SWS framework, while the application layer might be unnecessary in this case [63].
3.1. Instruments Layer
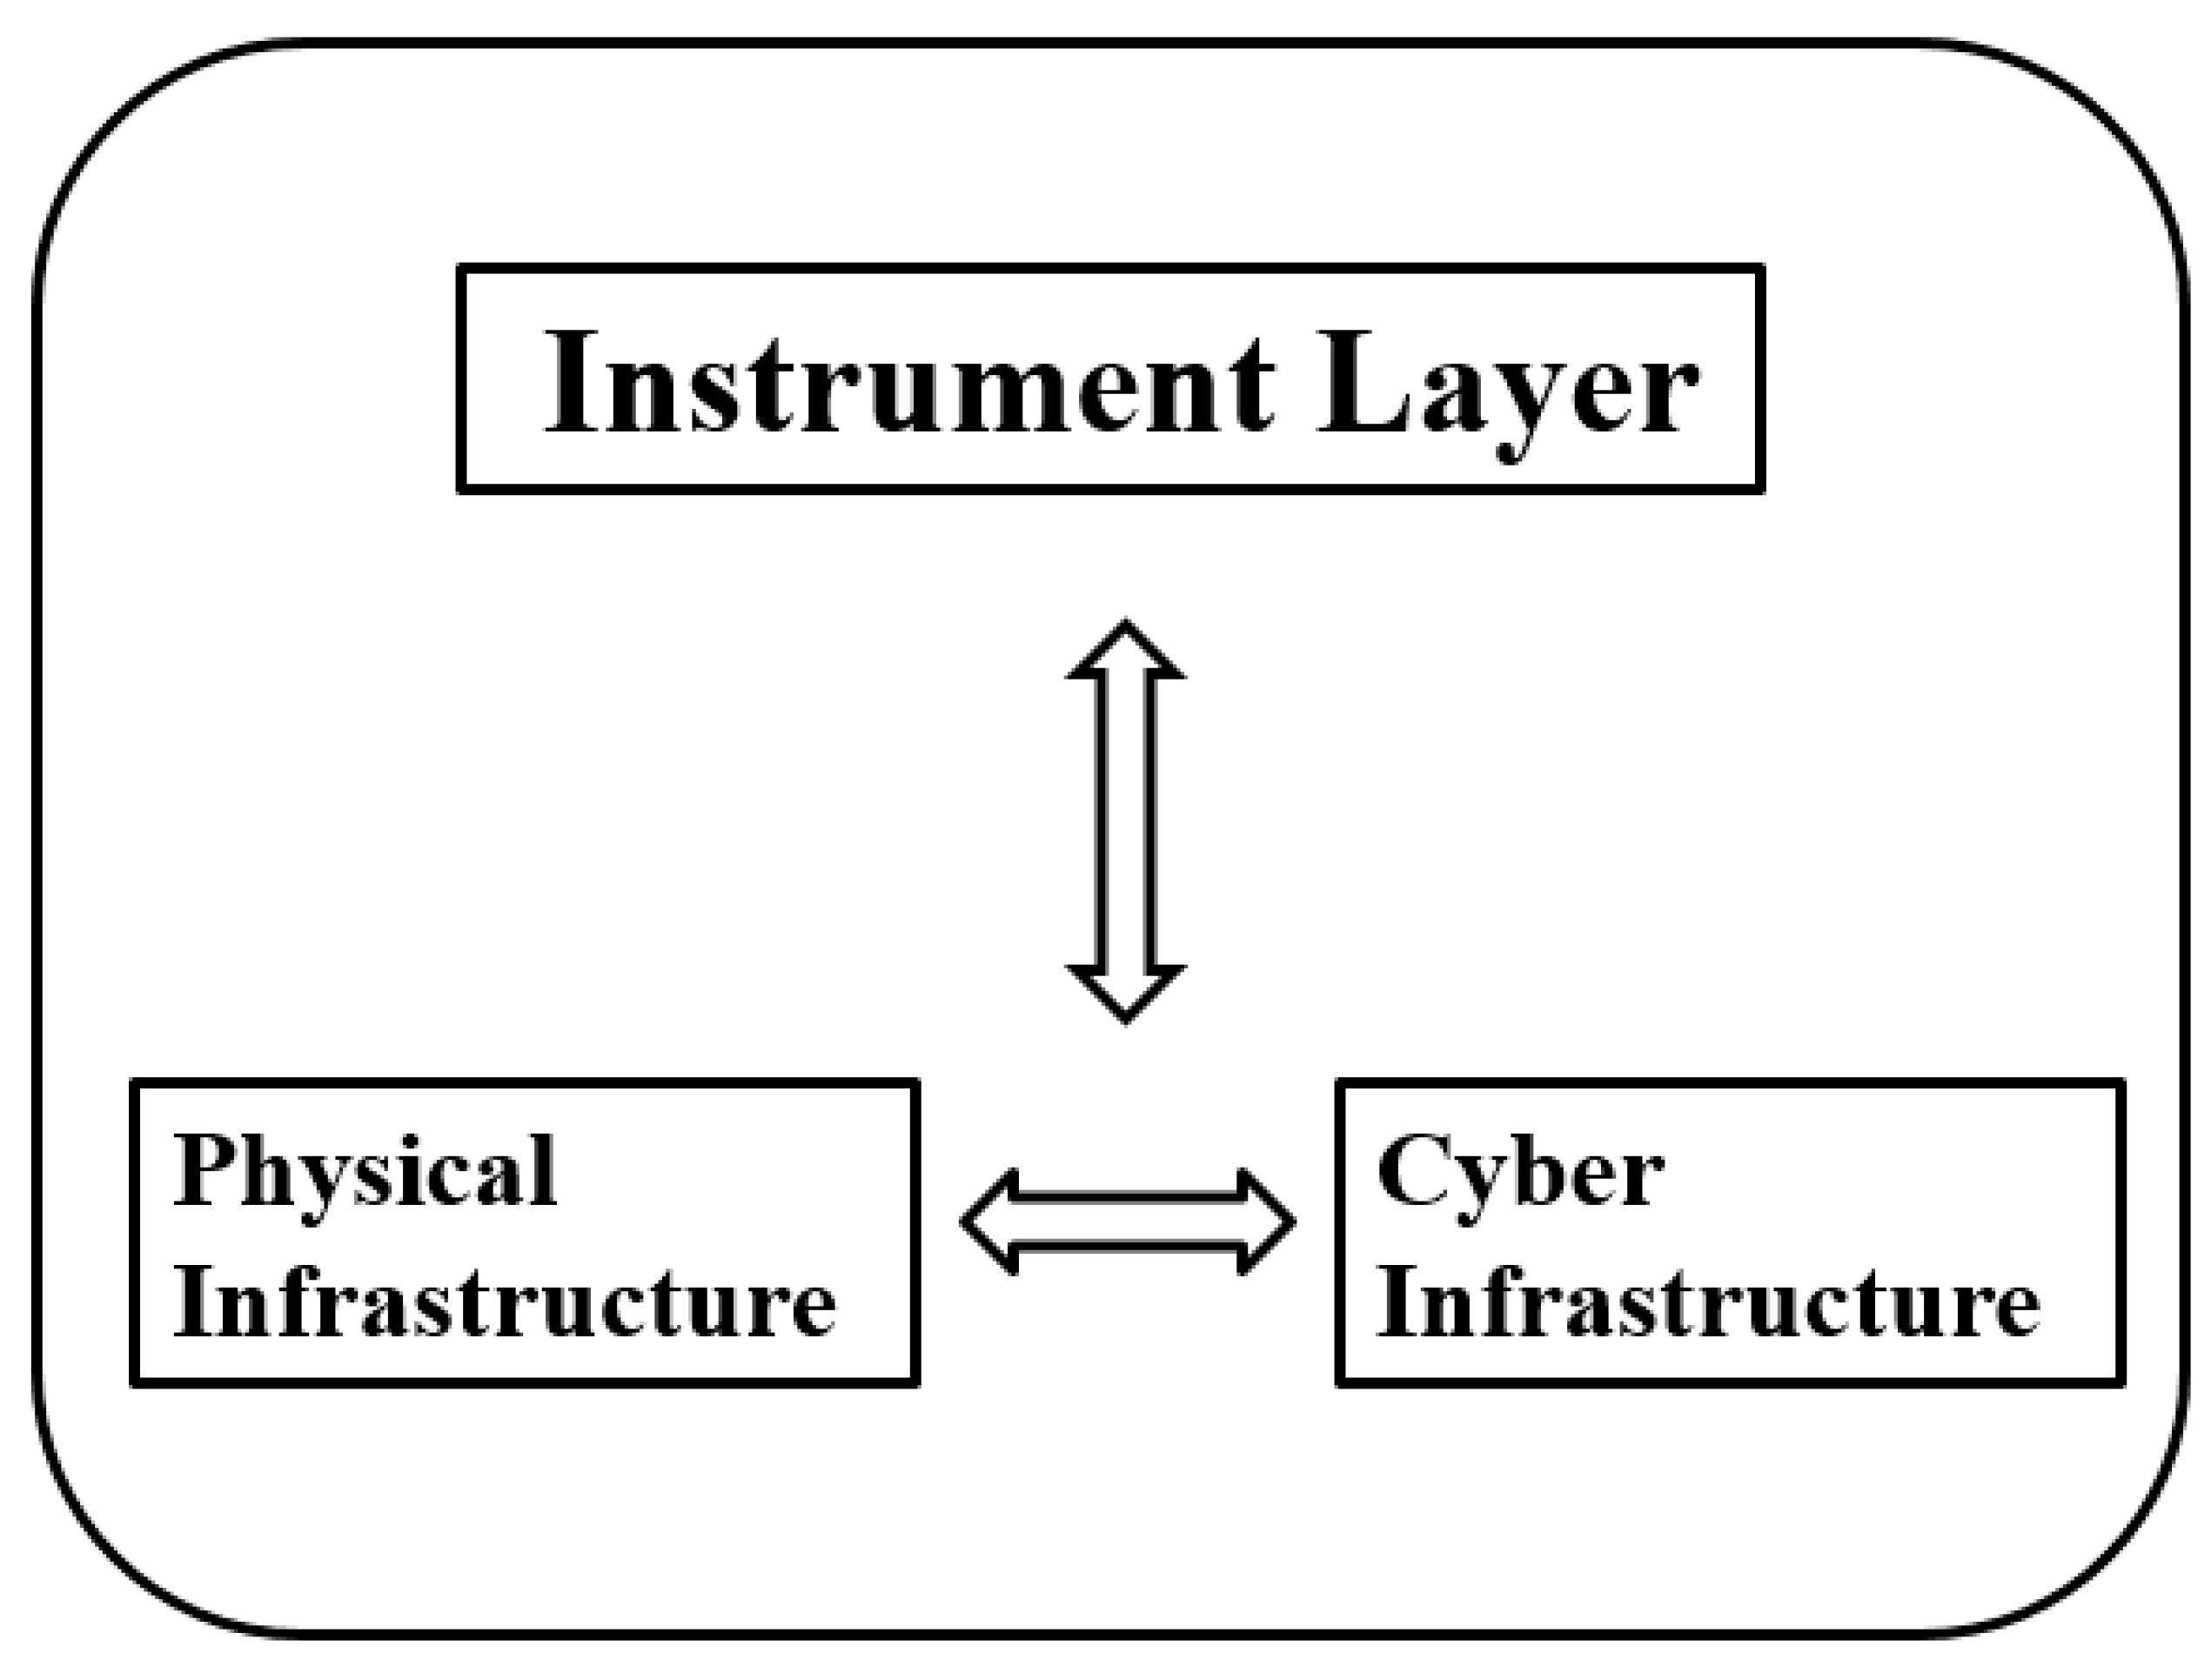
Typically, the instruments layer of SWS should be composed of physical infrastructure (network-level components) and cyberinfrastructure (internet-related hardware, software, and services). Although the physical instruments are the basic structure of the water system, they cannot make it smart or even data-enables only by itself. The cyberinfrastructure includes multiple intelligent devices like smart sensors, smart pumps, and smart valves, etc. Their primary roles and application goals are summarized in Table 2. The smart components of cyberinfrastructure are the elements in which SWS differs from the traditional water distribution system. For example, traditional water distribution systems with only physical instruments carry on pressure or flow data. Conversely, the SWS with cyber instruments not only sends a flow or pressure signal, but their data steam including diagnostic information also makes the SWS detect leaks more efficiently and automatically. Additionally, for the integrated SWS, the interaction and relationship between physical and cyberinfrastructure should not be ignored. Showing in Figure 5 below, physical instruments, including pipes, valves, and pumps provide the structural basement for the placement and installation of cyber instruments like smart meter and intelligent sensors (e.g., electromagnetic or ultrasonic). Meanwhile, physical infrastructures are elements that produce the required data and information, which would be collected, transferred, processed, and fused by internet-related hardware, software, and services. In return, the cyber instruments can instruct the operation and maintenance of physical components by analyzing the newly produced data and forecasting the system condition. For example, the automated meters are bi-direction communication devices that can execute actions on devices (e.g., valve turn off and on) [23]. Furthermore, the different smart sensors might be designed to solve various problems (shown in Figure 6) by operating systems discriminatively. Therefore, the components layer of SWS should achieve both of the roles of physical infrastructure and cyber-infrastructure.
3.2. Property Layer
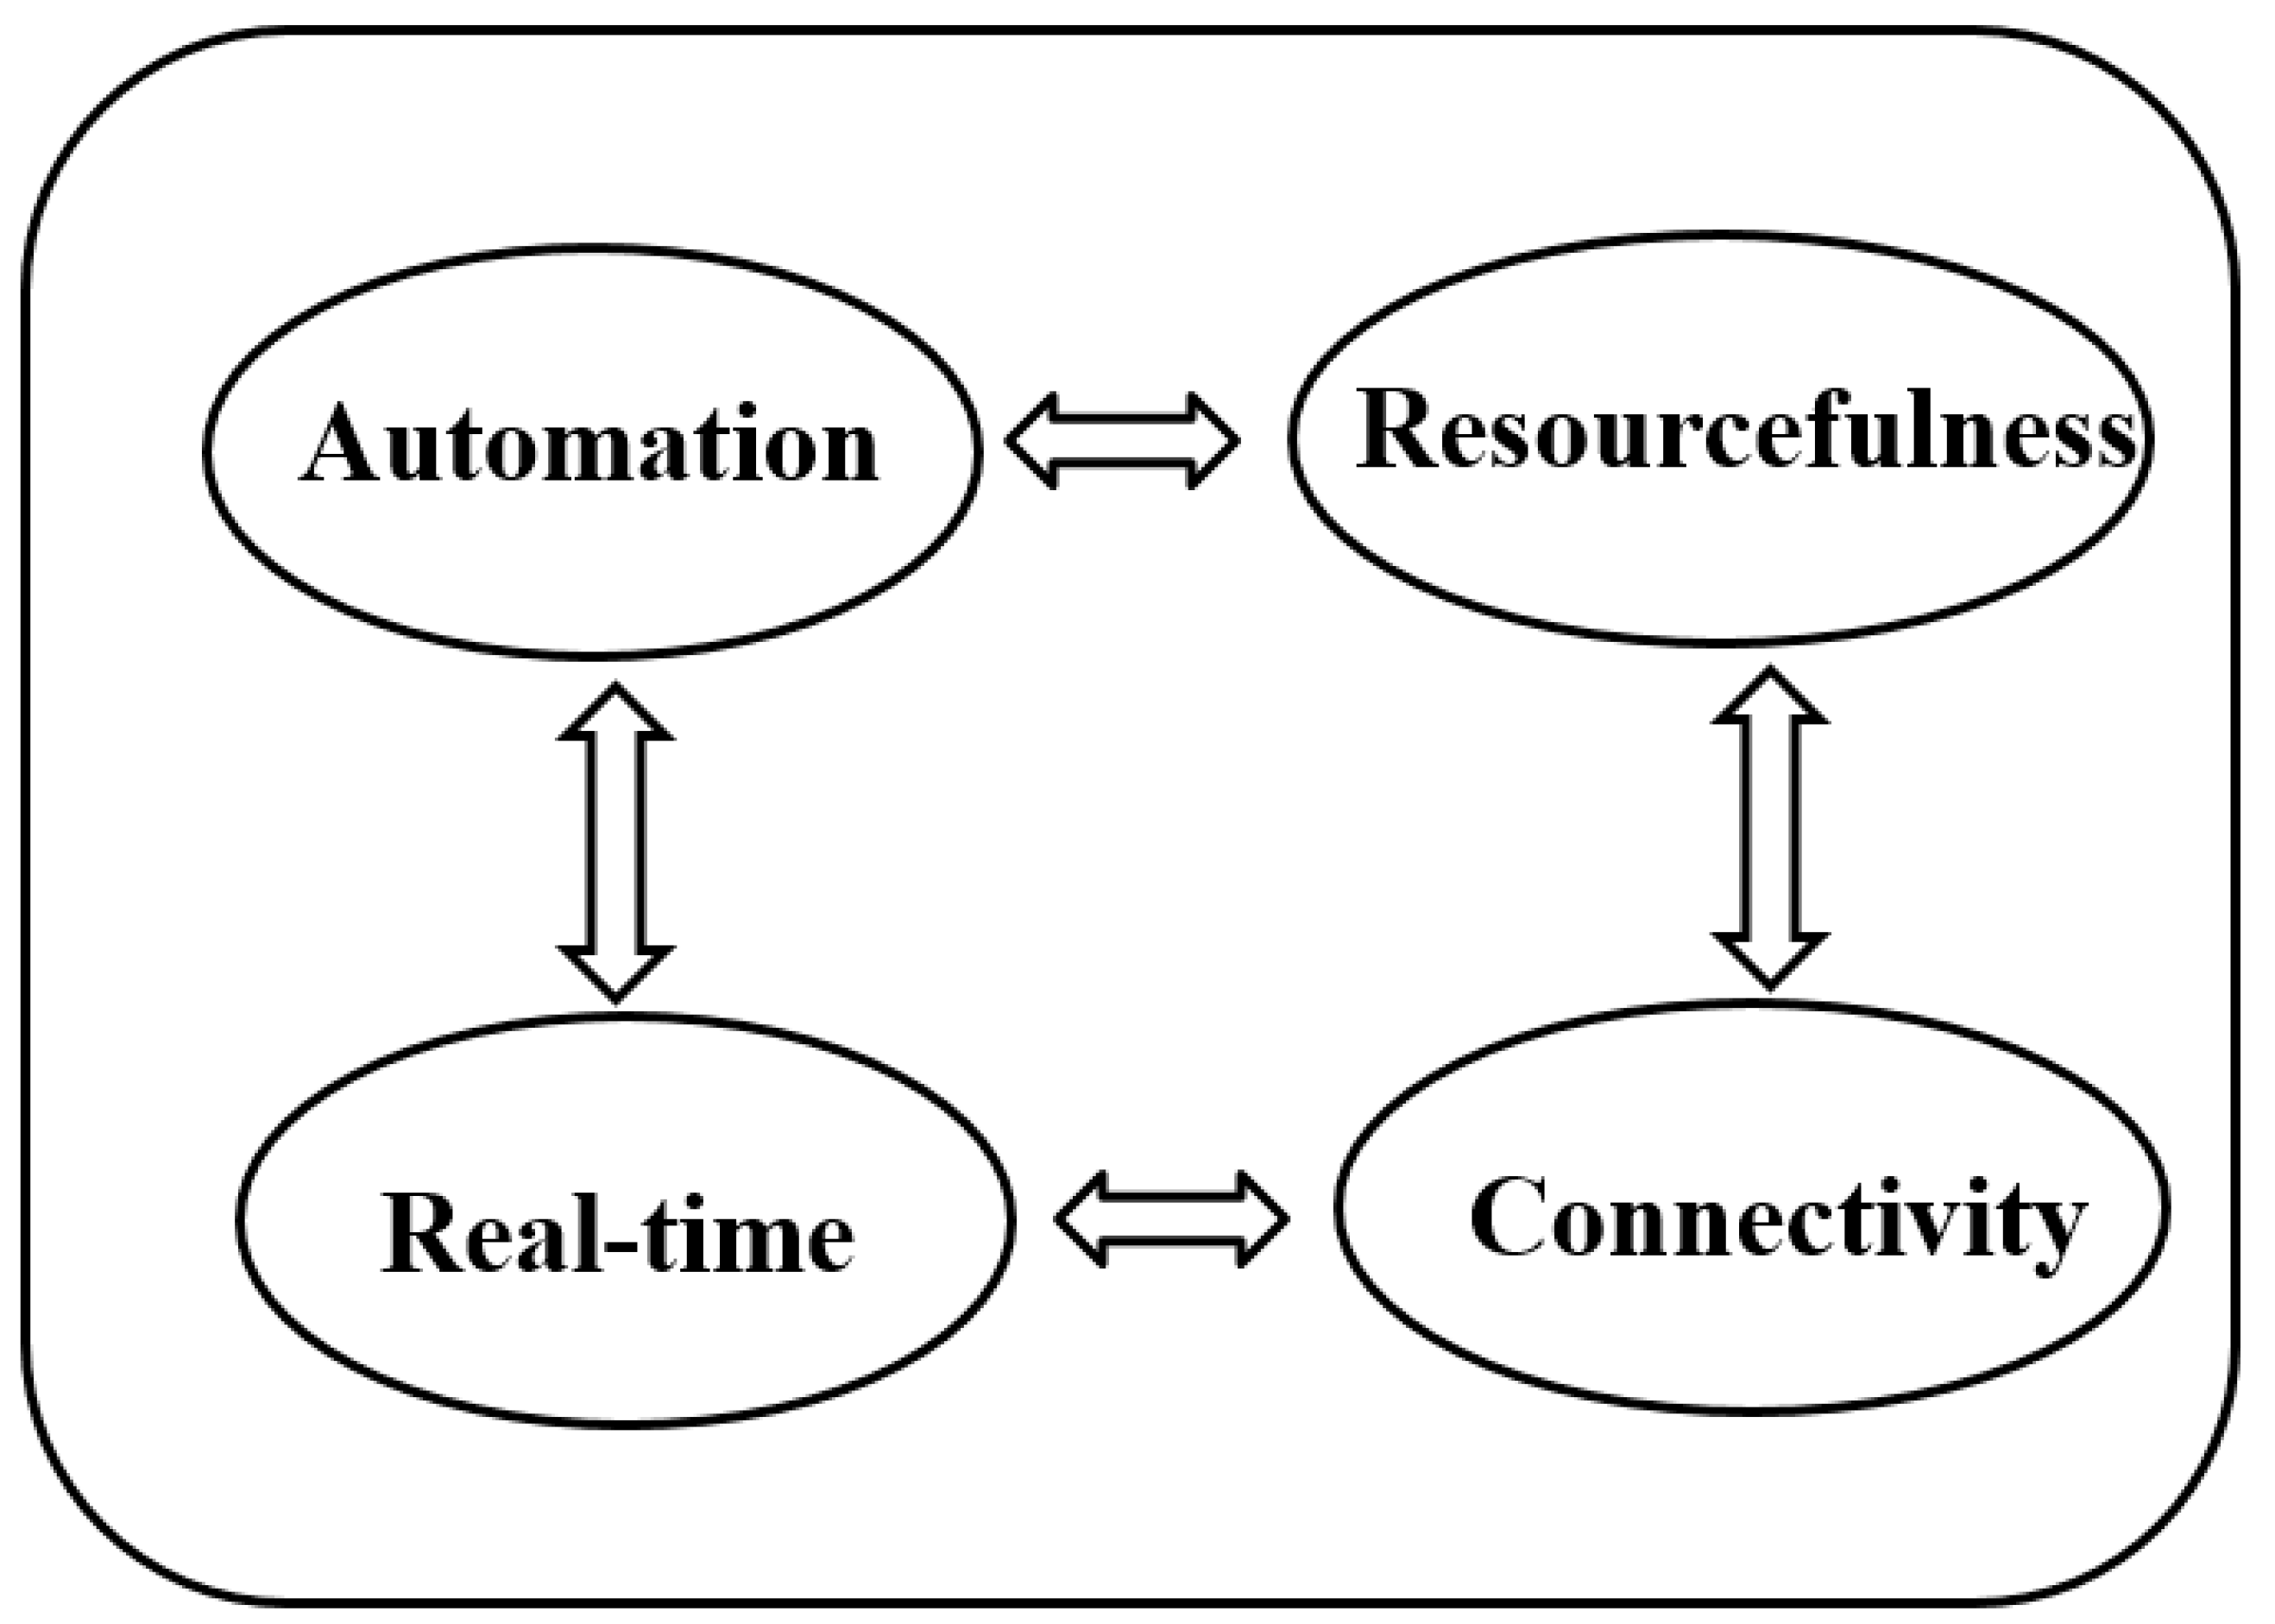
The property of SWS can be understood as the ability to respond to threat, withstand attack, and adapt more readily to failure risks, like connectivity, real-time, security, resourcefulness, and robustness. These properties can be considered indicators of how smart the SWS is, and have to be quantified either qualitatively or quantitatively through metrics. The metrics applied in the SWS assessment, such as smartness, how efficient the SWS is towards real-time, and cyber wellness, how defensible the SWS is against cyberattack, would be discussed in the next section. In this work, we proposed that SWS based on components layer should have 4 properties: (1) Automation; (2) Resourcefulness; (3) Real-time; (4) Connectivity. We designed the interaction between each other within the property loop in Figure 7. For instance, automation is the foundation to achieve real-time and also real-time is facilitated by connectivity. Resourcefulness is ensured by the automation and connectivity among various IoT. One common sense is that these four properties might not be applied to each case of SWS, and also, some researchers may consider SWS with other extra features, but these four demonstrate what most SWS look like.
Automation is the fundamental property, which means that SWS can perform the physical and cyber components’ operation automatically once the relevant parameters are set manually. This is a near-automatic process in the SWS since the application of ACT and ICT enables the SWS to execute one-way or two-way orders without too many operators’ involvement. For the one-way control case (e.g., by setting the sampling interval in the Arduino sketch), the smart sensor can modify the data collecting frequency. As to the two-way control example, the real-time metering data fusion can help provide feedback for the control center, where the data analytic tools, in turn, give instructions to the opening status of smart meters, smart valves, or intelligent pumps. Further, automation can be implemented not only for components providing functionality but also for operation mechanisms. For example, when water problems happen in the operation process or the element itself, the smart components notify the system center and then take action to avoid a crash. Additionally, with automatic self-verification, the water utility can know when the sensor needs maintenance or re-installation [64].
Connectivity is also a fundamental property, which means the degree of interconnectedness or duplication [56]. In a cyber-physical system like SWS, connectivity can be implemented by deploying multiple sensors and software for monitoring the same physical processes [65]. SWS should be qualified to connect with different software and hardware to make the system collect data, analyze data, and share information publicly. For example, the SWS can be connected with the hydraulic model, GIS platform, billing system, and Database Model.
Real-time is the core property of SWS, which can also be called system efficiency. The real-time performance of SWS is characterized as online steps like online data monitoring, online data assimilation, online modeling, online plotting, and online results output, despite offline performance included in SWS. Real-time is the property that SWS obtains to achieve the required smart features [66]. However, current research mainly focuses on real-time modeling. The real-time modeling of SWS is structured as 6 steps: (1) Communicate SCADA datasets; (2) Updating the network model boundary conditions and operational statuses; (3) Pausing execution; (4) Generating the corresponding networks analysis; (5) Waiting for the new SCADA measurements to reload the network model; (6) Return the network simulation. Mentioned in the connectivity property, real-time modeling can be performed only by connecting with data sources systems like SCADA with modeling tools like EPANET-RTX [60]. This newly produced data from real-time hydraulic modeling can forecast results and calibrate the model by comparing measurements and predicted values.
Resourcefulness is the final property, which means the SWS not only owns massive data storage but also aims to timely exchange data for further analysis. This property of data exchange can also be interpreted as interoperability, which refers to the capability of units of an SWS to exchange and use information and services with one another and interfaced external units [67]. SWS provides massive information to an automation and security system, compared with the traditional instruments [58]. Typically, there are three types of source data open to the processor: spatial data, attribute data, and multimedia data, which determine the database model designing. However, these data can only be shared with the public and business after being analyzed by experts. Those processed data would be input into the hydraulic model to produce forecasting data, and those visualized data would be interpreted as valuable information such as early warning system, assessment of pipe leakage/breaks, or identification of cyberattacks or for decision support [68]. Moreover, the processed information or data would be transmitted back to the SCADA system and stored as instrument status and diagnostic information.
3.3. Function Layer
Functions of SWS can be determined by the instrument layer and property layer since different components and properties lead to different functions. For example, one SWS installed with flow and pressure sensor would consider being featured with resourcefulness and can verify the pressure-driven modeling analysis with enormous data collection resources [69]. In contrast, SWS is equipped with temperature sensors functions predicting the infiltration rate in the water systems with available temperature data [70]. Within the architecture of SWS, the function layer is localized in the connection point between system’s property and metrics and plays a role in linking these two (shown in the framework Figure 5). Thus, the function layer can be interpreted as the backbone of SWS that includes functionalities of intelligent sensing, simulation, diagnosis, warning, dispatching, disposal, and control [43]. However, this study does not demonstrate the status of a function layer on the whole framework. Based on this function layer, this paper re-designs and specifies the function layer shown in Figure 8, which includes data producing, data sensing, data processing, simulation operating, and application supporting.
3.4. Benefit Layer
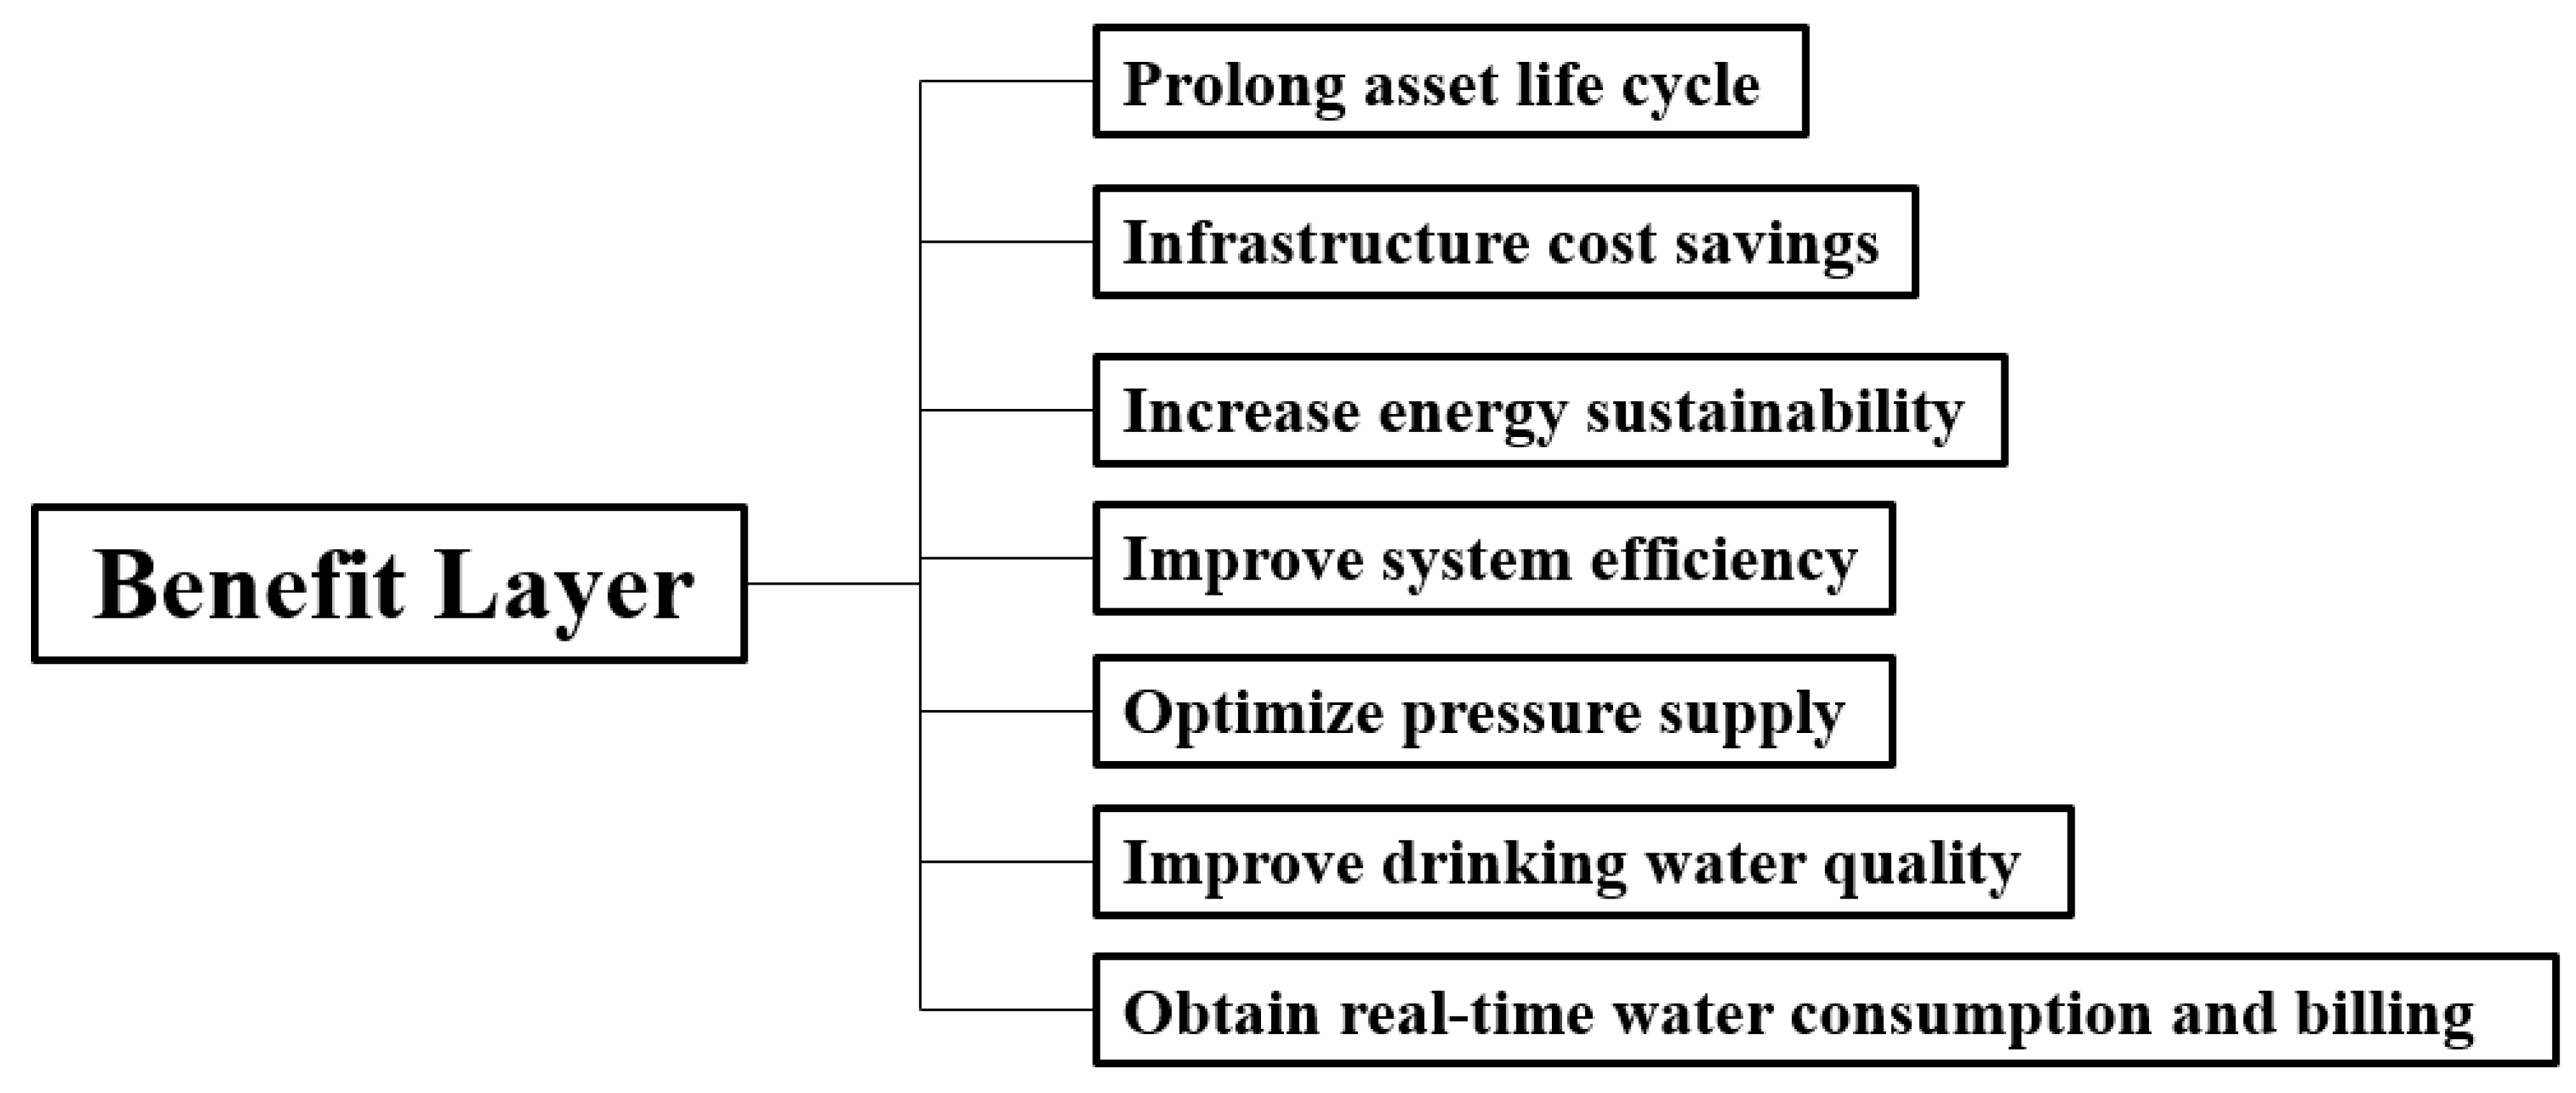
Retrofitting the traditional water supply system with smart devices brings many benefits such as bill reduction for consumers, operation cost decreases for utility, and water loss declines [10]. In this study, the benefit layer mainly contains four aspects including prolonging the asset life cycle, increasing energy sustainability, optimizing pressure and water quality, obtaining real-time water consumption shown in Figure 9 below. According to the benefits taxonomy by [71,72,73], the first two can be considered as business benefits while the third one belongs to shared benefits. The last benefit is classified as customer benefits.
3.4.1. Prolong Asset Life Cycle and Cost Saving
As real-time property states, an SWS can integrate and analyze real-time monitoring data from various instruments for decision-making support. Especially, monitoring data regarding pipelines, valves, pumps, and tank conditions can be used to develop a risk-evaluated model for instrument replacement or maintenance. This allows SWS to plan and schedule the replacement and rehabilitation of the asset program efficiently as well as effectively so that the right assets can be replaced, repaired, and rebuilt in a timely manner. Thus, the real-time monitoring of asset status could be regarded as indicators of preventive maintenance and predictive replacement to prolong the assets’ life cycle and cost savings [74,75,76].
3.4.2. Reduce Energy Loss and Improve System Efficiency
Energy is needed to extract, deliver, treat, and heat water for municipal, industrial, and agricultural uses [77,78]. In the United States, the energy required to move and handle the water is estimated to comprise 4% of total electricity consumption nationwide [79]. Knowing the quantity of water needed, and accounting for any losses, utilities can produce less water. This will be reflected in lower energy consumption as well as in water conservation. The energy loss and costs can be reduced by reducing the amount of water needed to be pumped, transported, heated, or treated [80]. Leakage in the water distribution system leads to additional energy required to pump and carry water to consumers as a result. Smart water sensors can monitor online pressure and warn pressure changes or significant pressure losses along with the water network, where utilities can remotely optimize the network pressure to help save energy [57].
3.4.3. Optimize Pressure Supply and Water Quality
Real-time data allows SWS to enhance system planning and operations by monitoring the hydraulic and water quality situation throughout the system [81]. On the one hand, the deficit pressure in the water distribution system can be detected so that actions can be taken promptly to alleviate the risk of pipe bursts. On the other hand, automated valve or smart gate operations can adjust the operating status to prevent pipe burst and water leakage, which might compensate for instruments changing process conditions or water treatment plant requirements [47]. Those data from SCADA and hydraulic integration can also be used for foreseeing the negative operating consequences, predicting future boundary conditions, and knowing the current system status in real-time, which empowers operators and engineers to control the water systems more effectively.
The implementation of cyber instruments into the water system can be utilized for warning pollutants intrusion. Continuous online monitoring for water quality indicators, such as free chlorine, total organic carbon, pH, conductivity, and turbidity, assist the effective response to a water contamination incident and to mitigate further consequences. For example, the real-time water quality issue detection system called CANARY can use advanced monitoring technologies and enhanced surveillance instruments to collect, integrate, analyze, and communicate information that provides a timely warning of potential contamination events [82].
3.4.4. Obtain Real-Time Water Consumption and Consumer Billing
SWS connected with the billing system and consumption system can display the metering information on the end-user’s platform, like laptops, smartphones, or tablets via internet connection. This real-time water consumption information helps customers to save water and costs [83,84]. As the crux elements of SWS, the automated meter readings (AMR) and automatic meter infrastructure (AMI) provide real-time feedback on water usage for customers. This enables customers to make informed choices towards water-consuming habits and join in the water management activity. In reverse, the change of demand pattern would help the engineers and operators to calibrate their model, optimize pump and valves schedules [85], and modify the boundary conditions timely as efficiently as accurately [47].
3.5. Application Layer
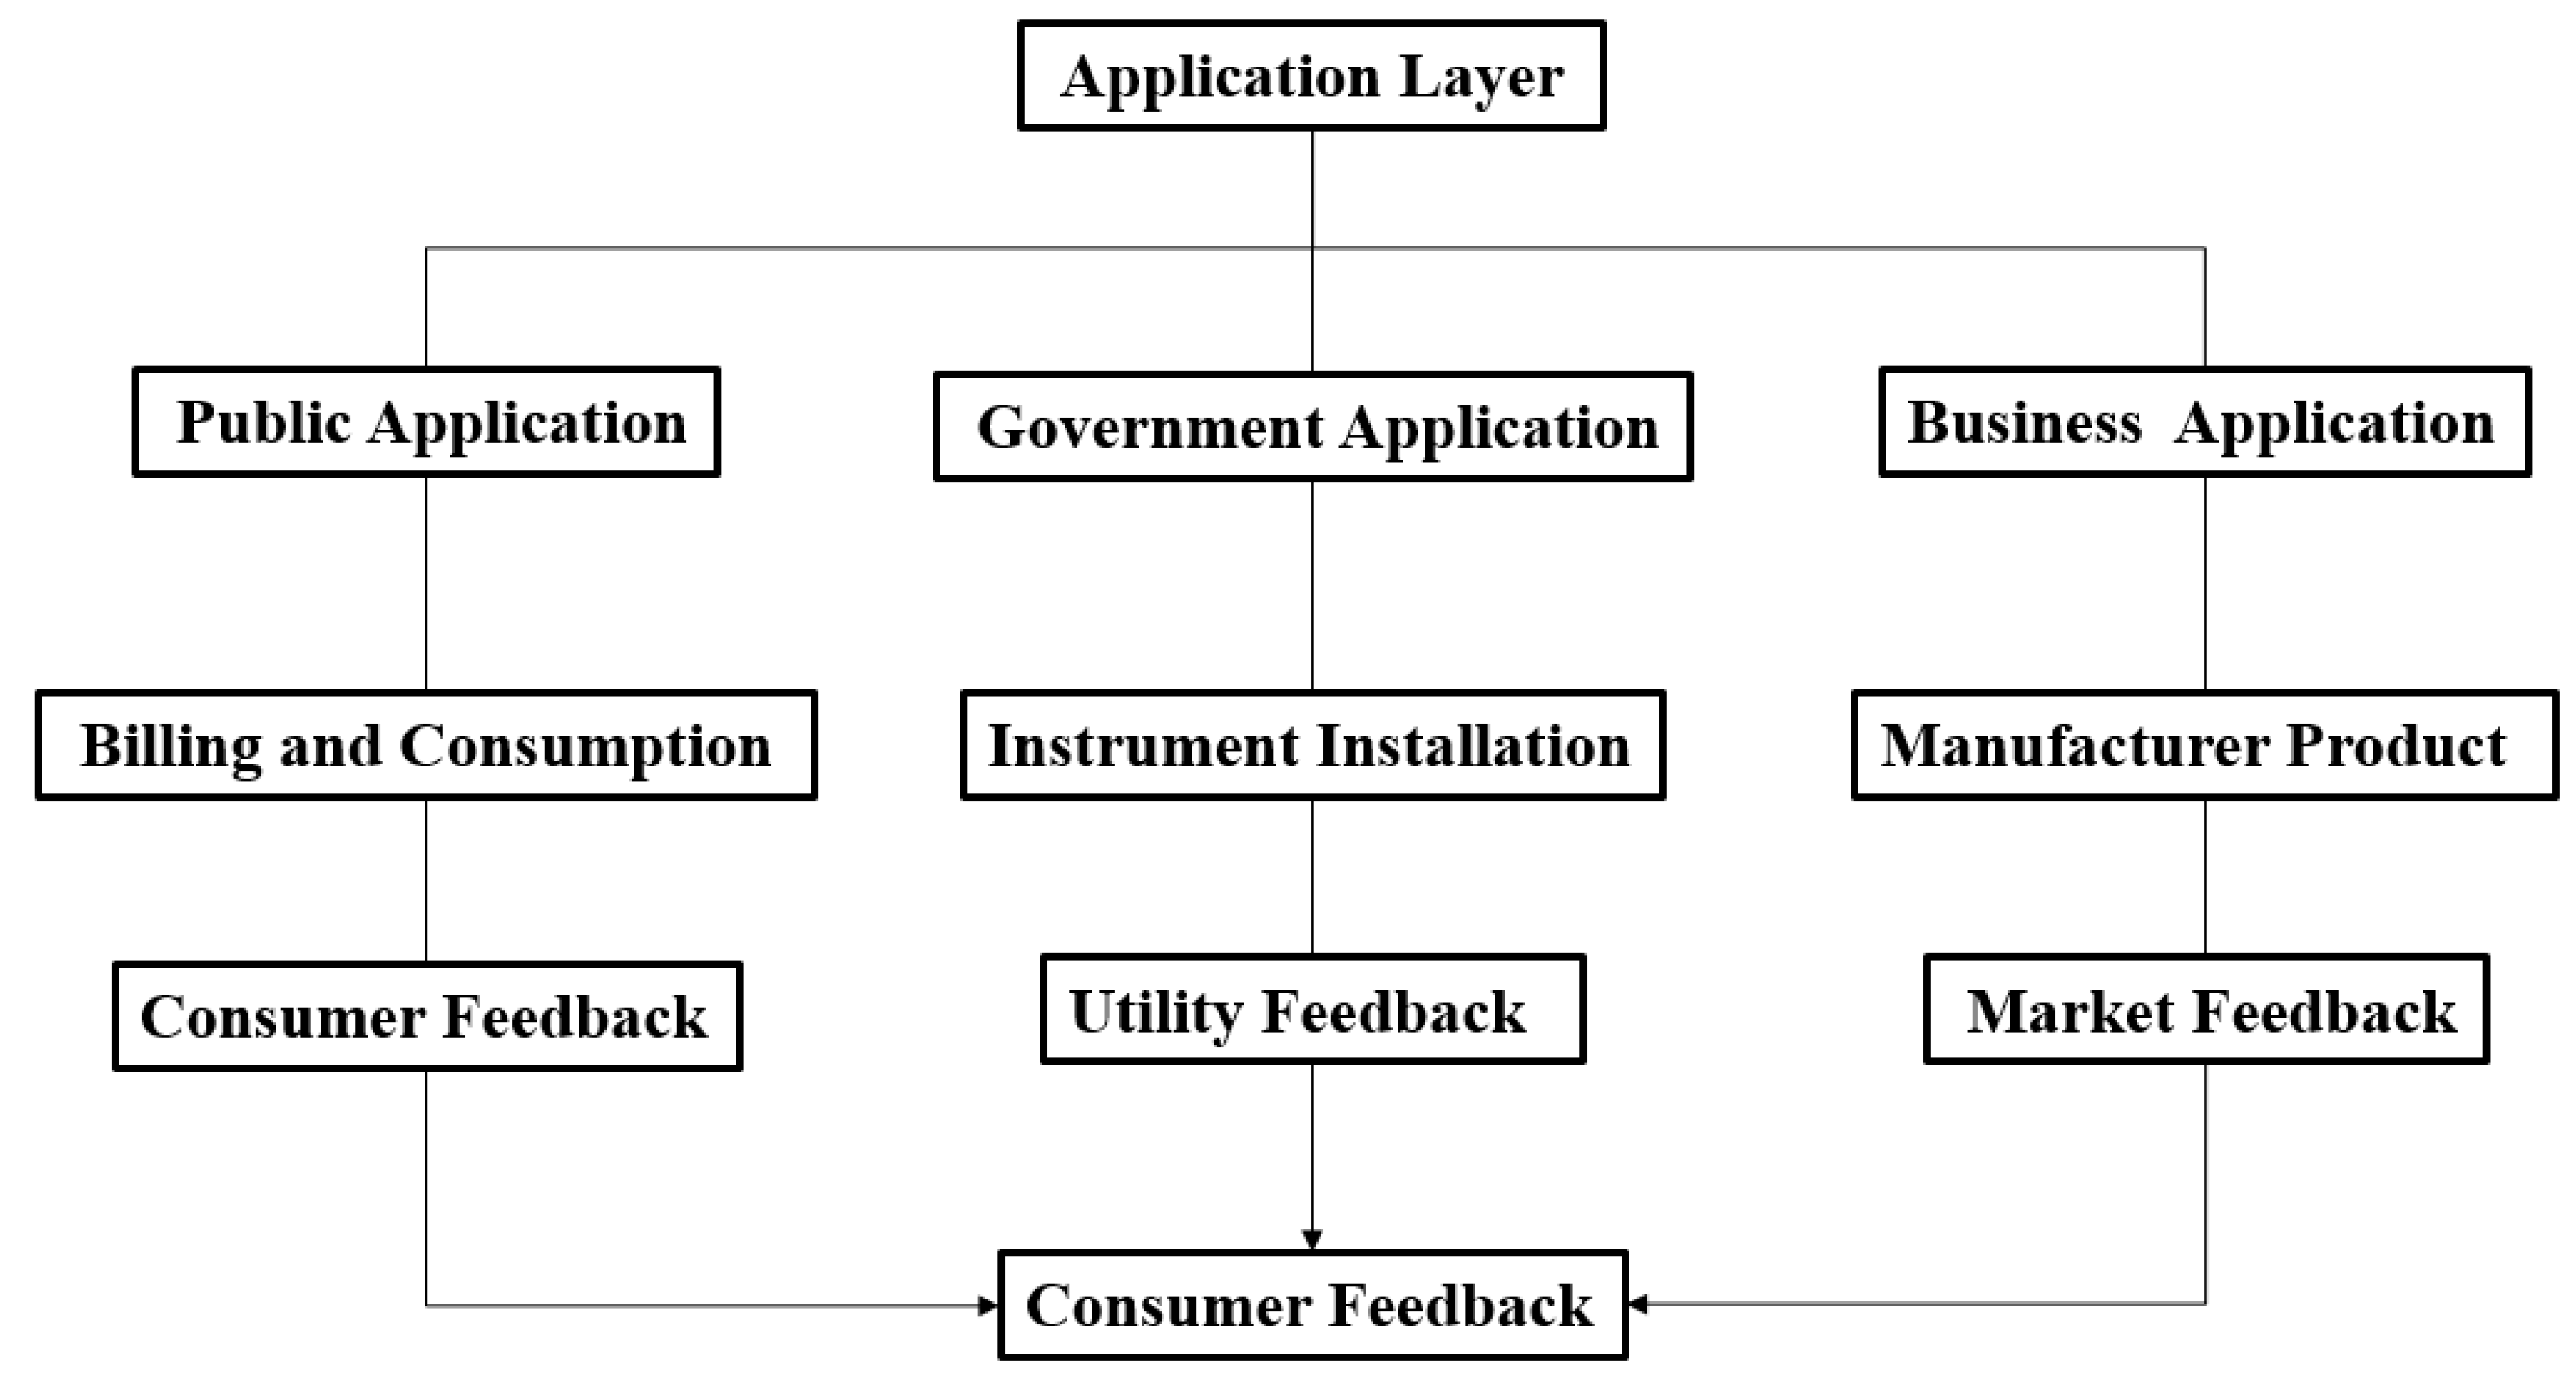
In the application layer, there are three aspects generally classified as the Public application, Government application, and Business application shown in Figure 10. The application layer is mainly user-oriented for decision-making support finally. These three kinds of applications can receive feedback from the corresponding users like consumers, utilities and markets, or other terminals shown in Figure 10 below.
The public application aims to share real-time data and information with consumers for their feedback on billing and consumption, which is beneficial for water conservation and costs saving. Besides, public awareness about this SWS and water conservation should be stressed. More community involvement might be eliminated by providing citizens with more information regarding water conservation and SWS. Manual flow meters reading and installation may cause problems like the embarrassing access of individuals and invasion of government on private property [86]. SWS’s technology development, combined with public awareness improvement, can reduce those risks.
The government application targets water utilities, different users from public applications. As the construction work of the water system, such as pipe replacement, instruments installation, and data center establishment, is the responsibility of the water utility, the sensors deployed by the water utility are helpful to take an insight of what is happening in SWS, and the collected sensor data would be adopted to support government decision.
The last application is the business application. The current smart water market mainly focuses on developing sensors and real-time software. But there are only a few standards or guidelines to evaluate these intelligent products. The application and development of SWS can accelerate the speed of evaluating the system on market feedback and build the rules of the smart water market. Additionally, the application layer is dependent on the purpose of data acquisition. However, there is no single protocol that can adequately suit all the applications and communication processes, and an overall application protocol would be too complex to support efficient business processes. Therefore, another business application is the on-going multi-protocol handing devices for specific purposes since one proprietary single-manufacturer protocol would not be the best for interoperability in SWS. These devices can stimulate communications by using the existing or coming protocols and also allow open programmable interfaces that can be customized for market tests and feedback [55].
4. Metrics for SWS
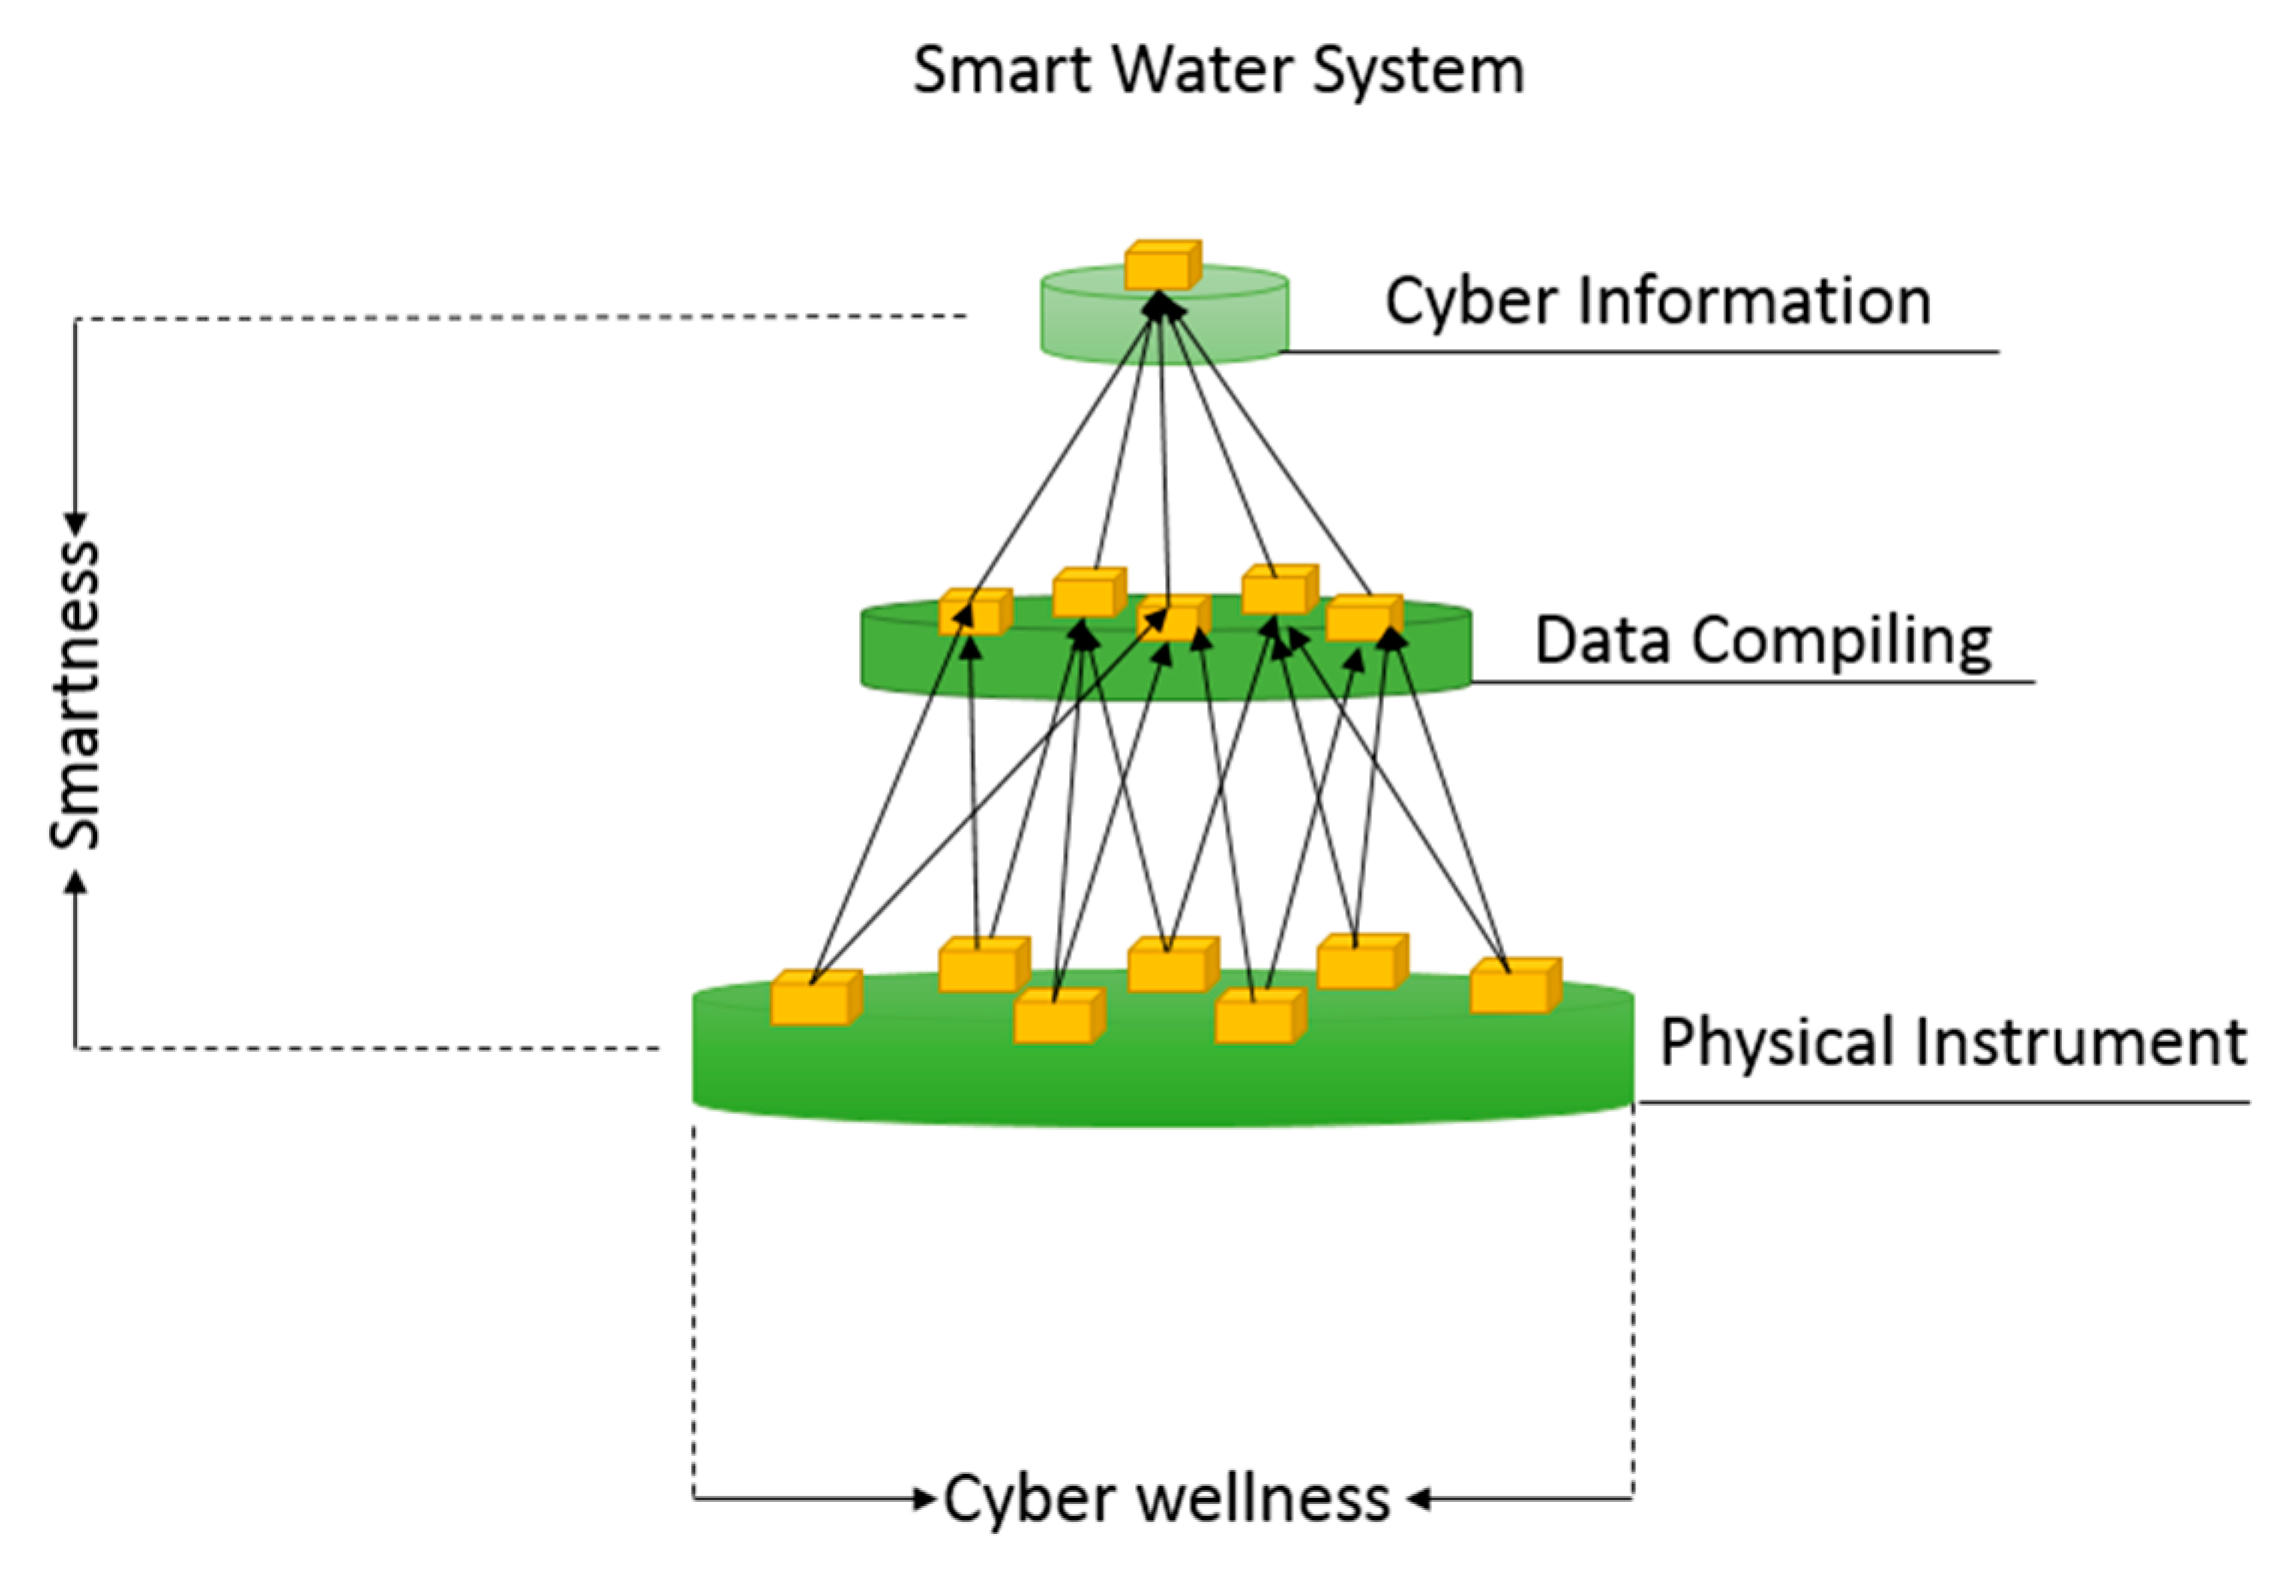
The technical structure of SWS has a pyramid structure with core information on the top to ensure system efficiency and security [87]. Figure 11 illustrates the features of such a technical structure. In this general structure of SWS, the configuration of components and connections can be interpreted as a network of cyber information (e.g., leak detection, discharge control, and noise recognition), data compiling (e.g., real-time modeling, real-time controlling, and real-time sampling), and physical instruments (e.g., sensors and loggers) domain. In Figure 11, nodes represent system components while the links stand for the functional relationship between nodes. For instance, the bottom nodes are connected with the intermedia nodes, which optionally means that the data from the sensor is transmitted to SCADA via links. To better assess the SWS’s efficiency and security within these domains, it is necessary to develop the metrics [45].
Before moving to the metrics discussion, the relationship between property and metrics should be clarified. While metrics are refined from properties, and both metrics and properties might be connected by functions, the application of SWS ultimately aims to assess the performance of SWS. Therefore, properties can be seen as the inherent components of SWS whilst metrics are the manual product. Additionally, properties might determine the assessment indexes on a given SWS, while metrics are those elements to achieve the terminal performance. For example, real-time modeling is a crucial property of SWS, which makes measuring the efficiency of SWS one indicator for smartness.
Furthermore, the performance of data processing in the context of resourcefulness is related to informational security. However, the effects of property layers on metrics are not certain without specific analysis of a given system. In this section, the paper proposes two new conceptual metrics (Smartness and Cyber wellness) for assessing two essential properties of SWS, efficiency and security, and discusses how to define these two metrics and how they can be objectively built to deal with threats of SWS.
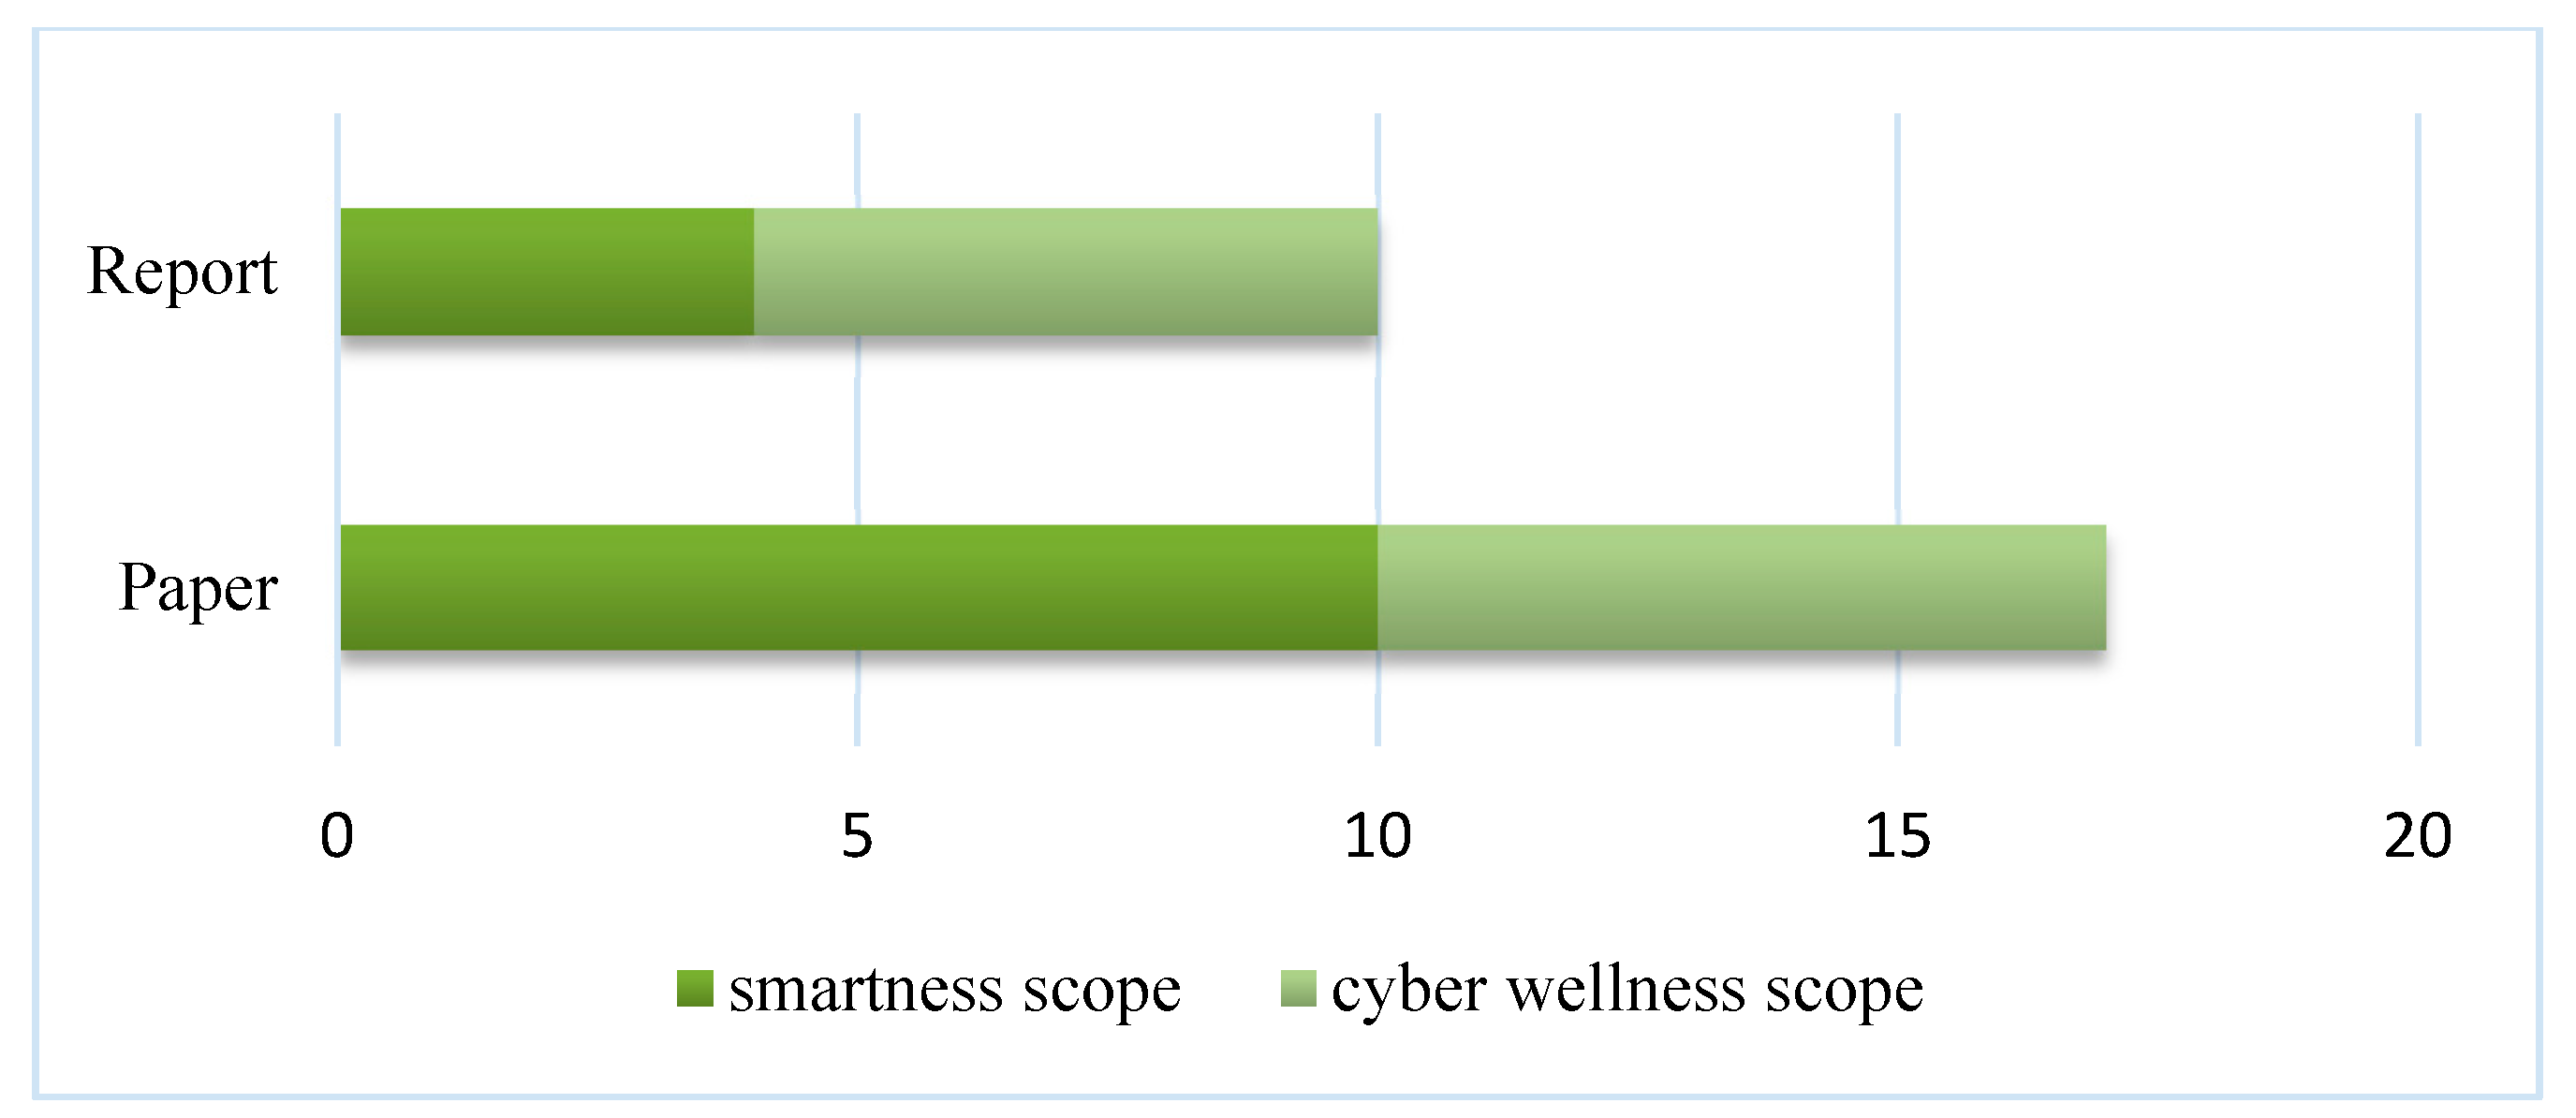
A brief investigation of 27 reviewed academic studies was conducted to analyze the SWS metrics shown in Figure 12, showing the number of studies (report and paper) for smartness scope and cyber wellness scope. Smartness and cyber wellness are seldom discussed directly in previous articles and reports. Most of them mention relationships with metrics or present the features of these two metrics. Thus, we consider that these papers and reports listed should be included in the scope of the metric. In the cyber wellness scope, cyber wellness only comes from the electrical and telecommunication fields [30], which makes it necessary to translate the cyber wellness into water systems. Although smartness has been described in the previous environmental studies, the vision is a little broader as water systems are only a small part of the environment [87]. More efforts would be required to narrow down the scope of smartness if it is applied in the water system sector.
4.1. Smartness
In previous studies, researchers made many efforts in achieving smart performance in water systems. The smart performance of SWS ought to expand to real-time modeling, real-time sampling, and real-time controlling, etc., which aim to minimize the time delay between system input and system output. It was revealed that the efficiency of data transmission would be promoted significantly by using SCADA [88,89]. Nevertheless, SCADA system enables multiple connections with various database and real-time modeling tools; the connection between the SCADA and offline or time-delay modeling tools still makes the water system not so smart as to reduce the data acquisition time. Some offline modeling tools like Hydraulic CAD and WATSYS can only process historical data, even though they are commonly used for the hydraulic model. Even if the SCADA system and so-called real-time simulation tools have been integrated into the water distribution system, it is still necessary to further understand what makes the water system smart. Real-time modeling tool applications like EPANET-RTX [90], LVVWD [91], and EPANET-CPS [92] actually need two steps to finish work: pausing execution and waiting for the new SCADA measurements to reload and to update the boundary condition [93]. The Pausing and Waiting takes typically 10 seconds and 14 minutes, respectively, which makes smart modeling is close to being near real-time process [94].
Thus, the time interval between system input and output, which is characterized as a time lag equation, can be used to assess how much smart it is. Overall, to define the SWS is to establish the mechanism for reducing time lag among those processes like real-time monitoring, real-time transporting, real-time processing, real-time sampling, and real-time simulation in SWS. In this study, the term “Smartness” is introduced to quantify the time lag reduction. The optimal levels of smartness require trade-offs from the source to the end [87]. This way, the smartness used in Equation (1) aims to minimize the system time costs from start input and terminal output. As smartness ensures performance, efficiency, and expediency, the maximum of smartness will revolutionize the interaction relationship between systems and engineers.
Smartness = min (Time lag: system input, system output)
The unit for smartness is minutes; a smartness below 15 min can be acceptable while a smartness over 15 min is unfavorable. Smartness can be used to assess the efficiency of the smart water system when dealing and interpreting measurements from real-world systems.
4.2. Cyber Wellness
The scale IoT devices are growing even faster than the world’s population. There will be 20.4 billion connected devices by 2020, compared with 7.8 billion global population [95]. These numbers highlight IoT’s significance in the fourth industrial revolution, also known as the digital economy, where IoT is expected to deliver the “smarts” needed to address common everyday challenges in areas such as education, healthcare, utilities, transportation, and public and residential buildings [96].
SWS has a number of logical sub-layers in the integration of physical components and IoT, where sensors and actuators are deployed across the water distribution network to enable significant data processes and real-time performance. However, the pursuit of smartness without considering data authenticity and reliability would lead to information security issues. Many information safety issues are from system integration [42]. Thus, security at both IoT and network-level is critical to the operation of SWS [61]. Compared with physical network level components, these data-related smart sensors and intelligent devices with larger importance are the heart of SWS, occupying the decision-making resources. In comparison with the physical network level, the related data are easier to be chosen as the hitting points and even more vulnerable to cyberattacks because the hackers or cyberattackers might tend to crush the critical components of SWS or to steal the most crucial data saved in the database.
In this paper, we propose cyber wellness as one of the metrics to evaluate the information security of SWS. Cyber wellness is first put forward in the International Telecommunication Union (ITU) to describe the health level of information and communication technologies [97]. Continuously, cyber wellness is also introduced into the education field to describe the health level of Internet users [88]. In terms of information security, the emphasis from all cases is on how many of the IoT works well to extract data and how long it will last to defend itself when a cyberattack happens. In this work, we define the well-being level of information as “cyber wellness” in SWS. The goal of cyber wellness is, therefore, to store data as much as possible before a cyberattack and to withstand cyberattacks as long as possible at the same time shown in Equation (2):
Cyber wellness = max(Information security: capacity, endurance)
Cyber wellness is unitless, usually ranging from 0% to 100%. The higher cyber wellness reflects that the smart water system has more capacity to be against system failure and to prevent information loss.
5. Future Research Recommendations
A few challenges in the application of SWS are still waiting to be solved before the wide application of a smart water system [47]. More coordination is needed for collective work from the academia, industry, and government to enable smart techniques for public adoption. Based on the results of this review paper and the work from different water organizations, several research directions are recommended to help engineers, researchers, and the public to work on those challenges in a more efficient and focused way.
5.1. Cyberattack to Smart Water Micro-Components
As the latest information and data center systems are vulnerable to hackers switching off the power easily, the smart equipment being connected to the wider internet is revealed to be exposed to cyberattack risks [98]. This finding reflects the current security problems in the IoTs are a significant public concern. SWS, which is also on the basis of IoT, should not ignore this concern, and it is required to build a strong defensive wall to cyberattacks [52]. However, there are few studies discussing the protection of smart water micro-components. Different smart devices such as sensors, loggers, samplers, and controllers play roles of varying importance in water systems, meaning that cyberattackers might select the attacking intentionally in one specific case. In this way, we need to develop efficient methods and technologies to benchmark the smart water micro-components protection efficiency. This will budget the investment in the water system retrofitting where identical smart water micro-components are required for different defense costs.
5.2. Resilience Incorporation into Smart Water System
The resilience concept has been incorporated into the traditional water distribution system, rainwater harvesting system, storm drainage system, and wastewater system in some papers and projects [99,100,101,102]. However, there are few papers discussing how to implement resilience in the smart water system. The smart water system needs to be resilient since it involves more recovery not only in physical components but also in the intelligent ones. In contrast to traditional water systems, a smart water system has more complex connections with automatic and online operations. Thus, the performance of SWS is determined by water, energy, and electricity availability. The necessity of incorporating resilience into the smart water system to evaluate their recovery ability and function efficiency are therefore very important. Incorporating the sub-resilience into the smart water micro-components would also be a better way to quantify the recovery capacity of the whole water system.
5.3. Smart Water (End-User) Data Disaggregation and Analysis
Real-time meter readings generate massive data that require good organization and powerful analytics to extract useful information [103]. The high-resolution water data sampling can enable end-user disaggregation to efficiently recognize the peak demand, pipe leakage, and breakage [104,105]. However, the smart water system field is still lacking proper data disaggregation and analysis tools.
The development of data analysis tools that utilize the processed data to obtain water consumption information such as peak hourly consumption, end-uses, or comparative analysis is still at the formative stage [106]. Multi-Resolution data availability can assist utilities in obtaining benefits from data sampling and the cost of high-resolution metering, real-time data-model coupling, and maintaining metering infrastructures [67,72]. These are the most critical challenges requiring urgent research attention as the efficient end-user data analysis approach can benefit the customers’ billing and costs. Such work will provide insight into future big water data management research and commercial applications [107,108,109].
6. Conclusions
This paper has conducted a critical review of studies that deal with smart water techniques applied in water systems, with a particular focus on the understanding of how to address the key components for the framework of the smart water system (SWS). Four critical components composed of the SWS (instrument layer, property layer, function layer, benefit layer, and application layer) and two metrics (smartness and cyber wellness) are proposed to characterize SWS. In this review, a total number of 32 literature including 1 international forum, 17 peer-reviewed papers, 10 reports, and 4 presentations, explicitly supporting the smart water system’s definition, architecture, and metrics, are analyzed. The main conclusions drawn from this study can be summarized as follows:
- The lack of consensus in the definition and architecture of a smart water system and metrics of intelligent water system assessment is hindering the process of smart techniques entering the water sector;
- A systematic and comprehensive smart water system framework is put forward including critical elements like the definition, architecture, metrics, and research directions, which can be directly applicable for education, research, and public knowledge;
- Two conceptual metrics (smartness and cyber wellness) to evaluate the performance of the smart water system are proposed to characterize system efficiency and information security;
- Existing challenges drive concentration on future research directions, and these future tasks can be viewed as a synthetic work where the academia, industry, and government will join in together.
Overall, this review has defined what SWS is and established a systematic framework for SWS, including architecture and metrics of SWS, which also shows that SWS has great potential to maximize the benefits in water sectors over the coming decades. This study is useful for designing assessing, and rehabilitating SWS when different goals are required in practical applicability in the field or lab. Future research directions are also clarified for this cross-disciplinary work, to assist the water areas to move towards a smarter future. As smart water technologies are under development, more real-world tests will be needed to realize the full benefits of smart water system.
Author Contributions
Conceptualization, J.L.; methodology, J.L.; formal analysis, J.L. and X.Y.; investigation, J.L. and R.S.; resources, J.L.; data curation, J.L.; writing—original draft preparation, J.L.; writing—review and editing, J.L. X.Y. and R.S.; visualization, J.L.; financial support, R.S. All authors have read and agreed to the published version of the manuscript.
Funding
This work is mainly supported by the Teaching Assistance Scholarship of the Civil and Environmental Engineering Department at the University of Utah. The publication fee is financially covered by the Climate and Energy Fund of the University of Innsbruck.
Acknowledgments
We would like to show our great thanks to the financial support Climate and Energy Fund and also the assistance from the program “Smart Cities Demo-Living Urban Innovation 2018” (project 872123) of the University of Innsbruck.
Conflicts of Interest
The authors declare no conflict of interest.
References
- UN DESA. World Urbanization Prospects: The 2018 Revision; United Nations: New York, NY, USA, 2019. [Google Scholar]
- The World Bank Group. The World Bank Population Growth (Annual %); The World Bank: Washington, DC, USA, 2018. [Google Scholar]
- Butler, D.; Farmani, R.; Fu, G.; Ward, S.; Diao, K.; Astaraie-Imani, M. A New Approach to Urban Water Management: Safe and Sure. Procedia Eng. 2014, 89, 347–354. [Google Scholar] [CrossRef] [Green Version]
- Collins, A. The Global Risks Report 2018, 13th ed.; World Economic Forum: Geneva, Switzerland, 2013; ISBN 978-1-944835-15-6. [Google Scholar]
- Tao, T.; Xin, K. Public health: A sustainable plan for China’s drinking water. Nature 2014, 511, 527. [Google Scholar] [CrossRef] [PubMed]
- Tao, T.; Li, J.; Xin, K.; Liu, P.; Xiong, X. Division method for water distribution networks in hilly areas. Water Sci. Technol. Water Supply 2016, 3, 727–736. [Google Scholar] [CrossRef]
- Lee, S.W.; Sarp, S.; Jeon, D.J.; Kim, J.H. Smart water grid: The future water management platform. Desalin. Water Treat. 2015, 55, 339–346. [Google Scholar] [CrossRef]
- Maxmen, A. As Cape Town water crisis deepens, scientists prepare for ‘Day Zero’. Nature 2018, 554, 7690. [Google Scholar] [CrossRef] [Green Version]
- Booysen, M.J.; Visser, M.; Burger, R. Temporal case study of household behavioural response to Cape Town’s “Day Zero” using smart meter data. Water Res. 2019, 149, 414–420. [Google Scholar] [CrossRef] [Green Version]
- Nguyen, K.A.; Stewart, R.A.; Zhang, H.; Sahin, O.; Siriwardene, N. Re-engineering traditional urban water management practices with smart metering and informatics. Environ. Model. Softw. 2018, 101, 256–267. [Google Scholar] [CrossRef] [Green Version]
- Choi, G.W.; Chong, K.Y.; Kim, S.J.; Ryu, T.S. SWMI: New paradigm of water resources management for SDGs. Smart Water 2016, 1, 3. [Google Scholar] [CrossRef] [Green Version]
- Sonaje, N.P.; Joshi, M.G. A Review of Modeling an Application of Water Distribution Networks (WDN) Softwares. Int. J. Tech. Res. Appl. 2015, 3, 174–178. [Google Scholar]
- Liu, X.; Tian, Y.; Lei, X.; Wang, H.; Liu, Z.; Wang, J. An improved self-adaptive grey wolf optimizer for the daily optimal operation of cascade pumping stations. Appl. Soft Comput. J. 2019, 75, 473–493. [Google Scholar] [CrossRef]
- Leitão, P.; Colombo, A.W.; Karnouskos, S. Industrial automation based on cyber-physical systems technologies: Prototype implementations and challenges. Comput. Ind. 2016, 81, 11–25. [Google Scholar] [CrossRef] [Green Version]
- NET Plateform. Smart cities applications and requirements. City, 20 May 2011; 1–39. [Google Scholar]
- Hayes, J.; Goonetilleke, A. Building Community Resilience ± Learning from the 2011 Floods in Southeast Queensland, Australia. In Proceedings of the 8th Annual Conference of International Institute for Infrastructure, Renewal and Reconstruction: International Conference on Disaster Management (IIIRR 2012), Kumamoto, Japan, 24–26 August 2012. [Google Scholar]
- Allen, M.; Preis, A.; Iqbal, M.; Whittle, A.J. Case study: A smart water grid in Singapore. Water Pract. Technol. 2012, 7, 4. [Google Scholar] [CrossRef] [Green Version]
- Barsugli, J.; Anderson, C.; Smith, J.B.; Vogel, J.M. Options for Improving Climate Modeling to Assist Water Utility Planning for Climate Change; University of Colorado at Boulder: Denver, CO, USA, 2009. [Google Scholar]
- Arregui, F.J.; Gavara, F.J.; Soriano, J.; Pastor-Jabaloyes, L. Performance analysis of aging single-jet water meters for measuring residential water consumption. Water 2018, 10, 612. [Google Scholar] [CrossRef] [Green Version]
- Ribeiro, R.; Loureiro, D.; Barateiro, J.; Smith, J.R.; Rebelo, M.; Kossieris, P.; Gerakopoulou, P.; Makropoulos, C.; Vieira, P.; Mansfield, L. Framework for technical evaluation of decision support systems based on water smart metering: The iWIDGET case. Procedia Eng. 2015, 119, 1348–1355. [Google Scholar] [CrossRef] [Green Version]
- Mounce, S.; Machell, J.; Boxall, J. Water quality event detection and customer complaint clustering analysis in distribution systems. Water Sci. Technol. Water Supply 2012, 12, 580–587. [Google Scholar] [CrossRef] [Green Version]
- Anzecc, A. Australian and New Zealand Guidelines for Fresh and Marine Water Quality. Natl. Water Qual. Manag. Strategy 2000, 1, 1–103. [Google Scholar]
- Albino, V.; Berardi, U.; Dangelico, R.M. Smart cities: Definitions, dimensions, performance, and initiatives. J. Urban Technol. 2015, 22, 3–21. [Google Scholar] [CrossRef]
- Hall, R.E.; Bowerman, B.; Braverman, J.; Taylor, J.; Todosow, H. The Vision of a Smart City. In Proceedings of the 2nd International Life Extension Technology Workshop, Paris, France, 28 September 2000. [Google Scholar]
- Höjer, M.; Wangel, J. Smart Sustainable Cities; Springer International Publishing: Cham, Switzerland, 2014; pp. 333–349. [Google Scholar]
- Owen, D.L. The Singapore water story. Int. J. Water Resour. Dev. 2013, 29, 290–293. [Google Scholar] [CrossRef]
- Gourbesville, P. Key Challenges for Smart Water. Procedia Eng. 2016, 154, 11–18. [Google Scholar] [CrossRef] [Green Version]
- Boyle, T.; Giurco, D.; Mukheibir, P.; Liu, A.; Moy, C.; White, S.; Stewart, R. Intelligent metering for urban water: A review. Water 2013, 5, 1052–1081. [Google Scholar] [CrossRef] [Green Version]
- Fang, X.; Misra, S.; Xue, G.; Yang, D. Smart grid—The new and improved power grid: A survey. IEEE Commun. Surv. Tutor. 2012, 14, 944–980. [Google Scholar] [CrossRef]
- Balijepalli, V.S.K.M.; Pradhan, V.; Khaparde, S.A.; Shereef, R.M. Review of Demand Response under Smart Grid Paradigm. In Proceedings of the 2011 IEEE PES International Conference on Innovative Smart Grid Technologies-India, ISGT India 2011, Kollam, Kerala, India, 1–3 December 2011. [Google Scholar]
- Gelazanskas, L.; Gamage, K.A.A. Demand side management in smart grid: A review and proposals for future direction. Sustain. Cities Soc. 2014, 11, 22–30. [Google Scholar] [CrossRef]
- ITU. Global Cybersecurity Index & Cyberwellness Profiles; International Telecommunication Union: Geneva, Switzerland, 2015; ISBN 9789261250614. [Google Scholar]
- Hagar, J.; Murray, R.; Haxton, T.; Hall, J.; McKenna, S. Using the CANARY Event Detection Software to Enhance Security and Improve Water Quality. In Proceedings of the World Environmental and Water Resources Congress 2013: Showcasing the Future—Proceedings of the 2013 Congress, Cincinnati, OH, USA, 19–23 May 2013. [Google Scholar]
- University of Oxford Smart Water System. Available online: https://assets.publishing.service.gov.uk/media/57a08ab9e5274a31e000073c/SmartWaterSystems_FinalReport-Main_Reduced__April2011.pdf (accessed on 9 June 2018).
- DNV GL. Global Opportunity Report 2015. Available online: https://issuu.com/dnvgl/docs/globalopportunityreport/14 (accessed on 10 December 2019).
- DNV GL. Global Opportunity Report 2016. Available online: https://issuu.com/dnvgl/docs/the-2016-global-opportunity-report (accessed on 10 December 2019).
- United Nations Global Compact Global Opportunity Report 2017. Available online: https://www.unglobalcompact.org/library/5081 (accessed on 10 December 2019).
- DNV GL. Global Opportunity Report 2018. Available online: https://www.dnvgl.com/feature/gor2018.html (accessed on 12 October 2019).
- Colorado State University. Smart Water Grid-Plan B Technical Final Report. Available online: https://www.engr.colostate.edu/~pierre/ce_old/Projects/Rising Stars Website/Martyusheva,Olga_PlanB_TechnicalReport.pdf (accessed on 12 October 2019).
- The Smart Water Networks Forum What is a Smart Water Network? Available online: https://www.swan-forum.com/swan-tools/what-is-a-swn/ (accessed on 18 October 2019).
- Dragan Savic Intelligent/Smart Water System. Available online: https://www.slideshare.net/gidrasavic/intelligent-smart-water-systems (accessed on 12 October 2019).
- Li, J.; Lee, S.; Shin, S.; Burian, S. Using a Micro-Test-Bed Water Network to Investigate Smart Meter Data Connections to Hydraulic Models. In Proceedings of the World Environmental and Water Resources Congress 2018: Hydraulics and Waterways, Water Distribution Systems Analysis, and Smart Water—Selected Papers from the World Environmental and Water Resources Congress 2018, Minneapolis, MN, USA, 3–7 June 2018. [Google Scholar]
- Ye, Y.; Liang, L.; Zhao, H.; Jiang, Y. The System Architecture of Smart Water Grid for Water Security. Procedia Eng. 2016, 154, 361–368. [Google Scholar] [CrossRef]
- Günther, M.; Camhy, D.; Steffelbauer, D.; Neumayer, M.; Fuchs-Hanusch, D. Showcasing a smart water network based on an experimental water distribution system. Procedia Eng. 2015, 119, 450–457. [Google Scholar] [CrossRef] [Green Version]
- Mutchek, M.; Williams, E. Moving Towards Sustainable and Resilient Smart Water Grids. Challenges 2014, 5, 123–137. [Google Scholar] [CrossRef] [Green Version]
- Li, J.; Bao, S.; Burian, S. Real-time data assimilation potential to connect micro-smart water test bed and hydraulic model. H2Open J. 2019, 2, 71–82. [Google Scholar] [CrossRef] [Green Version]
- McKenna, K.; Keane, A. Residential Load Modeling of Price-Based Demand Response for Network Impact Studies. IEEE Trans. Smart Grid 2016, 7, 2285–2294. [Google Scholar] [CrossRef] [Green Version]
- Oracle. Smart Metering for Water Utilities; Oracle Corporation: Redwood Shores, CA, USA, 2009. [Google Scholar]
- Beal, C.; Flynn, J. The 2014 Review of Smart Metering and Intelligent Water Networks in Australia & New Zealand. In Proceedings of the Report prepared for WSAA by the Smart Water Research Centre, Griffith University, Queensland, Australia, 1 November 2014. [Google Scholar]
- Murray, R.; Haxton, T.; McKenna, S.; Hart, D.; Umberg, K.; Hall, J.; Lee, Y.; Tyree, M.; Hartman, D. Case Study Application of the CANARY Event Detection Software. In Proceedings of the Water Quality Technology Conference and Exposition 2010, Savannah, GA, USA, 14–18 November 2010. [Google Scholar]
- U.S. Department of Energy. 2014 Smart Grid System Report; The U.S. Department of Energy: Washington, DC, USA, 2014; ISBN 2025863098.
- Batty, M.; Axhausen, K.W.; Giannotti, F.; Pozdnoukhov, A.; Bazzani, A.; Wachowicz, M.; Ouzounis, G.; Portugali, Y. Smart cities of the future. Eur. Phys. J. Spec. Top. 2012, 214, 481–518. [Google Scholar] [CrossRef] [Green Version]
- Kartakis, S.; Abraham, E.; McCann, J.A. WaterBox: A Testbed for Monitoring And Controlling Smart Water Networks. In Proceedings of the 1st ACM International Workshop on Cyber-Physical Systems for Smart Water Networks, CySWater 2015, Seattle, WA, USA, 14–16 April 2015. [Google Scholar]
- Koo, D.; Piratla, K.; Matthews, C.J. Towards Sustainable Water Supply: Schematic Development of Big Data Collection Using Internet of Things (IoT). Procedia Eng. 2015, 118, 489–497. [Google Scholar] [CrossRef] [Green Version]
- Luciani, C.; Casellato, F.; Alvisi, S.; Franchini, M. From Water Consumption Smart Metering to Leakage Characterization at District and User Level: The GST4Water Project. Proceedings 2018, 2, 675. [Google Scholar] [CrossRef] [Green Version]
- Gabrielli, L.; Pizzichini, M.; Spinsante, S.; Squartini, S.; Gavazzi, R. Smart Water Grids for Smart Cities: A Sustainable Prototype Demonstrator. In Proceedings of the EuCNC 2014—European Conference on Networks and Communications, Bologna, Italy, 23–26 June 2014. [Google Scholar]
- Chen, Y.; Han, D. Water quality monitoring in smart city: A pilot project. Autom. Constr. 2018, 89, 307–316. [Google Scholar] [CrossRef] [Green Version]
- Helmbrecht, J.; Pastor, J.; Moya, C. Smart Solution to Improve Water-energy Nexus for Water Supply Systems. Procedia Eng. 2017, 186, 101–109. [Google Scholar] [CrossRef]
- Wu, Z.Y.; El-Maghraby, M.; Pathak, S. Applications of deep learning for smart water networks. Procedia Eng. 2015, 119, 479–485. [Google Scholar] [CrossRef]
- Hatchett, S.; Uber, J.; Boccelli, D.; Haxton, T.; Janke, R.; Kramer, A.; Matracia, A.; Panguluri, S. Real-Time Distribution System Modeling: Development, Application, and Insights. In Proceedings of the Urban Water Management: Challenges and Oppurtunities—11th International Conference on Computing and Control for the Water Industry, CCWI 2011, Exeter, UK, 5–7 September 2011. [Google Scholar]
- Ntuli, N.; Abu-Mahfouz, A. A Simple Security Architecture for Smart Water Management System. Procedia Comput. Sci. 2016, 83, 1164–1169. [Google Scholar] [CrossRef] [Green Version]
- The Smart Water Networks Forum Swan Workgroups. Available online: https://www.swan-forum.com/workgroups/ (accessed on 10 December 2019).
- Li, J.; Lee, S.; Shin, S.; Burian, S. Using a Micro-Test-Bed Water Network to Investigate Smart Meter Data Connections to Hydraulic Models. In Proceedings of the World Environmental and Water Resources Congress 2018: Hydraulics and Waterways, Water Distribution Systems Analysis, and Smart Water, Reston, VA, USA, 3–7 June 2018; 2018; pp. 342–350. [Google Scholar]
- Kamienski, C.; Soininen, J.P.; Taumberger, M.; Dantas, R.; Toscano, A.; Cinotti, T.S.; Maia, R.F.; Neto, A.T. Smart water management platform: IoT-based precision irrigation for agriculture. Sensors 2019, 19, 276. [Google Scholar] [CrossRef] [PubMed] [Green Version]
- Bragalli, C.; Neri, M.; Toth, E. Effectiveness of smart meter-based urban water loss assessment in a real network with synchronous and incomplete readings. Environ. Model. Softw. 2019, 112, 128–142. [Google Scholar] [CrossRef]
- Alvisi, S.; Casellato, F.; Franchini, M.; Govoni, M.; Luciani, C.; Poltronieri, F.; Riberto, G.; Stefanelli, C.; Tortonesi, M. Wireless middleware solutions for smart water metering. Sensors 2019, 19, 1853. [Google Scholar] [CrossRef] [Green Version]
- Cominola, A.; Giuliani, M.; Castelletti, A.; Rosenberg, D.E.; Abdallah, A.M. Implications of data sampling resolution on water use simulation, end-use disaggregation, and demand management. Environ. Model. Softw. 2018, 102, 199–212. [Google Scholar] [CrossRef] [Green Version]
- Jha, M.K.; Sah, R.K.; Rashmitha, M.S.; Sinha, R.; Sujatha, B.; Suma, K.V. Smart Water Monitoring System for Real-Time Water Quality and Usage Monitoring. In Proceedings of the International Conference on Inventive Research in Computing Applications, ICIRCA 2018, Coimbatore, Tamil Nadu, India, 11–12 July 2018. [Google Scholar]
- Siew, C.; Tanyimboh, T.T. Pressure-Dependent EPANET Extension. Water Resour. Manag. 2012, 26, 1477–1498. [Google Scholar] [CrossRef] [Green Version]
- Pai, T.Y.; Lin, K.L.; Shie, J.L.; Chang, T.C.; Chen, B.Y. Predicting the co-melting temperatures of municipal solid waste incinerator fly ash and sewage sludge ash using grey model and neural network. Waste Manag. Res. 2011, 29, 284–293. [Google Scholar] [CrossRef]
- Monks, I.; Stewart, R.A.; Sahin, O.; Keller, R. Revealing unreported benefits of digital water metering: Literature review and expert opinions. Water 2019, 29, 838. [Google Scholar] [CrossRef] [Green Version]
- Stewart, R.A.; Nguyen, K.; Beal, C.; Zhang, H.; Sahin, O.; Bertone, E.; Vieira, A.S.; Castelletti, A.; Cominola, A.; Giuliani, M.; et al. Integrated intelligent water-energy metering systems and informatics: Visioning a digital multi-utility service provider. Environ. Model. Softw. 2018, 105, 94–117. [Google Scholar] [CrossRef]
- Beal, C.D.; Stewart, R.A. Identifying residential water end uses underpinning peak day and peak hour demand. J. Water Resour. Plan. Manag. 2014, 140, 04014008. [Google Scholar] [CrossRef] [Green Version]
- Romano, M.; Kapelan, Z. Adaptive water demand forecasting for near real-time management of smart water distribution systems. Environ. Model. Softw. 2014, 60, 265–276. [Google Scholar] [CrossRef] [Green Version]
- Public Utilities Board Singapore. Managing the water distribution network with a Smart Water Grid. Smart Water. 2016, 1, 1–13. [Google Scholar]
- Aşchilean, I.; Giurca, I. Choosing a water distribution pipe rehabilitation solution using the analytical network process method. Water 2018, 10, 484. [Google Scholar] [CrossRef] [Green Version]
- Fontana, N.; Giugni, M.; Glielmo, L.; Marini, G.; Zollo, R. Hydraulic and electric regulation of a prototype for real-time control of pressure and hydropower generation in a water distribution network. J. Water Resour. Plan. Manag. 2018, 144, 04018072. [Google Scholar] [CrossRef]
- Sitzenfrei, R.; Rauch, W. Optimizing small hydropower systems in water distribution systems based on long-time-series simulation and future scenarios. J. Water Resour. Plan. Manag. 2015, 141, 04015021. [Google Scholar] [CrossRef]
- Torcellini, P.A.; Long, N.; Judkoff, R.D. Consumptive Water Use for U.S. Power Production. In Proceedings of the 2004 Winter Meeting—Technical and Symposium Papers, American Society of Heating, Refrigerating and Air-Conditioning Engineers, Anaheim, CA, USA, 24–28 January 2004. [Google Scholar]
- Ton, D.T.; Smith, M.A. The U.S. Department of Energy’s Microgrid Initiative. Electr. J. 2012, 25, 84–94. [Google Scholar] [CrossRef]
- Di Nardo, A.; Di Natale, M.; Santonastaso, G.F.; Venticinque, S. An Automated Tool for Smart Water Network Partitioning. Water Resour. Manag. 2013, 27, 4493–4508. [Google Scholar] [CrossRef]
- U.S. EPA. CANARY User’s Manual Version 4.3.2; Sandia National Laboratories (SNL-NM): Albuquerque, NM, USA, 2012.
- Sønderlund, A.L.; Smith, J.R.; Hutton, C.J.; Kapelan, Z.; Savic, D. Effectiveness of smart meter-based consumption feedback in curbing household water use: Knowns and unknowns. J. Water Resour. Plan. Manag. 2016, 142, 04016060. [Google Scholar] [CrossRef] [Green Version]
- Cardell-Oliver, R.; Wang, J.; Gigney, H. Smart meter analytics to pinpoint opportunities for reducing household water use. J. Water Resour. Plan. Manag. 2016, 142, 04016007. [Google Scholar] [CrossRef]
- Brentan, B.; Meirelles, G.; Luvizotto, E.; Izquierdo, J. Joint operation of pressure-reducing valves and pumps for improving the efficiency of water distribution systems. J. Water Resour. Plan. Manag. 2018, 144, 04018055. [Google Scholar] [CrossRef] [Green Version]
- Murphy, J.J.; Dinar, A.; Howitt, R.E.; Rassenti, S.J.; Smith, V.L. The design of “Smart” water market institutions using laboratory experiments. Environ. Resour. Econ. 2000, 17, 375–394. [Google Scholar] [CrossRef]
- Marchese, D.; Linkov, I. Can You Be Smart and Resilient at the Same Time? Environ. Sci. Technol. 2017, 51, 5867–5868. [Google Scholar] [CrossRef] [Green Version]
- Jazri, H.; Jat, D.S. A Quick Cybersecurity Wellness Evaluation Framework for Critical Organizations. In Proceedings of the 2016 International Conference on ICT in Business, Industry, and Government, ICTBIG 2016, Indore, India, 18 November 2016. [Google Scholar]
- Dong, X.; Lin, H.; Tan, R.; Iyer, R.K.; Kalbarczyk, Z. Software-Defined Networking for Smart Grid Resilience: Opportunities and Challenges. In Proceedings of the CPSS 2015—1st ACM Workshop on Cyber-Physical System Security, Part of ASIACCS 2015, Denver, CO, USA, 16 October 2015; pp. 61–68. [Google Scholar]
- Hatchett, S.; Boccelli, D.; Uber, J.; Haxton, T.; Janke, R.; Kramer, A.; Matracia, A.; Panguluri, S. How Accurate Is a Hydraulic Model? In Proceedings of the Water Distribution Systems Analysis 2010—12th International Conference, WDSA 2010, Tucson, AZ, USA, 12–15 September 2010; pp. 1379–1389. [Google Scholar]
- Boulos, P.F.; Jacobsen, L.B.; Heath, J.E.; Kamojjala, S. Real-time modeling of water distribution systems: A case study. J. Am. Water Works Assoc. 2014, 106, E391–E401. [Google Scholar] [CrossRef]
- Taormina, R.; Galelli, S.; Tippenhauer, N.O.; Salomons, E.; Ostfeld, A. Characterizing cyber-physical attacks on water distribution systems. J. Water Resour. Plan. Manag. 2017, 143, 04017009. [Google Scholar] [CrossRef]
- Okeya, I.; Kapelan, Z.; Hutton, C.; Naga, D. Online modelling of water distribution system using Data Assimilation. Procedia Eng. 2014, 70, 1261–1270. [Google Scholar] [CrossRef] [Green Version]
- Sadler, J.M.; Goodall, J.L.; Behl, M.; Morsy, M.M.; Culver, T.B.; Bowes, B.D. Leveraging open source software and parallel computing for model predictive control of urban drainage systems using EPA-SWMM5. Environ. Model. Softw. 2019, 120, 104484. [Google Scholar] [CrossRef]
- International Telecommunication Union. ITU Guide to Developing a National Cybersecurity Strategy—Strategic Engagement in Cybersecurity. 2018. Available online: https://www.itu.int/dms_pub/itu-d/opb/str/D-STR-CYB_GUIDE.01-2018-PDF-E.pdf (accessed on 20 November 2019).
- Muhammad, A.; Haider, B.; Ahmad, Z. IoT Enabled Analysis of Irrigation Rosters in the Indus Basin Irrigation System. Procedia Eng. 2016, 154, 229–235. [Google Scholar] [CrossRef] [Green Version]
- Tonge, A.M. Cyber security: Challenges for society- literature review. IOSR J. Comput. Eng. 2013, 2, 67–75. [Google Scholar] [CrossRef]
- Sharpe, R.G.; Goodall, P.A.; Neal, A.D.; Conway, P.P.; West, A.A. Cyber-Physical Systems in the re-use, refurbishment and recycling of used Electrical and Electronic Equipment. J. Clean. Prod. 2018, 170, 351–361. [Google Scholar] [CrossRef] [Green Version]
- Lansey, K. Sustainable, Robust, Resilient, Water Distribution Systems. In Proceedings of the 14th Water Distribution Systems Analysis Conference 2012, WDSA 2012, Adelaide, Australia, 24–27 September 2012. [Google Scholar]
- Juan-García, P.; Butler, D.; Comas, J.; Darch, G.; Sweetapple, C.; Thornton, A.; Corominas, L. Resilience theory incorporated into urban wastewater systems management. State of the art. Water Res. 2017, 115, 149–161. [Google Scholar] [CrossRef] [Green Version]
- Todini, E. Looped water distribution networks design using a resilience index based heuristic approach. Urban Water 2000, 2, 115–122. [Google Scholar] [CrossRef]
- Youn, S.G.; Chung, E.S.; Kang, W.G.; Sung, J.H. Probabilistic estimation of the storage capacity of a rainwater harvesting system considering climate change. Resour. Conserv. Recycl. 2012, 65, 136–144. [Google Scholar] [CrossRef]
- Abdallah, A.M.; Rosenberg, D.E. Heterogeneous residential water and energy linkages and implications for conservation and management. J. Water Resour. Plan. Manag. 2014, 140, 288–297. [Google Scholar] [CrossRef]
- Horsburgh, J.S.; Leonardo, M.E.; Abdallah, A.M.; Rosenberg, D.E. Measuring water use, conservation, and differences by gender using an inexpensive, high frequency metering system. Environ. Model. Softw. 2017, 96, 83–94. [Google Scholar] [CrossRef]
- Nguyen, K.A.; Stewart, R.A.; Zhang, H. An autonomous and intelligent expert system for residential water end-use classification. Expert Syst. Appl. 2014, 41, 342–356. [Google Scholar] [CrossRef] [Green Version]
- Cominola, A.; Nguyen, K.; Giuliani, M.; Stewart, R.A.; Maier, H.R.; Castelletti, A. Data mining to uncover heterogeneous water use behaviors from smart meter data. Water Resour. Res. 2019, 55, 9315–9333. [Google Scholar] [CrossRef] [Green Version]
- Stewart, R.A.; Willis, R.; Giurco, D.; Panuwatwanich, K.; Capati, G. Web-based knowledge management system: Linking smart metering to the future of urban water planning. Aust. Plan. 2010, 47, 66–74. [Google Scholar] [CrossRef] [Green Version]
- Yuan, Z.; Olsson, G.; Cardell-Oliver, R.; van Schagen, K.; Marchi, A.; Deletic, A.; Urich, C.; Rauch, W.; Liu, Y.; Jiang, G. Sweating the assets—The role of instrumentation, control and automation in urban water systems. Water Res. 2019, 155, 381–402. [Google Scholar] [CrossRef] [PubMed]
- Cominola, A.; Giuliani, M.; Piga, D.; Castelletti, A.; Rizzoli, A.E. Benefits and challenges of using smart meters for advancing residential water demand modeling and management: A review. Environ. Model. Softw. 2015, 72, 198–214. [Google Scholar] [CrossRef] [Green Version]
Figure 1.
Literature overview: the number of publications for smart water systems (SWS’s) definition.
Figure 1.
Literature overview: the number of publications for smart water systems (SWS’s) definition.

Figure 2.
Literature overview: the number of the organization for SWS’s definition.

Figure 3.
Literature overview: the number of literature types for different organizations.

Figure 4.
Literature overview: number of studies for literature type.

Figure 5.
A New Framework of Smart Water System.

Figure 6.
Designing of Instruments layer.

Figure 7.
Property layer designing.

Figure 8.
Function layer designing.

Figure 9.
Benefits layer designing.

Figure 10.
Application layer designing.

Figure 11.
Illustration of a smart water system technical structure.

Figure 12.
The number of studies for different metrics scope.


Table 1.
Classification of the literature considering the framework in SWS.
| Reference Number | Smart Water Definition | Smart Water Structure | Smart Water Metrics | Future Research | ||||
|---|---|---|---|---|---|---|---|---|
| Instrument Layer | Property Layer | Function Layer | Benefit Layer | Application Layer | ||||
| [42] | Smart water is also called Smart Water Grid (SWG4), Internet of Water5, Smart Water Management, etc. | ● | ● | ● | ● | ● | ||
| [43] | Smart water grid is based on the Internet of Things and the structure of smart water system. | ● | ● | ● | ● | |||
| [44] | A smart water system (network) in water context comprises smart meters, smart valves, smart pumps, data communication, data management, data fusion, and analysis tools. | ● | ● | ● | ● | |||
| [45] | A smart water network should comprise smart meters, smart valves, and smart pumps. | ● | ● | . ● | ||||
| [46] | An advanced and intelligent water supply system and includes ICT integration of the water supply network. | ● | ● | ● | ● | |||
| [17] | Water management technologies converging with ICT have been called Smart Water Management (SWM) distinguished from traditional water management technologies. | ● | ● | ● | ● | ● | ● | |
| [47] | A Smart Water Grid system integrates information and communications technologies into the management of the water distribution system. | ● | ● | ● | ● | ● | . ● | |
| [48] | Smart water system illustrates many of the ways technology, middleware, and software help maximize the value of Smart Metering data to all stakeholders. | ● | ● | ● | ||||
| [33] | Not specified | ● | ● | |||||
| [34] | A smart water system offers a mechanism to capture and communicate data on water resources through hydro informatics systems. | ● | ● | ● | ||||
| [36] | Not specified | ● | ● | ● | ● | |||
| [37] | Not specified | ● | ● | ● | ● | |||
| [38] | Not specified | ● | ● | ● | ● | |||
| [39] | Smart water networks is a system composed of automation, sensing and communication tools. | ● | ● | ● | ● | |||
| [41] | A smart water system is an integrated set of products, solutions, and systems. | ● | ● | ● | ||||
| [49] | A smart water system is based on the smart metering system to collect real-time water data. | ● | ● | ● | ● | ● | ||
| [40] | Smart water networks are layered, as any data ecosystem is, starting from sensors, remote control, and enterprise data sources, through data collection and communications, data management and display, and up to data fusion and analysis. | ● | ● | ● | ● | |||
| [50] | Not specified | ● | ● | ● | ||||
| [51] | Not specified | |||||||
| [23] | Not specified | ● | ||||||
| [52] | A smart water system is designed to gather meaningful and actionable data about the flow, pressure, and distribution of a city’s water. | ● | ● | ● | ||||
| [53] | A smart water system uses data-driven components to help manage and operate the physical network of pipe. | ● | ● | ● | ● | |||
| [54] | Smart water system aims to deploy the Internet of Things (IoT) technology throughout the water supply infrastructure and consumers’ usage. | ● | ● | ● | ● | |||
| [43] | Smart water grid is based on the Internet of Things, mainly including hierarchy framework, technical system, and function framework. | ● | ● | ● | ● | ● | ● | |
| [20] | An assortment of components and procedures for the continuous monitoring and evaluation of water use. | ● | ● | ● | ||||
| [55] | A smart water architecture can be characterized by five layers: physical layer, sensing, and control layer, communication layer, data management layer, and data fusion layer. | ● | ● | ● | ||||
| [56] | A smart water grid is an innovative way to monitor water distribution networks. | ● | ● | ● | ● | |||
| [57] | A water smart grid would direct the innovative technologies suite to create a data-driven system for intelligent water resources management. | ● | ● | ● | ● | |||
| [58] | Smart water networks need online water monitoring for the collection and analysis of data. | ● | ● | ● | ● | |||
| [59] | Not specified | ● | ● | ● | ● | |||
| [60] | Not specified | ● | ● | |||||
| [61] | Smart water system requires many digital devices (sensors and actuators) to be deployed across the water distribution network to enable near real-time monitoring and control of the water grid components. | ● | ● | ● | ||||
Table 2.
Components of Cyber-Infrastructure.
| Components | Roles | Problems Solved |
|---|---|---|
| Smart Flow Sensors | Monitor flow | Water leakage, Pipe burst |
| Smart Pressure Sensor | Monitor pressure | Pressure instability, Water Loss, Energy Loss |
| Smart Valves | “Bi-direction” operation | Water leakage, Pipe burst |
| Smart Pumps | “Bi-direction” operation | Pressure unbalance, Energy loss |
| Smart Irrigation Controllers | “Bi-direction” operation | Water loss, Energy loss, Water Overuse |
| Smart Contaminant Sensor | Monitor water quality | Pipe deterioration, Water aging, Contaminant intrusion |
| Smart Flood Sensor | Monitor flood volume | Flood disaster, Water quality issues |
Note: Bidrirection communication denotes the ability of the meter operator to “at a minimum, obtain meter reads on-demand, to ascertain whether water has recently been flowing through the meter and onto the premises, and to issue commands to the meter to perform specific tasks such as disconnecting or restricting water flow” [58].
© 2020 by the authors. Licensee MDPI, Basel, Switzerland. This article is an open access article distributed under the terms and conditions of the Creative Commons Attribution (CC BY) license (http://creativecommons.org/licenses/by/4.0/).
Share and Cite
MDPI and ACS Style
Li, J.; Yang, X.; Sitzenfrei, R. Rethinking the Framework of Smart Water System: A Review. Water 2020, 12, 412. https://doi.org/10.3390/w12020412
AMA Style
Li J, Yang X, Sitzenfrei R. Rethinking the Framework of Smart Water System: A Review. Water. 2020; 12(2):412. https://doi.org/10.3390/w12020412
Chicago/Turabian StyleLi, Jiada, Xiafei Yang, and Robert Sitzenfrei. 2020. "Rethinking the Framework of Smart Water System: A Review" Water 12, no. 2: 412. https://doi.org/10.3390/w12020412
Note that from the first issue of 2016, this journal uses article numbers instead of page numbers. See further details here.