Anaerobic Oxidation of Methane in Freshwater Sediments of Rzeszów Reservoir


Department of Environmental and Chemistry Engineering, Faculty of Civil and Environmental Engineering and Architecture, Rzeszów University of Technology, al. Powstańców Warszawy 12, 35-959 Rzeszów, Poland
*
Author to whom correspondence should be addressed.
Water 2020, 12(2), 398; https://doi.org/10.3390/w12020398
Submission received: 27 October 2019
/
Revised: 16 January 2020
/
Accepted: 30 January 2020
/
Published: 2 February 2020
(This article belongs to the Section Hydrology)
Abstract
:The anaerobic oxidation of methane (AOM) is an important sink of methane that plays a significant role in global warming. However, evidence for the AOM in freshwater habitats is rare, especially in dam and weir (small-scale dam) reservoirs. Here, the AOM process was examined in freshwater sediments of a small-scale dam reservoir located in Rzeszów, SE Poland. The AOM rate was determined in the main experiment with the addition of the 13CH4 isotope marker (He+13CH4). Sediments were collected three times: in spring (in May, 15 °C), in summer (in July, 20 °C) and in autumn (in September, 10 °C). Further analysis considers the impact on AOM rate of potential electron acceptors present in pore-water (NO2−, NO3−, SO42−, and Fe3+ ions). The work suggests that an AOM process does take place in the studied reservoir sediments, with this evidenced by the presence in the headspace of an increased 13CO2 concentration deemed to derive from 13CH4 oxidation. Rates of AOM noted were of 0.36–1.42 nmol·g−1·h−1, with the most intensive oxidation in each sediment layer occurring at 20 °C. While none of the potential electron acceptors considered individually were found to have had a statistically significant influence on the AOM rate, their significance to the dynamics of the AOM process was not precluded.
1. Introduction
Methane (CH4) is an important gaseous atmospheric pollutant contributing to the greenhouse effect through its capacity to capture heat 23 times more effectively than carbon dioxide (CO2), as the best-known greenhouse gas. The oceans play a key role in global gaseous exchange, even though their share in the global carbon cycle is only of about 1% [1]. There is also strong evidence that inland waters (especially dam reservoirs) can play a role in the global dynamics of greenhouse gases that is disproportionate, given the way these cover just 3.6% of the Earth’s surface [2,3], yet may well account for 16% of total CH4 emissions to the atmosphere [4,5,6].
Where reservoirs are concerned, it is organic matter decomposition that is responsible for the emission of both main GHGs, i.e., CH4 and CO2 [7,8]. This decomposition takes place in sediments [9], though—as the main reducers are heterotrophic bacteria [10], which are most active is the upper sediment layer [11]—it is there that reduction prevails. Organic matter is the most frequent electron donor in the natural environment, but recent studies have shown how CH4 may also affect the growth of microorganisms under anaerobic conditions significantly [12]. This suggests a role for methane itself as an electron donor, with the acceptors being nitrates (NO3−), manganese (Mn4+), iron (Fe3+), or sulphates (SO42−). The use of electron acceptors by microorganisms is sequential, and the rate of methane oxidation would depend on their availability, though the actual presence of anaerobic oxidation of methane (AOM) in the environment was long doubted [13]. However, evidence has emerged in the last few years, with even a suggestion that the process has a significant role to play in the global carbon cycle [13,14,15,16]. AOM is considered to occur in both marine and freshwater sediments [17,18,19,20,21,22], to an extent that considerably reduces emissions of CH4 from waters to the atmosphere [16,23,24,25].
Given the results concerning CH4 emissions yielded by recent research on temperate-zone weir and dam reservoirs [7,26], it is important for both the mechanisms underpinning AOM and the microorganisms involved in this oxidation of CH4 in freshwater ecosystems to be understood better, not least with a view to future CH4 emissions to the atmosphere being forecast appropriately. However, recent publications on the AOM process have focused on rates characterising marine sediments [27,28,29,30,31,32,33,34]. That leaves any further study of AOM rates in freshwater environments looking of value as it contributes to a broader understanding of the metabolic processes microorganisms in aquatic ecosystems are responsible for, above all the natural oxidation of CH4 by way of alternative electron acceptors.
It is the relative lack of information on AOM process in small-scale dam reservoirs that prompted the attempt described here to pursue preliminary research into this process, in the sediments of the small-scale dam reservoir located in Rzeszów, SE Poland. Specifically, the aim was to determine AOM rates in the main experiment involving the incubation of sediments along with an 13CH4 isotope marker, at temperatures of 10, 15, or 20 °C. Additionally, for the purpose of comparison, an experiment in anaerobic conditions without addition 13CH4 (He) was carried out.
2. Materials and Methods
2.1. Study Area
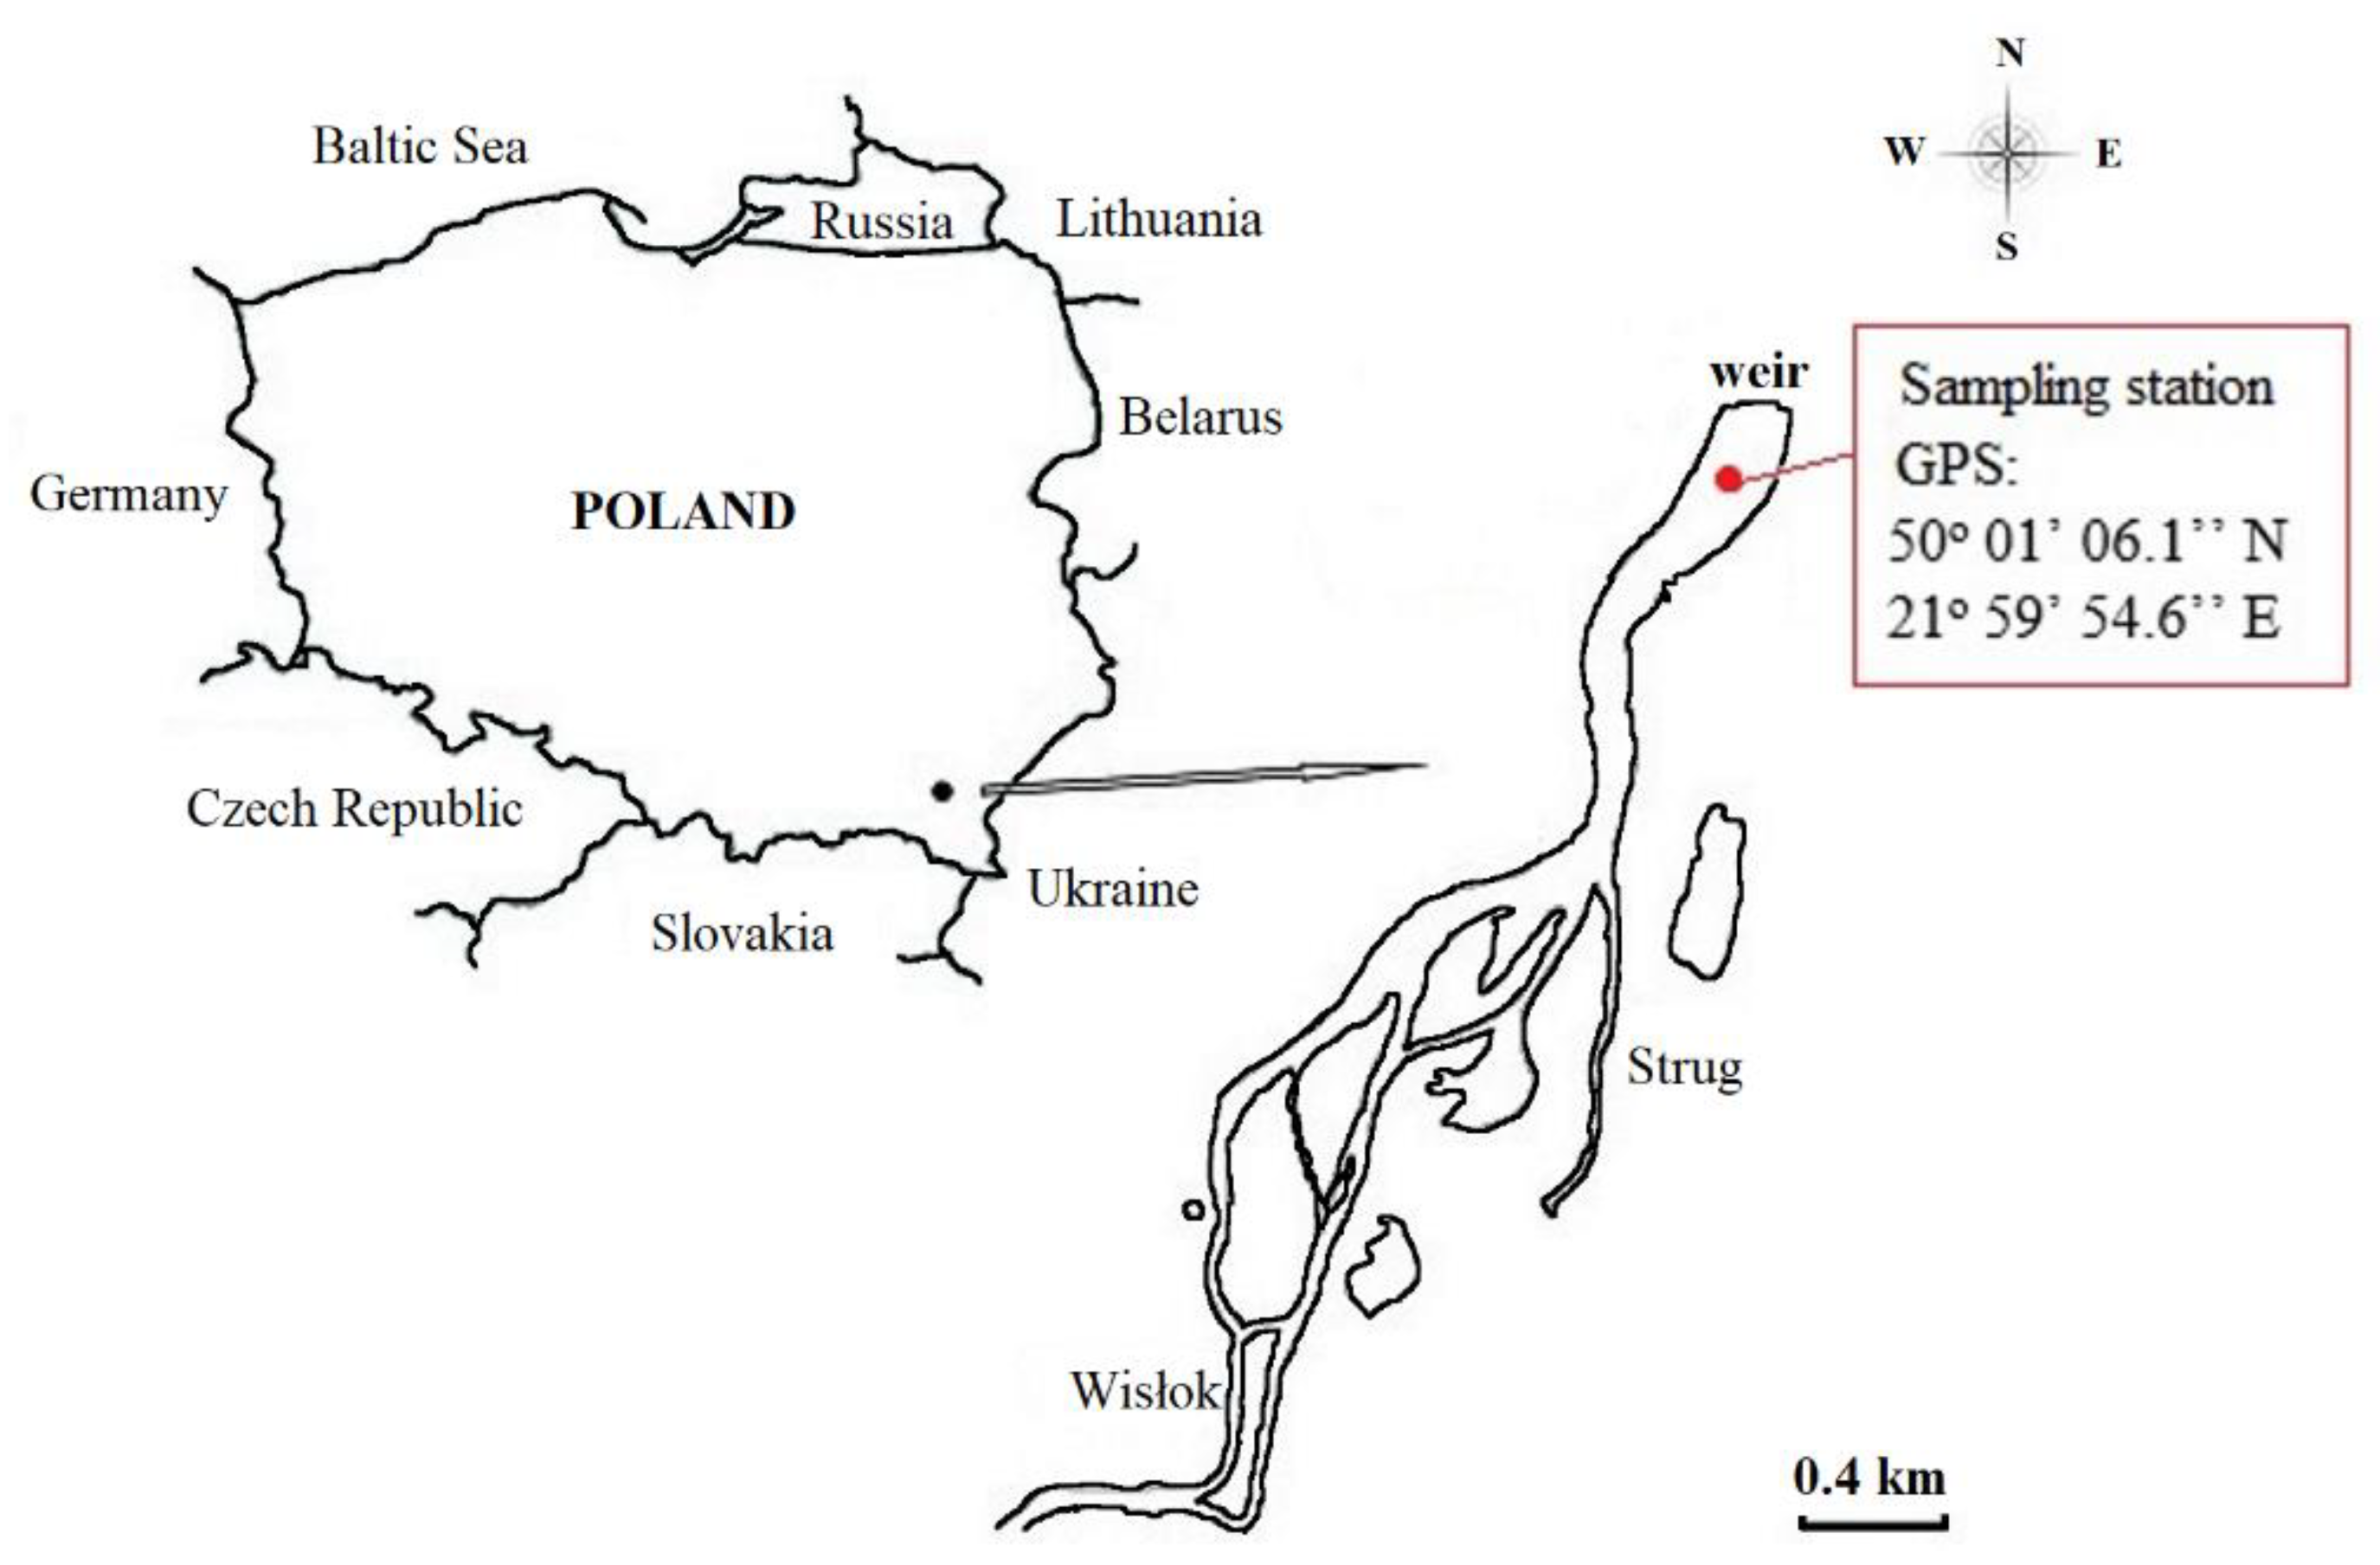
The reservoir in Rzeszów selected for the research was built in 1974 by damming Poland’s River Wisłok some 64 km along its course with a concrete weir. The overflow weir section consists of 4 spans (20.8 m wide). The spans are closed with valves of 4.30 m high and movable flap gates, raising the water above the normal damming level by 1 m. The ordinate of the normal damming level is 198.50 m a.s.l. Also fed by the River Strug, the reservoir has as its main purpose the proper operation of a water intake for the 184,000 inhabitant city of Rzeszów. However, due to a location on the outskirts of that city, this body of water also plays its important sporting and recreational role. That said, a proportionally large reduction in overall volume (of 0.7M m3) has affected the Reservoir over the last 40 years, with many areas (in the upper part especially) silted up and gradually transforming into land.
Rzeszów Reservoir has an elongated shape and a variable width ranging from 40 m to 300 m and the mean depth is ca. 2 m. The catchment of the reservoir covers 2050 km2, with the Wisłok flowing through a sub-mountainous (largely agricultural) area into a central industrialised part featuring glassworks, tanneries and refineries. For its part, the catchment of the Strug is agricultural land with high population density [35].
Reservoir sediments were sampled at a station located near the weir, following recent studies indicating that CH4 emissions there might be considerable, at 29.13 ± 67.87 mmol·m−2·day−1 on average [7]. CH4 production is shown to result from processes of acetate fermentation and hydrogenotrophic methanogenesis, albeit with the relative significances of these varying with temperature and sediment layer [36,37]. The locations of Rzeszów Reservoir and the sampling station are shown in Figure 1.
2.2. Sediment Sampling and Preparation
Reservoir sediments were collected in spring, summer and autumn in 2018, at temperatures of 15, 20, and 10 °C, respectively. Specifically, sampling took place once time each in April, July, and September, with five cores sampled at the bottom of some 1 m water depth using a specially designed sediment corer with a 60-mm-diameter (Polish patent application No P.428513) along with overlying water. These were then transported to the laboratory immediately, with the cores (thickness of sediment cores usually no higher than 15–20 cm) pushed progressively from the bottom of Plexiglas tubes by a piston, in such a way that it was possible to study separately the layers present at depths of 0–5, 5–10, and 10–15 cm.
Pore-water was centrifuged from three layers of one core in a laboratory centrifuge (MPW-352), so that determinations could be made for organic carbon (TOC), as well as nitrite, nitrate, and sulphate ions (NO2−, NO3−, and SO42−). Pore-water from a second core was squeezed directly into a gastight vial using a modified pore-water squeezer [38], in order for contact with the atmosphere to be avoided, so that a determination for trivalent iron (Fe3+) could be carried out.
The three sediment layers from the third core were dried to constant weight at room temperature, and subsequently at 60 °C, before sediments were milled in advance of parameters like pH, organic matter (OM), total organic carbon (TOC), total nitrogen (TN), and humic substances (HS) being determined. The grain size distribution of sediments was determined only once in summer (in July).
Sediments from the fourth and fifth cores were used to research the AOM process (via incubations with the isotope marker (He + 13CH4) and without 13CH4 (He)).
2.3. Incubation Experiment
After being brought to the laboratory, the collected sediments were divided into their 0–5, 5–10, and 10–15 cm layers. The sediments of each layer were homogenized by gentle mixing using a glass rod. To avoid any exposure to the atmospheric oxygen, it was all done inside the glove box under an inert atmosphere of helium. Incubation of each layer then took place, with the 13CH4 isotope marker added or without 13CH4. For this purpose, 7 g of wet sediment from each layer was placed into the incubation vessels (120 cm3) with 14 mL of distilled water deoxygenated by nitrogen purging (99.99% Air Products) using a laboratory scrubber. All operations were carried out in a glove box (830-ABB Compact Glove Box Plas-Labs, Inc. USA). Prior to the laboratory work, the air in the glove box was replaced 7–8 times, with helium (He, 99.9999% Air Products). Prepared samples were then subjected to pre-incubation by placing them in the dark in a thermostat for 10 days at in situ temperature (15 °C spring; 20 °C summer; 10 °C autumn), to allow for the removal of residual oxygen by microorganisms, via biochemical processes. It was only after this that about 1 cm3 of the 13CH4 isotope marker (99%, Sigma-Aldrich 490229-1L-EU) was added to samples. Incubations were carried out at temperatures corresponding to the in-situ sediment temperatures in spring (15 °C), summer (20 °C) and autumn (10 °C). After a certain time (0, 3, 20, and 40 days in the spring and summer cases; and 0, 3, 10, 20, 30, 40 and 50 in autumn), 1 cm3 of the headspace was withdrawn carefully within the glove box using a gas-tight syringe (1001SL Hamilton) and analyzed for CH4 and CO2 concentrations (ppm) using a Shimadzu GC-2010 Plus gas chromatograph equipped with a Barrier Discharge Ionization Detector (BID) and a Shin Carbon ST column (2 m, 1.00 mm ID, Mesh 100/120). Samples were injected manually into a GC apparatus with the detector working at 250 °C. Temperatures were 150 °C for the injection port and 60 °C for the column (the latter being maintained for 13 min). The carrier gas was helium (99.9999% Air Products) at a 50 mL·min−1 flow rate. The carbon isotopic composition of CO2 was determined using gas chromatograph combustion isotope mass spectrometry (GC-CIII-IRMS DELTAPlus Finnigan, Thermo Electron Corporation, Waltham, MA, USA), by withdrawing 0.1 cm3 of the headspace (also in the glove box) using a gas-tight syringe (1700, Hamilton). The results of stable isotope analyses are presented in the form of δ13C expressed in [‰] relative to the PDB (Pee Dee Belemnite) standard (Equation (1)):
Results obtained for CO2 concentrations (ppm) and δ13C-CO2 (‰) were used to calculate the rate at which the anaerobic oxidation of methane (AOM) had taken place.
In order to confirm the anaerobic conditions, empty vials were prepared (without sediment and distilled water) according to the procedure described above. The 13CH4 isotope marker alone was added to the vials and the concentrations of CH4 and CO2 were determined (at the same days as for other samples). There was no oxidation of CH4 to CO2 and therefore no oxygen.
The CH4 and CO2 concentrations at time zero were subtracted from each CH4 and CO2 concentrations, respectively, after incubation times of 3, 10, 20, 30, 40, and 50 days.
2.4. Sediment and Pore-Water Analysis
The reaction was determined potentiometrically (MultiLine P4, WTW, Germany) in slurry with 1 N KCl [39].
The OM content was determined as the loss after drying of sediments within 4 h at 550 °C [40].
Areometric method was used in determining the grain size distribution of sediments. The procedure for the determination of the grain size distribution is described in detail in PKN-CEN ISO/TS 17892-4: Part 4.
The contents of TOC and TN were determined at 1020 °C using a CN elemental analyzer (Flash EA 1112, ThermoQuest). The quality analysis made use of standard samples of known amounts of carbon and nitrogen (acetanilide). Prior to determination of TOC content, the dried and ground sediment samples were placed in a desiccator with concentrated HCl vapor [41] for 72 h, to ensure the removal of carbonates. Prior to analysis, the sediment sample was again dried to constant weight at 60 °C.
The modified method of Griffith and Schnitzer (1975) [42] was used for determining the content of humic substances. Dried and milled sediments were shaken at room temperature with 0.1 mole NaOH. A known volume of the alkaline extract was taken into a centrifuge tube, the solution then being adjusted to pH 1.0–1.5 with H2SO4, and allowed to stand for the next day to precipitate humic acids. Following separation from the precipitate, the obtained solution was then the subject of determinations for the organic-carbon content of fulvic acid (FA). The organic-carbon content of fulvic plus humic acids (FA+HA) was determined in the remaining alkaline extract using the Shimadzu TOC-V CPN Total Organic Carbon Analyzer. 0.5 M H2SO4 was added to residue in the centrifuge tube, and the tubes placed in a water bath for 1 h at 80 °C. In the extract obtained, the organic carbon content of the hemicellulose (HC) was determined on the aforementioned analyzer. The residue in the centrifuge tube was dried at 80 °C to constant weight and weighed carefully. A sample of the remaining sediment was taken, to determine the organic carbon content of humins (HU) using a CN elemental analyzer (Flash EA 1112, ThermoQuest). The organic carbon content of humic substances was calculated as the sum of the organic carbon content of the fulvic acids (FA), humic acids (HA) and humins (HU).
Ions, i.e., nitrite (NO2−), nitrate (NO3−), and sulphate (SO42−), were analysed in centrifuged pore-water after first being filtered through 0.22-μm syringe filters using DIONEX ICS-5000 ion chromatography.
Total organic carbon was determined using the Shimadzu TOC-V CPN Total Organic Carbon Analyzer, while the concentration of Fe3+ was determined spectrophotometrically using ferrozine, in line with the method after Viollier et al. (2000) [43]. Absorbance was measured using a Hach UV-VIS spectrometer at 562 nm.
2.5. Calculations
The AOM rate (nmol·g−1·h−1) and amount of CH4 oxidised (nmol·g−1) were calculated using formula developed by reference to available literature [44,45] (2) and (3). δ13C-CO2 was converted to 13C atom percent (13C AT%) in line with Equation (4):
where 13CAT—13C atom percent (%); CO2—carbon dioxide concentration at time t (ppm); Vg—volume of headspace in vial (0.096156 dm3); Vm—molar volume of ideal gas at 25 °C (24.45 dm3‧mol−1); m—dry sediment weight (g); t—incubation time (h); Rstd—absolute ratio constants in the standard (0.0111803).
3. Results
3.1. Characteristics of Sediments and Pore-Water
3.1.1. Sediment Characteristics
The results for selected physical and chemical parameters characterising sediments of Rzeszów Reservoir are as summarised in Table 1.
The reaction of the sediments proved to be slightly alkaline, with pH values in the 7.15–7.71 range. The lowest pH characterised the sediments of the 0–5 cm layer, and the highest the 10–15 cm layer. The highest OM values were likewise noted for the uppermost 5 cm layer (in the range 9.30–10.84% d.m.). Lower OM values were noted for the 10–15 cm layer (4.62–6.46%). The organic carbon content (TOC) was found to correlate significantly with that of OM content (R2 = 0.65), with figures for TOC being approximately 30% of OM values. Sediments were also characterised by low TN contents—in the range 0.10% (10–15 cm—20 °C layer) to 0.37% (0–5 cm layer—10 °C). There were positive correlations between the content of OM and TN (R2 = 0.95) as well as TOC and TN (R2 = 0.82), with this indicating organic nitrogen as the main component of TN. The OM and TOC contents are rather typical for Polish reservoirs. For example, the sediments in Sulejów Reservoir have OM contents in the 9.9–21.8% range, as well as TOC values of 5.2–10.3% [46]. In the sediments of Czorsztyn Reservoir, the OM values ranged from 2.3–11.9% [47], while corresponding values for other reservoirs are: Solina 8.72–10.11% OM and 1.94–2.92% TOC; Myczkowce 10.78–11.94% OM and 3.95–4.08% TOC [48,49].
C:N ratios obtained for the present study are in the 9.86–15.26 range, albeit with higher values observed in the deepest (10–15 cm) sediment layer. Lower C:N values recorded in the 0–5 cm layer indicate a greater share of autochthonous matter; in turn, organic matter in the 10–15 cm sediment layer is mainly of allochthonous origin, with sources taken to include macrophytes and plants rich in cellulose [7].
The content of humic substances ranged from 11.9 to 34.9 mg·g−1 d.w. The highest values were obtained in the uppermost 5 cm sediment layer in each research season. The content of humic substances correlated positively with the content of organic matter, and R2 was 0.70.
All analysed sediment layers consisted of several fractions (Table 1). In all layers, the predominant fraction was the silty fraction and its content varied from 73.15% to 77.35%. The sand fraction represented the smallest contribution in the granulation of the studied sediments and ranged from 3.50% to 5.23%. The remaining share was a clay fraction. The analysis of the grain composition of sediments showed that the grain fraction of 0.063–0.002 mm dominated in all sediment layers. In addition, the 2–0.063 mm fraction represented the lowest share. The top 5 cm sediment layer was granulometrically equivalent to silty loam, the deeper layers were granulometrically equivalent to silty clay.
3.1.2. Pore-Water Characteristics
Values for pore-water concentrations of the NO2−, NO3−, SO42−, and Fe3+ ions, as well as TOC are as shown in Table 2.
In each of the three seasons researched, the highest concentrations were obtained for TOC (5.62–79.88 mg·dm−3). Values on average 100 times lower characterised NO2− (0.009–0.021 mg·dm−3), NO3− (0.017–0.973 mg·dm−3) and SO42− (0.036–13.867 mg·dm−3). On the other hand, Fe3+ concentrations were of 39.45–380.57 µmol·dm−3.
3.2. Rates of Anaerobic Oxidation of Methane
Changes in CH4 and CO2 concentrations in the headspace during the incubation of sediments (He + 13CH4) at different temperatures are as shown in Supplementary Figure S1.
The concentration of CH4 was already decreasing rapidly in the first 3 days, only to reach values below 10 ppm on the last day of incubation (day 40 or 50). In contrast, as time went by, there was a steady increase in the concentration of CO2 recorded from the headspace. Values noted for CH4 were in the 0.3–2200 ppm range, while those of CO2 varied from 2200 to 18,000 ppm. At time zero, the values obtained were, in turn, in the 13–7910 ppm (CH4) and 1610–6760 ppm (CO2) range. However, by day 50 of the research (at 10 °C) there had been a decrease in CO2 concentration perhaps indicating the gradual depletion of electron acceptors, and hence increased emphasis on the process of methanogenesis most probably proceeding simultaneously the entire time.
Results obtained for CH4 and CO2 concentrations via He experiment are as shown in the Supplementary Figure S2. In the case of treatment without 13CH4, CH4 concentrations in the headspace varied from 1 to 50 ppm, while those of CO2 were in the 1400–16000 ppm range. Additionally, CH4 and CO2 concentrations at 0 day equaled 11–95 ppm and 900–10100 ppm, respectively.
Further analysis considers the calculation of 13C atom percent (13C AT%), on the basis of δ13C–CO2 (‰) values, and the results are shown in the Supplementary Materials (Figure S3).
CO2 in the headspace was found to be significantly enriched in 13C, most of all in the case of samples incubated at 20 °C. At this temperature, values noted for 13C AP were in the range 2.51–3.10% in the 0–5 cm layer (Supplementary Materials—Figure S3c), 4.82–6.77% in the 5–10 cm layer (Supplementary Materials—Figure S3f) and 2.13–7.62% in the 10–15 cm layer (Supplementary Materials—Figure S3i). In the case of other temperatures, values obtained were on average only half as high (15 °C—Supplementary Figure S3b,e,h) or only one-third as high (10 °C Supplementary Figure S3a,d,g). In most cases, 13C AP values decreased beyond day 20 of the incubation process. On the other hand, no significant increase in the 13C AP of He treatment (without 13CH4) was noted, which indicated that natural fractionation had little impact over the course of the experiment, and that natural 13CO2 signature does not change over the trial. The values obtained remain at a similar level at different temperatures in sediment layers. 13C AP were below 1.30%.
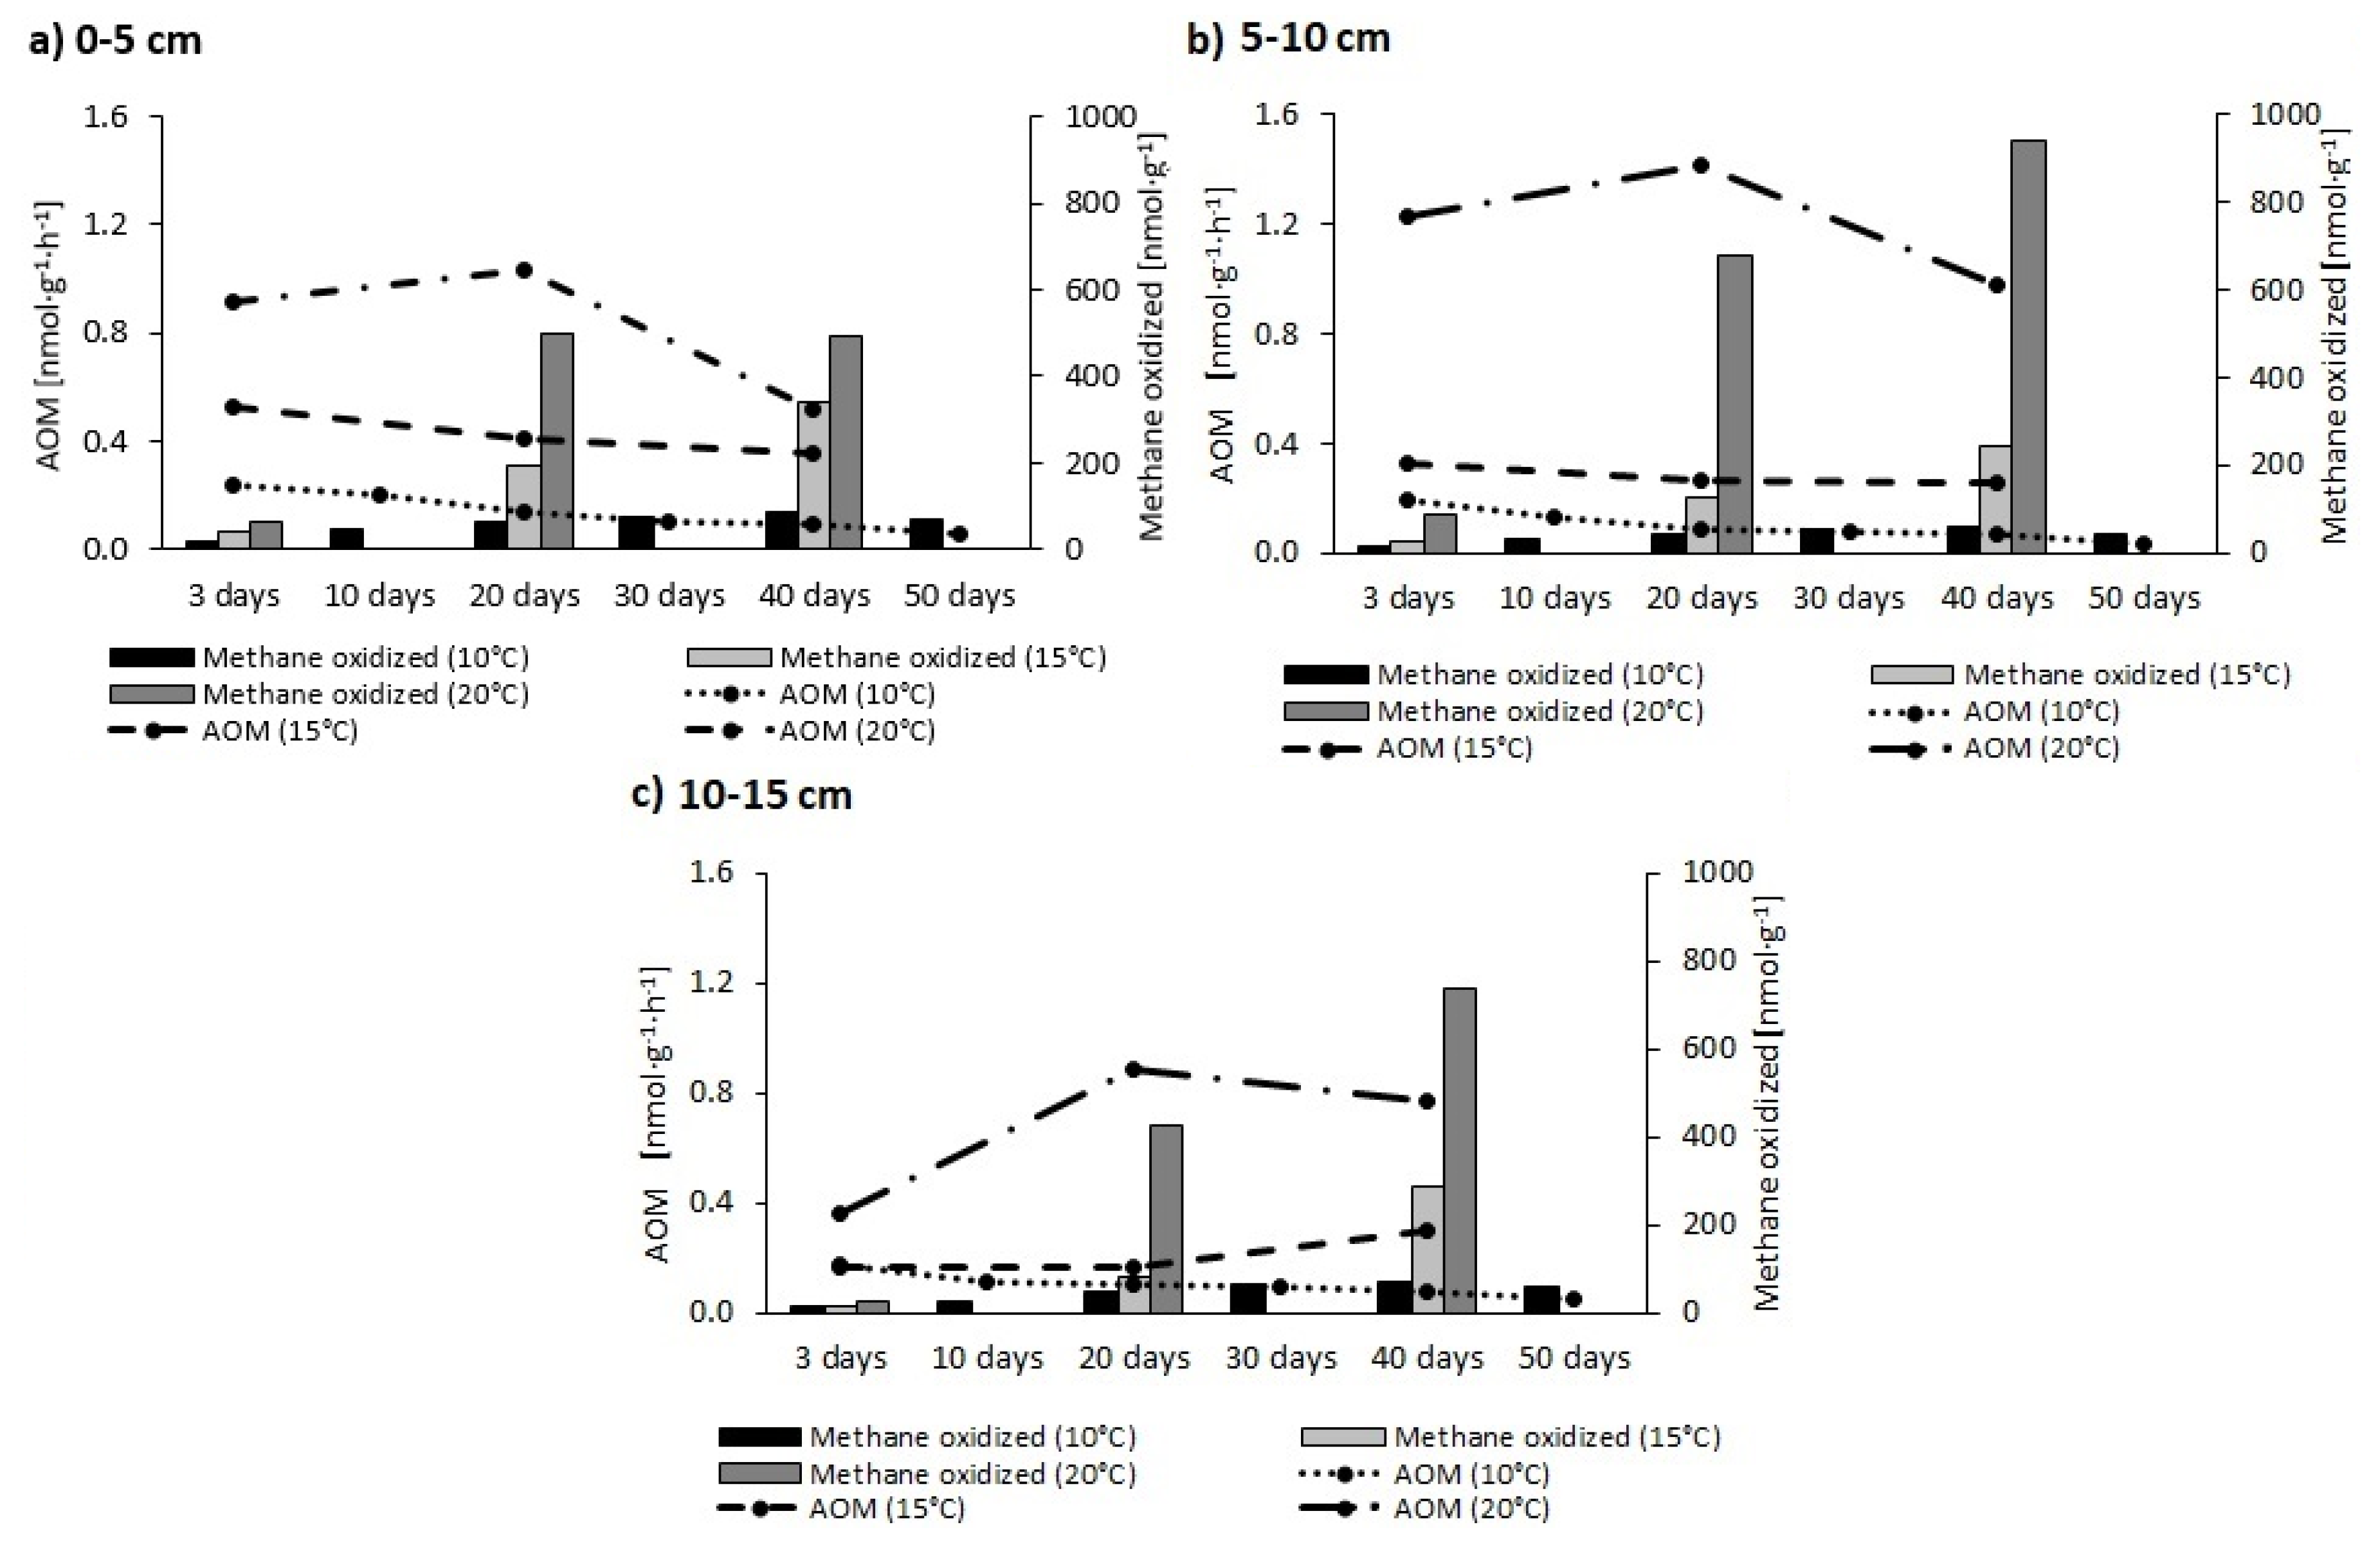
The AOM rate and amount of CH4 oxidised, as calculated on the basis of CO2 concentrations (ppm) and δ13C-CO2 values (‰), are shown graphically in Figure 2.
The AOM rate and amount of CH4 oxidised were greater at progressively-higher temperatures, with values for AOM noted at 20 °C in fact being five times higher than those at 10 or 15 °C. However, while the AOM process at 20 °C proved most effective in the 5–10 cm layer, those ongoing at 10 and 15 °C peaked in the 0–5 cm layer. Irrespective of incubation type, lowest values for the AOM process were noted in sediments from 10–15 cm down. At 10 °C, the amount of CH4 oxidised did not exceed 100 nmol·g−1, while at 15 °C amounts were still below 400 nmol·g−1. These results were thus in contrast with those obtained at 20 °C, which even reached 1000 nmol·g−1.
The AOM rate generally peaked as soon as on day 3 of incubation, with a decrease over time then ensuing. This shaping of the rate most likely reflected gradual depletion of electron acceptors involved in the AOM process [50].
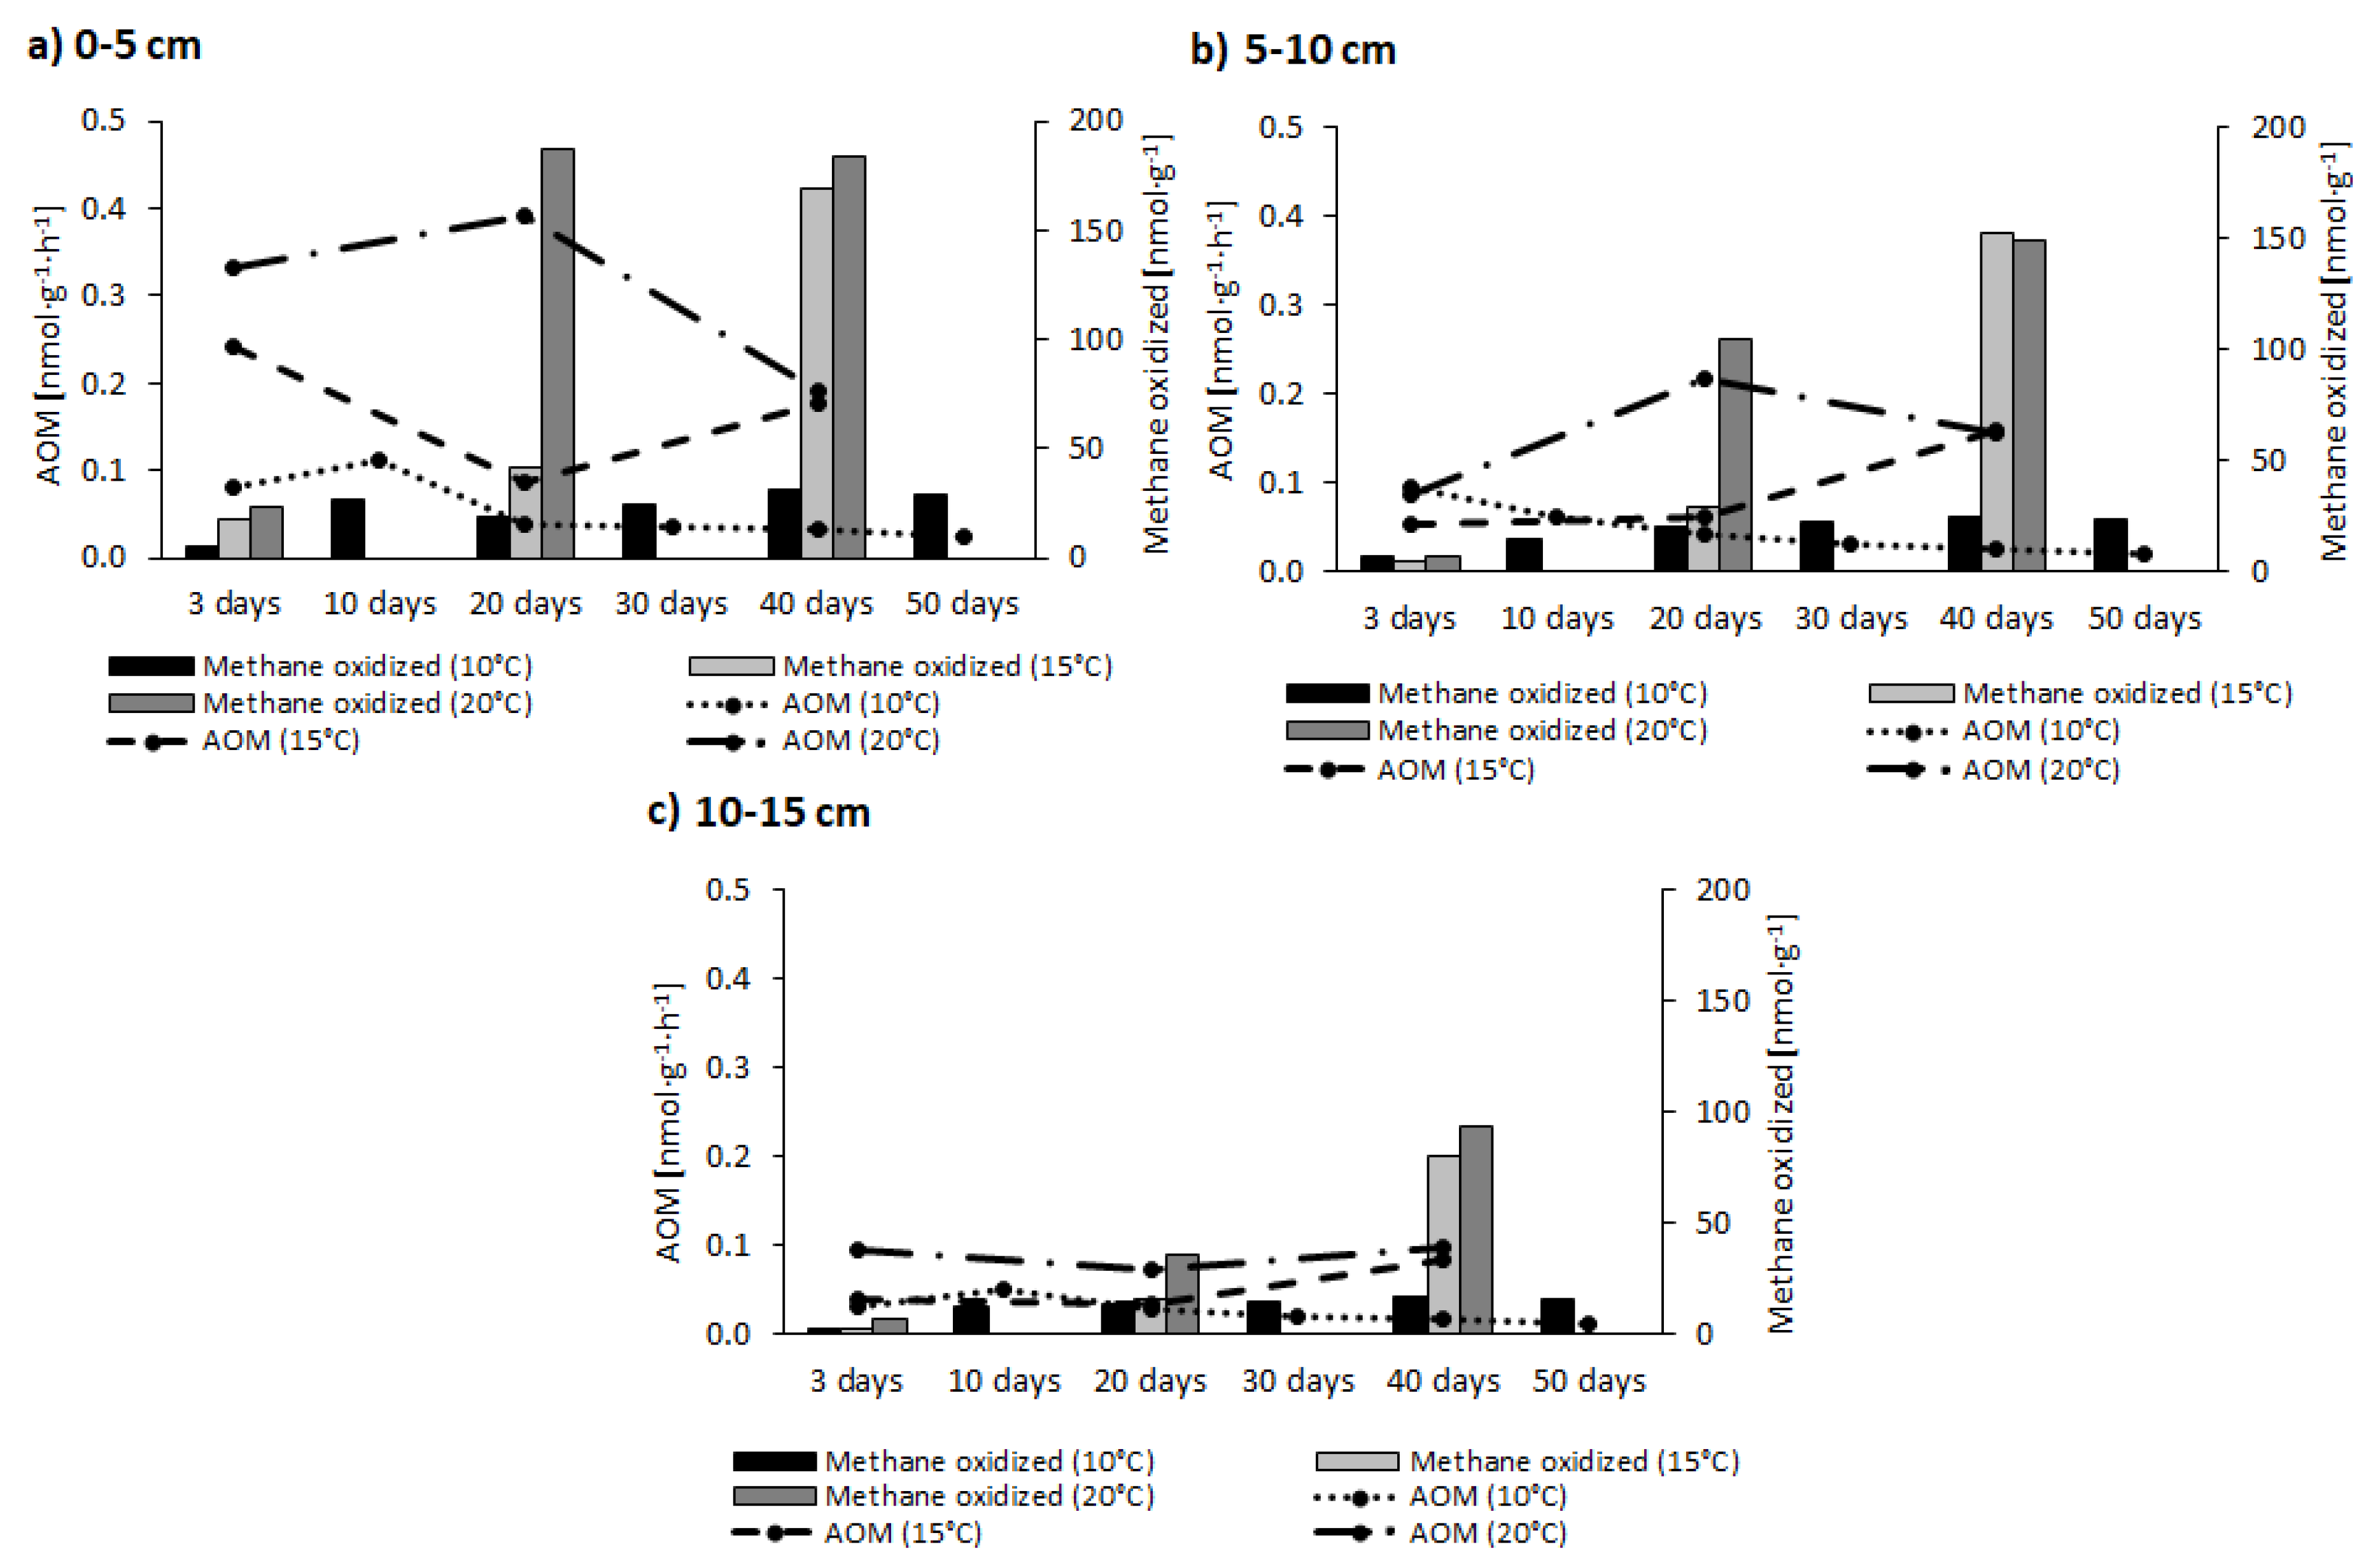
The AOM rate and amount of CH4 oxidised, i.e., He treatment, are shown graphically in Figure 3.
In the case of the incubation without 13CH4, the AOM rate reached the highest values in the 0–5 cm layer, and did not exceed 0.5 nmol·g−1·h−1. The rates then decreased with depth. Values for AOM obtained at 20 °C were higher compared to other temperatures. The amount of CH4 oxidised were almost 200 nmol·g−1 in the 0–5 cm layer, on the other hand, in the 10–15 cm layer amounts were below 100 nmol·g−1.
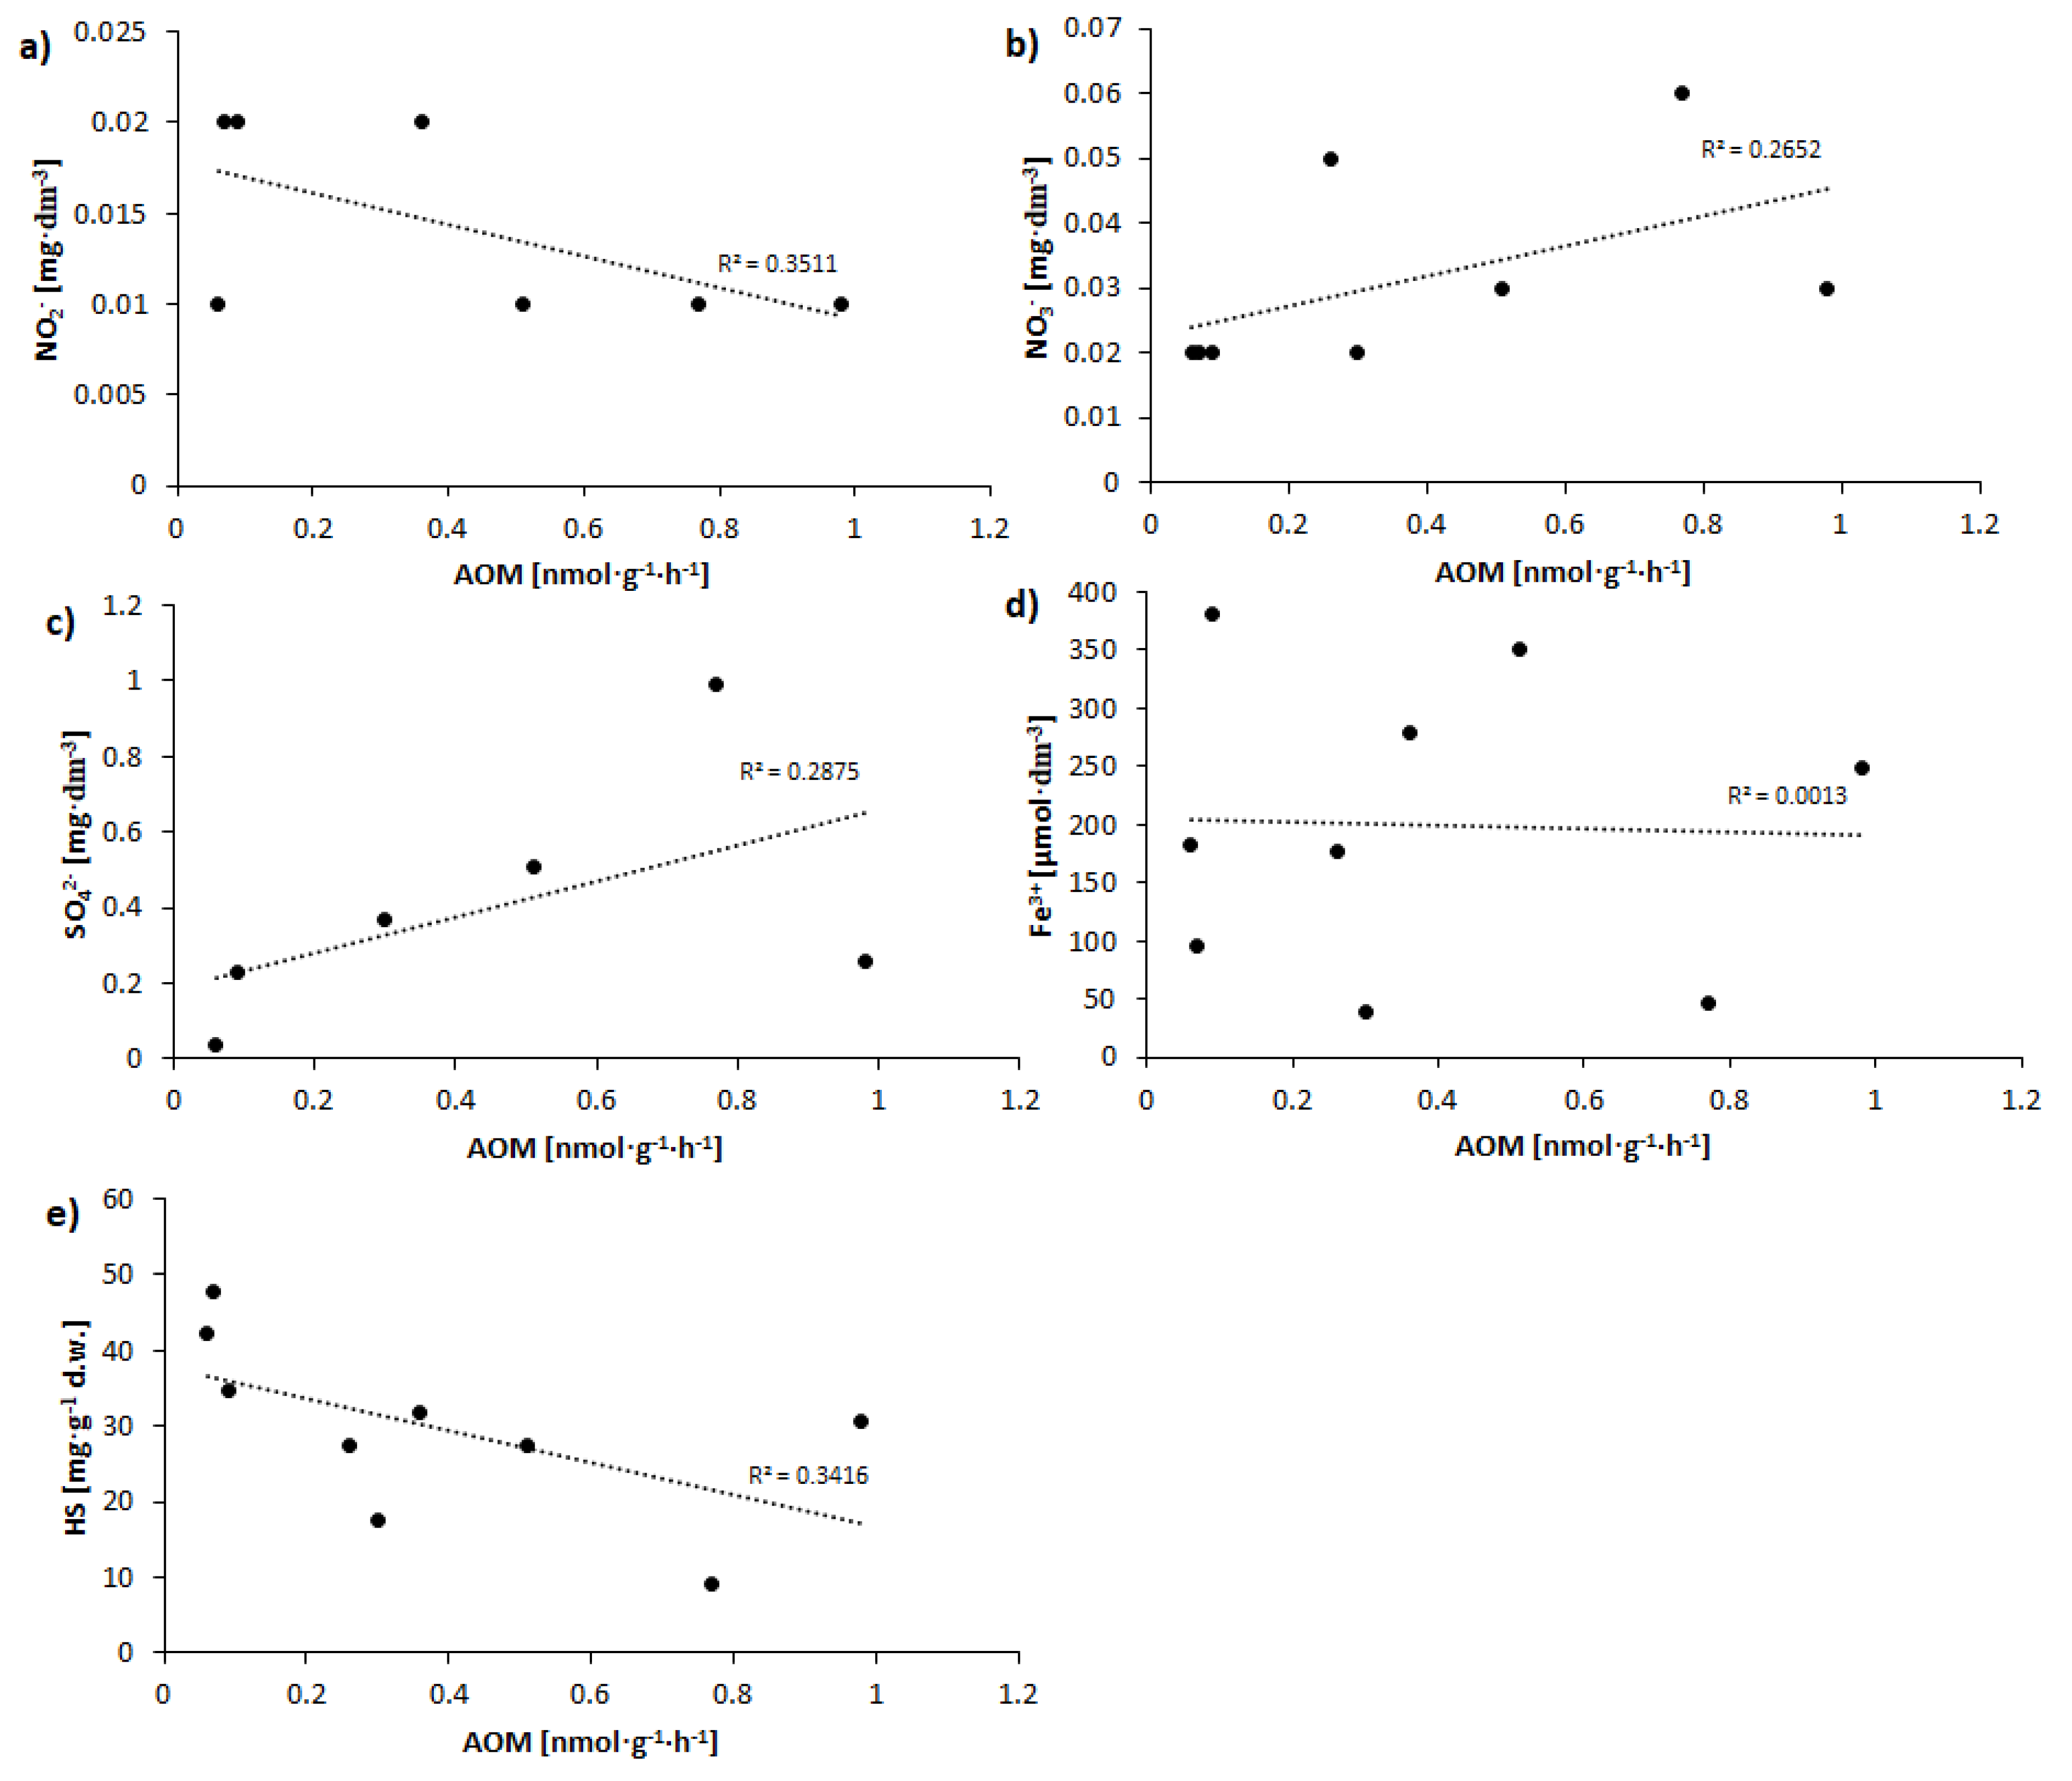
Correlations between AOM rate at day 40 and concentrations of nitrites, nitrates, sulphates, iron, and humic substances are shown graphically in Figure 4.
While no statistically significant correlations were obtained between AOM rate and concentrations of NO3− (R2 = 0.2652) (Figure 4b) or NO2− −(R2 = 0.3511) (Figure 4a), upward and downward trends respectively were observed. In turn, there was also an upward trend noted for the relationship between sulphates in pore-water and the AOM rate (R2 = 0.2875) (Figure 4c). In the case of Fe3+, the R2 value was of just 0.0013 (Figure 4d), hence no relationship or tendency could be observed. On the other hand, a clear downward trend for the relationship between AOM rate and HS concentrations was to be noted (R2 = 0.3416) (Figure 4e).
4. Discussion
The results of the research into the AOM process (He + 13CH4) reported here confirms the presence of this process in the freshwater sediments of small-scale dam reservoirs, as well as its potential importance as a link in the chain of processes involved in CH4 cycle. AOM is mainly evidenced by increased 13CO2 concentrations in the headspace during the incubation process, with the source for this being oxidation of 13CH4. The process involved here is engaged in by microorganisms [44,51,52,53,54], with these producing isotopically heavier CO2 as a result of their anaerobic oxidation of an isotopically-enriched compound such as 13CH4. The amount of 13CO2 in the headspace increased over time, perhaps also indicating curbed activity among endogenous microorganisms responsible for methanogenesis, as well as inhibited production of 12CO2 from the decomposition of organic compounds [55,56]. The highest 13C-enrichment of CO2 was observed in the headspace of samples incubated at 20 °C.
In general, the process was most effective at 20 °C, and data in the literature do point to a temperature-sensitive AOM process, with greatest effectiveness at ~25 °C [57,58]. The fact that our samples were genuinely collected at different times of the year may also affect the AOM rate. Sediments differ in the composition and activity of microorganisms responsible for AOM from one season to another [44].
The AOM rate (He + 13CH4) usually peaked on day 3 of the incubation process, only to decrease again thereafter. A decrease in the AOM rate has been attributed to declines in concentrations of electron acceptors [50]. After 3 days, CH4 concentrations in the headspace also declined, while CO2 concentrations went on increasing until the end of the 40-day. A reduced CO2 concentration at day 50 may indicate gradual depletion of electron acceptors, and hence an increased relative importance of methane production probably occurring simultaneously throughout the experiment [44].
In the case of He+13CH4 treatment, the AOM rate was lowest in the 10–15 cm sediment layer irrespective of incubation conditions. While AOM at 20 °C was most effective in the 5–10 cm layer, at the temperatures of 10 and 15 °C it was the 0–5 cm layer that was associated with peak values. At 10 °C and 15 °C, values for AOM rate were progressively higher in increasingly superficial layers of sediment. This likely increase in CH4 oxidation rates in upper sediment layers may reflect the increased availability of electron acceptors near the sediment-water interface [58]. While AOM may be occurring, CH4 is also being produced, in amounts that become significant in deeper sediment layers in particular. Methanogenesis entails the decomposition of “old” carbon in deeper layers of the sediment, with some of the carbon then available for anaerobic oxidation in the presence of alternative electron acceptors [59,60].
AOM rates obtained for Rzeszów Reservoir differ from those noted in other aquatic ecosystems, though they still fall within the range of values presented (Table 3).
On average, values obtained for AOM rate were 100 times those noted for wetlands and bogs located in the United States, while only being respectively one-thousandth or one-hundredth of those characterising the Eckernforde Bay (Germany) or Gulf of Candiz. Such a large differentiation in the obtained values of AOM rate is still unclear and requires further research. The process is complex and depends on many factors, e.g., availability and concentration of alternative electron acceptors, parameters of sediments or presence and number of microorganisms participating in AOM. Equally significant differences are noted for methane emissions from reservoirs all around the world. CH4 fluxes differ not only between reservoirs located in different climatic zones, but also between reservoirs of the same zone and even within one reservoir between research stations. According to research conducted in Rzeszów Reservoir in 2009–2012 and 2018–2019 [7,61], average fluxes of methane at the water-atmosphere interface are very high and even exceed the values described for large tropical reservoirs.
When analyzing the data presented for various aquatic ecosystems, it should be taken into account that the AOM rates in vitro may differ from the AOM rate in situ (depending on the height of the water column above the sediment). The reason for this may be different hydrostatic pressure under natural and laboratory conditions. Theoretically, elevated hydrostatic pressures favor AOM, causes an increase in methane solubility and, consequently, an increase in its bioavailability [62], but the research results do not give a definite answer in this matter. For example, Cassarini [62] studied the impact of pressure gradients (0.45, 10, 20, 40 MPa) on the efficiency of the AOM. The author obtained the highest rate at 11 °C and at low pressure (0.45 MPa), indicating that active ANME (anaerobic methane-oxidizing archaea) preferred scarce methane availability. Other researchers [30,63] obtained the highest AOM rate at 0.1 MPa and 15 °C. In contrast, the highest specific AOM rate was obtained with sediments incubated at pressure of 6 MPa and at 20 °C [64]. Additionally, Krüger [65], Nauhaus [66] and Zhang [32] showed a strong positive relation of the activity of the AOM microorganisms with pressure even up to 12 MPa.
Different AOM rates in situ and in vitro can also be caused by different oxidation-reduction conditions. It mainly applies to surface sediment layers, for which the AOM rate in the natural environment may be lower due to highly probable presence of oxygen.
Undoubtedly, the AOM process depends on the availability of potential electron acceptors. The impact of these acceptors on AOM rate was determined, with pore-water analysed for this purpose, in relation to its NO2−, NO3−, SO42−, and Fe3+ concentrations in the 0–5, 5–10, and 10–15 cm layers of sediment. Additionally, the humic substances were determined for sediments first dried and then milled.
Concentrations of NO3− in the reservoir sediments varied from 0.017 to 0.973 mg·dm−3, while those of NO2− were in the 0.009–0.017 mg·dm−3 range. These values were either below or in the lower range of concentrations noted in sediments whose AOM process was coupled with denitrification [67,68]. In turn, concentrations of SO42− ranged from 0.036–13.867 mg·dm−3. No statistically significant correlations were obtained between AOM rate and concentrations of SO42−, NO3− or NO2−. However, there was an upward trend noted for the relationship between nitrates and sulphates (except for nitrites) in pore-water and the AOM rate.
The anaerobic oxidation of methane associated with sulphate reduction (AOM-SR) occurs at SO42− concentrations below 10 mg·dm−3 [69], and such concentrations were obtained (except in the 0–5 cm layer at 15 °C). Nevertheless, there is insufficient evidence to confirm AOM-SR activity in Rzeszów Reservoir sediments.
Concentrations of Fe3+ and HS ranged from 39.45 to 380.57 µmol·dm−3 and 11.9 to 34.9 mg·g−1 d.w., respectively. In the case of Fe3+, no relationship or tendency could be observed, but there was a downward trend for the relationship between AOM rate and HS concentrations.
Results presented by Gupta (2011) [44] show that, other than in the case of SO42−, significant dependent relationships between concentrations of ions and AOM rate were lacking. On the other hand, Deutzmann and Schink (2011) [68] observed a negligible impact of SO42− on the dynamics of AOM, while NO3− and Fe3+ were found to intensify the oxidation of methane significantly. This all therefore suggests a need to continue research into the AOM process in freshwater ecosystems, in order for a thorough acquaintanceship with the mechanisms and parameters underpinning AOM to be gained. Previous studies have shown complex relationships with the presence of metals, sulphates or humic substances [25,59,70,71,72,73]. It is possible that the combination of electron acceptors and their pathways for CH4 oxidation may be present in the sediments from Rzeszów Reservoir.
5. Conclusions
As detailed in this paper, analytical work on sediments (He + 13CH4 experiment) from Poland’s Rzeszów Reservoir sustains the following conclusions:
- Anaerobic oxidation of methane (AOM) is a process occurring in freshwater sediments, i.e., at Rzeszów, given that a 13CH4 isotopic marker added in the course of incubation trials underwent systematic oxidation to 13CO2. A capacity to oxidise 13CH4 to 13CO2 in this way is attributed to microorganisms responsible for AOM.
- AOM rates were higher at higher temperatures, such that methane was found to oxidise most intensively at 20 °C, irrespective of the sediment layer under study. Incubation at either 10 or 15 °C sustained rates only one-fifth as high on average.
- AOM proved most effective on day 3 of incubation, with a sharp decline in rate proceeding thereafter. After day 3, CH4 concentrations also decreased, while those of CO2 continued to rise through to day 50 (at 10 °C). On day 50 of the research, a decline in CO2 concentration could finally be observed, perhaps as a sign of the gradual depletion of electron acceptors participating in AOM, with a growth in the relative importance of the methanogenesis ongoing simultaneously then making itself felt.
- AOM rates noted here differ from those reported for other aquatic ecosystems. While average rates were hundred times those seen in certain US wetlands, they were respectively just one-hundredth or one-tenth of those obtained for an oceanic trough (Japan) or a bay (USA).
- While a prominent role in the dynamics of the AOM process may be played by electron acceptors present in pore-water (like the NO3−, SO42− and Fe3+ ions studied) or in sediments as such (humic substances), statistically significant correlations between concentrations and AOM rates were not obtained. Previous research into AOM in other aquatic ecosystems suggests a complex relationship between respective electron acceptors and the pathways to methane oxidation they are involved in, and such dependent relationships are possibly likewise present in Rzeszów Reservoir.
Supplementary Materials
The following are available online at https://www.mdpi.com/2073-4441/12/2/398/s1, Figure S1. Changes in concentration of CH4 (black) and CO2 (grey) over time, in the different sediment layers and at different temperatures (He+13CH4). Figure S2. Changes in concentration of CH4 (black) and CO2 (grey) over time, in the different sediment layers and at different temperatures (He). Figure S3. Change of 13C AP over time for incubations conducted at different temperatures in the 0-5, 5-10 and 10-15 cm sediment layers (He+13CH4).
Author Contributions
Conceptualization, D.S.; methodology, D.S. and R.G.-R.; Formal analysis, D.S.; investigation, D.S.; resources, D.S.; data curation, D.S.; writing—original draft preparation, D.S.; writing—review and editing, R.G.-R.; visualization, D.S.; supervision, R.G.-R.; funding acquisition, R.G.-R. All authors have read and agreed to the published version of the manuscript.
Funding
This research was funded by the National Science Centre Poland, via Grant No. 2017/25/B/ST10/00981.
Conflicts of Interest
The authors declare no conflict of interest.
References
- Rhee, T.S.; Kettle, A.J.; Andreae, M.O. Methane and nitrous oxide emissions from the ocean: A reassessment using basin- observations in the Atlantic. J. Geophys. Res. Atmos. 2009, 114, 1–20. [Google Scholar] [CrossRef] [Green Version]
- Verpoorter, C.; Kutser, T.; Seekell, D.A.; Tranvik, L.J. A global inventory of lakes based on high-resolution satellite imagery. Geophys. Res. Lett. 2014, 41, 6396–6402. [Google Scholar] [CrossRef]
- Downing, J.A.; Prairie, Y.T.; Cole, J.J.; Duarte, C.M.; Tranvik, L.J.; Striegl, R.G.; McDowell, W.H.; Kortelainen, P.; Caraco, N.F.; Melack, J.M.; et al. The global abundance and size distribution of lakes, ponds, and impoundments. Limnol. Oceanogr. 2006, 51, 2388–2397. [Google Scholar] [CrossRef] [Green Version]
- Bastviken, D.; Tranvik, L.; Downing, J.A.; Crill, P.M.; Enrich-Prast, A. Freshwater methane emissions offset the continental carbon sink. Science 2011, 331, 50. [Google Scholar] [CrossRef] [Green Version]
- Holgerson, M.A.; Raymond, P.A. Large contribution to inland water CO2 and CH4 emissions from very small ponds. Nat. Geosci. 2016, 9, 222–226. [Google Scholar] [CrossRef]
- Saunois, M.; Jackson, R.B.; Bousquet, P.; Boulter, B.; Canadell, J.G. The growing role of methane in anthropogenic climate change. Environ. Res. Lett. 2016, 11, 120207. [Google Scholar] [CrossRef] [Green Version]
- Gruca-Rokosz, R. Dynamics of carbon greenhouse gases in reservoirs: Production pathways, emissions to atmosphere (in Polish). Oficyna Wydawnicza Politechniki Rzeszowskiej 2015, 1–132. [Google Scholar]
- Zehnder, A.J.B.; Stumm, W. Geochemistry and biogeochemistry of anaerobic habitats. In Biology of Anaerobic Microorganisms; Zehnder, A.J.B., Ed.; John Wiley & Sons: New York, NY, USA, 1988; pp. 1–38. [Google Scholar]
- Den Heyer, C.; Kalff, J. Organic Matter Mineralization Rates in Sediments: A Within- and Among- Lake Study. Limnol. Oceanogr. 1998, 43, 695–705. [Google Scholar] [CrossRef]
- Bastviken, D. Anoxic Degradation of Organic Matter in Lakes—Implications for Carbon Cycling and Aquatic Food Webs. Ph.D. Thesis, Department of Water and Environmental Studies, Linköping University, Linköping, Sweden, 2002; pp. 3–55. [Google Scholar]
- Wetzel, R.G. Limnology—Lake and River Ecosystems, 3rd ed.; Academic Press: San Diego, CA, USA, 2001; pp. 631–664. [Google Scholar]
- Thauer, R.K.; Shima, S. Methane as fuel for anaerobic microorganisms. Ann. N. Y. Acad. Sci. 2008, 1125, 158–170. [Google Scholar] [CrossRef]
- Strous, M.; Jetten, M.S.M. Anaerobic oxidation of methane and ammonium. Annu. Rev. Microbiol. 2004, 58, 99–117. [Google Scholar] [CrossRef]
- Shima, S.; Thauer, R.K. Methyl-coenzyme M reductase and the anaerobic oxidation of methane in methanotrophic. Archaea. Curr. Opin. Microbiol. 2005, 8, 643–648. [Google Scholar] [CrossRef] [PubMed]
- Valentine, D.L.; Reeburgh, W.S. New perspectives on anaerobic methane oxidation. Environ. Microbiol. 2000, 2, 477–484. [Google Scholar] [CrossRef] [PubMed]
- Smemo, K.A.; Yavitt, J.B. Anaerobic oxidation of methane: An underappreciated aspect of methane cycling in peatland ecosystems? Biogeosciences 2011, 8, 779–793. [Google Scholar] [CrossRef] [Green Version]
- Blazewicz, S.J.; Petersen, D.G.; Waldrop, M.P.; Firestone, M.K. Anaerobic oxidation of methane in tropical and boreal soils: Ecological significance in terrestrial methane cycling. J. Geophys. Res. Biogeosci. 2012, 117, G02033. [Google Scholar] [CrossRef]
- Boetius, A.; Ravenschlag, K.; Schubert, C.J.; Rickert, D.; Widdel, F.; Gieseke, A.; Amann, R.; Jørgensen, B.B.; Witte, U.; Pfannkuche, O. A marine microbial consortium apparently mediating anaerobic oxidation of methane. Nature 2000, 407, 623–626. [Google Scholar] [CrossRef] [PubMed]
- Deutzmann, J.S.; Stief, P.; Brandes, J.; Schink, B. Anaerobic methane oxidation coupled to denitrification is the dominant methane sink in a deep lake. PNAS 2014, 111, 18273–18278. [Google Scholar] [CrossRef] [PubMed] [Green Version]
- Reeburgh, W.S. Methane consumption in Cariaco Trenchwaters and sediment. Earth Planet. Sci. Lett. 1976, 28, 337–344. [Google Scholar] [CrossRef] [Green Version]
- Schubert, C.J.; Lucas, F.S.; Durisch-Kaiser, E.; Stierli, R.; Diem, T.; Scheidegger, O.; Vazquez, F.; Müller, B. Oxidation and emission of methane in a monomictic lake (Rotsee, Switzerland). Aquat. Sci. 2010, 72, 455–466. [Google Scholar] [CrossRef] [Green Version]
- Zehnder, A.J.; Brock, T.D. Methane formation and methane oxidation by methanogenic bacteria. J. Bacteriol. 1979, 137, 420–432. [Google Scholar] [CrossRef] [Green Version]
- Reeburgh, W. Oceanic methane biogeochemistry. Chem. Rev. 2007, 107, 486–513. [Google Scholar] [CrossRef] [Green Version]
- Segarra, K.E.A.; Schubotz, F.; Samarkin, V.; Yoshinaga, M.Y.; Hinrichs, K.U.; Joye, S.B. High rates of anaerobic methane oxidation in freshwater wetlands reduce potential atmospheric methane emissions. Nat. Commun. 2015, 6, 7477. [Google Scholar] [CrossRef] [PubMed]
- Sivan, O.; Adler, M.; Pearson, A.; Gelman, F.; Bar-Or, I.; John, S.C.; Eckert, W. Geochemical evidence for iron-mediated anaerobic oxidation of methane. Limnol. Oceanogr. 2011, 56, 1536–1544. [Google Scholar] [CrossRef] [Green Version]
- Gruca-Rokosz, R.; Tomaszek, J.A.; Koszelnik, P.; Czerwieniec, E. Methane and carbon dioxide fluxes at the sediment–water interface in reservoir. Pol. J. Environ. Study 2011, 20, 81–86. [Google Scholar]
- Aoki, M.; Ehara, M.; Saito, Y.; Yoshioka, H.; Miyazaki, M.; Saito, Y.; Miyashita, A.; Kawakami, S.; Yamaguchi, T.; Ohashi, A.; et al. A Long-Term Cultivation of an Anaerobic Methane-Oxidizing Microbial Community from Deep-Sea Methane-Seep Sediment Using a Continuous-Flow Bioreactor. PLoS ONE 2014, 9, e105356. [Google Scholar] [CrossRef] [Green Version]
- Girguis, P.R.; Orphan, V.J.; Hallam, S.J.; DeLong, E.F. Growth and methane oxidation rates of anaerobic methanotrophic archaea in a continuous-flow bioreactor. Appl. Environ. Microbiol. 2003, 69, 5472–5482. [Google Scholar] [CrossRef] [Green Version]
- Girguis, P.R.; Cozen, A.E.; DeLong, E.F. Growth and population dynamics of anaerobic methane-oxidizing archaea and sulfate-reducing bacteria in a continuous-flow bioreactor. Appl. Environ. Microbiol. 2005, 71, 3725–3733. [Google Scholar] [CrossRef] [Green Version]
- Meulepas, R.J.W.; Jagersma, C.G.; Gieteling, J.; Buisman, C.J.N.; Stams, A.J.M.; Lens, P.N.L. Enrichment of anaerobic methanotrophs in a sulfate-reducing membrane bioreactors. Biotechnol. Bioeng. 2009, 104, 458–470. [Google Scholar] [CrossRef]
- Jagersma, G.C.; Meulepas, R.J.W.; Jong, I.H.; Gieteling, J.; Klimiuk, A.; Schouten, S.; Damsté, J.S.S.; Lens, P.N.L.; Stams, A.J.M. Microbial diversity and community structure of a highly active anaerobic methane-oxidizing sulfate-reducing enrichment. Environ. Microbiol. 2009, 12, 3223–3232. [Google Scholar] [CrossRef]
- Zhang, Y.; Henriet, J.P.; Bursens, J.; Boon, N. Stimulation of in vitro anaerobic oxidation of methane rate in a continuous high-pressure bioreactor. Bioresour. Technol. 2010, 101, 3132–3138. [Google Scholar] [CrossRef]
- Zhang, Y.; Maignien, L.; Zhao, X.; Wang, F.; Boon, N. Enrichment of a microbial community performing anaerobic oxidation of methane in a continuous high-pressure bioreactor. BMC Microbiol. 2011, 11, 137. [Google Scholar] [CrossRef] [Green Version]
- Wegener, G.; Boetius, A. An experimental study on short-term changes in the anaerobic oxidation of methane in response to varying methane and sulfate fluxes. Biogeosciences 2009, 6, 867–876. [Google Scholar] [CrossRef] [Green Version]
- Koszelnik, P.; Tomaszek, J.A. Loading of the Rzeszów reservoir with biogenic elements—Mass balance. Environ. Prot. Eng. 2002, 28, 99–106. [Google Scholar]
- Gruca-Rokosz, R.; Tomaszek, J. Methane and Carbon Dioxide in the Sediment of a Eutrophic Reservoir: Production Pathways and Diffusion Fluxes at the Sediment–Water Interface. Water Air Soil Pollut. 2015, 226, 16. [Google Scholar] [CrossRef] [PubMed] [Green Version]
- Gruca-Rokosz, R.; Koszelnik, P. Production pathways for CH4 and CO2 in sediments of two freshwater ecosystems in south-eastern Poland. PLoS ONE 2018, 13, e0199755. [Google Scholar] [CrossRef] [PubMed] [Green Version]
- Reeburgh, W.S. An improved interstitial water sampler. Limnol. Oceanogr. 1967, 12, 163–165. [Google Scholar] [CrossRef] [Green Version]
- Ostrowska, A.; Gawliński, S.; Szczubiałka, Z. Methods of Analysis and Assessment of Soil and Plant Properties (in Polish); Instytut Ochrony Środowiska: Warszawa, Poland, 1991. [Google Scholar]
- Holmer, M.; Wildish, D.; Hargrave, B. Organic Enrichment from Marine Finfish Aquaculture and Effects on Sediment Biogeochemical Processes. In Environmental Effects of Marine Finfish Aquaculture; Springer: Berlin/Heidelberg, Germany, 2005; Volume 5, pp. 181–206. [Google Scholar] [CrossRef]
- Zimmermann, C.F.; Keefe, C.W.; Bashe, J. Method 440.0 Determination of Carbon and Nitrogen in Sediments and Particulates/Coastal Waters Using Elemental Analysis; NER Laboratory, USEPA: Cincinnati, OH, USA, 1997. Available online: http://www.epa.gov/nerlcwww/m440_0.pdf (accessed on 19 August 2019).
- Griffith, S.M.; Schnitzer, M. Analytical characteristics of humic and fiilvic acids extracted from tropical volcanic soils. Soil Sci. Soc. Am. J. 1975, 39, 861–867. [Google Scholar] [CrossRef]
- Viollier, E.; Inglett, P.W.; Hunter, K.; Roychoudhury, A.N.; Van Cappellen, P. The ferrozine method revisited: Fe(II)/Fe(III) determination in natural waters. Appl. Geochem. 2000, 15, 785–790. [Google Scholar] [CrossRef]
- Gupta, V. Anaerobic Oxidation of Methane in Northern Peatland. Ph.D. Thesis, Department of Geography, University of Toronto, Toronto, ON, Canada, December 2011. [Google Scholar]
- Shi, Y.; Wang, Z.; He, C.; Zhang, X.; Sheng, L.; Ren, X. Using 13 C isotopes to explore denitrification-dependent anaerobic methane oxidation in a paddy-peatland. Sci. Rep. 2017, 7, 40848. [Google Scholar] [CrossRef]
- Bednarek, A.; Zalewski, M. Potential effects of enhancing denitrification rates in sediments of the Sulejow reservoir. Environ. Prot. Eng. 2007, 33, 35–43. [Google Scholar]
- Haziak, T.; Czaplicka-Kotas, A.; Ślusarczyk, Z.; Szalińska, E. Spatial changes of zinc concentrations in the Czorsztyn Reservoir sediments (in Polish). Inżynieria i Ochrona Środowiska 2013, 16, 57–68. [Google Scholar]
- Koszelnik, P. Sources and Distribution of Biogenic Elements on the Example of the Solina-Myczkowce Dam Reservoir (in Polish); Oficyna Wydawnicza Politechniki Rzeszowskiej: Rzeszów, Poland, 2009; pp. 1–147. [Google Scholar]
- Piwińska, D.; Gruca-Rokosz, R.; Bartoszek, L.; Czarnota, J. Spatial Diversity Characterising Certain Chemical Substances in Sediments of Besko Reservoir. J. Ecol. Eng. 2018, 19, 104–112. [Google Scholar] [CrossRef]
- Fan, L.; Shahbaz, M.; Ge, T.; Wu, J.; Dippold, M.; Thiel, V.; Kuzyakov, Y.; Dorodnikov, M. To shake or not to shake: 13C-based evidence on anaerobic methane oxidation in paddy soil. Soil Biol. Biochem. 2019, 133, 146–154. [Google Scholar] [CrossRef]
- Basiliko, N.; Yavitt, J.B.; Dees, P.M.; Merkel, S.M. Methane Biogeochemistry and Methanogen Communities in Two Northern Peatland Ecosystems, New York State. Geomicrobiol. J. 2003, 20, 563–577. [Google Scholar] [CrossRef]
- Dettling, M.D.; Yavitt, J.B.; Zinder, S.H. Control of organic carbon mineralization by alternative electron acceptors in four peatlands, Central New York State, USA. Wetlands 2006, 26, 917. [Google Scholar] [CrossRef]
- Godin, A.; McLaughlin, J.W.; Webster, K.; Packalen, M.; Basiliko, N. Methane and methanogen community dynamics across a boreal peatland nutrient gradient. Soil Biol. Biochem. 2012, 48, 96–105. [Google Scholar] [CrossRef]
- Martinez-Cruz, K.; Sepulveda-Jauregui, A.; Casper, P.; Anthony, K.W.; Smemo, K.A.; Thalasso, F. Ubiquitous and significant anaerobic oxidation of methane in freshwater lake sediments. Water Res. 2018, 144, 332–340. [Google Scholar] [CrossRef]
- Szal, D.; Gruca-Rokosz, R. Denitrification-Dependent Anaerobic Oxidation of Methane in Freshwater Sediments of Reservoirs in SE Poland. J. Ecol. Eng. 2019, 20, 218–227. [Google Scholar] [CrossRef] [Green Version]
- Li, L.; Xue, S.; Xi, J. Anaerobic oxidation of methane coupled to sulfate reduction: Consortium characteristics and application in co-removal of H2S and methane. J. Environ. Sci. 2019, 76, 238–248. [Google Scholar] [CrossRef]
- Hoehler, T.M.; Alperin, M.J.; Albert, D.B.; Martens, C.S. Field and laboratory studies of methane oxidation in an anoxic marine sediment: Evidence for a methanogen-sulfate reducer consortium. Glob. Biogeochem. Cycles 1994, 8, 451–463. [Google Scholar] [CrossRef]
- Smemo, K.A. Methane Cycling in Northern Peatland Ecosystems. A Potential Role for Anaerobic Methane Oxidation. Ph.D. Thesis, Cornell University, Ithaca, NY, USA, 2003; p. 138. [Google Scholar]
- Smemo, K.; Yavitt, J.B. Evidence for Anaerobic CH4 Oxidation in Freshwater Peatlands. Geomicrobiol. J. 2007, 24, 583–597. [Google Scholar] [CrossRef]
- Broman, E. Observation of Methanogenesis and Potential Iron-Dependent Anaerobic Oxidation of Methane in Old Lake Sediments, A Study of Two Boreal Forest Lakes. Master’s Thesis, Uppsala University, Uppsala, Sweden, 2013. [Google Scholar]
- Gruca-Rokosz, R. Quantitative fluxes of the greenhouse gases CH4, CO2 from the surfaces of selected Polish reservoirs. Atmosphere 2019. submitted. [Google Scholar]
- Cassarini, C. Anaerobic Oxidation of Methane Coupled to Reduction of Different Sulfur Compounds as Electron Acceptors in Bioreactors; CRC Press: Boca Raton, FL, USA, 2017. [Google Scholar]
- Meulepas, R.J.W.; Jagersma, C.G.; Khadem, A.F.; Buisman, C.J.N.; Stams, A.J.M.; Lens, P.N.L. Effect of environmental conditions on sulfate reduction with methane as electron donor by an Eckernförde Bay enrichment. Environ. Sci. Technol. 2009, 43, 6553–6559. [Google Scholar] [CrossRef] [PubMed]
- Deusner, C.; Meyer, V.; Ferdelman, T. High-pressure systems for gas-phase free continuous incubation of enriched marine microbial communities performing anaerobic oxidation of methane. Biotechnol. Bioeng. 2009, 105, 524–533. [Google Scholar] [CrossRef] [PubMed]
- Krüger, M.; Treude, T.; Wolters, H.; Nauhaus, K.; Boetius, A. Microbial methane turnover in different marine habitats. Palaeogeogr. Palaeoclimatol. Palaeoecol. 2005, 227, 6–17. [Google Scholar] [CrossRef]
- Nauhaus, K.; Boetius, A.; Kruger, M.; Widdel, F. In vitro demonstration of anaerobic oxidation of methane coupled to sulphate reduction in sediment from a marine gas hydrate area. Environ. Microbiol. 2002, 4, 296–305. [Google Scholar] [CrossRef]
- Ettwig, K.F.; van Alen, T.; van de Pas-Schoonen, K.T.; Jetten, M.S.M.; Strous, M. Enrichment and molecular detection of denitrifying methanotrophic bacteria of the NC10 phylum. Appl. Environ. Microbiol. 2009, 75, 3656–3662. [Google Scholar] [CrossRef] [Green Version]
- Deutzmann, J.; Schink, B. Anaerobic Oxidation of Methane in Sediments of Lake Constance, an Oligotrophic Freshwater Lake. Appl. Environ. Microbiol. 2011, 77, 4429–4436. [Google Scholar] [CrossRef] [Green Version]
- Weber, H.S.; Habicht, K.S.; Thamdrup, B. Anaerobic Methanotrophic Archaea of the ANME-2d Cluster Are Active in a Low-sulfate, Iron-rich Freshwater Sediment. Front Microbiol. 2017, 12, 619. [Google Scholar] [CrossRef] [Green Version]
- Egger, M.; Rasigraf, O.; Sapart, C.J.; Jilbert, T.; Jetten, M.S.M.; Röckmann, T.; Van Der Veen, C.; Bânda, N.; Kartal, B.; Ettwig, K.F.; et al. Iron-mediated anaerobic oxidation of methane in brackish coastal sediments. Environ. Sci.Technol. 2015, 49, 277–283. [Google Scholar] [CrossRef] [Green Version]
- He, Z.; Zhang, Q.; Feng, Y.; Luo, H.; Pan, X.; Michael, G. Microbiological and environmental significance of metal-dependent anaerobic oxidation of methane. Sci. Total Environ. 2018, 610, 759–768. [Google Scholar] [CrossRef]
- Nordi, K.; Thamdrup, B.; Schubert, C. Anaerobic oxidation of methane in an iron-rich Danish freshwater lake sediment. Limnol. Oceanogr. 2013, 58, 546–554. [Google Scholar] [CrossRef]
- Valenzuela, E.I.; Prieto-Davó, A.; López-Lozano, N.E.; Hernández-Eligio, A.; Vega-Alvarado, L.; Juárez, K.; García-González, A.S.; López, M.G.; Cervantes, F.J. Anaerobic methane oxidation driven by microbial reduction of natural organic matter in a tropical wetland. Appl. Environ. Microbiol. 2017, 83. [Google Scholar] [CrossRef] [Green Version]
Figure 1.
Location of Rzeszów Reservoir and the sampling station

Figure 2.
Changes through time in the AOM rate and amount of CH4 oxidised, for the sediment layers collected from 0–5 cm (panel a), 5–10 cm (panel b) and 10–15 cm (panel c) (He + 13CH4).
Figure 2.
Changes through time in the AOM rate and amount of CH4 oxidised, for the sediment layers collected from 0–5 cm (panel a), 5–10 cm (panel b) and 10–15 cm (panel c) (He + 13CH4).

Figure 3.
Changes through time in the AOM rate and amount of CH4 oxidised, for the sediment layers collected from 0–5 cm (panel a), 5–10 cm (panel b) and 10–15 cm (panel c) (He).
Figure 3.
Changes through time in the AOM rate and amount of CH4 oxidised, for the sediment layers collected from 0–5 cm (panel a), 5–10 cm (panel b) and 10–15 cm (panel c) (He).

Figure 4.
Correlations between AOM rate (nmol‧g−1‧h−1) at day 40 and concentrations of (a) nitrites, (b) nitrates, (c) sulphates, (d) iron, and (e) humic substances.
Figure 4.
Correlations between AOM rate (nmol‧g−1‧h−1) at day 40 and concentrations of (a) nitrites, (b) nitrates, (c) sulphates, (d) iron, and (e) humic substances.


Table 1.
Selected physical and chemical parameters characterising sediments of Rzeszów Reservoir.
| Temperature | Depth [cm] | pH [-] | OM [%] | TOC [%] | TN [%] | TOC:TN [-] | HS [mg·g−1 d.w.] |
|---|---|---|---|---|---|---|---|
| 10 °C | 0–5 | 7.20 | 10.84 | 3.62 | 0.37 | 9.86 | 31.7 |
| 5–10 | 7.20 | 9.09 | 2.89 | 0.27 | 10.69 | 27.5 | |
| 10–15 | 7.39 | 6.46 | 1.82 | 0.17 | 10.81 | 17.6 | |
| 15 °C | 0–5 | 7.51 | 9.65 | 3.79 | 0.34 | 11.16 | 34.9 |
| 5–10 | 7.58 | 8.18 | 3.84 | 0.29 | 13.36 | 34.7 | |
| 10–15 | 7.71 | 5.99 | 2.66 | 0.17 | 15.26 | 22.9 | |
| 20 °C | 0–5 | 7.15 | 9.30 | 2.90 | 0.28 | 10.33 | 27.7 |
| 5–10 | 7.27 | 7.95 | 2.31 | 0.23 | 10.28 | 22.1 | |
| 10–15 | 7.54 | 4.62 | 1.27 | 0.10 | 12.21 | 11.9 | |
| Granulometric composition | Fraction [%] | Type | |||||
| Fsa 2-0.063 | Fsi 0.063-0.002 | Fcl < 0.002 | PN-EN ISO 14688-1:2018-05 | ||||
| 0–5 | 3.5 | 77.35 | 19.15 | silty loam (clSi) | |||
| 5–10 | 5.23 | 73.15 | 21.61 | silty clay(siCl) | |||
| 10–15 | 4.01 | 73.76 | 22.22 | silty clay (siCl) | |||
Fsa—sandy fraction, Fsi—silty fraction, Fcl—clay fraction.
Table 2.
Results for chemical parameters of pore-water in Rzeszów Reservoir sediments.
| Temperature | Depth [cm] | NO2− [mg·dm−3] | NO3− [mg·dm−3] | SO42− [mg·dm−3] | TOC [mg·dm−3] | Fe3+ [µmol·dm−3] |
|---|---|---|---|---|---|---|
| 10 °C | 0–5 | 0.017 | 0.017 | 0.230 | 20.39 | 380.57 |
| 5–10 | 0.014 | 0.019 | 0.036 | 13.18 | 182.80 | |
| 10–15 | 0.021 | 0.017 | n.d. | 16.47 | 95.40 | |
| 15 °C | 0–5 | 0.015 | 0.973 | 13.867 | 79.88 | 279.75 |
| 5–10 | n.d. | 0.052 | 2.556 | 31.44 | 177.15 | |
| 10–15 | n.d. | 0.020 | 0.373 | 36.56 | 39.45 | |
| 20 °C | 0–5 | 0.014 | 0.034 | 0.508 | 6.32 | 351.11 |
| 5–10 | 0.009 | 0.025 | 0.256 | 5.62 | 248.32 | |
| 10–15 | 0.013 | 0.055 | 0.986 | 26.18 | 46.85 |
n.d.—not detected.
Table 3.
Rates of the anaerobic oxidation of methane reported for various aquatic ecosystems.
| Name | AOM | Unit | Method | Reference |
|---|---|---|---|---|
| Michigan Hollow (USA) | 0.00156 | nmol·g−1·h−1 | incubation experiment with 13CH4 isotope | [44] |
| Channel Fen (USA) | 0.00253 | [44] | ||
| Big Run Bog (USA) | 0.00142 | [44] | ||
| Bog Lake Fen (USA) | 0.00254 | [44] | ||
| Buckles Bog (USA) | 0.00047 | [44] | ||
| Mclean Bog (USA) | 0.00088 | [44] | ||
| Dryden Bog (USA) | 0.00105 | [44] | ||
| Nankai Trough (Japan) | 15.63 | [27] | ||
| Eckernforde Bay (Germany) | 11920 | [30,31] | ||
| Monterey Bay (USA) | 5.75 | incubation experiment without 13CH4 isotope | [28,29] | |
| Gulf of Cadiz (Portugal/Spain) | 384 | [32,33] | ||
| Black Sea (Bulgaria/Georgia/Russia/Romania/Turkey/Ukraine) | 27 | [34] |
© 2020 by the authors. Licensee MDPI, Basel, Switzerland. This article is an open access article distributed under the terms and conditions of the Creative Commons Attribution (CC BY) license (http://creativecommons.org/licenses/by/4.0/).
Share and Cite
MDPI and ACS Style
Szal, D.; Gruca-Rokosz, R. Anaerobic Oxidation of Methane in Freshwater Sediments of Rzeszów Reservoir. Water 2020, 12, 398. https://doi.org/10.3390/w12020398
AMA Style
Szal D, Gruca-Rokosz R. Anaerobic Oxidation of Methane in Freshwater Sediments of Rzeszów Reservoir. Water. 2020; 12(2):398. https://doi.org/10.3390/w12020398
Chicago/Turabian StyleSzal, Dorota, and Renata Gruca-Rokosz. 2020. "Anaerobic Oxidation of Methane in Freshwater Sediments of Rzeszów Reservoir" Water 12, no. 2: 398. https://doi.org/10.3390/w12020398
Note that from the first issue of 2016, this journal uses article numbers instead of page numbers. See further details here.