Performance of Soil Moisture Sensors in Florida Sandy Soils
by
 , and
, and
Rhuanito Soranz Ferrarezi
1,* ,
,
Thiago Assis Rodrigues Nogueira
1,2 and
and
Sara Gabriela Cornejo Zepeda
3 1
University of Florida, Institute of Food and Agricultural Sciences, Indian River Research and Education Center, 2199 South Rock Road, Fort Pierce, FL 34945, USA
2
São Paulo State University, School of Engineering, Department of Plant Protection, Rural Engineering and Soils, Av. Brasil Sul no 56, Ilha Solteira, SP 15.385-000, Brazil
3
Zamorano Pan-American Agricultural School, PO Box 93, km 30 road from Tegucigalpa to Danli, San Antonio de Oriente, Francisco Morazán 11101, Honduras
*
Author to whom correspondence should be addressed.
Water 2020, 12(2), 358; https://doi.org/10.3390/w12020358
Submission received: 24 December 2019
/
Revised: 21 January 2020
/
Accepted: 24 January 2020
/
Published: 28 January 2020
(This article belongs to the Special Issue Crop Monitoring Strategies for Precise Irrigation Management)
Abstract
:Soil moisture sensors can improve water management efficiency by measuring soil volumetric water content (θv) in real time. Soil-specific calibration equations used to calculate θv can increase sensor accuracy. A laboratory study was conducted to evaluate the performance of several commercial sensors and to establish soil-specific calibration equations for different soil types. We tested five Florida sandy soils used for citrus production (Pineda, Riviera, Astatula, Candler, and Immokalee) divided into two depths (0.0–0.3 and 0.3–0.6 m). Readings were taken using twelve commercial sensors (CS650, CS616, CS655 (Campbell Scientific), GS3, 10HS, 5TE, GS1 (Meter), TDT-ACC-SEN-SDI, TDR315, TDR315S, TDR135L (Acclima), and Hydra Probe (Stevens)) connected to a datalogger (CR1000X; Campbell Scientific). Known amounts of water were added incrementally to obtain a broad range of θv. Small 450 cm3 samples were taken to determine the gravimetric water content and calculate the θv used to obtain the soil-specific calibration equations. Results indicated that factory-supplied calibration equations performed well for some sensors in sandy soils, especially 5TE, TDR315L, and GS1 (R2 = 0.92) but not for others (10HS, GS3, and Hydra Probe). Soil-specific calibrations from this study resulted in accuracy expressed as root mean square error (RMSE) ranging from 0.018 to 0.030 m3 m−3 for 5TE, CS616, CS650, CS655, GS1, Hydra Probe, TDR310S, TDR315, TDR315L, and TDT-ACC-SEN-SDI, while lower accuracies were found for 10HS (0.129 m3 m−3) and GS3 (0.054 m3 m−3). This study provided soil-specific calibration equations to increase the accuracy of commercial soil moisture sensors to facilitate irrigation scheduling and water management in Florida sandy soils used for citrus production.
1. Introduction
Irrigated agriculture is becoming increasingly important due to the rise in human population and food demand [1]. Different irrigation technologies can be deployed to improve the planning and management of water resources for agricultural production. The most used irrigation methods are surface, subsurface, sprinkler, and microirrigation. The use of each method depends on the crop, environmental conditions, and installation and maintenance costs. Surface irrigation entails water flowing by gravity over soil and includes furrow, basin, and border irrigation methods. Subsurface irrigation applies water below the soil surface to raise the water table into or near the plant root zone. Sprinkler irrigation applies water to the soil by spraying water through the air on to the soil surface. Finally, microirrigation applies water at low rates and pressures to small areas targeting the root zone through to use of drip emitters, bubblers, or microsprays [2]. Regardless of the irrigation system, the amount of water applied should always be precisely determined to reduce the potential of water losses through runoff and percolation and maximize crop yield. Despite the use of weather-based watering methods, most of the current irrigation scheduling follows rigid calendars using irrigation timers instead of accounting for the actual crop water requirements. Real-time, less expensive technologies are needed to increase the large-scale use of water scheduling tools. Recently, the use of soil-sensing methods has been increasing due to the profusion of sensors available in the market [3].
Soil moisture sensors (SMS) are a recent innovation with potential to estimate soil volumetric water content (θv) and electrical conductivity in real time [4,5,6]. Those sensors provide an accurate estimate of moisture content by measuring the dielectric constant of the soil or relative permittivity (ε) in response to water content, determined by the time in which an electromagnetic pulse travels in the soil [7,8]. The propagation of a wave through the soil varies according to its water content [9], which allows correlating the dielectric constant to the soil water content. The dielectric constant ranges from ∼1 in the air to 80 in the water [10,11]. Conversion or calibration equations provided by the manufacturers transform raw sensor measurements into the θv [12].
SMS allow real-time and continuous determination of soil moisture at different depths with minimum alteration of the natural soil conditions [13]. However, the results of these methods are affected by site characteristics such as soil type and moisture, soil homogeneity, and the presence of stones and roots [14,15]. All sensor manufacturers have generic equations for mineral and organic soils. However, the performance of a given sensor can be increased by 2–3% when a soil-specific calibration is performed [4]. Therefore, it is essential to evaluate the performance of SMS in determining soil moisture based on site-specific calibration equations for agricultural fields with large spatial variability [16].
The use of SMS for irrigation scheduling is recent in citrus production in spite of the crop’s relevance to the country’s economy. The United States’ citrus production in the 2017–2018 season totaled 6.13 million tons. Florida is the second largest citrus producer in the country, accounting for 36% of the production area [17]. Water is a limiting factor for Florida citrus growers due to the low water-holding capacity of sandy soils and the uneven distribution of rainfall during the year [18].
Even though generic equations are provided, manufacturers indicate that sensors are more accurate when soil-specific calibration equations are used [19]. The information of θv for different Florida sandy soils used in citrus production is still scarce. Maximizing crop productivity in these areas requires irrigation systems to be designed to ensure uniform water application. Soil water content affects the amount of water and nutrients available to plants and soil aeration status [20]. Furthermore, determining how much and when to irrigate is a key element for irrigation management.
This study aims to evaluate the accuracy of data collected from commercial capacitance sensors and to establish calibration equations for different sandy soils used for citrus production in Florida.
2. Materials and Methods
2.1. Sensor Description
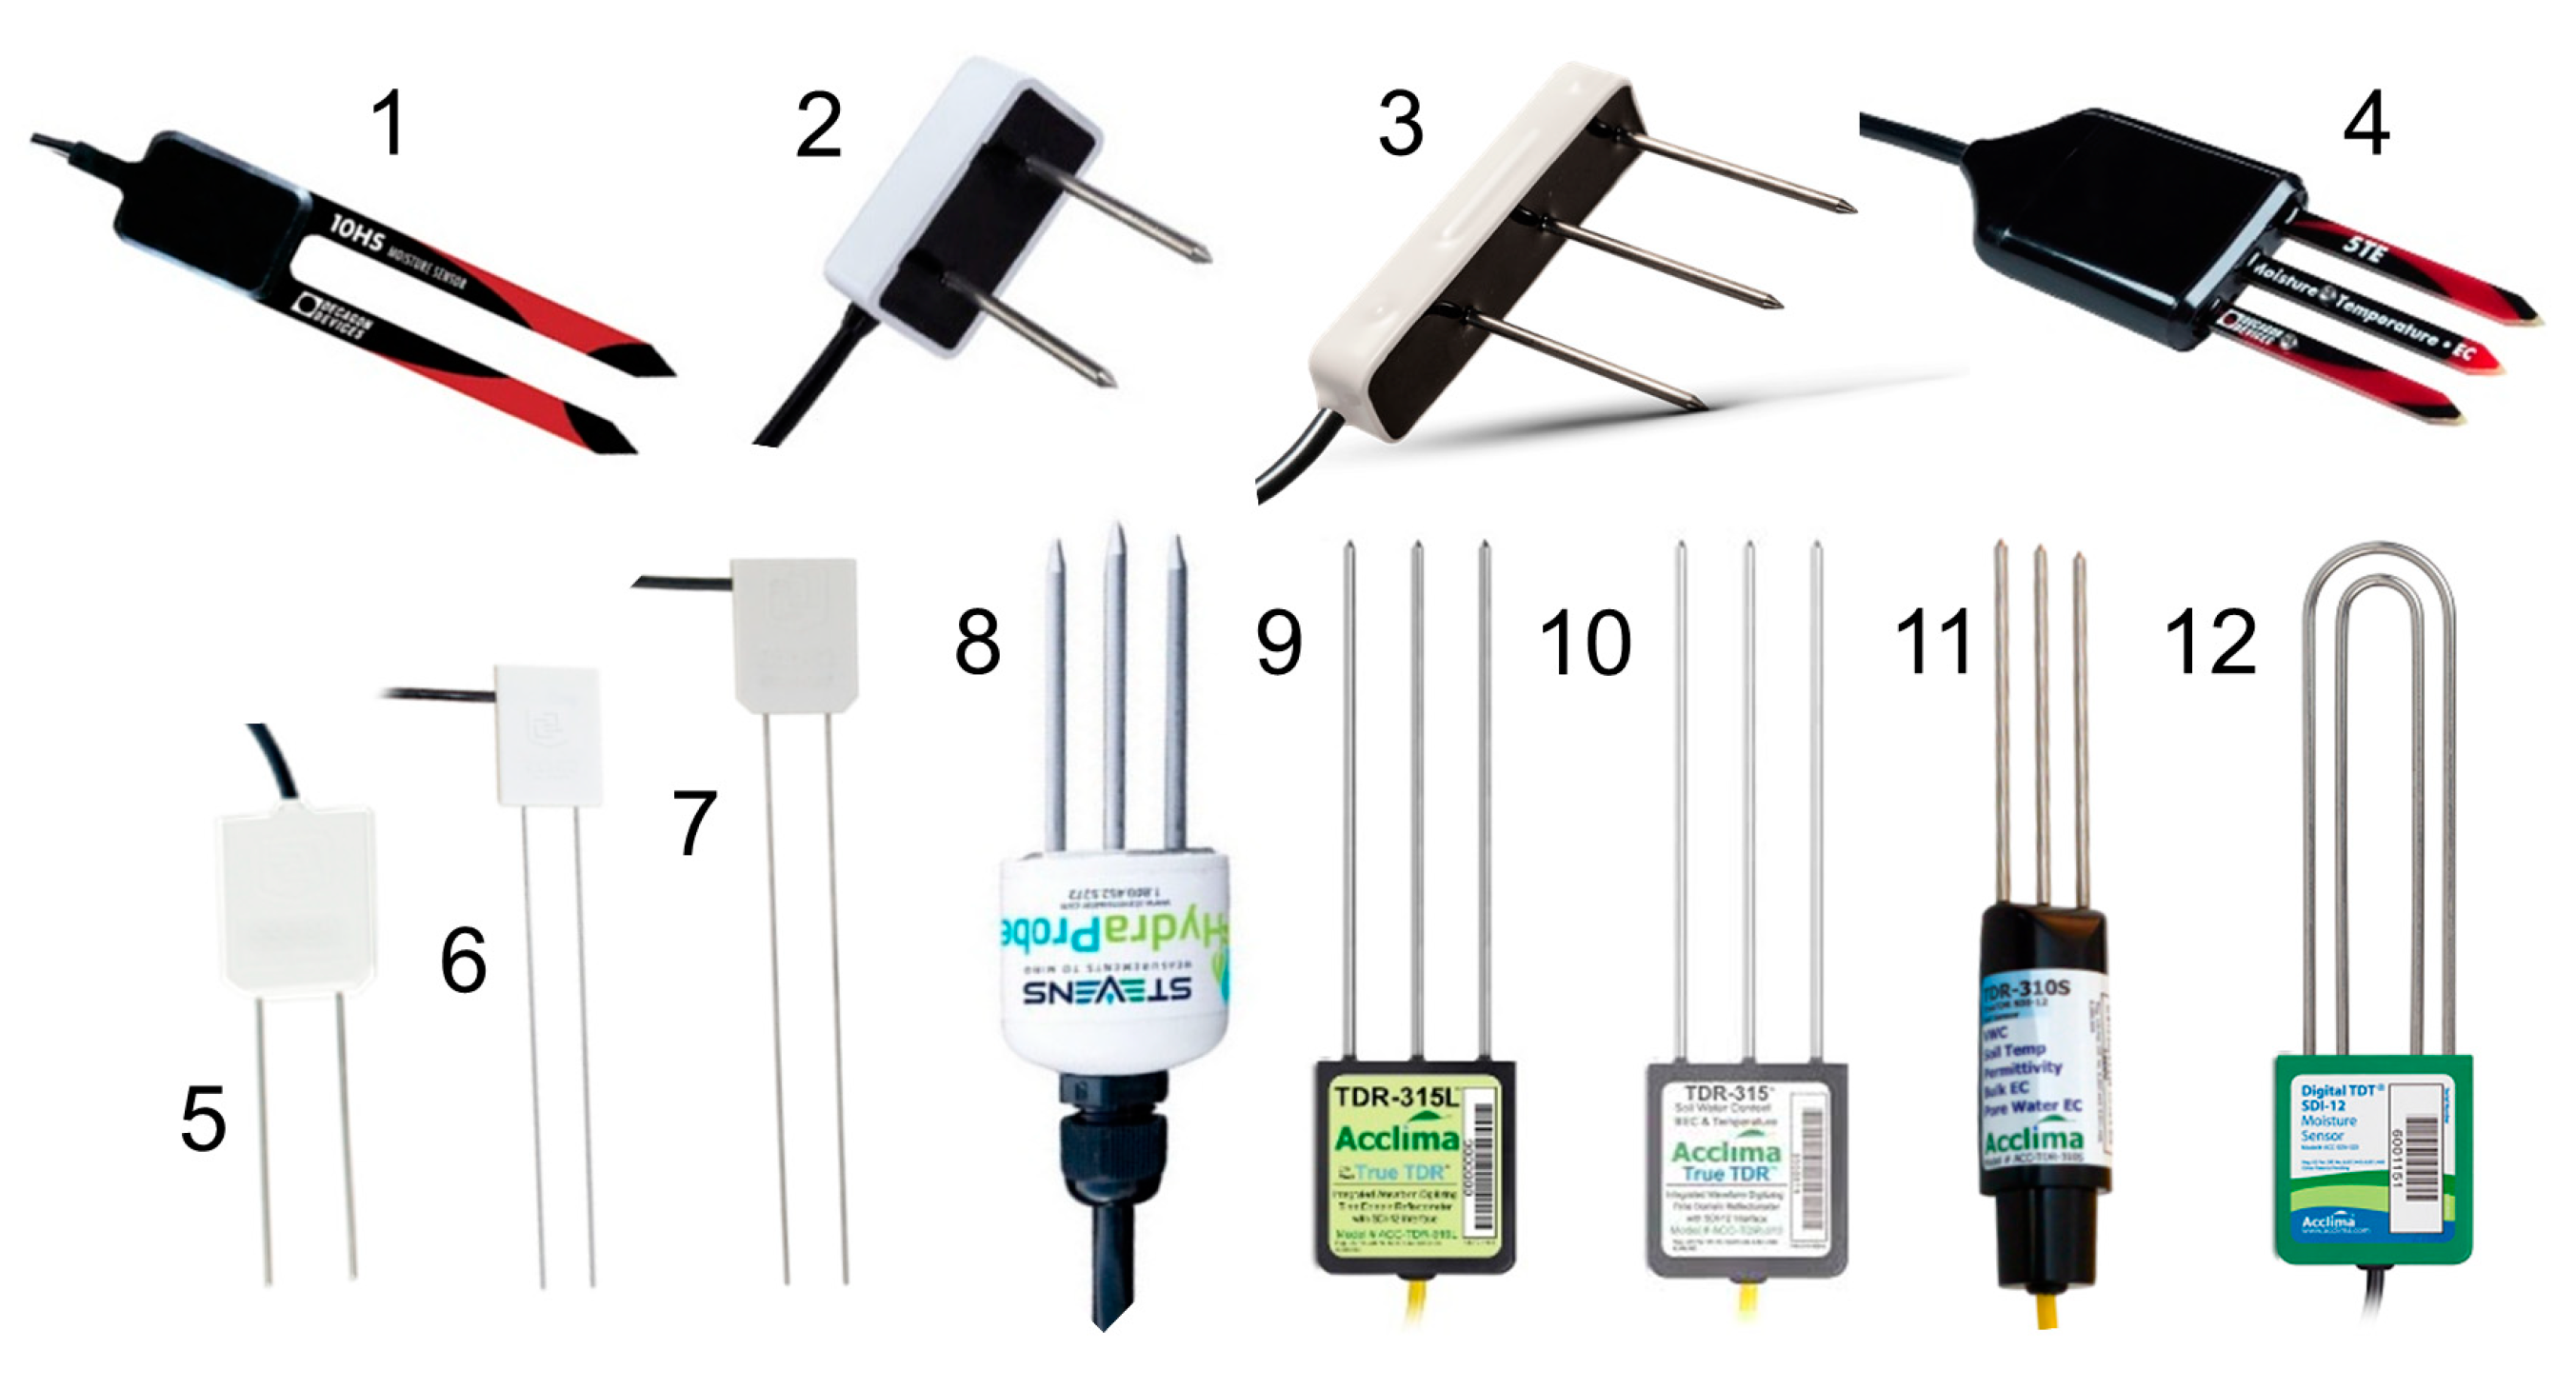
Twelve commercial capacitance sensors from different manufacturers were evaluated under laboratory conditions (Figure 1 and Table 1). The sensors were connected to a datalogger (CR1000X; Campbell Scientific, Logan, UT) to provide power and collect data. The communication between the datalogger and the computer was obtained through a proprietary software (LoggerNet 4.5; Campbell Scientific, Logan, UT).
Sensors use the physical, chemical and mechanical properties of the soil to take electrical, electromagnetic, optical, radiometric, mechanical, acoustic, pneumatic, or electrochemical measurements [21]. In the present study, electrical and electromagnetic measurements were assessed based on Time Domain Reflectometry (TDR), Frequency Domain Reflectometry (FDR), Transmission Line Oscillation (TLO), and Time Domain Transmissometry (TDT).
TDR is an accurate and widely used method to estimate soil θv based on soil dielectric properties. According to Topp et al. [22], there is a close relationship between soil θv and the dielectric constant. The principle behind the TDR method is the determination of the velocity of propagation and return (or reflection) of an electromagnetic wave in a medium [13]. The presence of water in the soil decreases the speed at which the electromagnetic wave travels [23], which allows the measurement of soil water content.
FDR is based on the resonance features of RLC (resistor, inductor, and capacitor) circuits in which a capacitor is formed by two electrodes and the in-between and surrounding soil [24]. The principle is based on the electrical capacitance of a capacitor that uses the soil as a dielectric pole that depends on the soil water content. When connecting the capacitor together with an oscillator to form an electrical circuit, changes in soil moisture can be detected by changes in the circuit operating frequency. In FDR the oscillator frequency is swept under control within a certain frequency range to find the resonant frequency (at which the amplitude is greatest), which is a measure of water content in the soil [25].
TLO is used by some moisture sensors, which have two parallel rods that conform to an open transmission line. The two-way travel time of the electromagnetic waves induced by the oscillator in the rods varies according to the moisture content in the soil and translates into a change in the dielectric constant [26].
TDT is a technique analogous to TDR that measures the transmission of an electrical pulse along a closed circuit. The principle of this technique is based on the measurement of the time it takes from the application of the pulse at one end of the probe to the other end of another probe [27]. The main difference between TDR and TDT is that the latter measures the time of transmission and not reflection, as TDR does.
2.2. Study Sites
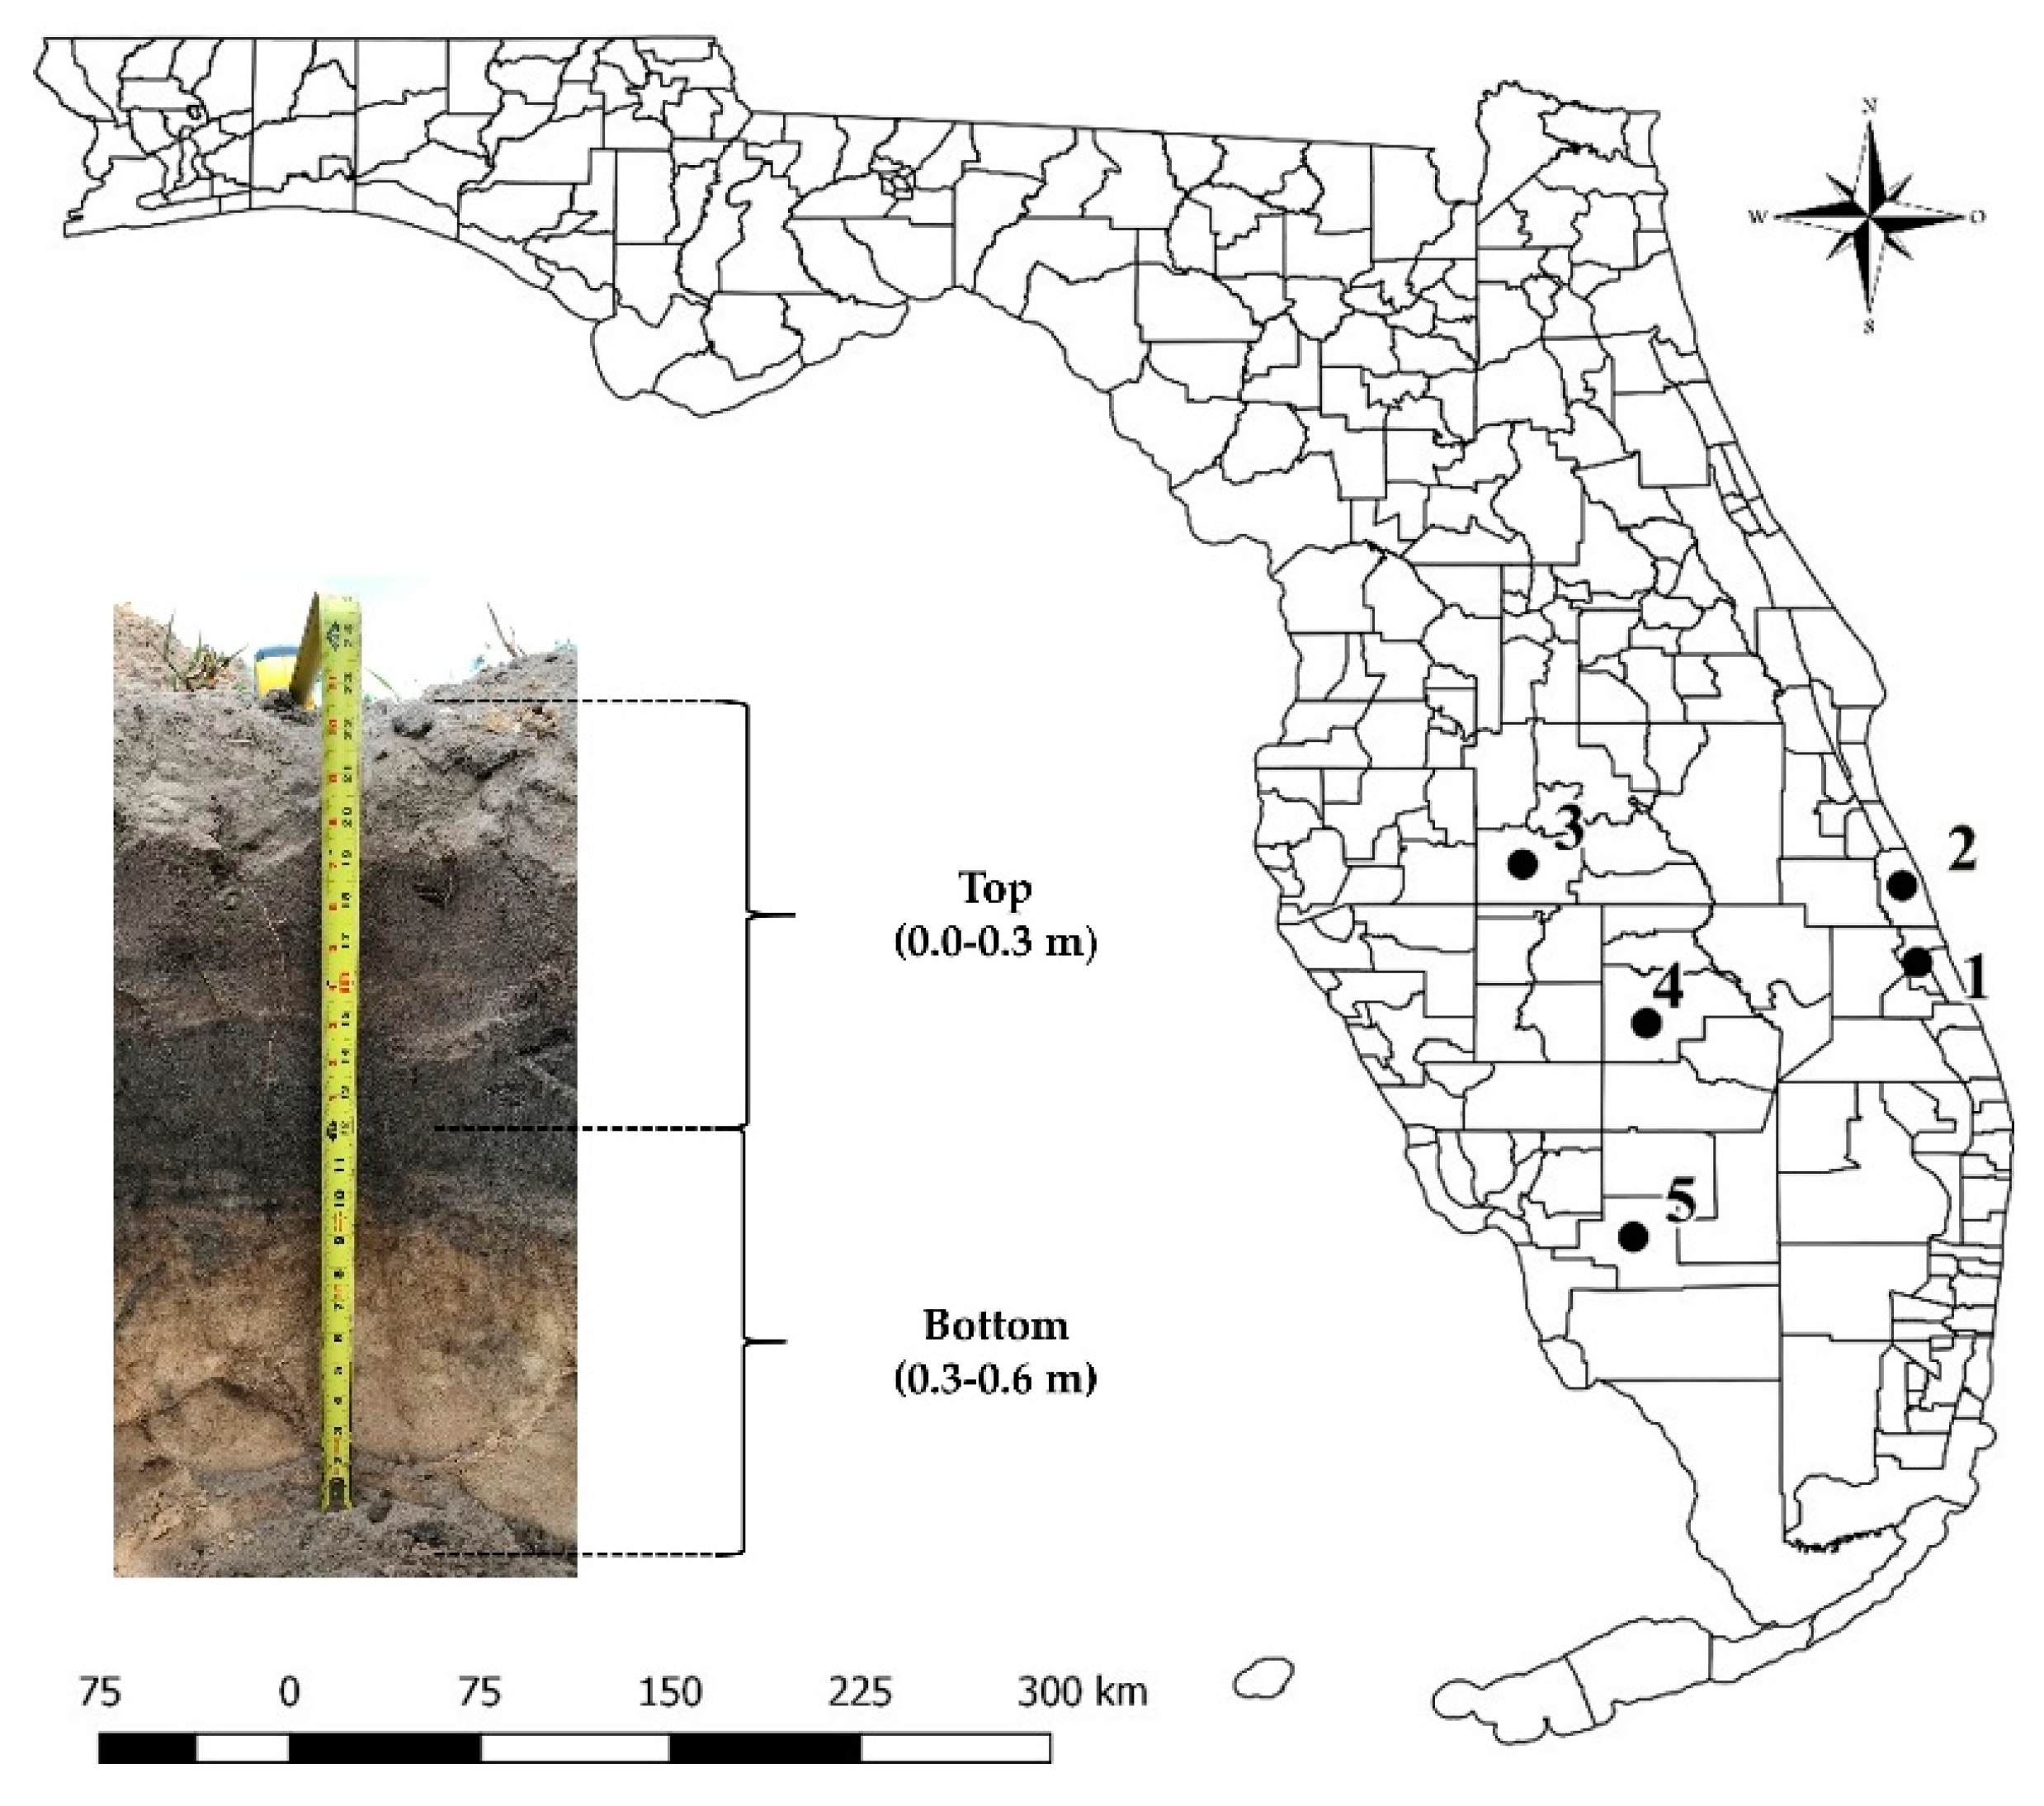
The study was conducted from February to June 2018 at the UF/IFAS IRREC in Fort Pierce, FL, using soils collected from multiple sites across the State of Florida (Figure 2). We tested five sandy soils [28] representing the most common soils for citrus production in Florida: (1) Pineda: Loamy, siliceous, active, hyperthermic Arenic Glossaqualfs (96.0% sand, 2.5% clay, and 1.5% silt); (2) Riviera: Loamy, siliceous, active, hyperthermic Arenic Glossaqualfs (96.5% sand, 2.0% clay, and 1.5% silt); (3) Candler: Hyperthermic, uncoated Lamellic Quartzipsamments (97.5% sand, 1.25% clay, and 1.25% silt); (4) Astatula: Hyperthermic, uncoated Typic Quartzipsamments (98.5% sand, 0.75% clay, and 0.75% silt); and (5) Immokalee: Sandy, siliceous, hyperthermic Arenic Alaquods (98.5% sand, 1.0% clay, and 0.5% silt). The particle size distribution reported was obtained from trials using the same soil type [29].
The content of organic matter and the water-holding capacity in these soils generally ranges from 0.5% to 2% and 25 to 83 mm m−1, respectively [28]. Pineda and Riviera soils are similar and characterized by poor drainage as they formed on unconsolidated marine sandy and loamy materials influenced by underlying alkaline material [28,29]. These nearly leveled soils are on low hammocks; in poorly defined drainage ways; and in broad, low, flat, and depressional areas. The water table is within a depth of 0.254 m of the surface for 1 to 6 months and at a depth of 0.254 to 1.016 m for more than 6 months in most years. The slope ranges from 0% to 2% [38,39]. Many areas that correspond to Pineda and Riviera soils have been drained and are currently used for citrus production. In their original state, these soils are used for pasture, and natural vegetation consists of species of pine (Pinus sp.), cypress (Cupressus sempervirens), myrtle (Myrtus communis) and palm (Areca sp.).
Candler and Astatula soils share certain similarities since both are excessively drained soils formed in sandy marine or eolian deposits. These soils are on broad undulating upland ridges and knolls on flatwoods. Slopes range from 0% to 8%. These soils are hyperthermic, uncoated Typic Quartzipsamments. Typical pedon of Candler sand has 0–5% slopes, whereas the typical pedon of Astatula sand is 0–8% [40,41]. These soils are used mainly for citrus and pastures.
Immokalee soils are characterized by nearly level, poorly drained soils on the flatwoods. These soils formed in sandy marine sediments. The slopes of these soils are less than 2%. These soils are sandy, siliceous, hyperthermic Arenic Haplaquods [42]. In natural conditions, these soils are used for wildlife conservation and forestry but with appropriate management, can be used for citrus, vegetables and grasses production.
2.3. Soil Sampling and Physical Characterization
Samples were collected from each soil type in two depths: top (0.0–0.3 m) and bottom layer (0.3–0.6 m). These depths were selected based on the fact that irrigation systems have a capacity to reach a moisture dispersion of 60% of the total citrus rooting area (approximately 0.9 m) [18]. Furthermore, the highest concentration of roots is located within this depth and there is a greater dynamic of water absorption.
Sampling began by removing debris from the surface with a hoe to eliminate all nondecomposed organic material. Subsequently, the soil was manually collected and deposited in 378 L plastic barrels. The soil samples were completely dried in a forced circulation oven at 75 °C for 10 days. Samples were divided to obtain three replicates. Each replication was placed into 19 L polyethylene buckets for data collection.
Analysis of the soil physical properties was performed at the beginning of the study. The specific gravity of solid particles and the bulk density were determined according to the procedure described by the American Society for Testing and Materials [43] (Table 2). The determination of bulk density was done in order to further transform the data obtained from the gravimetric method into θv.
2.4. Experimental Setup
Before starting to take sensor measurements, we calculated the amount of water to be added incrementally to obtain a broad range of θv values (0%, 5%, 10%, 15%, 20%, and 25%) until reaching the saturation point at the buckets using volumetric (θv) and gravimetric water content (θg), according to the Equations (1) and (2) proposed by Schmugge et al. [44]. Thus, a gradual increase of 5% moisture in the soil to amounts of 0.16 m3 m−3 was established.
The mixing of the given water volume was achieved by pouring the three replicates of each soil sample into a larger container, thoroughly mixing them, and then depositing them back into the 19-L polyethylene buckets. This was repeated five times for each soil sample, taking a reading with each sensor. The moisture percentages were used to obtain the relationship between soil moisture and sensor measurements. Each sensor was inserted vertically (i.e., the sensor head in air and rods fully submersed) into the soils in the center of all buckets with minimal disturbance to the surrounding soil while inserting the rods.
where is the volumetric water content, is the gravimetric water content, m is the mass, and is the density.
Substituting Equation (2) into Equation (1), we calculated the water volume (Wv) as:
The θg was obtained from each soil using the method described by Topp and Ferre [45]. Briefly, soil samples were collected, weighed, dried in a forced circulation oven, and weighed again, which enabled expressing water content on a mass basis. Additionally, 450 cm3 aluminum cylinders were weighed with soil samples. Subsequently, cylinders were oven-dried at 75 °C for 48 h, and final weight was recorded. Equations (5) and (6) established by Schmugge et al. [44] were used for θg and θv, respectively. Reference θv (θref, m3 m−3) was calculated by multiplying θg by soil bulk density [46].
2.5. Data Analysis
Accuracy and precision were used as proxies to assess sensor performance. Accuracy is the ability of a sensor to estimate the actual water content, while precision is an indication of the uniformity or repeatability of obtaining the same result [16]. A good sensor should have high accuracy and high precision. For sensor accuracy, we used the root mean square error (RMSE) and the coefficient of determination (R2) to verify the quality of fit. Briefly, RMSE is the standard deviation of the residuals (prediction errors), and the R2 is the proportion of the variance in the dependent variable that is predictable from the independent variables. For sensor precision, we used the coefficient of variation (CV) to evaluate the repeatability to obtain the same results from the sensor in comparison to the gravimetric method. The CV is expressed as the standard deviation by the mean value. The RMSE, R2, and CV for each sensor were computed across the three replications by soil series, soil depths, and amount of water added per sample.
To evaluate the performance of the selected sensors, θv readings were compared to θref values. The Pearson’s correlation coefficient (r) was calculated between the θv obtained by the sensors with the standard equations (Table 1) and that observed by gravimetry (θref). Finally, a regression analysis was performed to obtain the calibration for the 12 capacitance sensors using the data collected for each soil type and soil depth. The equations were estimated using the curve-fitting tool [47]. The statistical analyses were performed using SAS v. 9.4 [48].
3. Results and Discussion
3.1. Sensor Accuracy
The θv values measured by the sensors were compared to the results obtained from gravimetric determination in the laboratory. The comparison among different sensors is presented in Table 3. In general, sensors measured θv accurately, and several sensors presented an R2 > 0.90 (TDR315S, TDR315L, GS1, 5-ET, TDR315, TDT-ACC-SEN-SDI, and CS655). However, some sensors (10HS, GS3, and Hydra Probe) were not effective in determining θv, resulting in low R2 and high CV (Table 3).
In our study, the sensors that presented the lowest RMSE are based on the TDR measurement method (Table 3). In addition, all sensors from Acclima had an R2 ≥ 0.90. Out of these, only the TDT-ACC-SEN-SDI sensor uses a different measurement method, which is TDT. Varble and Chávez [49] indicate the performance of TDT and TDR sensors is similar in soils with different textures since these methods operate on similar electromagnetic frequencies.
The RMSE is a sensible indicator of sensor accuracy [50]. A small RMSE value indicates higher accuracy. Categories for interpreting RMSE values are described by Fares et al. [16]. These categories include good (RMSE ≤ 0.01 m3 m−3), fair (0.01 ≤ RMSE ≤ 0.05 m3 m−3), poor (0.05 ≤ RMSE ≤ 0.10 m3 m−3), and very poor (RMSE ≥ 0.10 m3 m−3). The sensors evaluated in this study had RMSE values ranging from 0.023 to 0.049 m3 m−3 (Table 3). The data obtained are similar to those of Singh et al. [51], where the sensors resulted in RMSE values between 0.02 m3 m−3 and 0.04 m3 m−3. The authors observed that sensors CS655 and TDR315 were the most accurate, with RMSE < 0.02 m3 m−3 in a low clay content soil. This value is lower than what we found for these sensors (CS650 = 0.035 m3 m−3 and TDR315 = 0.028 m3 m−3) in sandy Florida soils.
Since TDR310S, TDR315L, and TDR315 are recently released models, limited research is available to evaluate sensor performance. However, the accuracy established by the manufacturer is ± 0.02 m3 m−3 for the θv determination [36], which approximates the data obtained in the present study that indicate an RMSE of 0.023 m3 m−3 for TDR310S, 0.026 m3 m−3 for the TDR315L, and 0.028 m3 m−3 for the TDR315L sensor (Table 3).
The GS1 sensor also had low RMSE (0.026 m3 m−3) (Table 3). This value was smaller than the RMSE value of 0.048 reported by Datta et al. [6] for the GS1 in a fine sandy loam soil. These authors reported that TDR315, CS655, and GS1 sensors performed better in a soil with lower salinity and lower clay content. Adeyemi et al. [52] reported an RMSE of 0.03 m3 m−3 for both GS1 and TDR315 sensors. Those results were obtained by evaluating sensor performance in a sandy soil with similar characteristics to the ones evaluated in the present study.
Our results indicated that the TDR315, CS655, and 5TE sensors performed well in sandy soils with the generic equation presenting a lower mean square error (Table 3). Varble and Chávez [49] tested the 5TE sensor and concluded that the sensor’s generic equation is not accurate in sandy loam soils. More recently, a study regarding the 5TE, TDR315, and CS655 sensors showed RMSEs of 0.039, 0.050, and 0.078 m3 m−3, respectively in loam soils, overestimating the θv present in the samples [53].
Sensors CS650, CS616, Hydra Probe, 10HS, and GS3 had higher CVs, with R2 values ranging from 0.72 to 0.86 (Table 3). Vaz et al. [4] evaluated the Hydra Probe, 10HS, and CS616 sensors in a soil composed of 92.7% sand, which is similar to the soils evaluated in the present study. The RMSE obtained by these authors was 0.058 m3 m−3 for CS616, 0.018 m3 m−3 for Hydra Probe, and 0.077 m3 m−3 for 10HS. In the present study, we obtained a higher RMSE (0.037 m3 m−3) for Hydra Probe. Nevertheless, the CS616 and 10HS sensors presented lower values than those presented by Vaz et al. [4], which indicates that the generic equation is better for the soils evaluated in this study due to the soil texture. Similarly, in research conducted by Singh et al. [53], the CS616 and Hydra Probe sensors provided higher results with respect to RMSE determined. The CS616 sensor was also evaluated by Varble and Chávez [49], resulting in an overestimation of the volumetric water content in 0.03 m3 m−3 for a sandy loam soil. Furthermore, the results indicated that greater accuracy was obtained for sensor CS616 in sandy clay loam soils at lower θv and not at high θv.
The GS3 sensor presented an RMSE of 0.049 m3 m−3, which differs from the manufacturer’s accuracy of ± 0.03 m3 m−3 in mineral soils [32]. This value falls into the fair accuracy category as defined by Fares et al. [16]. These results suggest that GS3 sensor is highly sensitive to soil property variability (e.g., soil bulk density, total porosity, particle size distribution, pore size, electrical conductivity, etc.) with a significant impact on sensor performance. Similar results with a high RMSE (0.038 m3 m−3) were determined by Straten et al. [54] in sandy soils with an organic fraction of 2%. Son et al. [55] tested the GS3 sensor and found an overestimation of θv with an RMSE of 0.028 m3 m−3, indicating that the manufacturer’s generic equation is more appropriate for silt loam soils than sandy soils.
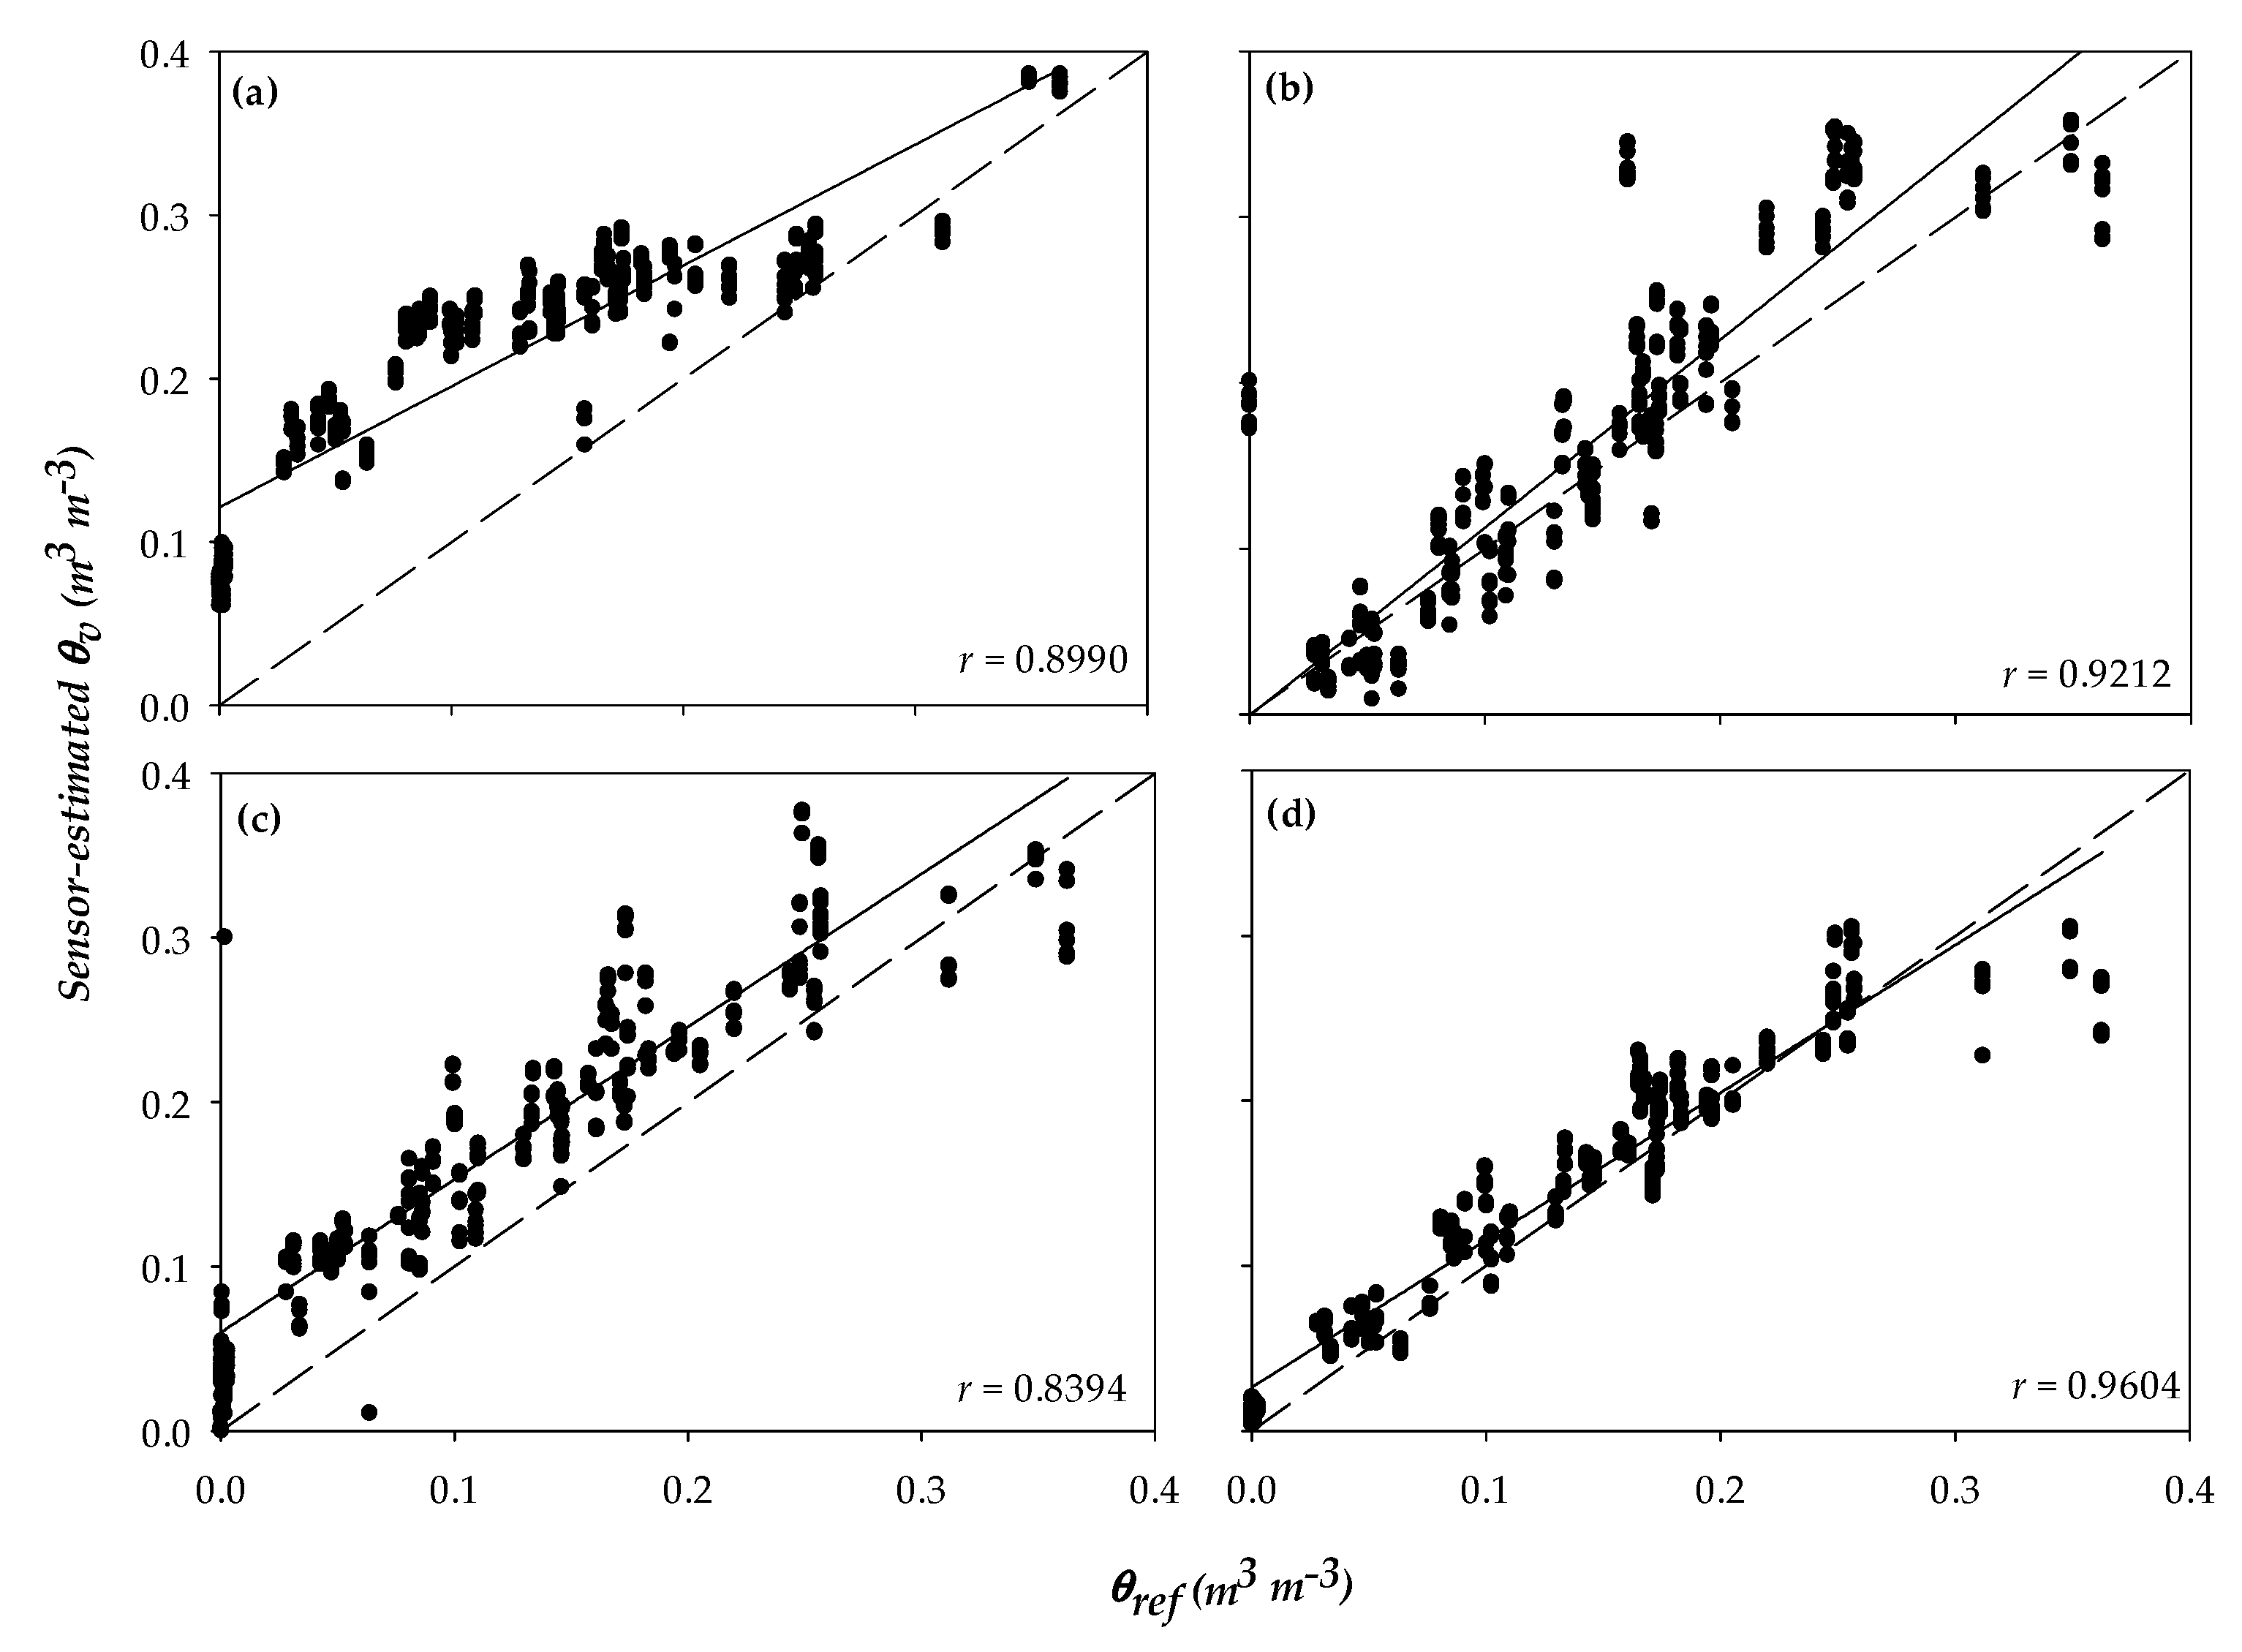
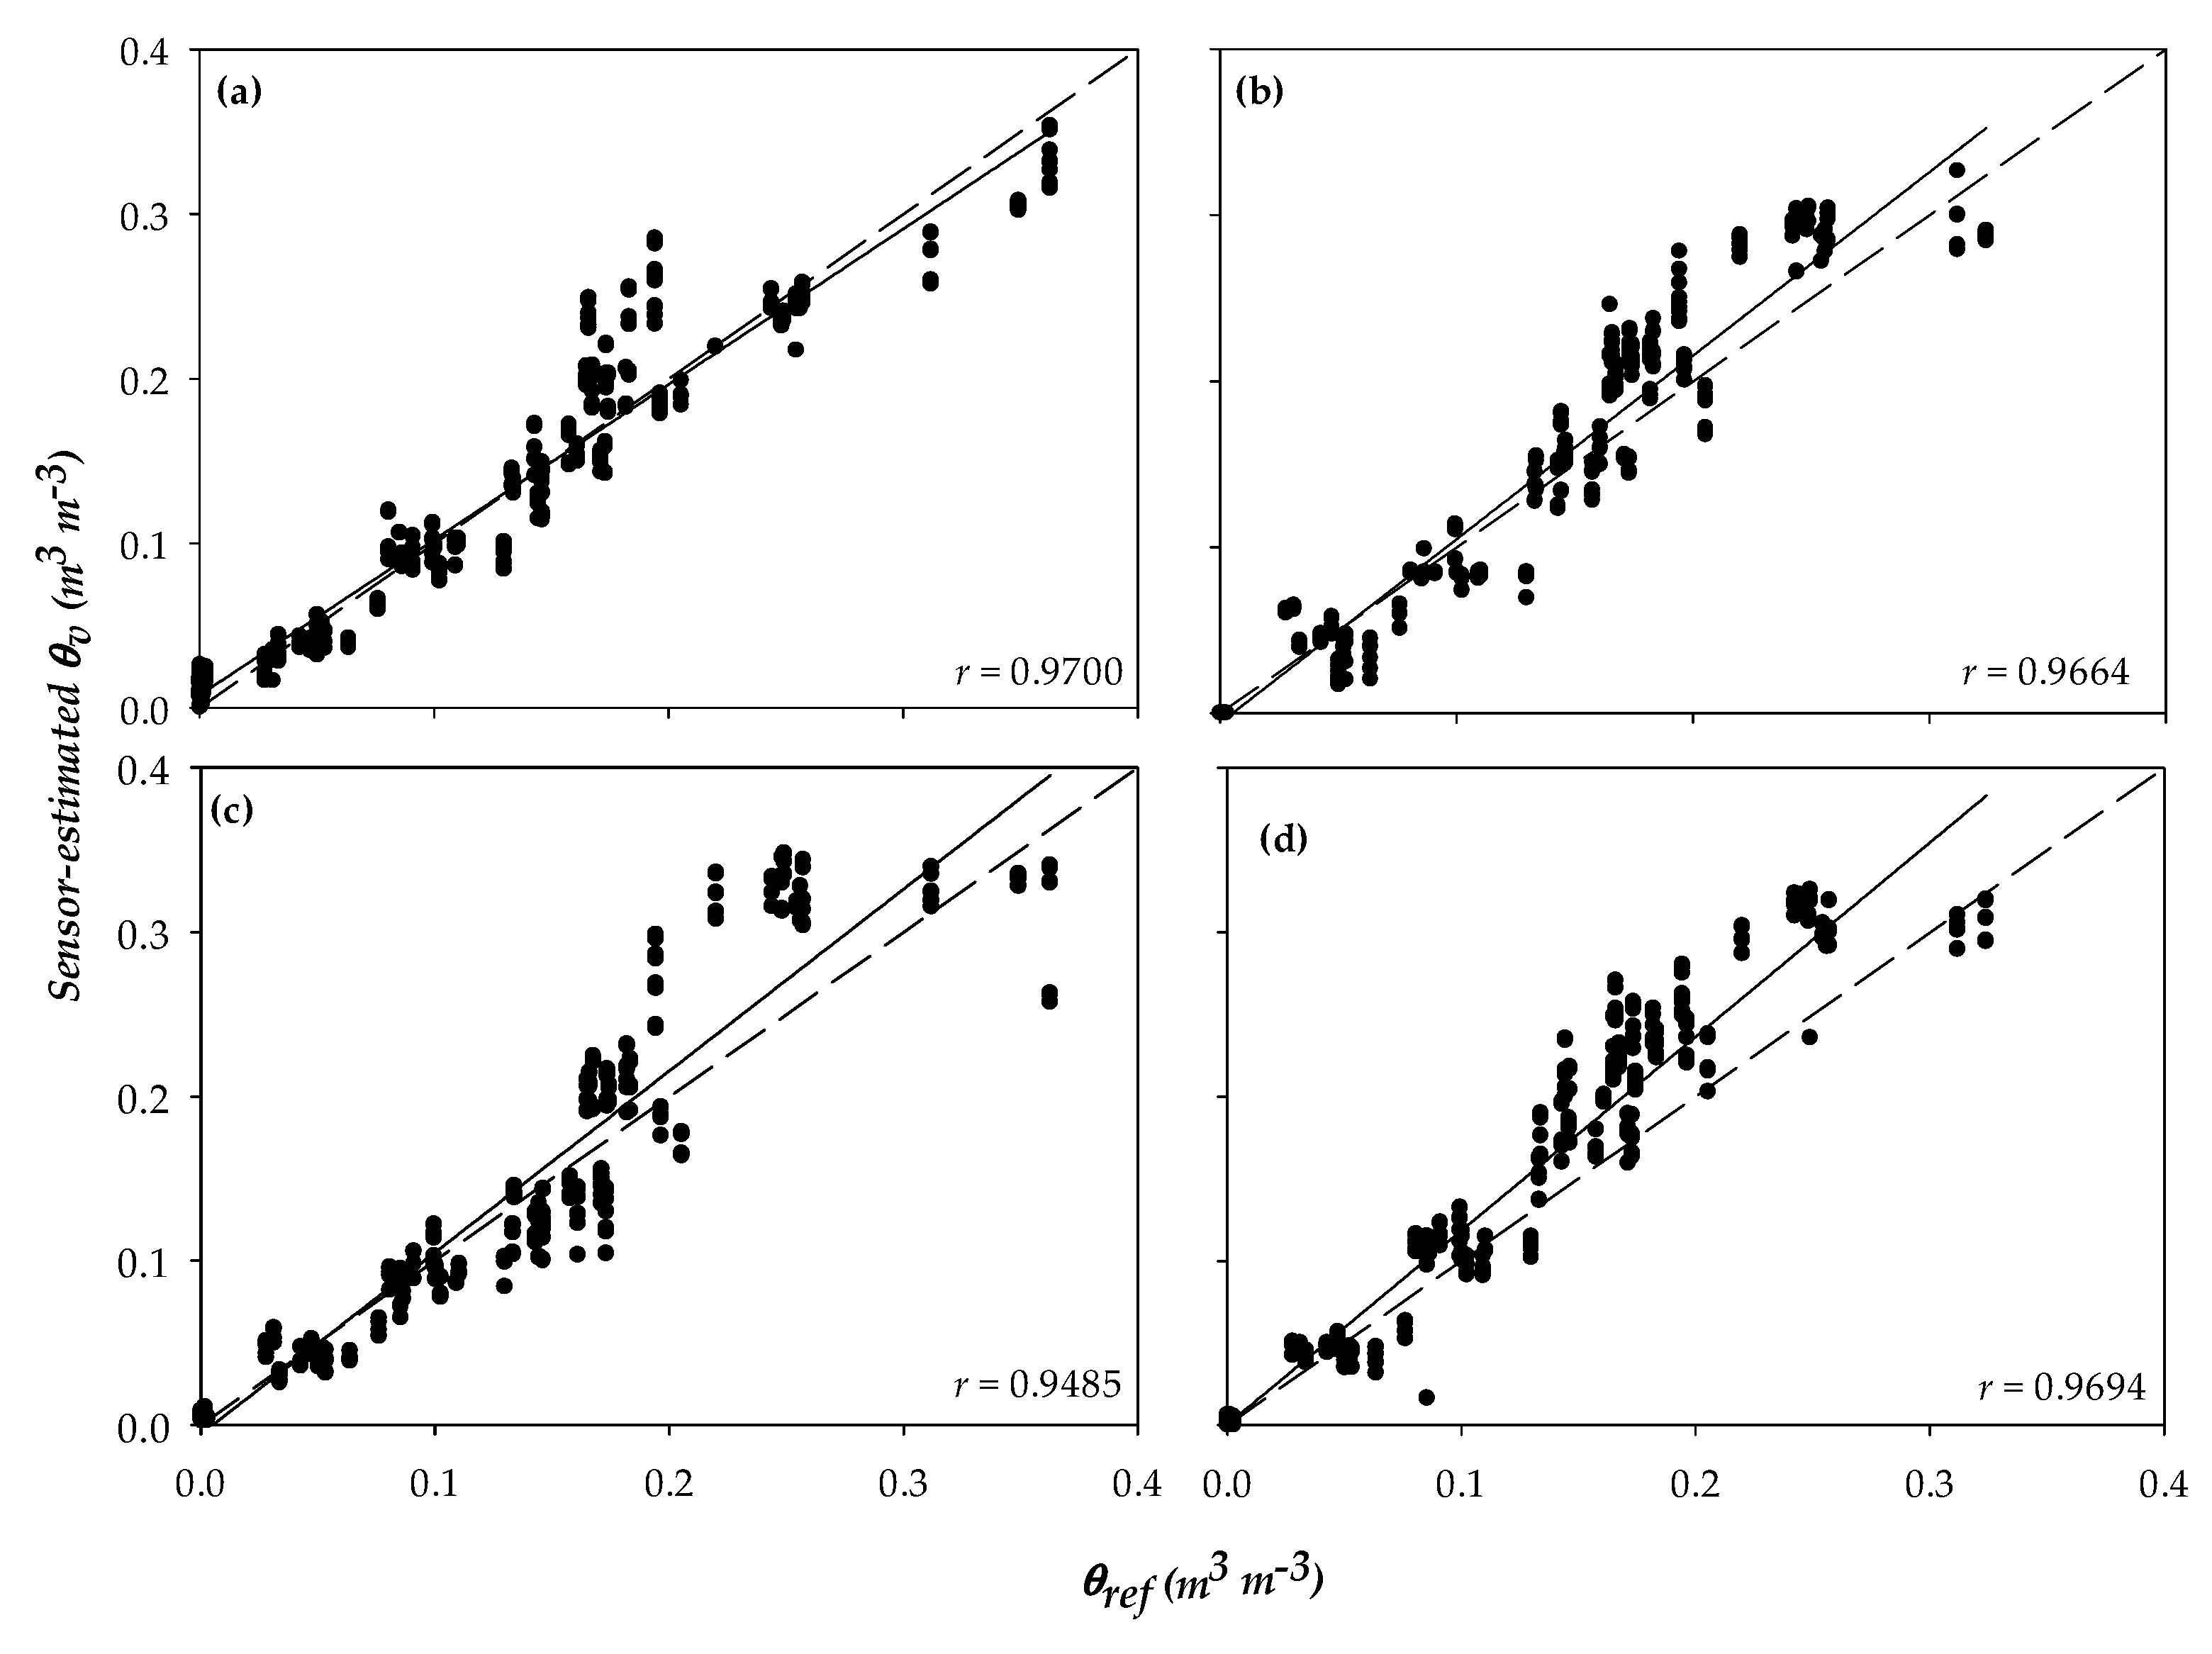
A positive correlation was observed between θv (measured by sensors) and θref values (determined by gravimetry) (Figure 3, Figure 4 and Figure 5). That means the sensor measurements are correlated with the gravimetric determinations. When comparing the regression graph with the 1:1 reference line, values on the upper half indicate θv overestimation, while values in the lower half indicate θv underestimation. Sensors 10HS, GS1, and GS3 had the lowest correlation coefficient (r = 0.8990, r = 0.9212, and r = 0.8394, respectively; Figure 3a–c), and outlier data points may have been caused by the generation of nonuniform readings from these sensors. This was more evident for sensors 10HS and GS3, which showed poor accuracy, low R2, and high CV (Table 3). However, the other sensors showed a high positive correlation between θv and θref (r > 0.90).
The sensors 10HS, GS1, GS3 (Figure 3a–c), CS650 (Figure 4b), TDR310S, TDT-ACC-SEN-SDI, and TDR315L (Figure 5b–d) overestimated θv as most of the points were above the 1:1 reference line. Many researchers have also reported overestimation of θv by the CS655 sensor [56,57,58]. Similar results from Datta et al. [6] showed that all sensors (TDR315, CS655, and GS1) overestimated θv in a low clay content soil located in central Oklahoma. Adeyemi et al. [52] found that TDR315 and GS1 underestimated θv in sandy loam soil. Singh et al. [51] reported that sensors TDR315 and CS655 resulted in θv similar to reference θ in a sandy soil (RMSE < 0.02 m3 m−3), but the discrepancy was larger for the clayey soils. An increase in clay content tended to cause TDR315 to underestimate θv and CS655 to overestimate θv [51].
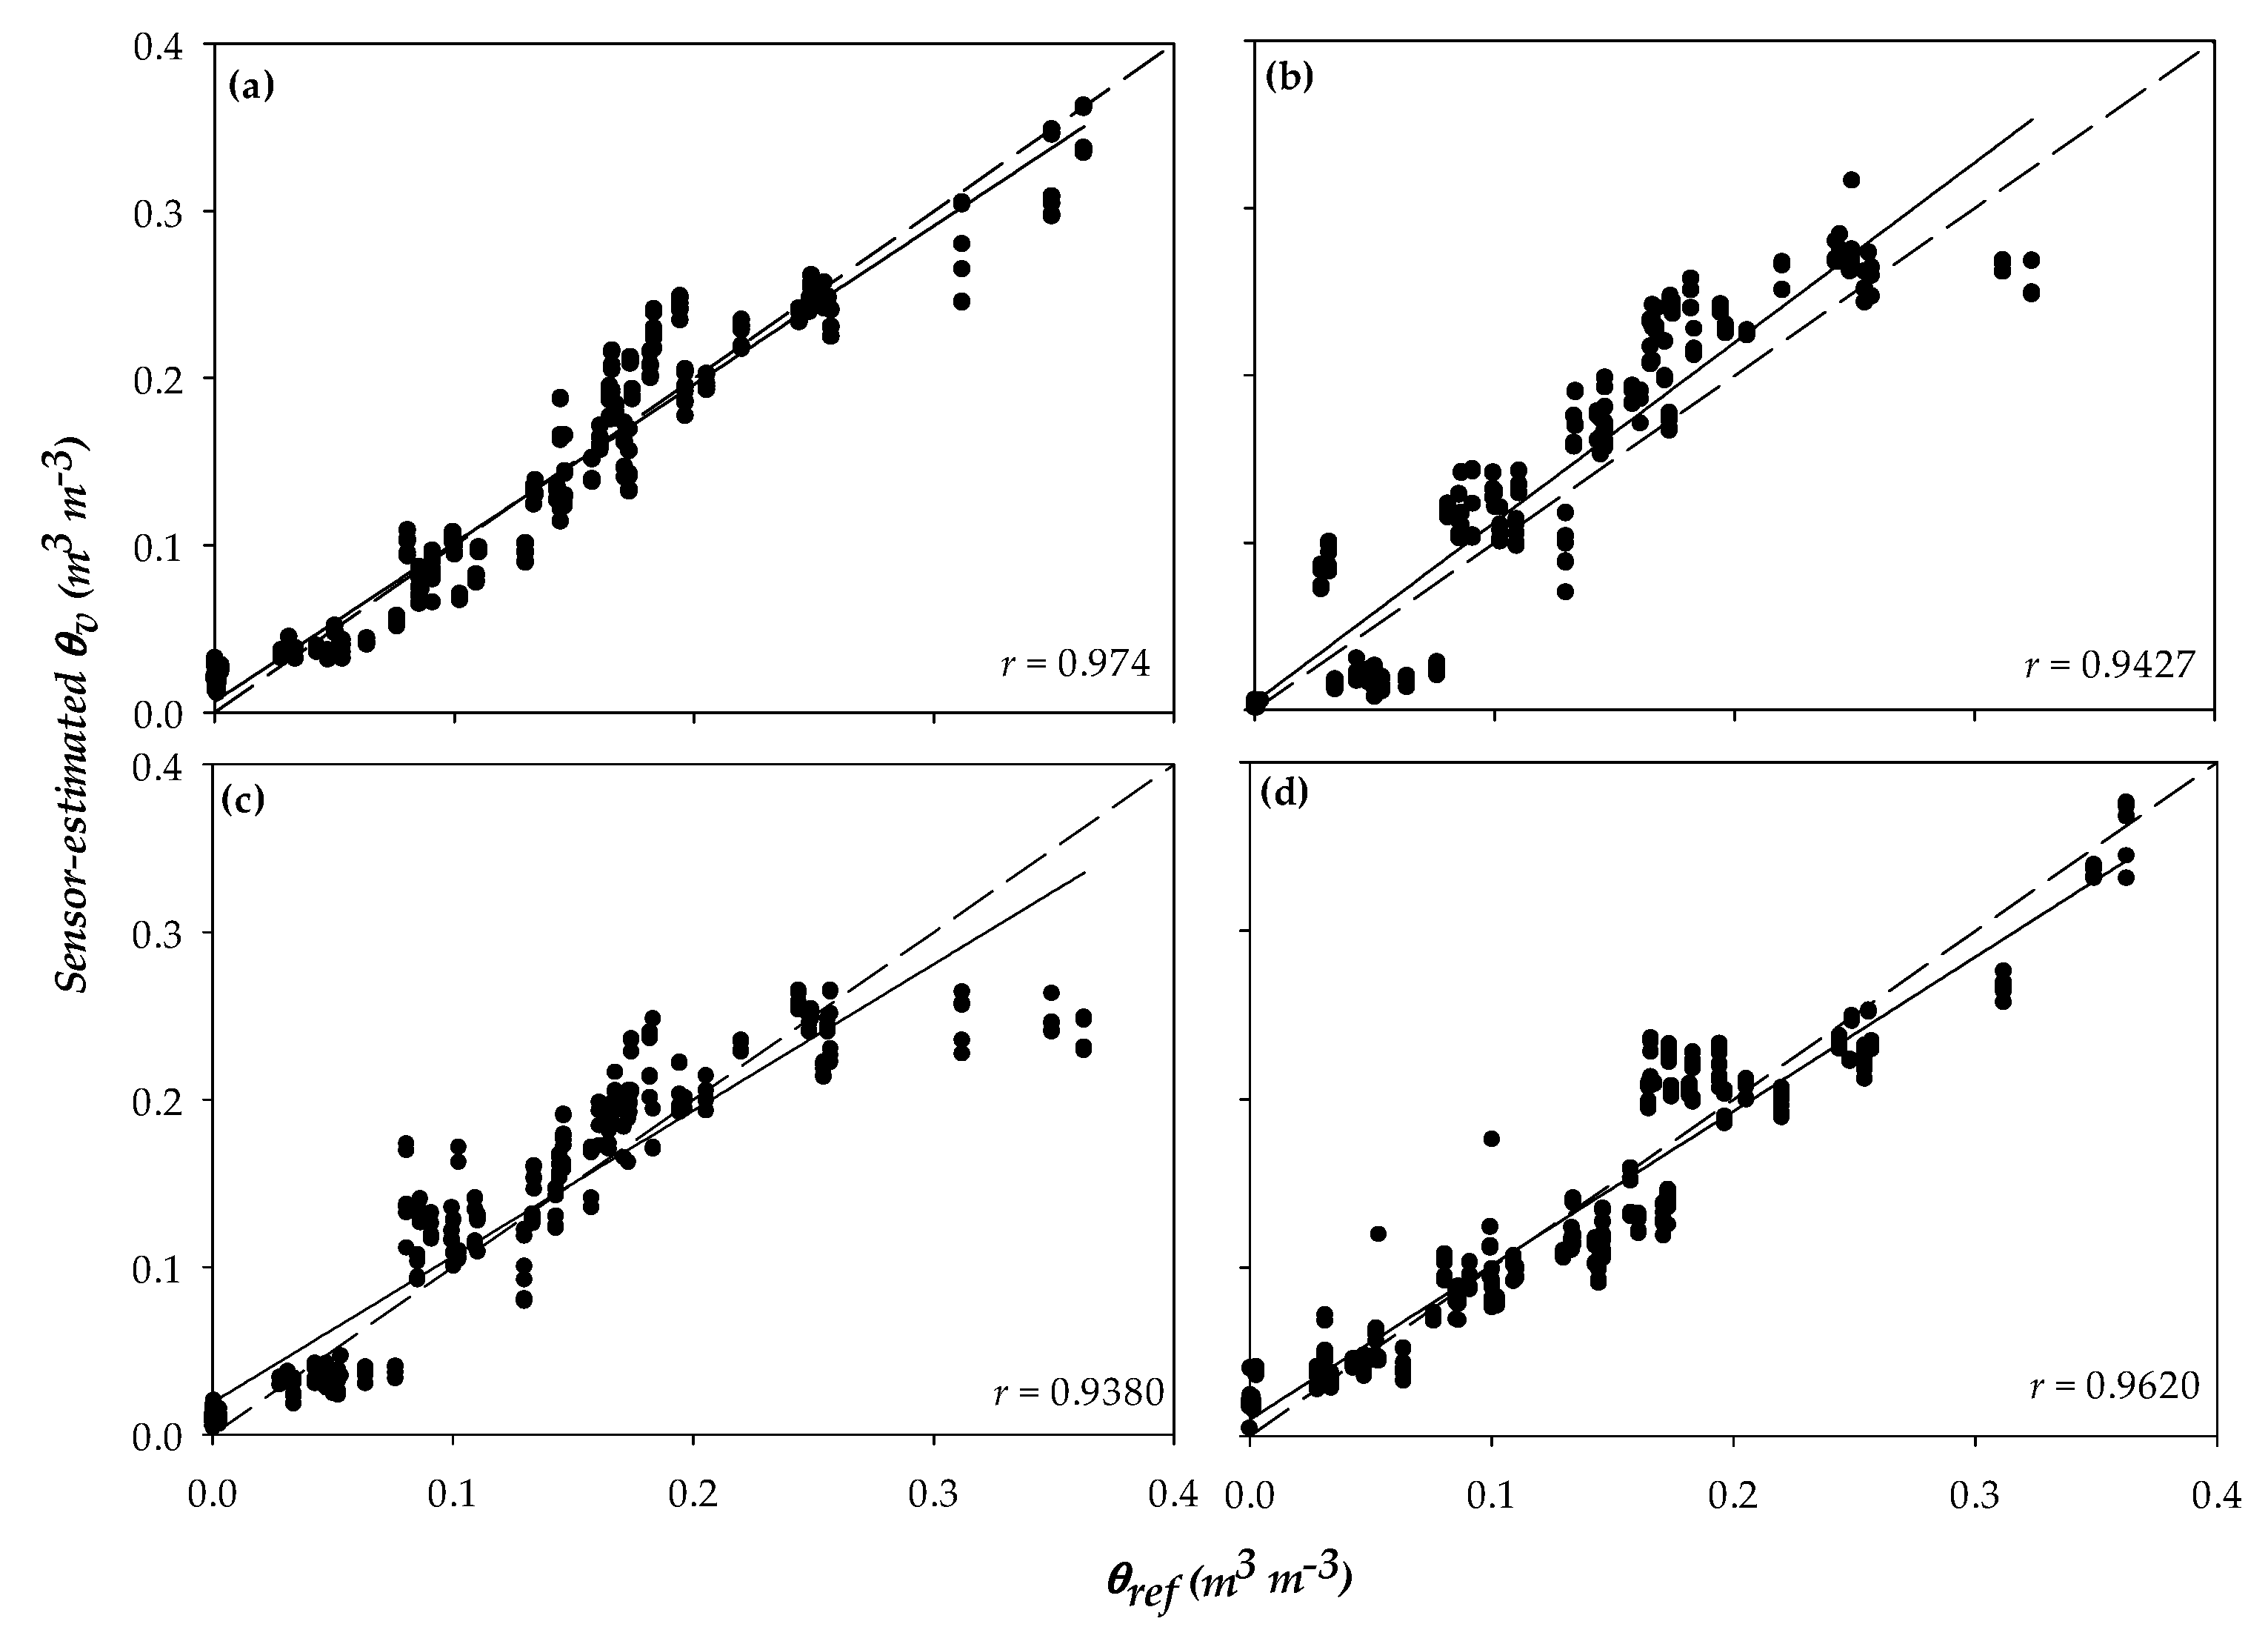
The CS616 and Hydra Probe sensors underestimated θv in sandy soils (Figure 4c,d). In contrast, Evett et al. [59] found that CS616 overestimated θv and Hydra Probe overestimated εa compared to TDR (slope = 1.437, R2 = 0.966, RMSE = 1.08) more than Acclima, which was highly corrected with TDR-derived εa (slope = 1.108, R2 = 0.996, RMSE = 0.256). In our study, the sensors 5TE, CS655, and TDR315 were very precise in determining θv (R2 ≥ 0.9604; Figure 3d, Figure 4a and Figure 5a).
3.2. Soil-Specific Calibration Equations
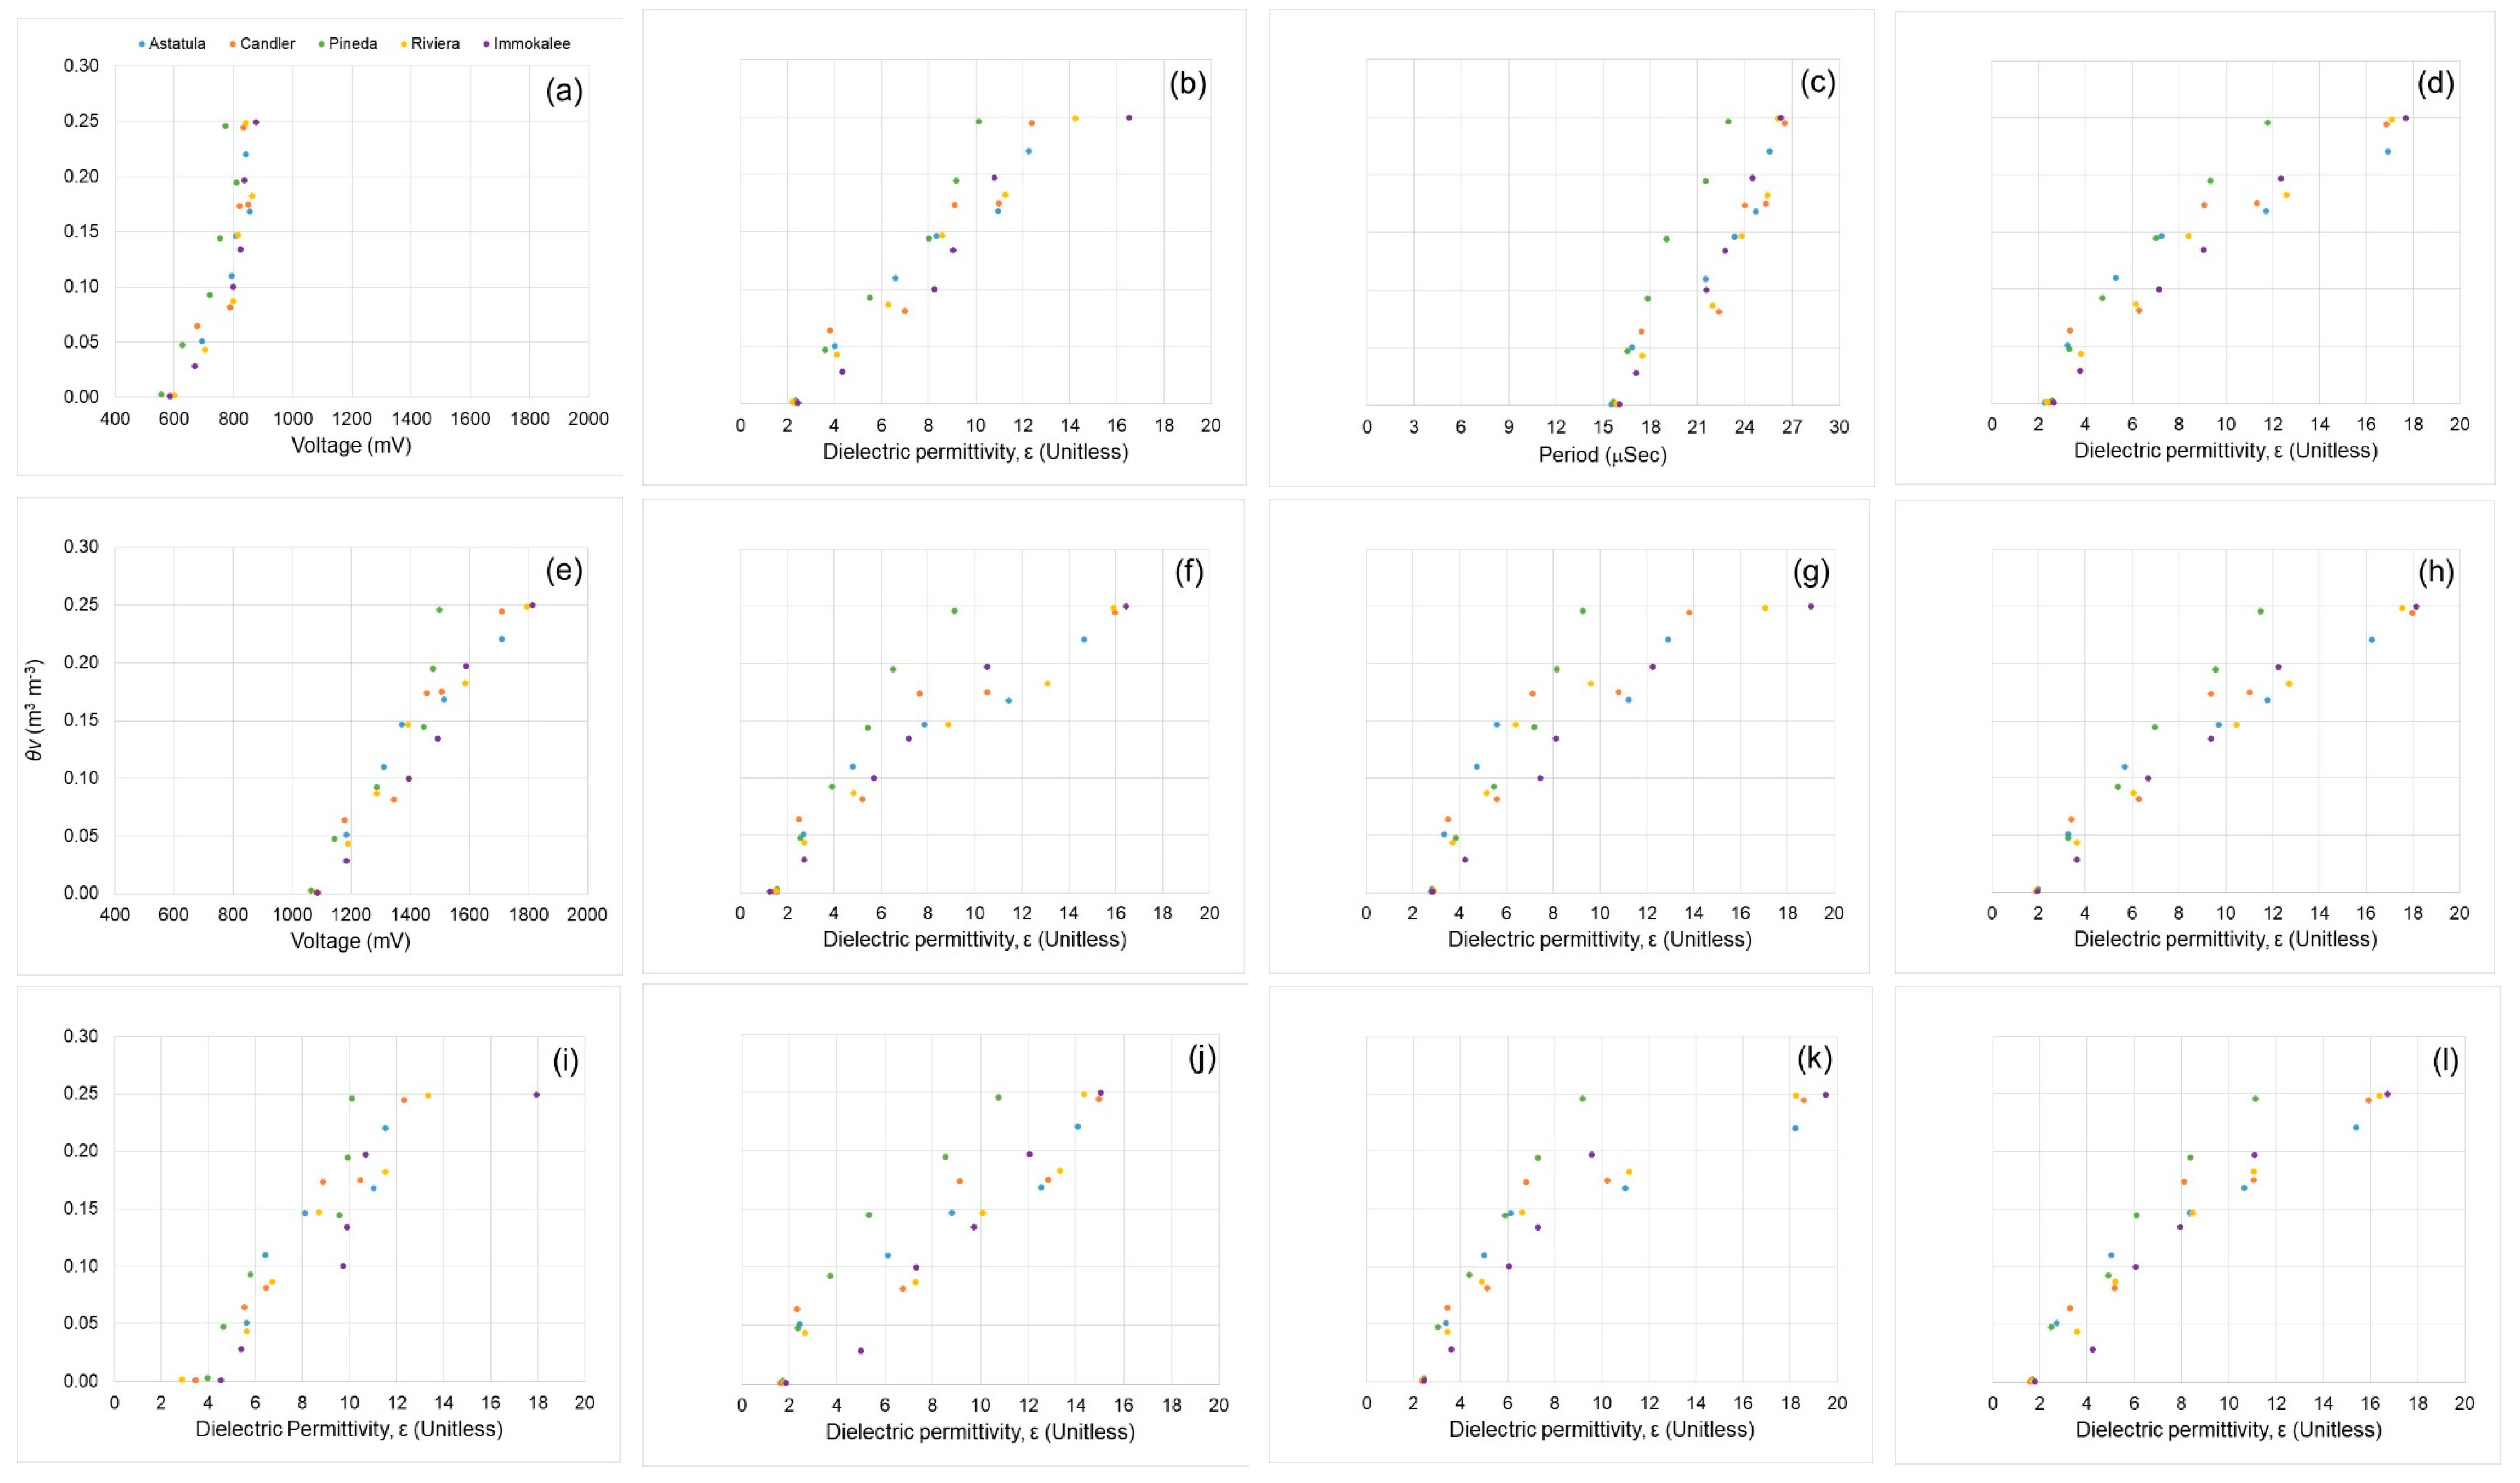
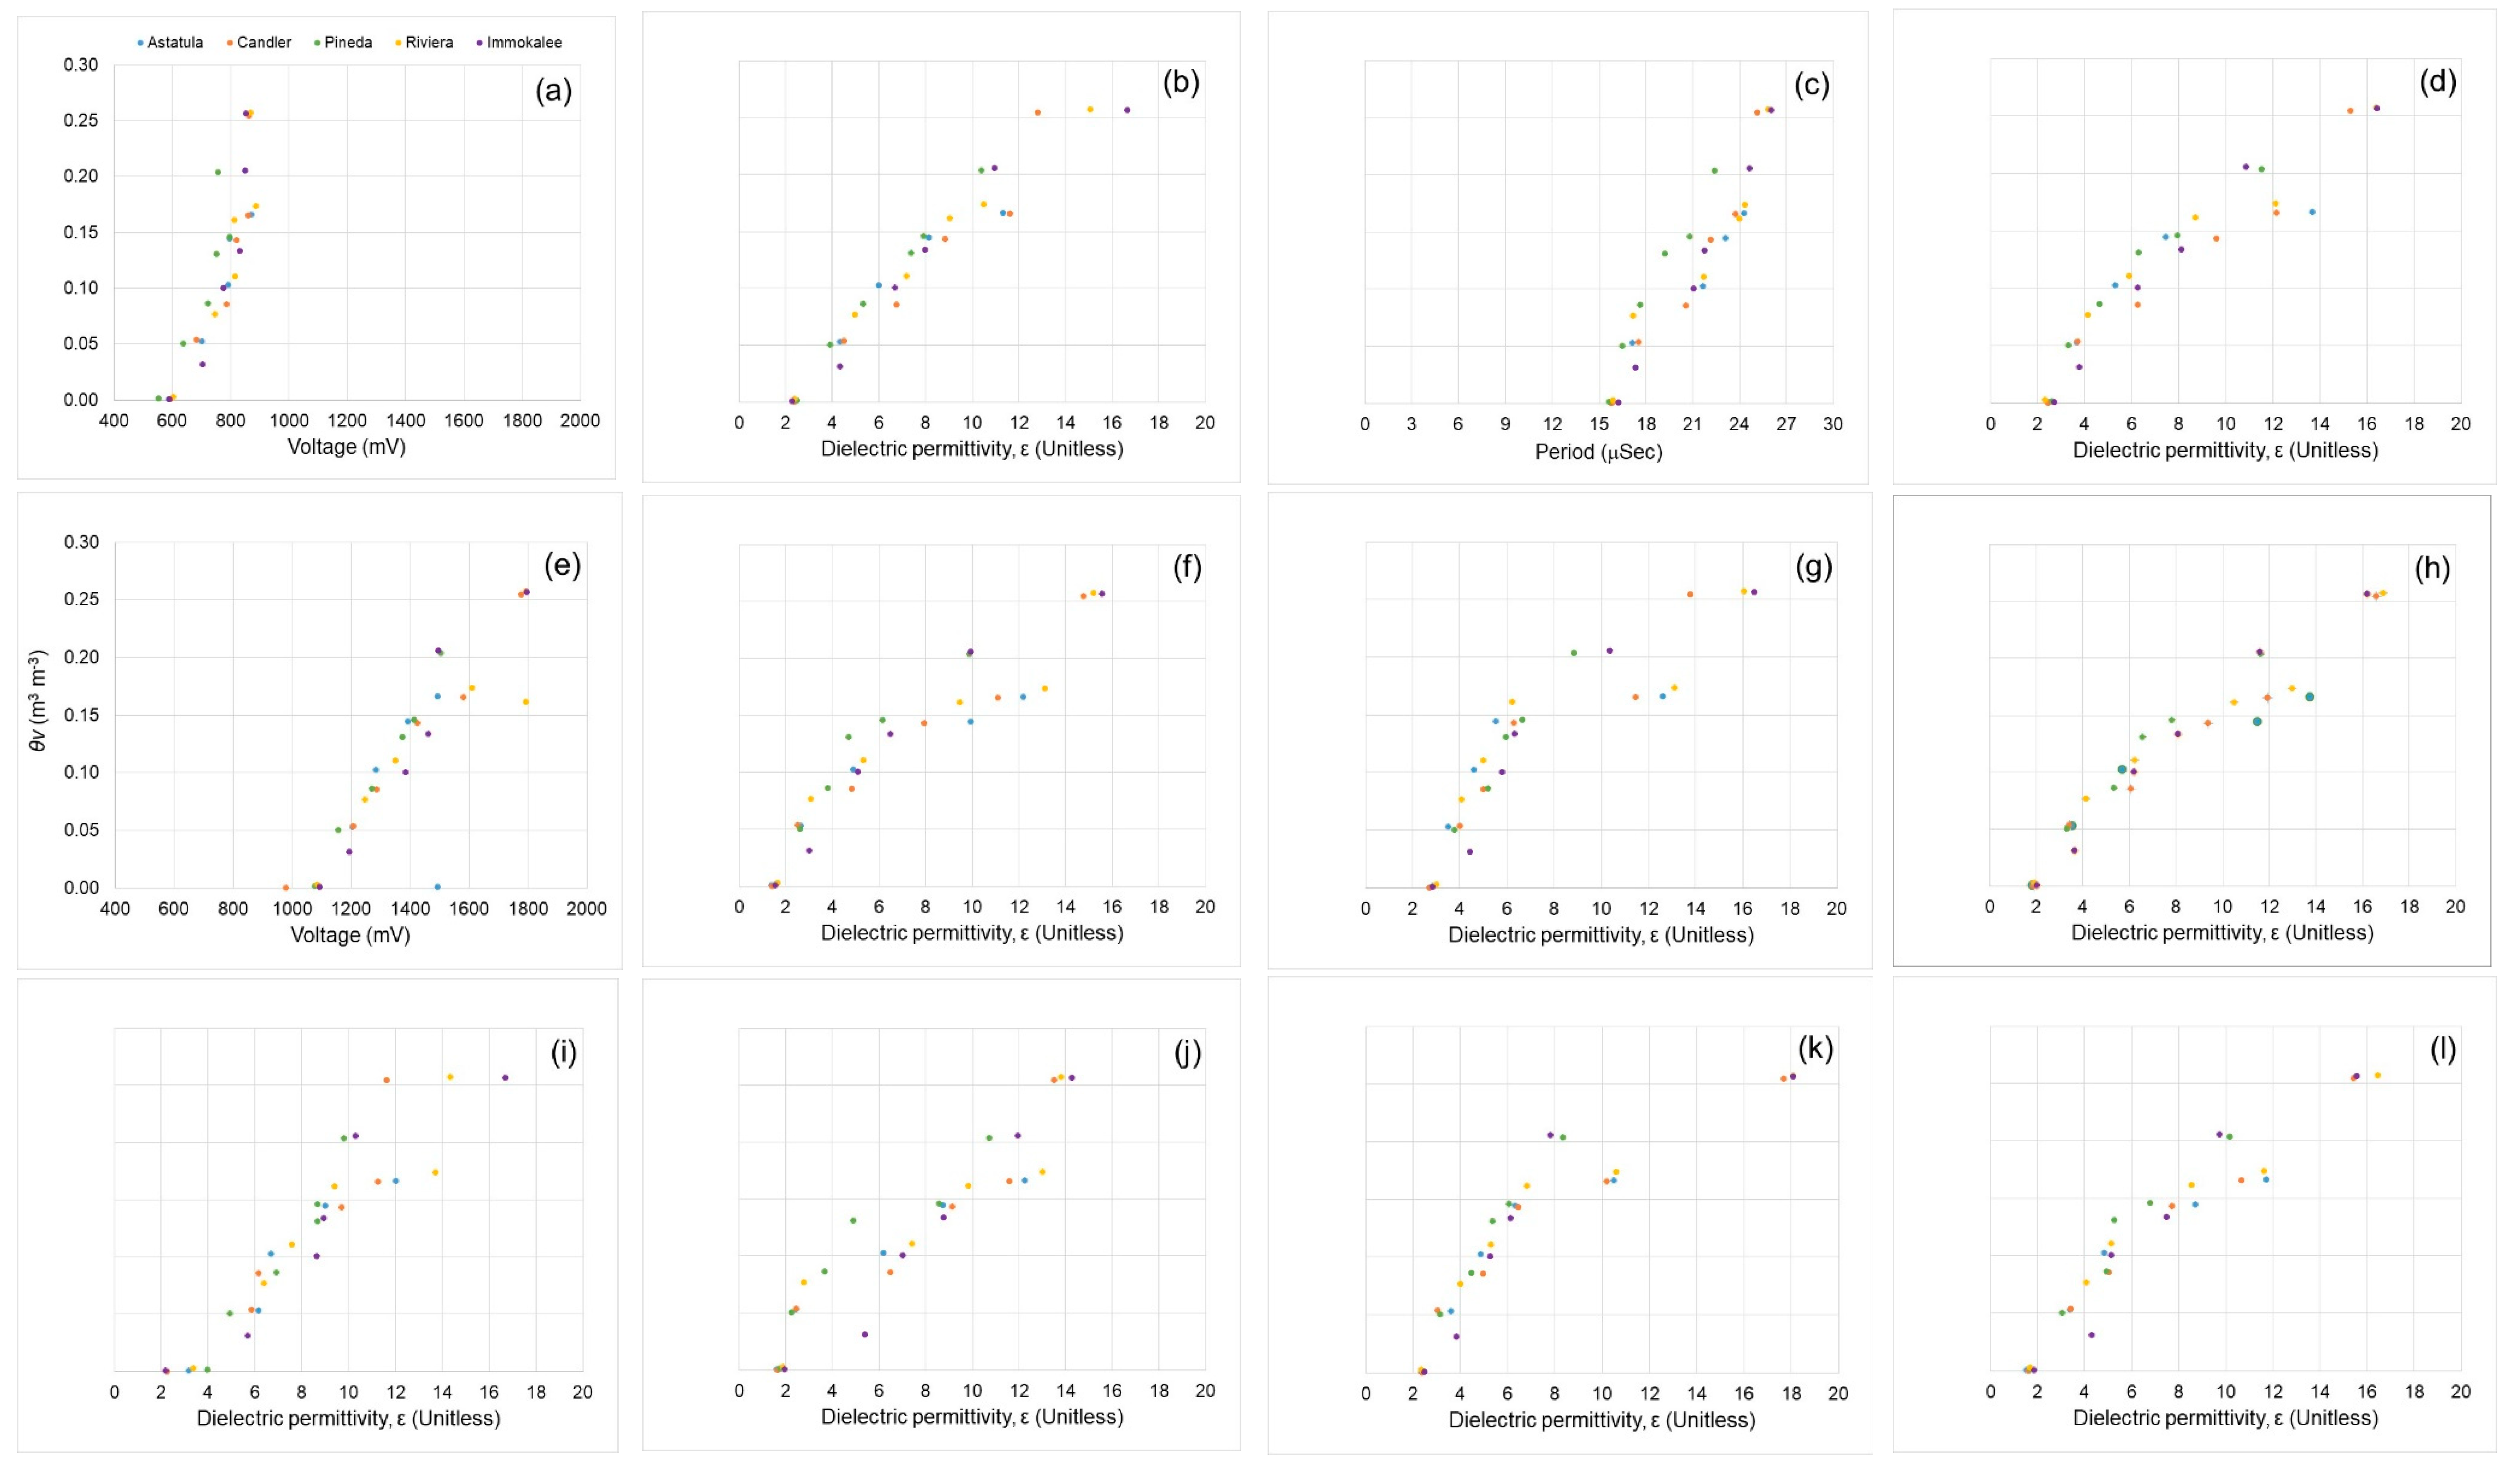
We generated calibration equations for several sandy soils representing the most common types used for citrus production in Florida (Figure 6; Figure 7). The sensor readings were taken over increasing θv values, successfully establishing soil-specific calibration equations for all the sensors, in all the soils sampled, and at the two depths tested. Sensors with output in voltage, period, and dielectric permittivity followed similar trends for all soil types and soil depths. The slopes on all soils differed for each sensor, evidencing that soil-specific calibration equations are required to improve sensor accuracy based on the soil used. That outcome is expected since several SMS have been evaluated, and most of the studies concluded that the sensor accuracy can be considerably increased by using soil- or site-specific equations determined in the laboratory and field instead of using the generic equations provided by the manufacturers [60,61,62].
In this study, the equations were established according to the different factors, including sensor, soil type, and soil depth. The linear, quadratic, or higher-order independent terms of each equation were determined through regression analysis, having the electric permittivity, voltage, or period as the independent variable and the θv determined by gravimetry as the dependent variable. The sensors’ readings were taken at incrementally θv, obtaining a range of values that allowed the determination of a soil-specific equation for each soil and depth. As a result, the soil-specific calibration equation in both depths presented an R2 ranging from 0.83 to 0.99 for Pineda soil (Table 4), from 0.81 to 0.99 for Riviera soil (Table 5), from 0.81 to 0.99 for Candler soil (Table 6), from 0.46 to 0.99 for Astatula soil (Table 7), and from 0.79 to 0.99 for Immokalee soil (Table 8).
Based on the determination of the soil-specific calibration equations, new values of RMSE were calculated. Except in the cases of 10HS (0.129 m3 m−3) and GS3 (0.054 m3 m−3), all sensors had a lower RMSE value than that presented by the manufacturer’s standard equation (5TE = 0.018; CS616 = 0.025; CS650 = 0.024; CS655 = 0.020; GS1 = 0.030; Hydra Probe = 0.024; TDR310S = 0.019; TDR315 = 0.022; TDR315L = 0.019; and TDT-ACC-SEN-SDI = 0.022 m3 m−3). The factors that influenced the increase in the RMSE for the 10HS and GS3 sensors are still unknown. However, it is important to note that these sensors presented the highest CV in comparison to the other sensors tested (Table 3). Hignett and Evett [63] indicated that for efficient irrigation management based on the determination of soil water content, the RMSE of the water content estimation should be between 0.01 and 0.02 m3 m−3. Thus, according to the RMSE presented in Table 3, none of the sensors evaluated would have the accuracy required for the determination of water content using the manufacturer’s generic equation. Therefore, to reduce the coefficients of variation as much as possible and to find the lowest RMSE, soil-specific calibration equations should be used to improve sensor accuracy.
Our results indicate that the use of a soil-specific equation had a notable impact on improving the accuracy of θv determination in sandy Florida soils. Vaz et al. [4] also compared the performance of the manufacturer’s generic calibration equations for different sensors (CS616, Hydra Probe, 5TE, and 10HS) with soil-specific equations developed in seven texturally varying soils. Those authors also demonstrated that soil-specific calibrations improve measurement accuracy to values ranging from 0.02 to 0.03 m3 m−3. That improvement is imperative for sandy soils like the ones used for citrus production in Florida since the water-holding capacity is reduced by the large pores present in sandy soils with more than 96–97% sand. Fares et al. [16] also concluded the soil-specific calibration equations can mitigate the effects of varying soil properties and improve sensor accuracy for water content measurements.
Results from field tests in sandy clay loam and loamy sand soils indicated that a linear calibration for the TDT, CS616, and 5TE sensors can reduce the errors of the factory calibration of θv to less than 0.02 ± 0.035 m3 m−3 [49]. Previous studies also have noted that RMSE in θv was smaller when using site-specific calibrations in comparison to generic calibrations [5,64,65]. Singh et al. [53] reported that soil-specific calibrations led to substantial improvement in θv accuracy beyond factory calibration. RMSE of CS616 exceeded 0.10 m3 m−3 at both depths when using generic calibration and dropped below 0.02 m3 m−3 for depth-specific and combined data when using soil-specific calibration. The authors noticed that the RMSE of the evaluated sensors (5TE, EC5, Hydra Probe2, CS616, CS655, and TDR 315) installed at depths of 0.15 and 0.76 m were below 0.015 m3 m−3 using soil-specific regression calibration sand and below 0.020 m3 m−3 as determined by combining all regression calibrations.
4. Conclusions
The sensors that performed best in estimating θv using the manufacturer’s generic equation for the evaluated soils were TDR310S, TDR315L, GS1, and 5TE. These sensors presented the greatest adjustments to the model and lowest RMSE. Conversely, the low CV for GS3, 10HS, and Hydra Prove sensors indicated the low accuracy of the standard equation for the θv determination in sandy soils. The estimated calibration equations can replace the manufacturer’s generic equations as they provide more accurate data on the soil’s real-time moisture content according to the sensor, soil type, and depth chosen.
Unsatisfactory results were found for soil-specific calibrations performed on two of the sensors tested (10HS and GS3). A significant improvement was obtained in estimating θv with respect to the generic equation for the other sensors. This improvement allows researchers and end users to obtain real soil moisture content data in the soils tested, permitting, for example, more efficient irrigation control and water savings by optimizing the water use.
For the evaluated Florida sandy soils, the calibration equations can be applied with an accuracy ranging from 0.018 to 0.030 m3 m−3. Sensors 5TE, TDR310S, and TDR315L had a better overall performance in soil moisture estimation.
These equations can be used under field conditions. However, we still recommend evaluating the sensors by considering the specific environmental conditions of each site, since they influence sensor performance. Finally, further research should be carried out to test other commercial sensors, in other soil types, and with different organic matter contents.
Author Contributions
Conceptualization, R.S.F.; data curation, S.G.C.Z.; formal analysis, R.S.F., T.A.R.N., and S.G.C.Z.; funding acquisition, R.S.F.; investigation, S.G.C.Z.; methodology, R.S.F. and S.G.C.Z.; project administration, R.S.F.; resources, R.S.F.; supervision, R.S.F.; validation, T.A.R.N. and S.G.C.Z.; writing—original draft, R.S.F., T.A.R.N., and S.G.C.Z.; writing—review & editing, R.S.F., T.A.R.N., and S.G.C.Z. All authors have read and agreed to the published version of the manuscript.
Funding
Funding for this research was provided by University of Florida’s Joye Giglia Endowment for Innovative Agricultural Technology (Project #2017-F0013964), U.S. Department of Agriculture’s Specialty Crop Research Initiative (SCRI) Citrus Disease Research and Extension Program (CDRE) (Award #2018-70016-27387), and U.S. Department of Agriculture’s National Institute of Food and Agriculture (NIFA) (Hatch/Multistate W4128 Project #1021596).
Acknowledgments
We thank Steve Futch (UF/IFAS Extension, Lake Alfred, FL), W. Cody Estes Sr. (Estes Citrus, Vero Beach, FL), Timothy Gast (Southwest Florida Research and Education Center, Immokalee, FL), John Strang (Gapway Groves, Auburndale, FL), Darrell McCullough (Smoak Groves, Lake Placid, FL), John Stephens, Randy Burton, Wayne Brunk and Clarence King for technical support.
Conflicts of Interest
The authors declare no conflict of interest.
References
- Abba, S.; Namkusong, J.W.; Lee, J.-A.; Crespo, M.L. Design and performance evaluation of a low-cost autonomous sensos interface for a smart IoT-based irrigation monitoring and control system. Sensors 2019, 19, 3643. [Google Scholar] [CrossRef] [PubMed] [Green Version]
- Bjorneberg, D.L. Irrigation Methods; Reference Module in Earth Systems and Environmental Sciences. 2013; pp. 1–9. Available online: https://eprints.nwisrl.ars.usda.gov/1568/1/1524.pdf (accessed on 30 September 2019).
- Sui, R. Irrigation scheduling using soil moisture sensors. J. Agr. Sci. 2018, 10, 1–11. [Google Scholar] [CrossRef]
- Vaz, C.M.P.; Jones, S.; Meding, M.; Tuller, M. Evaluation of standard calibration functions for eight electromagnetic soil moisture sensors. Vadose Zone J. 2013, 12, 1–16. [Google Scholar] [CrossRef]
- Ojo, E.R.; Bullock, P.R.; Fitzmaurice, J. Field performance of five soil moisture instruments in heavy clay soils. Soil Sci. Soc. Am. J. 2015, 79, 20–29. [Google Scholar]
- Datta, S.; Taghvaeian, S.; Ochsner, T.E.; Moriasi, D.; Gowda, P.; Steiner, J.L. Performance assessment of five different soil moisture sensors under irrigated field conditions in Oklahoma. Sensors 2018, 18, 3786. [Google Scholar] [CrossRef] [PubMed] [Green Version]
- Seyfried, M.S.; Murdock, M.D. Measurement of soil water content with a 50-MHz soil dielectric sensor. Soil Sci. Soc. Am. J. 2004, 68, 394–403. [Google Scholar] [CrossRef]
- Gnatowski, T.; Szatyłowicz, J.; Pawluskiewicz, B.; Oleszczuk, R.; Janicka, M.; Papierowska, E.; Szejba, D. Field calibration of TDR to assess the soil moisture of drained peatland surface layers. Water 2018, 10, 1842. [Google Scholar] [CrossRef] [Green Version]
- Salgado, H.; Romay, C.; Zabala, S.; Genova, L. Calibración de campo de un sensor dieléctrico para suelos en la Provincia de Buenos Aires. Buenos Aires, Argentina: Universidad de Buenos Aires. 2012. Available online: http://www.riegoyfertirriego.com.ar/VI_Jornadas/VI_JARF_TrabajosCompletos/Salgado.pdf (accessed on 30 September 2019).
- Banerjee, I. Low-k interlayer dielectrics. Encycl. Mater. Sci. Techno. 2001, 4644–4651. [Google Scholar]
- Normand, B.; Takenouti, H.; Keddam, M.; Liao, H.; Monteil, G.; Coddet, C. Electrochemical impedance spectroscopy and dielectric properties of polymer: application to PEEK thermally sprayed coating. Electrochim. Acta 2004, 49, 2981–2986. [Google Scholar] [CrossRef]
- Evett, S.R. Soil moisture seensing: comparing the technologies. Irrigation TODAY 2017, 3, 14. [Google Scholar]
- Paltineanu, I.; Starr, J. Real-time soil water dynamics using multisensor capacitance probes: laboratory calibration. Soil Sci. Soc. Am. J. 1997, 61, 1576–1585. [Google Scholar] [CrossRef]
- Andrade, P.; Aguera, J.; Upadhyaya, S.; Jenkins, B.; Rosa, U.; Josiah, M. Evaluation of dielectric-based moisture and salinity sensor for in situ applications. In Proceedings of the ASAE Annual International Meeting, Sacramento, CA, USA, 28 July 2001–1 August 2001. Abstract # 011010, 1–13. [Google Scholar]
- Mittelbach, H.I.; Lehner, S.I. Seneviratne. Comparison of four soil moisture sensor types under field conditions in Switzerland. J. Hydrol. 2012, 430–431, 39–49. [Google Scholar] [CrossRef]
- Fares, A.; Abbas, F.; Maria, D.; Mair, A. Improved calibration functions of three capacitance probes for the measurement of soil moisture in tropical soils. Sensors 2011, 11, 4858–4874. [Google Scholar] [CrossRef]
- USDA (United States Department of Agriculture). Citrus Fruits 2018 Summary. Available online: https://www.nass.usda.gov/Publications/Todays_Reports/reports/cfrt0818.pdf (accessed on 30 September 2019).
- Kadyampakeni, D.M.; Morgan, K.T.; Zekri, M.; Ferrarezi, R.S.; Schumann, A.W.; Obreza, T.A. 2019–2020 Florida citrus production guide: irrigation management of citrus trees. Available online: https://crec.ifas.ufl.edu/media/crecifasufledu/production-guide/Irrigation_Management.pdf (accessed on 30 September 2019).
- Spelman, D.; Kinzli, K.-D.; Kunberger, T. Calibration of the 10HS soil moisture sensor for southwest Florida agricultural soils. J. Irrig. Drain. Eng. 2013, 139, 965–971. [Google Scholar] [CrossRef]
- Voroney, P. Soil for horse pasture management. In Horse Pasture Management, 1st ed.; Voroney, P., Ed.; Academic Press: Cambridge, MA, USA, 2019; pp. 65–79. [Google Scholar]
- Adamchuka, V.; Humme, J.; Morgan, M.; Upadhyayad, K. On-the-go soil sensors for precision agriculture. Comput. Electron. Agr. 2004, 44, 71–91. [Google Scholar] [CrossRef] [Green Version]
- Topp, G.; Davis, J.; Annan, A. Electromagnetic determination of soil water content: measurements in coaxial transmission lines. Water Resour. Res. 1980, 16, 574–582. [Google Scholar] [CrossRef] [Green Version]
- Murillo, J.; Villafañe, R.; Basso, C.; Trujillo, A. Evaluation of an equipment of time domain reflectometry (TDR) for moisture registration in a loam soil. Rev. Fac. Agron. 2008, 25, 211–222. [Google Scholar]
- Visconti, F.; Paz, J.M. Electrical conductivity measurements in agriculture: the assessment of Soil Salinity. In New Trends and Developments in Metrology; Cocco, L., Ed.; IntechOpen: London, UK, 2016; pp. 99–126. [Google Scholar]
- Muñoz-Carpena, R. Field Devices Monitoring Soil Water Content. Available online: http://edis.ifas.ufl.edu/pdffiles/AE/AE26600.pdf (accessed on 8 October 2019).
- CS650 and CS655 Water Content Reflectometers. Instruction Manual. Available online: https://s.campbellsci.com/documents/es/manuals/cs650.pdf (accessed on 2 October 2019).
- Blonquist, J.; Jones, S.; Robinson, D. A time domain transmission sensor with TDR performance characteristics. J. Hydrol. 2005, 223, 235–245. [Google Scholar] [CrossRef]
- USDA, United States Department of Agriculture; Natural Resources Conservation Service. Soil Series Classification Database. Available online: https://soilseries.sc.egov.usda.gov/scname.aspx (accessed on 1 October 2019).
- Obreza, T.; Collins, M. Common Soils Used for Citrus Production in Florida. 2008. Available online: https://ufdcimages.uflib.ufl.edu/IR/00/00/31/34/00001/SS40300.pdf (accessed on 3 October 2019).
- 10HS Soil Moisture Sensor. Operator’s Manual. Available online: http://publications.decagon.com/Manuals/13508_10HS_Web.pdf (accessed on 2 October 2019).
- GS1 Soil Moisture Sensor. Operator’s Manual. Available online: http://publications.decagon.com/Manuals/14640_GS1_Web.pdf (accessed on 2 October 2019).
- GS3 Soil Moisture Sensor. Operator’s Manual. Available online: http://publications.decagon.com/Manuals/20429_GS3_Web.pdf (accessed on 2 October 2019).
- 5TE Soil Moisture Sensor. Operator’s Manual. Available online: http://publications.decagon.com/Manuals/13509_5TE.pdf (accessed on 2 October 2019).
- CS616 and CS625 Water Content Reflectometers. Instruction Manual. Available online: https://s.campbellsci.com/documents/af/manuals/cs616.pdf (accessed on 2 October 2019).
- HydraProbe Soil Sensor. User Manual. Available online: https://www.stevenswater.com/resources/documentation/hydraprobe/HydraProbe_Manual_Jan_2018.pdf (accessed on 2 October 2019).
- True TDR−315, TDR−315L & TDR−310S. User Manual. Available online: http://www.meteo-tech.co.il/ImagesDownloadFiles/DownloadFile1562_2_%D7%9E%D7%93%D7%A8%D7%99%D7%9A%20%D7%9C%D7%9E%D7%A9%D7%AA%D7%9E%D7%A9.pdf (accessed on 2 October 2019).
- TDT ACC-SEN-SDI. User Manual SDI-12 Soil Moisture. Available online: https://acclima.com/prodlit/User%20Manual%20SDI%20TDT.pdf (accessed on 2 October 2019).
- Watts, F.; Stankey, D.; Jones, M.; Lisante, R. Soil Survey of St. Lucie County Area, Florida. 1980. Available online: https://www.nrcs.usda.gov/Internet/FSE_MANUSCRIPTS/florida/FL111/0/lucie.pdf (accessed on 3 October 2019).
- Wettstein, C.; Noble, C.; Slabaugh, J. Soil Survey of Indian River County Area, Florida. 1987. Available online: https://www.nrcs.usda.gov/Internet/FSE_MANUSCRIPTS/florida/FL061/0/indian.pdf (accessed on 3 October 2019).
- Carter, L.; Lewis, D.; Crockett, L.; Vega, J. Soil Survey of Highlands County, Florida. 1989. Available online: https://www.nrcs.usda.gov/Internet/FSE_MANUSCRIPTS/florida/highlandsFL1989/Highlands.pdf (accessed on 3 October 2019).
- Ford, R.; Robbins, J.; Werner, J.; Cowherd, D.; Gordon, C.; Warmack, W.; Brown, M.; Monroe, K.; George, W.; Sanders, T.; et al. Soil Survey of Polk County, Florida. Available online: https://www.nrcs.usda.gov/Internet/FSE_MANUSCRIPTS/florida/FL105/0/Polk.pdf (accessed on 3 October 2019).
- Liudahl, K.; Belz, D.; Carey, L.; Drew, R.; Fisher, S.; Pate, R. Soil Survey of Collier County Area, Florida. 1998. Available online: https://www.nrcs.usda.gov/Internet/FSE_MANUSCRIPTS/florida/collierFL1998/Collier.pdf (accessed on 3 October 2019).
- ASTM - American Society for Testing and Materials. Standards & Publications: ASTM. Available online: https://www.astm.org/Standard/standards-and-publications.html (accessed on 10 October 2019).
- Schmugge, T.; Jackson, T.; McKim, H. Survey of methods for soil moisture determination. Water Resour. Res. 1980, 16, 961–979. [Google Scholar] [CrossRef] [Green Version]
- Topp, G.C.; Ferre, P.A. The soil solution phase. In Methods of Soil Analysis: Part 4—Physical Methods; Jacob, H.D., Topp, G.C., Eds.; Soil Science Society of America, Inc.: Madison, Wisconsin, 2002; pp. 417–545. [Google Scholar]
- Reynolds, S. The gravimetric method of soil moisture determination. J. Hydrol. 1970, 1, 258–273. [Google Scholar] [CrossRef]
- Excel 2016; Microsoft Corp.: Redmond, WA, USA.
- SAS Institute Inc, 2013. Base SAS® 9.4 Procedures Guide; SAS Institute Inc.: Cary, NC, USA.
- Varble, J.; Chávez, J. Performance evaluation and calibration of soil water content and potential sensors for agricultural soils in eastern Colorado. Agric. Water Manag. 2011, 101, 93–106. [Google Scholar] [CrossRef]
- Evett, S.R.; Tolk, J.A.; Howell, T.A. Soil profile water content determination: sensor accuracy, axial response, calibration, temperature dependence, and precision. Vadose Zone J. 2006, 5, 894–907. [Google Scholar] [CrossRef]
- Singh, J.; Lo, T.; Rudnick, D.R.; Irmak, S.; Blanco-Canqui, H. Quantifying and correcting for clay content effects on soil water measurement by reflectometers. Agric. Water Manag. 2019, 216, 390–399. [Google Scholar] [CrossRef]
- Adeyemi, O.; Norton, T.; Grove, I.; Peets, S. Performance evaluation of three newly developed soil moisture sensors. In Proceedings of the CIGR-AgEng Conference, Aarhus, Denmark, 26–29 June 2016. [Google Scholar]
- Singh, J.; Lo, T.; Rudnick, D.; Dorr, T.; Burr, C.; Werle, R.; Muñoz, F. Performance assessment of factory and field calibrations for electromagnetic sensors in a loam soil. Agric. Water Manag. 2018, 196, 87–98. [Google Scholar] [CrossRef]
- Straten, G.; Vos, A.; Vlaming, R.; Oosterbaan, R. Dielectric sensors in an automated facility for testing salt tolerance of irrigated field crops. In Proceedings of the 18th World Congress of CIGR. International Commission of Agricultural and Biosystems Engineering, Beijing, China, 16–19 September 2014. [Google Scholar]
- Son, J.; Shin, W.; Cho, J. Laboratory and field assessment of the Decagon 5TE and GS3 sensors for estimating soil water content in saline-alkali reclaimed soils. Commun. Soil. Sci. Plant Anal. 2017, 48, 2268–2279. [Google Scholar] [CrossRef]
- Chávez, J.L.; Evett, S.R. Using soil water sensors to improve irrigation management. In Proceedings of the 24th Annual Central Plains Irrigation Conference, Colby, KS, USA, 21–22 February 2012; pp. 187–202. [Google Scholar]
- Kisekka, I.; Aguilar, J.; Lamm, F.; Rogers, D. Using soil water and canopy temperature to improve irrigation scheduling for corn. In Proceedings of the 2014 Irrigation Association Conference, Phoenix, AZ, USA, 3–6 November 2014. [Google Scholar]
- Michel, A.; Brown, H.; Gillespie, R.; George, M.; Meenken, E. Automated measurement of crop water balances under a mobile rain-exclusion facility. Agron. N. Z. 2015, 45, 39–46. [Google Scholar]
- Evett, S.R.; Schwartz, R.C.; Mazahrih, N.T.; Jitan, M.A.; Shaqir, I.M. Soil water sensors for irrigation scheduling: can they deliver a management allowed depletion? Acta Hortic. 2011, 888, 231–237. [Google Scholar] [CrossRef]
- Logsdon, S.D. CS616 Calibration: Field versus laboratory. Soil. Sci. Soc. Am. J. 2009, 73, 1–6. [Google Scholar] [CrossRef]
- Rüdiger, C.; Hancock, G.; Hemakumara, H.M.; Jacobs, B.; Kalma, J.D.; Martinez, C.; Thyer, M.; Walker, J.P.; Wells, T.; Willgoose, G.R. Goulburn river experimental catchment data set. Water Resour. Res. 2007, 43, 1–10. [Google Scholar] [CrossRef] [Green Version]
- Mittelbach, H.; Casini, F.; Lehner, I.; Teuling, A.J.; Seneviratne, S.I. Soil moisture monitoring for climate research: evaluation of a low-cost sensor in the framework of the Swiss soil moisture experiment (SwissSMEX) campaign. J. Geophys. Res.-Atmos. 2011, 116, 1–11. [Google Scholar] [CrossRef] [Green Version]
- Hignett, C.; Evett, S. Field Estimation of Soil Water Content: A Practical Guide to Methods, Instrumentation and Sensor Technology. International Atomic Energy Agency: Viena. Available online: https://inis.iaea.org/collection/NCLCollectionStore/_Public/39/079/39079658.pdf (accessed on 19 November 2019).
- Nolz, R. Comparison of EnviSCAN and AquaCheck capacitance probe for multi-depth soil water Monitoring. In Proceedings of the 20th International Poster Day “Transport of Water, Chemicals and Energy in the Soil-Plant-Atmosphere System”, Bratislava, Slovakia, 15 November 2012; pp. 496–503. [Google Scholar]
- Rudnick, D.R.; Djaman, K.; Irmak, S. Performance analysis of capacitance and electrical resistance-type soil moisture sensors in a silt loam soil. T. ASABE 2015, 58, 649–665. [Google Scholar]
Figure 1.
Soil moisture sensors from different manufacturers used in this study. (Table 1 shows the manufacturer information.)
Figure 1.
Soil moisture sensors from different manufacturers used in this study. (Table 1 shows the manufacturer information.)

Figure 2.
Location of the five sandy soils: Fort Pierce, FL - Pineda soil (1); Vero Beach, FL—Riviera soil (2); Fort Meade, FL—Candler soil (3); Lake Placid, FL - Astatula soil (4); and Immokalee, FL—Immokalee soil (5). Soils were sampled at two different depths (top and bottom layers at 0.0–0.3 and 0.3–0.6 m, respectively).

Figure 3.
Pearson correlation coefficient (r) between soil volumetric water content (θv) measured by sensors using the generic equation provided by the manufacturer and determined by gravimetry (θref) for the Meter Group sensors 10HS (a), GS1 (b), GS3 (c), and the 5TE (d). The solid line is the fitted Pearson’s correlation, and the dashed line is the 1:1 reference. Each point represents a single data value taken from each of the three replications by soil series, soil depths, amount of water added, and evaluated sensors (n = 540).

Figure 4.
Pearson correlation coefficient (r) between θv measured by sensors using the generic equation provided by the manufacturer and determined by gravimetry (θref) for the Campbell Scientific sensors CS655 (a), CS650 (b), CS616 (c), and Stevens Water’s sensor Hydra Probe (d). The solid line is the fitted Pearson’s correlation, and the dashed line is the 1:1 reference. Each point represents a single data value taken from each of the three replications by soil series, soil depths, amount of water added, and evaluated sensors (n = 540).

Figure 5.
Pearson correlation coefficient (r) between θv measured by sensors using the generic equation provided by the manufacturer and determined by gravimetry (θref) for the Acclima sensors TDR315 (a), TDR310S (b), TDT-ACC-SEN-SDI (c), and TDR315L (d). The solid line is the fitted Pearson’s correlation, and the dashed line is the 1:1 reference. Each point represents a single data value taken from each of the three replications by soil series, soil depths, amount of water added, and evaluated sensors (n = 540).

Figure 6.
Raw values measured by all commercial soil moisture sensors in the soil top layer (0.0–0.3 m): 10HS (a), 5TE (b), CS616 (c), TDR315 (d), GS1 (e), CS655 (f), Hydra Probe (g), TDR315L (h), GS3 (i), CS650 (j), TDT-ACC-SEN-SDI (k), and TDR310S (l). Each data point is the average of the three samples of the soils taken from each of the three replications by soil series (n = 9).

Figure 7.
Raw values measured by all commercial soil moisture sensors in the soil bottom layer (0.3–0.6 m): 10HS (a), 5TE (b), CS616 (c), TDR315 (d), GS1 (e), CS655 (f), Hydra Probe (g), TDR315L (h), GS3 (i), CS650 (j), TDT-ACC-SEN-SDI (k), and TDR310S (l). Each data point is the average of the three samples of the soils taken from each of the three replications by soil series (n = 9).


Table 1.
Information on the capacitance sensors tested in this study.
| Manufacturer | # | Measuring Technique 1 | Sensor Model | Response Variables 2 | Volumetric Water Content (θv) 3 | Literature |
|---|---|---|---|---|---|---|
| Decagon | 1 | FDR | 10HS | Voltage | (2.97 × 10⁻⁹) (mV3) − (7.37 × 10⁻⁶) (mV2) + (6.69 × 10⁻³) (mV) − 1.92 | [30] |
| 2 | FDR | GS1 | Voltage | 4.94 × 10⁻⁴ × mV – 0.554 | [31] | |
| 3 | FDR | GS3 | Ɛ, ECb, T | 5.89 × 10⁻⁶ Ɛ3a − 7.62 × 10⁻⁴ Ɛ2a + 3.67 × 10⁻² Ɛa − 7.53 × 10⁻² | [32] | |
| 4 | FDR | 5TE | Ɛ, ECb, T | 4.3 × 10⁻⁶ Ɛ3a − 5.5 × 10⁻⁴ Ɛ2a + 2.92 × 10⁻² Ɛa − 5.3 × 10⁻² | [33] | |
| Campbell Scientific | 5 | TLO | CS655 | Ɛ, ECb, T | 4.3 × 10⁻⁶ Ɛ3a − 5.5 × 10⁻⁴ Ɛ2a + 2.92 × 10⁻² Ɛa − 5.3 × 10⁻² | [26] |
| 6 | TLO | CS650 | Ɛ, ECb, T | 4.3 × 10⁻⁶ Ɛ3a − 5.5 × 10⁻⁴ Ɛ2a + 2.92 × 10⁻² Ɛa − 5.3 × 10⁻² | [26] | |
| 7 | TLO | CS616 | Period | 0.0007 × τ2 + ((−0.0063) × τ) + (−0.0663) | [34] | |
| Stevens Water | 8 | TDR | Hydra Probe | Ɛ, Ɛ’, ECb, T | [35] | |
| Acclima | 9 | TDR | TDR-315L | Ɛ, ECb, ECw, T | 4.3 × 10⁻⁶ Ɛ3a − 5.5 × 10⁻⁴ Ɛ2a + 2.92 × 10⁻² Ɛa − 5.3 × 10⁻² | [36] |
| 10 | TDR | TDR-315 | Ɛ, ECb, ECw, T | 4.3 × 10⁻⁶ Ɛ3a − 5.5 × 10⁻⁴ Ɛ2a + 2.92 × 10⁻² Ɛa − 5.3 × 10⁻² | [36] | |
| 11 | TDR | TDR-310S | Ɛ, ECb, ECw, T | 4.3 × 10⁻⁶ Ɛ3a − 5.5 × 10⁻⁴ Ɛ2a + 2.92 × 10⁻² Ɛa − 5.3 × 10⁻² | [36] | |
| 12 | TDT | TDT ACC-SEN-SDI | Ɛ, EC, T | 4.3 × 10⁻⁶ Ɛ3a − 5.5 × 10⁻⁴ Ɛ2a + 2.92 × 10⁻² Ɛa − 5.3 × 10⁻² | [37] |
1 FDR: Frequency Domain Reflectometry; TLO: Transmission Line Oscillation; TDR: Time Domain Reflectometry; and TDT: Time Domain Transmissometry. 2 Ɛ: dielectric constant; ECb: electrical conductivity; T: temperature; ECw: electrical conductivity in soil pores; Ɛ’: imaginary dielectric constant. 3 General calibration equation for most mineral soil types according to manufacturers. Sensor prongs/rods length (cm): #1: 10, #2: 5.2, #3: 5.5, #4: 5.0, #5: 12.0, #6: 30.0, #7: 30.0, #8: 12.4, #9: 20.0, #10: 20.0, #11: 15.0, and #12: 20.0.
Table 2.
Physical properties of soils tested.
| Soil | Sample Depth | Bulk Density (g cm−3) | Specific Gravity (unitless) |
|---|---|---|---|
| Pineda | Top (0.0–0.3 m) | 1.65 | 2.63 |
| Bottom (0.3–0.6 m) | 1.56 | 2.62 | |
| Riviera | Top (0.0–0.3 m) | 1.54 | 2.65 |
| Bottom (0.3–0.6 m) | 1.51 | 2.64 | |
| Astatula | Top (0.0–0.3 m) | 1.49 | 2.64 |
| Bottom (0.3–0.6 m) | 1.52 | 2.63 | |
| Candler | Top (0.0–0.3 m) | 1.51 | 2.66 |
| Bottom (0.3–0.6 m) | 1.54 | 2.64 | |
| Immokalee | Top (0.0–0.3 m) | 1.38 | 2.58 |
| Bottom (0.3–0.6 m) | 1.37 | 2.63 |
Table 3.
Comparative analysis of θv by sensors and the gravimetric method, where: RMSE = Root mean square error, R2 = coefficient of determination, and CV = coefficient of variation for each sensor evaluated. The RMSE, R2, and CV for each sensor were computed across the three replications by soil series, soil depths, and amount of water added per sample (n = 540).
| Manufacturer | Sensor | Measuring Technique | RMSE (m3 m−3) | R2 | CV (%) |
|---|---|---|---|---|---|
| Meter Group | 10HS | FDR | 0.041 | 0.81 | 32.17 |
| GS1 | FDR | 0.026 | 0.92 | 20.48 | |
| GS3 | FDR | 0.049 | 0.72 | 39.16 | |
| 5TE | FDR | 0.026 | 0.92 | 20.45 | |
| Campbell Scientific | CS650 | TLO | 0.035 | 0.86 | 27.66 |
| CS655 | TLO | 0.029 | 0.90 | 22.65 | |
| CS616 | TLO | 0.032 | 0.86 | 25.46 | |
| Stevens Water | Hydra Probe | TDR | 0.037 | 0.84 | 29.11 |
| Acclima | TDR315L | TDR | 0.026 | 0.92 | 20.89 |
| TDR315 | TDR | 0.028 | 0.91 | 22.58 | |
| TDR310S | TDR | 0.023 | 0.93 | 18.23 | |
| TDT-ACC-SEN-SDI | TDT | 0.029 | 0.90 | 23.28 |
Table 4.
Soil-specific calibration equations for commercial soil moisture sensors in the Pineda soil series.
Table 4.
Soil-specific calibration equations for commercial soil moisture sensors in the Pineda soil series.
| Sensor | Soil Depth (m) | Soil-Specific Equation 1 | R2 |
|---|---|---|---|
| 10HS | 0.0–0.3 0.3–0.6 | 0.85 0.83 | |
| GS1 | 0.0–0.3 0.3–0.6 | 0.98 0.98 | |
| GS3 | 0.0–0.3 0.3–0.6 | 0.97 0.98 | |
| 5TE | 0.0–0.3 0.3–0.6 | 0.99 0.99 | |
| CS655 | 0.0–0.3 0.3–0.6 | 0.99 0.99 | |
| CS650 | 0.0–0.3 0.3–0.6 | 0.99 0.99 | |
| CS616 | 0.0–0.3 0.3–0.6 | 0.99 0.97 | |
| Hydra Probe | 0.0–0.3 0.3–0.6 | 0.97 0.99 | |
| TDR315L | 0.0–0.3 0.3–0.6 | 0.99 0.99 | |
| TDR315 | 0.0–0.3 0.3–0.6 | 0.99 0.99 | |
| TDR310S | 0.0–0.3 0.3–0.6 | 0.93 0.93 | |
| TDT-ACC-SEN-SDI | 0.0–0.3 0.3–0.6 | 0.99 0.99 |
1 Variable corresponds to the response value of the sensor (voltage, period, or dielectric constant). The obtained result from each equation is the soil volumetric water content (θv). Measuring technique: Frequency Domain Reflectometry—FDR (10HS, GS1, GS3, and 5TE); Transmission Line Oscillation—TLO (CS655, CS650, and CS616); Time Domain Reflectometry—TDR (Hydra Probe, TDR−315L, TDR−315, and TDR−310S); and Time Domain Transmissometry—TDT (TDT-ACC-SEN-SDI).
Table 5.
Soil-specific calibration equations for commercial soil moisture sensors in the Riviera soil series.
Table 5.
Soil-specific calibration equations for commercial soil moisture sensors in the Riviera soil series.
| Sensor | Soil Depth (m) | Soil-Specific Equation 1 | R2 |
|---|---|---|---|
| 10HS | 0.0–0.3 0.3–0.6 | 0.84 0.81 | |
| GS1 | 0.0–0.3 0.3–0.6 | 0.98 0.87 | |
| GS3 | 0.0–0.3 0.3–0.6 | 0.95 0.90 | |
| 5TE | 0.0–0.3 0.3–0.6 | 0.98 0.98 | |
| CS655 | 0.0–0.3 0.3–0.6 | 0.99 0.96 | |
| CS650 | 0.0–0.3 0.3–0.6 | 0.98 0.95 | |
| CS616 | 0.0–0.3 0.3–0.6 | 0.95 0.92 | |
| Hydra Probe | 0.0–0.3 0.3–0.6 | 0.86 0.96 | |
| TDR315L | 0.0–0.3 0.3–0.6 | 0.99 0.98 | |
| TDR315 | 0.0–0.3 0.3–0.6 | 0.98 0.99 | |
| TDR310S | 0.0–0.3 0.3–0.6 | 0.97 0.96 | |
| TDT-ACC-SEN-SDI | 0.0–0.3 0.3–0.6 | 0.97 0.94 |
1 Variable corresponds to the response value of the sensor (voltage, period, or dielectric constant). The obtained result from each equation is the soil volumetric water content (θv). Measuring technique: Frequency Domain Reflectometry—FDR (10HS, GS1, GS3, and 5TE); Transmission Line Oscillation—TLO (CS655, CS650, and CS616); Time Domain Reflectometry—TDR (Hydra Probe, TDR−315L, TDR−315, and TDR−310S); and Time Domain Transmissometry—TDT (TDT-ACC-SEN-SDI).
Table 6.
Soil-specific calibration equations for commercial soil moisture sensors in the Candler soil series.
Table 6.
Soil-specific calibration equations for commercial soil moisture sensors in the Candler soil series.
| Sensor | Soil Depth (m) | Soil-Specific Equation 1 | R2 |
|---|---|---|---|
| 10HS | 0.0–0.3 0.3–0.6 | 0.81 0.88 | |
| GS1 | 0.0–0.3 0.3–0.6 | 0.95 0.97 | |
| GS3 | 0.0–0.3 0.3–0.6 | 0.96 0.89 | |
| 5TE | 0.0–0.3 0.3–0.6 | 0.93 0.94 | |
| CS655 | 0.0–0.3 0.3–0.6 | 0.94 0.96 | |
| CS650 | 0.0–0.3 0.3–0.6 | 0.92 0.98 | |
| CS616 | 0.0–0.3 0.3–0.6 | 0.92 0.98 | |
| Hydra Probe | 0.0–0.3 0.3–0.6 | 0.92 0.93 | |
| TDR315L | 0.0–0.3 0.3–0.6 | 0.96 0.99 | |
| TDR315 | 0.0–0.3 0.3–0.6 | 0.94 0.98 | |
| TDR310S | 0.0–0.3 0.3–0.6 | 0.92 0.97 | |
| TDT-ACC-SEN-SDI | 0.0–0.3 0.3–0.6 | 0.93 0.93 |
1 Variable corresponds to the response value of the sensor (voltage, period, or dielectric constant). The obtained result from each equation is the soil volumetric water content (θv). Measuring technique: Frequency Domain Reflectometry—FDR (10HS, GS1, GS3, and 5TE); Transmission Line Oscillation—TLO (CS655, CS650, and CS616); Time Domain Reflectometry—TDR (Hydra Probe, TDR−315L, TDR−315, and TDR−310S); and Time Domain Transmissometry—TDT (TDT-ACC-SEN-SDI).
Table 7.
Soil-specific calibration equations for commercial soil moisture sensors in the Astatula soil series.
Table 7.
Soil-specific calibration equations for commercial soil moisture sensors in the Astatula soil series.
| Sensor | Soil Depth (m) | Soil-Specific Equation 1 | R2 |
|---|---|---|---|
| 10HS | 0.0–0.3 0.3–0.6 | 0.91 0.87 | |
| GS1 | 0.0–0.3 0.3–0.6 | 0.99 0.46 | |
| GS3 | 0.0–0.3 0.3–0.6 | 0.93 0.87 | |
| 5TE | 0.0–0.3 0.3–0.6 | 0.96 0.98 | |
| CS655 | 0.0–0.3 0.3–0.6 | 0.99 0.96 | |
| CS650 | 0.0–0.3 0.3–0.6 | 0.99 0.99 | |
| CS616 | 0.0–0.3 0.3–0.6 | 0.96 0.92 | |
| Hydra Probe | 0.0–0.3 0.3–0.6 | 0.90 0.97 | |
| TDR315L | 0.0–0.3 0.3–0.6 | 0.97 0.97 | |
| TDR315 | 0.0–0.3 0.3–0.6 | 0.94 0.94 | |
| TDR310S | 0.0–0.3 0.3–0.6 | 0.93 0.93 | |
| TDT-ACC-SEN-SDI | 0.0–0.3 0.3–0.6 | 0.92 0.95 |
1 Variable corresponds to the response value of the sensor (voltage, period, or dielectric constant). The obtained result from each equation is the soil volumetric water content (θv). Measuring technique: Frequency Domain Reflectometry—FDR (10HS, GS1, GS3, and 5TE); Transmission Line Oscillation—TLO (CS655, CS650, and CS616); Time Domain Reflectometry—TDR (Hydra Probe, TDR−315L, TDR−315, and TDR−310S); and Time Domain Transmissometry—TDT (TDT-ACC-SEN-SDI).
Table 8.
Soil-specific calibration equations for commercial soil moisture sensors in the Immokalee soil series.
Table 8.
Soil-specific calibration equations for commercial soil moisture sensors in the Immokalee soil series.
| Sensor | Soil Depth (m) | Soil-Specific Equation1 | R2 |
|---|---|---|---|
| 10HS | 0.0–0.3 0.3–0.6 | 0.96 0.92 | |
| GS1 | 0.0–0.3 0.3–0.6 | 0.99 0.95 | |
| GS3 | 0.0–0.3 0.3–0.6 | 0.94 0.97 | |
| 5TE | 0.0–0.3 0.3–0.6 | 0.98 0.99 | |
| CS655 | 0.0–0.3 0.3–0.6 | 0.99 0.99 | |
| CS650 | 0.0–0.3 0.3–0.6 | 0.99 0.99 | |
| CS616 | 0.0–0.3 0.3–0.6 | 0.99 0.99 | |
| Hydra Probe | 0.0–0.3 0.3–0.6 | 0.98 0.96 | |
| TDR315L | 0.0–0.3 0.3–0.6 | 0.99 0.99 | |
| TDR315 | 0.0–0.3 0.3–0.6 | 0.99 0.99 | |
| TDR310S | 0.0–0.3 0.3–0.6 | 0.99 0.97 | |
| TDT-ACC-SEN-SDI | 0.0–0.3 0.3–0.6 | 0.99 0.79 |
1 Variable corresponds the response value of the sensor (voltage, period, or dielectric constant). The obtained result from each equation is the soil volumetric water content (θv). Measuring technique: Frequency Domain Reflectometry—FDR (10HS, GS1, GS3, and 5TE); Transmission Line Oscillation—TLO (CS655, CS650, and CS616); Time Domain Reflectometry—TDR (Hydra Probe, TDR−315L, TDR−315, and TDR−310S); and Time Domain Transmissometry—TDT (TDT-ACC-SEN-SDI).
© 2020 by the authors. Licensee MDPI, Basel, Switzerland. This article is an open access article distributed under the terms and conditions of the Creative Commons Attribution (CC BY) license (http://creativecommons.org/licenses/by/4.0/).
Share and Cite
MDPI and ACS Style
Ferrarezi, R.S.; Nogueira, T.A.R.; Zepeda, S.G.C. Performance of Soil Moisture Sensors in Florida Sandy Soils. Water 2020, 12, 358. https://doi.org/10.3390/w12020358
AMA Style
Ferrarezi RS, Nogueira TAR, Zepeda SGC. Performance of Soil Moisture Sensors in Florida Sandy Soils. Water. 2020; 12(2):358. https://doi.org/10.3390/w12020358
Chicago/Turabian StyleFerrarezi, Rhuanito Soranz, Thiago Assis Rodrigues Nogueira, and Sara Gabriela Cornejo Zepeda. 2020. "Performance of Soil Moisture Sensors in Florida Sandy Soils" Water 12, no. 2: 358. https://doi.org/10.3390/w12020358
Note that from the first issue of 2016, this journal uses article numbers instead of page numbers. See further details here.