Does Salinity Affect the Distribution of the Artificial Radionuclides 90Sr and 137Cs in Water of the Saline Lakes? A Case of the Crimean Peninsula


Abstract
:1. Introduction
2. Materials and Methods
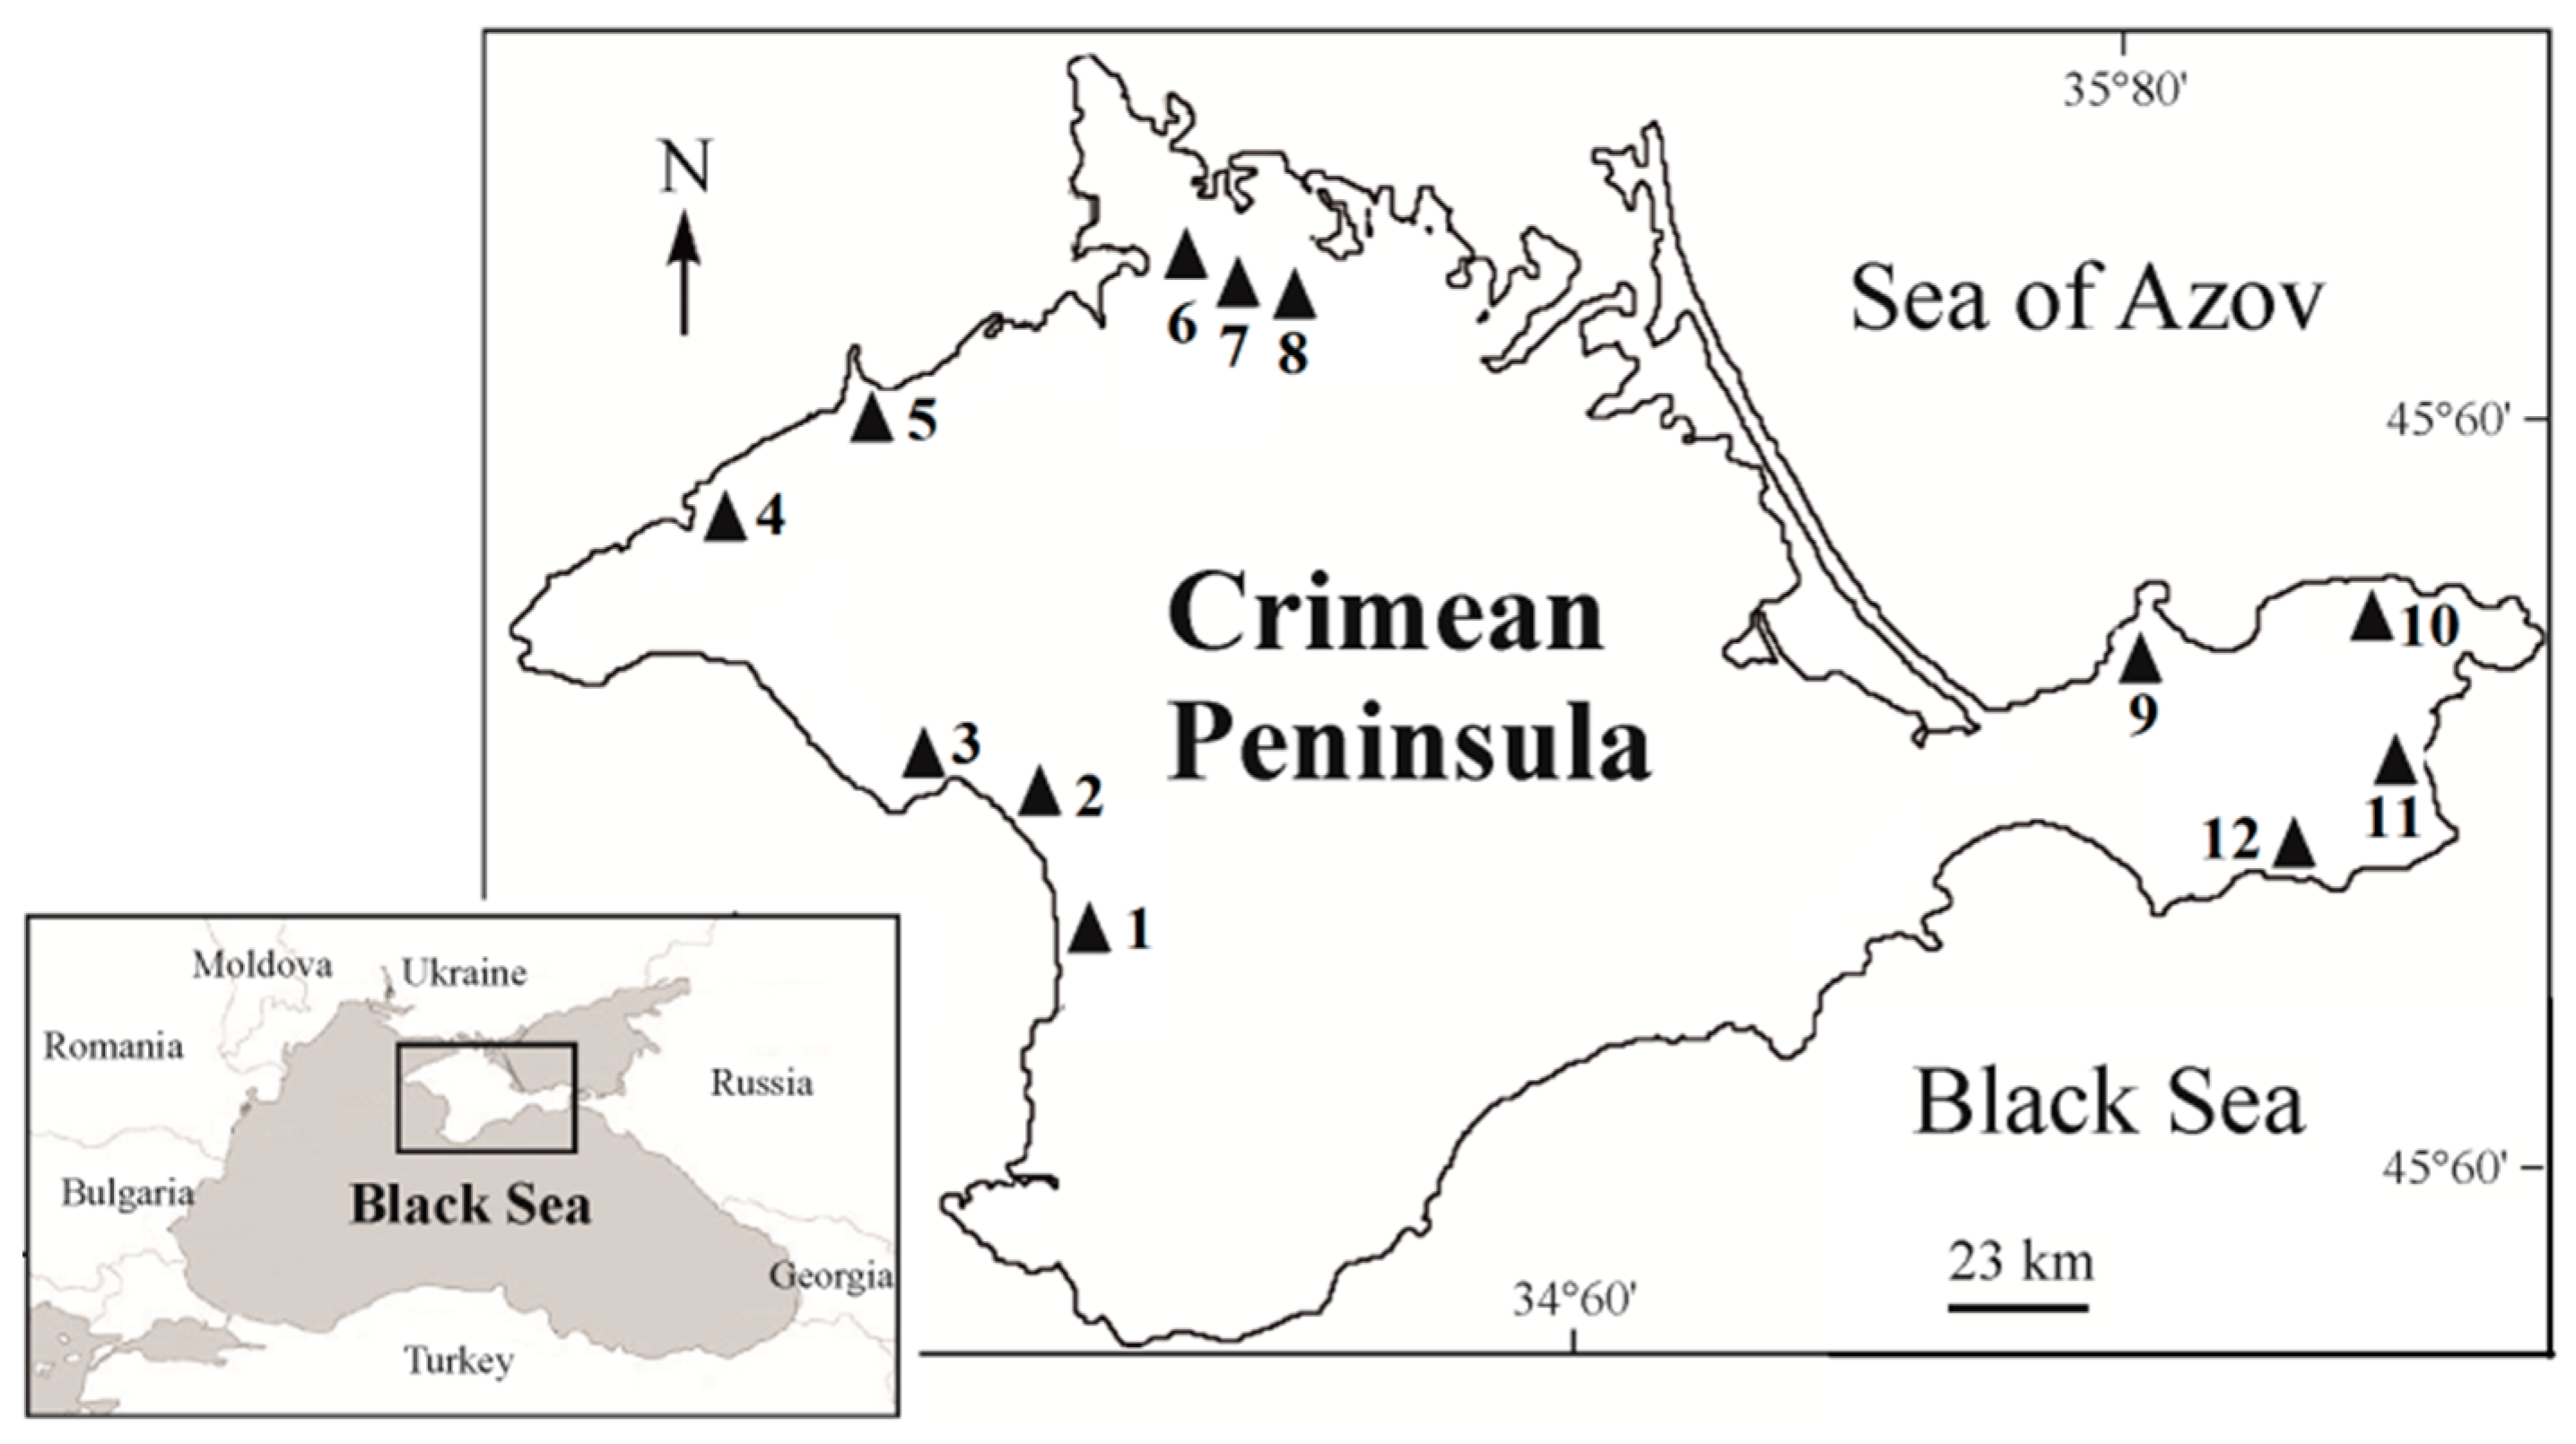
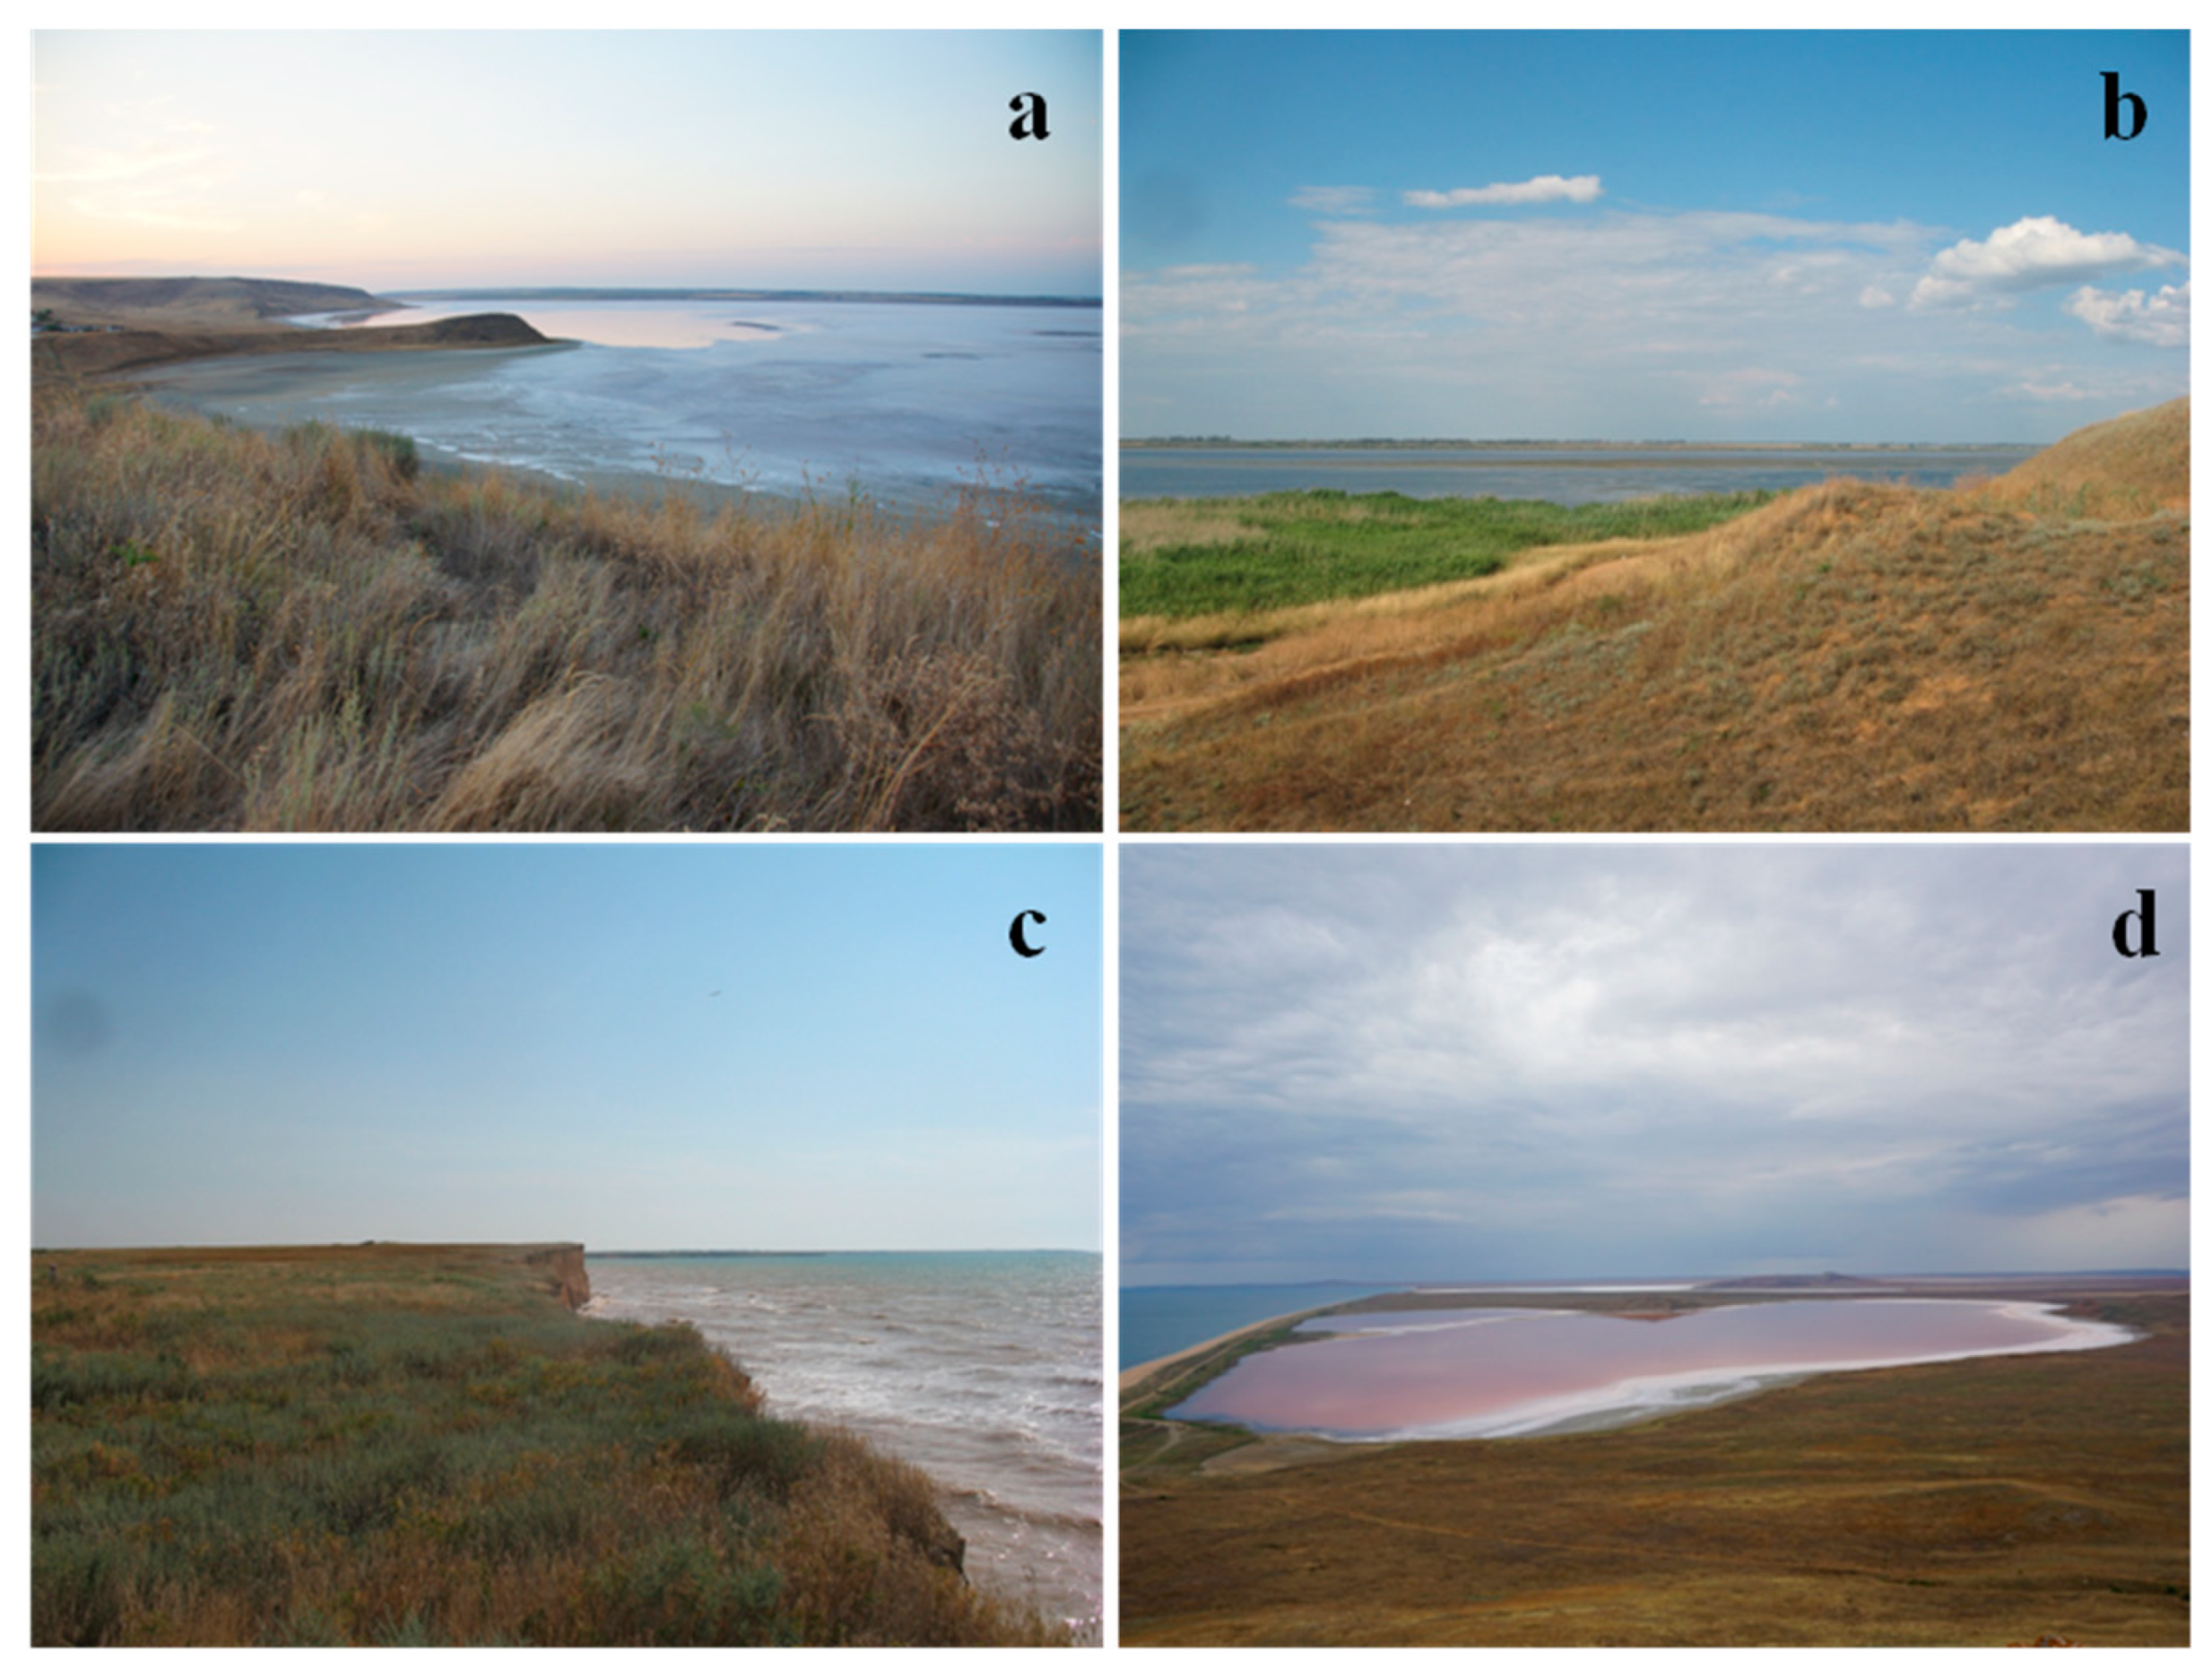
2.1. Studied Lakes
2.2. Method of Determination of the 90Sr
2.3. Gamma-Spectrometric Measurements of 137Cs
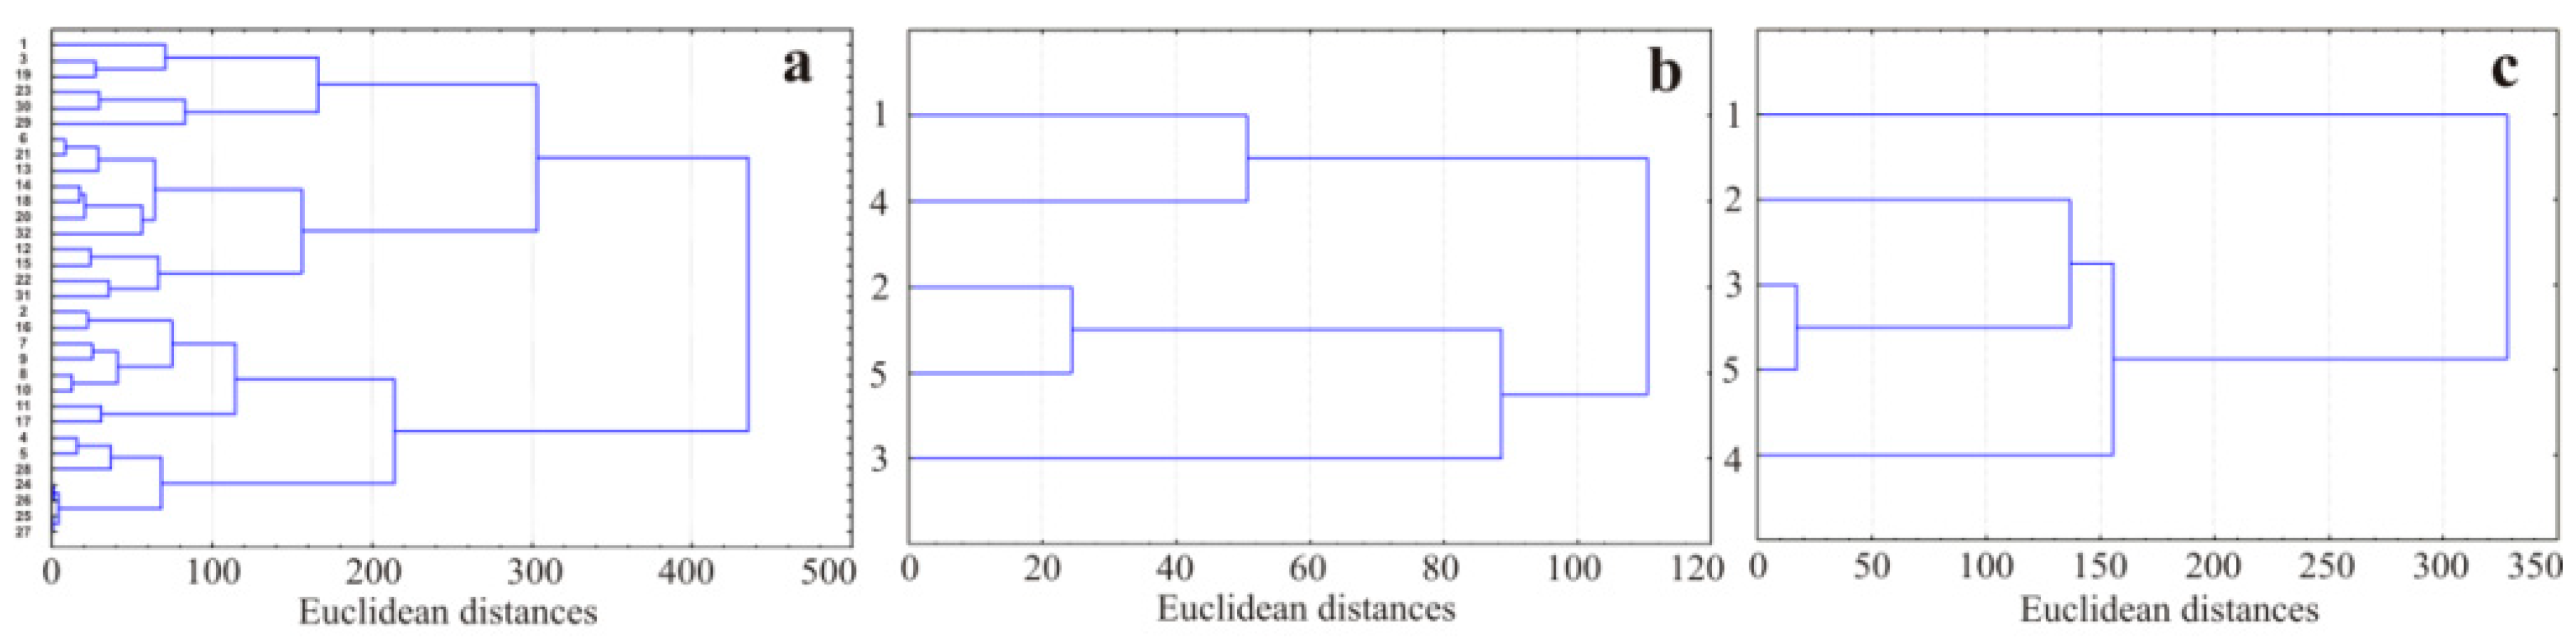
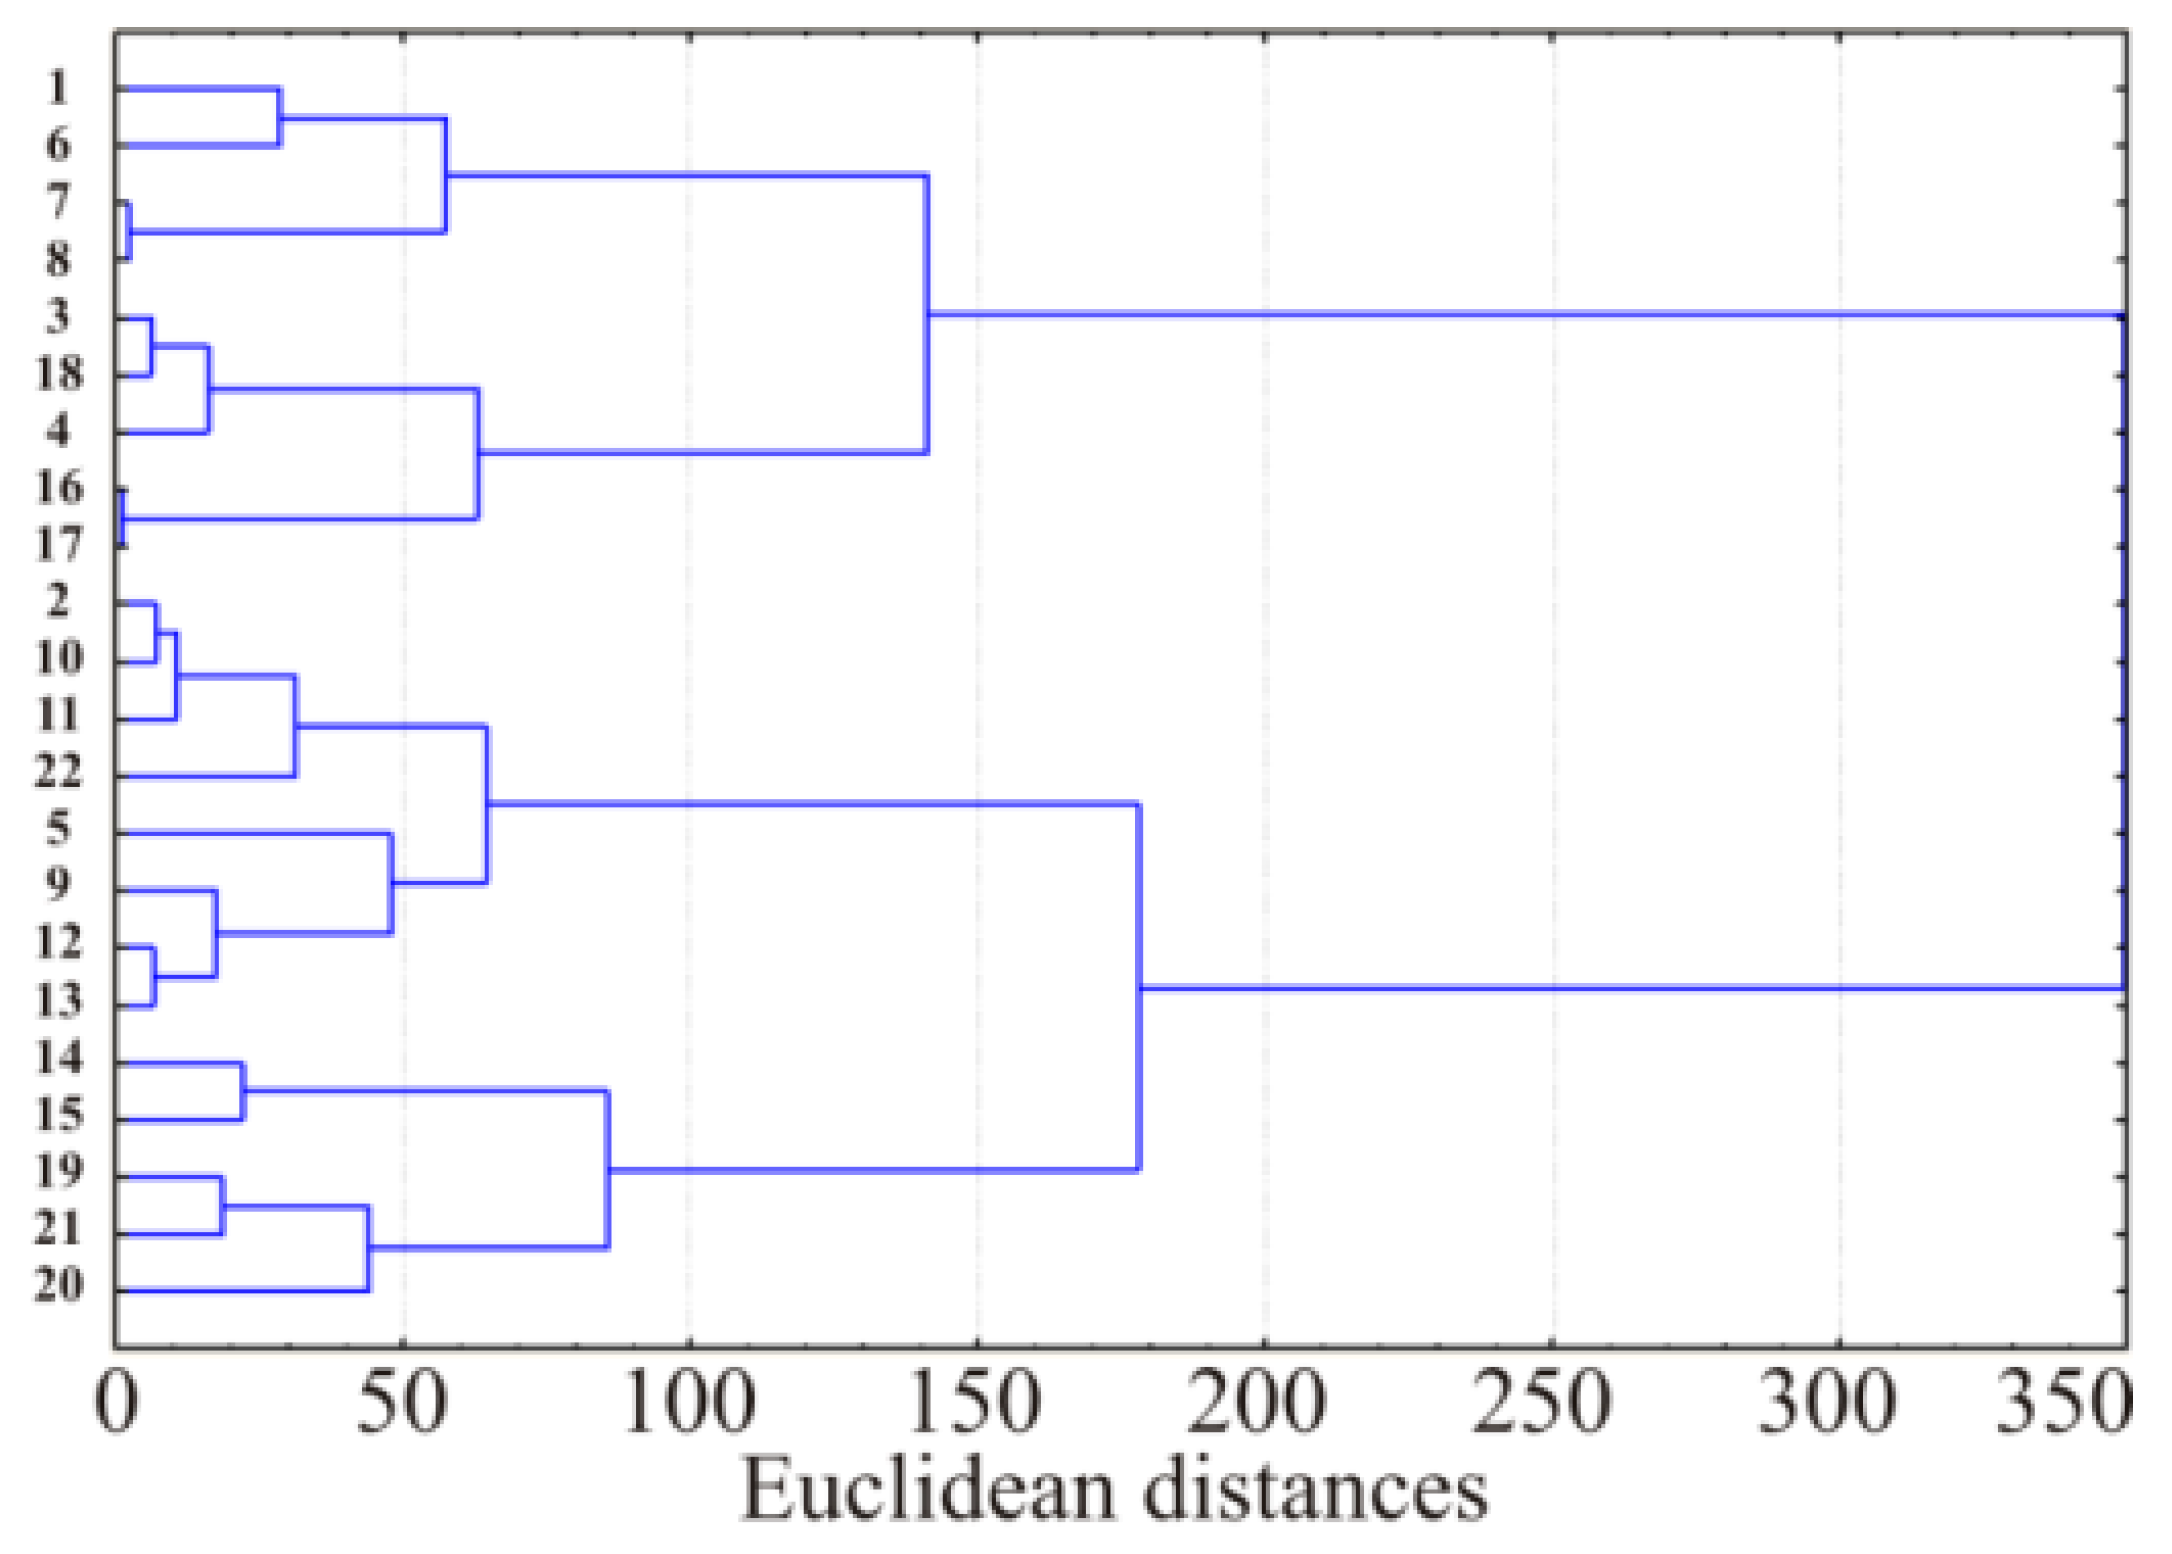
2.4. Data Analysis
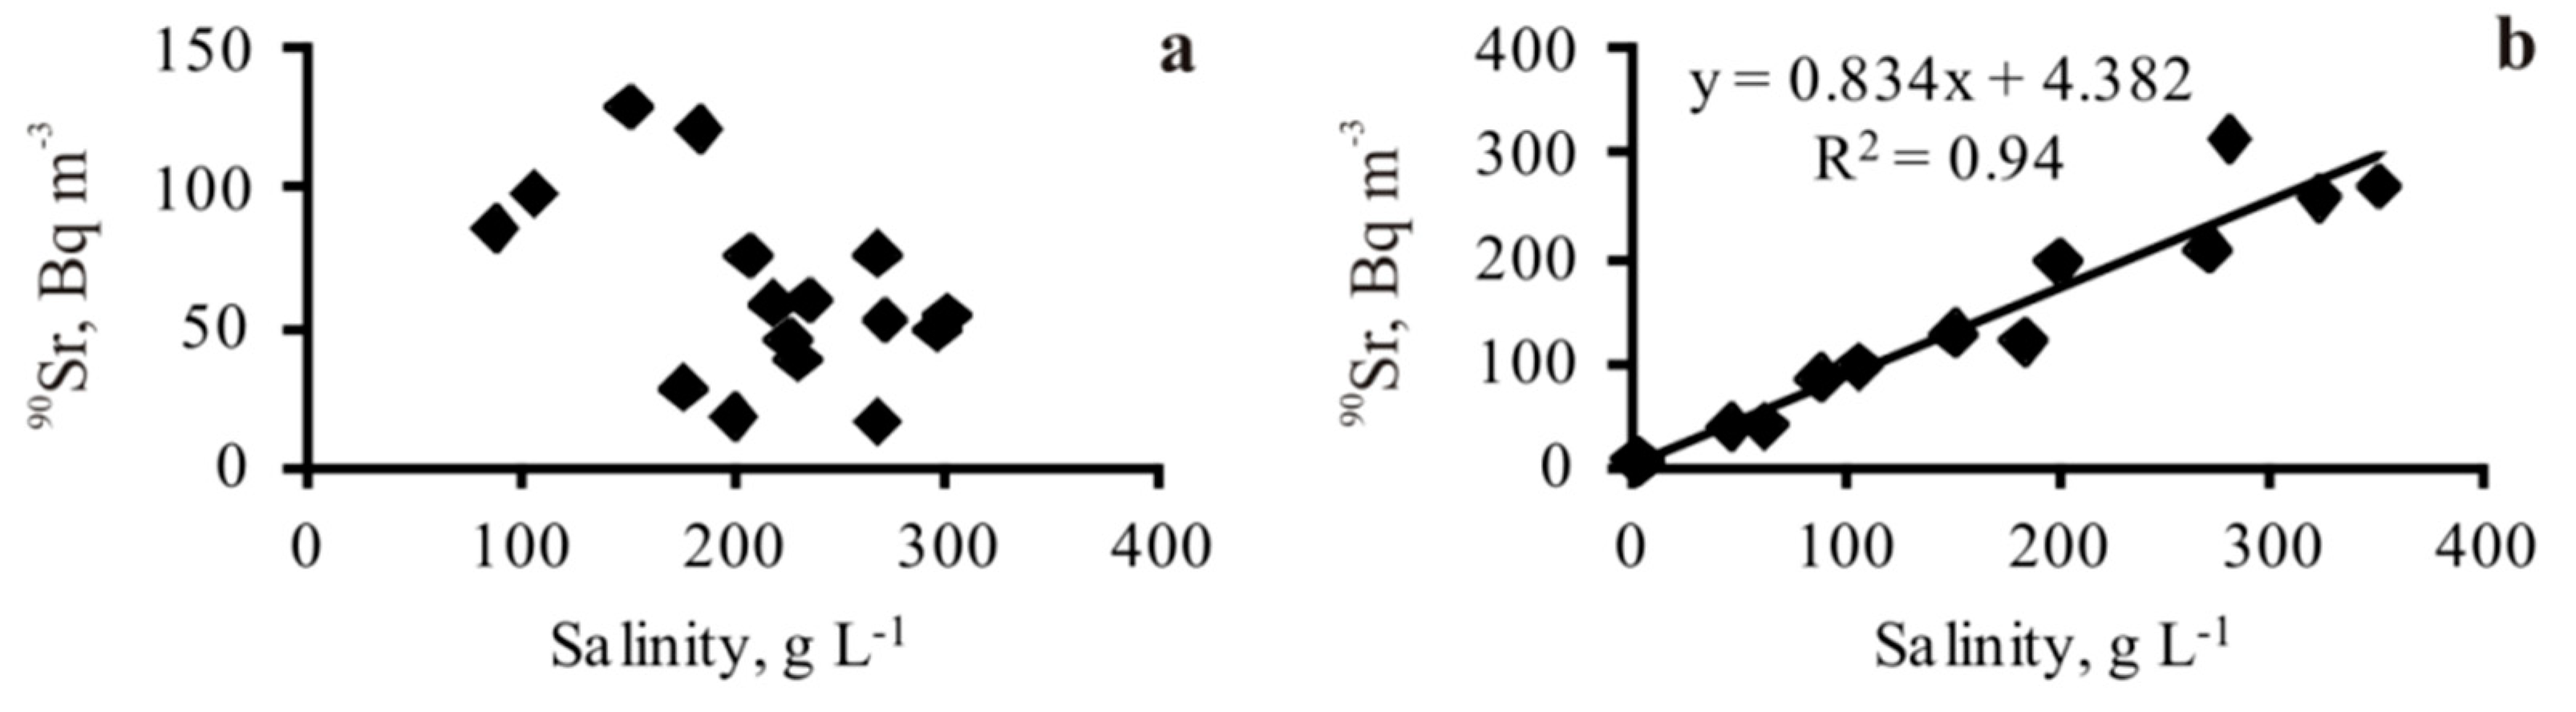
3. Results
4. Discussion
5. Conclusions
Author Contributions
Funding
Acknowledgments
Conflicts of Interest
References
- Aarkrog, A. Source terms and inventories of anthropogenic radionuclides. In Radioecology. Lectures in Environmental Radioactivity; Holm, E., Ed.; World Scientific Publishing: Lund, Sweden, 1994; pp. 21–38. [Google Scholar]
- Aarkrog, A. Input of anthropogenic radionuclides into the World Ocean. Deep Sea Res. Part II 2003, 50, 2597–2606. [Google Scholar] [CrossRef]
- Kessides, I.N. The future of the nuclear industry reconsidered: Risks, uncertainties, and continued promise. Energy Policy 2012, 48, 185–208. [Google Scholar] [CrossRef]
- Brumfiel, G. Directly Comparing Fukushima to Chernobyl. Nature News Blog. 2011. Available online: http://blogs.nature.com/news/2011/09/directly_comparing_fukushima_t.html (accessed on 8 August 2018).
- Brinkmann, L.; Rowan, D.J. Vulnerability of Canadian aquatic ecosystems to nuclear accidents. Ambio 2018, 47, 585–594. [Google Scholar] [CrossRef] [Green Version]
- Hakanson, L.; Andersson, T.; Nilsson, A. Radioactive cesium in fish in Swedish lakes 1986–1988 general pattern related to fallout and lake characteristics. J. Environ. Radioact. 1992, 15, 207–229. [Google Scholar] [CrossRef]
- Fuller, N.; Lerebours, A.; Smith, J.T.; Ford, A.T. The biological effects of ionising radiation on Crustaceans: A review. Aquat. Toxicol. 2015, 167, 55–67. [Google Scholar] [CrossRef]
- Rikhvanov, L.P. Common and Regional Problems of Radioecology; Publishing house of Tomsk Polytechnic University: Tomsk, Russia, 1997; 384p. (in Russian) [Google Scholar]
- Izrael, Y.A. Radioactive contamination of the Earth’s surface. Her. Russ. Acad. Sci. 1998, 68, 116–131. (In Russian) [Google Scholar]
- Gudiksen, P.H.; Harvey, T.F.; Lange, R. Chernobyl source term, atmospheric dispersion and dose estimation. Health Phys. 1989, 57, 697–705. [Google Scholar] [CrossRef] [PubMed] [Green Version]
- Polikarpov, G.G.; Egorov, V.N.; Gulin, S.B.; Stokozov, N.A.; Lazorenko, G.E.; Mirzoyeva, N.Y.; Tereschenko, N.N.; Tsitsugina, V.G.; Kulebakina, L.G.; Popovichev, V.N.; et al. Radioecological Response of the Black Sea to the Chernobyl Accident; EKOSI-Gidrofizika: Sevastopol, Russia, 2008; 667p. (In Russian) [Google Scholar]
- Mirzoyeva, N.Y.; Kulebakina, L.G. Methods of radiochemical determination of 90Sr in environmental samples. In Radioecological Response of the Black Sea to the Chernobyl NPP Accident; Polikarpov, G.G., Egorov, V.N., Eds.; EKOSI-Gidrofizika: Sevastopol, Russia, 2008; pp. 56–61. (In Russian) [Google Scholar]
- Gulin, S.B.; Mirzoyeva, N.Y.; Egorov, V.N.; Polikarpov, G.G.; Sidorov, I.G.; Proskurnin, V.Y. Secondary radioactive contamination of the Black Sea after Chernobyl accident: Recent levels, pathways and trends. J. Environ. Radioact. 2013, 124, 50–56. [Google Scholar] [CrossRef] [PubMed]
- Gulin, S.B.; Mirzoyeva, N.Y.; Lazorenko, G.E.; Egorov, V.N.; Trapeznikov, A.V.; Sidorov, I.G.; Proskurnin, V.Y.; Popovichev, V.N.; Bey, O.N.; Rodina, E.A. Contemporary radiological situation related to regime of the functioning of the North-Crimean Canal. Radiat. Biol. Radioekol. 2016, 56, 1–8. (In Russian) [Google Scholar]
- Kuzmenko, M.I.; Volkova, E.N.; Klenus, V.G. Radioactive contamination of the Dnieper and its reservoirs and some measures after the Chernobyl accident. Hydrobiol. J. 1992, 28, 51–86. (In Russian) [Google Scholar]
- Mirzoyeva, N.Y.; Arkhipova, S.I.; Kravchenko, N.V. Sources of inflow and nature of redistribution of 90Sr in the salt lakes of the Crimea. J. Environ. Radioact. 2018, 188, 38–46. [Google Scholar] [CrossRef] [PubMed]
- Mirzoyeva, N.Y.; Egorov, V.N.; Gulin, S.B. Radionuclides137Cs and90Sr in components of the Black Sea ecosystems: Contemporary status and prognosis. In Diversity in the Coastal Marine Sciences: Historical Perspectives and Contemporary Research of Geology, Physics, Chemistry, Biology and Remote Sensing; Finkl, C.W., Makowski, C., Eds.; Springer: Dordrecht, The Netherlands, 2018; Chapter 17; pp. 275–294. [Google Scholar]
- Kurnakov, N.S.; Kuznetsov, V.G.; Dzens-Lytovsky, A.I.; Ravich, M.I. The Crimean Salt Lakes; AN USSR Publ.: Moscow, Russia, 1936; 278p. (In Russian) [Google Scholar]
- Anufriieva, E.; Hołyńska, M.; Shadrin, N. Current invasions of Asian Cyclopid species (Copepoda: Cyclopidae) in Crimea, with taxonomical and zoogeographical remarks on the hypersaline and freshwater fauna. Ann. Zool. 2014, 64, 109–130. [Google Scholar] [CrossRef] [Green Version]
- Anufriieva, E.; Shadrin, N. Resting stages of crustaceans in the Crimean hypersaline lakes (Ukraine) and their ecological role. Acta Geol. Sin. Eng. Ed. 2014, 88, 46–49. [Google Scholar] [CrossRef]
- Shadrin, N.V.; Anufriieva, E.V.; Belyakov, V.P.; Bazhora, A.I. Chironomidae larvae in hypersaline waters of the Crimea: Diversity, distribution, abundance and production. Eur. Zool. J. 2017, 84, 61–72. [Google Scholar] [CrossRef]
- Shadrin, N.; Zheng, M.; Oren, A. Past, present and future of saline lakes: Research for global sustainable development. Chin. J. Oceanol. Limnol. 2015, 33, 1349–1353. [Google Scholar] [CrossRef]
- Denisova, A.I.; Timchenko, V.M.; Nakhshina, E.P.; Novikov, B.I.; Ryabov, A.K.; Bass, Y.I. Hydrology and Hydrochemistry of the Dnieper and its Reservoirs; Naukova Dumka: Kiev, Ukraine, 1989; 216p. (In Russian) [Google Scholar]
- Shadrin, N.V.; Anufriieva, E.V.; Kipriyanova, L.M.; Kolesnikova, E.A.; Latushkin, A.A.; Romanov, R.E.; Sergeeva, N.G. The political decision caused the drastic ecosystem shift of the Sivash Bay (the Sea of Azov). Quatern. Int. 2018, 475, 4–10. [Google Scholar] [CrossRef]
- Gulin, S.B.; Gulina, L.V. Natural and technogenic radionuclides in ecosystem of the salt lake Koyashskoye (south-eastern Crimea). Mar. Ecol. J. 2011, 1, 19–25. (In Russian) [Google Scholar]
- Mirzoyeva, N.; Gulina, L.; Gulin, S.; Plotitsina, O.; Stetsuk, A.; Arkhipova, S.; Korkishko, N.; Eremin, O. Radionuclides and mercury in the salt lakes of the Crimea. Chin. J. Oceanol. Limnol. 2015, 33, 1413–1425. [Google Scholar] [CrossRef]
- Mirzoyeva, N.Y.; Arkhipova, S.I.; Anufriieva, E.V.; Shadrin, N.V. Marine hypersaline lakes of the Kerch Peninsula and the differences in their responses to external influences: 90SR concentration after the Chernobyl accident Indicators of climatic changes. In Indicators of Climatic Changes in Marine Ecosystems; Berdnikov, S.V., Yaitskaya, N.A., Lychagina, Y.M., Eds.; SSC RAS Publishers: Rostov-on-Don, Russia, 2016; pp. 52–59. [Google Scholar]
- Khlebovich, V.V. Critical Salinity of Biological Processes; Nauka: Leningrad, Russia, 1974; 236p. (In Russian) [Google Scholar]
- Williams, W.D. Salinity as a determinant of the structure of biological communities in the salt lakes. Hydrobiologia 1998, 381, 191–201. [Google Scholar] [CrossRef]
- Khlebovich, V.V.; Aladin, N.V. The salinity factor in animal life. Her. Russ. Acad. Sci. 2010, 80, 299–304. [Google Scholar] [CrossRef]
- Shadrin, N. Hypersaline lakes as the polyextreme habitats for life. In Introduction to Salt Lake Sciences; Zheng, M., Oren, A., Deng, T., Eds.; Science Press: Beijing, China, 2018; pp. 180–187. [Google Scholar]
- Shadrin, N.; Anufriieva, E. Ecosystems of hypersaline waters: Structure and trophic relations. Zh. Obshch. Biol. 2018, 79, 418–427. (In Russian) [Google Scholar]
- Shadrin, N. Peculiarities of structure, functioning and dynamics of the salt lake ecosystems. In Introduction to Salt Lake Sciences; Zheng, M., Oren, A., Deng, T., Eds.; Science Press: Beijing, China, 2018; pp. 188–197. [Google Scholar]
- Shadrin, N.V.; Anufriieva, E.V. Climate change impact on the marine lakes and their Crustaceans: The case of marine hypersaline Lake Bakalskoye (Ukraine). Turk. J. Fish. Aquat. Sci. 2013, 13, 603–611. [Google Scholar] [CrossRef]
- Bondarenko, L.V.; Yakovenko, V.A. Transformation of the crustacean species structure in Lake Moinaki in connection with its desalination. Visnyk of Dnipropetrovsk University. Biol. Ecol. 2000, 8, 100–105. (In Russian) [Google Scholar]
- Golubkov, S.M.; Shadrin, N.V.; Golubkov, M.S.; Balushkina, E.V.; Litvinchuk, L.F. Food chains and their dynamics in ecosystems of shallow lakes with different water salinities. Russ. J. Ecol. 2018, 49, 442–448. [Google Scholar] [CrossRef]
- Khomenko, S.V.; Shadrin, N.V. Iranian endemic Artemia urmiana in hypersaline Lake Koyashskoye (Crimea, Ukraine): A preliminary discussion of introduction by birds. Branta. Trans. Azov Black Sea Ornithol. Stn. 2009, 12, 81–91. (In Russian) [Google Scholar]
- Harvey, B.R.; Ibbett, R.D.; Lovett, M.B.; Williams, K.J. Analytical procedures for the determination of strontium radionuclides in environmental materials. In Aquatic Environment Protection: Analytical Methods; Ministry of Agriculture Fisheries and Food, Directorate of Fisheries Research: Lowestoft, UK, 1989; Volume 5, pp. 1–33. [Google Scholar]
- International Atomic Energy Agency (IAEA). AQCS: Catalogue for Reference Material Sandinter-Comparison Exercises 1998/1999; International Atomic Energy Agency (IAEA): Vienna, Austria, 1998; 136p. [Google Scholar]
- International Atomic Energy Agency (IAEA). Reference Materials Catalogue 2004–2005; International Atomic Energy Agency (IAEA): Vienna, Austria, 2004; 116p. [Google Scholar]
- Betenkov, N.D.; Kaftailov, V.V.; Bushkov, E.I. Sorption of cesium from solutions of the seawater type. Radiochemistry 1987, 29, 127–129. (In Russian) [Google Scholar]
- Bey, O.N.; Proscurnin, V.Y.; Gulin, S.B. Measurement of the Cs concentration from its own β-radiation using liquid scintillation spectrometry. Radiochemistry 2016, 58, 147–149. [Google Scholar] [CrossRef]
- Müller, P.H.; Neuman, P.; Storm, R. Tafeln der Mathematischen Statistik; VEB Fachbuchverlag: Leipzig, Germany, 1979; 272p. [Google Scholar]
- Hakanson, L. Great Lakes—Form and function, as exemplified using data from Lake Vanern, the fourth largest lake in Europe. In Great Lakes: Ecology, Management and Conservation; Donovan, J.S., Ed.; Nova Science Publishers: New York, NY, USA, 2010; pp. 1–39. [Google Scholar]
- Staehr, P.A.; Baastrup-Spohr, L.; Sand-Jensen, K.; Stedmon, C. Lake metabolism scales with lake morphometry and catchment conditions. Aquat. Sci. 2012, 74, 155–169. [Google Scholar] [CrossRef]
- Ponizovskii, A.M. Salt Resources of the Crimea; Crimea: Simferopol, Ukraine, 1965; 166p. (In Russian) [Google Scholar]
- Park, N.; Lee, J.; Chon, K.; Kang, H.; Cho, J. Investigating microbial activities of constructed wetlands with respect to nitrate and sulfate reduction. Desalin. Water Treat. 2009, 1, 172–179. [Google Scholar] [CrossRef]
- Glinka, N.L. General Chemistry; Mir: Moscow, Russia, 1970; 636p. (In Russian) [Google Scholar]
- Fanning, J.C. The solubilities of the alkali metal salts and the precipitation of Cs+ from aqueous solution. Coordin. Chem. Rev. 1995, 140, 27–36. [Google Scholar] [CrossRef]
- Fan, Q.H.; Tanaka, M.; Tanaka, K.; Sakaguchi, A.; Takahashi, Y. An EXAFS study on the effects of natural organic matter and the expandability of clay minerals on cesium adsorption and mobility. Geochim. Cosmochim. Acta 2014, 135, 49–65. [Google Scholar] [CrossRef]
- Garnier, J.M.; Ciffroy, P.; Benyahya, L. Implications of short and long term (30 days) sorption on the desorption kinetic of trace metals (Cd, Zn, Co, Mn, Fe, Ag, Cs) associated with river suspended matter. Sci. Total Environ. 2006, 366, 350–360. [Google Scholar] [CrossRef] [PubMed]
- Boulion, V.V.; Anokhin, L.E.; Arakelova, E.U. Primary production of the hyperhaline lakes in Crimea. Proc. Zool. Inst. 1989, 205, 14–25. (In Russian) [Google Scholar]
- Shadrin, N.; Kolesnikova, E.; Revkova, T.; Latushkin, A.; Chepyzhenko, A.; Dyakov, N.; Anufriieva, E. Macrostructure of benthos along a salinity gradient: The case of Sivash Bay (the Sea of Azov), the largest hypersaline lagoon worldwide. J. Sea Res. 2019, 154, 101811. [Google Scholar] [CrossRef]
- Timofeeva-Resovskaya, E.A. Distribution of radioisotopes in the main components of freshwater reservoirs. Tr. Inst. Biol. Ural. Fil. AN SSSR 1963, 30, 1–77. (In Russian) [Google Scholar]
- Horne, R.A. Marine Chemistry. The Structure of Water and the Chemistry of the Hydrosphere; Wiley InterScience: New York, NY, USA, 1974; 568p. [Google Scholar]
- Zheng, M. Saline Lakes and Salt Basin Deposits in China; Science Press: Beijing, China, 2014; 321p. [Google Scholar]
- Anufriieva, E.V.; Shadrin, N.V. Morphometric variability of Arctodiaptomus salinus (Copepoda) in the Mediterranean-Black Sea region. Zool. Res. 2015, 36, 328–336. [Google Scholar]
- RSS-99/2009. Radiation Safety Standards (NRB-99/2009): The Sanitary Rules and Regulations (SanR & R 2.6.1.2523–09): Approved. and Enter. in Force From 1 September 2009 to Replace SanR & R 2.6.1.758-99. Registered with the Ministry of Justice 14 August 2009, Reg. Number 14534. Available online: http://base.garant.ru/4188851/#1000 (accessed on 7 August 2018). (In Russian).


| Lake | Date | No. | Coordinates | Salinity, g/L | pH | Concentration, Bq/m3 | Source of Data | |
|---|---|---|---|---|---|---|---|---|
| 90Sr | 137Cs | |||||||
| Aktashskoye | 11.04.2016 | 1 | 45°22′22″ N 35°46′42″ E | 270 | 7.4 | 209.1 ± 13.8 | - | [27] |
| 08.06.2016 | 2 | 45°23.483′ N 35°50.515′ E | 89 | 8.5 | 85.8 ± 3.9 | 11.5 ± 0.5 | [16] | |
| 17.08.2017 | 3 | 45°23.144′ N 35°50.036′ E | 200 | 8.1 | 196.9 ± 9.9 | 14.9 ± 0.9 | new data | |
| Bakalskoye | 27.06.2016 | 4 | 45°45.514′ N 33°10.794′ E | 47 | 8.6 | 40.0 ± 2.7 | 23.6 ± 1.1 | [16] |
| 14.07.2017 | 5 | 45°43.921′ N 33°10.936′ E | 62 | 8.2 | 41.9 ± 3.0 | 24.4 ± 1.0 | new data | |
| Chokrakskoye | 08.06.2016 | 6 | 45°27.508′ N 36°18.325′ E | 226 | 7.9 | 46.0 ± 3.4 | 49.3 ± 3.1 | [16] |
| Dzharylgach | 18.05.2016 | 7 | 45°33.965′ N 32°54.599′ E | 115 | 8.5 | 29.7 ± 2.4 | 22.2 ± 2.4 | [16] |
| 06.09.2016 | 8 | 45°33.967′ N 32°54.591′ E | 130 | 8.1 | 54.6 ± 4.1 | - | [16] | |
| 08.11.2016 | 9 | 45°33.968′ N 32°51.582′ E | 140 | 7.9 | 31.6 ± 2.8 | 34.6 ± 1.8 | [16] | |
| 14.07.2017 | 10 | 45°34.990′ N 32°51.505′ E | 140 | 8.0 | 62.6 ± 5.1 | 36.7 ± 2.0 | new data | |
| Kirleutskoye | 13.05.2014 | 11 | 45°56.572′ N 34°01.828′ E | 184 | 7.6 | 121.3 ± 7.1 | - | [26] |
| 18.11.2014 | 12 | 45°55.368′ N 34°02.385′ E | 271 | 7.6 | 52.9 ± 8.4 | - | [16] | |
| 14.06.2016 | 13 | 45°55.231′ N 34°02.681′ E | 235 | 7.9 | 18.7 ± 2.3 | 2.3 ± 0.1 | [16] | |
| 23.11.2016 | 14 | 45°53.753′ N 34°02.043′ E | 207 | 8.2 | 76.1 ± 7.3 | 13.3 ± 1.0 | [16] | |
| 22.06.2017 | 15 | 45°55.479′ N 34°02.730′ E | 267 | 7.2 | 76.7 ± 5.7 | - | new data | |
| Kiyatskoye | 13.05.2014 | 16 | 46°0.084′ N 33°56.707′ E | 107 | 7.8 | 98.0 ± 5.2 | - | [26] |
| 18.11.2014 | 17 | 45°59.361′ N 35°57.365′ E | 154 | 7.8 | 129.0 ± 7.5 | - | [16] | |
| 14.06.2016 | 18 | 45°59.729′ N 33°53.310′ E | 200 | 7.7 | 60.1 ± 4.7 | 5.3 ± 0.3 | [16] | |
| 23.11.2016 | 19 | 45°58.395′ N 33°55.364′ E | 224 | 8.2 | 209.2 ± 13.8 | 3.4 ± 0.2 | [16] | |
| 23.06.2017 | 20 | 45°58.684′N 33°54.572′E | 218 | 7.4 | 59.0 ± 3.9 | 6.4 ± 0.4 | new data | |
| Koyashskoye | 10.04.2016 | 21 | 45°02′08″N 36°12′03″E | 230 | 7.9 | 39.0 ± 2.6 | - | [27] |
| Krasnoye | 14.06.2016 | 22 | 45°59.437′N 33°57.319′E | 330 | 9.3 | 54.7 ± 21.3 | 37.4 ± 0.2 | [16] |
| 23.06.2017 | 23 | 45°59.275′N 33°53.110′E | 350 | 9.6 | 268.8 ± 23.9 | 46.5 ± 3.0 | new data | |
| Kyzyl-Yar | 13.05.2014 | 24 | 45°03.558′N 33°37.460′E | 2 | 7.1 | 9.6 ± 0.8 | - | [26] |
| 18.05.2016 | 25 | 45°03.560′N 33°35.360′E | 4 | 7.9 | 6.0 ± 0.8 | 0.8 ± 0.04 | [16] | |
| 06.09.2016 | 26 | 45°03.560′N 33°35.360′E | 3 | - | 9.3 ± 1.1 | - | [16] | |
| 28.07.2017 | 27 | 45°03.982′N 33°37.782′E | 4 | 7.8 | 5.9 ± 0.8 | 1.7 ± 0.1 | new data | |
| Moynakskoye | 18.05.2016 | 28 | 45°10.518′N 33°18.597′E | 47 | 8.2 | 8.3 ± 1.1 | 29.8 ± 1.4 | [16] |
| Sasyk-Sivash | 27.06.2016 | 29 | 45°09.151′N 33°30.447′E | 280 | 7.7 | 313.6 ±25.0 | 95.9 ± 8.1 | [16] |
| 08.11.2016 | 30 | 45°12.282′N 33°31.526′E | 322 | 7.8 | 258.9 ±14.7 | 83.0 ±7.1 | new data | |
| 28.07.2017 | 31 | 45°09.280′N 33°30.680′E | 295 | 7.5 | 49.4 ± 9.2 | 106.7 ±8.7 | new data | |
| Tobechikskoye | 07.06.2016 | 32 | 45°09.118′N 36°22.490′E | 176 | 8.2 | 28.9 ± 2.2 | 8.7 ± 0.4 | [16] |
| Chokrakskoye | 17.08.2017 (pool) | - | 45°27.835′N 36°18.526′E | 400 | 6.6 | below the detectable level | below the detectable level | new data |
| Tobechikskoye | 16.08.2017 (pool) | - | 45°09.238′N 36°22.623′E | 400 | 7.2 | below the detectable level | below the detectable level | new data |
© 2020 by the authors. Licensee MDPI, Basel, Switzerland. This article is an open access article distributed under the terms and conditions of the Creative Commons Attribution (CC BY) license (http://creativecommons.org/licenses/by/4.0/).
Share and Cite
Mirzoeva, N.; Shadrin, N.; Arkhipova, S.; Miroshnichenko, O.; Kravchenko, N.; Anufriieva, E. Does Salinity Affect the Distribution of the Artificial Radionuclides 90Sr and 137Cs in Water of the Saline Lakes? A Case of the Crimean Peninsula. Water 2020, 12, 349. https://doi.org/10.3390/w12020349
Mirzoeva N, Shadrin N, Arkhipova S, Miroshnichenko O, Kravchenko N, Anufriieva E. Does Salinity Affect the Distribution of the Artificial Radionuclides 90Sr and 137Cs in Water of the Saline Lakes? A Case of the Crimean Peninsula. Water. 2020; 12(2):349. https://doi.org/10.3390/w12020349
Chicago/Turabian StyleMirzoeva, Natalia, Nickolai Shadrin, Svetlana Arkhipova, Oksana Miroshnichenko, Natalia Kravchenko, and Elena Anufriieva. 2020. "Does Salinity Affect the Distribution of the Artificial Radionuclides 90Sr and 137Cs in Water of the Saline Lakes? A Case of the Crimean Peninsula" Water 12, no. 2: 349. https://doi.org/10.3390/w12020349