Modelling the 2012 Lahar in a Sector of Jamapa Gorge (Pico de Orizaba Volcano, Mexico) Using RAMMS and Tree-Ring Evidence

 , and
, and
Abstract
:1. Introduction
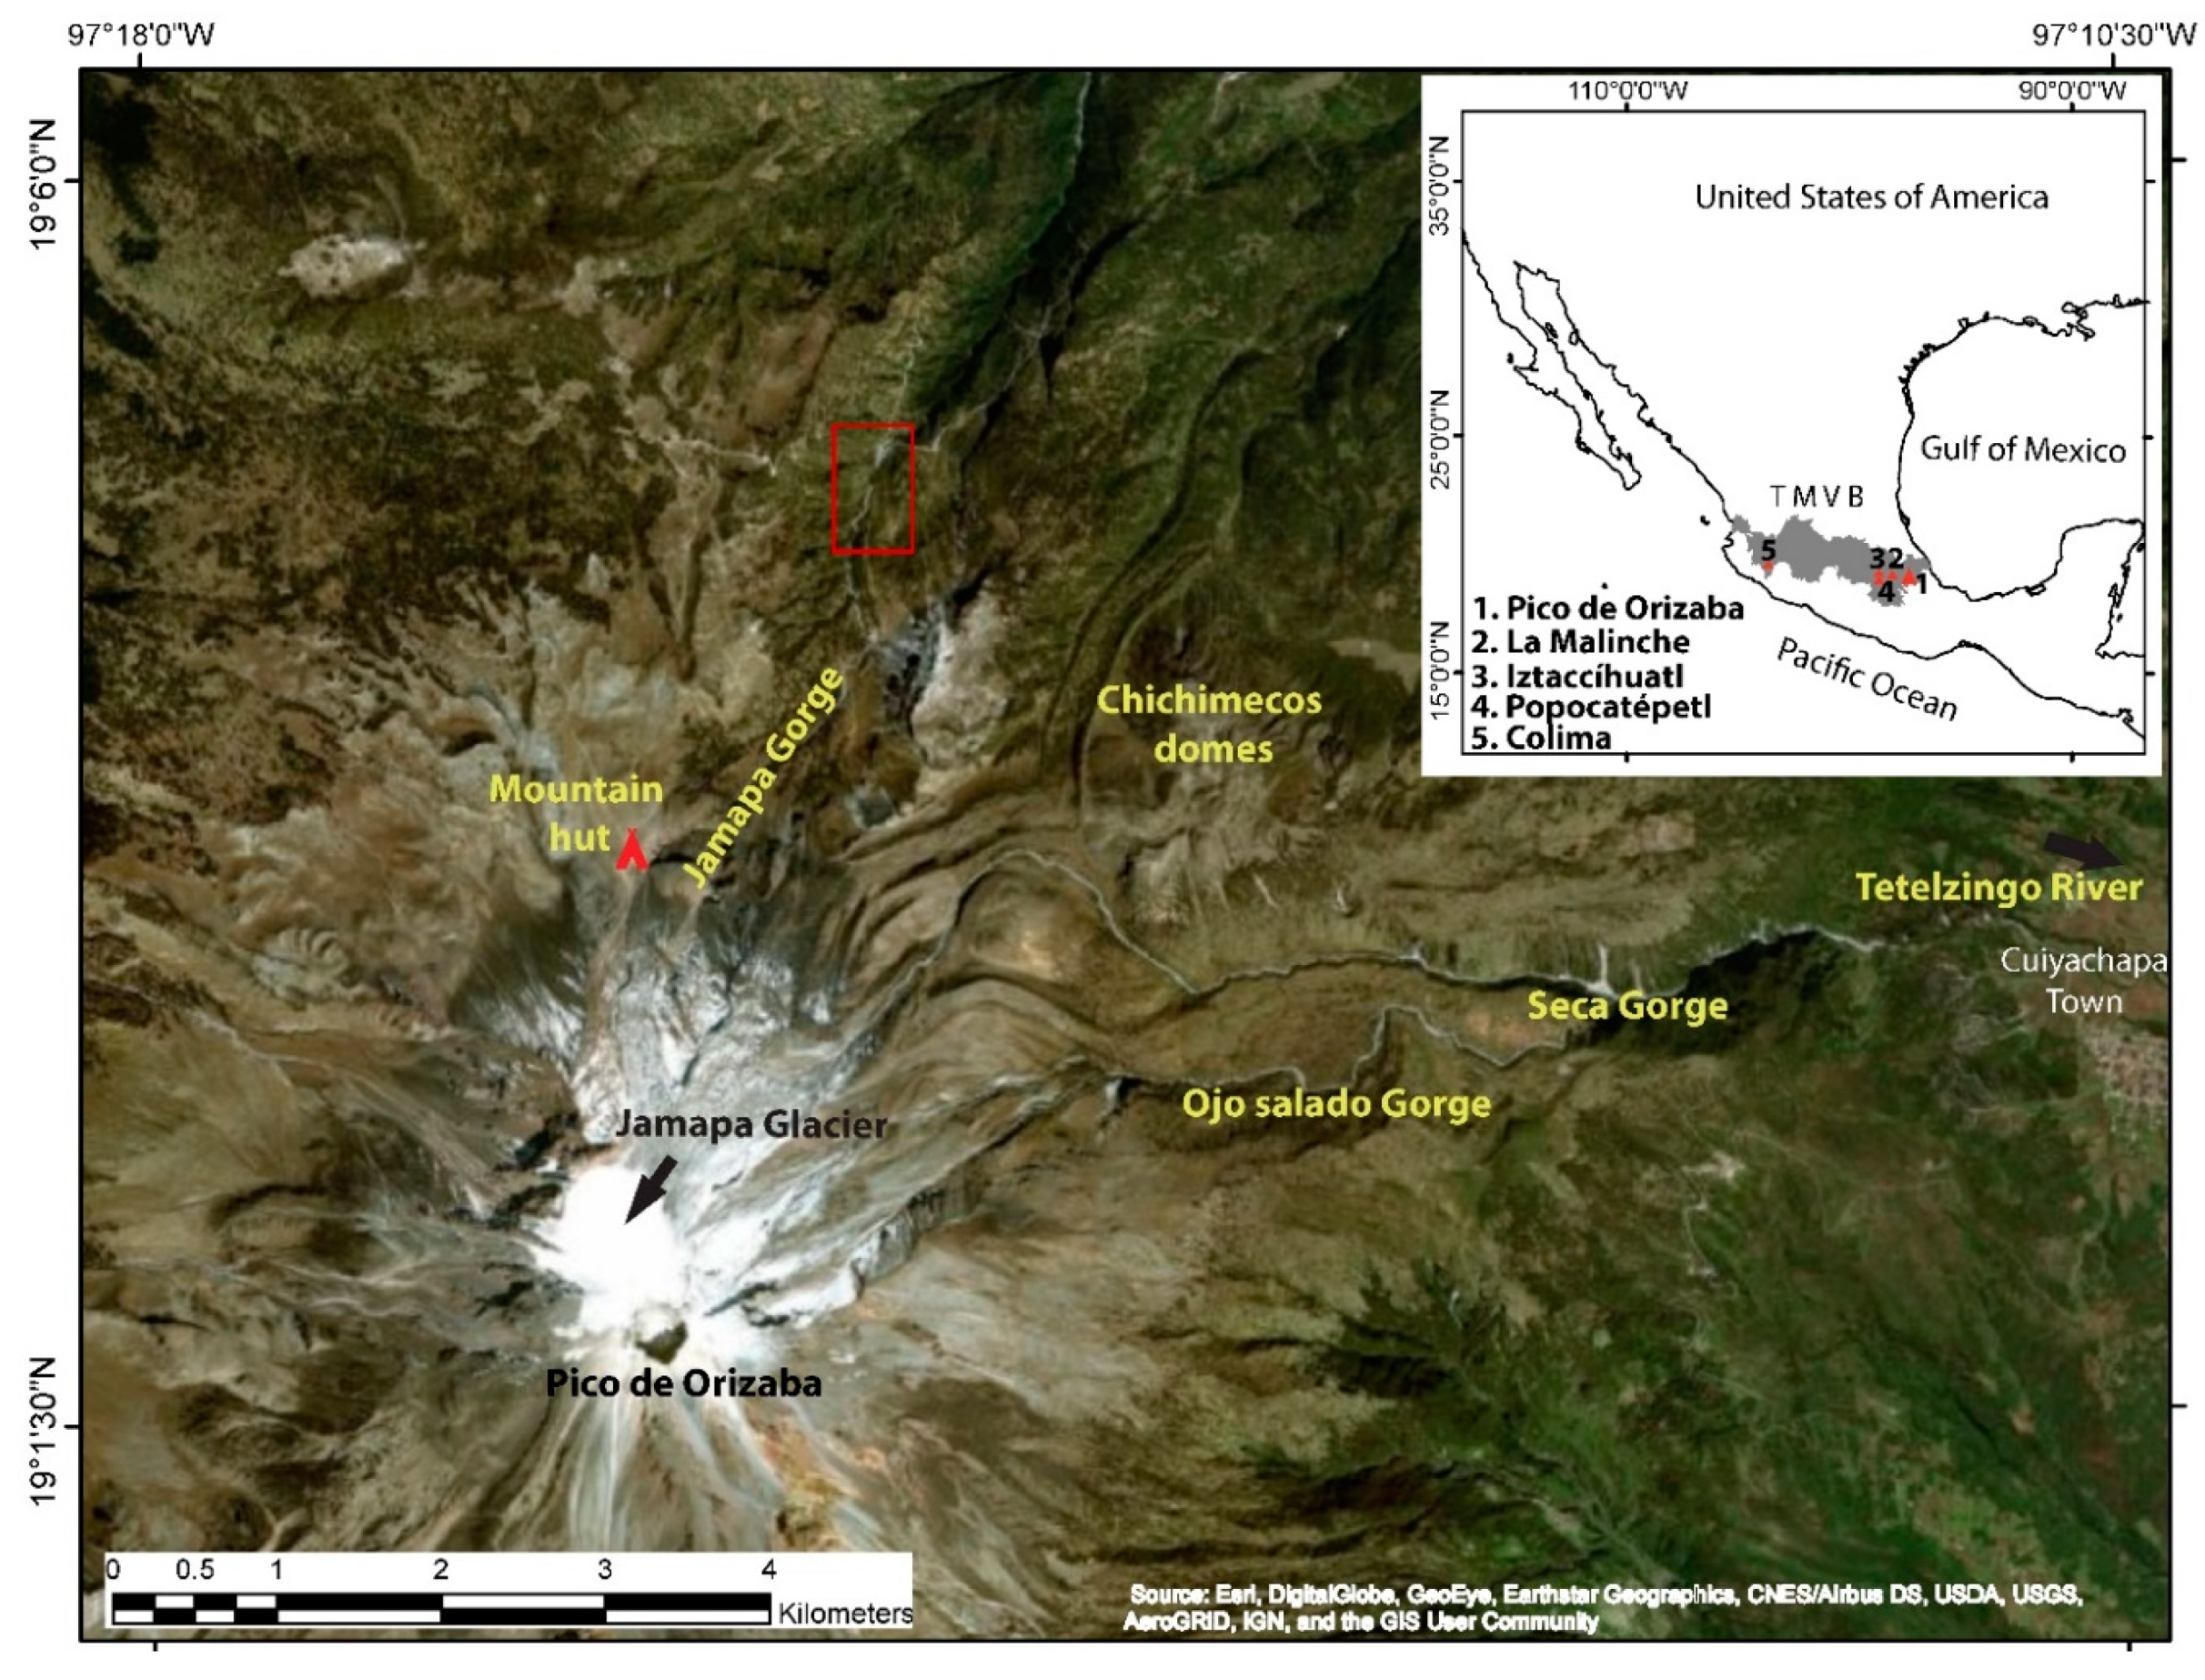
2. Study Site
2.1. Volcanic Setting and Recorded Lahar Activity
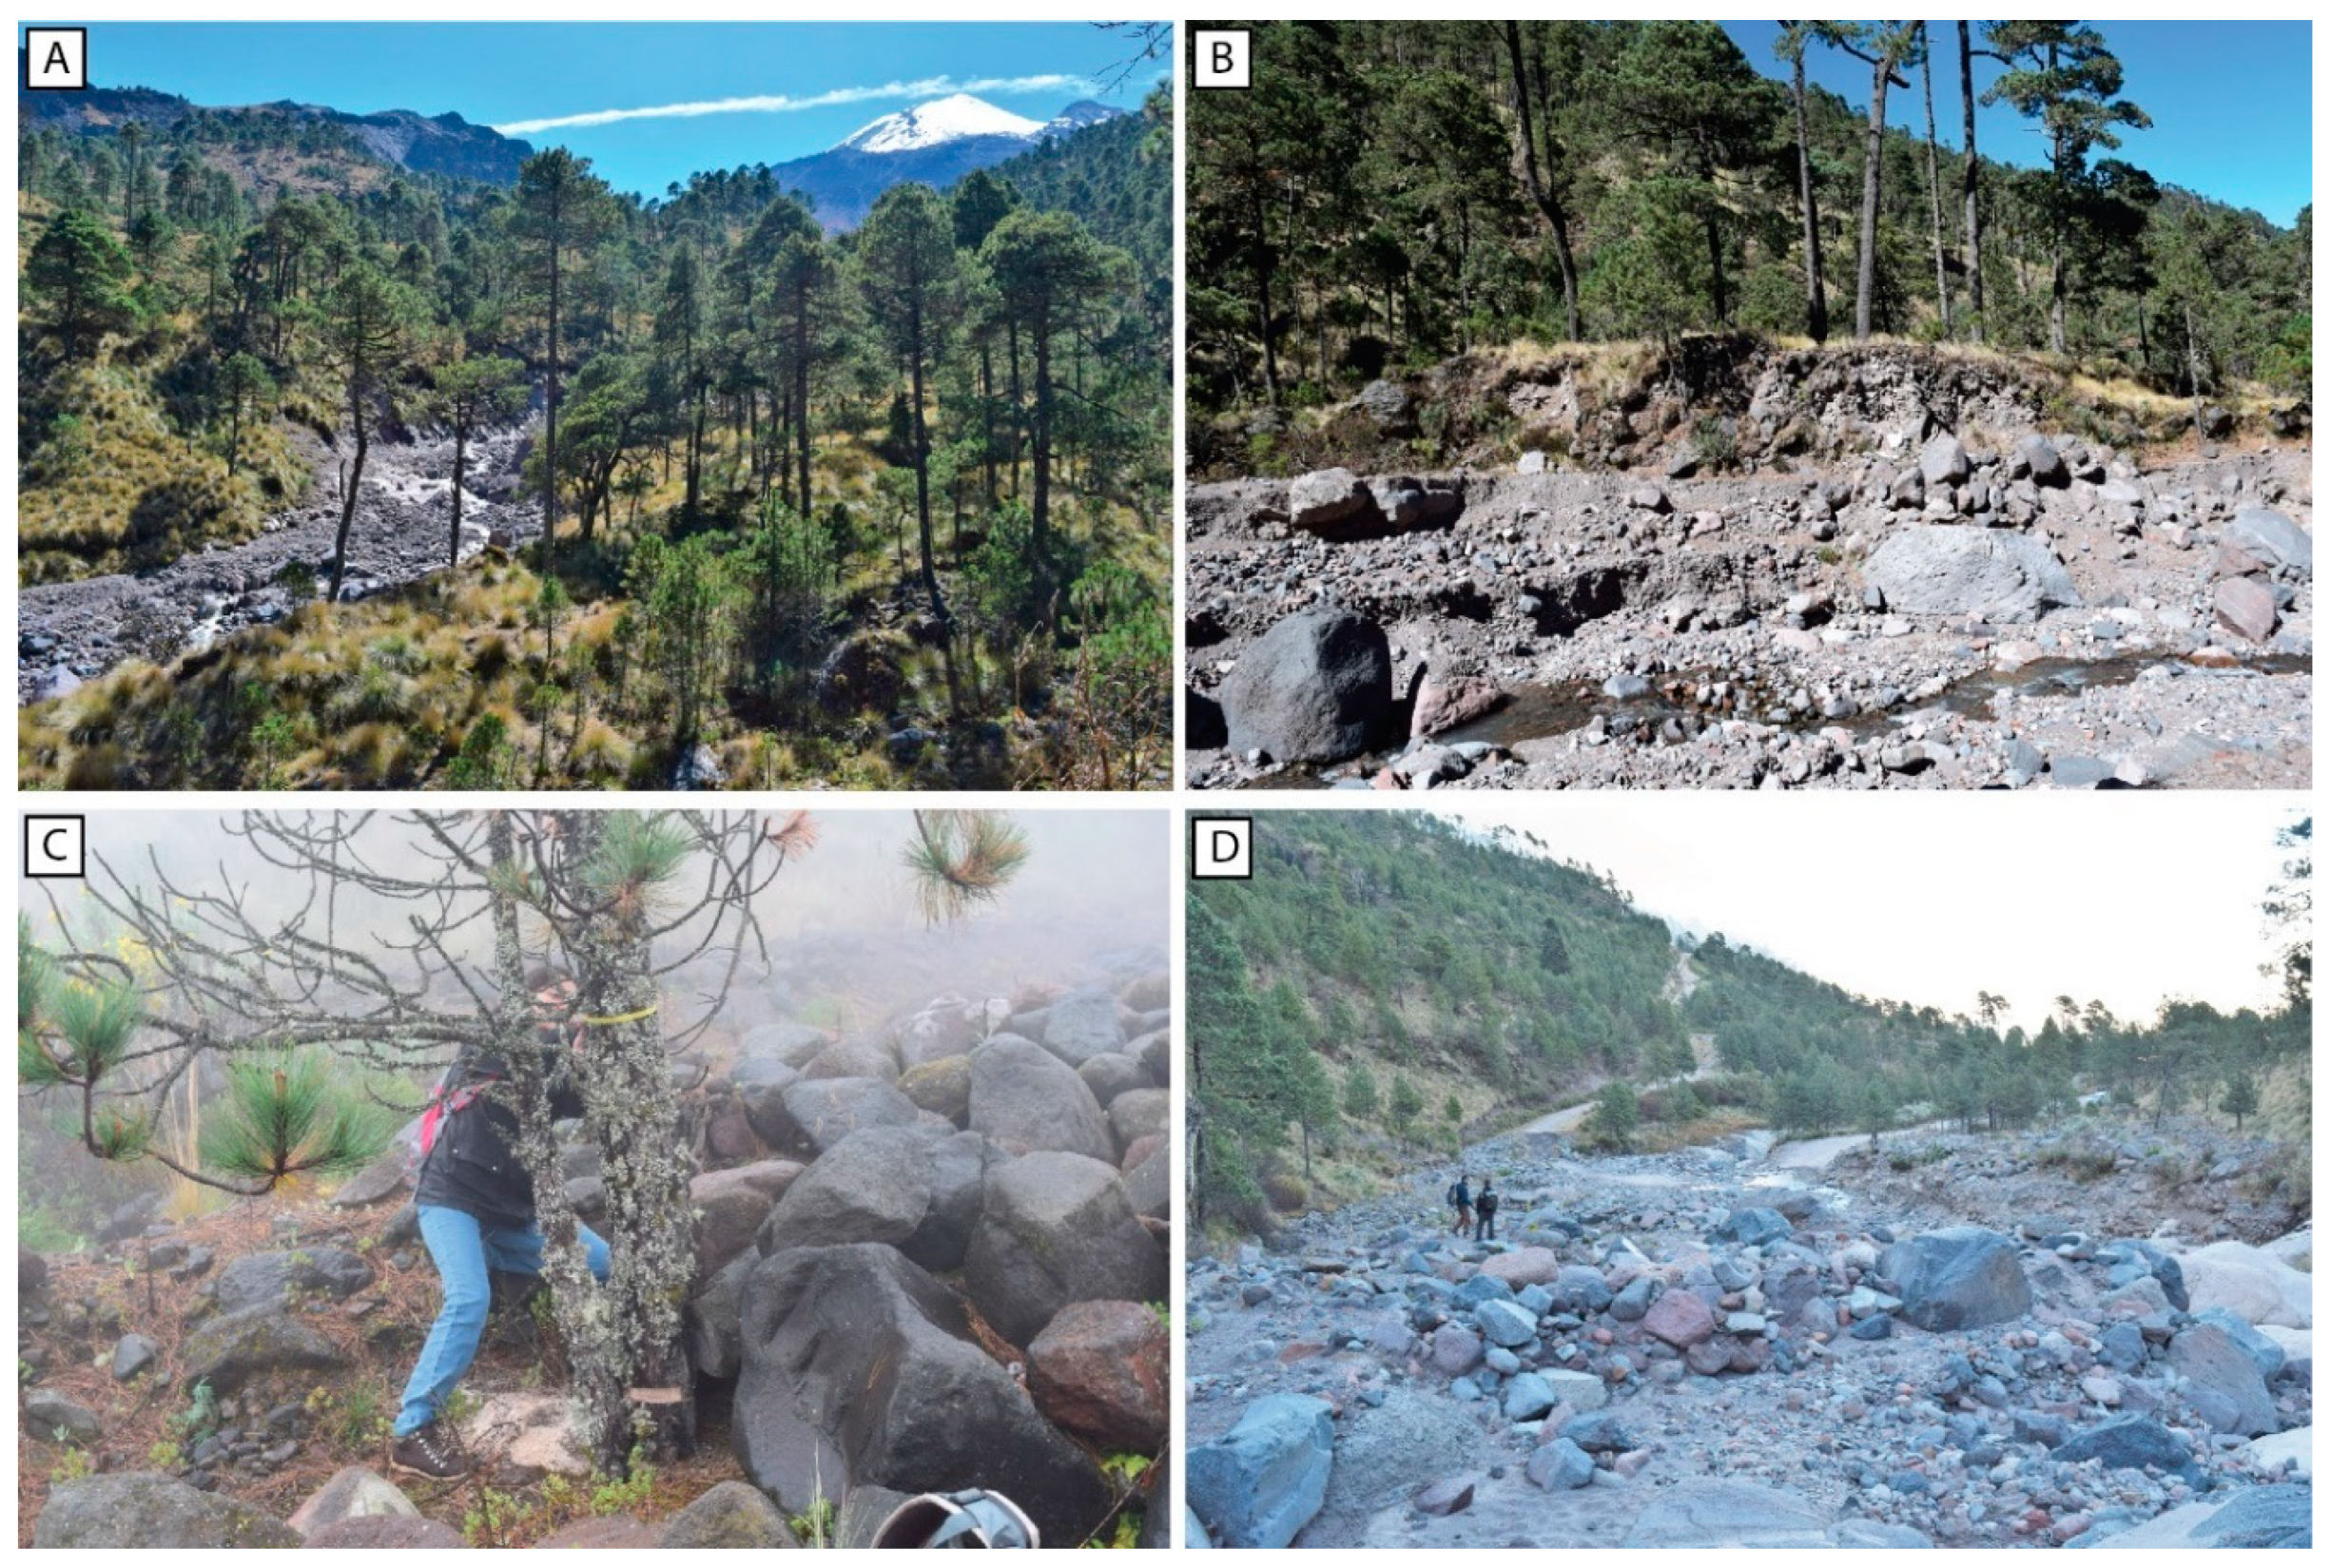
2.2. Geomorphic Features on Jamapa Gorge
2.3. The 2012 Hydrometeorological Event and Rainfall Triggering
3. Methods
3.1. Digital Terrain Model
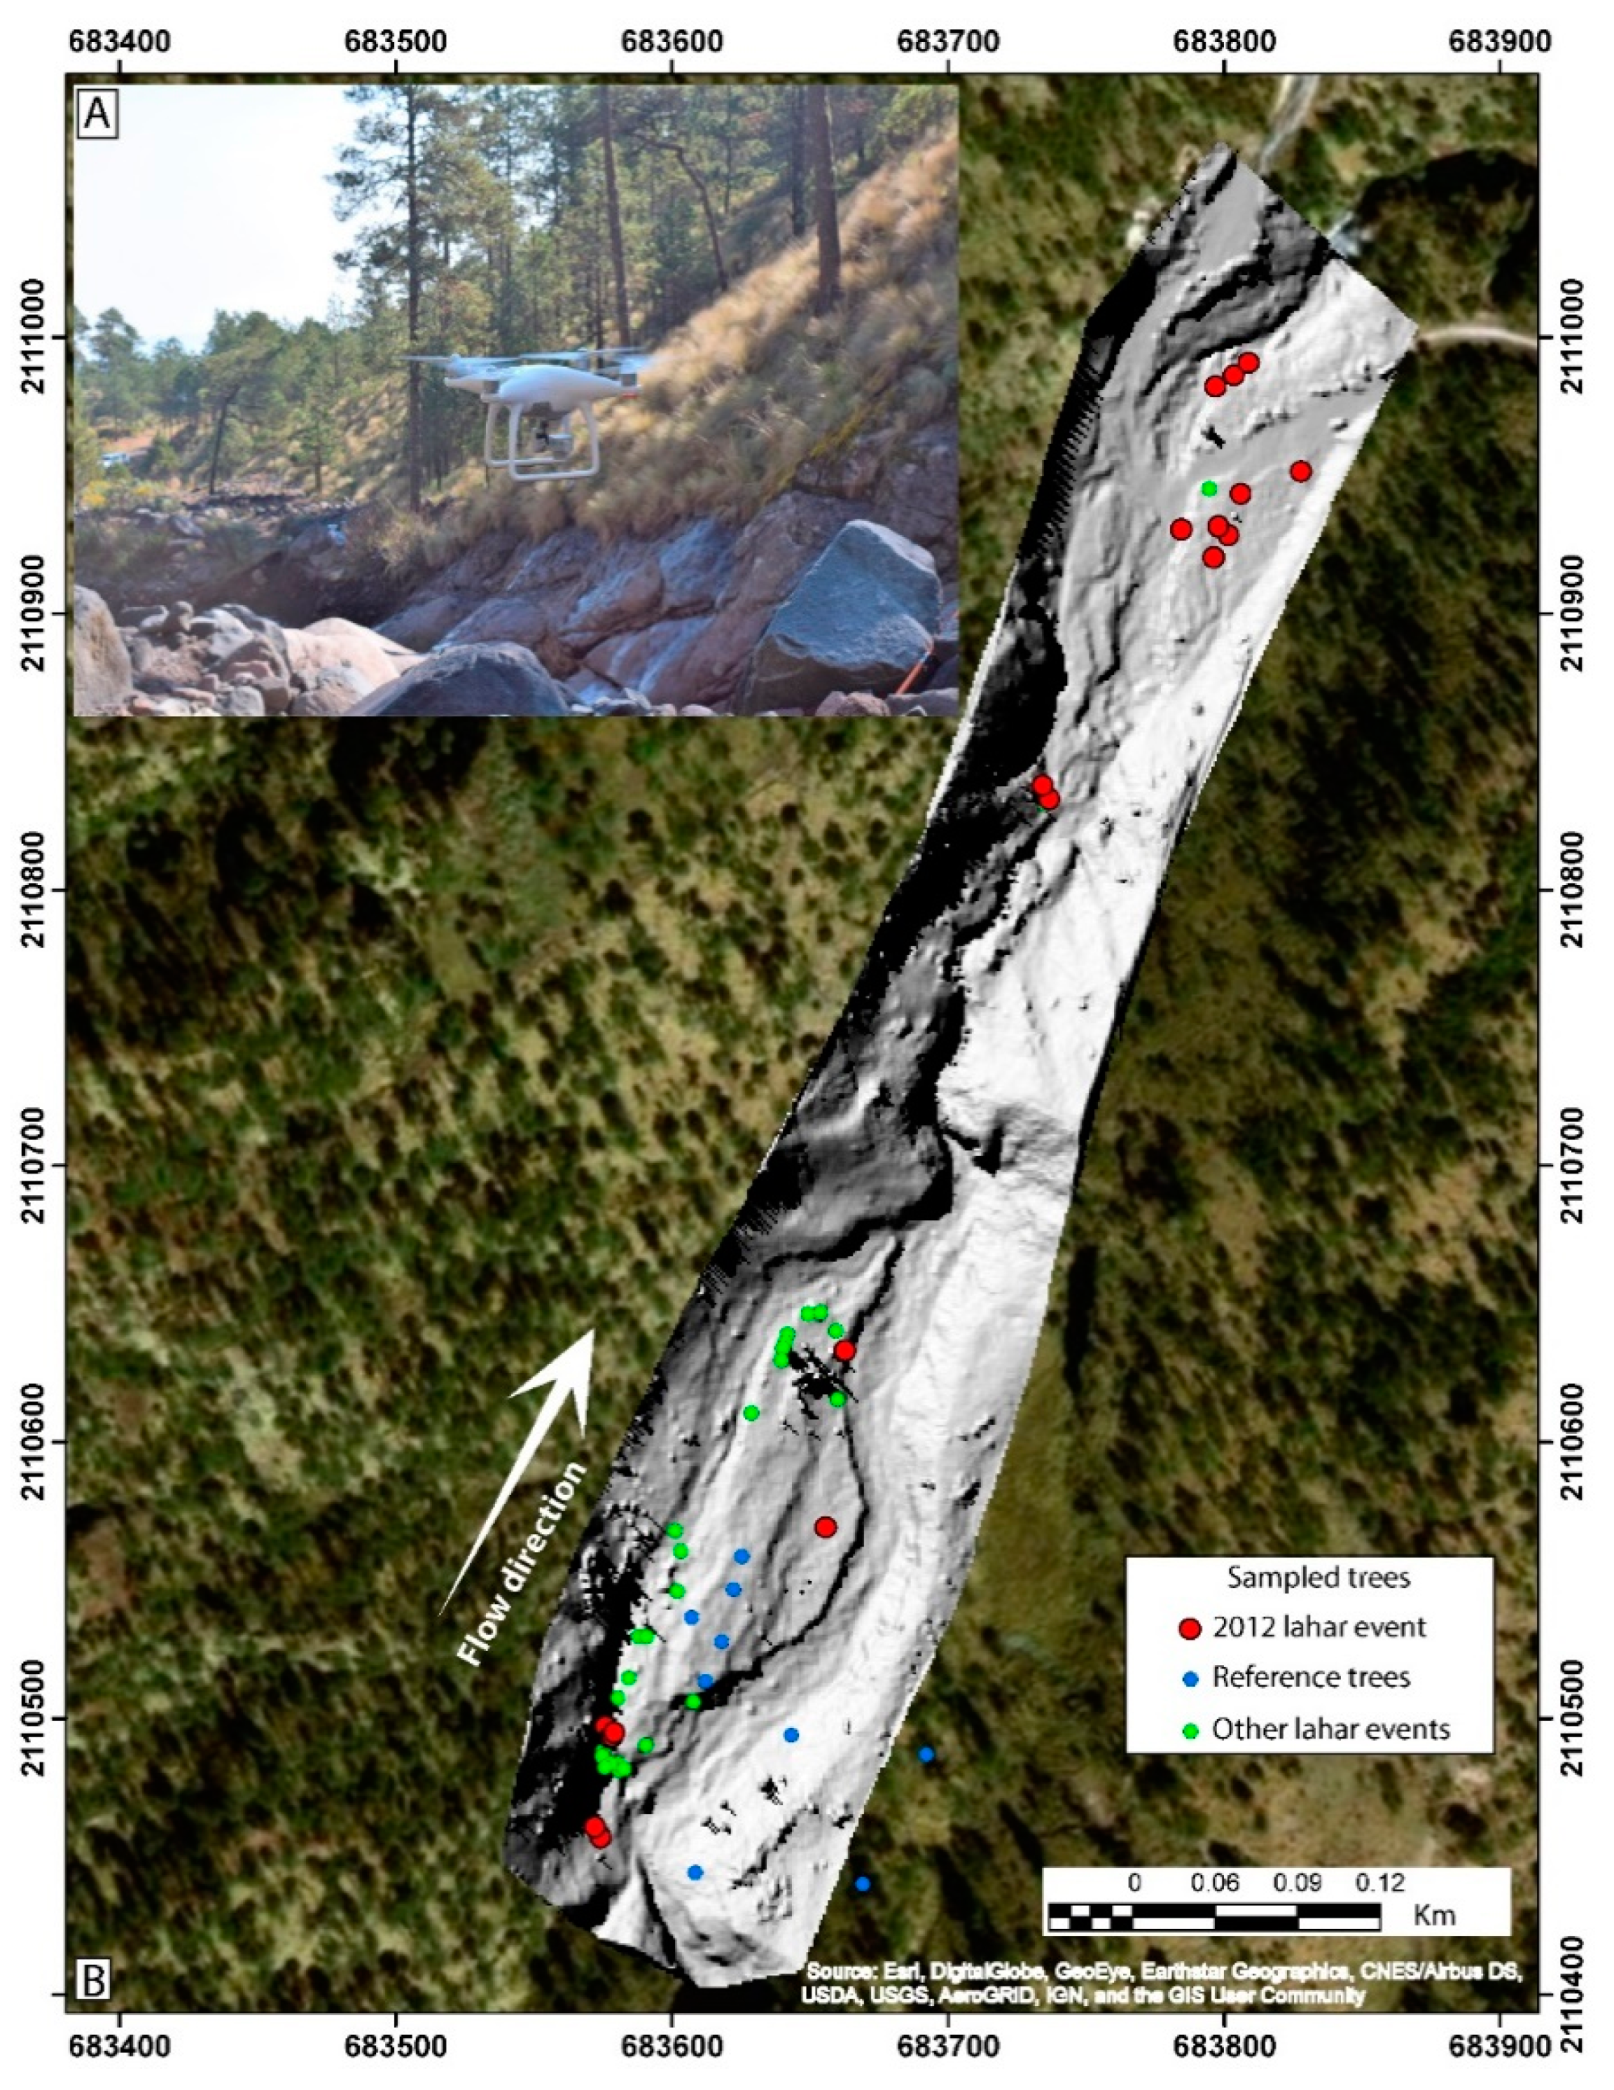
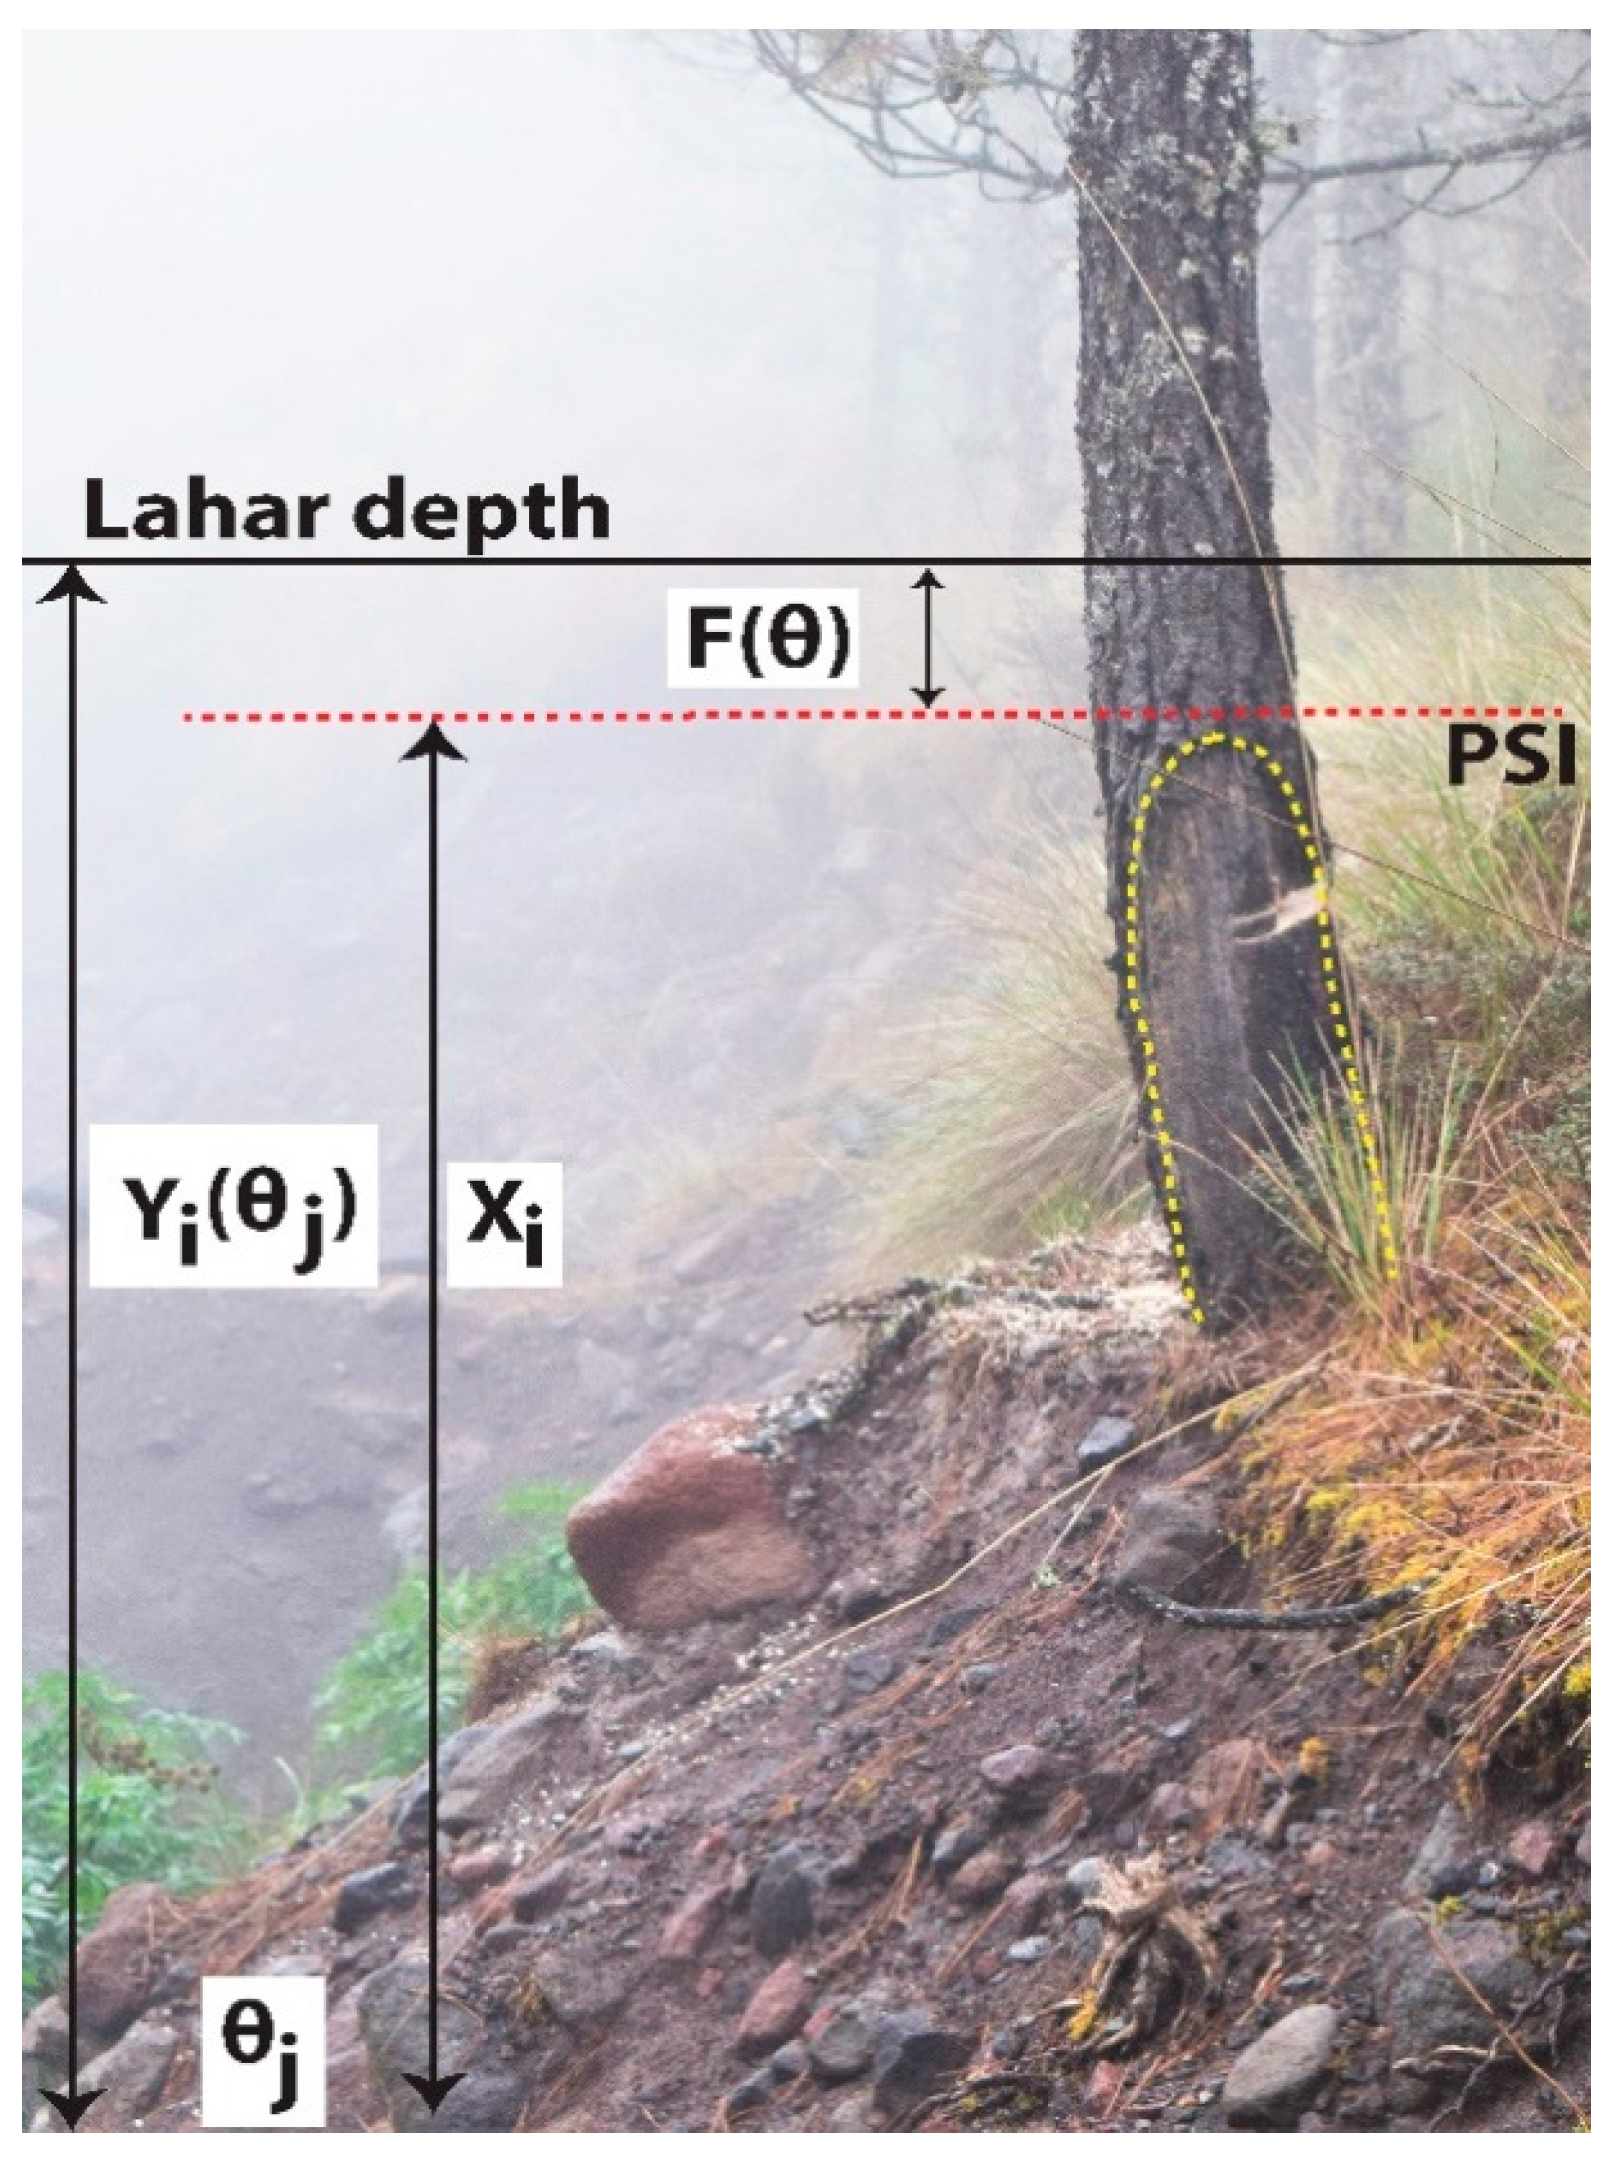
3.2. Dendrogeomorphic Analysis and PSI
3.3. Numerical Simulations
4. Results
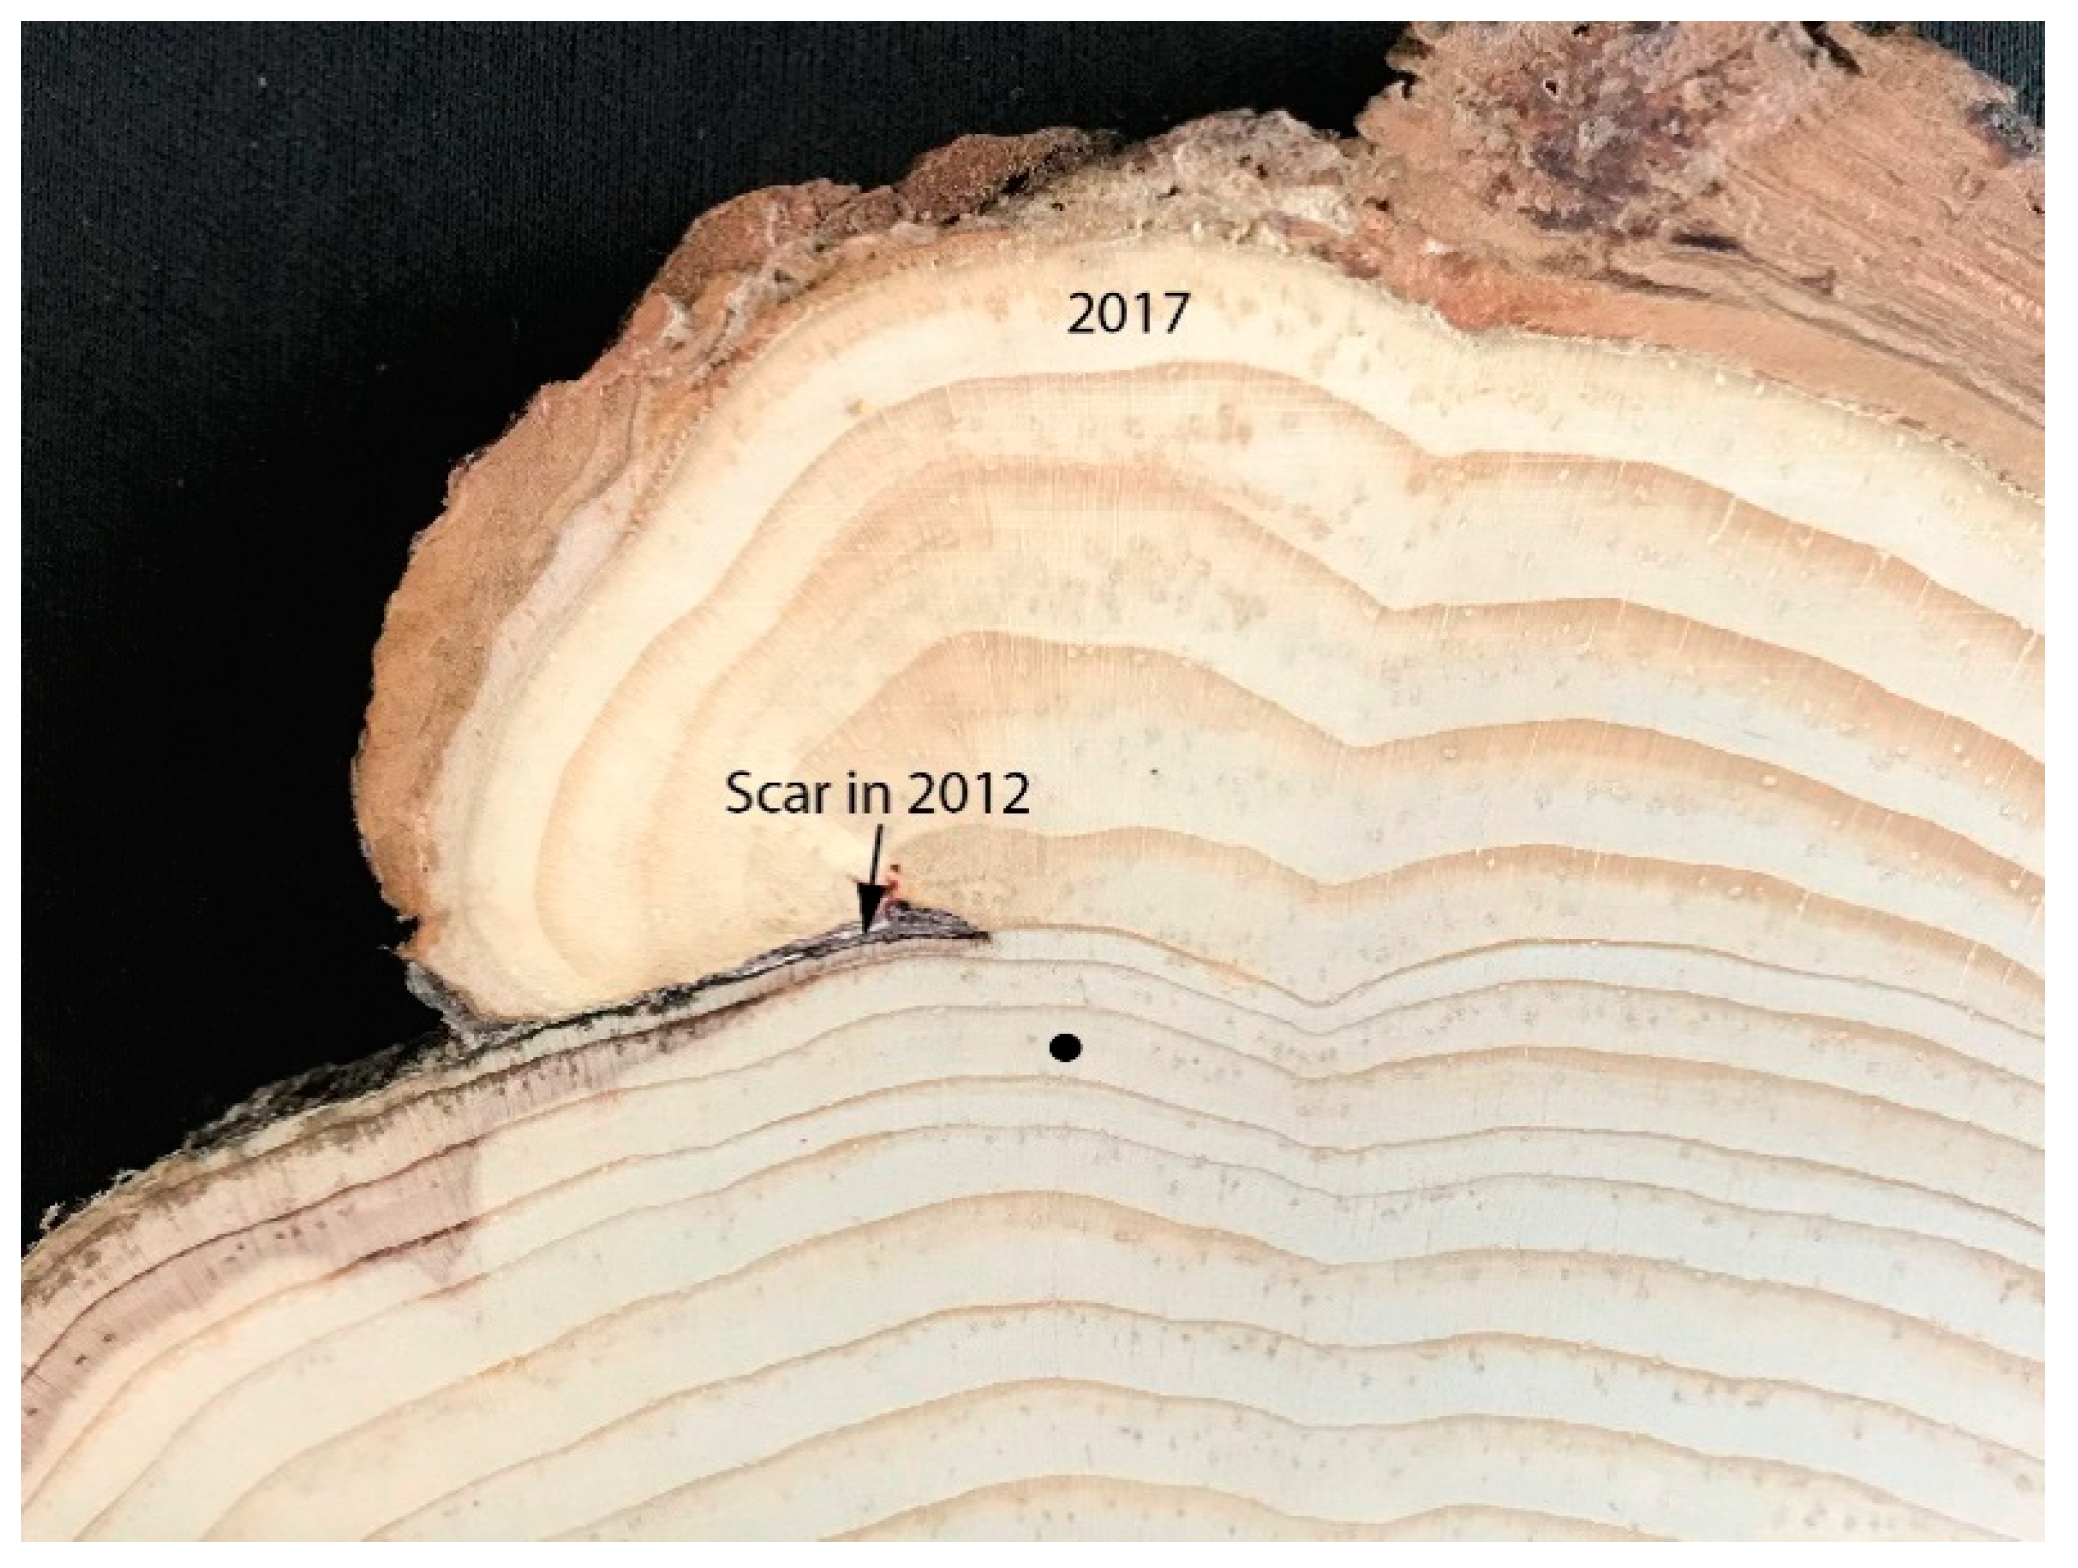
4.1. Tree Ring Evidence of the 2012 Lahar Event
4.2. Magnitude Reconstruction of the 2012 Lahar
5. Discussion and Conclusions
Author Contributions
Funding
Acknowledgments
Conflicts of Interest
References
- Smith, G.A.; Fritz, W.J. Volcanic influences on terrestrial sedimentation. Geology 1989, 17, 375–376. [Google Scholar] [CrossRef]
- Vallance, J.W. Volcanic debris flow. In Debris-Flows Hazards and Related Phenomena; Jakob, M., Hungr, O., Eds.; Springer: Berlin/Heidelberg, Germany, 2005; pp. 247–274. [Google Scholar]
- Lavigne, F.; Thouret, J.C. Sediment transportation and deposition by rain-triggered lahars at Merapi Volcano, Central Java, Indonesia. Geomorphology 2002, 49, 45–69. [Google Scholar] [CrossRef]
- Scott, K.; Macías, J.L.; Naranjo, J.A.; Rodríguez, S.; McGeehin, J.P. Catastrophic debris flows transformed from landslide in volcanic terrains: Mobility, hazard assessment and mitigation strategies. In U. S. Geological Survey Professional Paper; U.S. Geological Survey: Reston, VA, USA, 2001; Volume 1630, p. 59. [Google Scholar]
- Vallance, J.W.; Iverson, R.M. Lahars and their deposits. In Encyclopedia of Volcanoes, 2nd ed.; Academic Press: London, UK, 2015; pp. 649–664. [Google Scholar] [CrossRef]
- Capra, L.; Macías, J.L. The cohesive Naranjo debris flow deposit (10 km3): A dam breakout flow derived from the pleistocene debris-avalanche deposit of Nevado de Colima volcano (Mexico). J. Volcanol. Geoth. Res. 2002, 117, 213–235. [Google Scholar] [CrossRef]
- Cortes, A.; Macías, J.L.; Capra, L.; Garduño-Monroy, V.H. Sector collapse of the SW flank of Volcán de Colima, México. The 3600 yr BP La Lumbre-Los Ganchos debris avalanche and associated debris flows. J. Volcanol. Geoth. Res. 2010, 197, 52–66. [Google Scholar] [CrossRef]
- Saucedo, R.; Macías, J.L.; Sarocchi, D.; Bursik, M.I.; Rupp, B. The rain-triggered Atenquique volcaniclastic debris flow of October 16, 1955 at Nevado de Colima Volcano, Mexico. J. Volcanol. Geoth. Res. 2008, 173, 69–83. [Google Scholar] [CrossRef]
- Bisson, M.; Pareschi, M.T.; Zanchetta, G.; Sulpizio, R.; Santacroce, R. Volcaniclastic debris flow occurrences in the Campania region (southern Italy) and their relation to Holocene—Late Pleistocene pyroclastic fall deposits: Implications for large-scale hazard mapping. Bull Volcanol. 2007, 70, 157–167. [Google Scholar] [CrossRef] [Green Version]
- Bisson, M.; Zanchettab, G.; Sulpizio, R.; Demib, F. A map for volcaniclastic debris flow hazards in Apennine areas surrounding the Vesuvius volcano (Italy). J. Maps 2013, 9, 230–238. [Google Scholar] [CrossRef]
- Vallance, J.W.; Schilling, S.P.; Devoli, G.; Reid, M.E.; Howell, M.M.; Brien, D.L. Lahar Hazards at Casita and San Cristóbal Volcanoes, Nicaragua; Open-File Report 01-468; U.S. Geological Survey: Reston, VA, USA, 2004; pp. 1–18.
- Carrasco-Núñez, G.; Díaz-Castellón, R.; Siebert, L.; Hubbard, B.; Sheridan, M.F.; Rodríguez, S.R. Multiple edifice-collapse events in the Eastern Mexican Volcanic Belt: The role of sloping substrate and implications for hazard assessment. J. Volcanol. Geoth. Res. 2006, 158, 151–176. [Google Scholar] [CrossRef]
- Newhall, C.; Stauffer, P.H.; Hendley, J.W. Lahars of Mount Pinatubo, Philippines; Fact Sheet 114; U.S. Geological Survey: Reston, VA, USA, 1997.
- Lavigne, F.; Thouret, J.C.; Voight, B.; Suwa, H.; Sumaryono, A. Lahars at Merapi volcano, Central Java: An overview. J. Volcanol. Geoth. Res. 2000, 100, 423–456. [Google Scholar] [CrossRef]
- Capra, L.; Borselli, L.; Varley, N.; Gavilanes-Ruiz, J.C.; Norini, G.; Sarocchi, D.; Caballero, L.; Cortes, A. Rainfall-triggered lahars at Volcán de Colima, Mexico: Surface hydro-repellency as initiation process. J. Volcanol. Geoth. Res. 2010, 189, 105–117. [Google Scholar] [CrossRef]
- Vázquez, R.; Capra, L.; Caballero, L.; Arámbula-Mendoza, R.; Reyes-Dávila, G. The anatomy of a lahar: Deciphering the 15th September 2012 lahar at Volcán de Colima, Mexico. J. Volcanol. Geoth. Res. 2014, 272, 126–136. [Google Scholar] [CrossRef]
- Procter, J.N.; Cronin, S.J.; Zernack, A.V. Landscape and sedimentary response to catastrophic debris avalanches, western Taranaki, New Zealand. Sediment. Geol. 2009, 220, 271–287. [Google Scholar] [CrossRef]
- Bollschweiler, M.; Stoffel, M.; Vázquez-Selem, L.; Palacios, D. Tree-ring reconstruction of past lahar activity at Popocatépetl volcano, México. Holocene 2010, 20, 265–274. [Google Scholar] [CrossRef] [Green Version]
- Franco-Ramos, O.; Stoffel, M.; Vázquez-Selem, L.; Capra, L. Spatio-temporal reconstruction of lahars on the southern slopes of Colima volcano, Mexico—A dendrogeomorphic approach. J. Volcanol. Geoth. Res. 2013, 267, 30–38. [Google Scholar] [CrossRef]
- Franco-Ramos, O.; Castillo, M.; Muñoz–Salinas, E. Using tree-ring analysis to evaluate the intra-eruptive lahar activity in the Nexpayantla Gorge, Popocatépetl Volcano (Central Mexico). Catena 2016, 147, 205–215. [Google Scholar] [CrossRef]
- Franco-Ramos, O.; Stoffel, M.; Vázquez Selem, L. Tree-ring based record of intra-eruptive lahar activity: Axaltzintle valley, Malinche volcano, Mexico. Geochronometria 2016, 43, 74–83. [Google Scholar] [CrossRef] [Green Version]
- Worni, R.; Huggel, C.; Stoffel, M.; Pulgarin, B. Challenges of modelling recent, very large lahars at Nevado del Huila Volcano, Colombia. Bull. Volcanol. 2012, 74, 309–324. [Google Scholar] [CrossRef]
- Schilling, S. LAHARZ: GIS Programs for Automated Mapping of Lahar-Inundation Hazard Zones; OFR 98-638; USGS: Vancouver, WA, USA, 1998.
- Williams, R.; Stinton, A.J.; Sheridan, M.F. Evaluation of the Titan2D two-phase flow model using an actual event: Case study of the 2005 Vazcún Valley Lahar. J. Volcanol. Geoth. Res. 2008, 177, 760–766. [Google Scholar] [CrossRef]
- O’Brien, J.; Julien, P.; Fullerton, W. Two-dimensional water flood and mudflow simulation. J. Hydraul. Eng. 1993, 119, 244–261. [Google Scholar] [CrossRef]
- Cesca, M.; D’Agostino, V. Comparison between FLO-2D and RAMMS in debris-flow modelling: A case study in the Dolomites. WIT Trans. Eng. Sci. 2008, 60, 197–206. [Google Scholar] [CrossRef] [Green Version]
- Lee, S.K.; Lee, C.W.; Lee, S. A comparison of the Landsat image and LAHARZ-simulated lahar inundation hazard zone by the 2010 Merapi eruption. Bull. Volcanol. 2015, 77, 46. [Google Scholar] [CrossRef]
- Pistolesi, M.; Cioni, R.; Rosi, M.; Aguilera, E. Lahar hazard assessment in the southern drainage system of Cotopaxi volcano, Ecuador: Results from multiscale lahar simulations. Geomorphology 2014, 207, 51–63. [Google Scholar] [CrossRef]
- Nocentini, M.; Tofani, V.; Gigli, G.; Fidolini, F.; Casagli, N. Modeling debris flows in volcanic terrains for hazard mapping: The case study of Ischia Island (Italy). Landslides 2014, 12, 831–846. [Google Scholar] [CrossRef]
- Muñoz-Salinas, E.; Castillo-Rodríguez, M.; Manea, V.; Manea, M.; Palacios, D. Lahar flow simulation using LAHARZ program: Application for Popocatépetl volcano, Mexico. J. Volcanol. Geoth. Res. 2009, 182, 13–22. [Google Scholar] [CrossRef]
- Hubbard, B.E. Volcanic Hazard Mapping Using Aircraft, Satellite, and Digital Topographic Data: Pico de Orizaba (Citlaltépetl), Mexico. Ph.D. Thesis, University at Buffalo, Buffalo, NY, USA, 2001; p. 354. [Google Scholar]
- Capra, L.; Norini, G.; Groppelli, G.; Macías, J.L.; Arce, J.L. Volcanic hazard zonation of the Nevado de Toluca volcano, México. J. Volcanol. Geoth. Res. 2008, 176, 469–484. [Google Scholar] [CrossRef]
- Sieron, K.; Capra, L.; Rodríguez-Elizararrás, S. Hazard assessment at San Martín volcano based on geological record, numerical modeling, and spatial analysis. Nat. Hazards 2014, 70, 275–297. [Google Scholar] [CrossRef]
- Vázquez, R.; Macías, J.L.; Cisneros, G. A first approach to the numerical modeling of lahars at Tacaná Volcanic Complex, Chiapas, México. In EGU General Assembly Conference Abstracts; EGU2018-905; Geophysical Research Abstracts: Vienna, Austria, 2018; Volume 20. [Google Scholar]
- Sieron, K.; Ferrés, D.; Siebe, C.; Constantinescu, R.; Capra, L.; Connor, C.; Connor, L.; Groppelli, G.; González Zuccolotto, K. Ceboruco hazard map: Part II—Modeling volcanic phenomena and construction of the general hazard map. Nat. Hazards. 2019. [Google Scholar] [CrossRef]
- Caballero, L.; Capra, L. The use of FLO2D numerical code in lahar hazard evaluation at Popocatépetl volcano: A 2001 lahar scenario. Nat. Hazards Earth Syst. Sci. 2014, 14, 3345–3355. [Google Scholar] [CrossRef] [Green Version]
- Zaragoza Campillo, A.G. Caracterización y Dinámica del Lahar Secundario Ocurrido en 2010, Volcán Popocatépetl: Mecanismos Disparadores, Características Texturales y Simulación Numérica. Bachelor‘s Thesis, Facultad de Ciencias, Universidad Nacional Autónoma de México, Coyoacán, Mexico, 2017; p. 92. (In Spanish). [Google Scholar]
- Capra, L.; Coviello, V.; Borselli, L.; Márquez-Ramírez, V.H.; Arámbula-Mendoza, R. Hydrological control of large hurricane-induced lahars: Evidence from rainfall-runoff modeling, seismic and video monitoring. Nat. Hazards Earth Syst. Sci. 2018, 18, 781–794. [Google Scholar] [CrossRef] [Green Version]
- Baker, V.R.; Webb, R.H.; House, P.K. The scientific and societal value of paleoflood hydrology. In Ancient Floods, Modern Hazards: Principles and Applications of Paleoflood Hydrology; Water Science and Application; House, P.K., Webb, R.H., Baker, V.R., Levish, D.R., Eds.; American Geophysical Union: Washington, DC, USA, 2002; Volume 5, pp. 1–19. [Google Scholar]
- Ballesteros-Cánovas, J.A.; Stoffel, M.; St George, S.; Hirschboeck, K. A review of flood records from tree rings. Prog. Phys. Geogr. 2015, 39, 794–816. [Google Scholar] [CrossRef]
- Franco-Ramos, O.; Stoffel, M.; Ballesteros-Cánovas, J.A. Reconstruction of debris-flow activity in a temperate mountain forest catchment of central Mexico. J. Mt. Sci. 2019, 16, 2096–2109. [Google Scholar] [CrossRef]
- Stoffel, M.; Corona, C. Dendroecological dating of geomorphic disturbance in trees. Tree-Ring Res. 2014, 70, 3–20. [Google Scholar] [CrossRef] [Green Version]
- Webb, R.H.; Jarrett, R.D. One-dimensional estimation techniques for discharges of paleofloods. In Ancient Floods, Modern Hazards: Principles and Applications of Paleoflood Hydrology: Water Science and Application; House, P.K., Webb, R.H., Baker, V.R., Levish, D.R., Eds.; American Geophysical Union: Washington, DC, USA, 2002; pp. 111–126. [Google Scholar]
- Ballesteros, J.A.; Bodoque, J.M.; Díez, A.; Sanchez-Silva, M.; Stoffel, M. Calibration of floodplain roughness and estimation of palaeoflood discharge based on tree-ring evidence and hydraulic modelling. J. Hydrol. 2011, 403, 103–115. [Google Scholar] [CrossRef]
- Ballesteros, J.A.; Eguibar, M.; Bodoque, J.M.; Díez, A.; Stoffel, M.; Gutiérrez, I. Estimating flash flood discharge in an ungauged mountain catchment with 2D hydraulic models and dendrogeomorphic paleostage indicators. Hydrol. Process. 2011, 25, 970–979. [Google Scholar] [CrossRef] [Green Version]
- Ballesteros-Cánovas, J.A.; Stoffel, M.; Spyt, B.; Janecka, K.; Kaczka, R.J.; Lempa, M. Paleoflood discharge reconstruction in Tatra Mountain streams. Geomorphology 2016, 272, 92–101. [Google Scholar] [CrossRef]
- Bodoque, J.M.; Díez-Herrero, A.; Eguibar, M.A.; Benito, G.; Ruiz-Villanueva, V.; Ballesteros-Cánovas, J.A. Challenges in paleoflood hydrology applied to risk analysis in mountainous watersheds—A review. J. Hydrol. 2015, 529, 449–467. [Google Scholar] [CrossRef] [Green Version]
- Garrote, J.; Díez-Herrero, A.; Génova, M.; Bodoque, J.M.; Perucha, M.A.; Mayer, P.L. Improving Flood Maps in Ungauged Fluvial Basins with Dendrogeomorphological Data. An Example from the Caldera de Taburiente National Park (Canary Islands, Spain). Geosciences 2018, 8, 300. [Google Scholar] [CrossRef] [Green Version]
- Hussin, H.Y.; Quan Luna, B.; Westen, C.J.; Christen, M.; Malet, J.-P.; Van Asch, T.W. Parameterization of a numerical 2-D debris flow model with entrainment: A case study of the Faucon catchment, Southern French Alps. Nat. Hazards Earth Syst. Sci. 2012, 12, 3075–3090. [Google Scholar] [CrossRef]
- Fan, L.; Lehmanna, P.; McArdell, B.; Or, D. Linking rainfall-induced landslides with debris flows runout patterns towards catchment scale hazard assessment. Geomorphology 2017, 280, 1–15. [Google Scholar] [CrossRef]
- Frank, F.; McArdell, B.W.; Oggier, N.; Baer, P.; Christen, M.; Vieli, A. Debris-flow modeling at Meretschibach and Bondasca catchments, Switzerland: Sensitivity testing of field-data-based entrainment model. Nat. Hazards Earth Syst. Sci. 2017, 17, 801–815. [Google Scholar] [CrossRef] [Green Version]
- Carrasco-Núñez, G.; Vallance, J.W.; Rose, W.I. A voluminous avalanche-induced lahar from Citlaltépetl volcano, Mexico: Implications for hazards assessment. J. Volcanol. Geoth. Res. 1993, 59, 35–46. [Google Scholar] [CrossRef]
- Carrasco-Núñez, G. Structure and proximal stratigraphy of Citlaltépetl volcano (Pico de Orizaba), Mexico. Geol. Soc. Am. 2000, 334, 247–262. [Google Scholar] [CrossRef]
- Carrasco-Núñez, G.; Rose, W.I. Eruption of a major Holocene pyroclastic flow at Citlaltépetl volcano (Pico de Orizaba), México, 8.5-9.0 ka. J. Volcanol. Geoth. Res. 1995, 69, 197–215. [Google Scholar] [CrossRef]
- Rossotti, A.; Carrasco-Núñez, G. Stratigraphy of the 8.5–9.0 ka B.P. Citlaltépetl pumice fallout sequence. Rev. Mex. Ciencias Geol. 2004, 21, 353–370. [Google Scholar]
- Hoskuldsson, A.; Robin, C. Late Pleistocene to Holocene eruptive activity of Pico de Orizaba, Eastern Mexico. Bull. Volcanol. 1993, 55, 571–587. [Google Scholar] [CrossRef]
- Siebe, C.; Abrams, M.; Sheridan, M.F. Major Holocene block-and-ash fan at the western slope of ice-capped Pico de Orizaba volcano, México: Implications for future hazards. J. Volcanol. Geoth. Res. 1993, 59, 1–33. [Google Scholar] [CrossRef]
- Alcalá-Reygosa, J.; Palacios, D.; Schimmelpfennig, I.; Vázquez-Selem, L.; García-Sancho, L.; Franco-Ramos, O.; Villanueva, J.; Zamorano, J.J.; ASTER Team. Dating late Holocene lava flows in Pico de Orizaba (Mexico) by means of in situ-produced cosmogenic 36Cl, lichenometry and dendrochronology. Quat. Geochron. 2018, 47, 93–106. [Google Scholar] [CrossRef]
- Iverson, R.M.; Schilling, S.P.; Vallance, J.W. Objective delineation of lahar hazard zones. Geol. Soc. Am. Bull. 1998, 110, 972–984. [Google Scholar] [CrossRef]
- Rodríguez, S.; Mora-González, I.; Murrieta-Hernández, J.-L. Flujos de baja concentración asociados con lluvias de intensidad extraordinaria en el flanco sur del volcán Pico de Orizaba (Citlaltépetl), México. Boletín Soc. Geológica Mex. 2006, 58, 223–236. [Google Scholar] [CrossRef]
- Martínez, M.A.M.; Rodríguez, C.M.W.; Monjardín, L.C.R.; Weissling, B.; Sieron, K.; Martínez, C.A.O. Afectaciones por posible asociación de eventos hidrometeorológicos y geológicos en los municipios de Calcahualco y Coscomatepec, Veracruz. Teoría y Praxis 2016, 12, 31–49. [Google Scholar] [CrossRef]
- Palacios, D.; Vazquez-Selem, L. Geomorphic effects of the retreat of Jamapa glacier, Pico de Orizaba volcano (Mexico). Geogr. Ann. 1996, 78, 19–34. [Google Scholar] [CrossRef]
- Palacios, D.; Parrilla, G.; Zamorano, J.J. Paraglacial and postglacial debris flows on a Little Ice Age terminal moraine: Jamapa Glacier, Pico de Orizaba (Mexico). Geomorphology 1999, 28, 95–118. [Google Scholar] [CrossRef]
- Brown, D.P. Tropical Cyclone Report. Hurricane Ernesto. National Hurricane Center. NOAA, 2013. Available online: https://www.nhc.noaa.gov/data/tcr/AL052012_Ernesto.pdf (accessed on 22 November 2019).
- SMN-CNA. Reseña Huracán Ernesto del Océano Atlántico. Temporada 2012 de Ciclones y Huracanes. Servicio Metrológico Nacional-Comisión Nacional de Agua, 2012. (In Spanish). Available online: http://smn1.conagua.gob.mx/ciclones/tempo2012/atlantico/Ernesto-a2012.pdf (accessed on 22 November 2019).
- Archivo de Datos Climatológicos del Servicio Meteorológico Nacional; CNA-SMN: Mexico, 2019. Available online: https://smn.conagua.gob.mx/tools/RESOURCES/Diarios/30342.txt (accessed on 22 November 2019).
- Westoby, M.J.; Brasington, J.; Glasser, N.F.; Hambrey, M.J.; Reynolds, J.M. ‘Structure-from-Motion’photogrammetry: A low-cost, effective tool for geoscience applications. Geomorphology 2012, 179, 300–314. [Google Scholar] [CrossRef] [Green Version]
- Bräker, O. Measuring and data processing in tree-ring research—A methodological introduction. Dendrochronologia 2002, 20, 203–216. [Google Scholar] [CrossRef]
- Stoffel, M.; Bollschweiler, M. Tree-ring analysis in natural hazards research—An overview. Nat. Hazards Earth Syst. Sci. 2008, 8, 187–202. [Google Scholar] [CrossRef] [Green Version]
- Robinson, W.J.; Evans, R. A microcomputer-based tree-ring measuring system. Tree-Ring Bull. 1980, 40, 59–64. [Google Scholar]
- Rinn, F. TSAP-Win. Time Series Analysis and Presentation for Dendrochronology and Related Applications. Version 4.64 for Microsoft Windows. User Reference. Rinntech: Heidelberg, Germany, 2003; p. 22. Available online: http://www.rinntech.de (accessed on 22 January 2020).
- Stoffel, M.; Lièvre, I.; Monbaron, M.; Perre, S. Seasonal timing of rockfall activity on forested slope at Täschgufer (Swiss Alps)—A dendrogeomorphological approach. Z. Geomorphol. 2005, 49, 89–106. [Google Scholar]
- Bartelt, P.; Buehler, Y.; Christen, M.; Deubelbeiss, Y.; Graf, C.; McArdell, B.W. RAMMS—A Modelling System for Debris Flows in Research and Practice—User Manuel v.1.01/Hillslope Debris Flow; WSL Institute for Snow and Avalanche Research SLF: Davos, Switzerland, 2011; p. 91. [Google Scholar]
- Salm, B. Flow, flow transition and runout distances of flowing avalanches. Ann. Glaciol. 1993, 18, 221–226. [Google Scholar] [CrossRef] [Green Version]
- Voellmy, A. Über die Zerstörungskraft von Lawinen. Schweiz. Bauztg. 1955, 73, 159–162. [Google Scholar]
- Christen, M.; Bartelt, P.; Kowalski, J. Back calculation of the in den Arelen avalanche with RAMMS: Interpretation. Ann. Glaciol. 2010, 51, 161–168. [Google Scholar] [CrossRef] [Green Version]
- Christen, M.; Kowalski, J.; Bartelt, P. RAMMS: Numerical simulation of dense snow avalanches in three-dimensional terrain. Cold Reg. Sci. Technol. 2010, 63, 1–14. [Google Scholar] [CrossRef] [Green Version]
- Prado-Lallande, A. Geomorfología, Dendrocronología y Análisis Sedimentológico en la Cuenca Alta del Valle Alcalican, SW del Volcán Iztaccíhuatl. Bachelor‘s Thesis, Colegio de Geografía, Facultad de Filosofía y Letras, Universidad Nacional Autónoma de México, Mexico City, Mexico, 2017; p. 106. (In Spanish). [Google Scholar]
- La Jornada. The Newspaper of Mexico. 2012. (In Spanish). Available online: https://www.jornada.com.mx/2012/08/09/estados/033n1est (accessed on 18 September 2019).
- Gottesfeld, A.S. British Columbia flood scars: Maximum flood-stage indicator. Geomorphology 1996, 14, 319–325. [Google Scholar] [CrossRef]
- Yanosky, T.M.; Jarrett, R.D. Dendrochronologic evidence for the frequency and magnitude of paleofloods. In Ancient Floods, Modern Hazards: Principles and Applications of Paleoflood Hydrology; Water Science and Application; House, P.K., Webb, R.H., Baker, V.R., Levish, D.R., Eds.; American Geophysical Union: Washington, DC, USA, 2002; Volume 5, pp. 77–89. [Google Scholar]
- Victoriano, A.; Díez-Herrero, A.; Génova, M.; Guinau, M.; Furdada, G.; Khazaradze, G.; Calvet, J. Four-topic correlation between flood dendrogeomorphological evidence and hydraulic parameters (the Portainé stream, Iberian Peninsula). Catena 2018, 162, 216–229. [Google Scholar] [CrossRef]
- Quesada-Román, A.; Ballesteros-Cánovas, J.A.; Granados, S.; Birkel, C.; Stoffel, M. Dendrogeomorphic reconstruction of floods in a dynamic tropical river. Geormophology. in press.
- Naef, D.; Rickenmann, D.; Rutschmann, P.; McArdell, B.W. Comparison of flow resistance relations for debris flows using a one-dimensional finite element simulation model. Nat. Hazards Earth Syst. Sci. 2006, 6, 155–165. [Google Scholar] [CrossRef] [Green Version]


| Simulation | Mean (m) | Standard Deviation |
|---|---|---|
| density: 1400 kg/m3; chi: 400 | 0 | 0.43 |
| density: +25% | 0.43 | 0.72 |
| density: −25% | 0.43 | 0.72 |
| Chi: +25% | 0.39 | 0.72 |
| Chi: −25% | 0.47 | 0.73 |
| Tree Code | X-UTM | Y-UTM | Maximum Scar Height (m) | Deviation from Modelled Lahar Sediment (m) |
|---|---|---|---|---|
| 0 | 683,574.4 | 2,110,457 | 0.1 | 0.39 |
| 1 | 683,572.1 | 2,110,461 | 0.1 | −0.04 |
| 2 | 683,575.9 | 2,110,497 | 0.032 | 0.648 |
| 3 | 683,577.4 | 2,110,493 | 0.05 | 0.32 |
| 4 | 683,736.7 | 2,110,833 | 0.4 | −0.31 |
| 5 | 683,578.5 | 2,110,494 | 0.7 | −0.6 |
| 6 | 683,579.3 | 2,110,495 | 0.3 | −0.25 |
| 7 | 683,797.1 | 2,110,982 | 0.41 | 0.02 |
| 8 | 683,803.7 | 2,110,986 | 0.22 | −0.21 |
| 9 | 683,808.9 | 2,110,991 | 0.52 | 0.13 |
| 10 | 683,796.3 | 2,110,920 | 0.36 | 0.2 |
| 11 | 683,801.8 | 2,110,928 | 0.69 | −0.37 |
| 12 | 683,798.2 | 2,110,932 | 0.66 | −0.34 |
| 13 | 683,784.7 | 2,110,930 | 0.7 | 1.18 |
| 14 | 683,806.2 | 2,110,943 | 0.25 | 0.19 |
| 15 | 683,828 | 2,110,951 | 0.3 | −0.08 |
| 16 | 683,735 | 2,110,836 | 0.15 | −0.14 |
| 17 | 683,655.1 | 2,110,571 | 1.2 | 0.0 |
| 18 | 683,662.4 | 2,110,633 | 0.6 | −0.6 |
© 2020 by the authors. Licensee MDPI, Basel, Switzerland. This article is an open access article distributed under the terms and conditions of the Creative Commons Attribution (CC BY) license (http://creativecommons.org/licenses/by/4.0/).
Share and Cite
Franco-Ramos, O.; Ballesteros-Cánovas, J.A.; Figueroa-García, J.E.; Vázquez-Selem, L.; Stoffel, M.; Caballero, L. Modelling the 2012 Lahar in a Sector of Jamapa Gorge (Pico de Orizaba Volcano, Mexico) Using RAMMS and Tree-Ring Evidence. Water 2020, 12, 333. https://doi.org/10.3390/w12020333
Franco-Ramos O, Ballesteros-Cánovas JA, Figueroa-García JE, Vázquez-Selem L, Stoffel M, Caballero L. Modelling the 2012 Lahar in a Sector of Jamapa Gorge (Pico de Orizaba Volcano, Mexico) Using RAMMS and Tree-Ring Evidence. Water. 2020; 12(2):333. https://doi.org/10.3390/w12020333
Chicago/Turabian StyleFranco-Ramos, Osvaldo, Juan Antonio Ballesteros-Cánovas, José Ernesto Figueroa-García, Lorenzo Vázquez-Selem, Markus Stoffel, and Lizeth Caballero. 2020. "Modelling the 2012 Lahar in a Sector of Jamapa Gorge (Pico de Orizaba Volcano, Mexico) Using RAMMS and Tree-Ring Evidence" Water 12, no. 2: 333. https://doi.org/10.3390/w12020333