Article

Human Health Risks Associated with Recreational Waters: Preliminary Approach of Integrating Quantitative Microbial Risk Assessment with Microbial Source Tracking

1
Texas Water Resources Institute, Texas A & M AgriLife Research, 2260 TAMU, College Station, TX 77843, USA
2
UTHealth School of Public Health El Paso Campus, 5130 Gateway Blvd. East, El Paso, TX 79905, USA
3
Oklahoma Water Resources Center, 139 Agricultural Hall, Stillwater, OK 74708, USA
4
Texas A & M AgriLife Extension Service, Department of Soil and Crop Sciences, 370 Olsen Blvd., 2474 TAMU, Texas A & M University, College Station, TX 77843, USA
5
Department of Biological and Agricultural Engineering, Texas A & M University, 2117 TAMU, College Station, TX 77843, USA
6
Department of Soil and Crop Sciences, 370 Olsen Blvd., 2474 TAMU, Texas A & M University, College Station, TX 77843, USA
7
Engineering Consultant, College Station, TX 77845, USA
*
Author to whom correspondence should be addressed.
Water 2020, 12(2), 327; https://doi.org/10.3390/w12020327
Submission received: 27 November 2019 / Revised: 9 January 2020 / Accepted: 20 January 2020 / Published: 23 January 2020
(This article belongs to the Section Water Quality and Contamination)

Abstract

:
Gastrointestinal (GI) illness risks associated with exposure to waters impacted by human and nonhuman fecal sources were estimated using quantitative microbial risk assessment (QMRA). Microbial source tracking (MST) results had identified Escherichia coli (E. coli) contributors to the waterbody as human and unidentified (10%), cattle and domestic animals (25%), and wildlife (65%) in a rural watershed. The illness risks associated with ingestion during recreation were calculated by assigning reference pathogens for each contributing source and using pathogen dose–response relationships. The risk of GI illness was calculated for a specific sampling site with a geometric mean of E. coli of 163 colony forming units (cfu) 100 mL−1, and the recreational standard of E. coli, 126 cfu 100 mL−1. While the most frequent sources of fecal indicator bacteria at the sampling site were nonhuman, the risk of illness from norovirus, the reference pathogen representing human waste, contributed the greatest risk to human health. This study serves as a preliminary review regarding the potential for incorporating results from library-dependent MST to inform a QMRA for recreational waters. The simulations indicated that identifying the sources contributing to the bacterial impairment is critical to estimate the human health risk associated with recreation in a waterbody.

1. Introduction

A few studies have attempted to analyze the human health risk from recreation in waterbodies predominantly contaminated by nonhuman sources of fecal bacteria [1,2,3,4,5]. Microbial source tracking (MST) utilizes genetic or phenotypic tests to identify host-specific microbial strains and evaluate contributing sources of microbial contamination [6]. Coupling MST analyses with a subsequent quantitative microbial risk assessment (QMRA) approach is a relatively novel, site-specific, integrated approach that could potentially enhance the capacity for determining associated human health risks resulting from recreation in a selected waterbody. The present study explores the strengths and weaknesses of an integrated MST-QMRA approach for a particular watershed in Texas.
Microbial contamination of waterbodies is a significant water quality concern. Between 1986 and 2000, 5905 cases of illness and 95 outbreaks were associated with recreational waters. Of the 5905 cases, nearly a third resulted in gastrointestinal illnesses [7,8]. Indicator organism concentrations are used by regulatory agencies and public health officials to evaluate water quality for recreational activities. The regulatory standards applied to assess recreational waters specifically for primary contact recreation in freshwater, which is used in most states, is 126 colony-forming units (cfu) 100 mL−1 Escherichia coli (E. coli) (geometric mean over 30 days) [9]. Primary contact recreation includes activities such as swimming, bathing, surfing, water skiing, tubing, playing in water, and other water activities that would result in immersion and ingestion of water [9]. Following the USEPA National Epidemiological and Environmental Assessment of Recreational (NEEAR) water study, the definition of a gastrointestinal (GI) illness was revised to exclude fever as a symptom and to extend the incubation period of illness from 10 to 12 days, to account for viral pathogens. In addition, the acceptable risk level has been adjusted from 8 cases of a GI illness per 1000 individuals to 36 cases of a NEEAR-GI (NGI) illness per 1000 individuals [9].
Reference pathogens can be used in place of fecal indicator bacteria (FIB), such as E. coli, to evaluate the risk of illness in QMRA [1,2,3,4,5]. The reference pathogens used in the assessment have dose–response relationships and are representative of pathogens potentially of concern for exposure during recreation in a water body. Applying reference pathogens and QMRA with reference to MST results to calculate the potential human health risks from nonhuman sources has not been extensively studied [1,3,4,9,10,11]. The USEPA has recently acknowledged the significance and applicability of QMRA to calculate the potential human health risks from nonhuman sources [9,10]. Previous studies have estimated the human health risks associated with hypothetical sites at the regulatory limit of 126 E. coli cfu 100 mL−1 and 35 enterococci cfu 100 mL−1 by assigning reference pathogens for different fecal contamination sources, including Giardia spp., Cryptosporidium spp., Salmonella enterica, norovirus, E. coli O157:H7, and Campylobacter jejuni [1,3]. When using the regulatory standard for enterococci (35 cfu 100 mL−1) to calculate the risk of GI illnesses from different fecal contamination sources, including gull fecal waste, represented by Campylobacter jejuni and Salmonella enterica, and publicly owned sewage treatment works (POTW) waste, represented by norovirus, Giardia intestinalis, Cryptosporidium spp., and Salmonella enterica, the risk of illness from the gull fecal waste was found to be two log10 units lower than the illness benchmark of 0.01 as well as less than the risk of infection from POTW waste [1]. The risk of infection and illness associated with waterbodies impacted by human and nonhuman fecal waste sources appears to be predominantly influenced by the source that has the greatest potential for human infection [3].
The objective of this study was to conduct a QMRA estimating the risk for GI illness using MST data describing the primary sources contributing to a bacteria impairment in a particular waterbody. Integrating MST and QMRA, such as in this assessment, has the potential to inform policy decisions for waterbodies impacted by nonhuman sources of fecal contamination and further facilitate the development of site-specific standards. This preliminary analysis may serve as a model for future studies seeking to integrate MST and QMRA for improved risk assessment and management.

2. Materials and Methods

2.1. Study Area

Walnut Creek is a tributary of the Leon River in the Brazos River Basin in Texas and flows through a predominantly rural region encompassing row crops and rangeland [12]. Dairy cattle and concentrated animal feeding operations (CAFOs) exist in the northern part of the watershed, upstream of sampling site LEO 2. Moreover, many residences and businesses located throughout the watershed have on-site wastewater treatment systems [12,13]. Extensive monitoring via monthly grab samples of E. coli and MST analyses were conducted from 2011 to 2012 to determine the contributing sources of bacteria pollution in the river and its tributaries. The geometric mean for E. coli at sampling site LEO 2 (USGS Station ID: 17379) on Walnut Creek was 163 cfu 100 mL−1, which exceeded the recreational standard. The MST data presented in this study and used for the assessment was data that had previously been published in technical documents used to inform watershed management efforts. It is beyond the scope of this microbial risk assessment to extensively review the methods by which the MST samples were analyzed, but instead to apply data released for watershed planning efforts in the context of a different water management approach, QMRA.
The MST analyses combined ERIC-PCR and Riboprinting in which isolates from water samples were compared against the Texas MST Library and a local library to identify sources and enhance accuracy of results. Known source fecal samples and E. coli isolates from water samples were DNA fingerprinted using the ERIC-PCR method [14]. Following ERIC-PCR analysis, E. coli isolates from water and fecal sources were RiboPrinted with the automated DuPont Qualicon RiboPrinter and restriction enzyme HindIII. ERIC-PCR and Riboprinting were performed according to previously published methods [15]. The Applied Maths BioNumerics software was further used the analyze the composite ERIC-RP DNA fingerprints. These techniques are considered moderately high in accuracy and have been extensively used for MST work in Texas recreational waters [16]. The Texas MST Library is composed of E. coli isolates from 12 different watersheds in Texas and includes over 8812 isolates from 2519 fecal source samples, representing humans and more than 130 different animal subclasses [6]. MST results for the specific sampling site were presented as a “four-way split” that quantified source percentages in the waterbody: cattle, domestic animals, wildlife, and human (included unidentified isolates). The wildlife category included both avian and non-avian species. The “unidentified” category listed in the MST results represent the percentage of isolates not identified with at least 80% similarity with a library isolate and were, therefore, included with the human source to conduct a worst-case scenario assessment. Wildlife and cattle/domestic animals were each combined into groups and assigned a single reference pathogen due to limited differentiation between individual species in the MST analysis and the lack of available pathogen density, infectivity, and illness data for each species. The cumulative pathogen dose was developed from the three different fecal source categories: human/unidentified, cattle/domestic animals, and wildlife. The contribution of each source to the E. coli concentration as described by the MST results was used to calculate the reference pathogen dose.
Results obtained from the MST analysis of Walnut Creek were used in a QMRA to calculate the risk of a GI illness. The risk was calculated for a site with E. coli levels exceeding the U.S. EPA regulatory standard of 126 cfu 100 mL−1. The total probability of illness, which combined the illness risk from both human sources (assumed to include secondary wastewater effluent and potentially raw sewage from bather shedding, failing septic systems, and leaking wastewater infrastructure), cattle/domestic animals, and wildlife, was calculated to determine if the illness risk was within the acceptable benchmark level of 0.036 [9].

2.2. E. coli Monitoring Data

Surface water quality data included MST percentages and E. coli concentrations that were used to calculate the geometric means for sites monitored in the Leon River watershed [12]. To consider seasonality, one year of monitoring data, which included monthly grab samples, were used. The data were part of a Texas State Soil and Water Conservation Board (TSSWCB) funded project supplementing the development and implementation of a Watershed Protection Plan (WPP) for the Leon River Watershed. While 12 sampling events were scheduled, drought conditions prevented samples from being collected for four scheduled events. The geometric mean for site LEO 2 was composed of the eight grab samples that were analyzed. Sampling site LEO 2 was used as the site for the risk assessment because the available MST data included only 3% unidentified sources [12]. The sampling and MST analyses were conducted by the Texas Water Resources Institute and were published in technical documents used to develop a watershed protection plan for the Leon River. For the present assessment, the data are used to examine the feasibility of applying available MST data in a QMRA.

2.3. Reference Pathogens

Reference pathogens were used to assess the infectivity of microbial groups that cause GI illnesses and those applied had also been used in prior risk assessments [1,2,3,17,18]. Norovirus represented human fecal contamination because it has been found to be an etiologic agent of concern and contributor to observed swimming-associated GI illnesses from contact recreation in human waste-impacted water bodies [2]. Campylobacter represented fecal contamination from cattle and domestic animals because of its predominance in livestock feces, occurrence in aquatic environments, and environmental persistence [10]. The USEPA lists Campylobacter as one of the pathogens predicted to be a dominant risk agent in water affected by cattle, pig, and chicken waste [10].
We found few studies that used reference pathogens to determine the risk of infectious human strains transported in wildlife fecal waste. Cryptosporidium spp. appeared to be a useful reference pathogen for addressing the illness risks from wildlife fecal waste present in a surface waterbody used for recreation. Cryptosporidium has been a commonly identified pathogen in waterborne outbreaks recorded in the United States [19]. While there is minimal conclusive molecular evidence linking water sources contaminated with Cryptosporidium by wildlife to cryptosporidiosis in humans, associated human health risks do exist [20]. A range of Cryptosporidium species and genotypes have been identified in a variety of water sources, which include both wildlife adapted genotypes and unidentified “environmental sequences”. The unidentified “environmental sequences” most likely represent wildlife genotypes but may potentially be emerging human pathogens [20]. Cryptosporidium is known to infect a variety of vertebrate hosts, although recent research has indicated that the wildlife genotypes of this pathogen can be host-specific and not always human-adapted, therefore, affecting the infectivity of the pathogens on humans [19,20,21].

2.4. Exposure Variables and Dose Calculations

Several variables and assumptions were selected when developing exposure scenarios. Adult populations were assessed because of the availability of dose–response data and water ingestion rates. While other routes of exposure (i.e., inhalation, dermal, and conjunctive exposure) can occur, data for ingestion values were more readily available in the literature and were the primary route of interest for this study. Input estimates used for water ingestion for adults have been described as a fitted normal distribution with an arithmetic mean of 25 mL h−1 and a standard deviation of 5 mL h−1 [22,23]. This risk assessment assumes that the total duration for water exposure will be one hour.
The densities of E. coli and the selected reference pathogens were used to calculate the dose ingested. The following modified equation was used to calculate the dose of each reference pathogen [1,3]. The equation follows the assumption that fecal pollution is fresh and directly deposited into the water, and not aged. While these conditions may not be as realistic of actual environmental conditions, they serve as a worst-case scenario.
D R P S   =   C E .   c o l i   × F s R E .   c o l i   S × 100 × R R P S × P R P S × I R P S × V
where
  • D R P S   is the dose of reference pathogen (# oocysts, viral particles, or CFU)
  • S is the specified source
  • C E .   c o l i is the concentration of the bacterial indicator E. coli in the waterbody ( cfu   100   mL 1 )
  • F s is the fraction of the total amount of indicator bacteria from the specific source
  • R E .   c o l i S is the density of the bacterial indicator, E. coli, to the wet mass of the nonhuman waste or human waste ( cfu   g 1 or   cfu   L 1 )
  • R R P S is the density of the reference pathogen in the fecal waste (wet mass) or in sewage ( cfu   g 1 or   cfu   L 1 )
  • P R P S is the prevalence of infection for the reference pathogen and source
  • I R P S is the infectious potential of the reference pathogen in humans
  • V is the water volume ingested (mL)
The range of E. coli concentration in wildlife fecal waste was calculated by taking the log10 of the lowest and highest E. coli concentration measured in a variety of Texas wildlife waste [24,25]. Table 1 lists the input parameters used in this assessment for calculating the ingested dose of each pathogen. The prevalence of infection describes the percentage of animals likely shedding the selected reference pathogen at any given time. Herd level prevalence was not assessed and conservatively assumed to be 100%, similar to assumptions made in other QMRA studies [3,5]. The range for the prevalence of infection of Cryptosporidium in wildlife was retrieved from a study that synthesized published concentrations of Cryptosporidium oocysts in wildlife fecal waste in the United States [26]. The prevalence of infection for humans, when using the reference pathogen norovirus, was assumed to be 100%. This assumption is based upon the understanding that a sample of primary sewage or treated wastewater will be estimated to have a prevalence of 100% for norovirus being detected. The values selected to describe the infectious prevalence for cattle/domestic animals, utilizing the reference pathogen Campylobacter jejuni, have been used for cattle in other risk assessment studies. C. jejuni has been identified as one of the most significant disease-causing species of Campylobacter found in livestock from human feces, animal feces, and in environmental samples [3,5,10].
Quantitative values for the human infectious potential or relative fraction of human infectious strains for each reference pathogen and nonhuman fecal source are limited in the literature. However, including ranges for the infectious potential of a pathogen is necessary since recent studies have indicated that the human health risk may be overestimated when not considering the different source genotypes of a pathogen [1,3,5,27]. Similar to the methods employed by referenced QMRA studies, qualitative values (low, medium, and high) were assigned to account for the range in pathogenicity for each reference pathogen [3,5]. Assigning quantitative values for the Campylobacter infectious potential is challenging since several factors affect serotype prevalence and infectivity, including animal age, season, region of the farms, and location of isolate sampling. The infectivity of Campylobacter for humans varies among species and isolates with the prevalence of specific strains differing in both humans and animals [3]. Serotyping of Campylobacter has indicated that linked isolates in an outbreak or from human patients are often the same serotypes found in domestic animal species. Serotypes that have greater overlap among isolate groups, such as for humans and domestic animals, indicate a greater potential for infectivity [28,29]. An analysis of C. jejuni serotypes using the heat-stable Penner scheme was conducted in poultry, cattle, swine, and hospital patients in Denmark. Among the human clinical isolates, 62% of C. jejuni isolates had the O:1, 44, O:2, and O:4 complex serotypes. The same serotypes were found to be common in poultry and cattle, indicating large overlap and, therefore, a potential significant source for human campylobacteriosis [30]. Since C. jejuni has been found to be prevalent among several different livestock and domestic animal species (cattle, chickens, and pigs), the infectious potential is assumed to be high, with an assigned infectious potential ranging from 67% to 100% [3,4,5]. Most Cryptosporidium genotypes have been determined to have a narrow host range, and while humans can be included in the host range, most wildlife species are considered to not contribute to a significant public health concern [26]. Recent efforts to genotype Cryptosporidium species in water sources have indicated that many of these genotypes may not be human-adapted strains of the pathogen, but rather host-adapted strains for wildlife and other animals [20]. Infectivity for wildlife is, therefore, considered low, ranging from 0 to 33% [3,5]. Human infectivity is considered 100% for norovirus since the virus is host-specific and the human waste source is assumed to include sewage.
The dose–response model parameters described in Table 1 were used to determine the probability of infection for each source and its reference pathogen in the risk characterization of the risk assessment. Both dose–response models for Campylobacter jejuni and Cryptosporidium spp. have been previously used in other QMRA studies [3,4,5]. While norovirus has recently been used as a pathogen of interest in QMRA studies, there is a lack of consistency as to which applied dose–response model is most acceptable for drinking and recreational water outbreaks [18]. The norovirus dose–response model has previously been presented a beta-binomial function model, based on the confluent hypergeometric function; it further required harmonization of laboratory and environmental data as well as ignoring aggregation of viral particles [31]. The secretor status of the affected individual was not considered with these dose–response values, but it was assumed that the GII strain of norovirus would be the pathogen of concern. The GII.4 strain (commonly referred to as the GII strain) of norovirus is responsible for at least 80% of norovirus infections globally [32]. Assumptions in the model included modeling the infection based on individual exposure and assuming there is no Poisson distribution [31]. These assumptions allow the dose–response curve for norovirus to be simplified to a beta-binomial distribution.

2.5. Calculating Total Probability of Illness for a Mixture of Fecal Sources

The total probability of illness (Pill) was calculated to account for the overall human health risk from a mixture of fecal sources. The parameter P i l l s describes the probability of a GI illness from each reference pathogen (representing a fecal source). The formula computes the overall risk in the case that the individual risks are low or high, ensuring that a total probability risk value is below one [38].
P i l l   =   1 ( 1 P i l l S )

2.6. Characterizing Human Health Risk

The probabilities of a gastrointestinal illness resulting from primary contact recreation in a waterbody exceeding the bacteria standards were evaluated when a mixture of fecal sources was present. A probabilistic analysis was employed for several input parameters used in the dose formula (see Table 1). Applying a probabilistic approach to develop probability distributions for several parameters assists in evaluating the uncertainty in the risk model and identifying which parameters contributed the greatest amount of uncertainty [39].
A Monte Carlo analysis of 10,000 simulations was conducted in Crystal Ball Pro® software (Oracle Corp., Redwood Shores, CA, USA) to develop a distribution of the pathogen dose from each source, as well as to estimate the probability of illness. The probability of a GI illness based on the reference pathogen input from three fecal sources was estimated. The risk estimates (for a GI illness) were calculated with a 95% confidence level, and the median, 5th, 25th, 75th, and 95th percentile values of each risk estimate for each scenario were reviewed. The scenarios assessed the effects of changing the contributing percentages of different sources on the overall human health risk. The simulated scenarios included: (a) each fecal source contributes 100% to the FIB concentration; (b) each fecal source contributes based upon results: 10% human (combined with unidentified), 25% cattle/domestic animals, and 65% wildlife; (c) each fecal source contributes based upon modified MST results, separating cattle and domestic animals: 7% human, 20% cattle, and 73% wildlife/domestic animals/unidentified.

3. Results

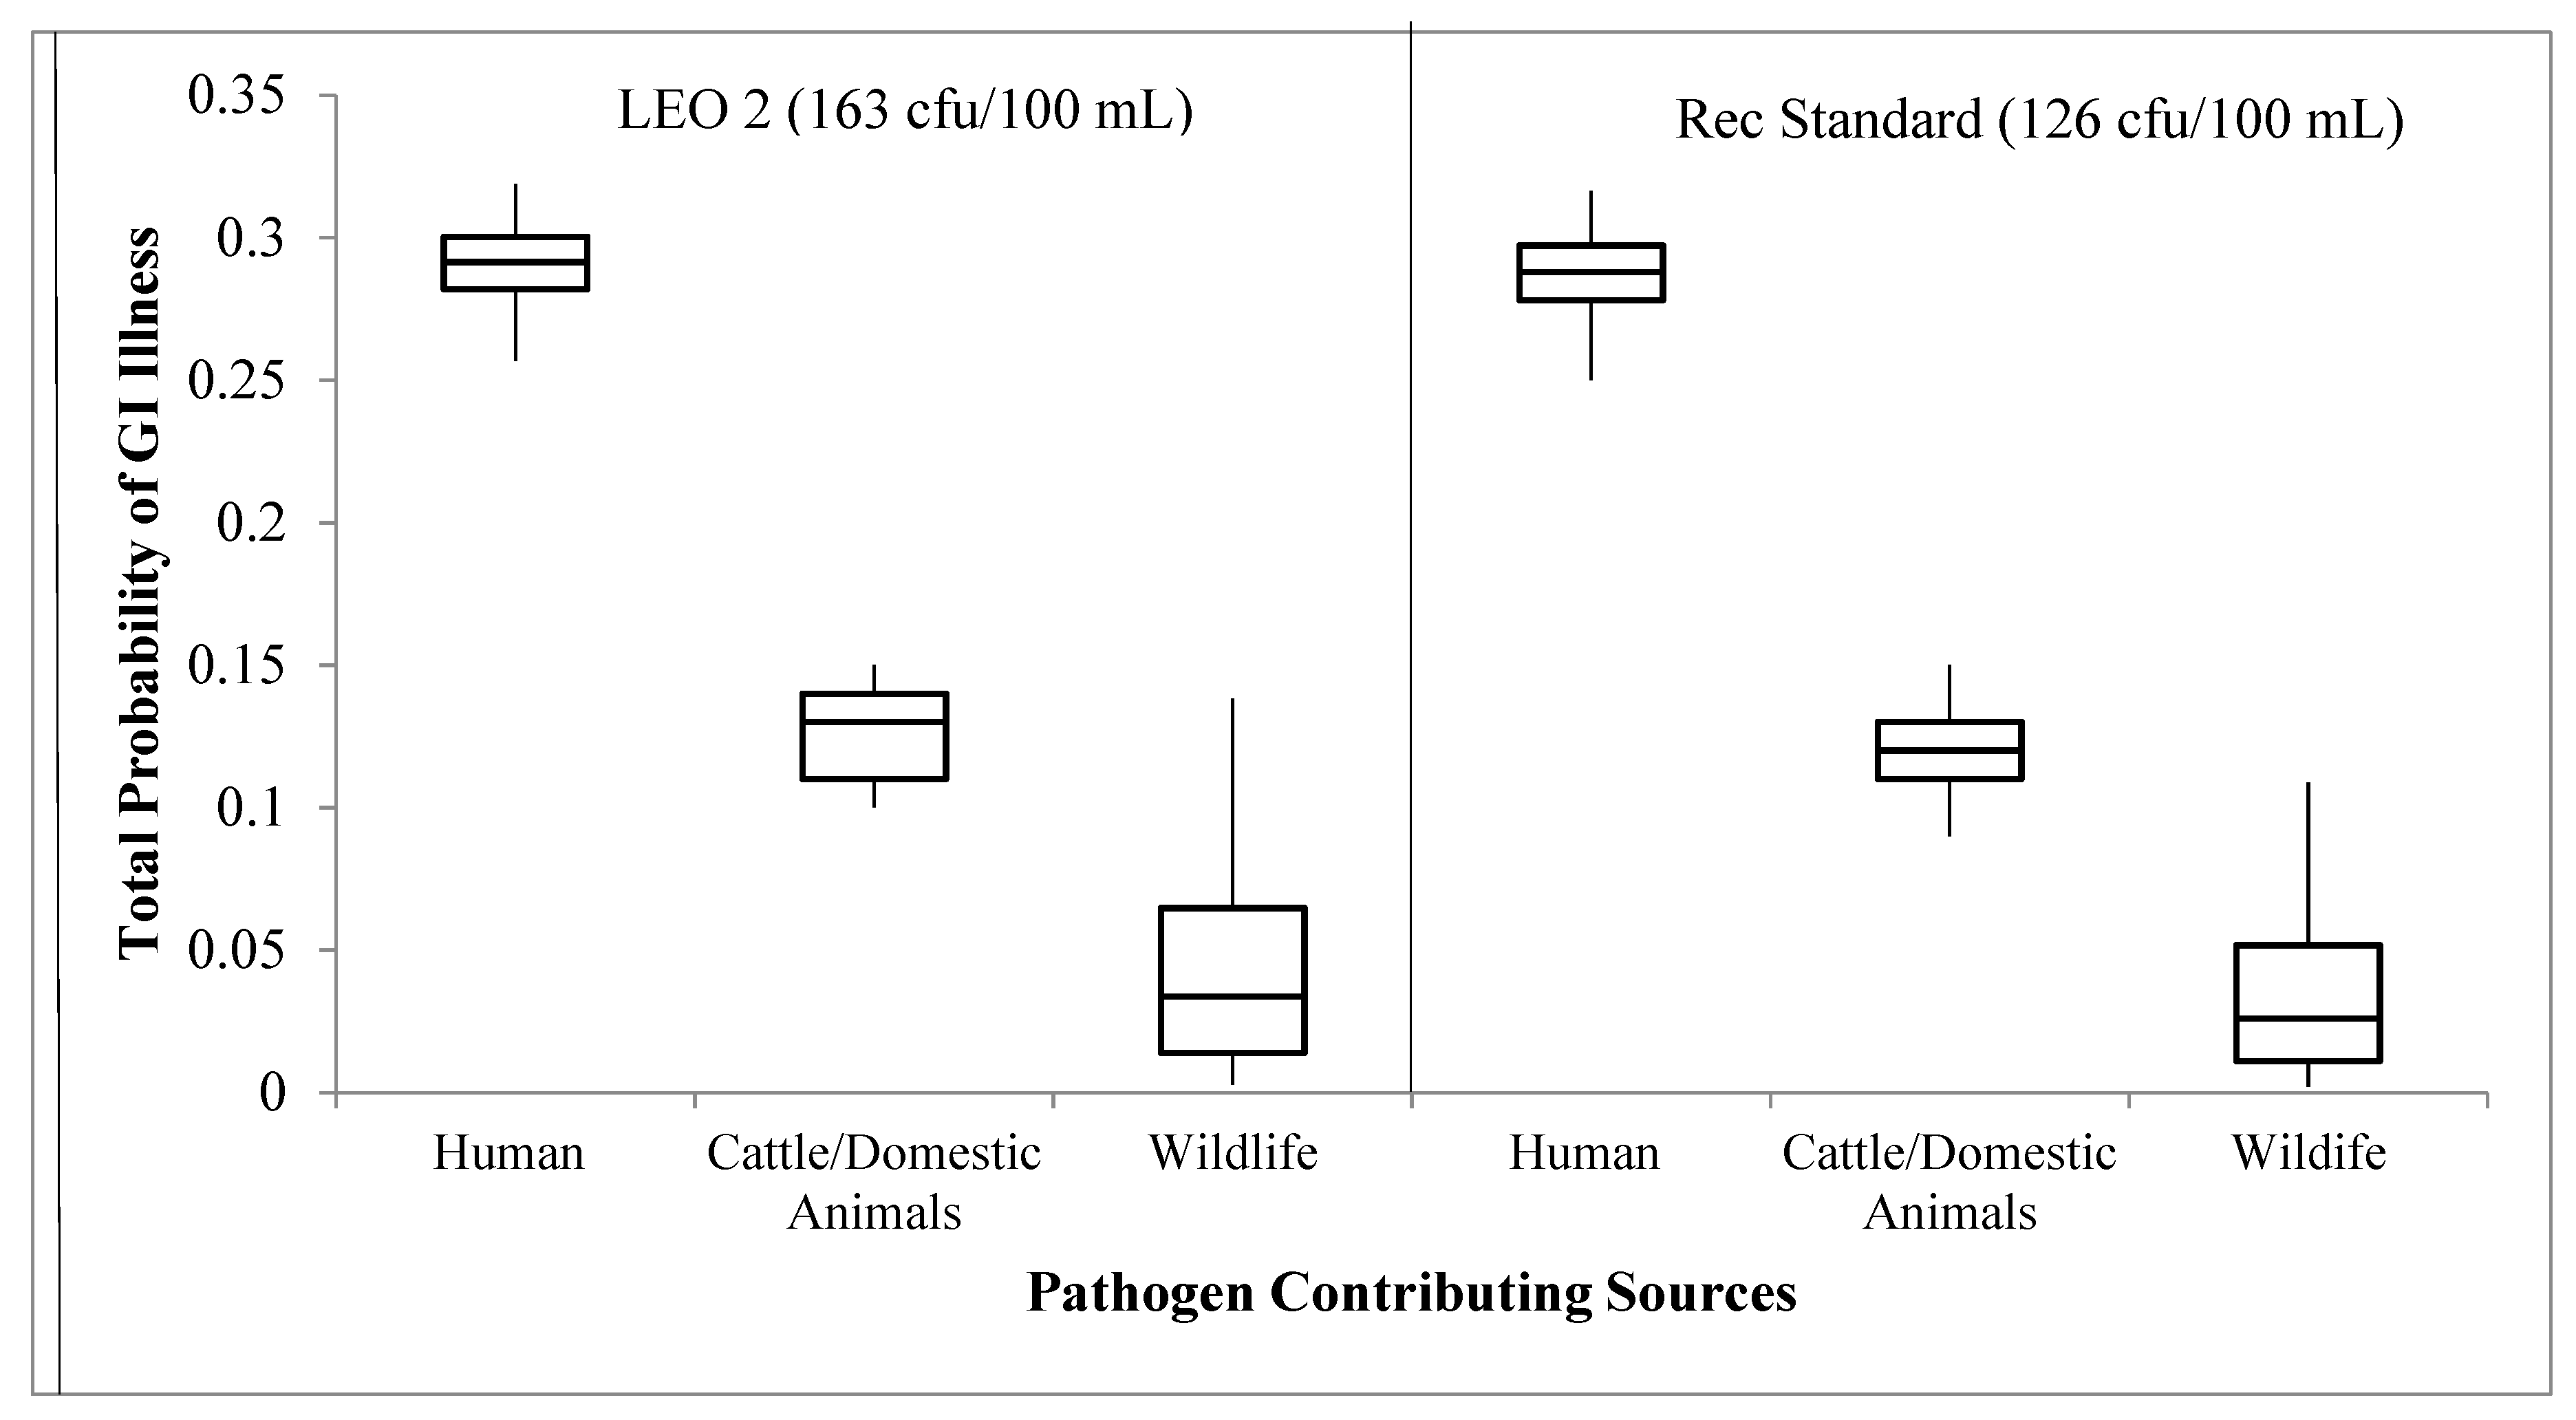
3.1. Scenario 1: Each Source Contributing 100%

When calculating risk under Scenario 1, the greatest median risk for GI infection and illness was estimated to be contributed by the human source, represented by norovirus illness (0.29). The lowest median risk among the three sources was wildlife (0.03), represented by Cryptosporidium illness (Figure 1). However, the variance was much greater for the wildlife source than for either the human or cattle/domestic animal sources as expected because of the range of species represented. Cattle/domestic animals, as measured through Campylobacter illness, had a median risk for a GI illness (0.13) slightly greater than wildlife, but less than for human sources. The median calculated risk for a GI illness for each source at LEO 2 was similar to the mean calculated risk of illness under the recreational standard (126 cfu/100 mL of E. coli) (Figure 1).

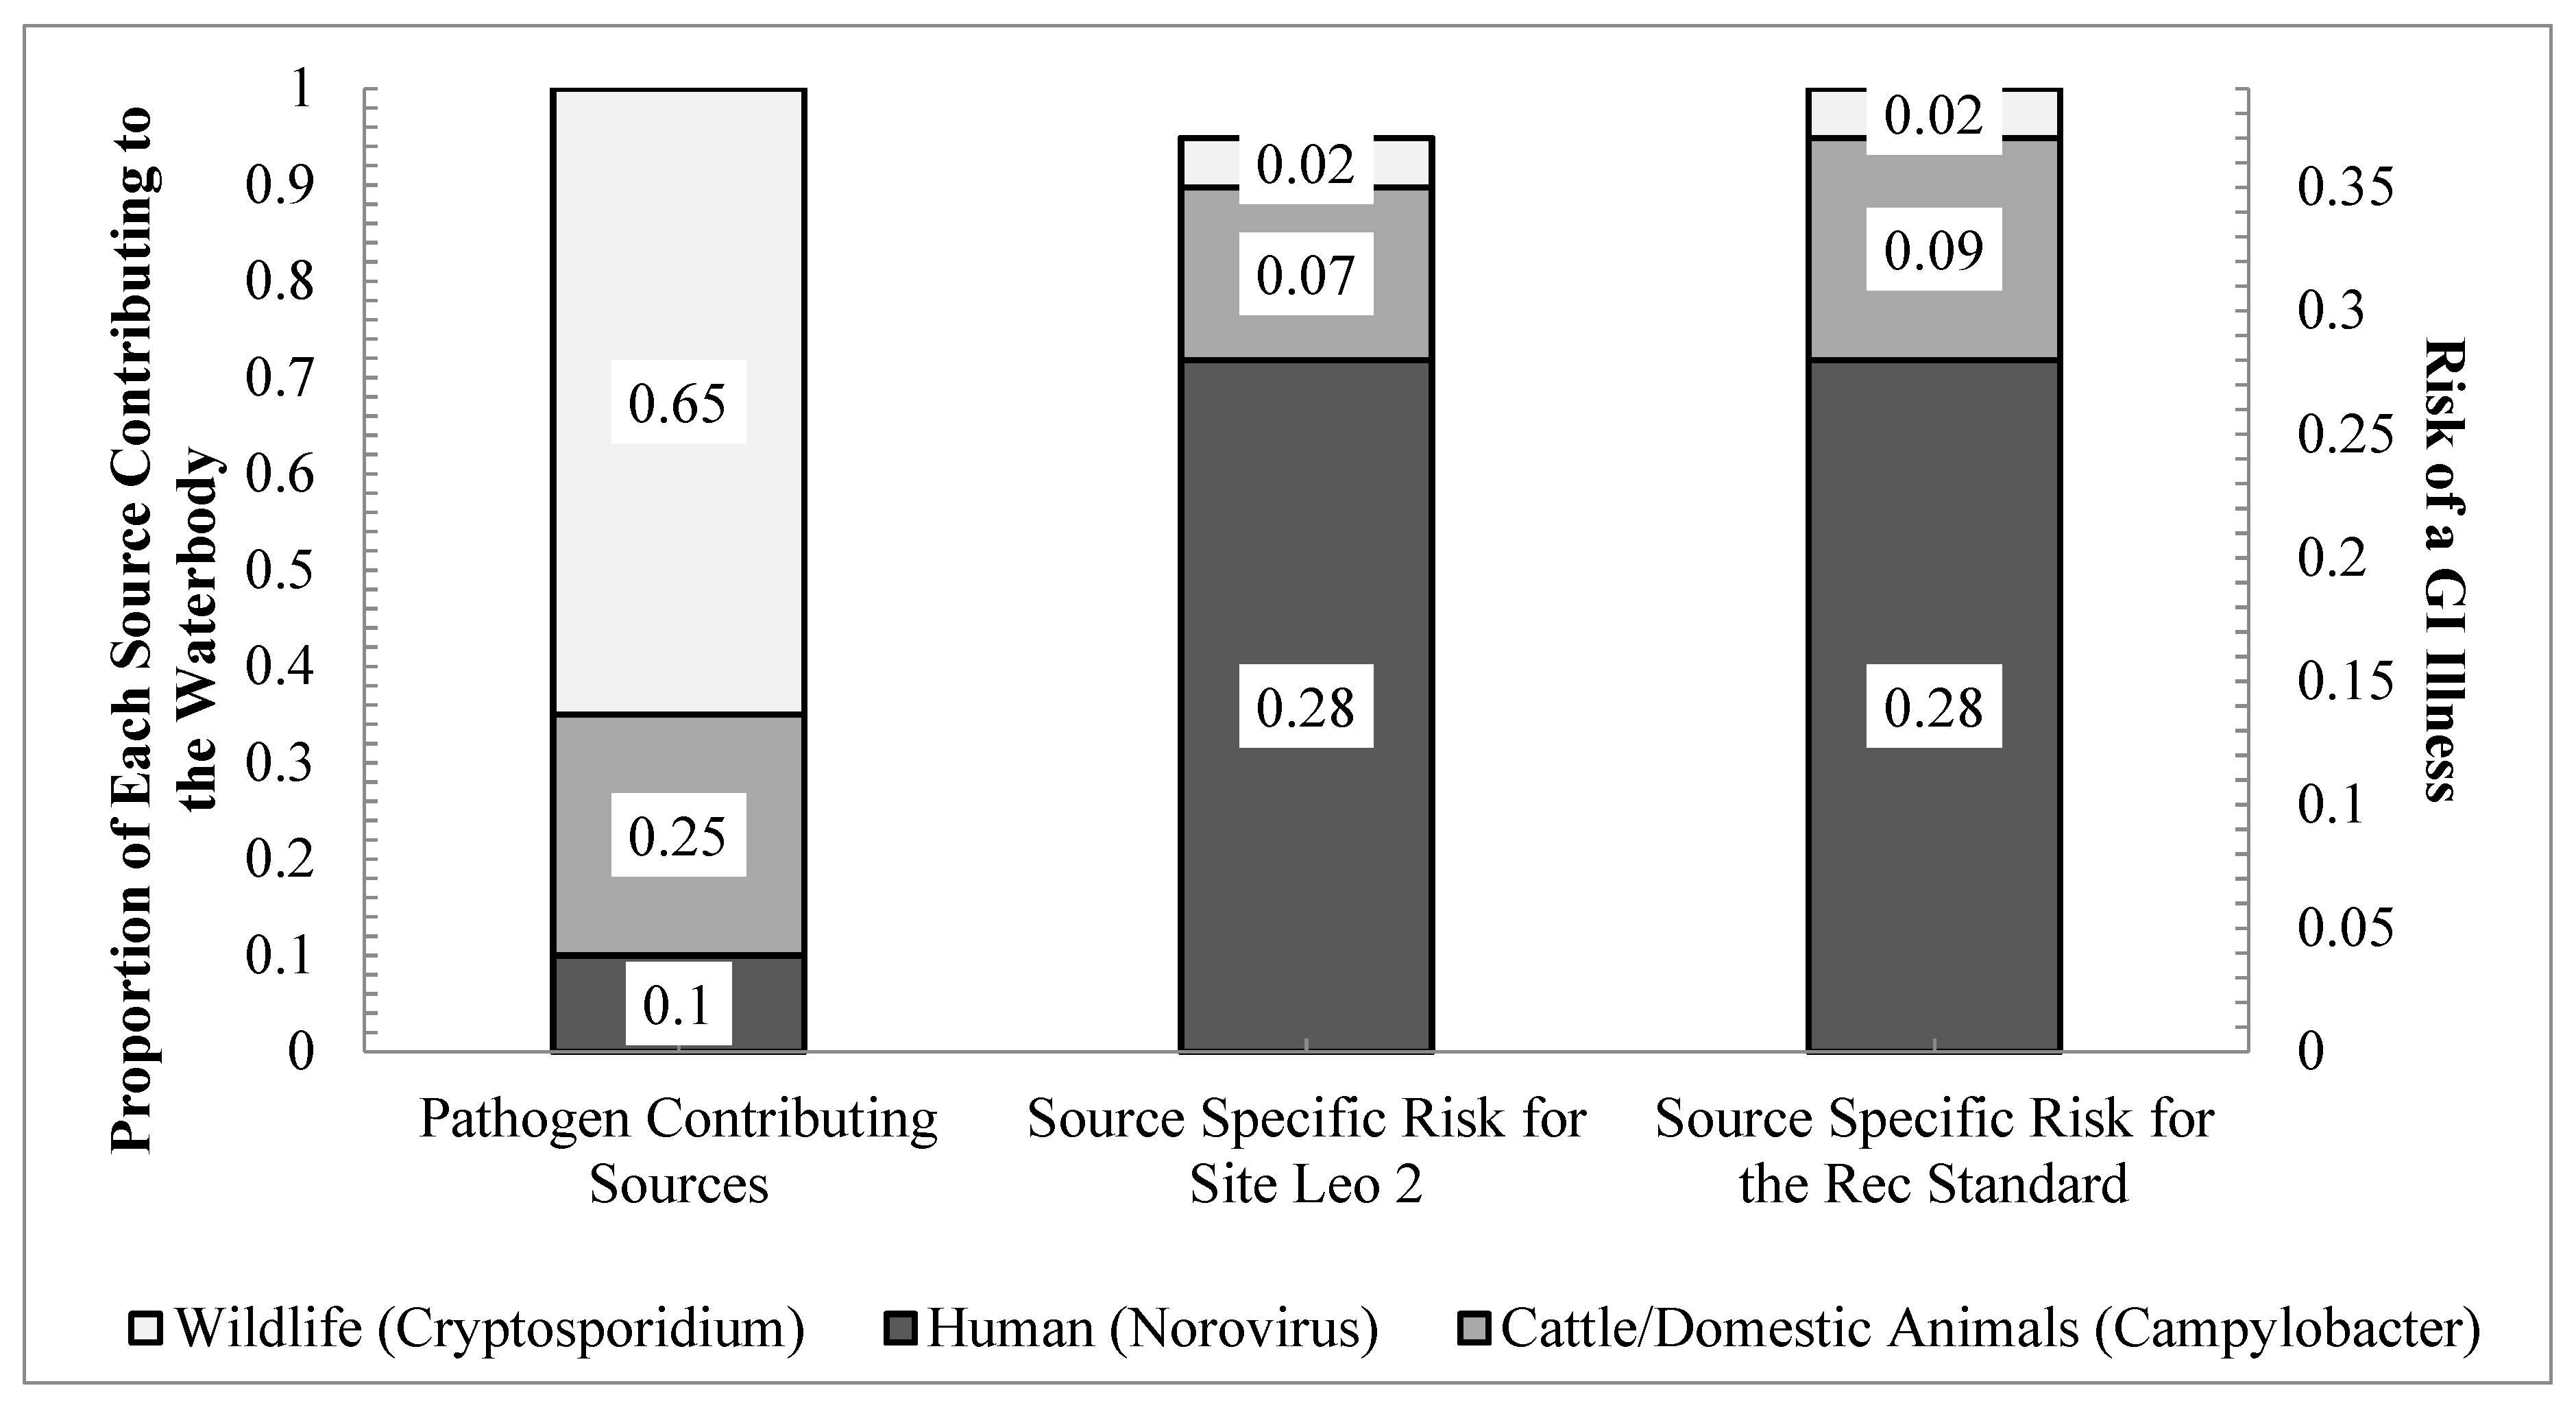
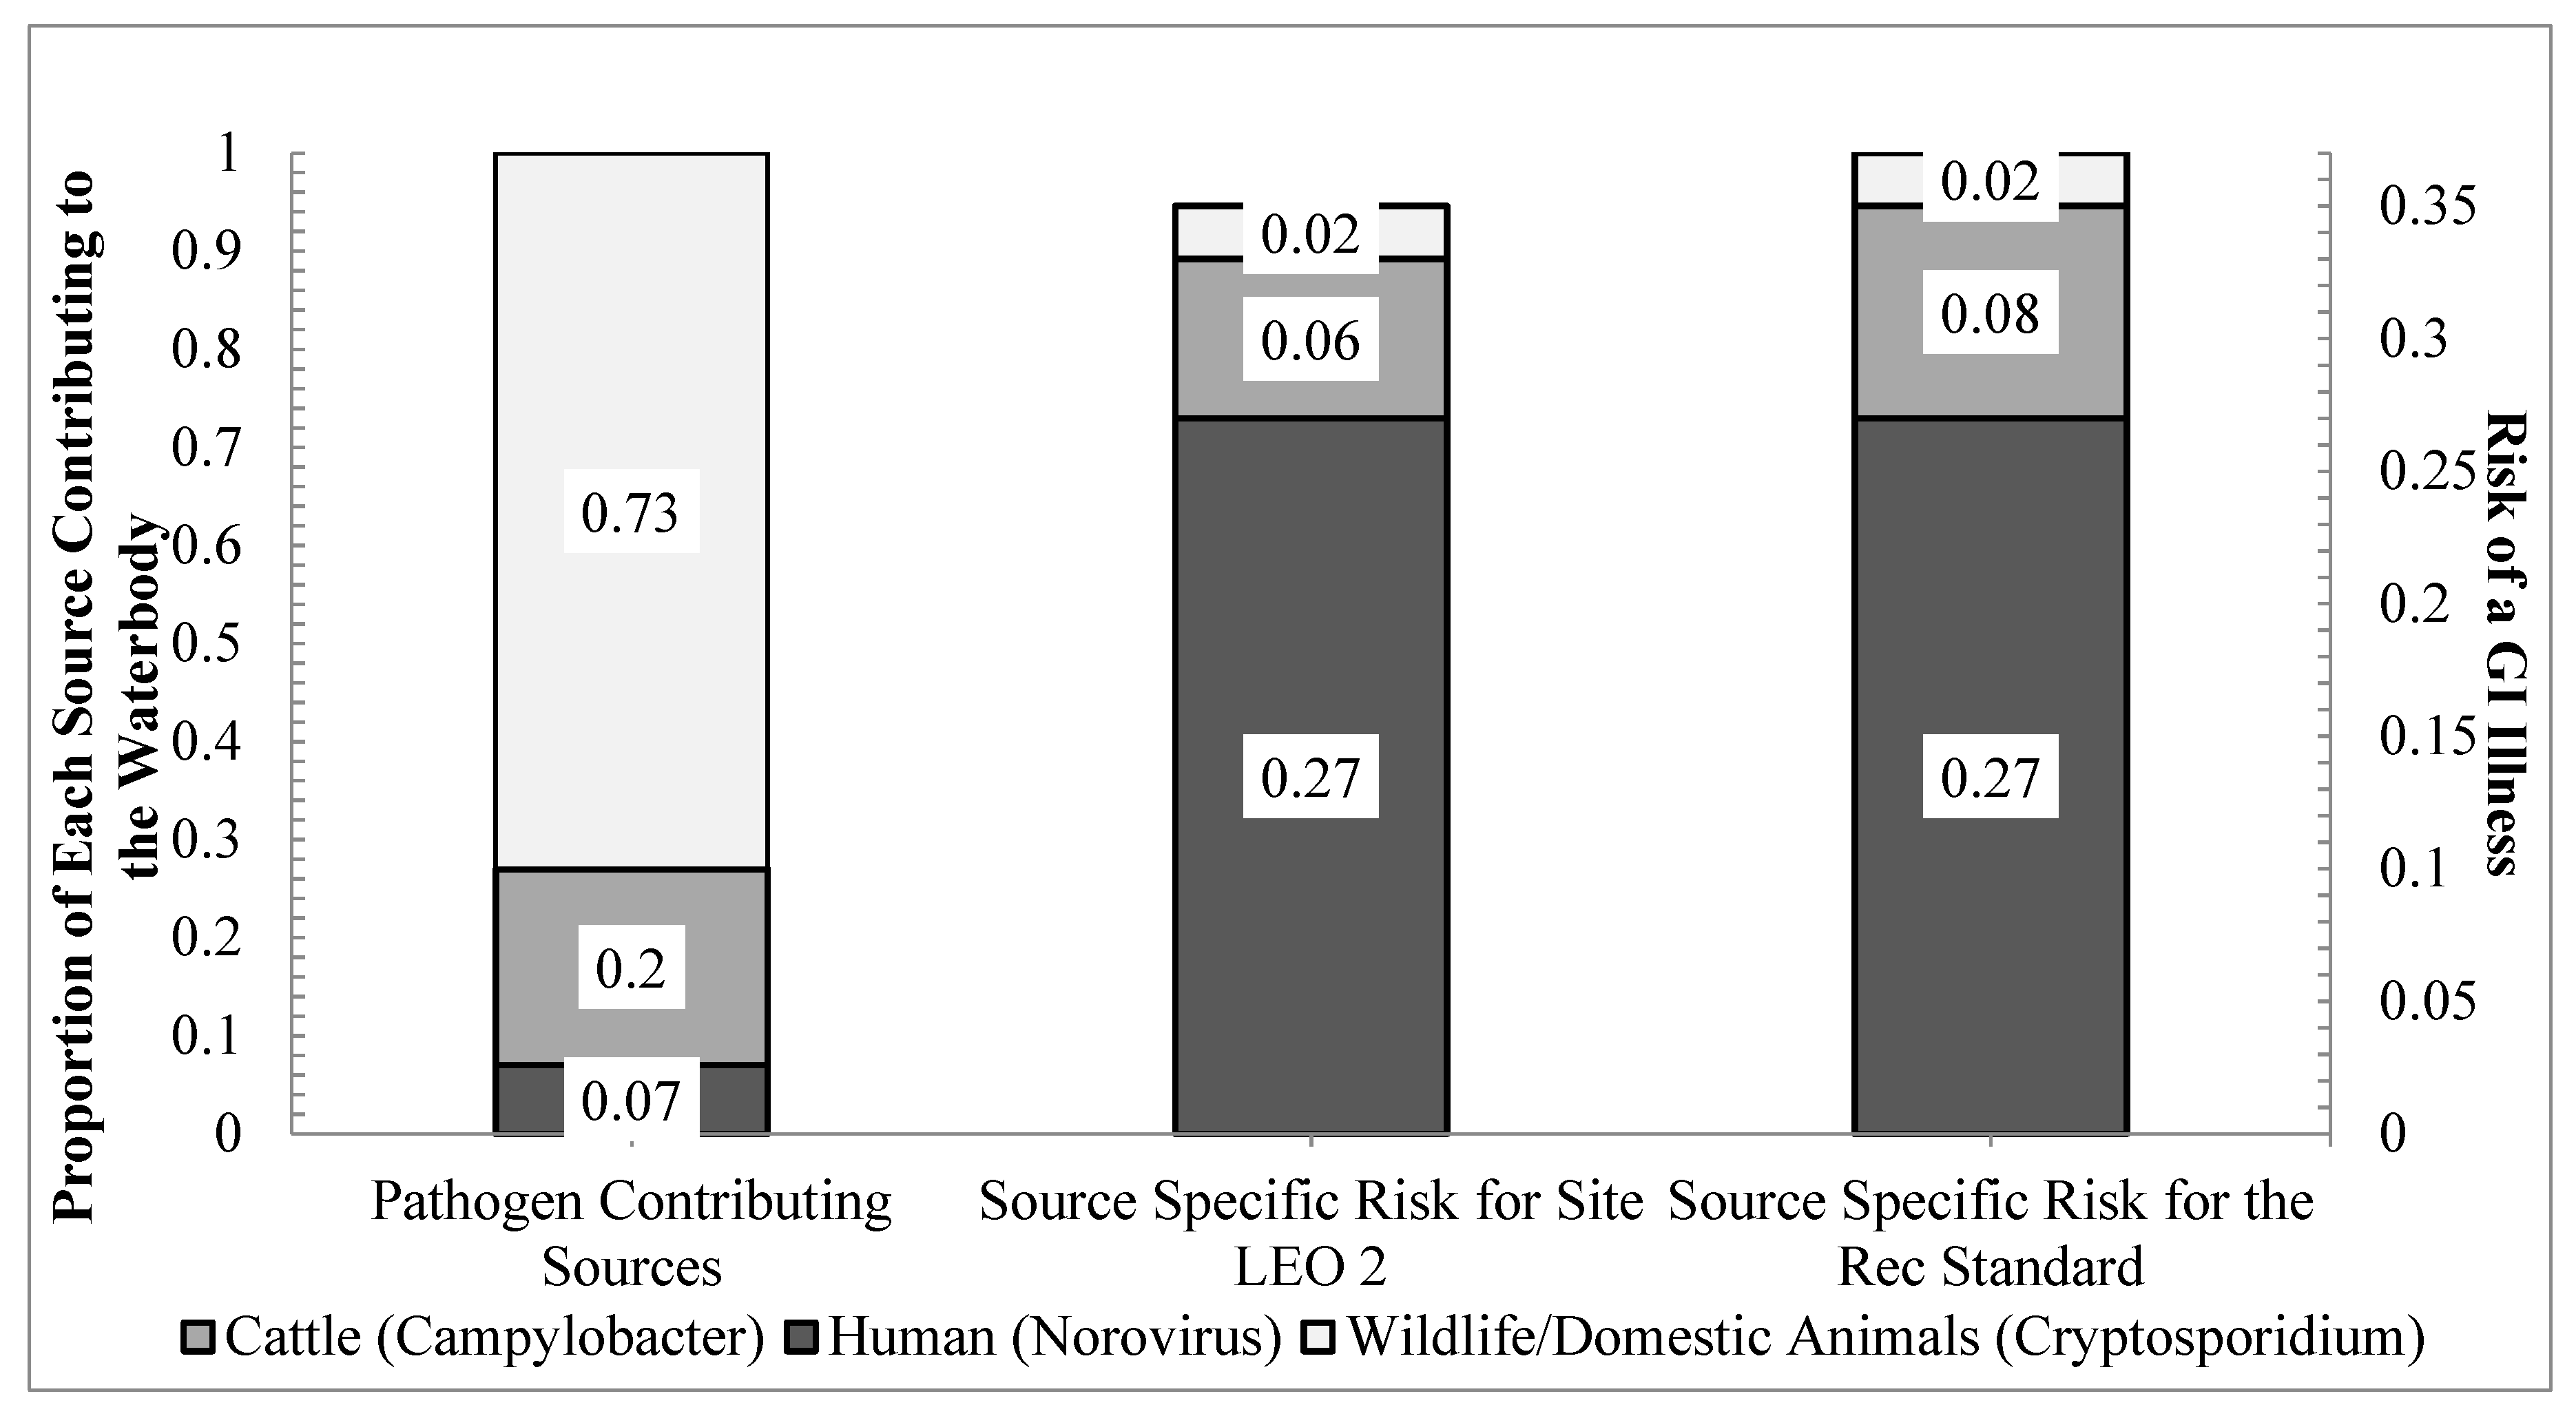
3.2. Scenarios 2 and 3: Source Contributions Based on MST and Modified MST Results

Under Scenario 2, the human health risk was calculated assuming each source contributed a specific proportion of the E. coli load, as determined by MST (Figure 2). Scenario 3 was simulated using modified MST proportions, combining domestic animals and unidentified sources with wildlife, to produce a less conservative estimation (Figure 3). As expected from the previous results, the human source contributed to the greatest health risk despite contributing the least to the bacterial concentration and loading. Wildlife, the largest contributing source, resulted in the least human health risk. The total difference in health risk between LEO 2 and the recreational standard was negligible (Figure 2).
Scenario 3, with the human source only contributing 7% to the FIB concentration, served as the least conservative estimate for the risk to human health; however, the overall estimated risk was similar to Scenario 2. The human source was again found to contribute the greatest to the overall risk followed by cattle, and wildlife/domestic animals for both LEO 2 and the recreational standard (Figure 3). The median risks for a GI illness for each source (as they contribute to the total probability for a GI illness) under each scenario are listed in Figure 2 and Figure 3.

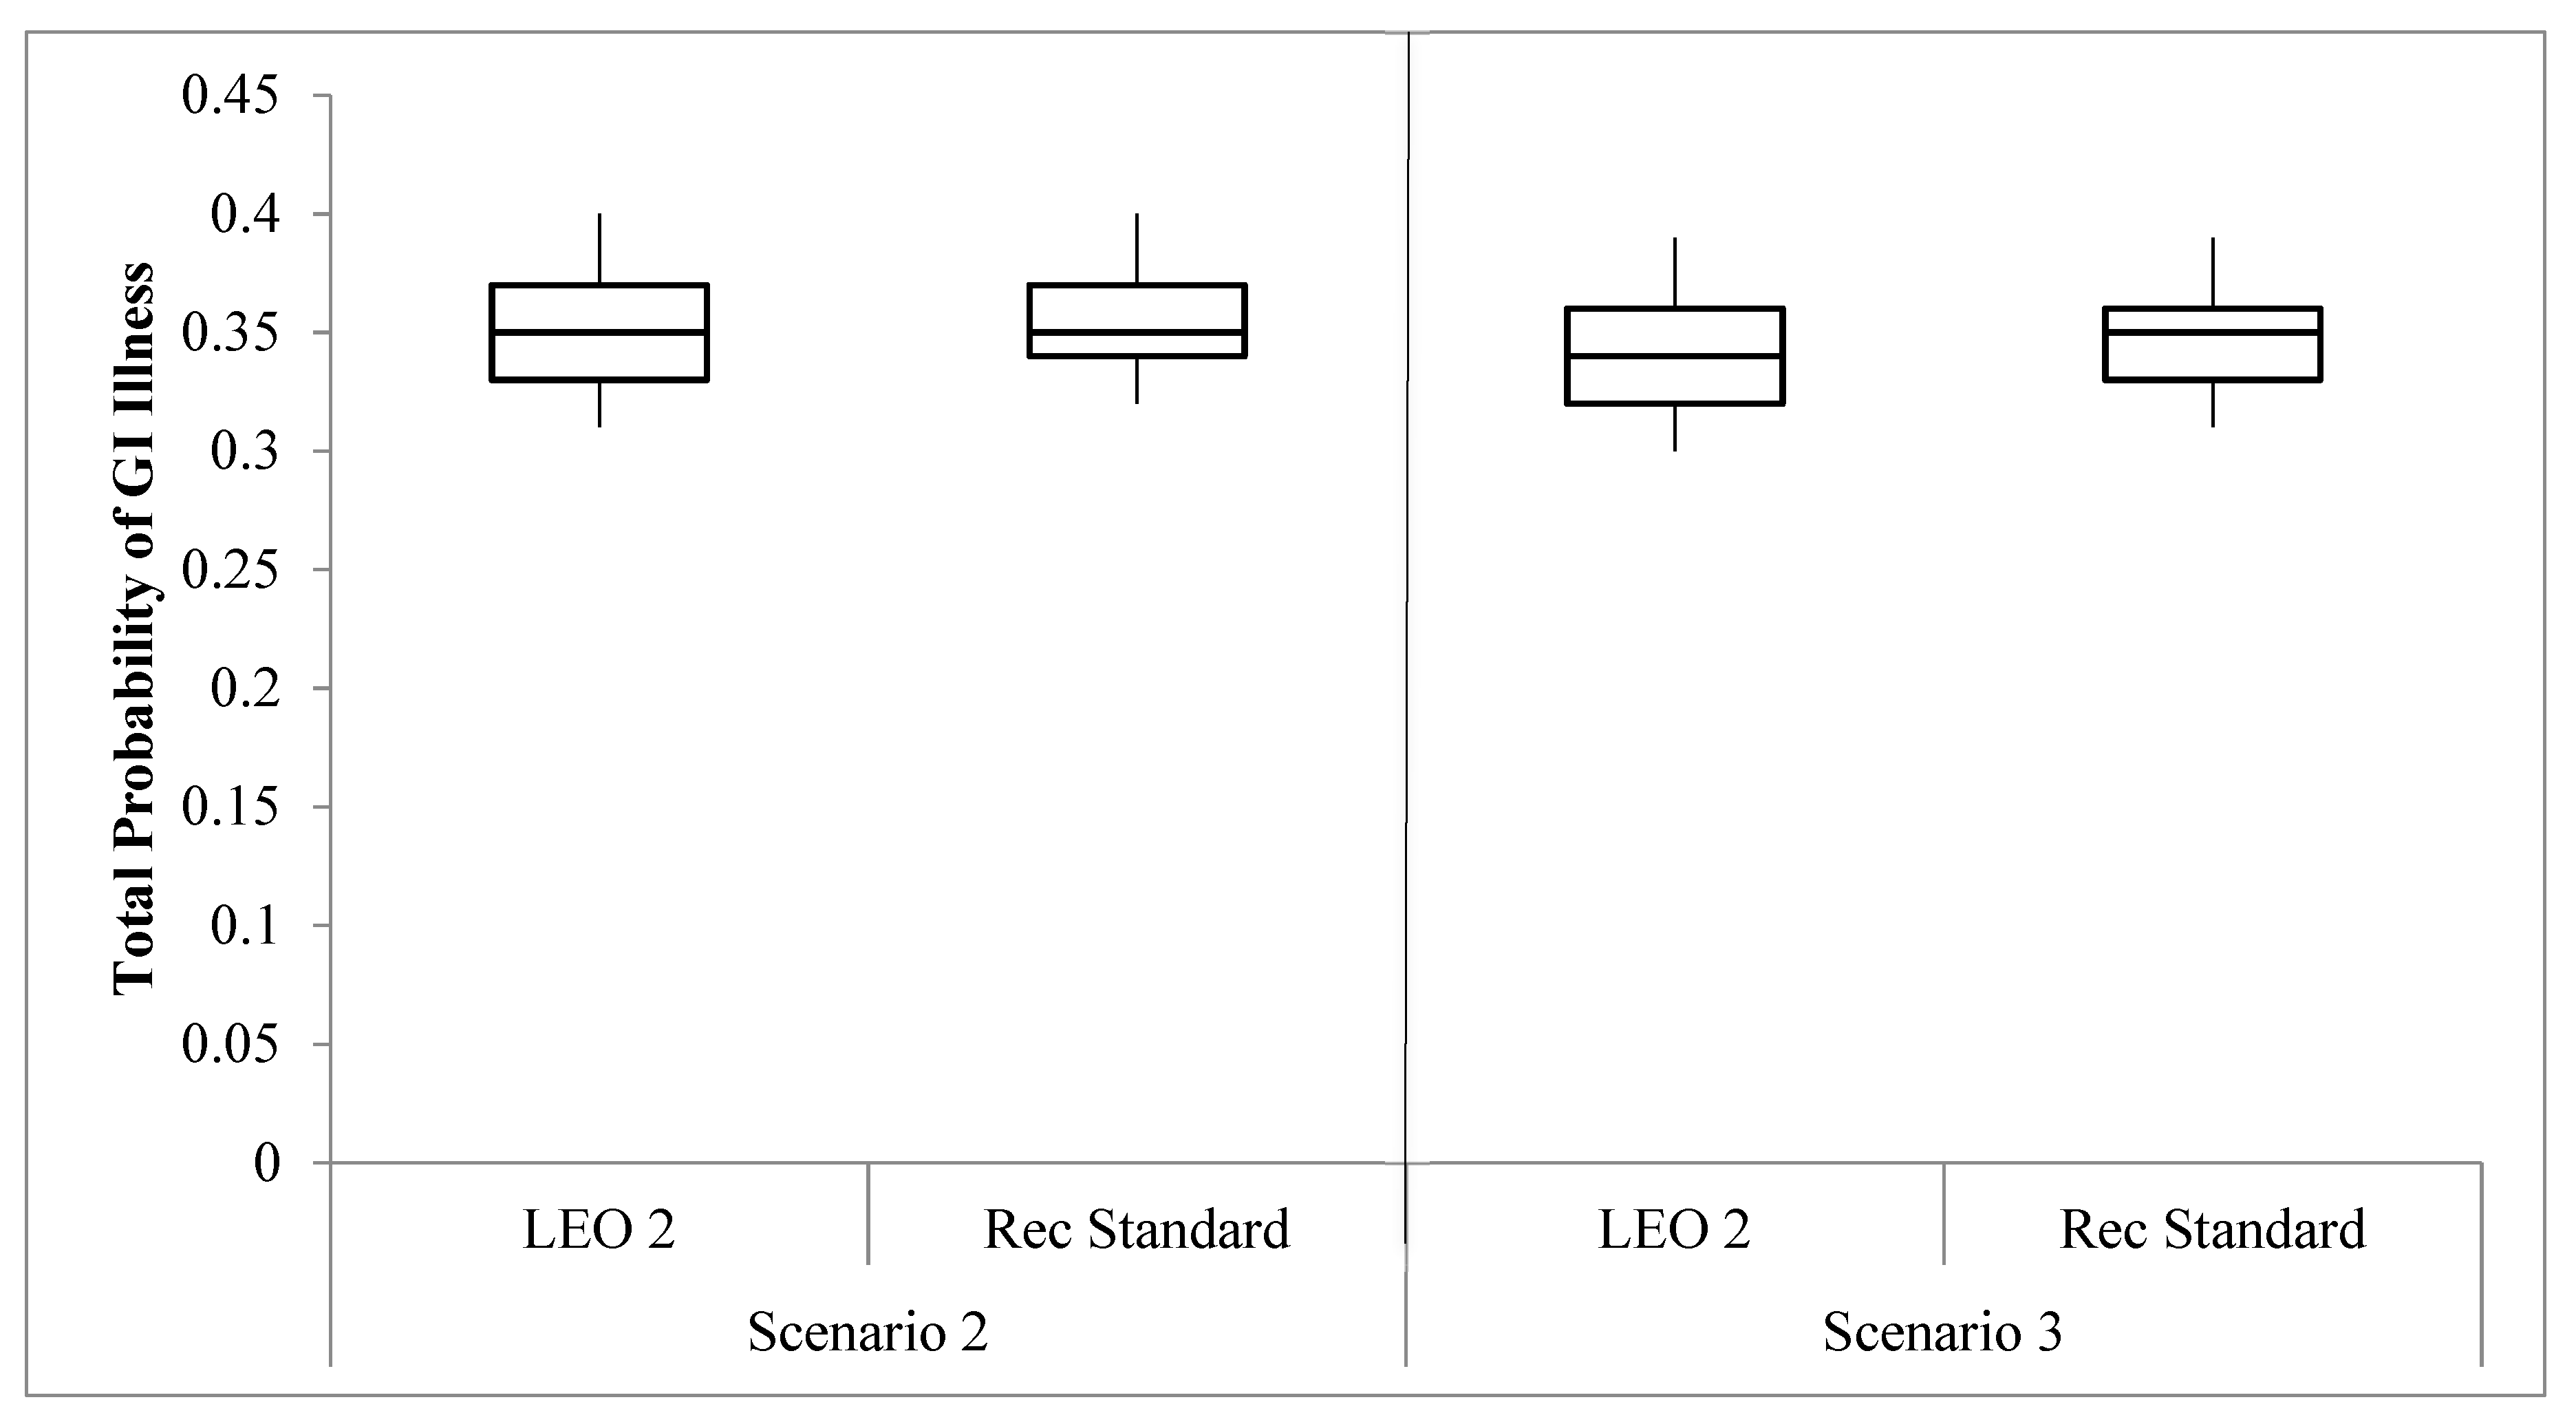
3.3. Comparison of the Total Probability of Illness Risks

For each scenario, which included a mixture of fecal sources, the median risk for a GI illness was at least 0.31 (Figure 4). The difference in total health risk when the human source contributed 10% as opposed to 7% was negligible (Figure 2 and Figure 3). High human infectivity of norovirus and the smaller ratio of fecal indicator bacteria to norovirus than for the other pathogens, resulted in the risk being relatively similar across each scenario. These findings indicate that the proportion of cattle/domestic animals and wildlife fecal loading had a much less substantial impact on the overall risk for a GI illness (Figure 4).

3.4. Sensitivity Analysis of the Uncertainty in Simulations

A sensitivity analysis of the risk of illness was conducted for each scenario to identify the assumptions that had the greatest impact on the overall risk estimate. Crystal Ball Pro® utilizes a rank correlation coefficient to identify assumptions that have the greatest influence on the uncertainty of the model. The assumptions, prevalence of infection, and infectious potential of Campylobacter and Cryptosporidium were repeatedly identified as being the primary factors contributing to the greatest amount of uncertainty when calculating the risk of illness for each pathogen/source in each scenario. The assumption contributing the greatest amount of uncertainty when calculating the risk of illness from the human source was attributed to the density of E. coli in human waste. The assumptions for the infectious potential and prevalence of infection for norovirus were point estimates and were not included in the sensitivity analysis. The assumptions for the volume of water ingested and density of E. coli in cattle/domestic animal and wildlife waste did not appear to significantly influence the sensitivity analysis.

4. Discussion

4.1. Scenario Assessment and Risks of a GI Illness

In this risk assessment, the influence of different measured proportions of human and nonhuman fecal sources contributing to bacterial impairment was evaluated to estimate the associated risk of a GI illness from recreation in a waterbody. The findings indicated that the greatest illness risk was associated with the human source, as measured by the reference pathogen norovirus. None of the assessments met the recreational risk standard of 0.036, due to the elevated risk of a GI illness from potential exposure to norovirus. The risk for a GI illness was estimated to be one order of magnitude greater than the recreational risk standard. The recreational risk standard was based upon epidemiological studies instead of a risk calculation, which may be an indicator as to why the calculated risk exceeds the recreational standard by one order of magnitude. The risk of illness from cattle/domestic animals consistently had a greater median calculated risk for a GI illness than the wildlife source. The proportion of each contributing source was not found to directly relate to the overall human health risk.

4.2. Source Contributing the Greatest Human Health Risk

The human health risks estimated when calculating the illness risk from a mixture of sources were greatly driven by the human source. The risks of a GI illness from a recreational waterbody impacted by a mixture of fecal contamination sources were identified to be influenced by the most infectious pathogen for humans [1,4,17]. In a study estimating the human health risk associated with different ratios of fresh gull waste and POTW waste, the percentage of human waste, as represented by norovirus, was found to dominate the human health risk until gull waste contributed 98% of the fecal contamination load [1]. A similar study examined risk scenarios when 90% of the fecal bacteria came from non-pathogenic sources, yet a large portion of the total risk was driven by recently discharged disinfected municipal wastewater [17]. Another study translated levels of sewage-associated quantitative PCR molecular markers (Bacteroides HF183, human polyomaviruses (HPyV), pepper mild mottle viruses (PMMoV), human adenovirus A-F (HAdV), and Methanobrevibacter smithii nifH) to develop a QMRA utilizing viral reference pathogens to estimate the GI risk associated with exposure to untreated and secondary treated sewage in recreational coastal waters. The GI risk decreased with increasing sewage dilution, with secondary treated sewage having a lower health risk than fresh, untreated sewage [40]. The findings from the present study indicate that the human health risk, in regards to recreation in rural waters, is predominantly driven by the most infectious source instead of by the largest contributing source to a waterbody. The proportion of a single source contributing to the overall fecal indicator concentration is not an indicator of the overall human health risk, therefore, determining which source represents the most dominant human health risk can assist in targeting management efforts.

4.3. Study Limitations

The FIB levels used in the calculations were assumed to be directly derived from fresh fecal deposition and not from other sources. Sediment resuspension of FIB, especially E. coli, has been found to dramatically increase E. coli concentrations when compared to only measuring waterborne E. coli concentrations [41]. The persistence of FIB in the environment is challenging to quantitatively assess because it is greatly influenced by physical, biological, and chemical properties, especially temperature, solar radiation, and nutrient availability [22,42]. Decay variables were not included in the risk assessment and the study assumed that no FIB or pathogen decay had occurred during transport to the time of exposure because of the complexity between different decay rates of FIB and pathogens. A primary advantage of applying QMRA is the ability to estimate multiple exposure scenarios that may be considered during the process of risk management decision-making without performing costly epidemiology studies that may be infeasible.
Using library-dependent MST data in a QMRA does have limitations. Libraries must be developed to include geographical and temporal variability of E. coli within a certain region. E. coli isolates can have differential survival rates; therefore, certain isolates may appear more dominant than others [16]. E. coli as an indicator organism does have several limitations, including its ability to survive in natural environments, potential resuspension in sediments and the current, and limited understanding of naturally occurring E. coli isolates in the environment. The source proportions from a MST analysis are a snapshot in time and specific isolates may be more heavily represented than others, greatly influencing the uncertainty within the QMRA. Library-dependent MST provides a glimpse of the actual conditions of a watershed, but the environmental conditions surrounding sampling, the methods by which the isolates are identified and the accuracy of the library must all be considered.
Norovirus was selected as the human reference pathogen and while prior studies have found using norovirus to yield high illness risks, the pathogen’s human dose–response relationship requires further research [1,2,15,18,31]. Further, the dose–response models used in this study did not account for immunocompromised individuals, such as pregnant women or children. These sensitive subpopulations may be more susceptible to pathogen infection or at a greater risk for a GI illness [43]. The potential uncertainties in dose–response model parameters were not considered in the assessment as point estimates were used. Although the values used in the dose exposure formula were gathered from the literature and the model was simplified to conduct the exposure scenario, this risk assessment can potentially serve as a model for future risk assessments.

4.4. QMRA Applicability for the Future

Current efforts to assign site-specific recreational water quality standards at least in Texas typically require conducting Recreational Use Attainability Analyses (RUAAs), monitoring efforts, MST analyses, and Total Maximum Daily Loads (TMDL), and/or WPP development. Incorporating QMRA into this “toolbox” could assist in assessing the human health risks for a site, especially if the site exceeds the FIB recreational standard and none of the contributing sources are human. Emphasizing the human health risk associated with a site, based upon MST, may be a more accurate, effective, and cost-efficient method for determining which waterbodies are of greatest risk for human health. While previous efforts have been directed at reducing FIB concentrations to the recreational standard, efforts to minimize the human health risk by targeting the sources representing the greatest risk may be more protective of human health.
Further investigation of zoonotic pathogens and their infectivity should be reviewed when considering rural recreational waters. A variety of strains and genotypes exist for zoonotic pathogens, therefore, determining their infectivity for humans is challenging and contributes to a significant amount of uncertainty in a QMRA. Assuming that zoonotic sources of fecal contamination do not pose a significant health risk in a QMRA may be a severe underestimation of the risk. Recognizing the uncertainty in using reference pathogens for a QMRA analysis and the range in infectivity levels for different sources of pathogens should be considered.
Regulatory and management decision-making could be informed by the approach illustrated in the present article. Collecting monitoring data may provide a snapshot of a waterbody’s current conditions, but conducting a QMRA provides a risk estimate to evaluate actions to protect human health. While a waterbody may be listed as impaired for E. coli concentrations, a site-specific risk assessment provides a more detailed look into the waterbody’s current conditions. Documented and future MST results integrated with a QMRA for impaired waterbodies can be used to better understand the human health risk associated with the contributing fecal contamination sources. While the risk assessment served as a worst-case scenario, the estimated risk results do indicate the need to consider the different sources contributing to fecal pollution and potentially pathogenic organisms to a waterbody. Identifying the different sources in a QMRA can provide a risk estimate more representative of the selected waterbody being studied.

5. Conclusions

Specifying the sources contributing to a bacterial impairment in a waterbody can assist in identifying the potential human health risk, especially when differentiating human and nonhuman sources. Depending on the source, pathogens can potentially have different prevalence and human infectivity and, therefore, be associated with a different human health risk. Identifying the sources contributing to the FIB impairments and applying QMRA may be a useful practice to develop site-specific standards, especially when FIB concentrations may exceed the primary contact recreation E. coli standard. Assessing the illness risk for a waterbody based upon the sources contributing to the FIB concentrations and estimated human health risks can be used to inform management decisions. Because human fecal waste sources have a greater health risk than nonhuman waste sources, differentiating sources would improve human health risk estimations and subsequent management strategies.

Author Contributions

A.G., K.D.M., K.L.W., D.E.B., and R.K. conducted the conceptualization of the project. A.G., K.D.M., and R.K. were involved in developing and refining the methodology used. A.G. completed the formal statistical analysis and development of the original manuscript. K.D.M., K.L.W., D.E.B., R.K., K.E.B., L.F.G., and T.J.G. reviewed, edited, and provided comments on the manuscript and project design. All authors have read and agreed to the published version of the manuscript.

Funding

This research received no external funding.

Acknowledgments

This research was partially supported by the Texas State Soil and Water Conservation Board and the Texas Commission on Environmental Quality. Patrick M. Tarwater (former faculty at the UTHealth School of Public Health El Paso Campus) helped with the statistical analysis.

Conflicts of Interest

The authors declare no conflict of interest.

References

  1. Schoen, M.E.; Ashbolt, N.J. Assessing pathogen risk to swimmers at non-sewage impacted recreational beaches. Environ. Sci. Technol. 2010, 44, 2286–2291. [Google Scholar] [CrossRef] [PubMed]
  2. Soller, J.A.; Bartrand, T.; Ashbolt, N.J.; Ravenscroft, J.; Wade, T.J. Estimating the primary etiologic agents in recreational freshwaters impacted by human sources of faecal contamination. Water Res. 2010, 44, 4736–4747. [Google Scholar] [CrossRef] [PubMed]
  3. Soller, J.A.; Schoen, M.E.; Bartrand, T.; Ravenscroft, J.E.; Ashbolt, N.J. Estimated human health risks from exposure to recreational waters impacted by human and non-human sources of faecal contamination. Water Res. 2010, 44, 4674–4691. [Google Scholar] [CrossRef]
  4. Soller, J.A.; Schoen, M.E.; Varghese, A.; Ichida, A.M.; Boehm, A.B.; Eftim, S.; Ashbolt, N.J.; Ravenscroft, J.E. Human health risk implications of multiple sources of faecal indicator bacteria in a recreational waterbody. Water Res. 2014, 66, 254–264. [Google Scholar] [CrossRef] [PubMed]
  5. Soller, J.; Bartrand, T.; Ravenscroft, J.; Molina, M.; Whelan, G.; Schoen, M.; Ashbolt, N. Estimated human health risks from recreational exposures to stormwater runoff containing animal faecal material. Environ. Model. Softw. 2015, 72, 21–32. [Google Scholar] [CrossRef]
  6. Di Giovanni, G.D.; Gentry, T.J.; Martin, E.; Gregory, L.; Wagner, K. Support Analytical Infrastructure and Further Development of a Statewide Bacterial Source Tracking Library Report TR-448; Texas Water Resources Institute: College Station, TX, USA, 2013. [Google Scholar]
  7. Arnone, R.D.; Walling, J.P. Waterborne pathogens in urban watersheds. J. Water Health 2007, 4, 149–162. [Google Scholar] [CrossRef]
  8. Pandey, P.K.; Kass, P.H.; Soupir, M.L.; Biswas, S.; Singh, V.P. Contamination of water resources by pathogenic bacteria. AMB Express 2014, 4, 1–16. [Google Scholar] [CrossRef] [Green Version]
  9. USEPA. Recreational Water Quality Criteria Report 820-F-12-058; U.S. Environmental Protection Agency Office of Water: Washington, DC, USA, 2012. [Google Scholar]
  10. USEPA. Quantitative Microbial Risk Assessment to Estimate Illness in Freshwater Impacted by Agricultural Animal Sources of Fecal Contamination Report EPA 822-R-10-005; U.S. Environmental Protection Agency Office of Water: Washington, DC, USA, 2010. [Google Scholar]
  11. Schijven, J.F.; de Roda Husman, A.M. Applications of Quantitative Microbial Source Tracking (QMST) and Quantitative Microbial Risk Assessment (QMRA). In Microbial Source Tracking: Methods, Applications, and Case Studies; Hagedorn, C., Blanch, A.R., Harwood, V.J., Eds.; Springer: New York, NY, USA, 2011; pp. 559–583. [Google Scholar]
  12. Gregory, L.; Casarez, E.; Truesdale, J.; Di Giovanni, G.; Owen, T.; Wolfe, J. Bacterial Source Tracking to Support. the Development and Implementation of Watershed Protection Plans for the Lampasas and Leon Rivers TR-442; Texas Water Resources Institute: College Station, TX, USA, 2013. [Google Scholar]
  13. Bragg, J.; Vargas, M.; Dulcay, M. Watershed Protection Plan for the Leon River below Proctor Lake and above Belton Lake. 2011. Available online: http://leonriver.tamu.edu/media/1110/final-leon-wpp.pdf (accessed on 16 July 2016).
  14. Versalovic, J.; Schneider, M.; De Bruijn, F.J.; Lupski, J.R. Genomic fingerprinting of bacteria using repetitive sequence-based polymerase chain reaction. Meth. Mol. Cell Biol. 1994, 5, 25–40. [Google Scholar]
  15. Casarez, E.A.; Pillai, S.D.; Mott, J.B.; Vargas, M.; Dean, K.E.; Di Giovanni, G.D. Direct comparison of four bacterial source tracking methods and use of composite data sets. J. Appl. Microbiol. 2007, 103, 350–364. [Google Scholar] [CrossRef]
  16. Casarez, E.A.; Pillai, S.D.; Di Giovanni, G.D. Genotype diversity of Escherichia coli isolates in natural waters determined by PFGE and ERIC-PCR. Water Res. 2007, 41, 3643–3648. [Google Scholar] [CrossRef]
  17. Schoen, M.E.; Soller, J.A.; Ashbolt, N.J. Evaluating the importance of faecal sources in human-impacted waters. Water Res. 2011, 45, 2670–2680. [Google Scholar] [CrossRef] [PubMed]
  18. Van Abel, N.; Schoen, M.E.; Kissel, J.C.; Meschke, J.S. Comparison of risk predicted by multiple norovirus dose–response models and implications for quantitative microbial risk assessment. Risk Anal. 2016, 37, 245–264. [Google Scholar] [CrossRef] [PubMed]
  19. Carmena, D. Waterborne transmission of Cryptosporidium and Giardia: Detection, surveillance and implications for public health. In Current Research, Technology and Education Topics in Applied Microbiology and Microbial Biotechnology; Mendez-Vilas, A., Ed.; Formatex: Badajoz, Spain, 2010; Volume 1, pp. 3–14. [Google Scholar]
  20. Zahedi, A.; Paparini, A.; Jian, F.; Robertson, I.; Ryan, U. Public health significance of zoonotic Cryptosporidium species in wildlife: Critical insights into better drinking water management. Int. J. Parasitol. Parasites Wildl. 2016, 5, 88–109. [Google Scholar] [CrossRef] [PubMed] [Green Version]
  21. Graczyk, T.K.; Majewska, A.C.; Schwab, K.J. The role of birds in dissemination of human waterborne enteropathogens. Trends. Parasitol. 2008, 24, 55–59. [Google Scholar] [CrossRef] [PubMed]
  22. Dufour, A.P.; Evans, O.; Behymer, T.D.; Cantu, R. Water ingestion during swimming activities in a pool: A pilot study. J. Water Health 2006, 4, 425–430. [Google Scholar] [CrossRef] [PubMed] [Green Version]
  23. Sunger, N.; Haas, C.N. Quantitative microbial risk assessment for recreational exposure to water bodies in Philadelphia. Water Environ. Res. 2015, 87, 211–222. [Google Scholar] [CrossRef]
  24. Padia, R.; Karthikeyan, R.; Mukhtar, S.; Parker, I. Occurrence and fate of E. coli from various non-point sources in a subtropical watershed. J. Nat. & Environ. Sci 2012, 3, 9–18. [Google Scholar]
  25. Telesford-Checkley, J.M.; Mora, M.A.; Gentry, T.J.; McDonald, T.J.; Boellstorff, D.E. Impacts of heronries on water quality as evaluated through Escherichia coli and Fecal Sterol Analyses. Water Environ. Res. 2017, 89, 508–518. [Google Scholar] [CrossRef]
  26. Appelbee, A.J.; Thompson, R.A.; Olson, M.E. Giardia and Cryptosporidium in mammalian wildlife–current status and future needs. Trends Parasitol. 2005, 21, 370–376. [Google Scholar] [CrossRef]
  27. Thomas, J.L.; Pintar, K.D.; Wallis, P.M.; Neumann, N.F. Using host-specificity of Cryptosporidium to understand contaminant sources, seasonality, and human health risk in three watersheds of differing land-use. J. Environ. Prot. 2016, 7, 372–381. [Google Scholar] [CrossRef] [Green Version]
  28. Rosef, O.; Kapperud, G.; Lauwers, S.; Gondrosen, B. Serotyping of Campylobacter jejuni, Campylobacter coli and Campylobacter laridis from domestic and wild animals. Appl. Environ. Microbiol. 1985, 49, 1507–1510. [Google Scholar] [CrossRef] [PubMed] [Green Version]
  29. Petersen, L.; Nielsen, E.M.; Engber, J.; On, S.L.W.; Dietz, H.H. Comparison of genotypes and serotypes of Campylobacter jejuni isolated from Danish wild mammals and birds and from broiler flocks and humans. Appl. Environ. Microbiol. 2001, 67, 3115–3121. [Google Scholar] [CrossRef] [PubMed] [Green Version]
  30. Nielsen, E.M.; Engberg, J.; Madsen, M. Distribution of serotypes of Campylobacter jejuni and C. coli from Danish patients, poultry, cattle and swine. FEMS Immunol. Med. Microbiol. 1997, 19, 47–56. [Google Scholar] [CrossRef] [PubMed] [Green Version]
  31. McBride, G.B.; Stott, R.; Miller, W.; Bambic, D.; Wuertz, S. Discharge-based QMRA for estimation of public health risks from exposure to stormwater-borne pathogens in recreational waters in the United States. Water Res. 2013, 47, 5282–5297. [Google Scholar] [CrossRef] [PubMed]
  32. Lindesmith, L.C.; Donaldson, E.F.; Baric, R.S. Norovirus GII. 4 strain antigenic variation. J. Virol. 2011, 85, 231–242. [Google Scholar] [CrossRef] [Green Version]
  33. Atwill, E.R.; Phillips, R.; Rulofson, F. Environmental loading rates of the waterborne pathogenic protozoa Cryptosporidium parvum in certain domestic and wildlife species in California. In Proceedings of the Vertebrate Pest Conference, Reno, NV, USA, 4–7 Macch 2002. [Google Scholar]
  34. Medema, G.J.; Teunis, P.F.M.; Havelaar, A.H.; Haas, C.N. Assessment of the dose-response relationship of Campylobacter jejuni. Int. J. Food Microbiol. 1996, 30, 101–111. [Google Scholar] [CrossRef]
  35. Teunis, P.F.; Moe, C.L.; Liu, P.; Miller, S.E.; Lindesmith, L.; Baric, R.S.; Le Pendu, J.; Calderon, R.L. Norwalk virus: How infectious is it? J. Med. Virol. 2008, 80, 1468–1476. [Google Scholar] [CrossRef]
  36. Teunis, P.F.M.; van den Brandhofl, W.; Nauta, M.; Wagenaar, J.; van den Kerkhof, H.; van Pelt, W. A reconsideration of the Campylobacter dose-response relation. Epidemiol. Infect. 2005, 133, 583–592. [Google Scholar] [CrossRef]
  37. USEPA. Economic Analysis for the Final Long Term 2 Enhanced Surface Water Treatment Rule Report 815-R-06-001; U.S. Environmental Protection Agency Office of Water: Washington, DC, USA, 2005. [Google Scholar]
  38. Soller, J.; Eftim, S.E.; Warren, I.; Nappier, S.P. Evaluation of microbiological risks associated with direct potable reuse. Microbi. Risk Anal. 2017, 5, 3–14. [Google Scholar] [CrossRef]
  39. Eisenberg, J.; Seto, E.Y.W.; Olivieri, A.W.; Spear, R.C. Quantifying water pathogen risk in an epidemiological framework. Risk Anal. 1996, 16, 549–563. [Google Scholar] [CrossRef]
  40. Ahmed, W.; Hamilton, K.A.; Lobos, A.; Hughes, B.; Staley, C.; Sadowsky, M.J.; Harwood, V.J. Quantitative microbial risk assessment of microbial source tracking markers in recreational water contaminated with fresh untreated and secondary treated sewage. Environ. Int. 2018, 117, 243–249. [Google Scholar] [CrossRef] [PubMed]
  41. Pandey, P.K.; Soupir, M.L. Assessing the impacts of E. coli laden streambed sediment on E. coli loads over a range of flows and sediment characteristics. J. Am. Water Resour. Assoc. 2013, 49, 1261–1269. [Google Scholar] [CrossRef]
  42. Korajkic, A.; McMinn, B.R.; Harwood, V.J.; Shanks, O.C.; Fout, G.S.; Ashbolt, N.J. Differential decay of enterococci and Escherichia coli originating from two fecal pollution sources. Appl Environ. Microb 2013, 79, 2488–2492. [Google Scholar] [CrossRef] [PubMed] [Green Version]
  43. Gerba, C.P.; Rose, J.B.; Haas, C.N. Sensitive populations: Who is at the greatest risk? Int. J. Food Microbiol. 1996, 30, 113–123. [Google Scholar] [CrossRef]
Figure 1. The calculated probabilities for a gastrointestinal (GI) illness under Scenario 1 (each source contributes 100%). The 5th, 25th, 75th, and 95th percentiles, as well as the median, are presented for the actual E. coli concentration (163 cfu 100 mL−1) and current contact recreational standard (126 cfu 100 mL−1).
Water 12 00327 g001
Figure 2. Contribution of each source to the health risk under Scenario 2 (each source contributes according to the microbial source tracking (MST) results). LEO 2 had an E. coli concentration of 163 cfu 100 mL−1 and the recreational standard had an E. coli concentration of 126 cfu 100 mL−1.
Water 12 00327 g002
Figure 3. Contribution of each source to the health risk under Scenario 3 (each source contributes according to the modified MST results). LEO 2 had an E. coli concentration of 163 cfu 100 mL−1 and the recreational standard had an E. coli concentration of 126 cfu 100 mL−1.
Water 12 00327 g003
Figure 4. The calculated probabilities for a GI illness under Scenarios 2 and 3. The 5th, 25th, 75th, and 95th percentiles, as well as the median, are presented. LEO 2 had an E. coli concentration of 163 cfu 100 mL−1 and the recreational standard had an E. coli concentration of 126 cfu 100 mL−1.
Water 12 00327 g004
Table 1. Parameters applied for calculating the dose ingested, the risk of infection, and the risk of illness.
ParametersInput DataCommentsDistributionSource
Volume of Water IngestedArithmetic mean: 25 mL h−1 Normal [22,23]
Standard deviation: 5 mL h−1
Density of E. coli in Fecal Waste (Log10 range)Human: 0.5–8.0Log10 rangeLog-Uniform [3]
Cattle/Domestic Animal: 5.0–6.7[3]
Wildlife: 2.0–9.5[24,25]
Density of Reference Pathogen in Fecal Waste (Log10 range)Human (Norovirus): 3.0–7.5Log10 rangeLog-Uniform [1,3,4,33]
Cattle/Domestic Animal (Campylobacter): 1.2–7.3
Wildlife (Cryptosporidium): 2.3–3.8
Prevalence of InfectionHuman: 100%Percent rangesUniform [3,4,5,26]
Cattle/Domestic Animal: 5–38%
Wildlife: 5–50%
Infectious Potential Human: 100%Percent rangesUniform [3,5,20,27]
Cattle/Domestic Animal: 67–100%
Wildlife: 0–33%
Dose–Response Values 1 Norovirus: α = 0.04, β = 0.055Beta-Binomial (ID50: 26 viral particles, 60% morbidity) 2Point Estimate [31,34,35,36,37]
Campylobacter: α = 0.145, N50 = 7.59Beta-Poisson (ID50: 800 cfu, morbidity 28%)2
Cryptosporidium: r = 0.09 Exponential (ID50:8 oocysts, morbidity 50%) 2
Concentration of E. coli in Field DataLEO 2 (geometric mean: 163)point estimates of the geometric mean (cfu 100 mL−1)Point Estimate[12]
Recreational Standard (geometric mean: 126)
1 The dose–response parameters are numerical values used in a statistical distribution to describe the host–pathogen interaction. The parameters listed above are for infection risk. 2 The ID50 is the median infective dose of pathogens contributing to infection.

