Article

Hydrochemical Conditions for Aerobic/Anaerobic Biodegradation of Chlorinated Ethenes—A Multi-Site Assessment

1
ENACON s.r.o., Krčská 16, CZ-140 00 Prague 4, Czech Republic
2
Institute for Nanomaterials, Advanced Technologies and Innovation, Technical University of Liberec, Studentská 2, CZ-461 17 Liberec, Czech Republic
3
DEKONTA a.s., Volutová 2523, CZ-158 00 Prague 5, Czech Republic
4
Faculty of Science, Charles University, Benátská 2, CZ-128 01 Prague 2, Czech Republic
*
Author to whom correspondence should be addressed.
Water 2020, 12(2), 322; https://doi.org/10.3390/w12020322
Submission received: 3 December 2019 / Revised: 16 January 2020 / Accepted: 19 January 2020 / Published: 22 January 2020
(This article belongs to the Special Issue Advances in In Situ Biological and Chemical Groundwater Treatment)

Abstract

:
A stall of cis-1,2-DCE and vinyl chloride (VC) is frequently observed during bioremediation of groundwater chloroethenes via reductive dechlorination. These chloroethenes may be oxidised by aerobic methanotrophs or ethenotrophs co-metabolically and/or metabolically. We assessed the potential for such oxidation at 12 sites (49 groundwater samples) using hydrochemical and molecular biological tools. Both ethenotroph (etnC and etnE) and methanotroph (mmoX and pmoA) functional genes were identified in 90% of samples, while reductive dehalogenase functional genes (vcrA and bvcA) were identified in 82%. All functional genes were simultaneously detected in 78% of samples, in actively biostimulated sites in 88% of samples. Correlation analysis revealed that cis-1,2-DCE concentration was positively correlated with vcrA, etnC and etnE, while VC concentration was correlated with etnC, etnE, vcrA and bvcA. However, feature selection based on random forest classification indicated a significant relationship for the vcrA in relation to cis-1,2-DCE, and vcrA, bvcA and etnE for VC and no prove of relationship between cis-1,2-DCE or VC and the methanotroph functional genes. Analysis of hydrochemical parameters indicated that aerobic oxidation of chloroethenes by ethenotrophs may take place under a range of redox conditions of aquifers and coincide with high ethene and VC concentrations.

1. Introduction

Chloroethene tetrachloroethene (PCE) and trichloroethene (TCE) are amongst the most abundant pollutants of groundwater and soil due to their frequent use in industrial applications. These pollutants can be biodegraded through natural or enhanced anaerobic reductive dechlorination, where chloroethenes serve as electron acceptors and molecular hydrogen and acetate, both released as by-products of organic substrate fermentation reactions, are used by the dechlorinating bacteria as electron donors and as carbon sources, respectively [1]. During this process, PCE is converted stepwise to TCE by removing one chlorine atom and replacing it with a hydrogen atom; likewise, trichloroethene (TCE), is primarily converted to cis-1,2-DCE, then to vinyl chloride (VC), and finally to ethene [2].
Anaerobic reductive dechlorination of chloroethenes is restricted to just a few bacterial genera (hereafter collectively referred to as anaerobic dechlorinators). Those capable of sequentially dechlorinating PCE or TCE down to cis-1,2-DCE include Dehalobacter [3,4], Dehalospirilum [5], Desulfuromonas [6,7], Geobacter [8], Sulfurospirrilium [9] and Desulfitobacterium [10]. Dehalococcoides mccartyi [11,12] and Dehalogenimonas species [13] are anaerobic dechlorinators known to gain energy through dechlorination of DCE to VC and eventually to ethene using the reductive dehalogenase enzymes BvcA and VcrA [14] or similar ones in the case of Dehalogenimonas spp. Despite the presence of anaerobic dechlorinators, cis-1,2-DCE and VC often accumulate in groundwater as the sequential steps of the reductive dechlorination process are less and less favourable thermodynamically and kinetically [15], and/or the conditions for complete dechlorination are not always optimal.
Under aerobic conditions, chloroethenes can be oxidised both cometabolically and metabolically. During cometabolic oxidation, chloroethenes are only degraded into non-toxic end-products fortuitously when degrading enzymes are produced for degradation of bacterial growth substrates such as methane, ethene, ammonium or aromatic pollutants. Cometabolic degradation has been shown for all chloroethenes, though only rarely described for PCE [16]. Aerobic cometabolic oxidation is related to certain aerobic bacteria, such as ethene-oxidisers (etheneotrophs) and methane-oxidisers (methanotrophs) [17,18,19]. Methanotrops employ soluble and particulate methane monooxygenases (sMMO and pMMO, respectively) to oxidise methane as a primary growth substrate. Both sMMO and pMMO are also capable of fortuitous oxidation of chloroethenes. The sMMO have a broader substrate range than pMMO, and are more efficient at degrading chlorinated ethenes [20]. The gene mmoX, which encodes the sMMO α subunit, and pmoA, which encodes the pMMO α subunit, are used as biomarkers of chloroethene cometabolic potential in groundwater [20,21,22].
Etheneotrophs can cometabolise VC and DCE when growing on ethene as a primary growth substrate, while several pure etheneotrophic strains, such as Mycobacterium and Nocardiodes, can also utilise VC as their sole carbon and energy source [18]. Etheneotrophs, when growing on ethene and VC, express a soluble alkene monooxygenase (AkMO), transforming VC to epoxide chlorooxirane, which is further metabolised to 2-chloro-2-hydroxyethyl-CoM by epoxyalkane:coenzyme M transferase (EaCoMT) [19,23]. The genes etnC and etnE encode the α subunit of AkMO and the EaCoMT, respectively, and serve as emerging biomarkers for ethenotroph-mediated aerobic biodegradation potential, though they do not distinguish between metabolic and cometabolic biodegradation pathways [20,24].
Two degradation pathways have been proposed as regards aerobic metabolic degradation of cis-1,2-DCE. Both of them involve degradation through monooxygenase-catalysed epoxidation [25], with the initial step catalysed by cytochrome P450 monooxygenase. Epoxides can be degraded subsequently either by epoxyalkane, coenzyme M transferase or through formation of glutathione conjugates [26,27].
Only a few studies have focused on parallel presence of anaerobic dechlorinators and aerobic methanotrophs or ethenotrophs at contaminated sites. Liang et al. [20] studied the potential for VC degradation at six contaminated sites based on abundance and expression of VC biodegradation genes, and suggested that both ethenotrophs and anaerobic VC dechlorinators simultaneously contributed to VC biodegradation at the sites with high VC attenuation rates. Richards et al. [19] investigated spatial relationships between functional genes of ethenotrophs, anaerobic VC dechlorinators and methanotrophs in aquifer soil samples collected at a contaminated site, and found that functional genes of all the three bacterial guilds coexisted in 48% of the samples that appeared to be anaerobic.
These results attracted our interest to further assess the potential of using the alternate anaerobic/aerobic biodegradation of chloroethenes as a practical remedial tool, which can eliminate frequent accumulation of cis-1,2-DCE and VC in groundwater. The goal of this study is to investigate this potential of ongoing activities of both anaerobic and aerobic chloroethene degraders at a large number of remediated sites affected by biostimulation to different levels and to estimate limiting conditions for these microbial degradation processes. For such scanning, the qPCR data and hydrogeochemical parameters were analysed by advanced statistical methods.

2. Materials and Methods
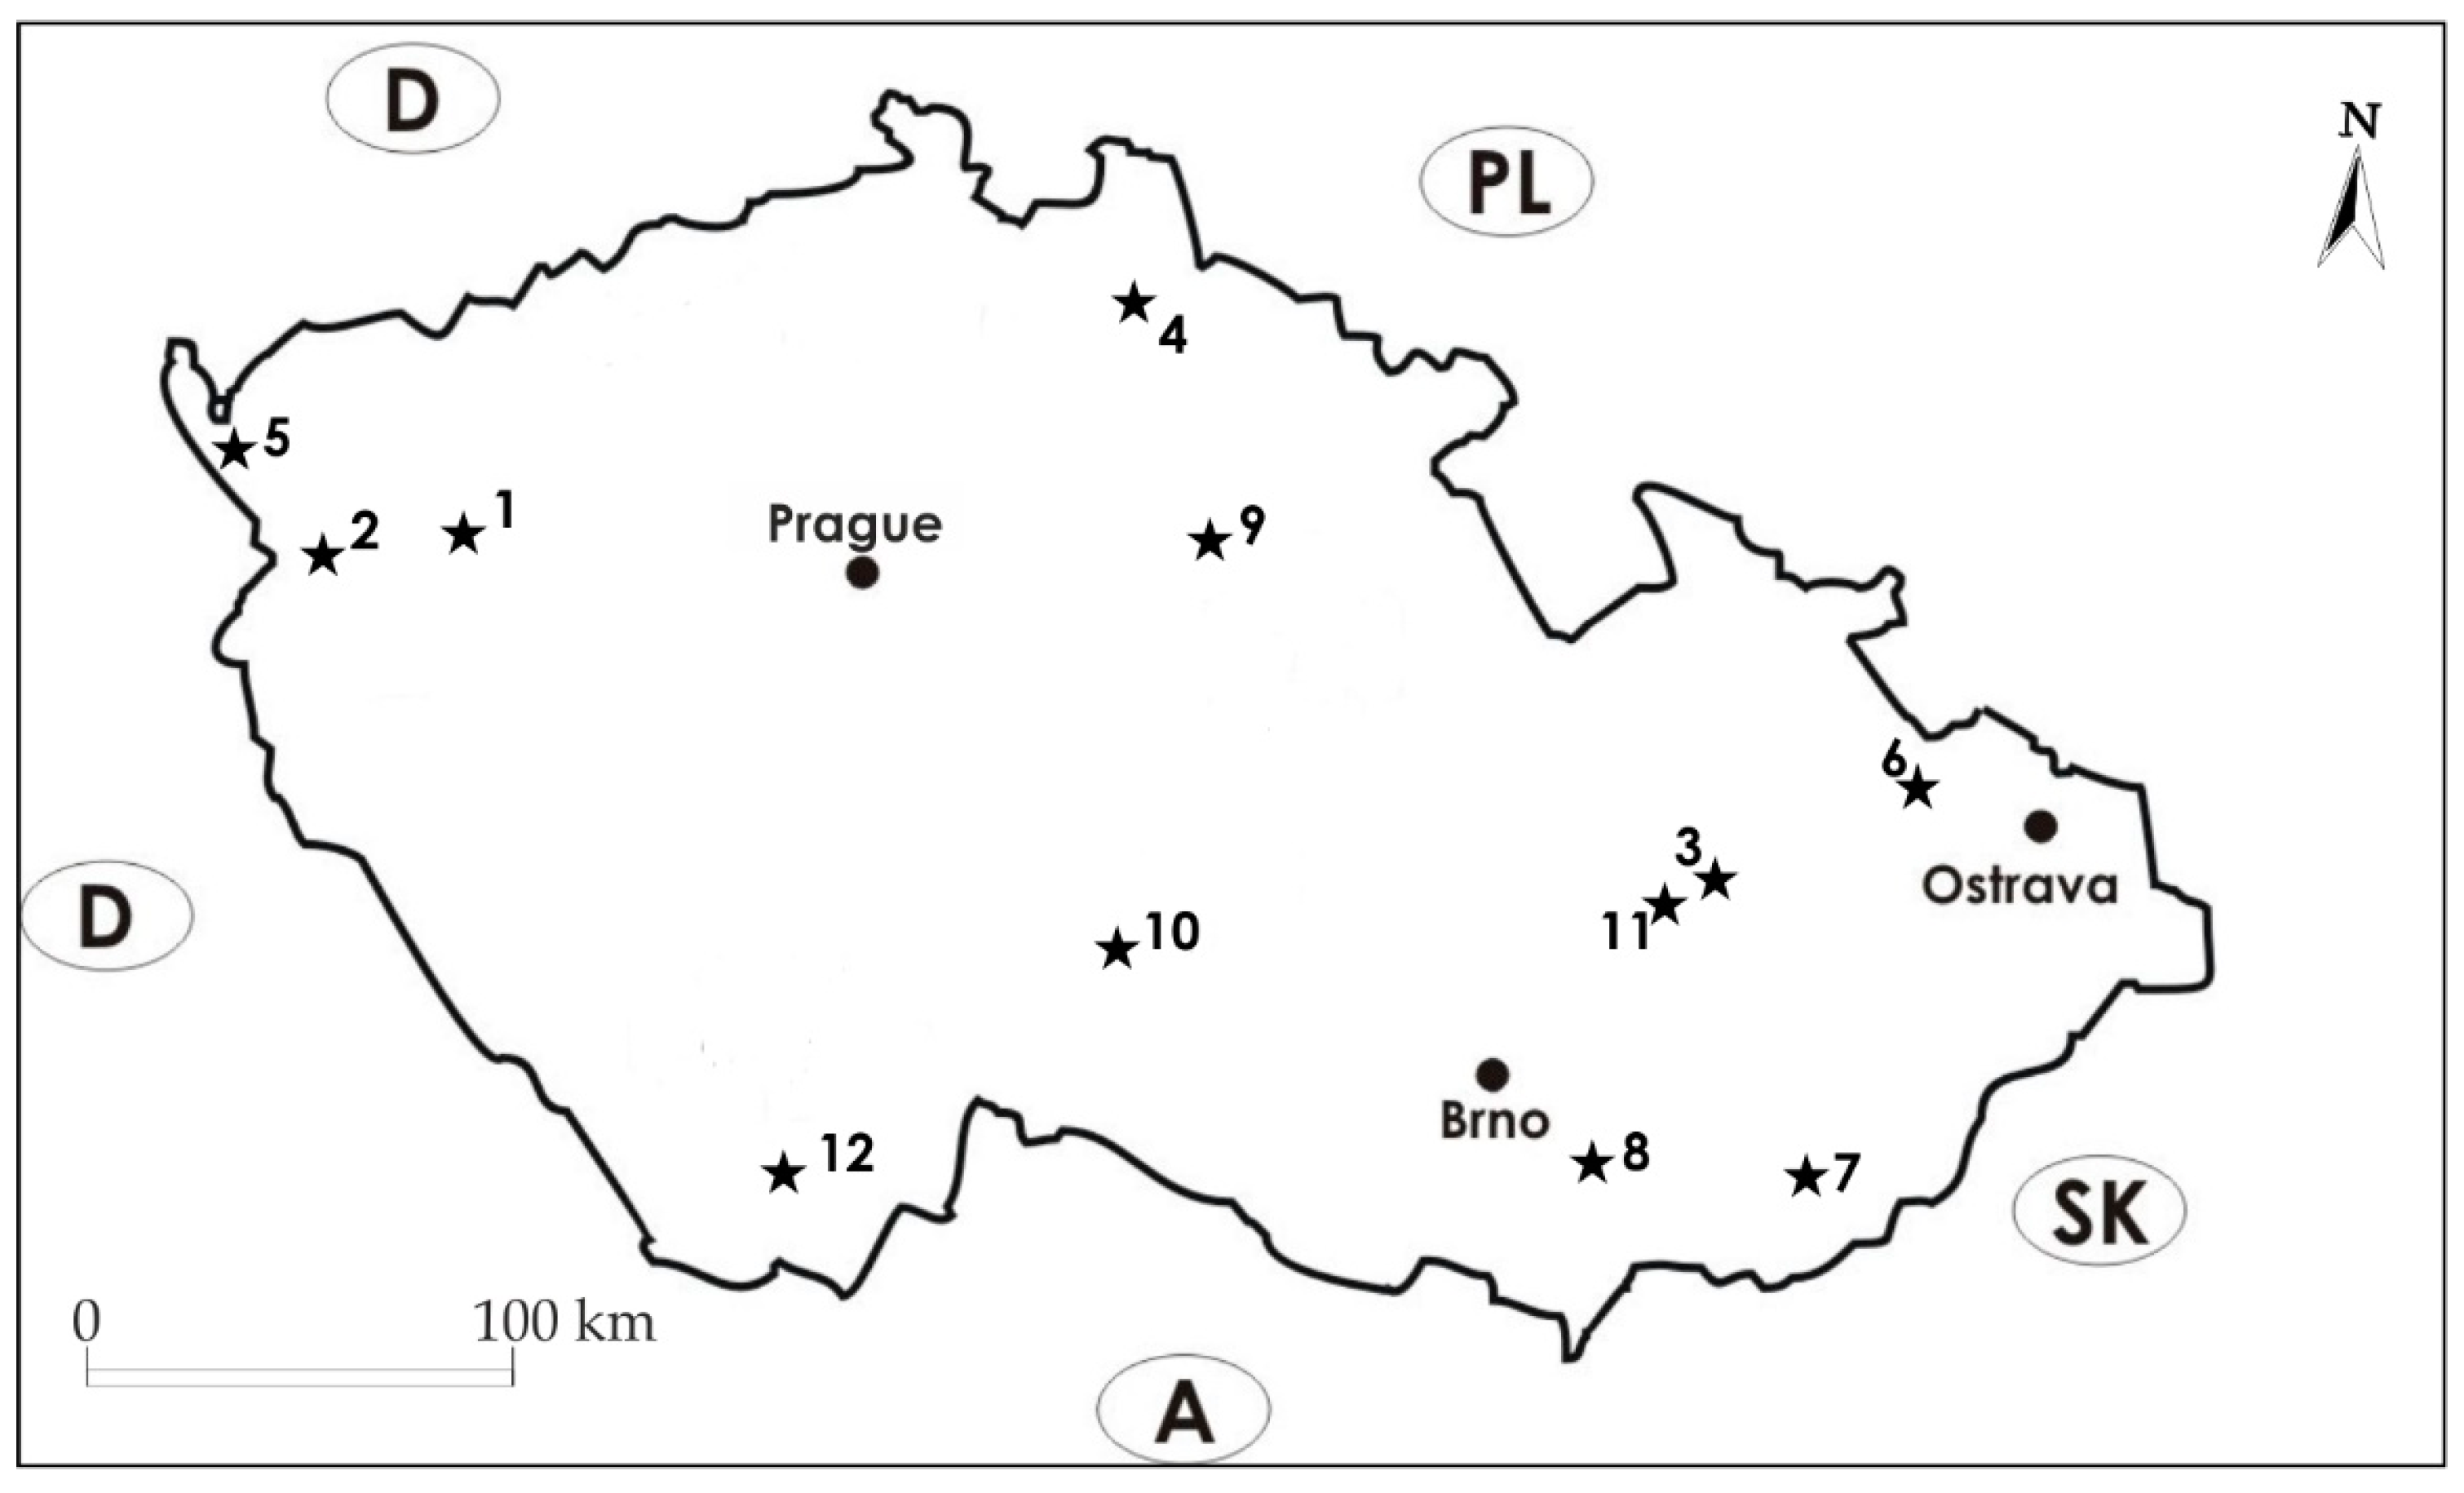
2.1. Test Sites

This study examined 35 sampling wells situated in 16 contaminanted groundwater plumes located at 12 different sites in the Czech Republic (some of the wells were sampled repeatedly, and, thus, 49 groundwater samples were analysed in total). Location and numbering of the sites are depicted in Figure 1. Out of the 16 contaminated groundwater plumes, 12 plumes were remediated using in situ biostimulation of anaerobic biodegradation prior to or over the course of the study. Cheese whey (either in liquid form, as supplied by the Diary Čejetičky spol. s.r.o., Czech Republic, or diluted dry whey supplied by Lacnea agri s.r.o., Czech Republic) was used as an electron donor in all bioremediated plumes. Amounts of whey applied to remedial wells were determined based on the local hydrogeological settings and the target TOC concentration in groundwater >100 mg/L. However, not all the wells in the remediated contaminated groundwater plumes were affected by the applied electron donor. Information on time of whey application to the respective wells (relative to the sampling date) are given in Table 2. Bioaugmentation was not performed at any of the tested sites. On three sites (#2, #3 and #5), zero-valent iron (ZVI) was injected in a pilot scale either alone or together with the whey.
Groundwater samples were collected from shallow aquifers developed mainly in Quaternary fluvial sediments or in a sandy eluvium associated with the crystalline bedrock. Only one contaminant site (#10) was related to a fractured rock aquifer.

2.2. Groundwater Sampling and Scope of Laboratory Analysis

Before sampling, all wells were purged by pumping approximately three borehole casing volumes of groundwater using a Gigant submersible sampling pump (Ekotechnika, Czech Republic), according to standard procedure [28]. A range of field parameters (pH, oxidation-reduction potential (ORP), electrical conductivity and temperature) were recorded using a flow-through cell connected to a Multi 350i Multimeter (WTW, Germany). Samples for real-time PCR analyses were collected into 500 mL single-use, DNA free containers and transported together with the other samples to the laboratory within 24 h.
Groundwater samples from all wells were analysed and monitored for the following parameters: chlorinated ethenes, ethene, ethane, methane, sulfate, hydrogen sulfide, nitrate, dissolved iron and manganese, total organic carbon (TOC), relative abundance of specific bacteria and functional genes using real-time PCR (see Section 2.3 and Section 2.4).

2.3. DNA Extraction and Real-Time Quantitative PCR

Groundwater samples (0.2–0.5 L) were filtered through 0.22 μm membrane filters (Merck Millipore, Darmstadt, Germany), after which DNA was extracted from the filters (with microorganisms) using the FastDNA Spin Kit for Soil (MP Biomedicals, Irvine, CA, USA), following the manufacturer’s protocol. A Bead Blaster 24 homogenisation unit (Benchmark Scientific, Sayreville, NJ, USA) was employed for cell lysis, while the extracted DNA was quantified using a Qubit 2.0 fluorometer (Life Technologies, Carlsbad, CA, USA).
Real-time quantitative PCR (qPCR) analysis was performed in order to quantify 16S rDNA of total bacteria (16S), the anaerobic dechlorinators Dehalobacter spp. (Dre), D. mccartyi (Dhc), Desulfitobacterium spp. (Dsb) and Dehalogenimonas spp. (Dhgm), and genes encoding for reductive dehalogenase (vcrA and bvcA), functional genes coding enzymes for ethenotroph-mediated aerobic biodegradation (i.e., alkene monooxygenase (etnC) and epoxyalkane, coenzyme M transferase (etnE)) and functional genes for soluble methane monooxygenase (mmoX) and particulate methane monooxygenase (pmoA) as biomarkers of methanotroph-mediated aerobic cometabolic biodegradation of chloroethenes. All primers used for qPCR are listed in Supplementary Table S1.
All qPCR assays were performed on a LightCycler® 480 (Roche, Switzerland), using the same reaction conditions described in our previous study [29]. qPCR mixtures with a total volume of 10 μL were prepared using LightCycler® 480 SYBR Green I Master (Roche, Switzerland), 4 pmol of each primer (Generi Biotech, Czech Republic) and 1 μL of template DNA. Each sample was analysed in duplicate in 96-well plates, including no-template controls. The qPCR thermal profile was 5 min at 95 °C followed by 45 cycles at 95 °C for 10 s, 68/60/55 °C for 15 s, and 72 °C for 20 s. Appropriate annealing temperatures are listed in Supplementary Table S1. To control the specificity of the qPCR amplification, a melting curve analysis (72 to 98 °C, ramp rate 0.06 °C/s) was performed at the end of each qPCR. The presence of PCR inhibitors was tested for in each DNA sample by serial dilution of DNA template. Detected Ct values were normalised to the filtration volume and sample dilution to get the final Cq values. qPCR amplification efficiency for each primer set was determined based on the slope of the curves constructed from a serial dilution of template DNA from five different environmental samples. Based on the approach used, the qPCR results were presented as relative abundances of the individual biomarkers.

2.4. Physical and Chemical Parameters of the Groundwater

Concentration of iron and manganese dissolved in groundwater were analysed using an Optima 2100 inductively coupled plasma-optical emission spectrometer (ICP-OES; Perkin Elmer, Waltham, MA, USA) according to ČSN EN ISO 11885 [30]. The groundwater samples were filtered through a 0.45 µm membrane filter prior to analysis. Hydrogen sulfide was determined spectrophotometrically according to ČSN 83 0530-31 [31]. TOC was determined according to ČSN EN 1484 [32] using a MULTI N/C 2100S TOC analyser (Analytik Jena, Jena, Germany). Nitrate and sulfate were assessed using a ICS-90 ion chromatograph (Dionex, Sunnyvale, CA, USA) according to ČSN EN ISO 10304-1 [33]. Volatile organic carbons, including chlorinated ethenes, ethene, ethane and methane, were assessed using a Saturn 2200 CP 3800 gas chromatography–mass spectrometer (GC-MS; Varian, USA) using a VF-624ms column (Varian, Palo Alto, CA, USA), a CTC Combipal injector (CTC Analytics, Morrisville, NC, USA) and a headspace agitator.

2.5. Data Analysis

As an initial step, data below the limit of quantification (LOQ) were replaced with values equal to half of the LOQ of the respective method. Contents of individual chlorinated ethenes, ethene and ethane, in groundwater were converted from mass concentrations to molar concentrations. Dechlorination of the parent chlorinated ethenes PCE and TCE to less chlorinated forms and on to non-chlorinated ethenes through hydrogenolysis was assessed and expressed by the chlorine number (Cl no.), i.e., the weighted average number of chlorine atoms per molecule of ethene [34]. Identification of prevailing redox processes was performed based a range of chemical criteria (Table 1).
A final data set, used for further statistical analysis, was created by merging data for hydrochemical parameters and biomarker values.
All statistical analyses were performed in RStudio [36] and R software version 3.6.1 [37]. The relationship between gene abundance and hydrochemical parameters was tested using nonparametric Spearman’s correlation [38]. The importance of feature selection attributes was assessed using the Boruta package [39], built on the random forest classification algorithm, which enables a search for significant and non-redundant variables. Biomarker abundance and field parameters were tested for outliers, with positive outliers treated by capping using inter quartile range (IQR = Q3 − Q1, where Q1, Q3 are 1st and 3rd quartile, respectively). Values that lay outside the 1.5 * IQR limits were replaced with 5th percentile. All values were subsequently log-transformed to achieve normality.
The whole dataset was also subjected to a cluster analysis with the ethenotroph functional genes etnC and etnE set as clustering variables. The dataset included field parameters (pH, ORP), parameters identifying redox processes, i.e., electron acceptors (nitrate, sulfate), and redox reaction products (iron, hydrogen sulfide, and methane), TOC, concentrations of chlorinated ethenes and their non-chlorinated metabolites ethene and ethane, and appropriate biomarkers (etnC, etnE, mmoX, pmoA, vcrA, bvcA, Dehalobacter spp., D. mccartyi, Desulfitobacterium spp., Dehalogenimonas spp.). Six sample clusters were identified representing groundwater samples with the highest and lowest abundance of etnC and etnE, respectively. For each cluster, basic statistical parameters (maximum, mean, median, and minimum values) were calculated for the hydrochemical parameters. The prevailing redox processes assessed for each groundwater sample (see Section 3.1) were taken into account. Clustering of the final dataset was performed using the hierarchical clustering algorithm implemented by the hclust function in the R software package. The optimal number of clusters and the clustering algorithm were assessed using the clValid package [40].

3. Results and Discussion

3.1. Results of Chemical Analyses

For a full summary of the chemical analyses, see the supplementary material (Supplementary Table S2). As most samples in this study were collected from aquifers affected by historical or on-going remediation using biostimulation via delivery of organic carbon, the laboratory analysis revealed mostly anoxic redox processes. Ongoing methanogenesis was detected based on the applied criteria (≥0.5 mg/L of methane) in 30 of 49 groundwater samples analysed; however, strict methanogenesis was only detected in four samples, the remaining 26 samples displaying criteria for more than one redox process were, mostly including Fe(III) reduction (24 samples). Fe(III) reduction alone, or in combination with Mn(IV) or NO3 reduction, was only identified in nine samples.
With regard to concentrations of individual chloroethenes, the prevailing anoxic conditions, favourable for reductive dechlorination, resulted in sequential degradation of the parent contaminants (PCE and/or TCE) down to cis-1,2-DCE, VC and ethene. An average Cl no. of 1.5 indicated an advanced state of reductive dechlorination. In 11 of the 49 samples the Cl no. was even below 0.5, showing almost complete dechlorination by biostimulation of anaerobic biodegradation performed at these sites.
In all the collected samples, cis-1,2-DCE was the dominant DCE isomer. The ratio of trans-1,2-DCE to cis-1,2-DCE was below 2.2% in all the samples (mean ratio 0.39%) and concentrations of 1,1-DCE were similar to trans-1,2-DCE. Therefore, data for trans-1,2-DCE and 1,1-DCE were not included into the final data set for statistical analysis.
Of the 49 samples taken, 43 did not contain any other contaminants (in addition to chloroethenes) in significant concentrations (molar mass of the sum of co-contaminants below 2.5% of the molar mass of the sum of chloroethenes in the respective sample was used as the criterion). Six samples contained significant concentrations of co-occurring contaminants: at contaminated site #6 (two samples), the main contaminants were chloroform and 1,2-dichloroethane, whereas toluene was the dominant contaminant in the samples collected at site #12, although, historically, the site was dominantly contaminated by chloroethenes. Although co-occurring contaminants present in groundwater might affect both anaerobic reductive dechlorination and aerobic biodegradation, they were not included in the final data set for statistical analysis as their occurrence was limited and scattered.
Acetylene as an intermediate of abiotic β-elimination of chloroethenes [41] was detected in seven of the 49 samples taken. It was present at sites #2, #3 and #5 where zerovalent iron materials were injected together with the whey in the past. It can be concluded that abiotic β-elimination has contributed to the degradation of chloroethenes at these sites.
For co-contaminants; trans-1,2-DCE and 1,1-DCE and acetylene concentrations, see the supplementary material (Supplementary Table S3).

3.2. Results of qPCR

qPCR revealed the frequent occurrence of both aerobic and reductive biomarkers. Presence of the ethenotroph functional genes etnC and etnE was confirmed in 44 of 49 (90%) samples analysed, as were the methanotroph functional genes mmoX and pmoA, while the reductive dehalogenase genes vcrA and bvcA were recorded in 40 of 49 (82%) samples analysed (Table 2, Figure 2). All functional genes together (etnC, etnE, mmoX, pmoA, vcrA and bvcA) were detected in 38 of 49 (78%) samples analysed, indicating that both aerobic oxidation and reductive dechlorination of chloroethenes may take place simultaneously at the same place or in close microenvironments. This finding is consistent with the study of Liang et al. [20], which detected functional genes from all three bacterial guilds (ethenotrophs, methanotrophs and reductive dechlorinators) in 99% of groundwater samples collected at six contaminated sites.
The qPCR results exhibited noticeable differences in individual biomarkers within one site or even one contaminant plume (e.g., aerobic biomarkers in contaminant plume #10_1 or reductive biomarkers in contaminant plume #1_1; see Table 2).
Of the 49 analysed samples, 16 were collected during the on-going remedial biostimulation (samples were collected 1 to 4 months after the last whey application, see column 6 in Table 2). Despite the fact that application of whey stimulates reductive dechlorination, all functional genes (etnC, etnE, mmoX, pmoA, vcrA and bvcA) coexisted in 14 of the 16 (88%) samples.
Of the anaerobic dechlorinators, Desulfitobacterium spp. were most frequent, being present in 47 of 49 samples (96%), while D. mccartyi and Dehalogenimonas spp. were identified in 46 of 49 analysed samples (94%). The occurrence of D. mccartyi and Dehalogenimonas spp. corresponded well with Dehalobacter spp. (see correlation analysis in Section 3.3), though the latter were only identified in 74% of samples. The lower incidence of Dehalobacter spp. in groundwater samples may reflect the fact that Dehalobacter spp. degrade the parent chlorinated compounds PCE and TCE [3,42], which were mostly degraded to less chlorinated metabolites at the sites tested. Frequent detection of Dehalogenimonas spp. in our samples (94%) is consistent with the findings of Yang et al. [13], who detected Dehalogenimonas spp. in 81% of 1173 samples collected in the United States and Australia.

3.3. Correlation and Feature Selection Analysis

Correlation analysis (Figure 3) revealed that TCE was only correlated with Desulfitobacterium spp., probably as none of the enzymes tested related to the reductive or aerobic functional genes participating in biodegradation of TCE. However, cis-1,2-DCE was positively correlated with both the reductive functional gene vcrA and the ethenotroph functional genes etnC and etnE, as well as the reductive dechlorinators Dehalogenimonas spp. and Desulfitobacterium spp. Similarly, VC concentration was positively correlated to the ethenotroph functional genes etnC and etnE and the reductive dehalogenase genes vcrA and bvcA, as well as the reductive dechlorinators D. mccartyi and Dehalogenimonas spp. The positive correlation of cis-1,2-DCE and VC to abundance of Dehalogenimonas spp., whose ability to degrade cis-1,2-DCE and VC was only recently confirmed by Yang et al. [13], indicates a potentially notable contribution of Dehalogenimonas spp. in reductive dechlorination at the sites tested.
None of the chlorinated ethenes were correlated with the methanotroph functional genes mmoX and pmoA.
In sum, it implies that both anaerobic reductive dechlorination and ethenotroph-mediated aerobic biodegradation could participate in biodegradation of VC and cis-1,2-DCE.
With regard to the correlation of individual functional genes with hydrochemical and field parameters, the reductive dehalogenase genes vcrA and bvcA were negatively correlated with ORP and sulfate and positively correlated with dissolved iron, hydrogen sulfide and methane. As has been previously noted, anaerobic reductive dechlorination of chloroethenes can occur under both nitrate-reducing and iron-reducing conditions, though the most favourable conditions for anaerobic dechlorinators are sulfate reducing and methanogenic [43]. This is also supported by a strong negative correlation of Cl no. with methane and positive correlation of Cl no. with sulfate. The methanotroph functional genes mmoX and pmoA were positively correlated with dissolved iron and methane, while pmoA was negatively correlated with sulpfate. There was no correlation observed between the ethenotroph functional genes etnC and etnE and any hydrochemical and/or field parameters, suggesting that hydrochemical conditions of aquifers are not limiting factors for proliferation of ethenotrophs.
The significance of individual cis-1,2-DCE and VC biodegradation processes was assessed using feature selection utilising the random forest classification algorithm. Only the reductive dehalogenase gene vcrA exhibited significant relevance for cis-1,2-DCE (Figure 4), whereas both reductive dehalogenase genes (vcrA and bvcA) and the ethenotroph functional gene etnE were significantly relevant for VC (Figure 5). In sum, feature selection provided further support for the hypothesis that both reductive dechlorinators and ethenotrophs participate in biodegradation of VC at the sites tested; however, it indicated that there was only intermediate significant involvement of ethenotrophs in biodegradation of cis-1,2-DCE.

3.4. Hydrochemical Conditions for Aerobic Oxidation

As aerobic (both metabolic and co-metabolic) oxidation processes in remedial practice can overcome a frequent accumulation of metabolites cis-1,2-DCE and VC generated during in-situ anaerobic reductive bioremediation, the hydrochemical conditions for these processes were assessed. First, the whole dataset was subjected to cluster analysis with the ethenotroph functional genes etnC and etnE set as clustering variables. Six sample clusters were identified, with clusters #1 and #6 representing groundwater samples with the highest and lowest abundance of etnC and etnE, respectively. The basic statistical parameters (maximum, mean, median, and minimum values) calculated for the hydrochemical parameters for each cluster are given in graphs in the supplementary material (Supplementary Figure S1). The prevailing redox processes assessed for each groundwater sample (see Section 3.1) are given in Supplementary Table S2.
Cluster #1, which represented the highest potential for aerobic oxidation, was comprised of three groundwater samples collected from two sites. Redox conditions were mixed, covering a wide spectrum of processes from Fe(III) reduction (iron mean concentration 33.38 mg/L) to methanogenic (methane mean concentration 7.8 mg/L). The groundwater samples in cluster #1 differed from those in the other clusters, mainly in higher concentrations of VC (mean 10,314 µg/L) and of ethene (mean 4534 µg/L).
In comparison, cluster #6 comprised groundwater samples with lowest potential for aerobic oxidation and included 28 samples collected at eight sites. With regards to redox conditions, cluster #6 contained samples with Mn(VI) reduction and Fe(III) reduction predominating, along with samples of mixed redox categories, covering Mn(VI) reduction down to methanogenic conditions. Mean iron and methane concentrations for cluster #6 were 15.8 and 3.5 mg/L, respectively. Groundwater samples in this cluster contained significantly lower concentrations of VC (mean 276 µg/L) and ethene (mean 344 µg/L); however, the degree of chloroethene dechlorination (Cl no.) was similar to that of cluster #1 (mean Cl no. cluster #1 = 1.5, cluster #6 = 1.4). This indicates that aerobic oxidation of chloroethenes can take place in aquifers under a range of redox conditions, including apparently reducing environments. The most likely explanation is that the studied aquifers are not homogenous environments with one redox state only, but highly spatially and temporally heterogenous macro- and microenvironments with different redox conditions. Spatial heterogeneities may be a result of different lithology and permeability that influence migration patterns of organic substrates (electron donors), dissolved oxygen, chloroethenes and their co-occurring contaminants. This explanation is supported by the results of hotspot high-resolution characterisation performed on sites #2, #3, #5, #6, #7, #8 and 11 using a membrane interface probe (MIP) (Geoprobe Systems®, Salina, KS, USA). MIP was used for collection of semi-quantitative data on the presence of volatile organic compounds (VOCs) and soil electric conductivity measurements indicating aquifer lithology in the vertical soil profile. MIP profiles (data not shown) from majority of the sites show presence of soil layers with different electric conductivities and levels of contamination (i.e., distinct lithological and contamination heterogeneity).
Temporal changes may result from irregular seepage of oxic rainwater, groundwater level fluctuations, and/or from discontinuous application of organic substrates at the bioremediated sites. Methanotrophs are found mainly at aerobic/anaerobic interfaces in soil and aquatic environments that are crossed by methane [44], thus inhabiting environments with low oxygen level. Similarly, ethenotrophs can survive in environments with very limited oxygen contents [17,45,46]. These macro- and microheterogeneities and abilities of aerobic ethenotrophs to sustain low levels of oxygen are reasons for their occurrence in anaerobic aquifers containing anaerobic dechlorinators. Co-occurrence of anaerobic dechlorinators and VC assimilating bacteria was revealed also in groundwater samples from other sites [20,29], in discrete aquifer soil samples [19] as well as in surface riverbed sediment samples [47] where the TOC content in soil was found to be the critical parameter determining the dominant degradation pathway [48].
The results also suggest that high concentrations of ethene and VC (as electron donors in aerobic oxidation of chloroethenes) are correlated with the abundance of ethenotrophs. This is also supported by the results of correlation analysis, which indicated a positive correlation between VC and the ethenotroph functional genes etnC and etnE.

4. Conclusions

The aim of this study is to assess the potential for aerobic oxidation of chlorinated ethenes at contaminated sites and to characterise those conditions favourable for aerobic biodegradation of VC and cis-1,2-DCE.
The main findings of this study are as follows:
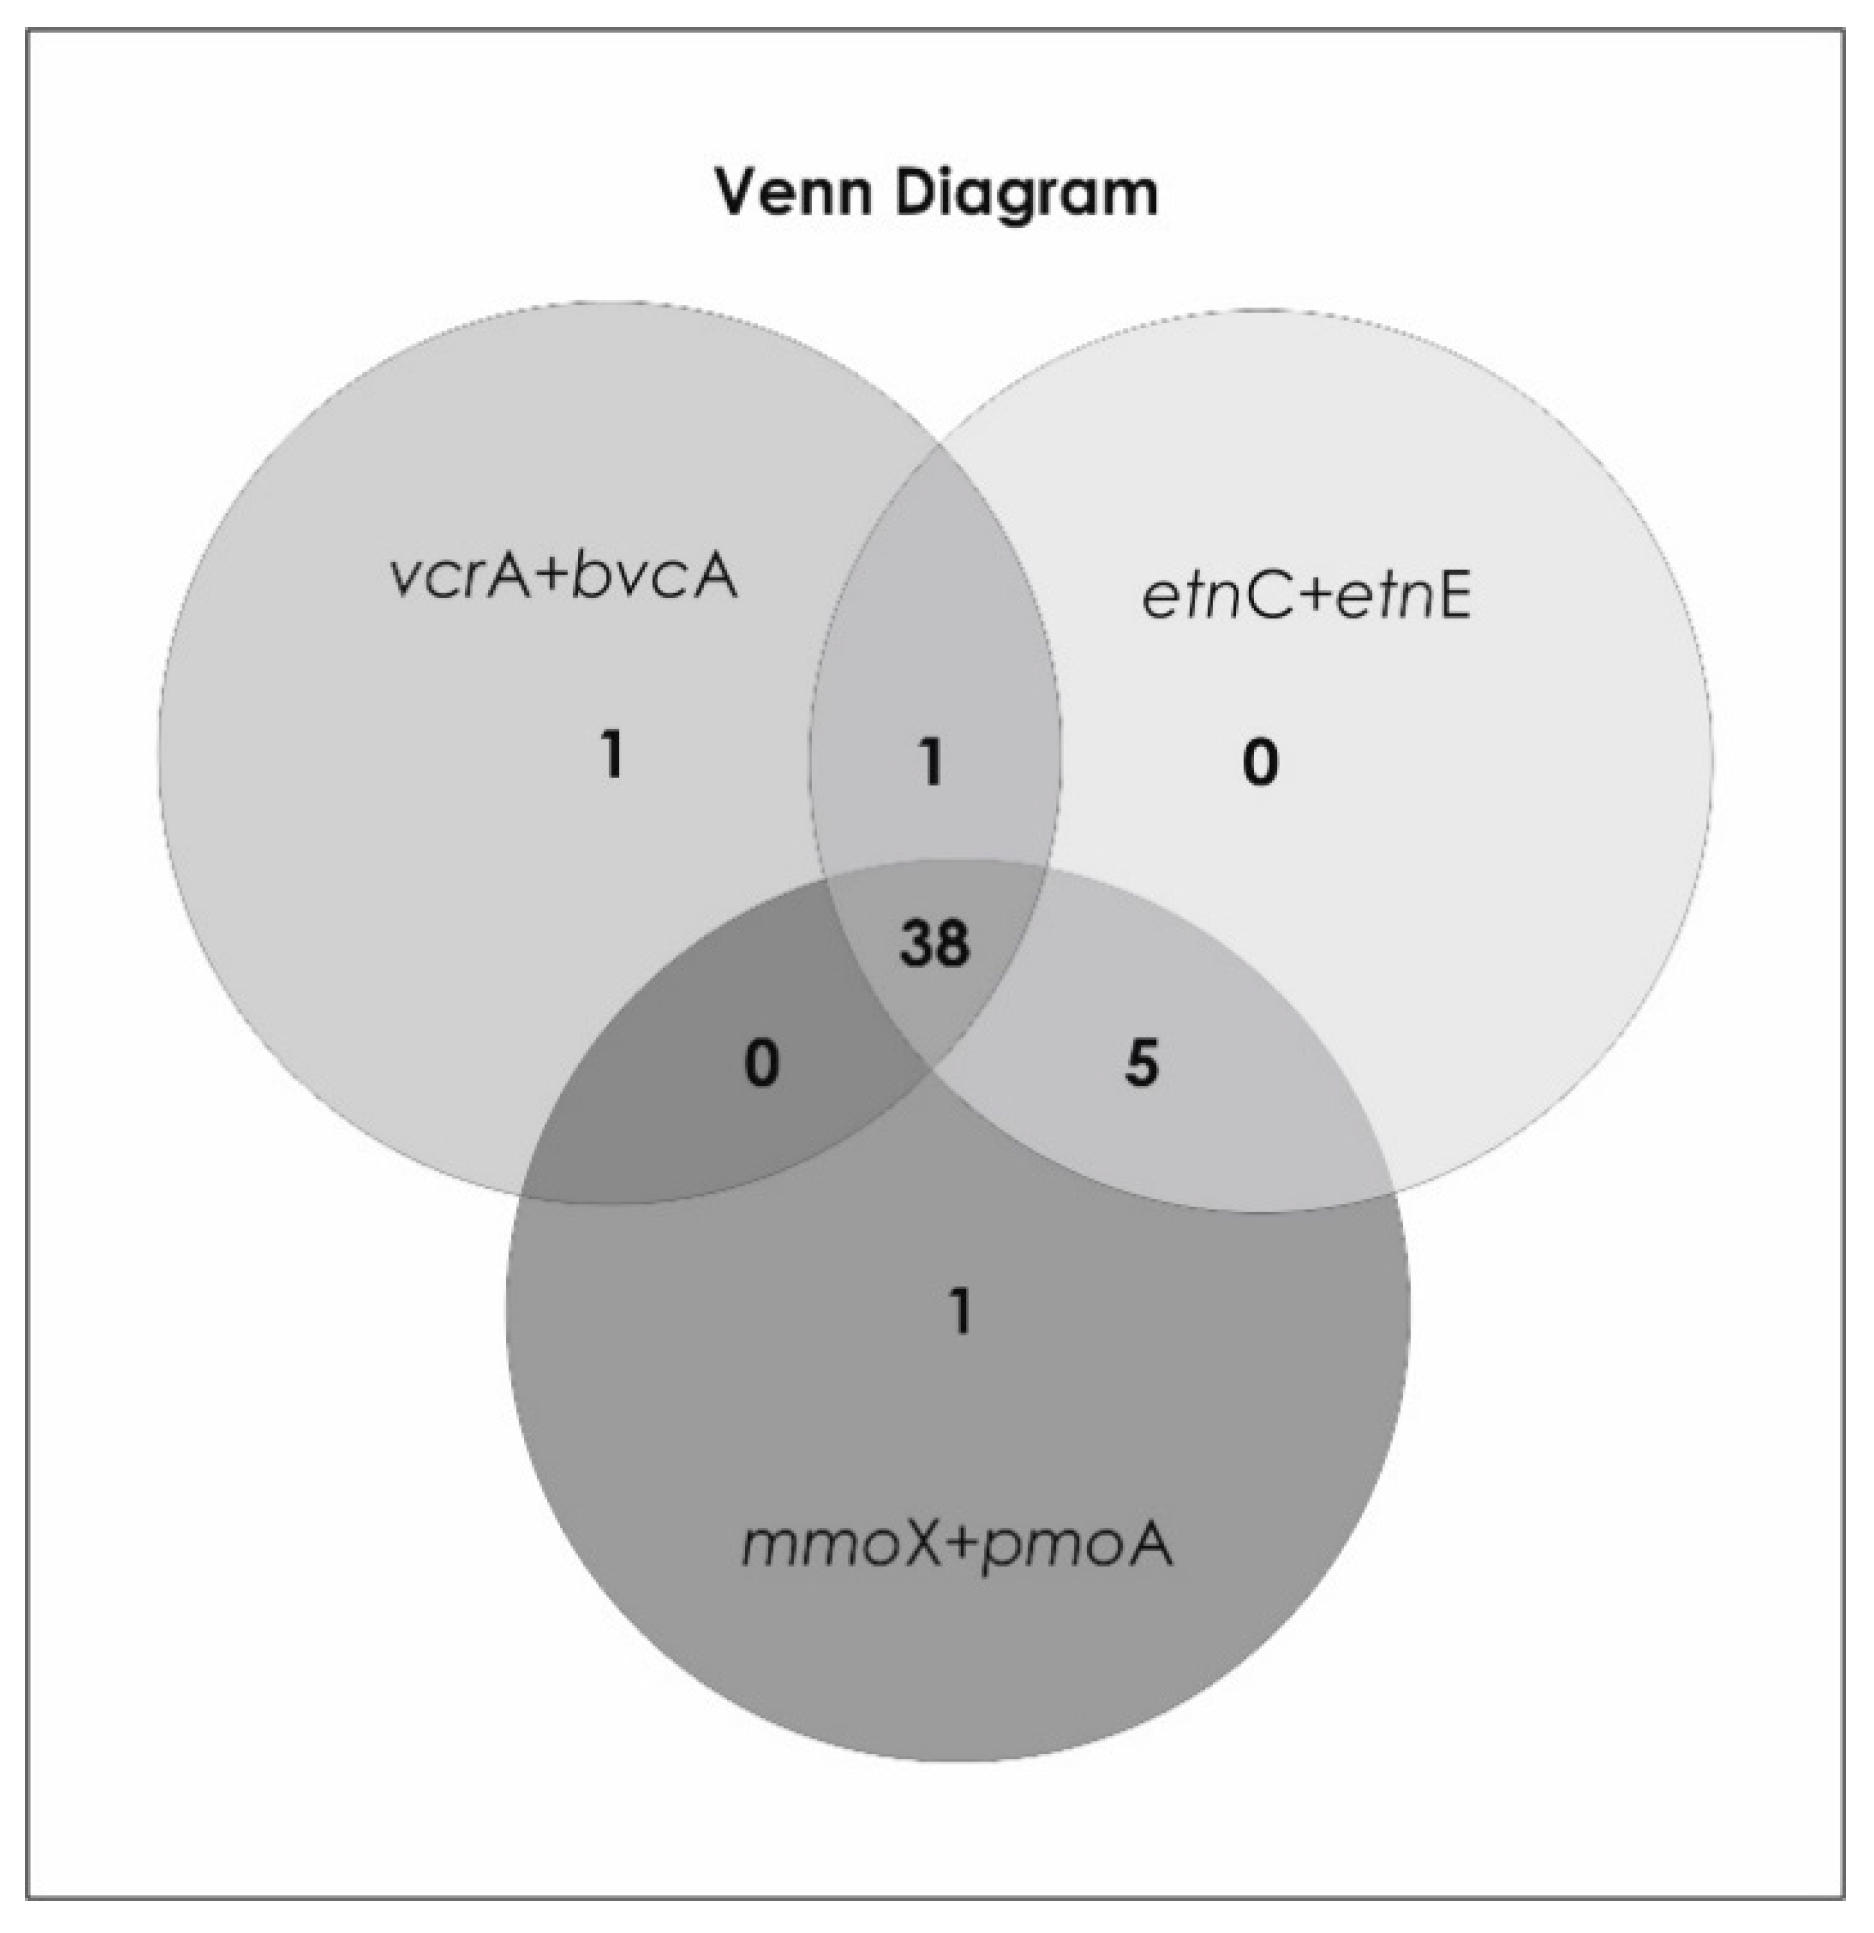
  • Both the ethenotroph functional genes etnC and etnE and methanotroph functional genes mmoX and pmoA were identified in 90% of groundwater samples, while all functional genes (etnC, etnE, mmoX, pmoA, vcrA and bvcA) coexisted in 78% of samples, in actively biostimulated sites in 88% of samples.
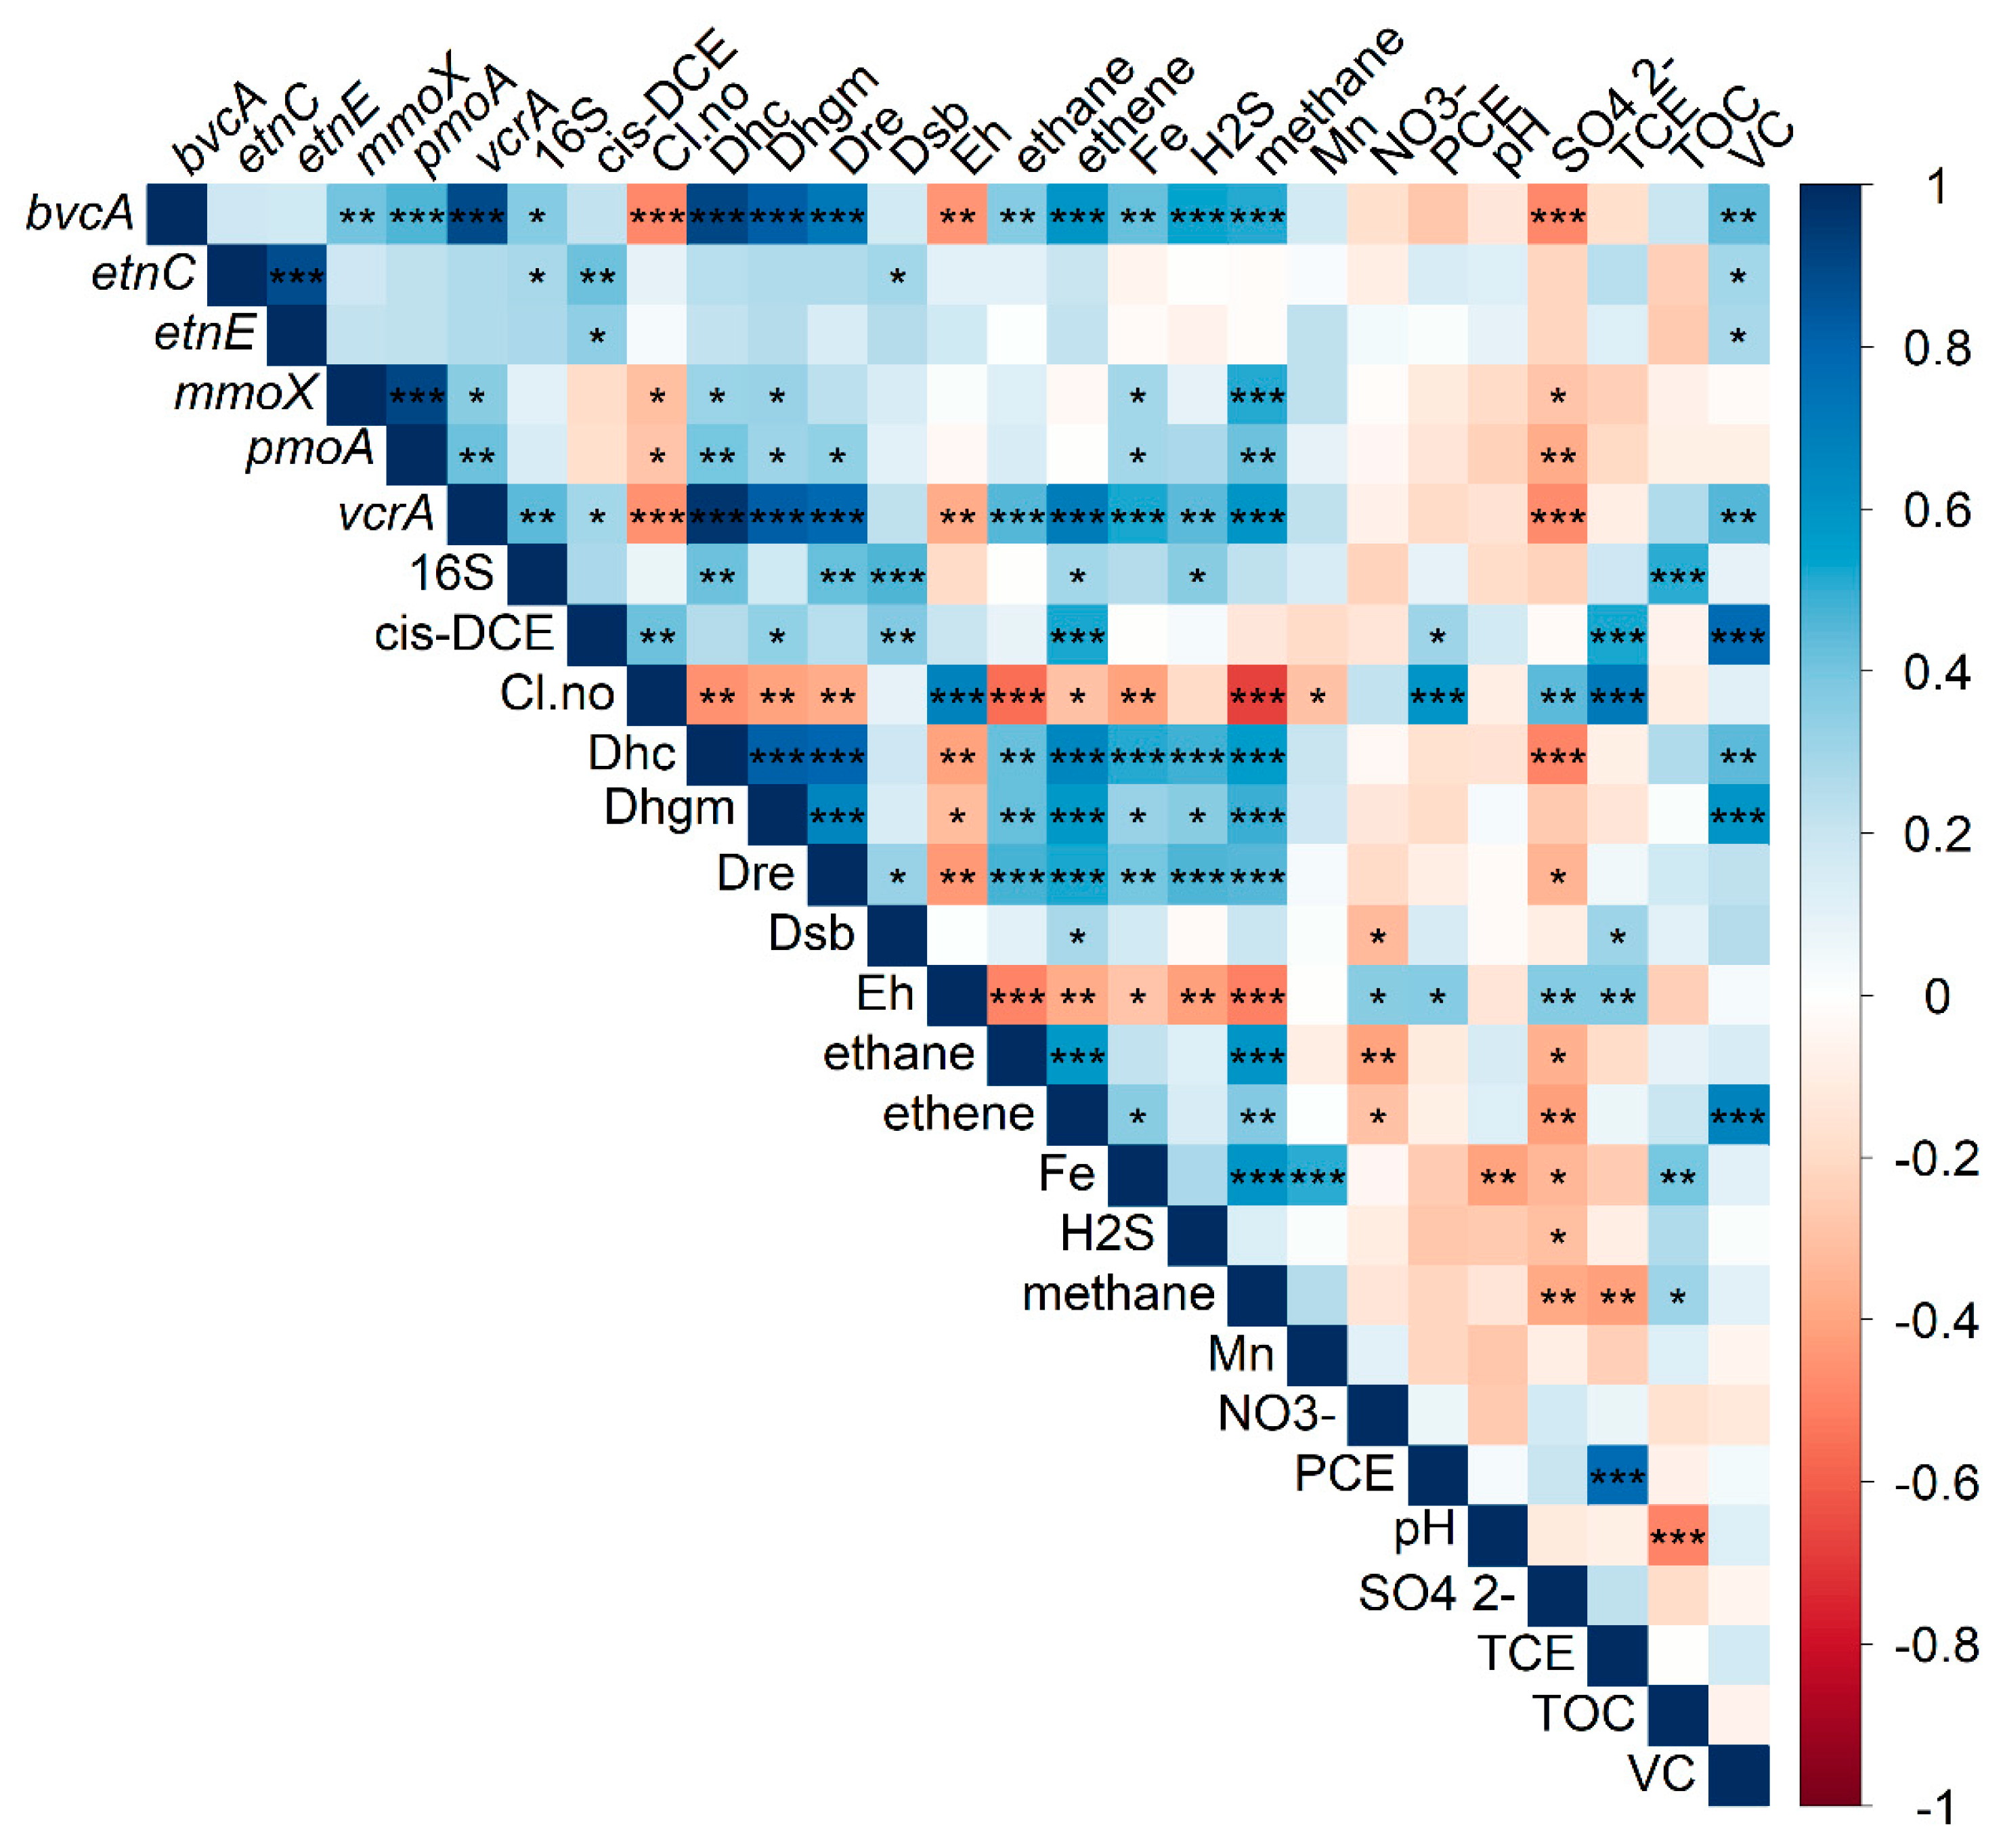
  • The reductive dechlorinator Dehalogenimonas spp., only recently identified as capable of cis-1,2-DCE and VC degradation, was detected by qPCR in 94% of samples. A positive correlation between Dehalogenimonas spp. abundance and cis-1,2-DCE and VC concentration indicates a potential contribution to reductive dechlorination at the sites tested.
  • Presence of both cis-1,2-DCE and VC was positively correlated with the reductive functional gene vcrA, and the ethenotroph functional genes etnC and etnE, and VC additionally with the reductive functional gene bvcA.
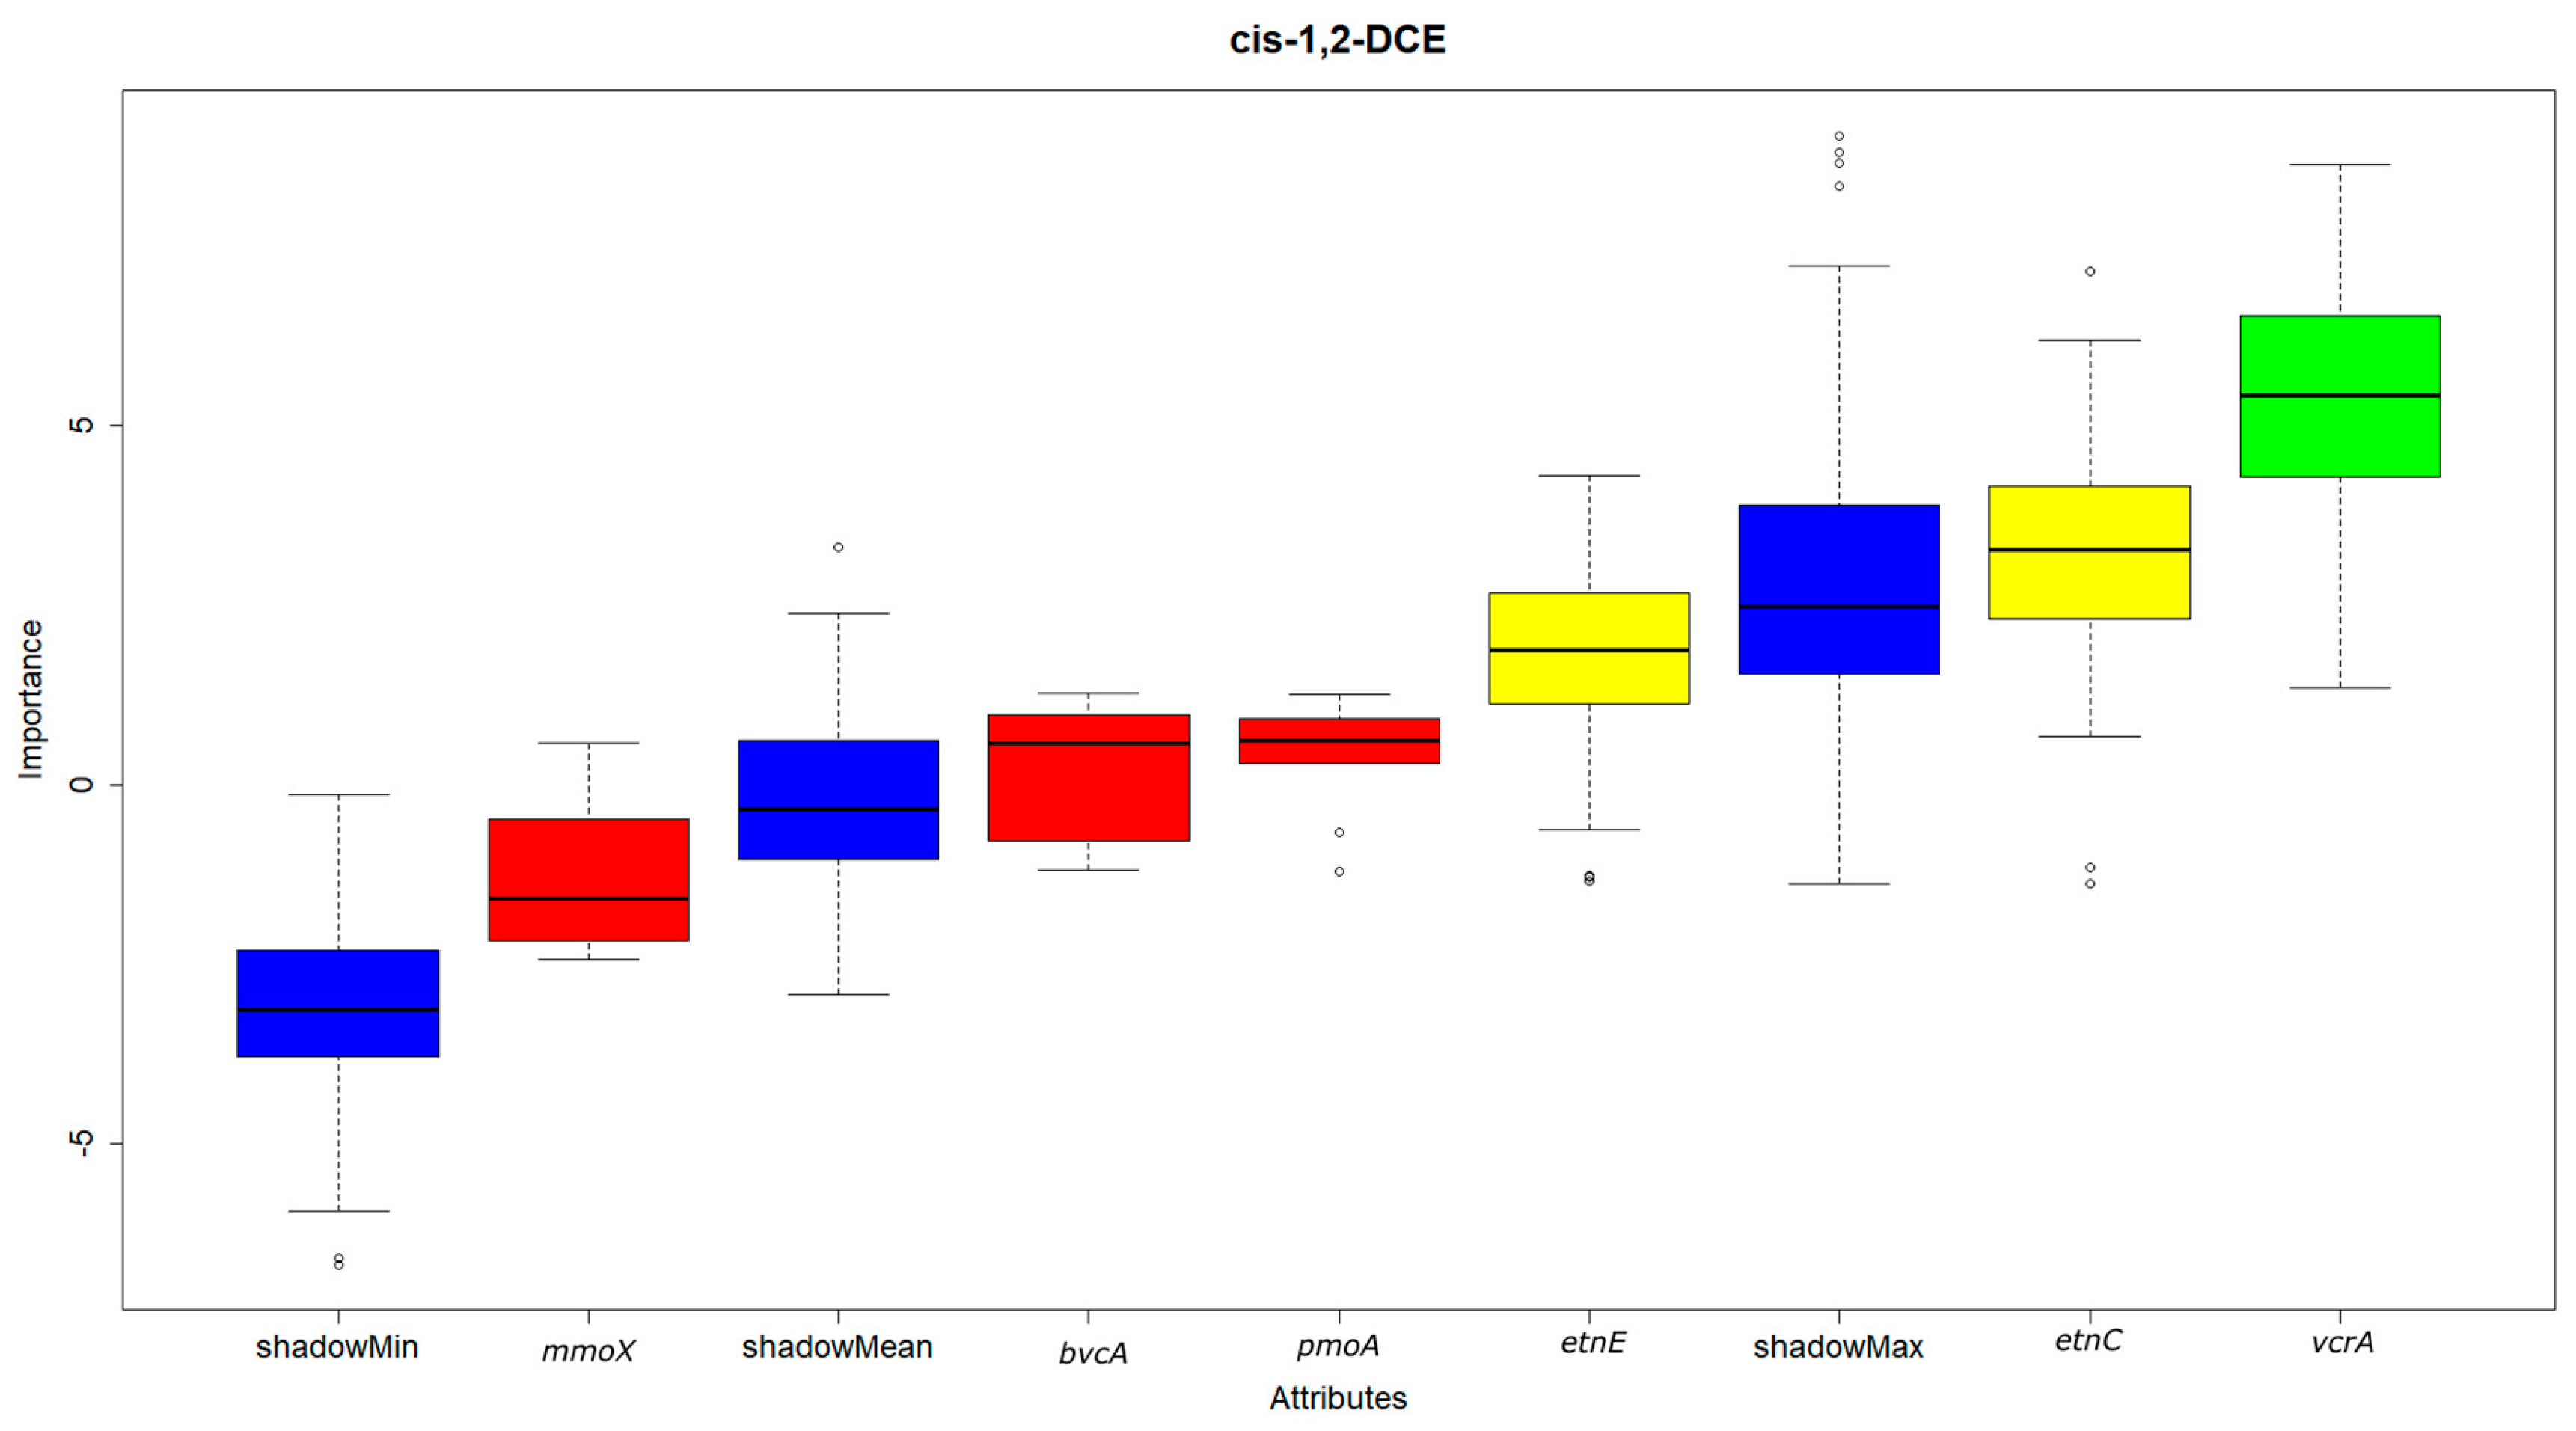
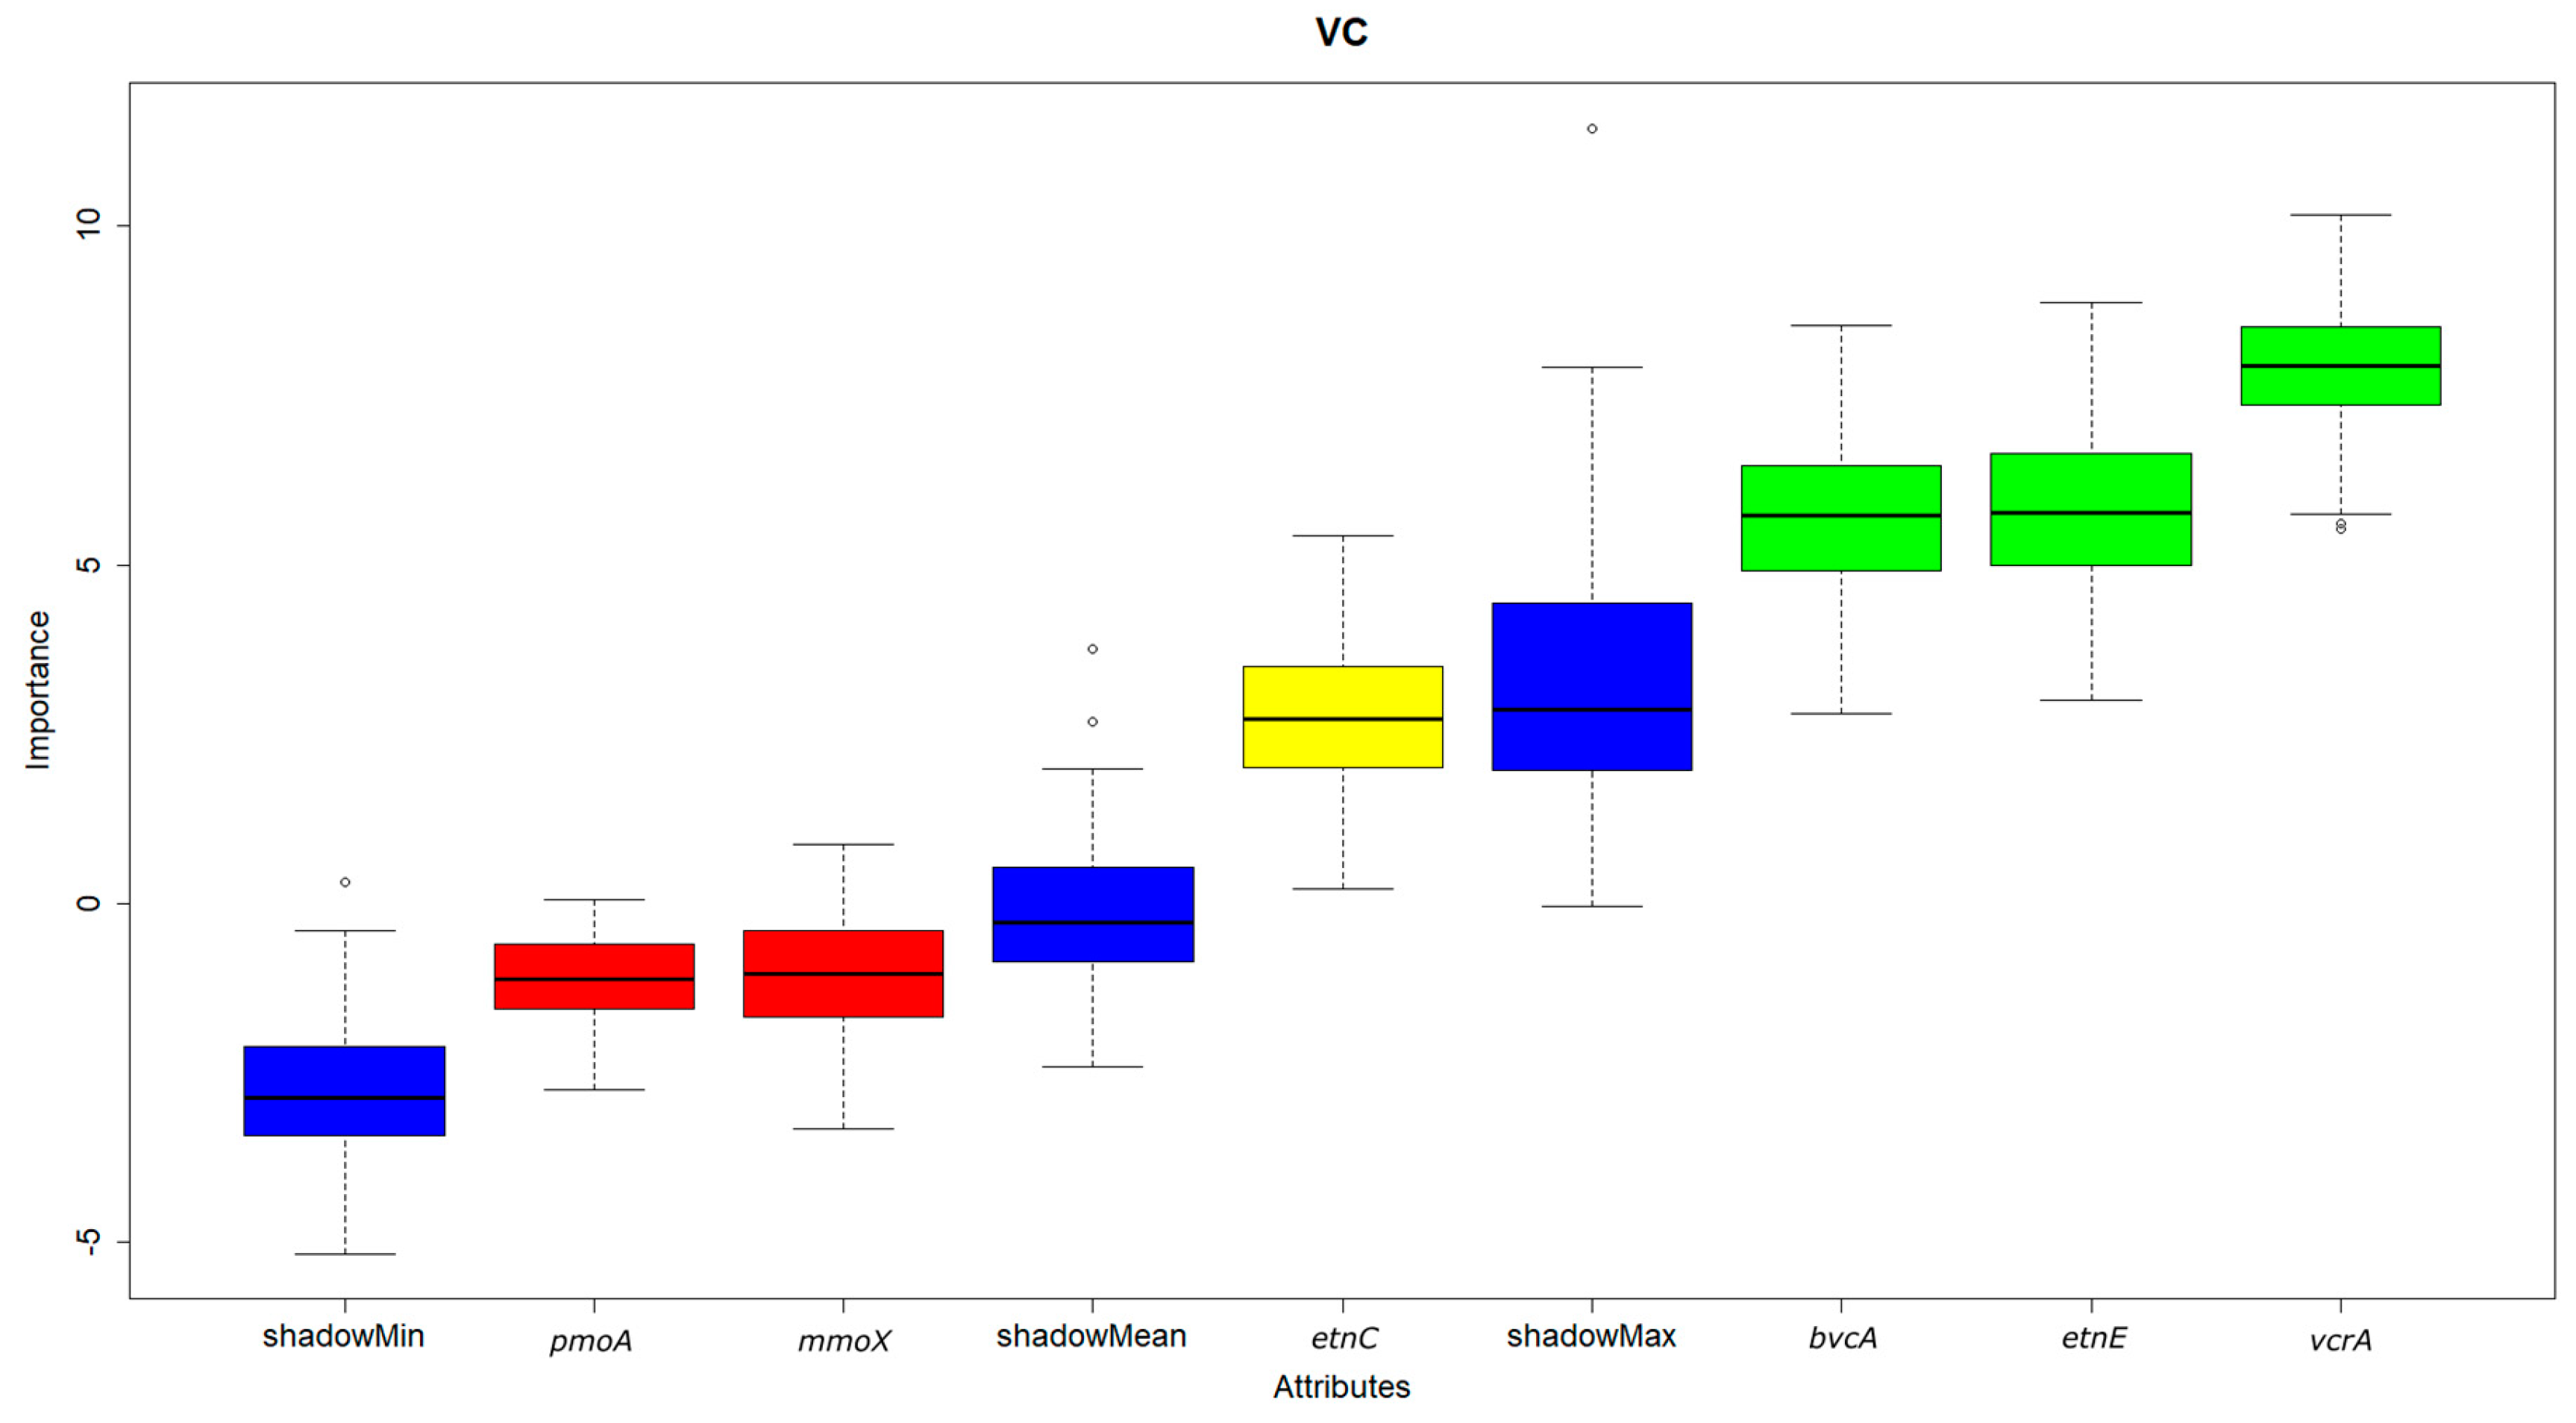
  • Of all the functional genes tested, only the reductive dehalogenase functional gene vcrA was found to be significant for cis-1,2-DCE degradation by feature selection using the random forest algorithm. On the hand, both the dehalogenase functional genes vcrA and bvcA and the ethenotroph functional gene etnE were indicated as significant for VC.
  • No significant relationship was observed between cis-1,2-DCE and VC concentration and abundance of the methanotroph functional genes mmoX and pmoA, because methanotrophs oxidise these contaminants cometabolically only, without any energetic benefit.
  • Cluster analysis revealed that aerobic oxidation of chloroethenes can take place under a broad range of apparent redox conditions, even under apparently methanogenic conditions, probably due to a high redox microheterogeneity of the aquifer environment, ability of ethenotrophs to survive in environments with very limited oxygen contents and high concentrations of ethene and VC (as electron donors in aerobic oxidation of chloroethenes), these being the most important hydrochemical parameters affecting abundance of ethenotrophs.
The results of this study demonstrate the potential for incorporating aerobic steps in in-situ bioremediation schemes for treatment of chloroethenes, especially when temporal stalls in carcinogenic VC may cause an on-site human health risk.

Supplementary Materials

The following are available online at https://www.mdpi.com/2073-4441/12/2/322/s1, Table S1: Primers used in qPCR, Table S2: Hydrochemical data and assessment of predominant redox processes, Table S3: Concentrations of volatile organic compounds and acetylene in groundwater, Figure S1: Graphs of hydrochemical and molecular biological data for each cluster of groundwater samples.

Author Contributions

Conceptualization, J.N.; methodology, J.N. and K.M.; Investigation, P.K. and O.L.; Laboratory analyses, V.A. and K.M.; data curation, J.N., R.Š. and K.M.; Writing—original draft preparation, J.N.; Writing—review and editing, M.Č., K.M. and O.L. All authors have read and agreed to the published version of the manuscript.

Funding

This research was funded by the Technology Agency of the Czech Republic, grant number TH04030225.

Acknowledgments

The authors acknowledge the assistance provided by Research Infrastructure NanoEnviCz (Project no. LM2015073), supported by the Ministry of Education, Youth and Sports of the Czech Republic.

Conflicts of Interest

The authors declare no conflict of interest.

References

  1. Bradley, P.M.; Chapelle, F.H. In Situ Remediation of Chlorinated Solvent Plumes; Stroo, H., Ward, C., Eds.; Springer: New York, NY, USA, 2010; Chapter 3; pp. 39–67. ISBN 978-1-4419-1400-2. [Google Scholar]
  2. Stroo, H.F.; West, M.R.; Kueper, B.H.; Borden, R.C.; Major, D.W.; Ward, C.H. Chlorinated Solvent Source Zone Remediation; Kueper, B.H., Stroo, H.F., Vogel, C.M., Ward, C.H., Eds.; Springer: New York, NY, USA, 2014; Chapter 12; pp. 395–457. ISBN 978-1-4614-6921-6. [Google Scholar]
  3. Holliger, C.; Hahn, D.; Harmsen, H.; Ludwig, W.; Schumacher, W.; Tindall, B.; Vazquez, F.; Weiss, N.; Zehnder, A.J. Dehalobacter restrictus gen. nov. and sp. nov., a strictly anaerobic bacterium that reductively dechlorinates tetra-and trichloroethene in an anaerobic respiration. Arch. Microbiol. 1998, 169, 313–321. [Google Scholar] [CrossRef] [PubMed]
  4. Holliger, C.; Schraa, G.; Stams, A.; Zehnder, A. A highly purified enrichment culture couples the reductive dechlorination of tetrachloroethene to growth. Appl. Environ. Microbiol. 1993, 59, 2991–2997. [Google Scholar] [CrossRef] [Green Version]
  5. Neumann, A.; Scholz-Muramatsu, H.; Diekert, G. Tetrachloroethene metabolism of Dehalospirillum multivorans. Arch. Microbiol. 1994, 162, 295–301. [Google Scholar] [CrossRef] [PubMed]
  6. Krumholz, L.R.; Sharp, R.; Fishbain, S.S. A freshwater anaerobe coupling acetate oxidation to tetrachloroethylene dehalogenation. Appl. Environ. Microbiol. 1996, 62, 4108–4113. [Google Scholar] [CrossRef] [PubMed] [Green Version]
  7. Sung, Y.; Ritalahti, K.M.; Sanford, R.A.; Urbance, J.W.; Flynn, S.J.; Tiedje, J.M.; Löffler, F.E. Characterization of two tetrachloroethene-reducing, acetate-oxidizing anaerobic bacteria and their description as Desulfuromonas michiganensis sp. nov. Appl. Environ. Microbiol. 2003, 69, 2964–2974. [Google Scholar] [CrossRef] [PubMed] [Green Version]
  8. Sung, Y.; Fletcher, K.E.; Ritalahti, K.M.; Apkarian, R.P.; Ramos-Hernández, N.; Sanford, R.A.; Mesbah, N.M.; Löffler, F.E. Geobacter lovleyi sp. nov. strain SZ, a novel metal-reducing and tetrachloroethene-dechlorinating bacterium. Appl. Environ. Microbiol. 2006, 72, 2775–2782. [Google Scholar] [CrossRef] [PubMed] [Green Version]
  9. Luijten, M.L.; de Weert, J.; Smidt, H.; Boschker, H.T.; de Vos, W.M.; Schraa, G.; Stams, A.J. Description of Sulfurospirillum halorespirans sp. nov., an anaerobic, tetrachloroethene-respiring bacterium, and transfer of Dehalospirillum multivorans to the genus Sulfurospirillum as Sulfurospirillum multivorans comb. nov. Int. J. Syst. Evol. Microbiol. 2003, 53, 787–793. [Google Scholar] [CrossRef] [Green Version]
  10. Maillard, J.; Regeard, C.; Holliger, C. Isolation and characterization of Tn-Dha1, a transposon containing the tetrachloroethene reductive dehalogenase of Desulfitobacterium hafniense strain TCE1. Environ. Microbiol. 2005, 7, 107–117. [Google Scholar] [CrossRef]
  11. Löffler, F.E.; Ritalahti, K.M.; Zinder, S.H. Bioaugmentation for Groundwater Remediation; Stroo, H., Leeson, A., Ward, C., Eds.; Springer: New York, NY, USA, 2013; Chapter 2; pp. 39–88. ISBN 978-1-4614-4114-4. [Google Scholar]
  12. Maymó-Gatell, X.; Nijenhuis, I.; Zinder, S.H. Reductive dechlorination of cis-1, 2-dichloroethene and vinyl chloride by “Dehalococcoides ethenogenes”. Environ. Sci. Technol. 2001, 35, 516–521. [Google Scholar] [CrossRef]
  13. Yang, Y.; Higgins, S.A.; Yan, J.; Şimşir, B.; Chourney, K.; Iyer, R.; Hettlich, R.L.; Baldwin, B.; Ogles, D.M.; Löffler, F.E. Grape pomace compost harbors organohalide-respiring Dehalogenimonas species with novel reductive dehalogenase genes. ISME J. 2017, 11, 2767–2780. [Google Scholar] [CrossRef] [Green Version]
  14. Judger, B.-E.; Ertan, H.; Lee, M.; Manefield, M.; Marquis, C.P. Reductive dehalogenases come of age in biological destruction of organohalides. Trends Biotechnol. 2015, 33, 596–608. [Google Scholar] [CrossRef]
  15. Tratnyek, P.G.; Johnson, R.L.; Lowry, G.V.; Brown, R.A. Chlorinated Solvent Source Zone Remediation; Kueper, B.H., Stroo, H.F., Vogel, C.M., Ward, C.H., Eds.; Springer: New York, NY, USA, 2014; Chapter 10; pp. 307–351. ISBN 978-1-4614-6921-6. [Google Scholar]
  16. Thiem, A.; Schmidt, K.R. Sequential anaerobic biodegradation of chloroethenes—Aspects of field application. Curr. Opin. Biotechnol. 2011, 22, 415–421. [Google Scholar] [CrossRef] [PubMed]
  17. Coleman, N.V.; Mattes, T.E.; Gossett, J.M.; Spain, J.C. Phylogenetic and kinetic diversity of aerobic vinyl chloride-assimilating bacteria from contaminated sites. Appl. Environ. Microbiol. 2002, 68, 6162–6171. [Google Scholar] [CrossRef] [PubMed] [Green Version]
  18. Mattes, T.E.; Alexander, A.K.; Coleman, N.V. Aerobic biodegradation of the chloroethenes: Pathways, enzymes, ecology, and evolution. FEMS Microbiol. Rev. 2010, 34, 445–475. [Google Scholar] [CrossRef] [Green Version]
  19. Richards, P.M.; Liang, Y.; Johnson, R.; Mattes, T.E. Cryogenic soil coring reveals coexistence of aerobic and anaerobic vinyl chloride degrading bacteria in a chlorinated ethene contaminated aquifer. Water Res. 2019, 157, 281–291. [Google Scholar] [CrossRef] [Green Version]
  20. Liang, Y.; Liu, X.; Singletary, M.A.; Wang, K.; Mattes, T.E. Relationships between the abundance and expression of functional genes from vinyl chloride (VC)-degrading bacteria and geochemical parameters at VC-contaminated sites. Environ. Sci. Technol. 2017, 51, 12164–12174. [Google Scholar] [CrossRef]
  21. Wymore, R.A.; Lee, M.H.; Keener, W.K.; Miller, A.R.; Colwell, F.S.; Watwood, M.E.; Sorenson, K.S. Field evidence for intrinsic aerobic chlorinated cometabolism by methanotrophs expressing soluble methane monooxygenase. Biorem. J. 2007, 11, 125–139. [Google Scholar] [CrossRef] [Green Version]
  22. Paszynski, A.J.; Paidisetti, R.; Johnson, A.K.; Crawford, R.L.; Colwell, F.S.; Green, T.; Delwiche, M.; Lee, H.; Newby, D.; Brodie, E.L.; et al. Proteomic and targeted qPCR analyses of ubsurface microbial communities for presence of methane monooxygenase. Biodegradation 2011, 22, 1045–1059. [Google Scholar] [CrossRef]
  23. Coleman, N.V.; Spain, J.C. Epoxyalkane: Coenzyme M transferase in the ethene and vinyl chloride biodegradation pathways of mycobacterium strain JS60. J. Bacteriol. 2003, 185, 5536–5545. [Google Scholar] [CrossRef] [Green Version]
  24. Jin, Y.O.; Mattes, T.E. A quantitative PCR assay for aerobic, vinyl chloride- and ethene-assimilating microorganisms in groundwater. Environ. Sci. Technol. 2010, 44, 9036–9041. [Google Scholar] [CrossRef]
  25. Abe, Y.; Aravena, R.; Zopfi, J.; Shouakar-Stash, O.; Cox, E.; Roberts, J.D.; Hunkeler, D. Carbon and chlorine isotope fractionation during aerobic oxidation and reductive dechlorination of vinyl chloride and cis-1, 2-dichloroethene. Environ. Sci. Technol. 2009, 43, 101–107. [Google Scholar] [CrossRef] [PubMed] [Green Version]
  26. Jennings, L.K.; Chartrand, M.M.; Lacrampe-Couloume, G.; Lollar, B.S.; Spain, J.C.; Gossett, J.M. Proteomic and transcriptomic analyses reveal genes upregulated by cis-dichloroethene in Polaromonas sp. strain JS666. Appl. Environ. Microbiol. 2009, 75, 3733–3744. [Google Scholar] [CrossRef] [PubMed] [Green Version]
  27. Dolinová, I.; Štrojsová, M.; Černík, M.; Němeček, J.; Macháčková, M.; Ševců, A. Microbial degradation of chloroethenes: A review. Environ. Sci. Pollut. Res. 2017, 24, 13262–13283. [Google Scholar] [CrossRef] [PubMed]
  28. ČSN ISO 5667-11. Water Quality—Sampling—Part 11: Guidance on Sampling of Groundwaters; International Organization for Standardization: Geneva, Switzerland, 1993. [Google Scholar]
  29. Němeček, J.; Dolinová, I.; Macháčková, J.; Špánek, R.; Ševců, A.; Lederer, T.; Černík, M. Stratification of Chlorinated Ethenes Natural Attenuation in an Alluvial Aquifer Assessed by Hydrochemical and Biomolecular Tools. Chemosphere 2017, 184, 1157–1167. [Google Scholar] [CrossRef]
  30. ČSN EN ISO 11885. Water Quality—Determination of Selected Elements by Inductively Coupled Plasma Optical Emission Spectrometry (ICP-OES); International Organization for Standardization: Geneva, Switzerland, 2007. [Google Scholar]
  31. ČSN 83 0530-31. Chemical and Physical Analysis of Surface Water. Determination of Sulfide and Hydrogen Sulfide; International Organization for Standardization: Geneva, Switzerland, 1980. [Google Scholar]
  32. ČSN EN 1484. Water AnalysisGuidelines for the Determination of Total Organic Carbon (TOC) and Dissolved Organic Carbon (DOC); International Organization for Standardization: Geneva, Switzerland, 1998. [Google Scholar]
  33. ČSN EN ISO 10304-1. Water Quality—Determination of Dissolved Anions by Liquid Chromatography of Ions—Part 1: Determination of Bromide, Chloride, Fluoride, Nitrate, Nitrite, Phosphate and Sulfate; International Organization for Standardization: Geneva, Switzerland, 2007. [Google Scholar]
  34. Bewley, R.; Hick, P.; Rawcliffe, A. Meeting the challenges for bioremediation of chlorinated solvents at operational sites: A comparison of case studies. In Proceeding of the 13th International UFZ-Deltarez Conference on Sustainable Use and Management of Soil, Sediment and Water Resources, Copenhagen, Denmark, 9–12 June 2015. [Google Scholar]
  35. Chapelle, F.H.; Bradley, P.M.; Thomas, M.A.; McMahon, P.B. Distinguishing iron-reducing from sulfate-reducing conditions. Ground Water 2009, 47, 300–3058. [Google Scholar] [CrossRef]
  36. RStudio Team. RStudio: Integrated Development for R; RStudio, Inc.: Boston, MA, USA, 2015; Available online: http://www.rstudio.com/ (accessed on 28 November 2019).
  37. R Core Team. R: A Language and Environment for Statistical Computing; R Foundation for Statistical Computing: Vienna, Austria, 2018; Available online: http://www.R-project.org/ (accessed on 28 November 2019).
  38. Myers, J.L.; Well, A.D. Research Design and Statistical Analysis, 2nd ed.; Lawrence Erlbaum Associates: Mahwah, NJ, USA, 2003; p. 760. ISBN 0805840370. [Google Scholar]
  39. Kursa, M.B.; Rudnicki, W.R. Feature Selection with the Boruta Package. J. Stat. Soft. 2010, 36, 1–13. [Google Scholar] [CrossRef] [Green Version]
  40. Brock, E.; Pihur, V.; Datta, S.; Datta, S. clValid: An R Package for Cluster Validation. J. Stat. Soft. 2008, 25, 1–22. [Google Scholar] [CrossRef] [Green Version]
  41. Roberts, A.L.; Totten, L.A.; Arnold, W.A.; Burris, D.R.; Campbell, T.J. Reductive elimination of chlorinated ethylenes by zero valent metals. Environ. Sci. Technol. 1996, 30, 2654–2659. [Google Scholar] [CrossRef]
  42. Wild, A.; Hermann, R.; Leisinger, T. Isolation of an anaerobic bacterium which reductively dechlorinates tetrachloroethene and trichloroethene. Biodegradation 1996, 7, 507–511. [Google Scholar] [CrossRef]
  43. Bouwer, E.J. Bioremediation of chlorinated solvents using alternate electron acceptors. In Handbook of Bioremediation; Norris, R., Hinchee, R., Brown, R., McCarty, P., Semprini, L., Wilson, J., Kampbell, D., Reinhard, M., Borden, R., Eds.; Lewis Publishers: Boca Raton, FL, USA, 1994; pp. 149–175. [Google Scholar]
  44. Ehrlich, H.L.; Newman, D.K. Geomicrobiology, 5th ed.; CRC Press, Taylor & Francis Group: Boca Raton, FL, USA, 2009; p. 628. ISBN 978-0-8493-7906-2. [Google Scholar]
  45. Schmidt, K.R.; Tiehm, A. Natural attenuation of chloroethenes: Identification of sequential reductive/oxidative biodegradation by microcosm studies. Water Sci. Technol. 2008, 58, 1137–1145. [Google Scholar] [CrossRef]
  46. Gossett, J.M. Sustained aerobic oxidation of vinyl chloride at low oxygen concentrations. Environ. Sci. Technol. 2010, 44, 1405–1411. [Google Scholar] [CrossRef] [PubMed]
  47. Atashgahi, S.; Maphosa, F.; Doğan, E.; Smidt, H.; Springael, D.; Dejonghe, W. Small-scale oxygen distribution determines the vinyl chloride biodegradation pathway in surficial sediments of riverbed hyporheic zones. FEMS Microbiol. Ecol. 2013, 84, 133–142. [Google Scholar] [CrossRef] [PubMed] [Green Version]
  48. Atashgahi, S.; Lu, Y.; Ramiro-Garcia, J.; Peng, P.; Maphosa, F.; Sipkema, D.; Dejonghe, W.; Smidt, H.; Springael, D. Geochemical parameters and reductive dechlorination determine aerobic cometabolic vs. aerobic metabolic vinyl chloride biodegradation at oxic/anoxic interface of hyporheic zones. Environ. Sci. Technol. 2017, 51, 1626–1634. [Google Scholar] [CrossRef] [PubMed]
Figure 1. Location and numbering of contaminated sites tested in this study.
Water 12 00322 g001
Figure 2. Venn diagram showing the numbers of groundwater samples where functional gene groups were found individually or jointly (value of Cq = 40 was used as the detection limit, see Section 2.3 for more information).
Water 12 00322 g002
Figure 3. Results of Spearman correlation analysis (intensities of blue and red colours indicate values of positive and negative correlation coefficients, respectively; p-values: *** = 0.001, ** = 0.01, * = 0.05).
Water 12 00322 g003
Figure 4. Importance of individual biomarkers on concentration of cis-1,2-DCE, based on the Boruta algorithm utilising the random forest classification. Green indicates significant attributes, yellow indicates attributes of intermediate significance while red indicates attributes that are not significant (blue colour indicates shadows—Boruta auxiliary features used for selection of significant attributes).
Water 12 00322 g004
Figure 5. Importance of individual biomarkers on concentration of VC, based on the Boruta algorithm utilising the random forest classification. Green indicates significant attributes, yellow indicates attributes of intermediate significance while red indicates attributes that are not significant (blue colour indicates shadows—Boruta auxiliary features used for selection of significant attributes).
Water 12 00322 g005
Table 1. Water chemistry criteria for identifying redox processes in groundwater (modified from Chapelle et al. [35].
Predominant Redox ProcessNO3 (mg/L)Mn2+ (mg/L)Fe2+ (mg/L)SO42− (mg/L)Fe/H2SMethane (mg/L)
OxicO2 reduction-<0.05<0.1---
AnoxicNO3 reduction≥1.0<0.05<0.1---
Mn(IV) reduction<1.0≥0.05<0.1---
Fe(III) reduction<1.0-≥0.1≥0.5>10-
Mix Fe(III)/SO42− reduction<1.0-≥0.1≥0.53–10-
SO42− reduction<1.0-≥0.1≥0.5<3-
Methanogenesis<1.0-≥0.1<0.5-≥0.5
Table 2. Summary of qPCR results (samples are identified based on the well number and time (after underline), site ID refers to Figure 1, plume ID is related to the site ID, and in case that the well was affected by whey application, the time interval is mentioned, for abbreviations see text in Section 2.3).
Sample IDSite IDPlume IDDate of Sampling DD.MM.YYAffected by Whey Application Y/NTime Elapsed after the Last Whey Application (Months)Total BacteriaAerobic BiomarkersReductive Biomarkers
VC Reductive Dehalogenase GenesReductive Dechlorinators
16SetnCetnEmmoXpmoAbvcAvcrADhcDhgmDsbDre
AT-1511_124.01.19Y1++++++++++++++++++++++
AT-1911_101.05.19NNA++++++++++++++++++++++
AT-2011_101.05.19NNA+++++++++ND++ND++ND
AT-2111_101.05.19NNA+++++++++++-++++++-
SV-1022_124.01.19Y*8+++++++++++++++-+++ND
VS-522_124.01.19Y*8++++++++++++++++++-
A_I.33_104.02.19NNA+NDNDNDNDND++++ND
B_IV.33_104.02.19N*NA+NDNDNDNDND+NDND++ND
SM-7D33_204.02.19Y16+++++++++++++++++++++++++++
VS-7S_133_318.07.17N*NA++++++++++++++++++
VS-7S_233_313.10.17Y1++++++++++++++++++++++++++
VS-7S_333_312.02.18Y4++++++++++++++++++++++++
VS-7S_433_326.03.18Y5+++++++++++++++++++++++++
VS-7S_533_304.02.19Y16++++++ND+++++++++++++++
Studna_133_318.07.17NNA++++++++++++++++++
Studna_233_313.10.17Y1++++++++++++++++++++++
Studna_333_312.02.18Y4++++++++++++++++++++
Studna_433_326.03.18Y5+++++++++++++++++++
SM-8_133_318.07.17NNA++++++++++++++++++++++++++
SM-8_233_313.10.17Y1++++++++++++++++++++++++++
SM-8_333_312.02.18Y4+++++++++++++++++++++++++++
SM-8_433_326.03.18Y5++++++++++++++++++++++++++
AP-244_105.02.19Y28++++++++++++++++++++ND
HV-1644_109.04.19NNA+++-+++++++++++++++-
HV-2544_109.04.19Y50++++++++++++++++++
HV-8_144_103.08.16Y50++++++++++++++++++++++
HV-8_244_110.10.16Y1++++++++++++++++++++++++++
HV-8_344_116.01.17Y3++++++++++++++++++++-
HML-4S_144_103.08.16Y50++++++++++++++++++
HML-4S_244_110.10.16Y1++++++++++++++++++++
HML-4S_344_116.01.17Y3+++++++++++++++++++++
HV-53D44_209.04.19Y30+++++++++++++++++++
V-555_122.01.19Y3++++++++++++++++++ND+
V-1155_122.01.19Y3++++++++ND+++++++
V-1355_222.01.19Y*3++++ND++ND++++++++
SV-155_222.01.19NNA++++++++++++++++++ND
HJ-466_129.01.19NNA+++++++NDNDND+-+ND
V-3266_129.01.19NNA+++++++++ND++-+++ND
MV - 6A77_120.02.19Y34++-+-++++++++ND
Z - 477_120.02.19Y34+++++++++++++++++++ND
Žd - 288_120.02.19Y26++++++++++++++++++++++++++++++
Žd - 488_120.02.19Y26+++++++++++++++++++++++++++++++
MR 499_121.02.19Y50++++++++++++++++++
ZMS 499_121.02.19Y9+++++++++++++++++++++ND
HLV-51010_104.03.19NNA+++++++++++ND+++++++++
HV-261010_104.03.19NNA+NDNDNDNDNDNDNDND+ND
ID-21111_105.03.19NNA+NDNDNDND++++NDND
HV-2231212_109.05.19Y2+++++++++++++++++++++++++++
HV-1121212_109.05.19Y2+++++-++++++++++++++++++
Legend: * affected by application of ZVI
+++high quantity
++medium quantity
+low quantity
+-close to the detection limit
NDnot detected
Categories of “high”, “medium”, and “low” quantitites represent the respective thirds of the determined range of Cq values for each biomarker

