Drought Assessment using GRACE Terrestrial Water Storage Deficit in Mongolia from 2002 to 2017


1
School of Hydrology and Water Resources, Nanjing University of Information Science and Technology, Nanjing 210044, China
2
Department of Crop, Soil and Environmental Sciences, Auburn University, AL 36849, USA
3
College of Environment and Planning, Henan University, Kaifeng 475004, China
*
Author to whom correspondence should be addressed.
Water 2019, 11(6), 1301; https://doi.org/10.3390/w11061301
Submission received: 24 April 2019
/
Revised: 12 June 2019
/
Accepted: 20 June 2019
/
Published: 22 June 2019
(This article belongs to the Section Hydrology)
Abstract
:Climate warming can result in increases in the frequency and magnitude of drought events, leading to water shortages and socioeconomic losses. Gravity Recovery and Climate Experiment (GRACE) satellite data have been used to monitor and estimate drought events. However, there is little information on detecting the characteristics of droughts in Mongolia due to sparse observations. In this study, we estimate the drought conditions in Mongolia using GRACE terrestrial water storage data during 2002–2017. Water storage deficit (WSD) is used to identify the drought event and calculate the water storage deficit index (WSDI). The WSDI was compared with the standardized precipitation index (SPI) and the standardized precipitation evapotranspiration index (SPEI). The results showed that there were two turning points of WSD in 2007 and 2012. Eight drought events were identified and the most severe drought occurred in 2007–2009 lasting for 38 months with a WSDI of −0.98 and a total WSD of −290.8 mm. Overall, the WSD and WSDI were effective in analyzing and assessing the drought severity in a region where hydrological observations are lacking.
1. Introduction
Drought is a type of natural hazard that plays a critical role in threatening various ecosystems and human societies, which has attracted much attention in ecology, hydrology, and meteorology [1]. Some studies indicate that the frequency and magnitude of droughts are projected to enhance in the future due to climate change [2,3]. It has been reported that an increase in drought intensity can lead to an imbalance of soil nutrients cycling in terrestrial ecosystems, which in turn affect ecosystem functions and stability [4]. Furthermore, droughts can lead to substantial loss of crop and economy. The recent drought in Mongolia is associated with major social and environmental change, including migration of several hundred herders to the capital city, drying of lakes, and declines in grassland productivity [5]. Thus, it is of great importance to monitor and characterize drought events and spatiotemporal pattern of water deficit.
Regional drought evaluation is traditionally dependent on site−level observations that provide high spatial and temporal resolution data [6]. Although field observations have high resolution in specific regions, the field monitors need installing of some instruments that are not only limited in space and time but are also costly in high human and material resources. Drought is characterized by total water deficit (e.g., soil water, surface water, groundwater) [7], which is hard to quantify over large regions for a long time due to limited observations and systematic monitoring. In recent years, remote sensing has been demonstrated to be a useful and cost−effective approach in accurately understanding regional variations and patterns of drought−related parameters [8,9,10]. Since 2002, the Gravity Recovery and Climate Experiment (GRACE) satellite was launched into near polar orbits with an along−track separation of approximately 200 km at an altitude of 500 km, and it has provided a mapping of the time−variation of the monthly Total Water Storage (TWS) at regional and global scales [11,12]. GRACE−derived TWS dataset shows clear water loss or gains including all vertical water content such as ice, snow, surface water, soil moisture, and groundwater during a drought period because the effects of climate and atmosphere are removed [5,13]. Previous studies indicate that drought events can be accurately monitored using the GRACE−inferred TWS at regional scales, such as Yangtze River Basin [6], Amazon Basin [14], and southwestern China [15]. Therefore, the GRACE−based TWS is a powerful method in quantifying and characterizing drought events at a regional scale.
Drought indices are used to describe the features of drought (e.g. intensity and duration), which assimilate various parameters including precipitation, temperature, snowpack, soil moisture, and other water supply related drought variables into a single parameter [16,17]. In recent decades, many drought indices have been developed to estimate drought events, such as Standardized Precipitation Index (SPI), Rainfall Anomaly Index (RAI), Palmer Drought Severity Index (PDSI), Standardized Runoff Index (SRI), Surface Water Supply Index (SWSI), Standardized Precipitation Evapotranspiration Index (SPEI), and Vegetation Condition Index (VCI), which mainly rely upon subcomponents or proxies of total water deficit brought on by precipitation, temperature, wind speed, solar radiation, and other factors [18,19,20]. Apart from these drought indices related to meteorological, agricultural, hydrological, and socioeconomic variables, remote sensing−based drought indices have been prevalent in monitoring and detecting drought events for the last years because satellite images can obtain more spatial information with a high reliability at regional scales. For instance, some previous studies used GRACE−derived drought indices, including Total Storage Deficit Index (TSDI), hydrological drought index, Total Water Storage Anomaly Index (TWSI), and Water Storage Deficit Index (WSDI), to detect and analyze the occurrence, intensity, and duration of drought events around the world [21,22,23]. It is therefore of great importance to quantify and estimate the drought events using remote sensing−based drought indices.
Mongolia has experienced water shortages and droughts due to relatively sparse vegetation cover, low soil water capacity, and high rate of evapotranspiration [24]. These shortages and droughts play a key role in limiting the agricultural and socioeconomic development in this country. However, little information exists on monitoring and detecting the characteristics of droughts in this region due to the limited observations. In this paper, we use WSD and WSDI derived from GRACE−based Total Water Storage Anomaly (TWSA) to estimate the occurrence and intensity of drought events in Mongolia from April 2002 to June 2017.
2. Study Area
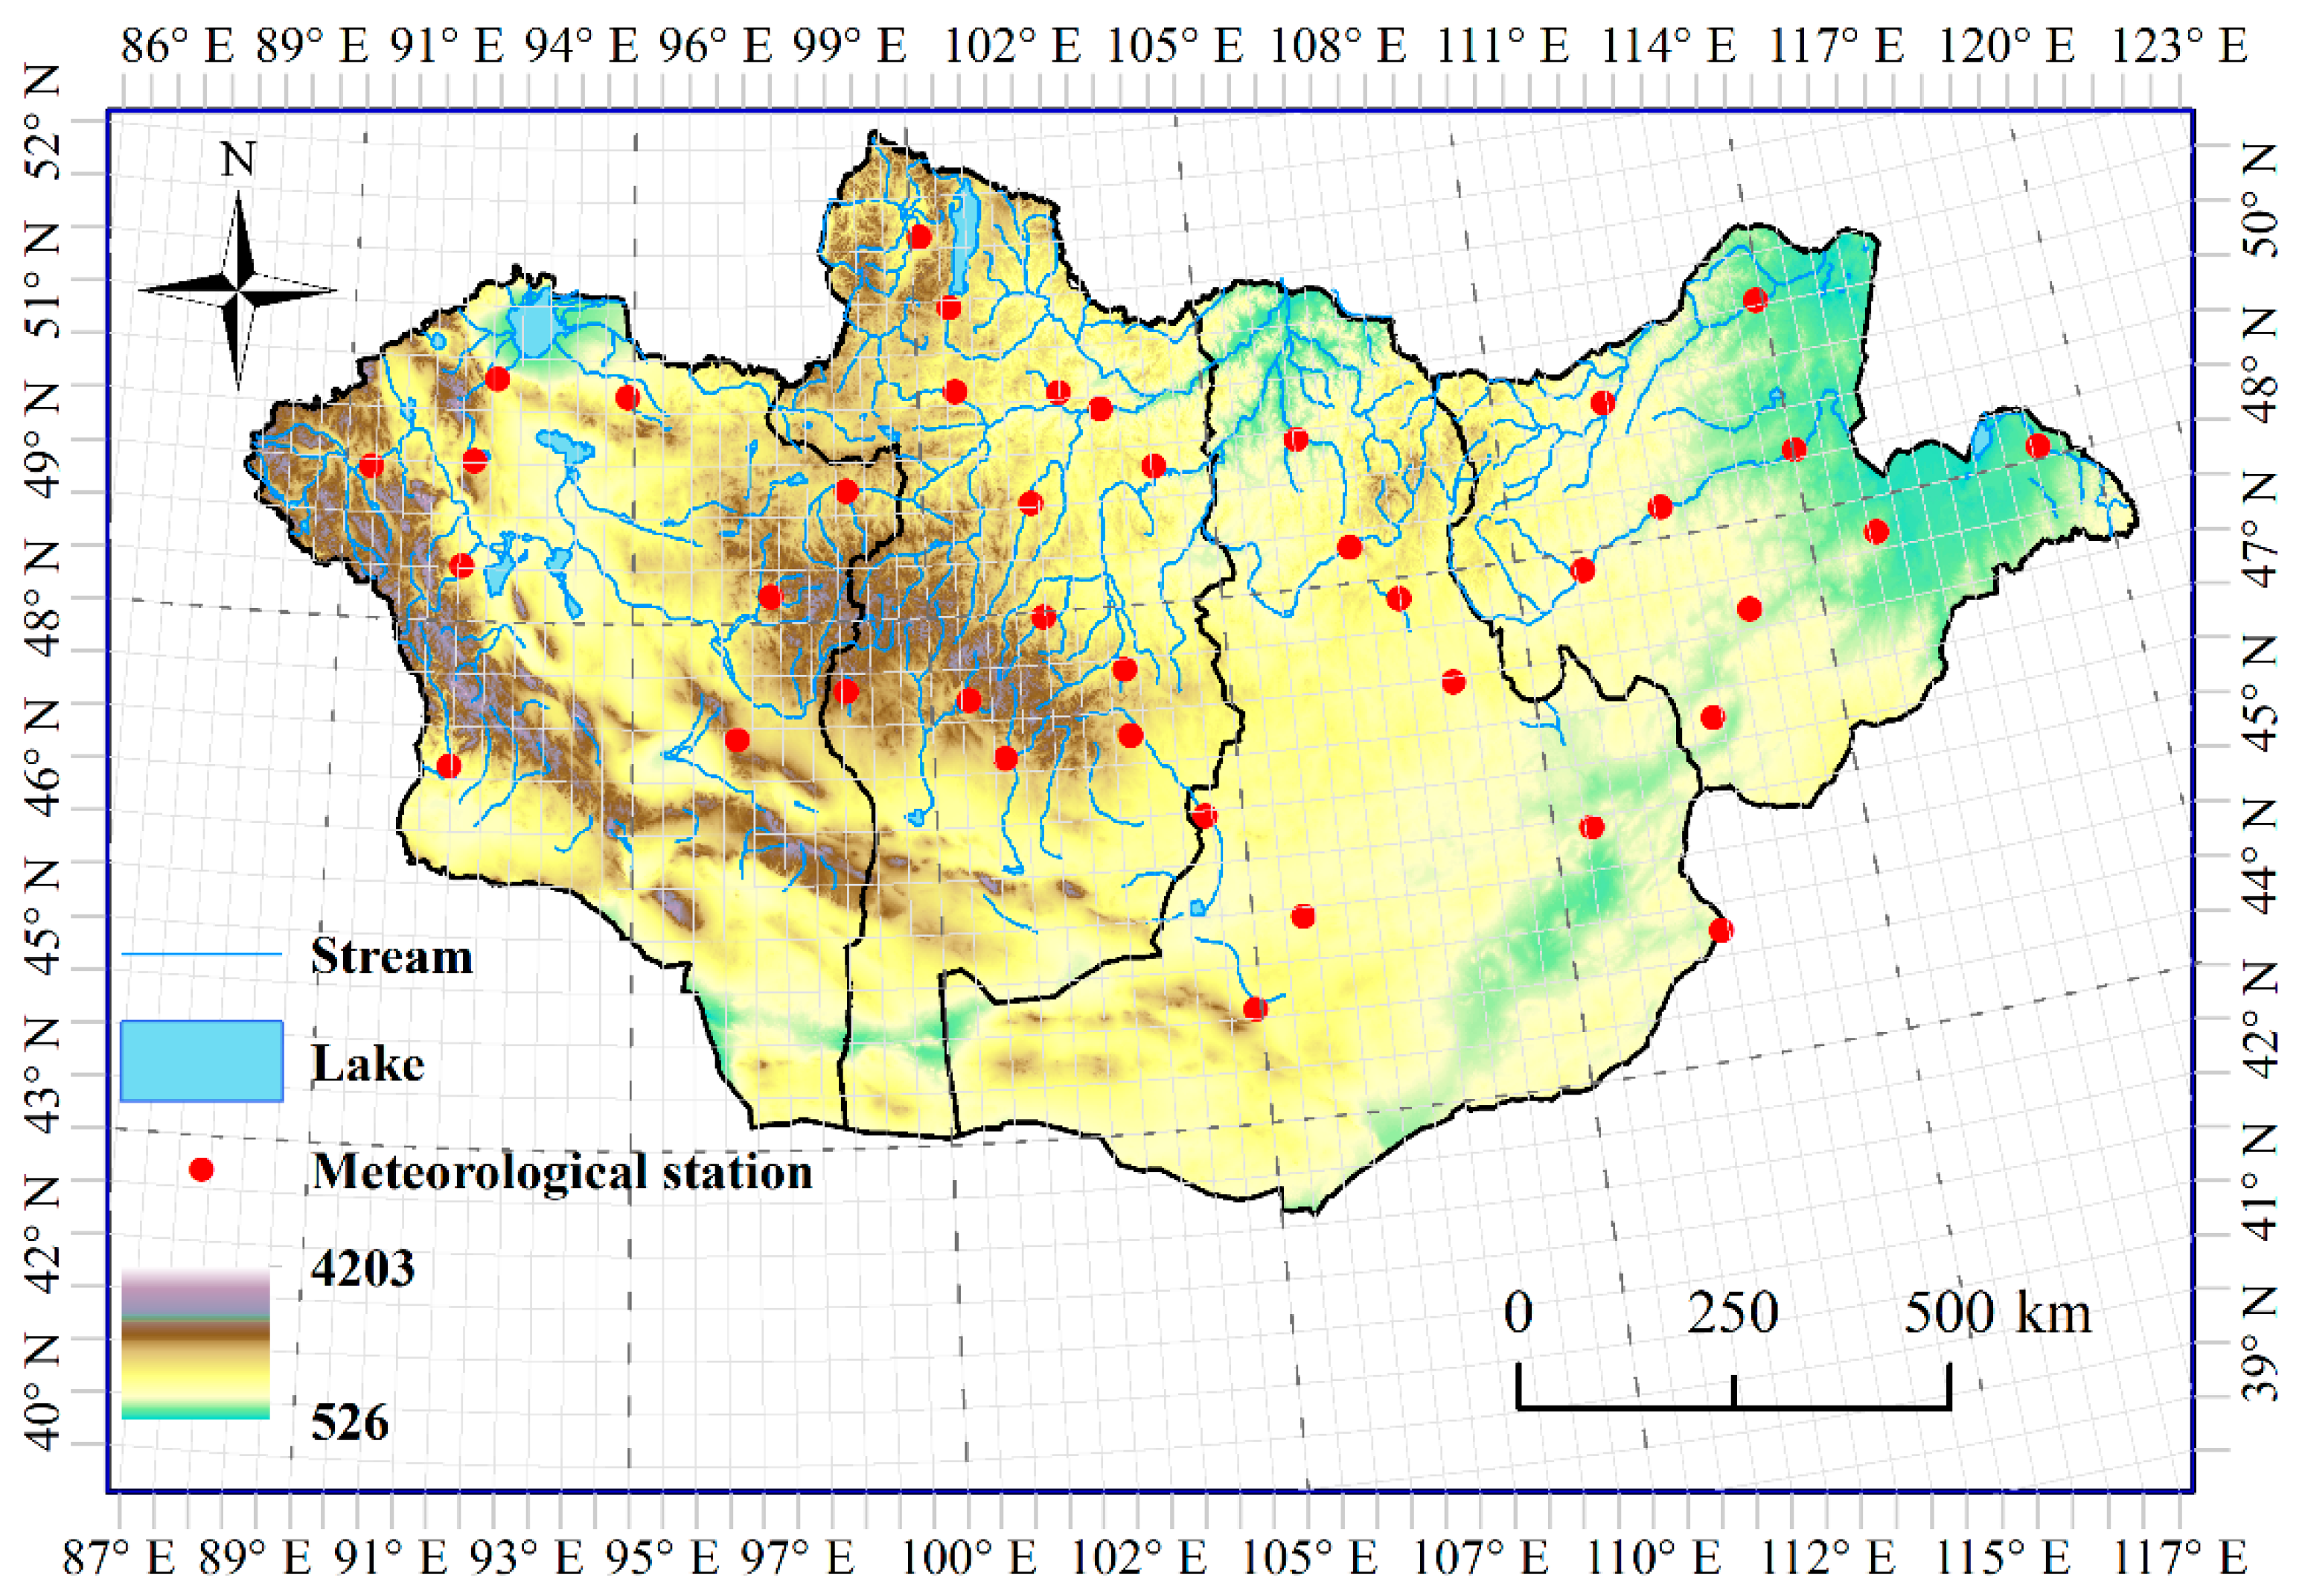
The nation of Mongolia is adjacent to northern China and southern Russia, covering an area of approximate 1.56 × 10⁶ km2 bounded between 41.59°N–52.14°N and between 87.76°E–119.93°E (Figure 1). The average elevation is about 1500 m and decreases gradually from the west to the east. This region is characterized by an extreme continental climate, with long and frigid winters, and short and warm summers. The hottest air temperature record is 35 °C in summer and the coldest temperature is −45 °C in winter. Mean annual precipitation is approximately 200 mm and more than 200 mm in the north and less than 100 mm in the south, with about 70% falling in July and August [24]. The precipitation shows a decreasing trend from north to south, while air temperature increases from south to north. Permafrost is mainly distributed in the northern part of Mongolia. Land cover types consist of forest, grassland, cropland, desert, and barren from north to south in Mongolia, of which desert occupies about a quarter of the area in the southern part, and grassland is the dominant vegetation type in the center part.
3. Materials and Methods
3.1. Materials
3.1.1. GRACE Data
The GRACE space mission is a joint project between NASA (the US National Aeronautics and Space Administration) and the DLR (the German Aerospace Center) that can accurately measure the averaged time−variable components of the Earth’s gravity field to monitor spatiotemporal variations of regional and global total water storage. The spatial resolution of GRACE data has been steadily improving and it currently 0.5° thanks to advances in processing of instrument data and post−processing of gravity field solutions. GRACE data is routinely calculated by various research groups producing monthly solutions based on 30 days of data [25]. The resulting Center for Space Research (CRS) mascon have no stripe errors and capture signal observed by GRACE within the measurement noise level; thus, GRACE RL05 CRS mascon products from the University of Texas Center for Space Research were used to estimate and characterize droughts. The grid data of GRACE total water storage from three GRACE data processing centers can be freely downloaded from the GRACE Tellus website. The monthly total water storage data, in units of equivalent water height [26,27,28] and with a 0.5° × 0.5° equiangular grid, were collected from April 2002 to June 2017. There are 20 months data were missed (approximately 10%; specifically including 2000/06, 2002/07, 2003/06, 2011/01, 2011/06, 2012/05, 2012/10, 2013/03, 2013/08, 2013/09, 2014/02, 2014/07, 2014/12, 2015/06, 2015/10, 2015/11, 2016−04, 2016/09, 2016/10, and 2017/02); all the missing data were interpolated using the mean values before and after the missing month [28,29].
3.1.2. Meteorological Data
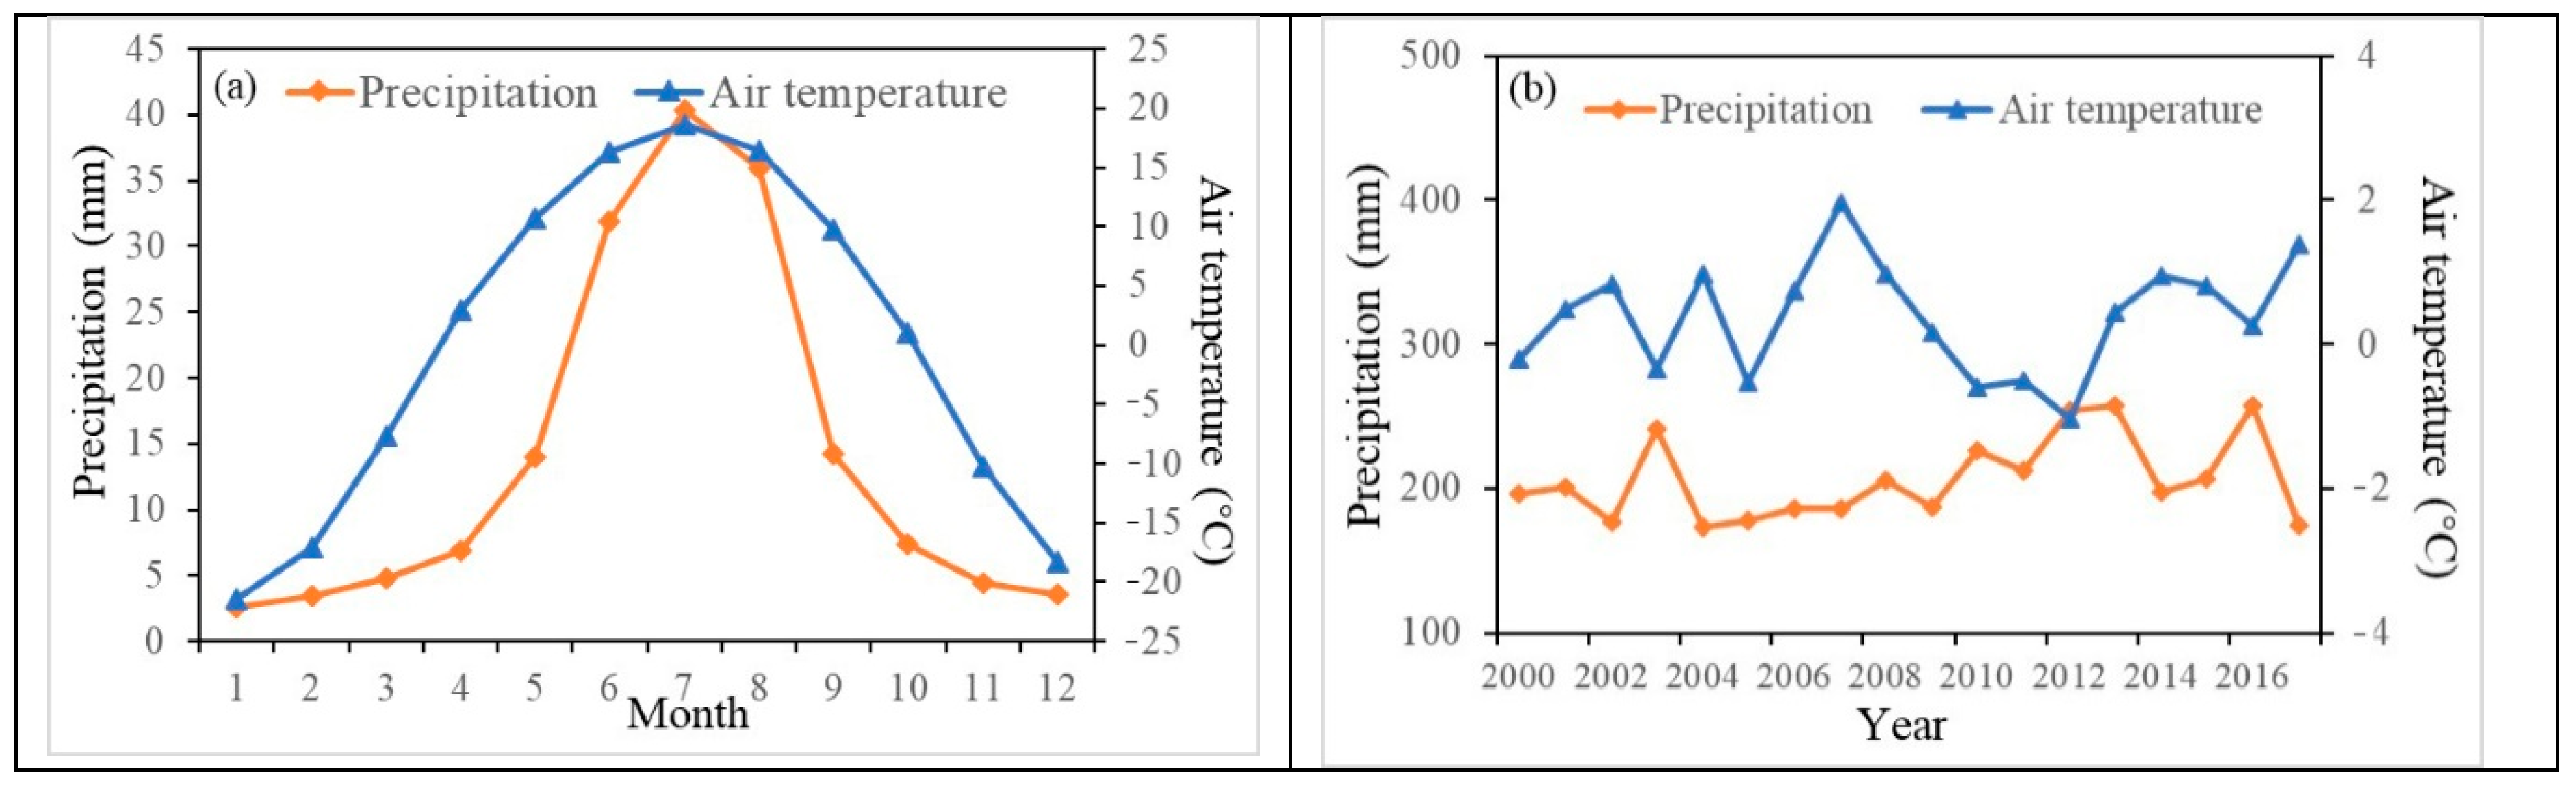
Surface and groundwater resources are scarce in Mongolia, making precipitation an important water source for local agriculture. Air temperature is also a significant factor in influencing variation in water storage. In this study, two meteorological parameters, precipitation and temperature, were used to analyze the water storage variation and drought severity. The U.S. National Climatic Data Center provided daily precipitation and air temperature data for 40 meteorological stations from 2002 and 2017. These sites are mainly located in the north of Mongolia (Figure 1), and thus, observations in the southern region are limited. The small amount of missing climate data is interpolated with linear regression. Average monthly air temperature ranges from −20 °C to 20 °C with two distinctive warm and cold seasons (Figure 2). The average annual air temperature is about 0 °C and the maximum and minimum values occurred in 2007 and 2012, respectively. The annual precipitation was less than 200 mm in 2008 and 2009, and show an increasing trend since 2010 (Figure 2).
3.2. Methods
3.2.1. GRACE−Based Water Storage Deficit Index
The water storage deficit index (WSDI) derived from the monthly deviation of GRACE TWSA is used to identify drought occurrences and to characterize their severity [21]; it is calculated by the following:
where WSDi, j and TWSAi, j are the total water storage deficit and GRACE−inferred TWSA time series for the jth month in year i, respectively; is the long term mean of TWSA for the same month (the jth month in a year), μ and σ are the mean and standard deviation of WSD time series, respectively. A negative WSD represents a deficit in total water storage, and a positive WSD denotes a surplus total water storage. A drought event occurs when a negative WSD lasts for three or more consecutive months [10]. Then WSDI can be calculated by standardizing WSD. The WSDI time series denotes the deviation of an individual month against average condition for that month, and its amount can be regarded as a proxy of drought intensity.
To assess drought severity, a method that can capture the combined impact of water storage deficit and duration was used. Drought events can be expressed by the following formula [10]:
where Se(t) is the severity of drought event t, M(t) is the average deficit of drought event t, that is the mean negative WSD in a drought event, and D(t) is the duration of drought event t, equal to the number of months between the starting and ending months of the drought event.
3.2.2. Standardized Drought Indices
Drought phenomena are usually monitored and characterized using standardized indices. In this study, SPI and SPEI derived from meteorological observations were used to characterize droughts in Mongolia and compared with the characterization obtained using WDSI values extracted from grid data of WDSI according to the location of meteorological stations.
The SPI is a precipitation−based drought index developed by McKee et al. (1993) [30] to define and monitor drought events at multiple time scales (1−, 3−, 6−, 12−, and 24−month). SPI can be calculated from long−term precipitation data with a probability density function and then transformed using an inverse normal function to monitor droughts with respect to different water resources [31]. However, disadvantages of SPI stem from the fact that only precipitation is considered without other meteorological factors and requires at least 20–30 years of monthly precipitation data, and 50–60 years, or more, is ideal.
SPEI, developed from SPI, is calculated using precipitation and potential evapotranspiration (Equation 4 and 5). Precipitation was obtained from meteorological stations and potential evapotranspiration was estimated using the Thornthwaite method (Equation 6 and 7) that only relied on air temperature and latitude to calculate the monthly average day length.
The SPEI can easily be calculated as the standardized values of F(x) over different time scales including, 3−, 6−, 9−, 12− and 24 months [32].
where P is the probability of exceeding a threshold and can be calculated following Vicente et al. (2010) [33]. If P ≤ 0.5, P = 1 − F(x); if P > 0.5, P is replaced by 1 − P. The other parameters, C0, C1, C2, d1, d2 and d3 are constants, taking the values of 2.515517, 0.802853, 0.010328, 1.432788, 0.189269, and 0.001308, respectively.
where PET is potential evapotranspiration, Ta is the mean monthly air temperature, I is the heat index, and a is a coefficient calculated by the heat index. The obtained PET values are corrected later according to the real of month and the theoretical sunshine hours for the latitude.
The SPI, SPEI and WSDI can detect both dry and wet conditions, with negative values representing drought and positive values for wet conditions. Magnitudes of the three drought indices were used to assess the severity of droughts. The category of drought severity in accordance with McKee et al. (1993) [30] and Palmer (1965) [34] is shown in Table 1. Observation were used to calculate SPI and SPEI; therefore, the drought analysis results were regarded as reliable. Thus, SPI and SPEI were used to compare and assess WSDI values.
3.2.3. Mann−Kendall Test
The Mann−Kendall (MK) test is a nonparametric method to identify the trend change within variables. The method has been used in studies to understand trends in time series of climate variables such as long−term precipitation, runoff, and evapotranspiration, as long as the time series values are independent of each other. The magnitude of the trend can be estimated by Thiel−Sen’s slope. Positive values mean an increasing trend, and negative values mean a decreasing trend. This method is used to examine the trends of TWSA and drought indices to analyze water storage change and drought severity.
4. Results and Discussion
4.1. Variation of TWSA and WSD
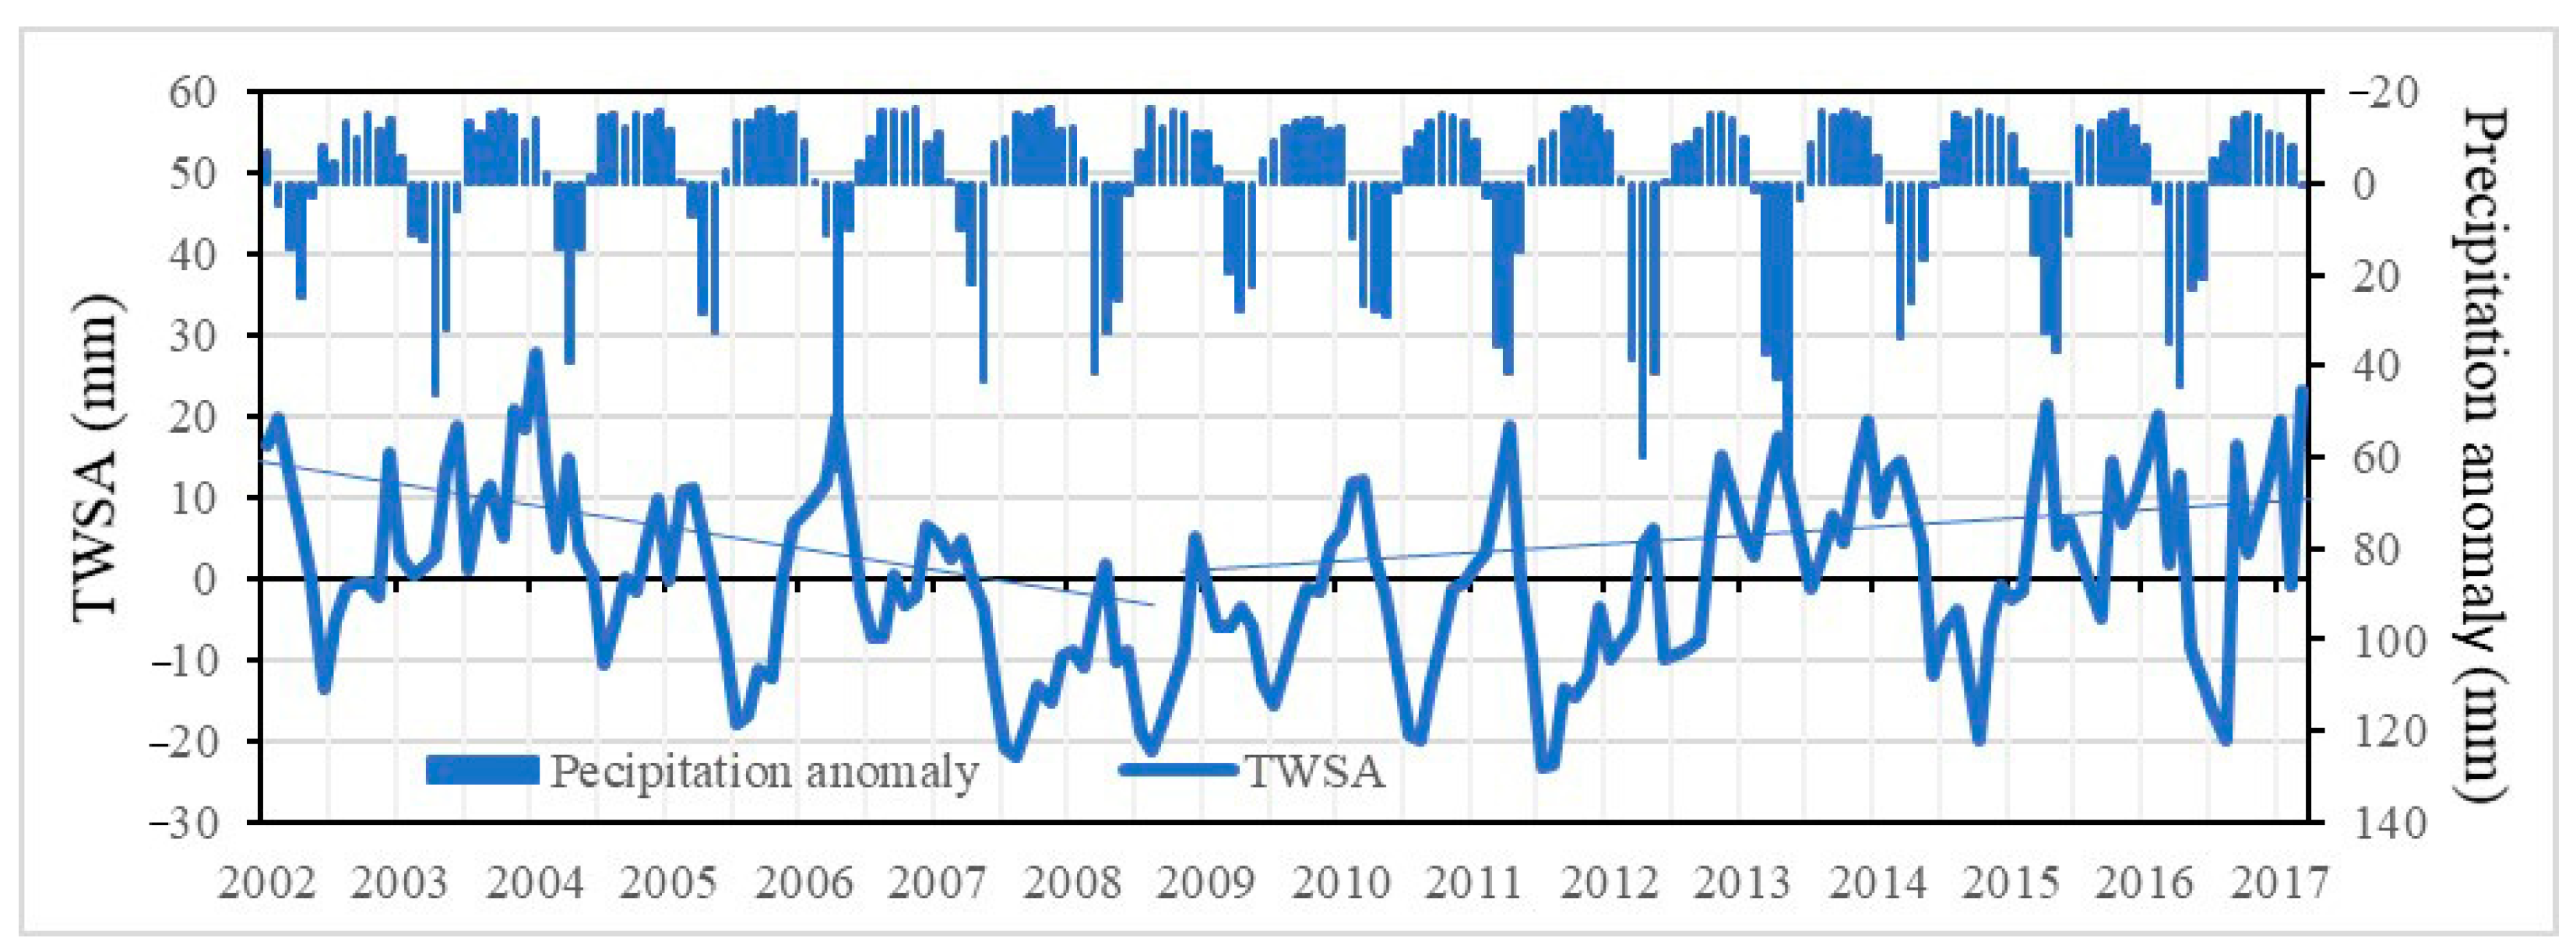
Generally, the change of precipitation influences TWSA. However, considering TWSA as anomaly values, it is compared with precipitation anomaly that was defined as the difference between the mean monthly precipitation and observed monthly precipitation. Figure 3 shows the time variations of TWSA and precipitation anomaly from 2002 to 2017. It shows that the majority of precipitation occurs in summers of 2002 to 2017. The annual fluctuation of precipitation anomaly is in agreement with the peaks in the TWSA time series in the study period. TWSA has a slightly decreasing trend from 2002 to 2008 and an increasing trend from 2009 to 2017. The trend of TWSA demonstrates that Mongolia became drier from 2002 to 2008, while Mongolia became wetter from 2009 to 2017. The change is similar to the combined effect of climatic factors. The precipitation trend from 2002 to 2008 has no apparent increasing trend, but air temperature has an upward trend. From 2009 to 2017, precipitation has an increasing trend, but average air temperature declined and has since increased. Thus, the change in TWSA might be attributed to climate change [35,36,37]. The mean values of TWSA are 0.28 mm close to 0.0, indicating water resources from 2002 to 2017 have no apparent loss.
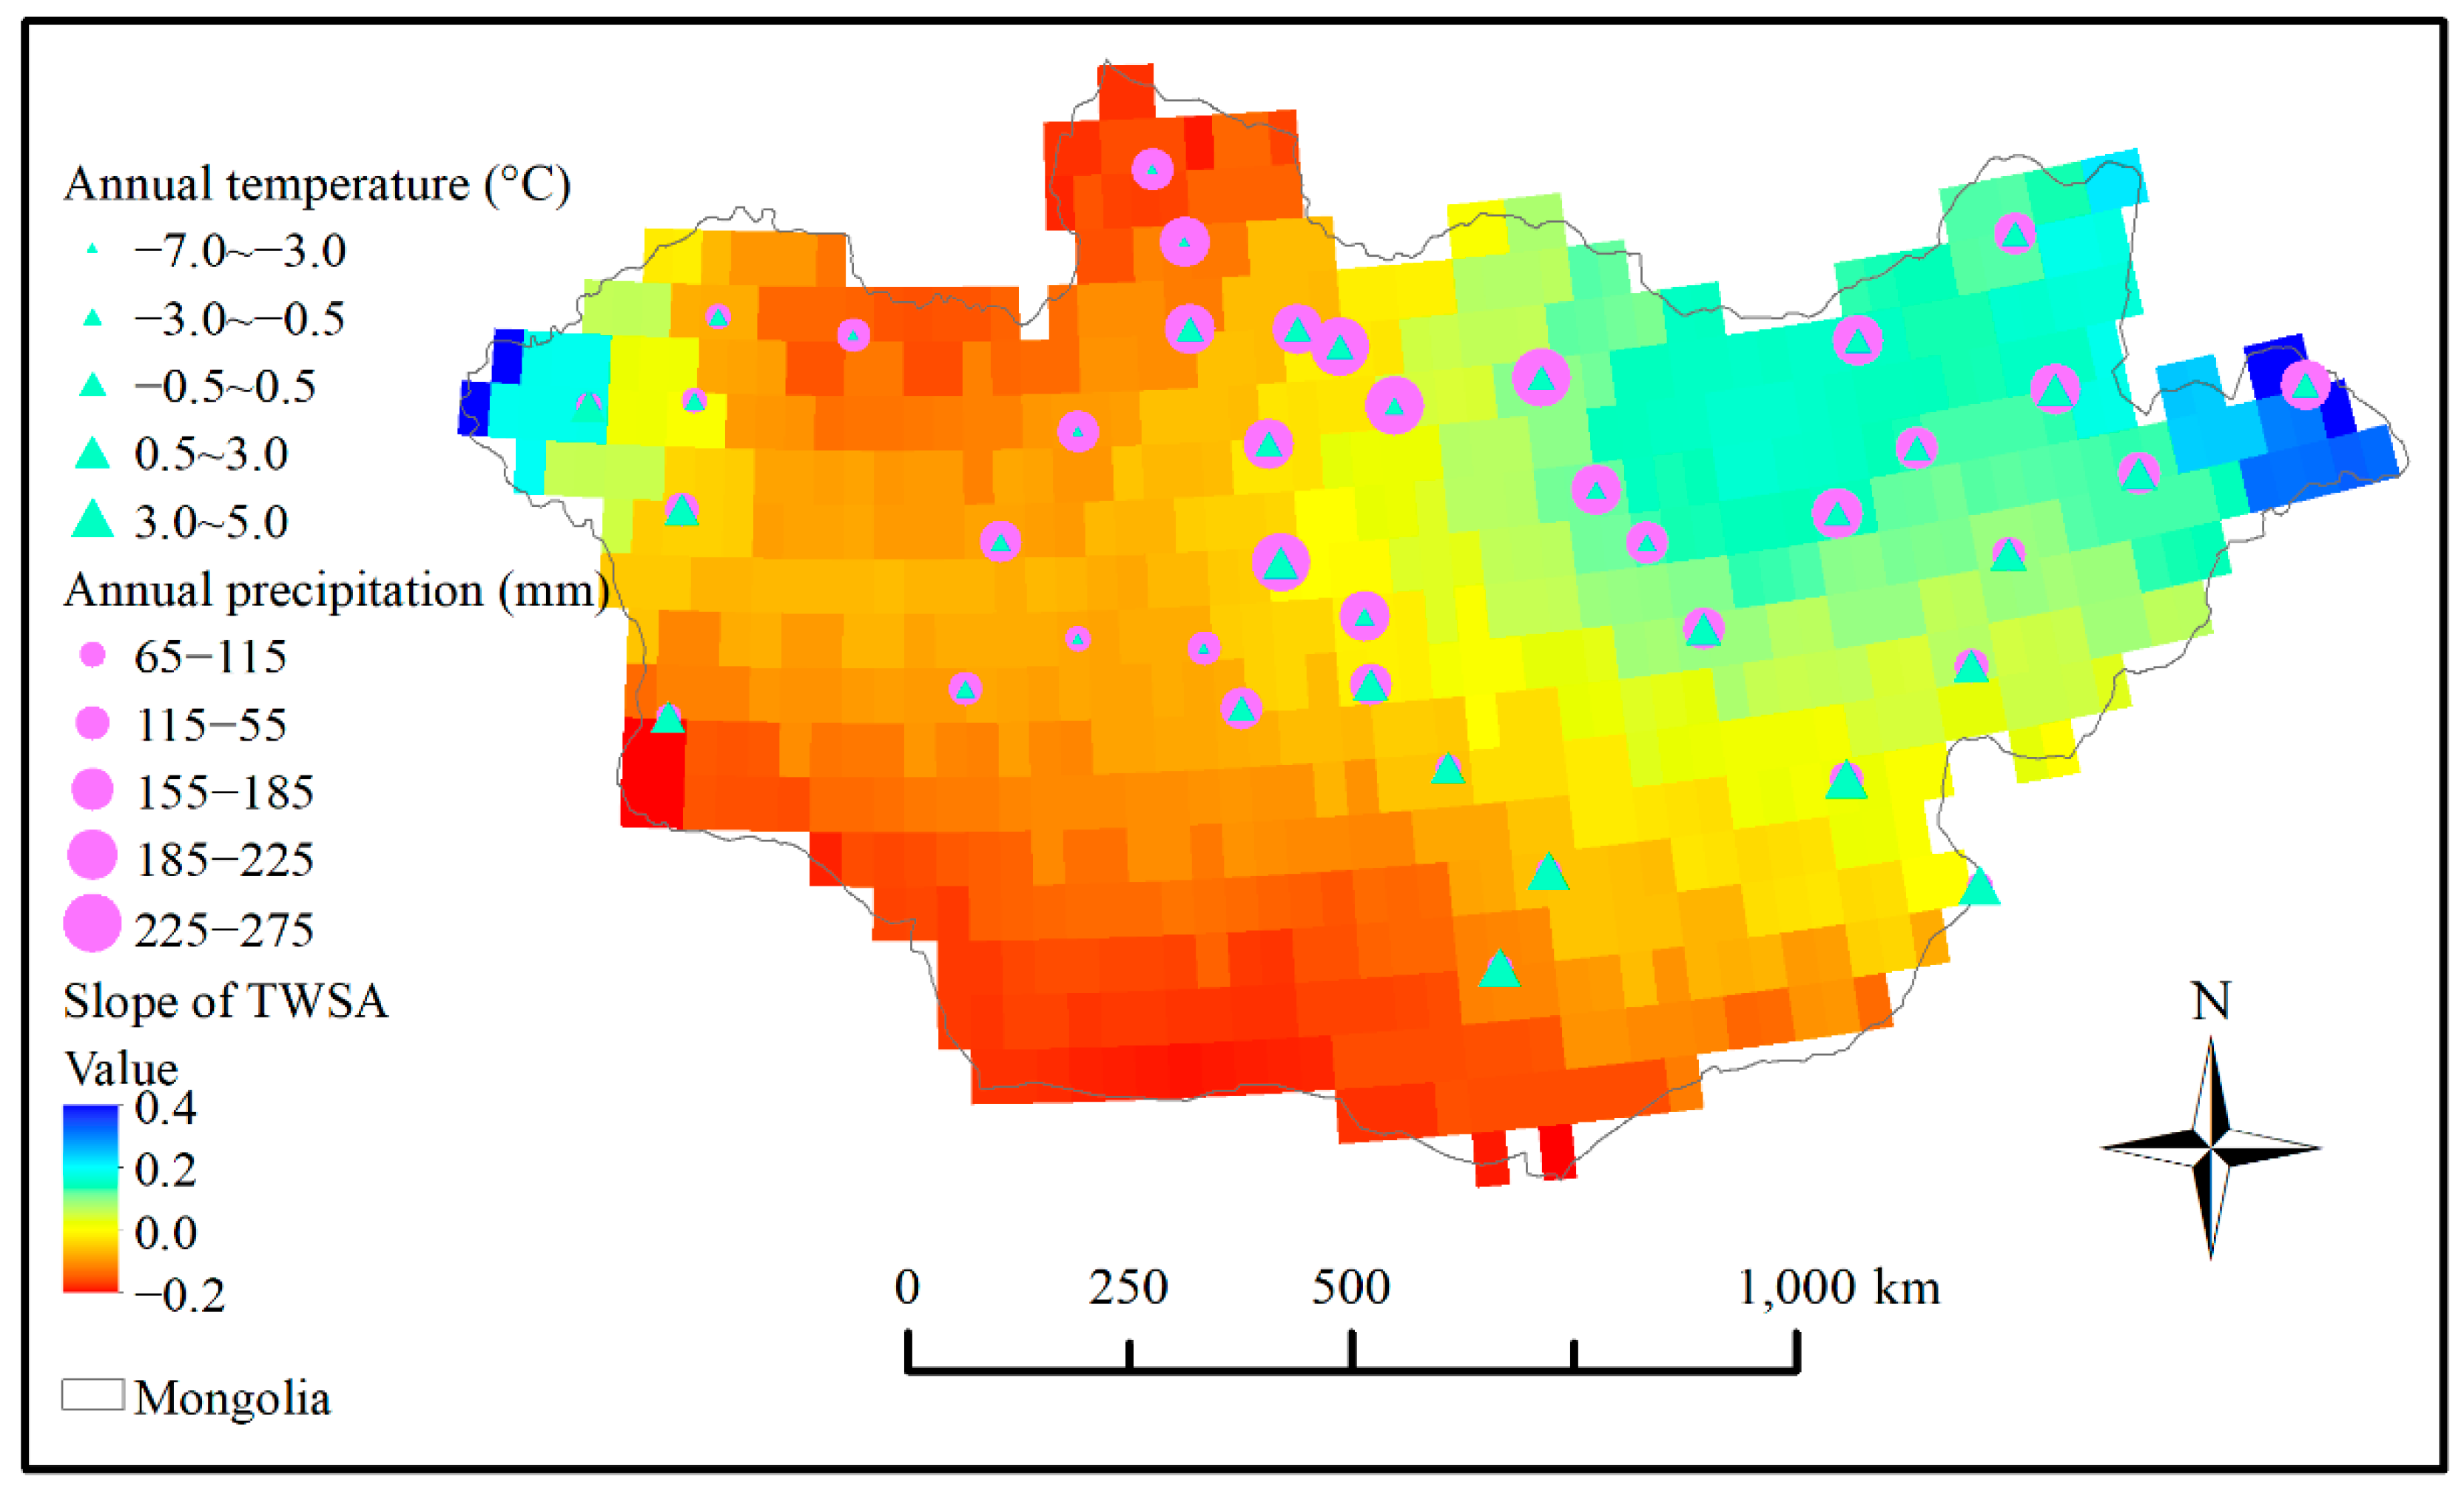
The MK test is used to detect the spatial pattern of TWSA trend and the slope of the change (Figure 4). The most eastern and western areas of Mongolia show increasing trends in mean slope values from 0 to 0.4, and the southern and northern part showed declining trends with the mean slope values from 0 to −0.2. The declining trend is more severe in the southern region because of sparse vegetation, limited precipitation, and high temperature, indicating that Mongolia may face a threat of the decreasing water supply.
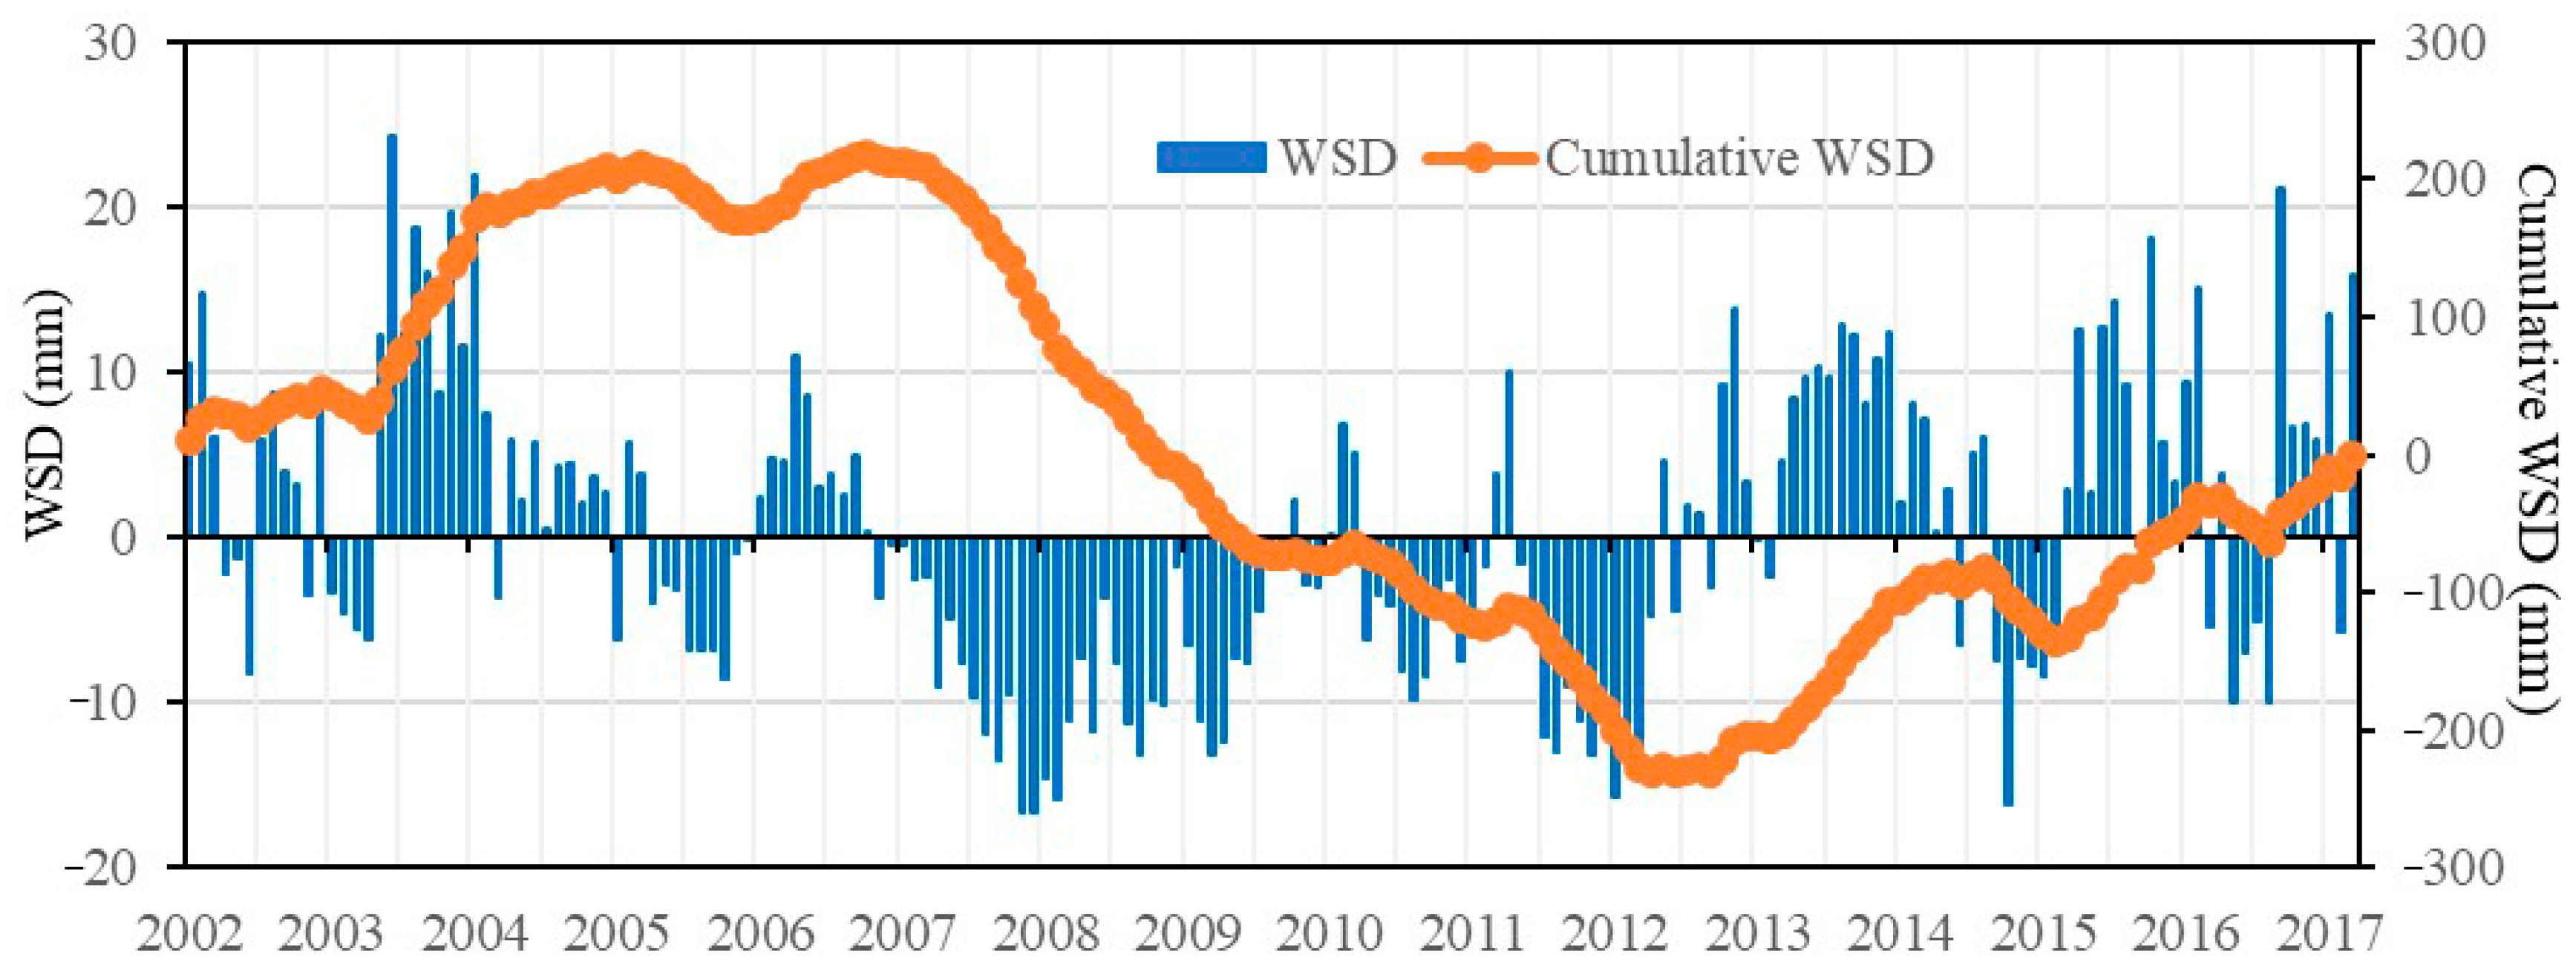
The WSD is calculated from GRACE−inferred TWSA using equation (1). The WSD has two apparent turning points that coincide with the change of TWSA (Figure 5). The change of WSD can be classified into three stages, the first stage occurring from 2002 to 2006, the second stage from 2007 to 2012, and the third stage from 2013 to 2017. Significant water storage deficits occurred in the second stage, while water storage surpluses were predominant in the first and the third stages. Cumulative WSD from 2002 to 2010 represents a continuous surplus in the change in water storage and a continuous deficit from 2011 to 2017. A declining trend denotes a lasting water storage deficit and an upward trend represents a water storage surplus. The upward trends were found from 2002 to 2006 and 2012 to 2017; whereas, the declining trend was found from 2007 to 2011, indicating Mongolia likely experienced long−term drought.
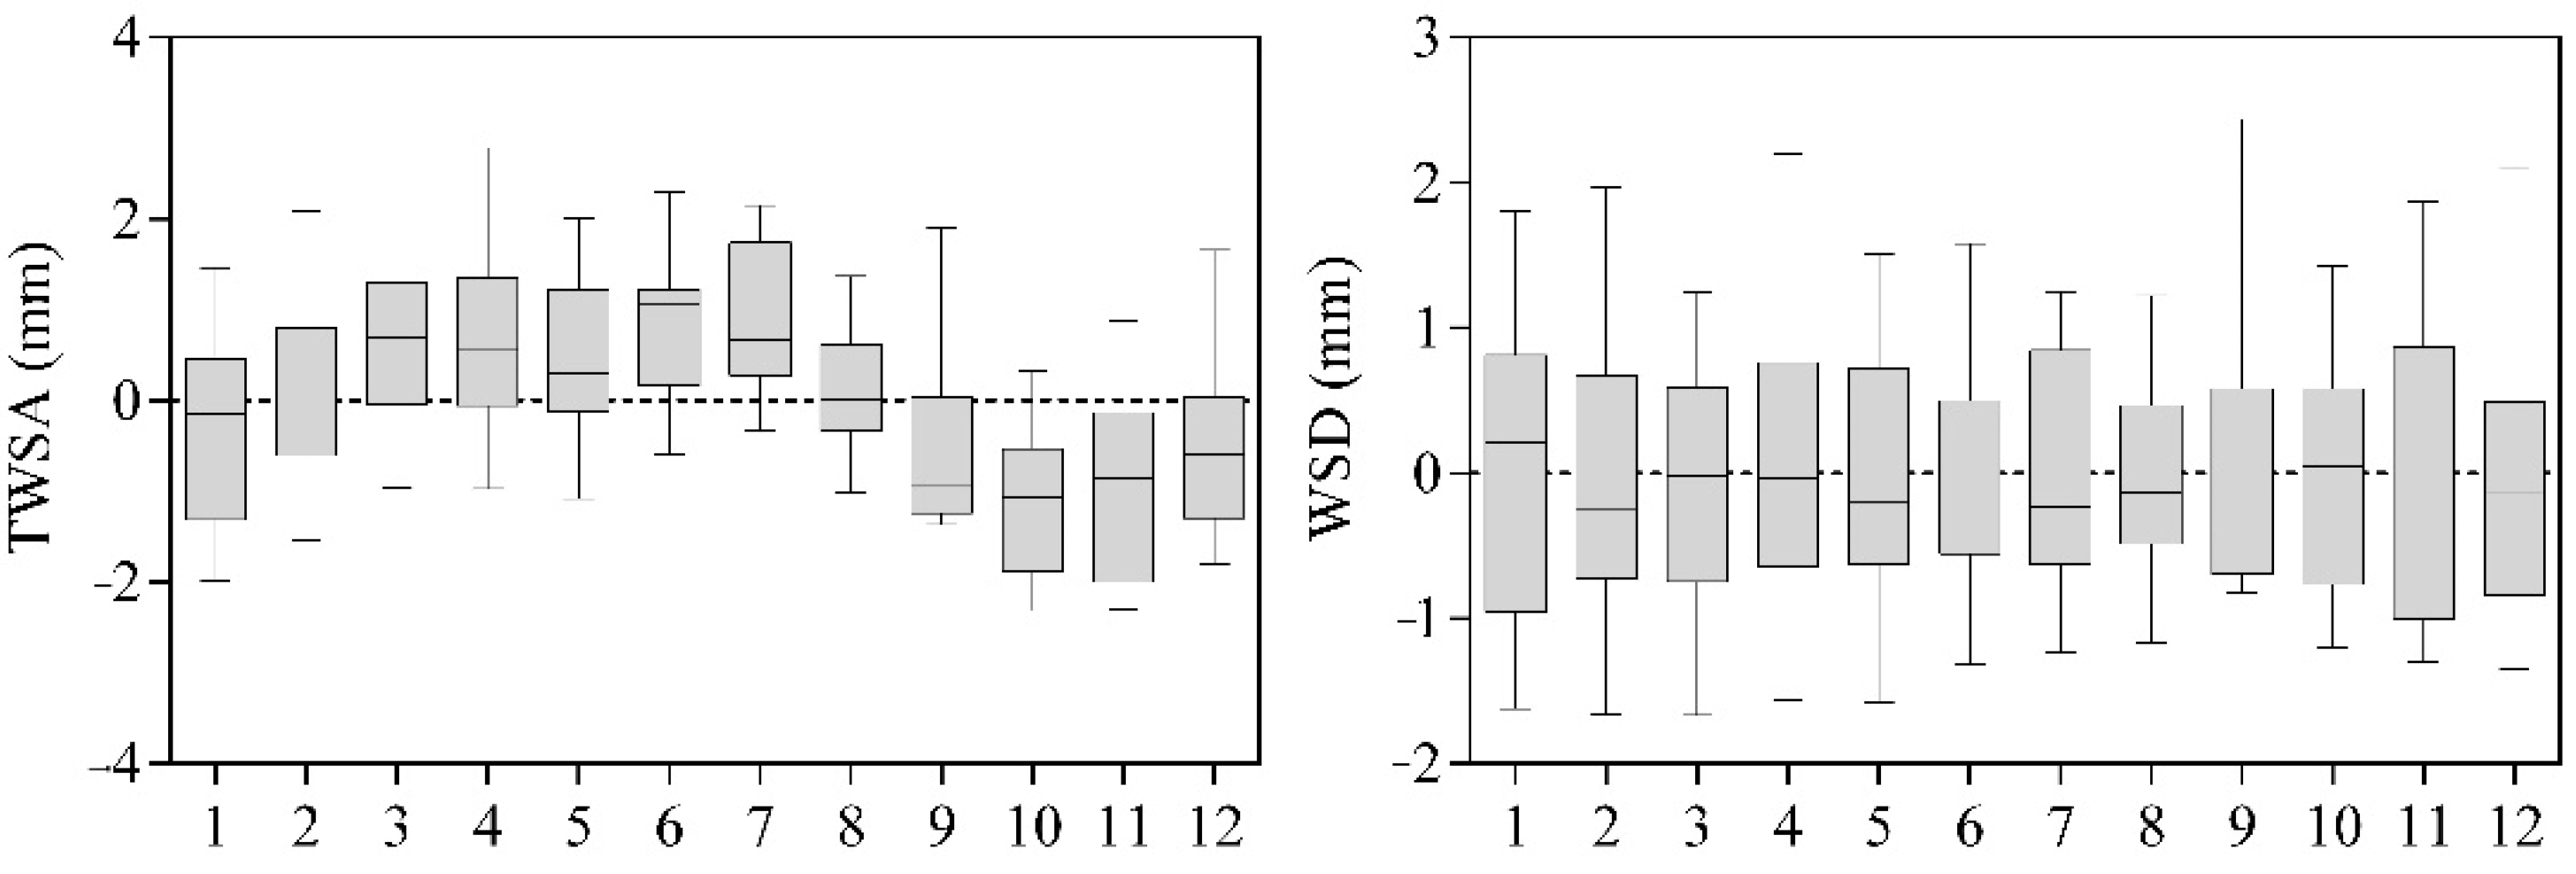
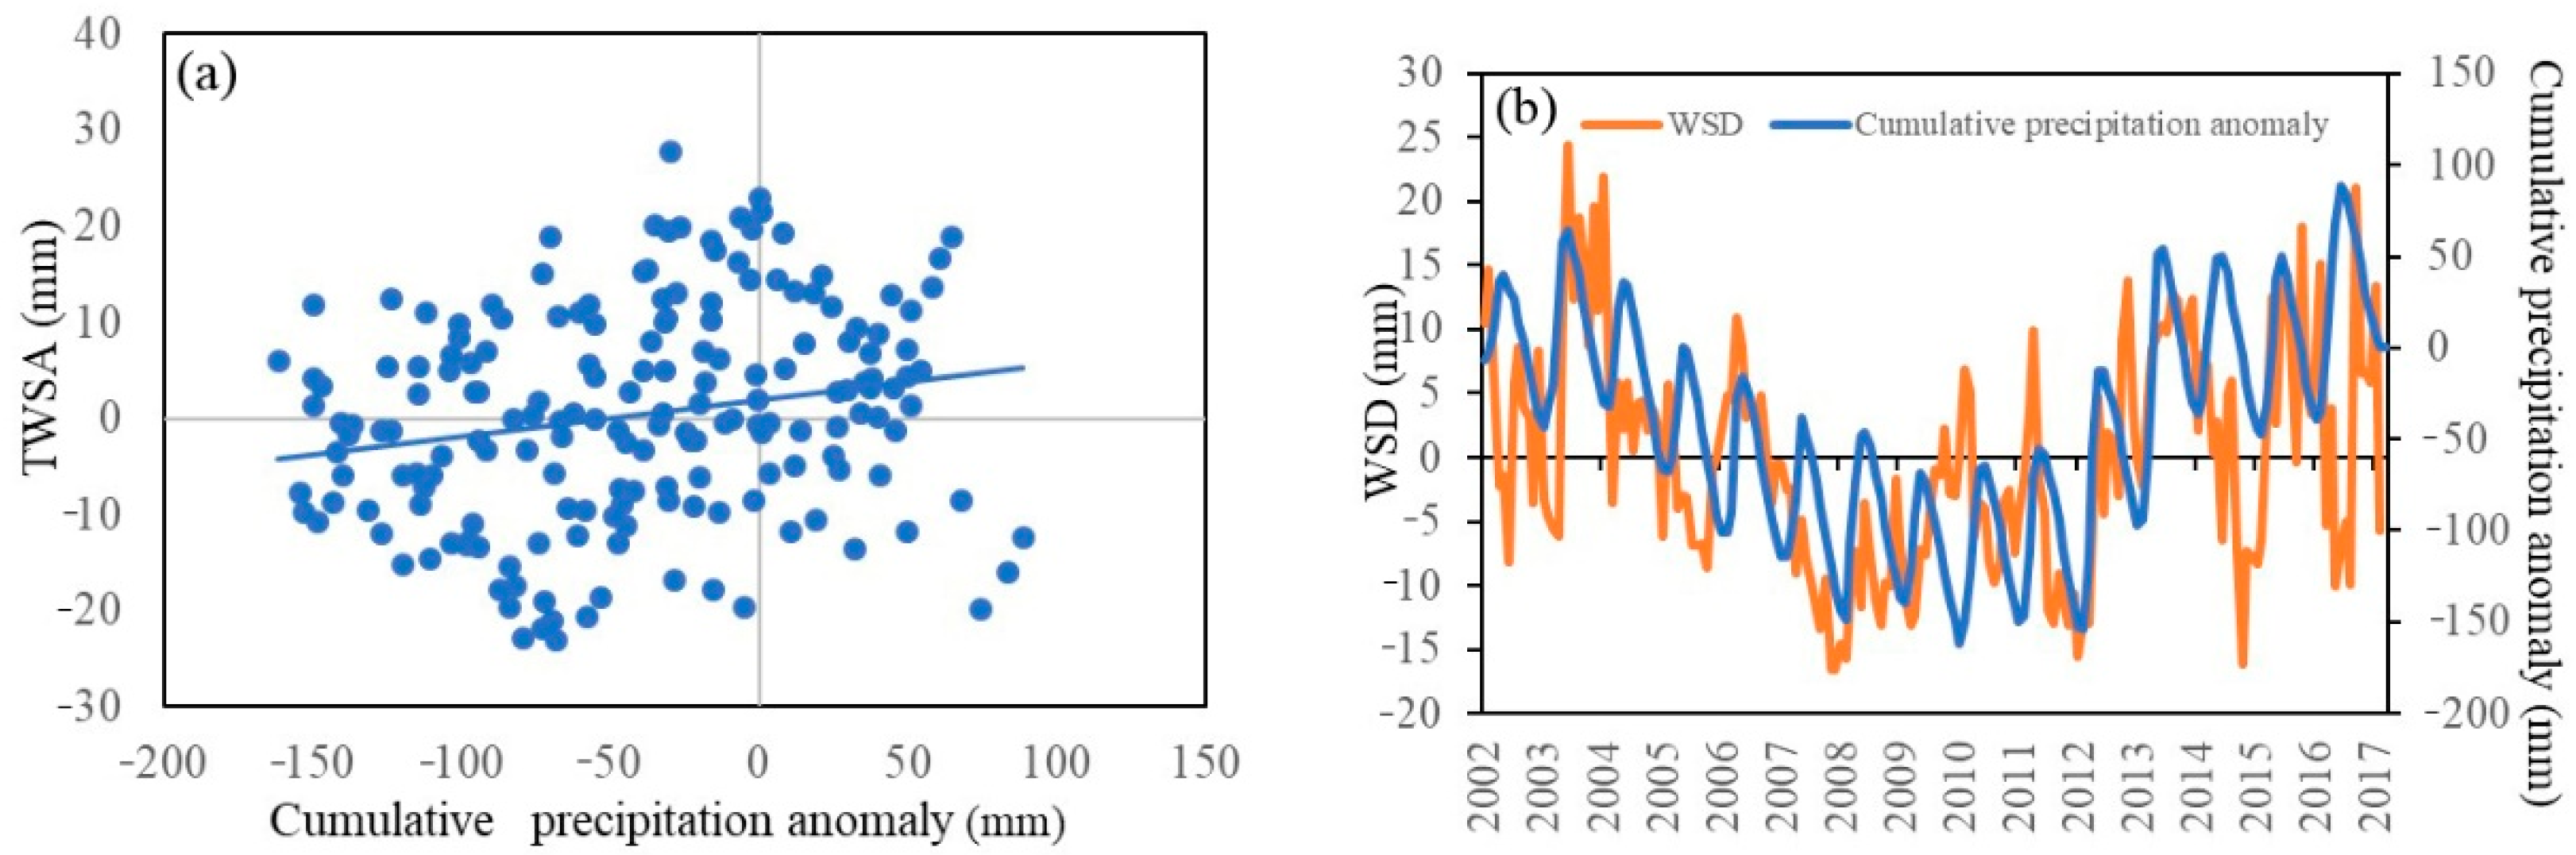
Mean monthly TWSA gradually increases from January to July, then decreases from July to October, and shows a slight increase from October to December for Mongolia (Figure 6). Although there were variations in TWSA between months, the change values were small in Mongolia at the national scale (Figure 6). The inter−annual variations in WSD had no apparent seasonal change, although precipitation fluctuates significantly at a monthly scale (Figure 2). However, comparing the TWSA and cumulative precipitation anomaly (Figure 7a), WSD and cumulative precipitation anomaly (Figure 7b), the correlation coefficients were 0.2 and 0.5, respectively. It indicates that precipitation is important but not the sole factor for impacting TWSA. They show a turning point in 2008 in the series of WSD and cumulative precipitation anomaly. Precipitation, as an important water source, influences the change in water storage. Thus, these results indicate that the water storage deficit might be affected not only by climate variability but also human activities.
4.2. Comparison of WSDI with Other Drought Indices
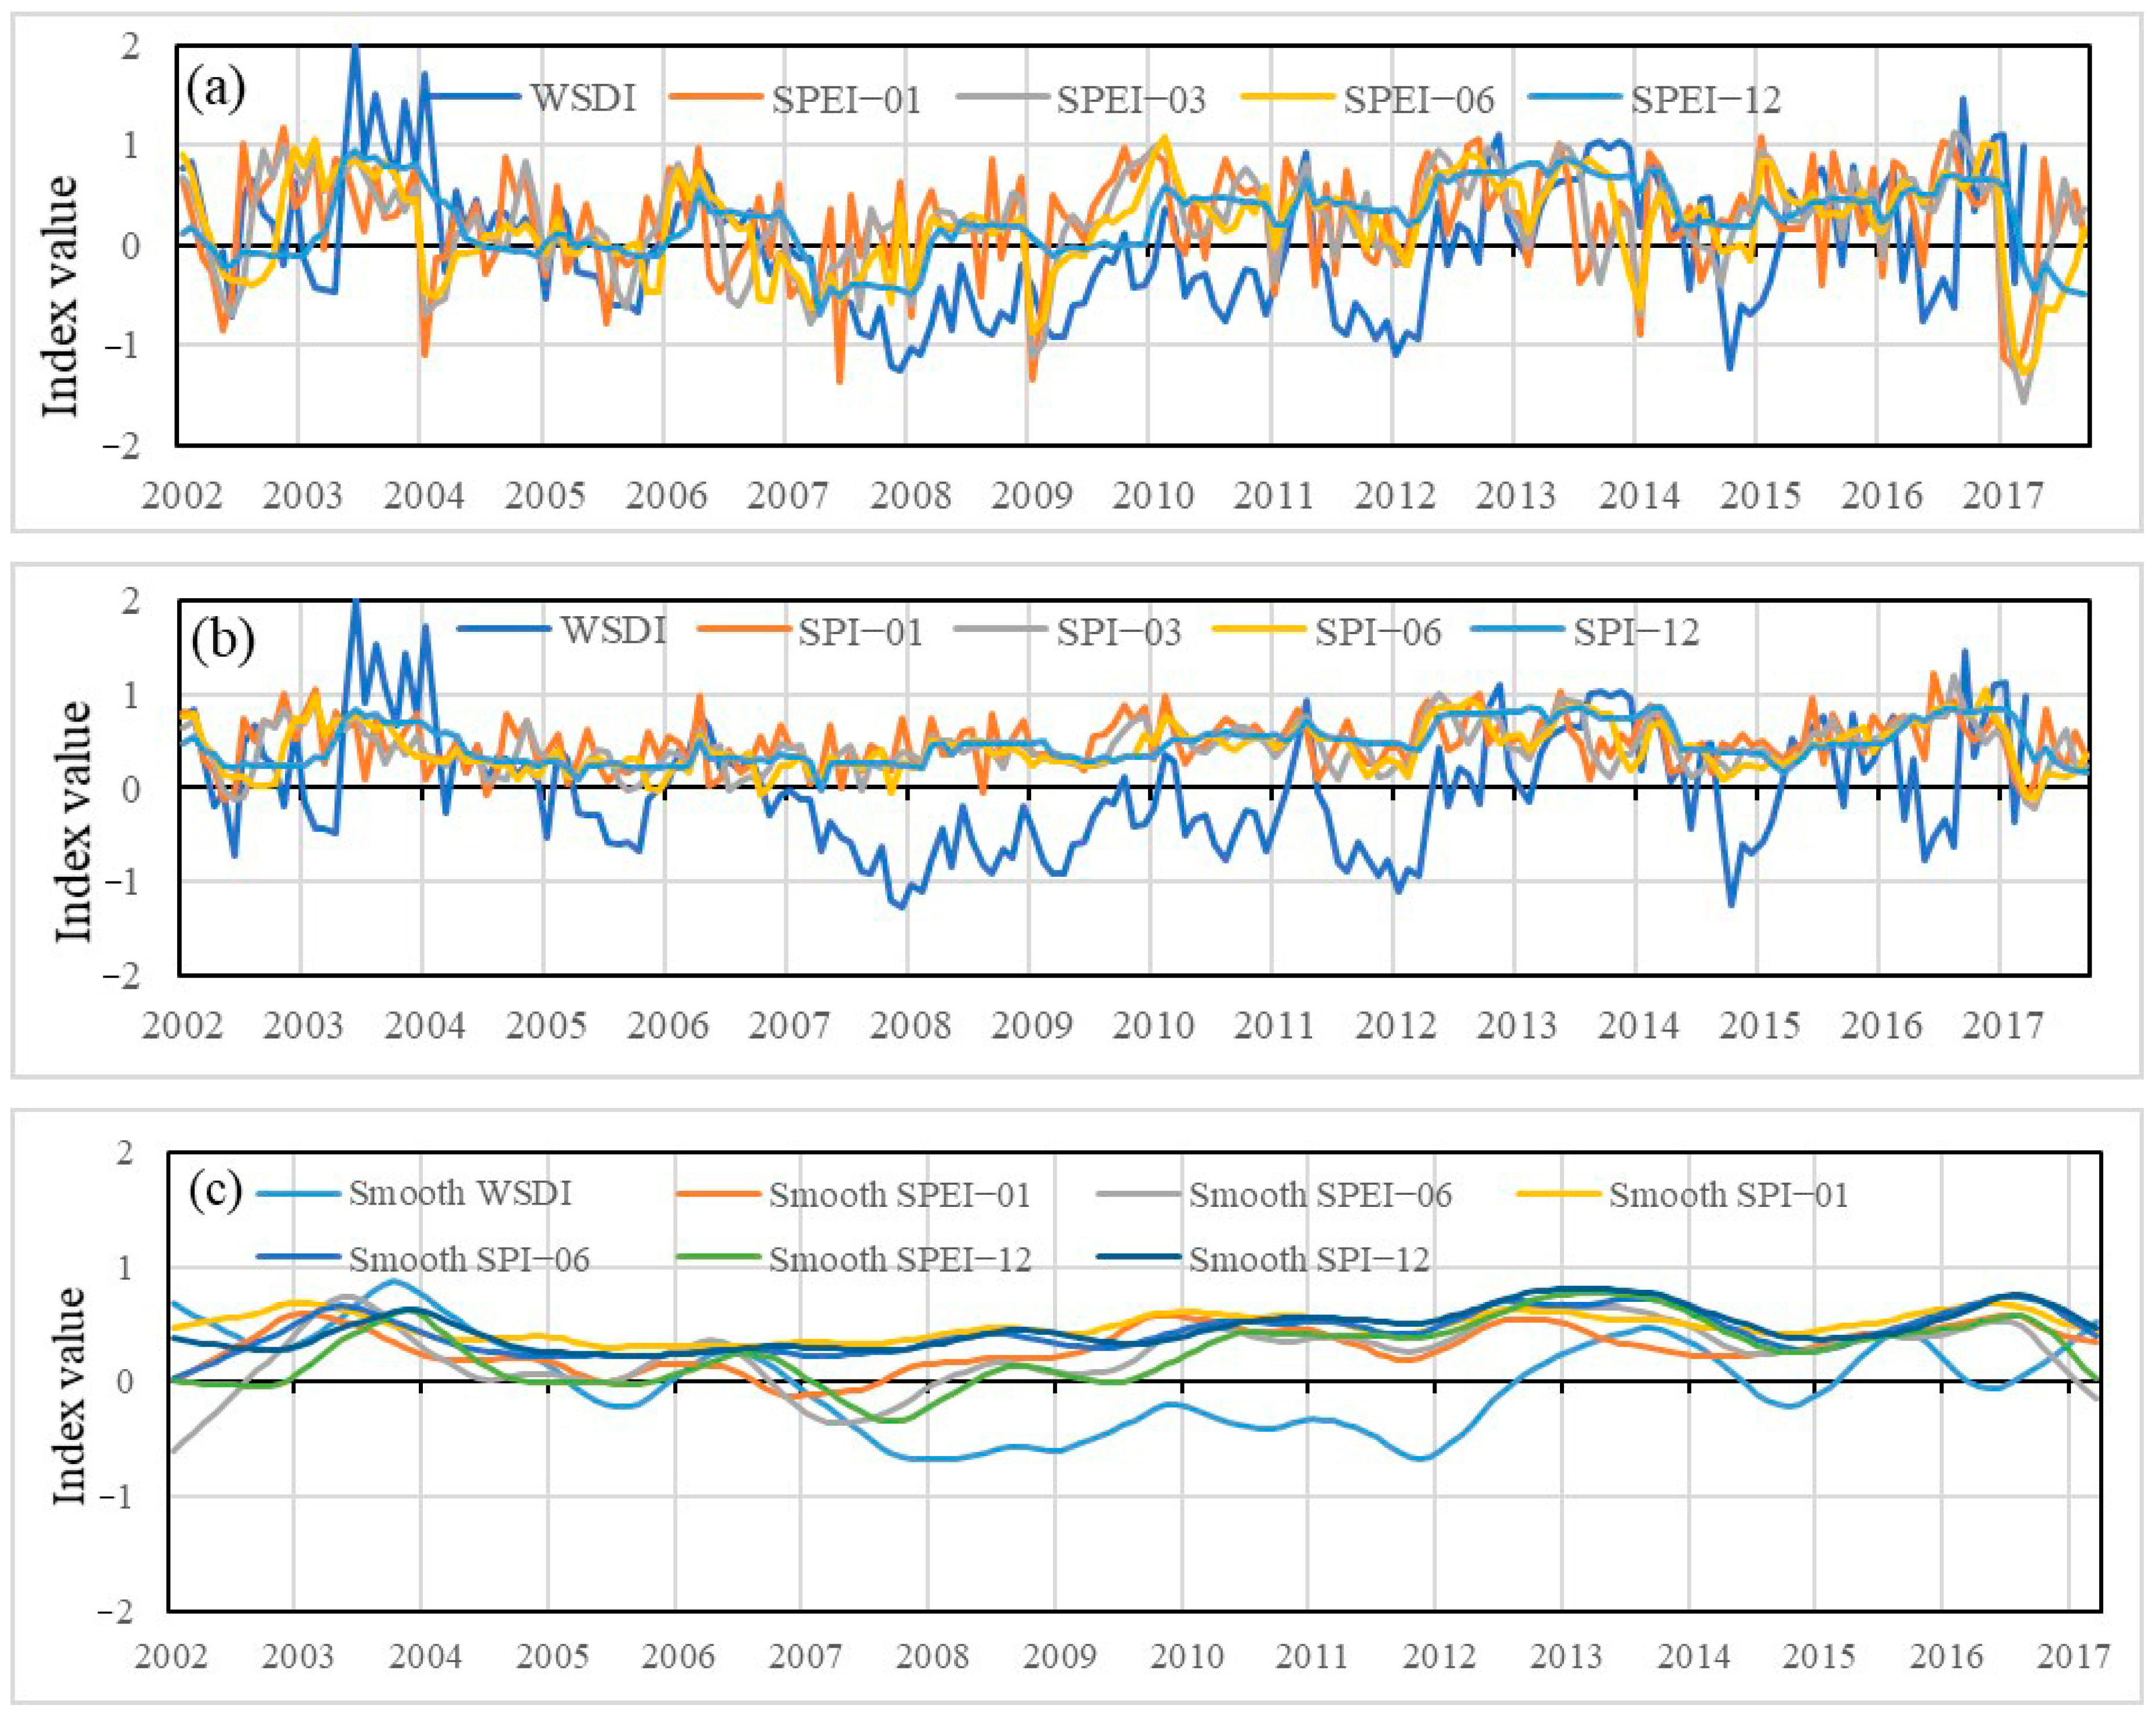
WSDI is a better indication of drought intensity to quantify the magnitude of drought severity. Figure 8 shows the comparison between WSDI and two widely used drought indices, SPI and SPEI, in different time scales in Mongolia from 2002 to 2017. The trend of WSDI is in agreement with the trend of SPEI−06 and SPI−06. Thus, the 6−month time scale can effectively show the terrestrial water storage deficit change from the GRACE satellite.
The smoothed WSDI, SPEI, and SPI time series also display consistent characteristics with respect to the time of peaks and troughs (Figure 8). In addition, the differences among drought indices are the result of different input variables and methodologies used to calculated. Another source of error may arise from differing spatial scales of the gridded WSDI and point scale of SPEI and SPI. The SPEI−06 was higher than SPI−06 and WSDI in 2006–2007, but lower than that in 2007–2008. The minimum of WSDI occurs in 2008, which is consistent with the previous results of Section 4.1. The drought indices show large troughs in 2007–2008, 2008–2009, and 2011–2012 when the TWSA values have the lowest values (Figure 3).
The values of WSDI are smaller than SPEI and SPI after 2008, likely a result of precipitation showing an apparent increasing trend and turning point since 2008. SPEI and SPI may present a positive spatial bias, a result of the lack of observations in southern Mongolia where less precipitation occurs.
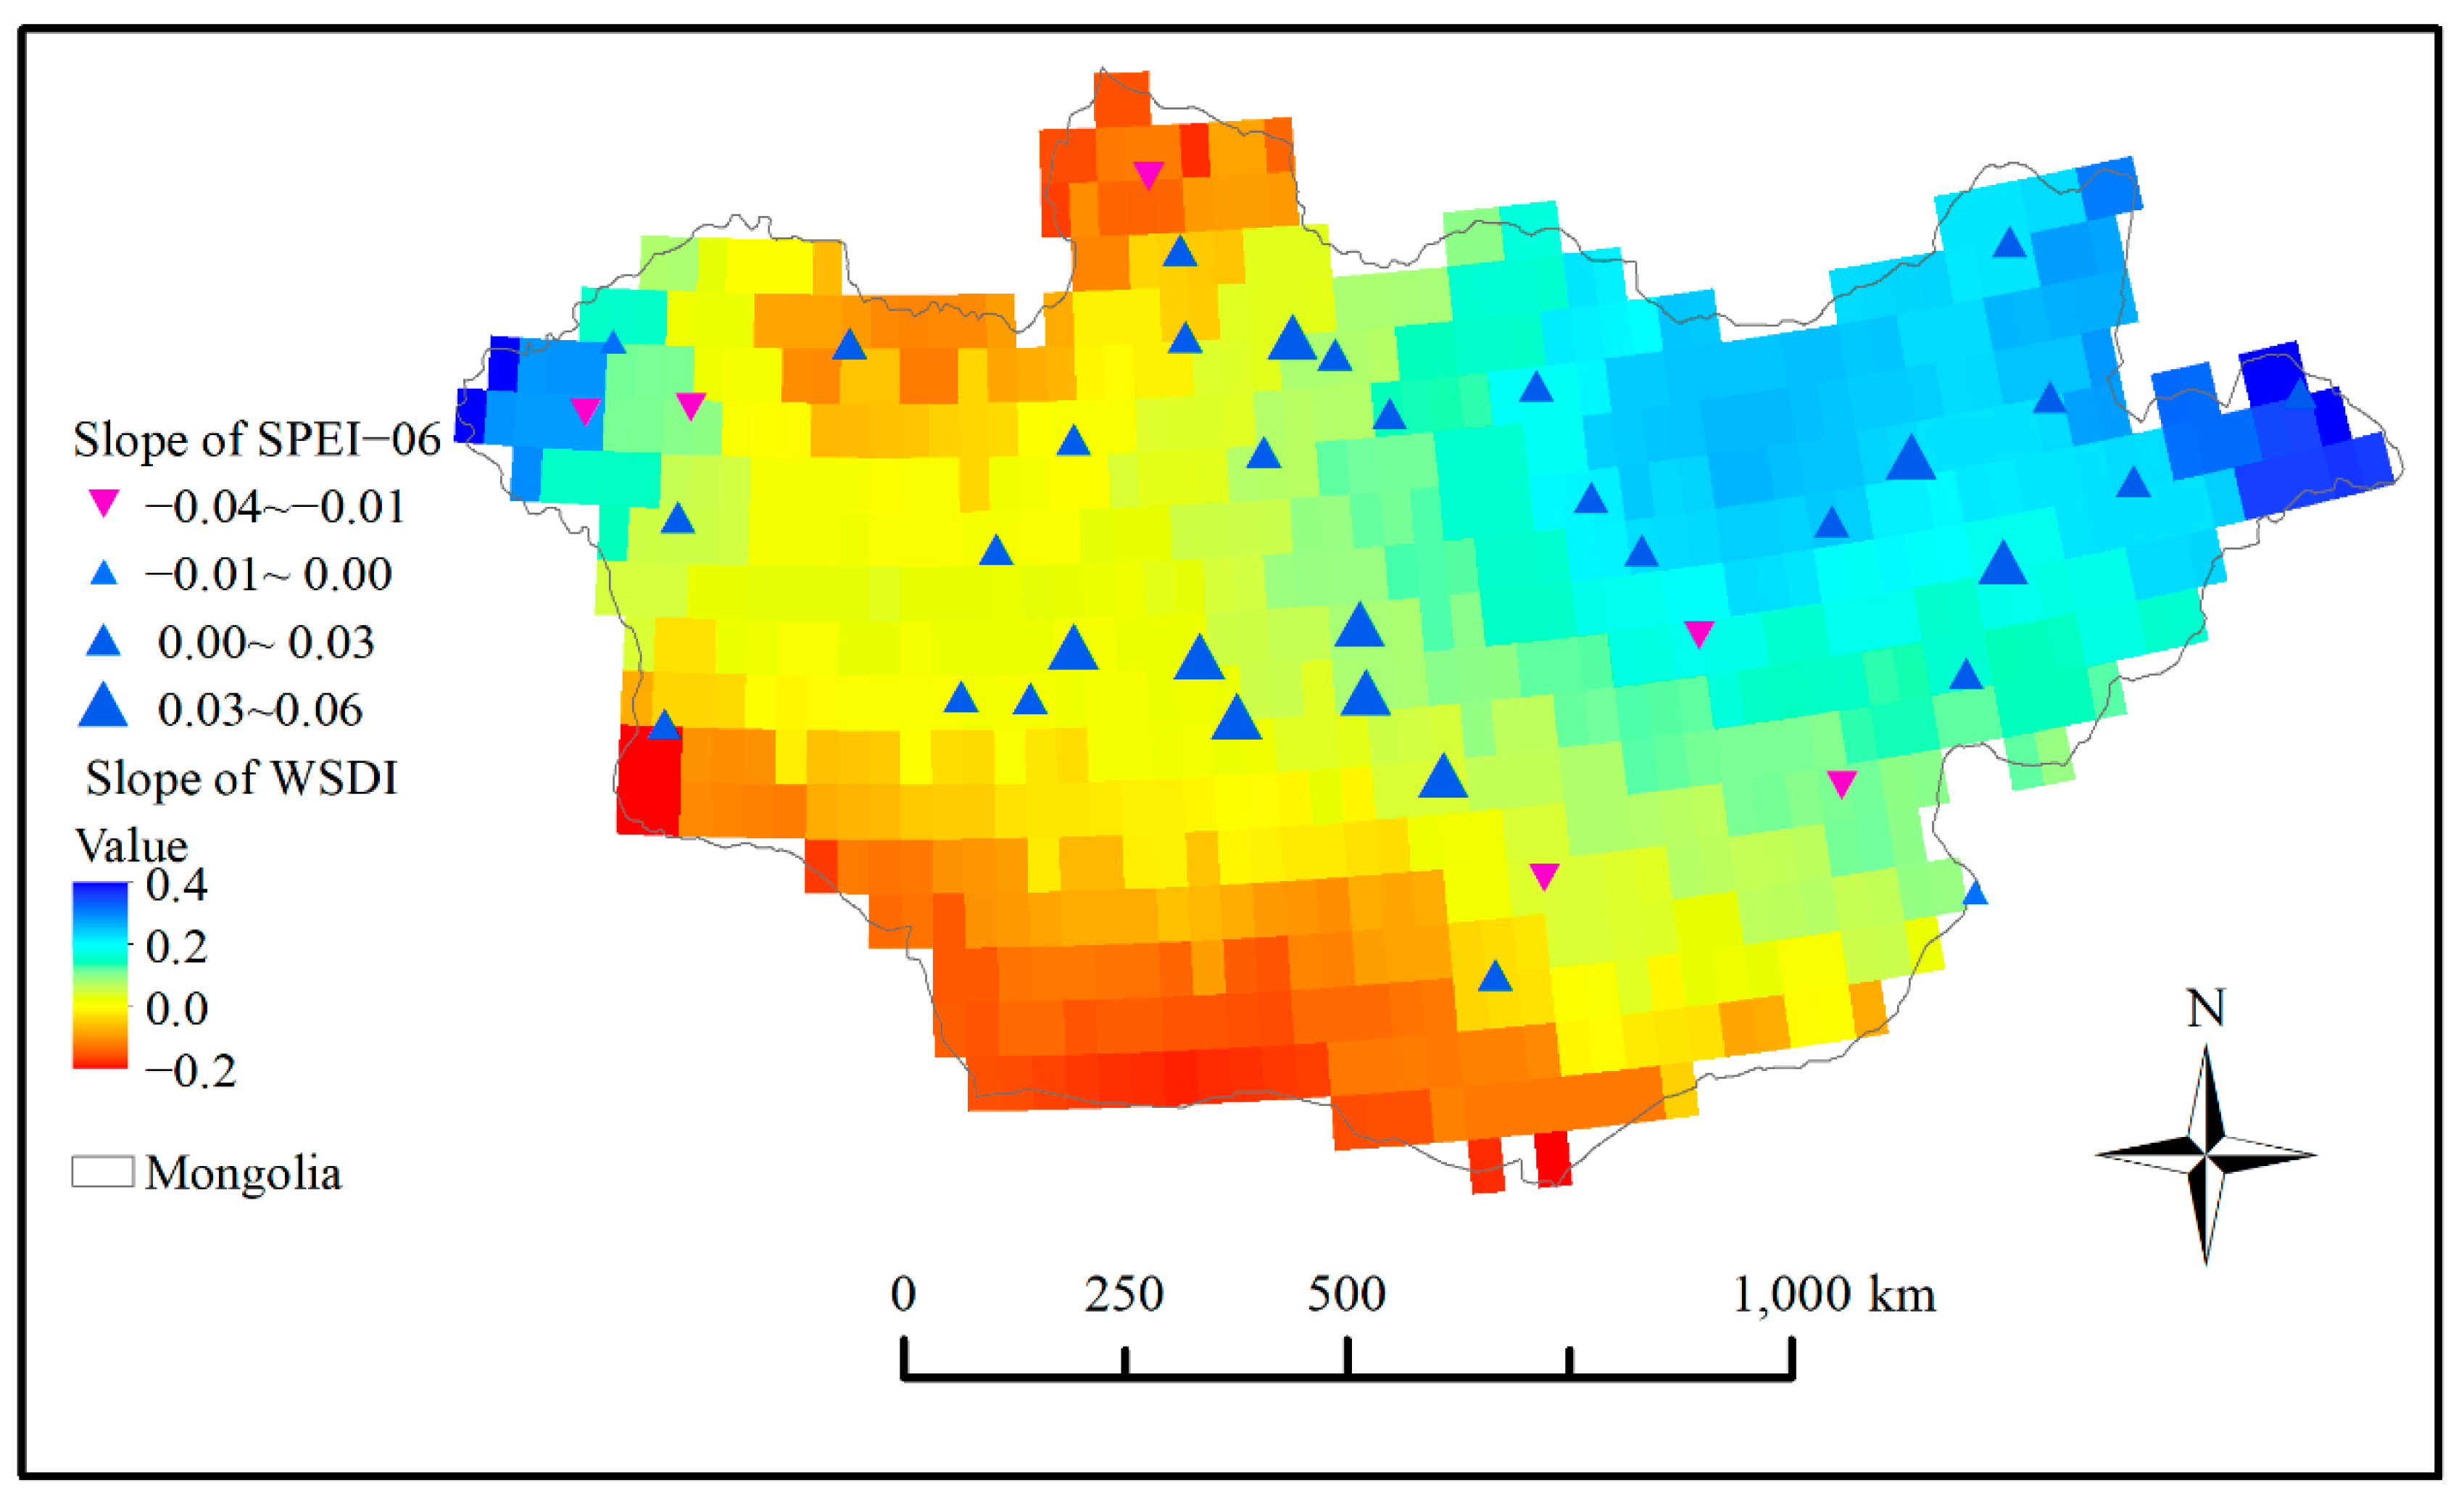
Additionally, the MK test was used to detect the trend change of WSDI and SPEI−06 and the slopes of the change are shown in Figure 9. Most trends of WSDI and SPEI−06 in Mongolia show an increasing trend, which indicates the drought condition in Mongolia improved. However, the northernmost and southernmost parts still experience severe drought trends. The distribution of the slope values of SPEI−06 are in agreement with slope values of WSDI.
4.3. Drought Events Detected by Drought Indices
By definition, a drought event occurs when negative WSD lasts for three or more consecutive months; eight drought events were confirmed based on WSD during the 2002–2017 period. The mean and peak values of WSD, Se from eight drought periods and the WSDI of Mongolia are shown in Table 2. In addition, the values and drought severity categories based on SPEI, SPI and WSDI of stations also are displayed in Table 3.
Statistics results of WSD values showed that the period from 2007/02 to 2009/12 was the most extensive drought period, followed by the period from 2011/08 to 2012/07, with durations of 38 and 12 months, respectively. The drought duration from 2011/08–2012/07 was shorter than that from 2007/02–2009/12, but the maximum average water deficit occurred with a value of −10.0 mm. In addition, the maximum peak deficits recorded were in 2008/03 and 2015/01 with −16.6 mm and −16.2 mm respectively, the drought duration only six months from 2014/12 to 2015/05.
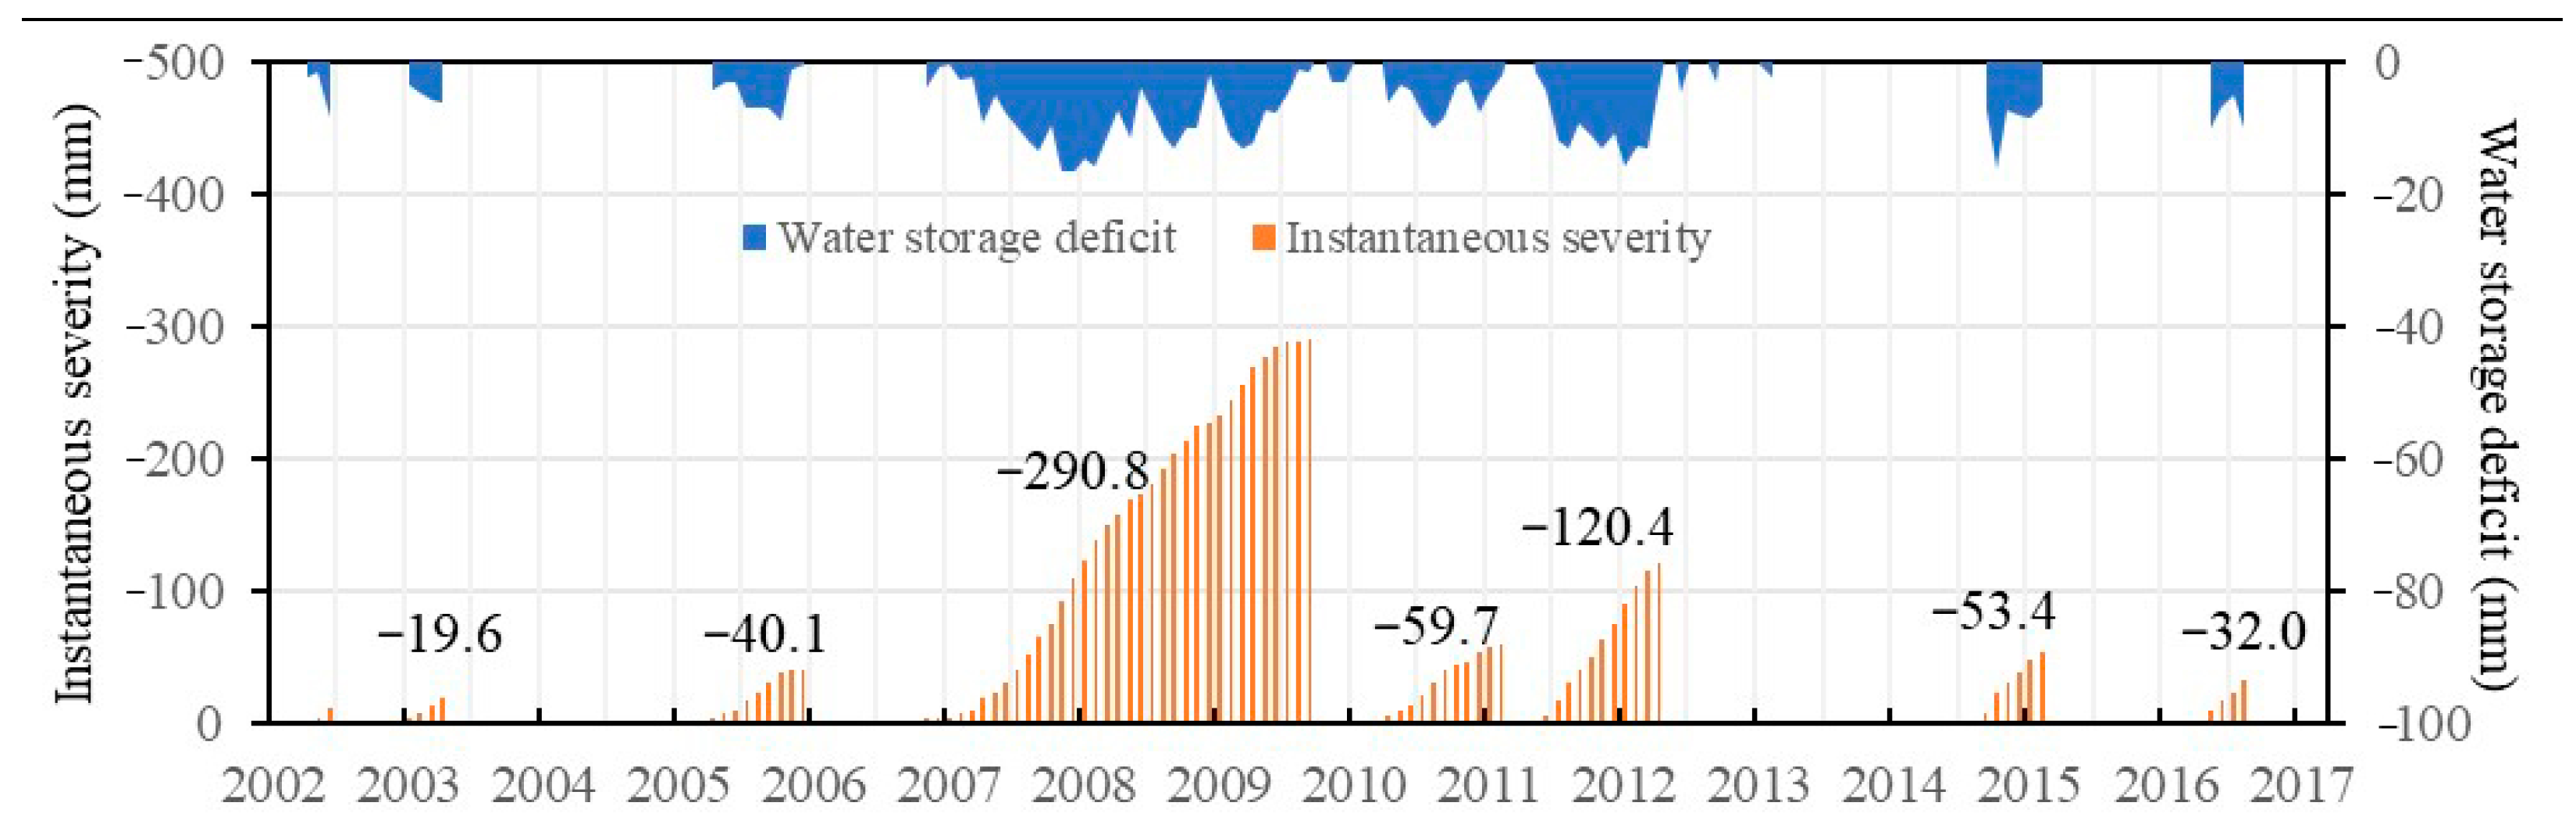
Figure 10 shows the overall drought severity in Mongolia using negative WSD values and a cumulative negative WSD from 2002 to 2017 to analyze and better quantify the intensity of each drought event. The values of drought severity (Se) calculated by equation 3 are shown in Figure 10. Large values of WSDs with longer durations are representative of more severe droughts. Among the eight drought events observed during the study period, the drought event during 2007/02–2009/12 was the most extensive deficit period, lasting 38 months. This event displays the highest total water deficit of −290.8 mm. The drought period from 2011/08–2012/07 lasted for 12 months with a severity of −120.4 mm. The two periods were rated as long−term drought events. Additionally, the other periods were regarded as minor droughts or temporary episodes of dryness in Mongolia, lasting for several months.
Drought severity levels are used to characterize drought intensity. Three indices with the highest values were classified according to Table 1. The different drought severity levels are displayed in Table 2. Differences in drought levels existed among these drought indices for the same drought events. For example, the period from 2007/02–2009/12 is classified as moderate drought (D2) according to SPEI, where it is classified as mild drought (D1) according to SPI and WSDI. The period from 2014/12–2015/05 is classified as moderate drought (D2) according to WSDI, but as mild drought (D1) according to SPI and SPEI. The same classification occurs in the periods from 2005/07–2006/03 and 2011/08–2012/07 based SPEI, SPI, and WSDI. Overall, it is clear that the drought severity levels of eight drought events identified by these drought indices express differences.
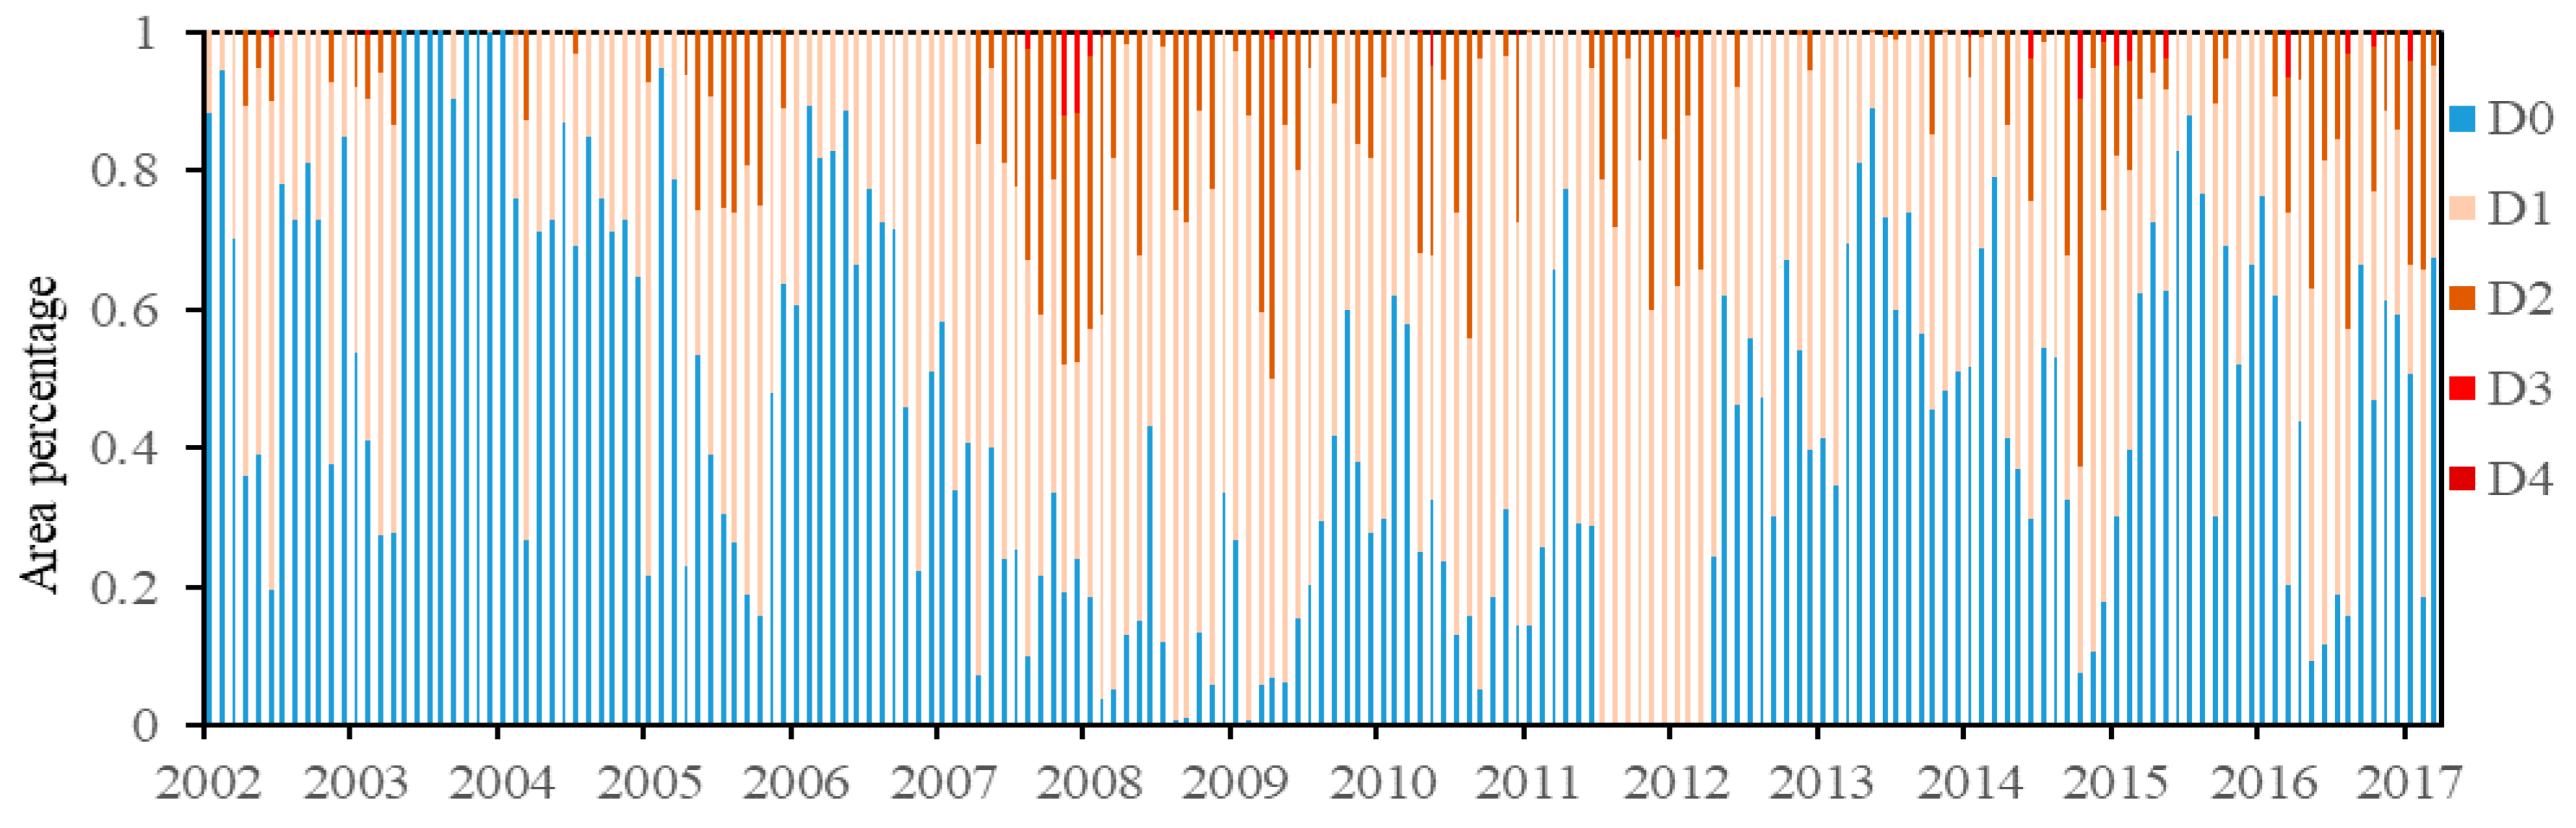
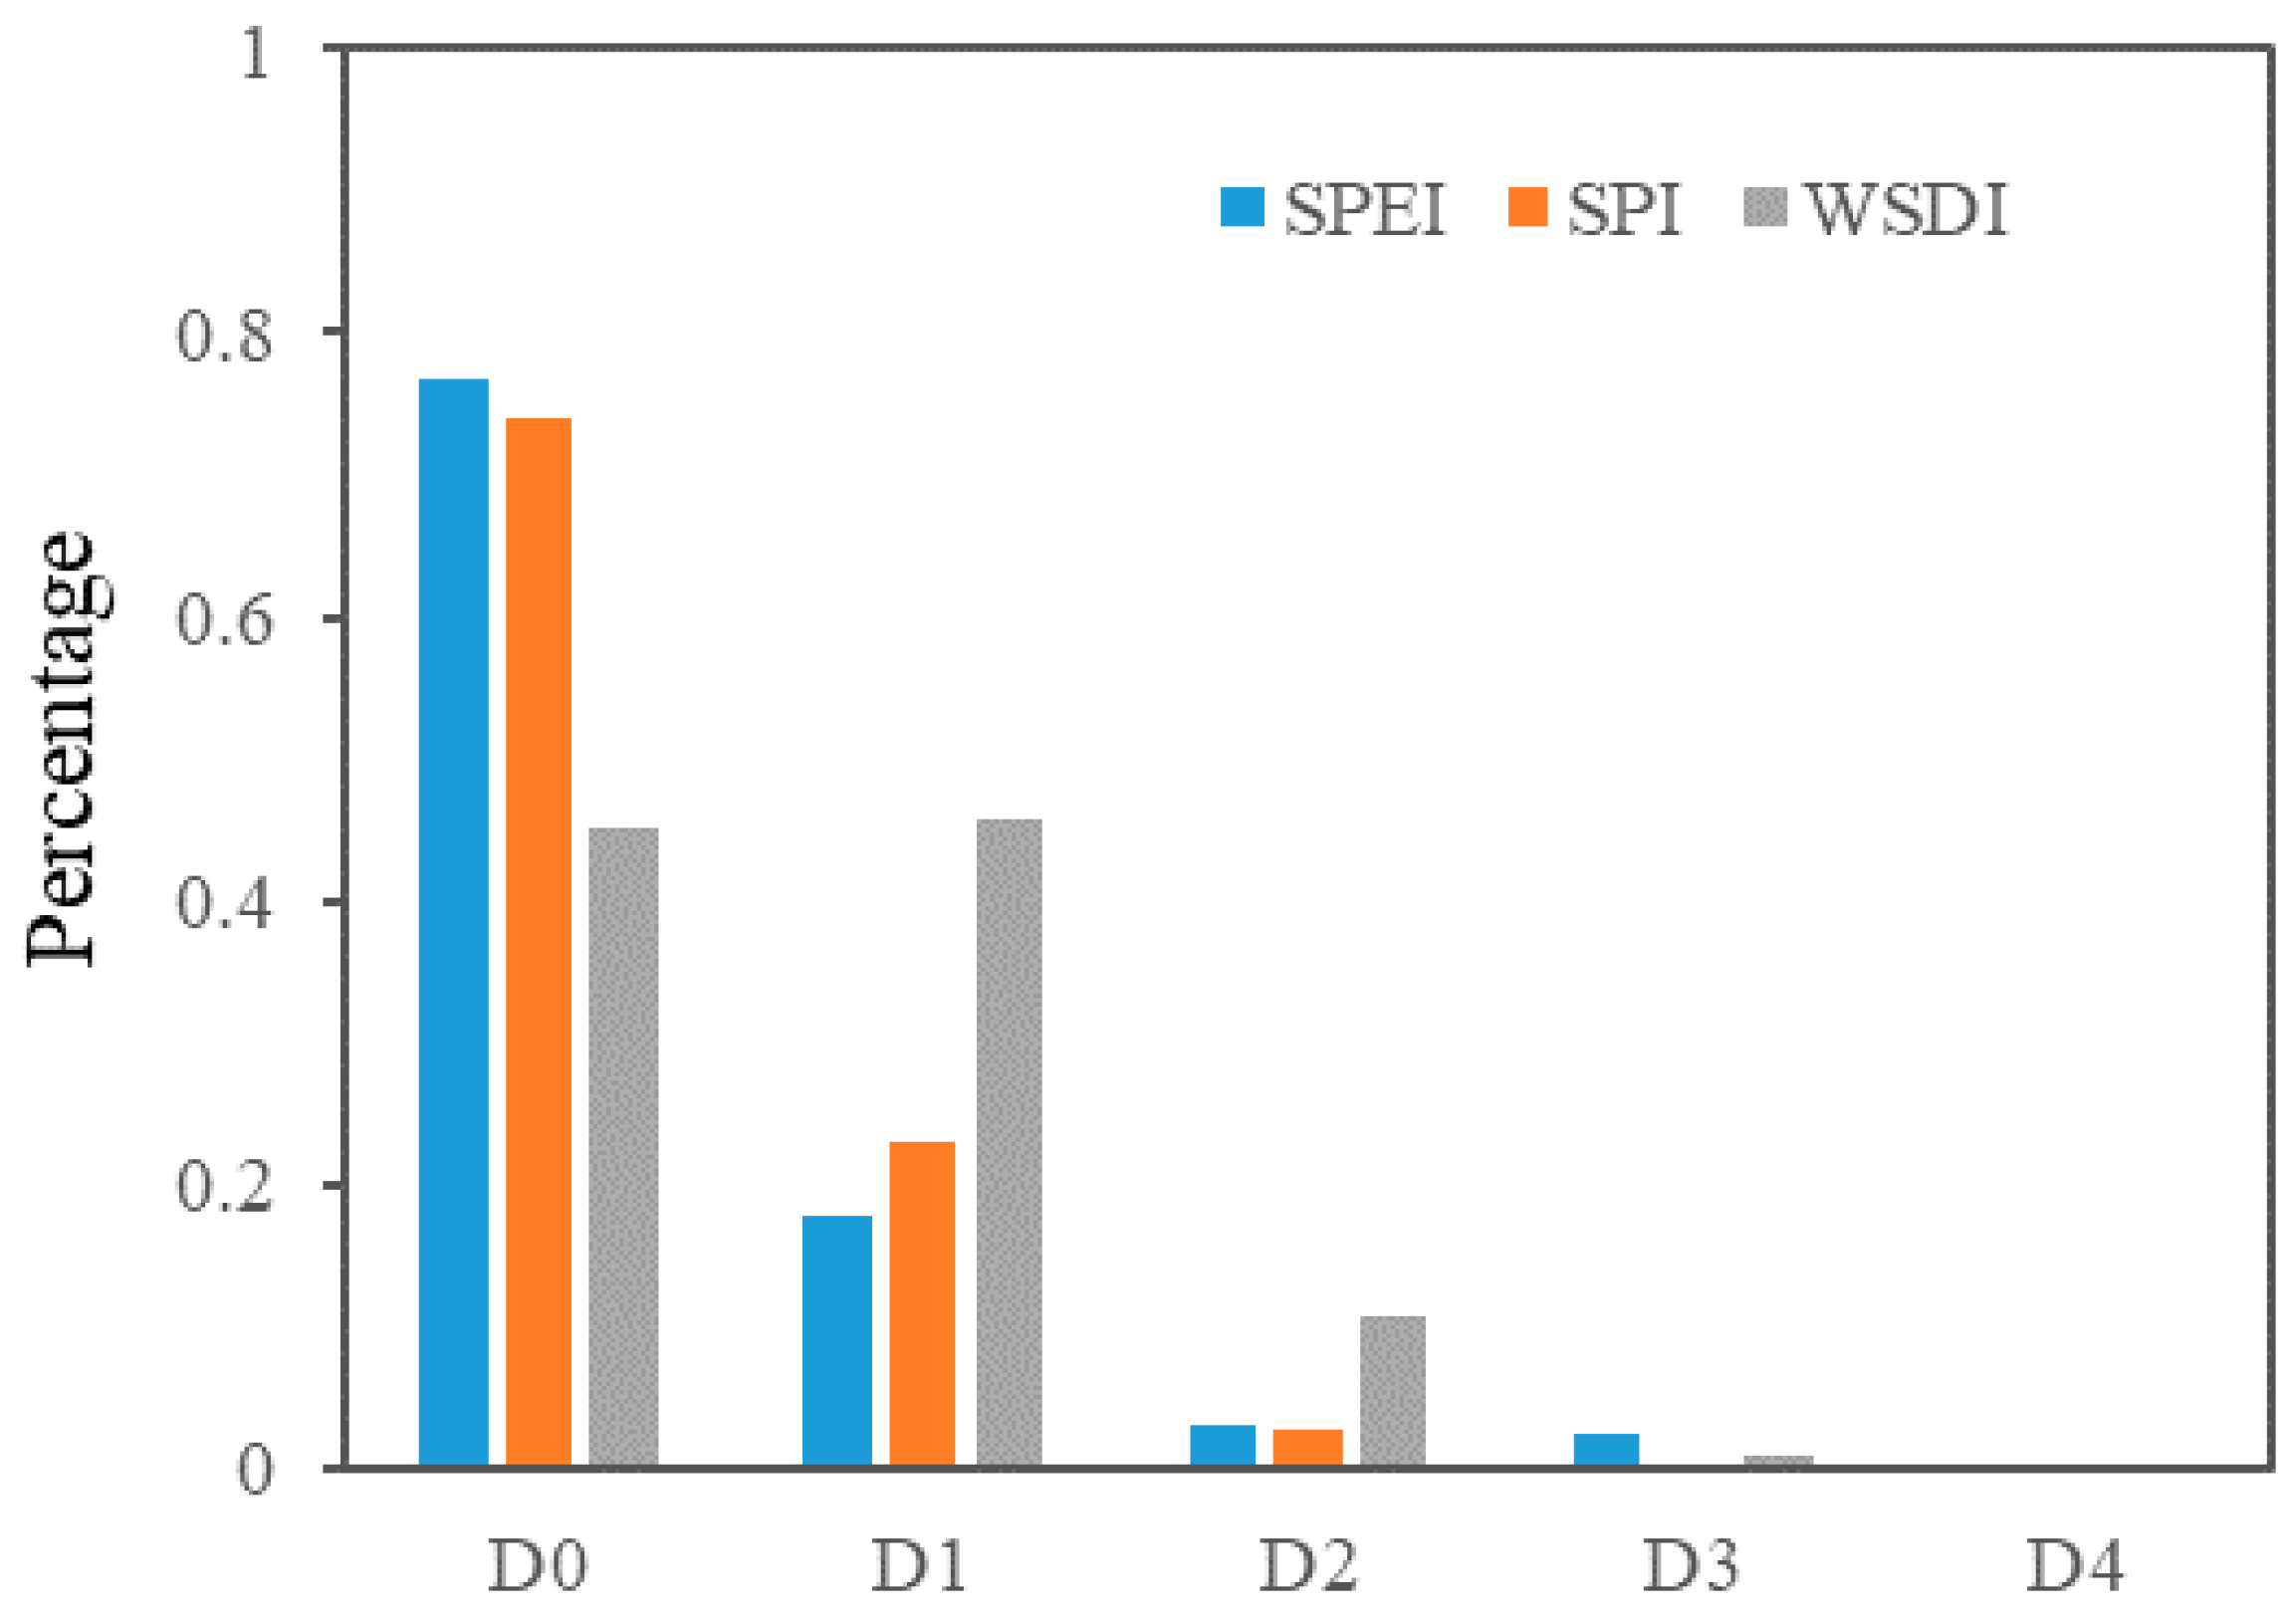
The drought severity of the area in Mongolia affected by different drought levels is assessed. The spatial distribution of drought areas represented the change process of different drought levels. The statistical results show the area’s change suffering from different drought levels. The time series of the monthly area percentage in different drought levels are shown in Figure 11 and Figure 12 to discern the change of drought severity. The largest area affected by drought (D1 and D2) occurred in the 2011–2012 drought event, which caused 71% of Mongolia to suffer a mild drought (D1) and 19% for a moderate drought (D2). From 2007 to 2008, 79% of Mongolia area suffers mild drought (D1), 29% moderate drought (D2), 5% for severe drought (D3) and 1% extreme drought (D4). The frequency of D0 from SPEI and SPI was the highest, while frequencies of D0 and D1 from WSDI were similar to one another (Figure 12). Overall, most of Mongolia experiences mild drought, and severe drought occasionally, although there were differences among these drought indices.
5. Conclusions
We evaluated drought events on Mongolia over the period from 2002 to 2013 based on GRACE data. It is clear that GRACE satellites provide considerable insights to the field of hydrology, revealing information about large−scale groundwater depletion and droughts. WSD and WSDI were used to analyze and characterize the identified drought events. Additionally, WSDI values were compared with SPEI and SPI and similarities and differences in the drought classification among these drought indices were discussed.
The results show that the TWSA had two turning points from 2002 to 2017, declining from 2002 to 2008, then increasing from 2009 to 2017. The cumulative WSD indicated that Mongolia became wet in the period from 2002 to 2006 and 2013 to 2017, and drier in the period from 2007 to 2012. Eight drought events were identified according to the WSD. The most severe drought occurred in 2007/02–2009/12 and lasted 38 months with the total WSD of −290.75 mm, although the average water storage deficit of −7.65 mm was less than that in 2011/08–2012/07 of −10.03 mm. The eight drought events analyzed were classified into different drought severity levels based on different drought indices. Because of the computation methods, data, spatial scales, and the category standards of the indices, differences were found in the results. Overall, although there were some differences between WSDI, SPI, and SPEI, the changing trend and occurred time of peak of these drought indices were consistent. Meanwhile, it captured the major drought events occurring over a large spatial area. Thus, it may be an ideal substitute for large−scale regions with scarce hydro−meteorological sites.
Author Contributions
The manuscript was primarily written by W.Y., with Y.L. and T.S. contributing to its preparation and English check. Y.C. supervised the research and critically reviewed the draft.
Acknowledgments
This work was supported by The Startup Foundation for Introducing Talent of NUIST (2017r078) and the National Natural Science Foundation of China (No. 41701019). We thank Liming Tian from the Key Laboratory for Bio−resource and Eco−environment of Ministry of Education in College of Life Sciences of Sichuan University for the suggestion about the article. We will give many thanks to the two anonymous reviewers for their critical comments and constructive suggestions on the manuscript.
Conflicts of Interest
The authors declare no conflict of interest.
References
- Mishra, A.K.; Singh, V.P. A review of drought concepts. J. Hydrol. 2010, 391, 202–216. [Google Scholar] [CrossRef]
- Dai, A. Increasing drought under global warming in observations and models. Nat. Clim. Chang. 2011, 3, 52–58. [Google Scholar] [CrossRef]
- Trenberth, K.E.; Dai, A.G.; van der Schrier, G.; Jones, P.D.; Barichivich, J.; Briffa, K.R.; Sheffield, J. Global warming and changes in drought. Nat. Clim. Chang. 2014, 4, 17–22. [Google Scholar] [CrossRef]
- Delgado−Baquerizo, M.; Maestre, F.T.; Gallardo, A.; Matthew, A.B.; Wallenstein, M.D.; Quero, J.L.; Ochoa, V.; Gozalo, B.; García−Gómez, M.; Soliveres, S.; et al. Decoupling of soil nutrient cycles as a function of aridity in global drylands. Nature 2013, 502, 672–676. [Google Scholar] [CrossRef] [PubMed]
- Hessl, A.E.; Anchukaitis, K.; Jelsema, C.; Cook, B.; Byambasuren, O.; Leland, C.; Nachin, B.; Pederson, N.; Tian, H.; Hayles, L.A. Past and future drought in Mongolia. Sci. Adv. 2018, 4, e1701832. [Google Scholar] [CrossRef] [PubMed] [Green Version]
- Sun, Z.; Zhu, X.; Pan, Y.; Zhang, J.; Liu, X. Drought evaluation using the GRACE terrestrial water storage deficit over the Yangtze River Basin, China. Sci. Total Environ. 2018, 634, 727–738. [Google Scholar] [CrossRef]
- Creutzfeldt, B.; Ferré, T.; Troch, P.; Merz, B.; Wziontek, H.; Güntner, A. Total water storage dynamics in response to climate variability and extremes: Inference from long−term terrestrial gravity measurement. J. Geophys. Res. Atmos. 2012, 117, D08112. [Google Scholar] [CrossRef]
- Mu, Q.; Zhao, M.; Kimball, J.S.; McDowell, N.G.; Running, S.W. A remotely sensed global terrestrial drought severity index. Bull. Am. Meteorol. Soc. 2013, 94, 83–98. [Google Scholar] [CrossRef]
- Jiang, D.; Wang, J.; Huang, Y.; Zhou, K.; Ding, X.; Fu, J. The review of GRACE data applications in terrestrial hydrology monitoring. Adv. Meteorol. 2014, 2014, 725131. [Google Scholar] [CrossRef]
- Thomas, A.C.; Reager, J.T.; Famiglietti, J.S.; Rodell, M.A. GRACE−based water storage deficit approach for hydrological drought characterization. Geophys. Res. Lett. 2014, 41, 1537–1545. [Google Scholar] [CrossRef]
- Ramillien, G.; Famiglietti, J.S.; Wahr, J. Detection of continental hydrology and glaciology signals from GRACE: A review. Surv. Geophys. 2008, 29, 361–374. [Google Scholar] [CrossRef]
- Tapley, B.D.; Bettadpur, S.; Ries, J.C.; Thompson, P.F.; Watkins, M.M. GRACE measurements of mass variability in the Earth system. Science 2004, 305, 503–505. [Google Scholar] [CrossRef] [PubMed]
- Wang, S.; Zhou, F.; Russell, H. Estimating snow mass and Peak River flows for the Mackenzie River Basin using GRACE satellite observations. Remote Sens. 2017, 9, 256. [Google Scholar] [CrossRef]
- Nie, N.; Zhang, W.; Guo, H.; Ishwaran, N. 2010–2012 drought and flood events in the Amazon Basin inferred by GRACE satellite observations. J. Appl. Remote Sens. 2015, 9, 096023. [Google Scholar] [CrossRef]
- Zhao, C.; Huang, Y.; Li, Z.; Chen, M. Drought monitoring of southwestern China using insufficient GRACE data for the long−term mean reference frame under global change. J. Clim. 2018, 31, 6897–6911. [Google Scholar] [CrossRef]
- Heim, R.R. A review of twentieth−century drought indices used in the United States. Bull. Am. Meteorol. Soc. 2002, 83, 1149–1165. [Google Scholar] [CrossRef]
- Hao, Z.C.; Singh, V.P. Drought characterization from a multivariate perspective: A review. J. Hydrol. 2015, 527, 668–678. [Google Scholar] [CrossRef]
- Beguería, S.; Vicente−Serrano, S.; Reig, F.; Latorre, B. Standardized precipitation evapotranspiration index (SPEI) revisited: Parameter fitting, evapotranspiration models, tools, datasets and drought monitoring. Int. J. Climatol. 2014, 34, 3001–3023. [Google Scholar] [CrossRef]
- Chen, H.; Sun, J. Changes in drought characteristics over China using the standardized precipitation evapotranspiration index. J. Clim. 2015, 28, 5430–5447. [Google Scholar] [CrossRef]
- Li, X.; He, B.; Quan, X.; Liao, Z.; Bai, X. Use of the standardized precipitation evapotranspiration index (SPEI) to characterize the drying trend in southwest China from 1982 to 2012. Remote Sens. 2015, 7, 10917–10937. [Google Scholar] [CrossRef]
- Yirdaw, S.Z.; Snelgrove, K.R.; Agboma, C.O. GRACE satellite observations of terrestrial moisture changes for drought characterization in the Canadian Prairie. J. Hydrol. 2008, 356, 84–92. [Google Scholar] [CrossRef]
- Cao, Y.; Nan, Z.; Cheng, G. GRACE gravity satellite observations of terrestrial water storage changes for drought characterization in the arid land of northwestern China. Remote Sens. 2015, 7, 1021–1047. [Google Scholar] [CrossRef]
- Yi, H.; Wen, L. Satellite gravity measurement monitoring terrestrial water storage change and drought in the continental United States. Sci. Rep. 2016, 6, 19909. [Google Scholar] [CrossRef] [PubMed]
- Yu, W.; Wu, T.; Wang, W.; Li, R.; Wang, T.; Qin, Y.; Wang, W.; Zhu, X. Spatiotemporal changes of reference evapotranspiration in Mongolia during 1980–2006. Adv. Meteorol. 2016, 9586896. [Google Scholar] [CrossRef]
- Tapley, B.D.; Bettadpur, S.; Watkins, M.; Reigber, C. The Gravity Recovery and Climate Experiment: Mission overview and early results. Geophys. Res. Lett. 2004, 31, 4. [Google Scholar] [CrossRef]
- Landerer, F.W.; Swenson, S. Accuracy of scaled GRACE terrestrial water storage estimates. Water Resour. Res. 2012, 48, W04531. [Google Scholar] [CrossRef]
- Swenson, S. GRACE Monthly Land Water Mass Grids NETCDF Release 5.0, Version 5.0. PO.DAAC. Available online: https://podaac−ftp.jpl.nasa.gov/dataset/TELLUS_LAND_NC_RL05 (accessed on 15 August 2012).
- Swenson, S.; Milly, P.C.D. Climate model biases in seasonality of continental water storage revealed by satellite gravimetry. Water Resour. Res. 2006, 42, W03201. [Google Scholar] [CrossRef]
- Yang, P.; Xia, J.; Zhan, C.; Qiao, Y.; Wang, Y. Monitoring the spatio−temporal changes of terrestrial water storage using GRACE data in the Tarim River basin between 2002 and 2015. Sci. Total Environ. 2017, 595, 218–228. [Google Scholar] [CrossRef]
- McKee, T.B.; Doesken, N.J.; Kleist, J. The Relationship of Drought Frequency and Duration to Time Scales. In Proceedings of the 8th Conference on Applied Climatology, American Meteorological Society Boston, Boston, MA, USA, 1993. [Google Scholar]
- Hayes, M.J.; Svoboda, M.D.; Wilhite, D.A.; Vanyarkho, O.V. Monitoring the 1996 drought using the Standardized Precipitation Index. Bull. Am. Meteorol. Soc. 1999, 80, 429–438. [Google Scholar] [CrossRef]
- Bae, S.; Lee, S.; Yoo, S.; Kim, T. Analysis of Drought intensity and trends using the modified SPEI in south Korea from 1981 to 2010. Water 2018, 20, 327. [Google Scholar] [CrossRef]
- Vicente−Serrano, S.M.; Begueria, S.; Lopez−Moreno, J.I. A multiscalar drought index sensitive to global warming: The Standardized Precipitation Evapotranspiration Index. J. Clim. 2010, 23, 1696–1718. [Google Scholar] [CrossRef]
- Palmer, W.C. Meteorological Drought; US Department of Commerce, Weather Bureau Washington: Washington, DC, USA, 1965.
- Tian, F.; Herzschuh, U.; Mischke, S.; Schluetz, F. What drives the recent intensified vegetation degradation in Mongolia−Climate change or human activity? Holocene 2014, 24, 1206–1215. [Google Scholar] [CrossRef]
- Zhao, X.; Hu, H.; Shen, H.; Zhou, D.; Zhou, L.; Myneni, R.B.; Fang, J. Satellite−indicated long−term vegetation changes and their drivers on the Mongolian Plateau. Landsc. Ecol. 2015, 30, 1599–1611. [Google Scholar] [CrossRef]
- Ning, S.; Ishidaira, H.; Udmale, P.; Ichikawa, Y. Remote sensing based analysis of recent variations in water resources and vegetation of a semi−arid region. Water 2015, 7, 6039–6055. [Google Scholar] [CrossRef]
Figure 1.
The grid of Gravity Recovery and Climate Experiment (GRACE) satellite in Mongolia, showing lakes, streams, meteorological stations, administrative boundaries, and elevation.
Figure 1.
The grid of Gravity Recovery and Climate Experiment (GRACE) satellite in Mongolia, showing lakes, streams, meteorological stations, administrative boundaries, and elevation.

Figure 2.
The monthly precipitation and monthly average air temperature (a), the annual precipitation and average air temperature (b). Values are the average of all meteorological stations.
Figure 2.
The monthly precipitation and monthly average air temperature (a), the annual precipitation and average air temperature (b). Values are the average of all meteorological stations.

Figure 3.
Time series of GRACE−inferred Total Water Storage Anomaly (TWSA) and observed precipitation anomaly for Mongolia from 2002 to 2017.
Figure 3.
Time series of GRACE−inferred Total Water Storage Anomaly (TWSA) and observed precipitation anomaly for Mongolia from 2002 to 2017.

Figure 4.
The distribution of the Thiel−Sen’s slope of TWSA and mean annual air temperature and annual precipitation for each meteorological station.
Figure 4.
The distribution of the Thiel−Sen’s slope of TWSA and mean annual air temperature and annual precipitation for each meteorological station.

Figure 5.
Time series of water storage deficit (WSD) and cumulative WSD for Mongolia from 2002 to 2017.
Figure 5.
Time series of water storage deficit (WSD) and cumulative WSD for Mongolia from 2002 to 2017.

Figure 6.
Box−plots showing the inter−annual change trends of total water storage anomaly (TWSA) and water storage deficit (WSD) in Mongolia from 2002 to 2017.
Figure 6.
Box−plots showing the inter−annual change trends of total water storage anomaly (TWSA) and water storage deficit (WSD) in Mongolia from 2002 to 2017.

Figure 7.
The correlation between TWSA and cumulative precipitation anomaly (a), and the series of WSD and cumulative precipitation anomaly (b).
Figure 7.
The correlation between TWSA and cumulative precipitation anomaly (a), and the series of WSD and cumulative precipitation anomaly (b).

Figure 8.
Comparisons between water storage deficit index (WSDI) and two other drought indices (SPEI (a) and SPI (b)) and after smoothing (c) in 1−,3−, 6−, and 12−month scales.
Figure 8.
Comparisons between water storage deficit index (WSDI) and two other drought indices (SPEI (a) and SPI (b)) and after smoothing (c) in 1−,3−, 6−, and 12−month scales.

Figure 9.
The distribution of the Thiel−Sen’s slope of WSDI and SPEI−06 for each meteorological station.
Figure 9.
The distribution of the Thiel−Sen’s slope of WSDI and SPEI−06 for each meteorological station.

Figure 10.
Instantaneous severity and associated total drought severity values and water storage deficit determined for GRACE−observed data.
Figure 10.
Instantaneous severity and associated total drought severity values and water storage deficit determined for GRACE−observed data.

Figure 11.
Percentage area of Mongolia subjected to droughts at different levels of severity based on WSDI from 2002 to 2017 (D0: no drought; D1: mild drought; D2: moderate drought; D3: severe drought; D4: extreme drought).
Figure 11.
Percentage area of Mongolia subjected to droughts at different levels of severity based on WSDI from 2002 to 2017 (D0: no drought; D1: mild drought; D2: moderate drought; D3: severe drought; D4: extreme drought).

Figure 12.
Percentage of meteorological stations (SPEI, SPI) or area (WSDI) of Mongolia experiencing different drought severity levels from 2002 to 2017.
Figure 12.
Percentage of meteorological stations (SPEI, SPI) or area (WSDI) of Mongolia experiencing different drought severity levels from 2002 to 2017.


Table 1.
Drought severity category based on drought indices. SPI: standardized precipitation index; SPEI: standardized precipitation evapotranspiration index.
Table 1.
Drought severity category based on drought indices. SPI: standardized precipitation index; SPEI: standardized precipitation evapotranspiration index.
| Category | Drought Condition | SPI/SPEI | WSDI |
|---|---|---|---|
| D0 | No drought | −0.5 < S | 0 < W |
| D1 | Mild drought | −1.0 < S ≤ −0.5 | −1.0 < W ≤ 0 |
| D2 | Moderate drought | −1.5 < S ≤ −1.0 | −2.0 < W ≤ −1.0 |
| D3 | Severe drought | −2.0 < S ≤ −1.5 | −3.0 < W ≤ −2.0 |
| D4 | Extreme drought | S ≤ −2.0 | W ≤ −3.0 |
Table 2.
Summary of GRACE−identified drought events and drought severity categories based on the WSD and WSDI of Mongolia.
Table 2.
Summary of GRACE−identified drought events and drought severity categories based on the WSD and WSDI of Mongolia.
| Time Period | Duration (month) | Total Severity (mm) | Average Deficit (mm) | Peak Deficit (mm) | WSDI/Category |
|---|---|---|---|---|---|
| 2002/07–2002/09 | 3 | −11.8 | −3.9 | −8.2 | −0.50/D1 |
| 2003/04–2003/07 | 4 | −19.6 | −4.9 | −6.2 | −0.38 /D1 |
| 2005/07–2006/03 | 9 | −40.1 | −4.5 | −8.6 | −0.63 /D1 |
| 2007/02–2009/12 | 38 | −290.8 | −7.7 | −16.6 | −0.98 /D1 |
| 2010/07–2011/05 | 11 | −59.7 | −5.4 | −9.7 | −0.81 /D1 |
| 2011/08–2012/07 | 12 | −120.4 | −10.0 | −15.6 | −0.99 /D1 |
| 2014/12–2015/05 | 6 | −53.4 | −8.9 | −16.2 | −1.18 /D2 |
| 2016/08–2016/11 | 4 | −32.0 | −8.0 | −10.0 | −0.87 /D1 |
Table 3.
Drought severity categories based on the SPEI, SPI, and WSDI of stations.
| Time Period | Duration(month) | SPEI/Category | SPI/Category | WSDI/Category | Combined Category |
|---|---|---|---|---|---|
| 2002/07–2002/09 | 3 | −1.01/D2 | −0.67/D1 | −0.72/D1 | D1/D2 |
| 2003/04–2003/07 | 4 | 0.52/D0 | 0.27/D0 | −0.48/D1 | D0/D1 |
| 2005/07–2006/03 | 9 | −0.82/D1 | −1.03/D1 | −0.68/D1 | D1 |
| 2007/02–2009/12 | 38 | −1.46/D2 | −0.81/D1 | −1.26/D2 | D1/D2 |
| 2010/07–2011/05 | 11 | −0.56/D1 | 0.06/D0 | −0.76/D1 | D0/D1 |
| 2011/08–2012/07 | 12 | −0.97/D1 | −0.64/D1 | −1.09/D2 | D1/D2 |
| 2014/12–2015/05 | 6 | −0.94/D1 | −0.54/D1 | −1.24/D2 | D1/D2 |
| 2016/08–2016/11 | 4 | −0.32/D0 | 0.41/D0 | −0.76/D1 | D0/D1 |
© 2019 by the authors. Licensee MDPI, Basel, Switzerland. This article is an open access article distributed under the terms and conditions of the Creative Commons Attribution (CC BY) license (http://creativecommons.org/licenses/by/4.0/).
Share and Cite
MDPI and ACS Style
Yu, W.; Li, Y.; Cao, Y.; Schillerberg, T. Drought Assessment using GRACE Terrestrial Water Storage Deficit in Mongolia from 2002 to 2017. Water 2019, 11, 1301. https://doi.org/10.3390/w11061301
AMA Style
Yu W, Li Y, Cao Y, Schillerberg T. Drought Assessment using GRACE Terrestrial Water Storage Deficit in Mongolia from 2002 to 2017. Water. 2019; 11(6):1301. https://doi.org/10.3390/w11061301
Chicago/Turabian StyleYu, Wenjun, Yanzhong Li, Yanping Cao, and Tayler Schillerberg. 2019. "Drought Assessment using GRACE Terrestrial Water Storage Deficit in Mongolia from 2002 to 2017" Water 11, no. 6: 1301. https://doi.org/10.3390/w11061301
Note that from the first issue of 2016, this journal uses article numbers instead of page numbers. See further details here.