Geochemical Behavior of Uranium and Radon in Groundwater of Jurassic Granite Area, Icheon, Middle Korea

1
Geologic Environment Division, Korea Institute of Geoscience and Mineral Resources, Daejeon 34132, Korea
2
Department of Earth and Environmental Sciences, Andong National University, Andong 36729, Korea
*
Author to whom correspondence should be addressed.
Water 2019, 11(6), 1278; https://doi.org/10.3390/w11061278
Submission received: 5 May 2019
/
Revised: 30 May 2019
/
Accepted: 17 June 2019
/
Published: 19 June 2019
(This article belongs to the Special Issue Radioactive Isotopes in Hydrosphere)
Abstract
:Uranium concentrations (a total of 82 samples) in groundwater in Icheon, middle Korea, showed a wide range from 0.02 to 1640 μg/L with a mean of 56.77 μg/L, a median of 3.03 μg/L, and a standard deviation of 228.63 μg/L. Most groundwater samples had quite low concentrations: 32.9% were below 1 μg/L, while 15.9% exceeded 30 μg/L, the maximum contaminant level (MCL) of the US EPA (Environmental Protection Agency). Radon concentrations also ranged widely from 1.48 to 865.8 Bq/L. Although the standard deviation of radon was large (151.8 Bq/L), the mean was 211.29 Bq/L and the median was 176.86 Bq/L. Overall, 64.6% of the samples exceeded the alternative maximum contaminant level (AMCL) of the US EPA (148 Bq/L). According to statistical analyses, there was no close correlations between uranium and radon, but there were correlations between uranium and redox potential (Eh) (−0.54), dissolved oxygen (DO) (−0.50), HCO3− (0.45), Sr (0.65), and SiO2 (−0.44). Radon showed independent behavior with respect to most components in groundwater. Uranium concentrations in groundwater increased with increasing water–rock interactions. Anomalously high uranium and radon concentrations in groundwater are preferentially localized in granite areas and spatial distributions are remarkably heterogeneous.

1. Introduction
Radionuclides such as uranium and radon naturally occur in groundwater around the world. However, at high concentrations, they can be harmful to public health and their mobility is sensitive to aqueous geochemical conditions. Uranium is more soluble in oxidizing, alkaline, and carbonate-rich water than under acidic, reducing conditions [1,2]. Radon, which has a half-life of 3.8 days, is an inert, radioactive gas that basically originates from the decay of radium. Many studies have reported higher uranium and radon concentrations in groundwater in granitic terrains [3,4,5,6,7,8,9,10]. Higher radon concentrations are commonly detected in areas underlain by granites that usually contain more uranium than other rock types [8,9,10]. The radon concentration in groundwater generally increases with an increase in the uranium content of the soil and bedrock [11,12], but is highly variable, depending on aquifer characteristics, bedrock geology, water chemistry, and good conditions [4,13,14].
The first nationwide survey of radionuclide concentrations in groundwater was conducted in 1999 by the Korea Institute of Geosciences and Mineral Resources (KIGAM), in collaboration with the National Institute of Environmental Research (NIER), Korea. To date, more than 5500 wells have been investigated for radionuclide concentrations in groundwater to establish recommended guidelines [15,16,17,18]. It has been found that radionuclides such as uranium and radon are highest in groundwater in granite areas, followed by other geologic units such as metamorphic, sedimentary, and volcanic rocks in Korea [4,9,10]. In fact, 51.6% of the groundwater used by communities in areas with Jurassic granite in Korea has radon values exceeding the WHO permissible limit of 100 Bq/L [10]. Unlike uranium, no recommended limit for radon in drinking water has been set yet in Korea [19], though the demand has increasingly grown with increasing concern about potential human health risks. Radon concentrations in the community groundwater system of Korea were highest in Jurassic granitic aquifers [10]. However, there is still a lack of information on geochemical behavior of radionuclides in groundwater from Jurassic granite because the occurrence and concentration levels differ considerably from place to place [8,9].
The purpose of this study is to provide insight into the geochemical behaviors of uranium and radon in groundwater in the Icheon area of middle Korea, whose geology is composed of Jurassic granite. It is important to elucidate the origin and distribution levels of these radionuclides in groundwater because Jurassic granite is one of the most widespread rock types in Korea. We performed chemical analyses of uranium, radon, and geochemical parameters. Statistical analyses including correlation coefficients and factor analysis were made to evaluate the relationships among uranium, radon, and geochemical parameters governing geochemical behaviors of radionuclides in groundwater near Jurassic granite.
2. Materials and Methods
2.1. Study Area and Bedrock Geology
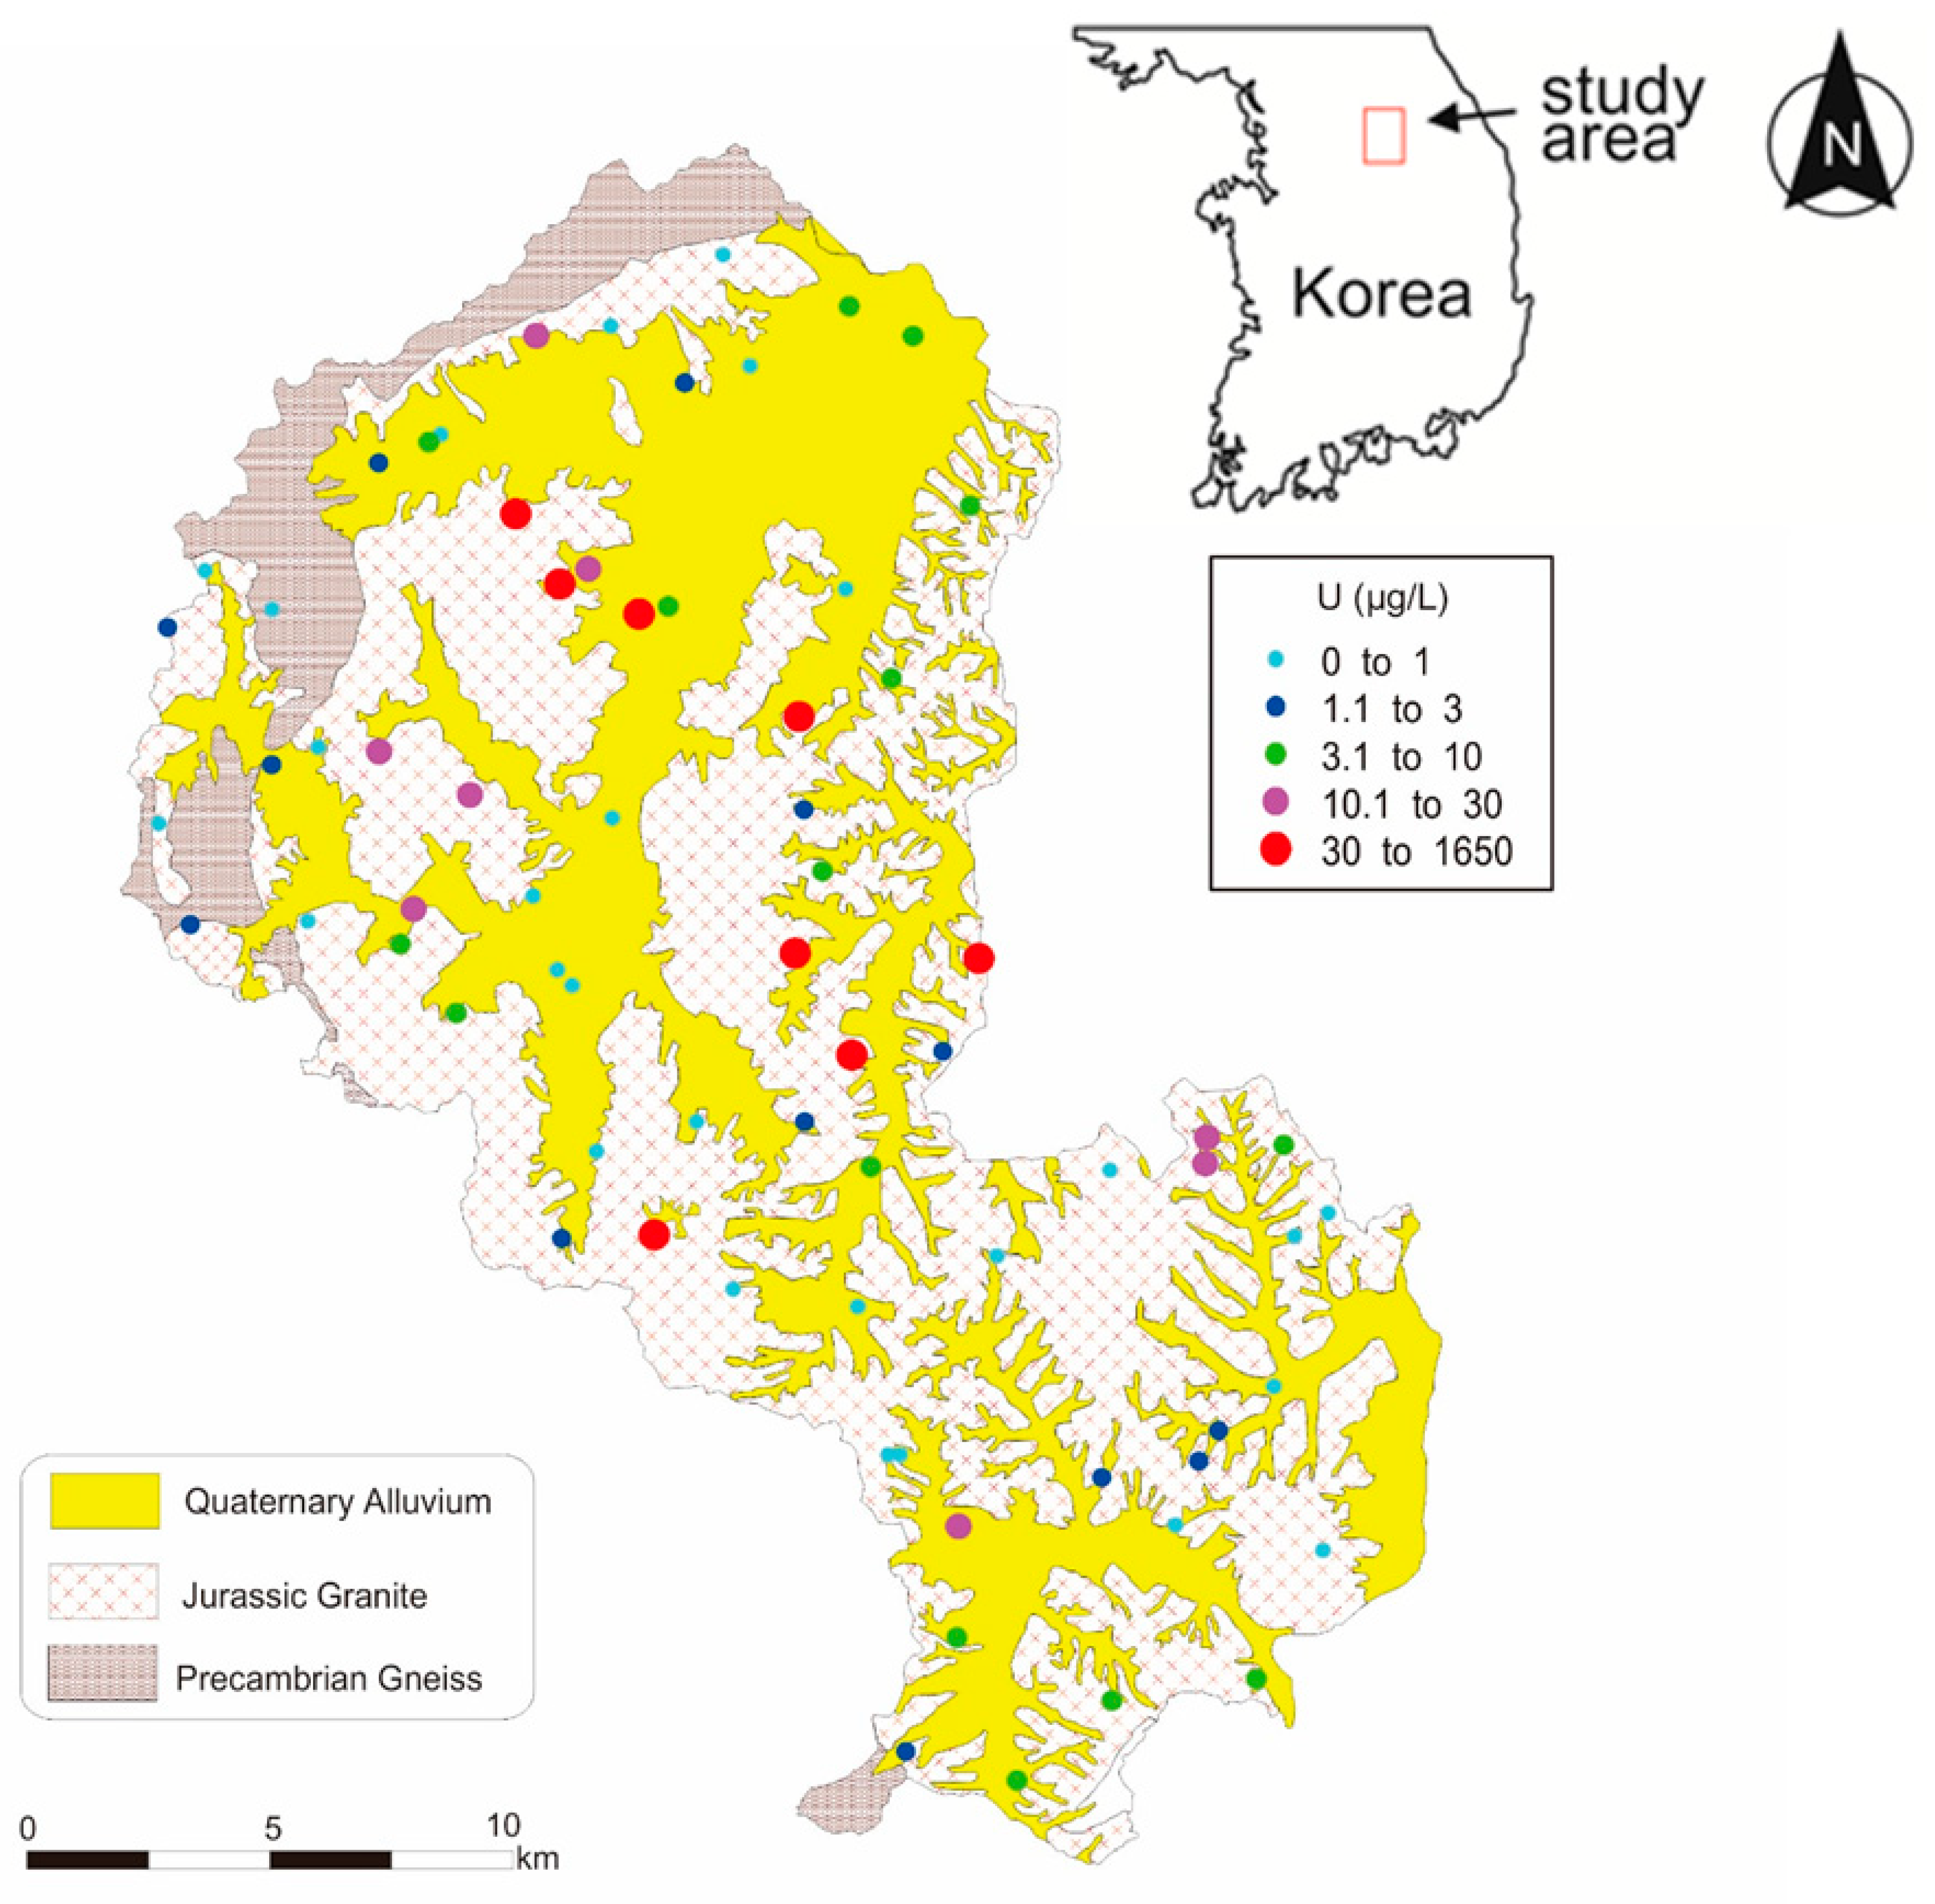
Icheon, an area of 461 km2 located about 40 km southeast from Seoul, Korea, consists of open countryside and a small city. Its landscape is characterized by low elevation, typical of old topography formed due to intensive weathering of granite, except for the highlands of the western area. A basin-like formation with wide and thick alluvium is well developed in the area. A main stream with a dendritic drainage pattern, called Bokhacheon, flows through the central part of the city, running from the south toward the north. The stream gradually flows toward the northeast and finally merges into the South Han River, one of the longest rivers in Korea. Thick alluvium ranging from 5 to 20 m has developed around the Bokhacheon stream and low lands are covered with sandy soils derived from the host granite, which play an important role in forming favorable catchments.
The geology of the study area mostly consists of biotite granite, with lesser two-mica granite and porphyritic granite, and dikes [20]. In a strict sense, these granites belong to the group of Jurassic granite called Daebo Granite, which is widespread in the middle part of the Korean peninsula. The Jurassic granite is characterized by S-type magma originating from the partial melting of continental crusts. The main constituent minerals of biotite granite are quartz, feldspars, biotite, and trace muscovite. Calcite occurs as fracture-coating minerals in the Jurassic granite. The two-mica granite is found as a zonal stock distributed in some places where there are numerous pegmatite dikes. It consists of coarse grains of quartz, feldspars, and micas including muscovite and biotite. Porphyritic granite occurs as stock in gradual contact with the biotite granite because it originates from cogenetic magma of the biotite granite. The main minerals constituting the porphyritic granite are feldspars, quartz, and biotite, the latter being much coarser in size. In Icheon, several felsic dikes with intruding granites have developed in the N20E–N20W directions. Preferred lineaments and small faults, though negligible, have also developed in the same direction as the dikes. Precambrian granitic gneiss is partly distributed in the northwestern part of the city area. All wells investigated were installed in Jurassic granite aquifer. The well depths of the groundwater studied ranged from 30 m to 320 m, with an average depth of 121 m.
2.2. Sampling and Analytical Methods
A total of 82 groundwater samples were collected from operational wells serving as public and private water sources across the study area and analyzed for uranium and radon concentrations. After the temperature, pH, redox potential (Eh), and electric conductivity (EC) were stabilized, groundwater samples were collected from April to June during the dry season to rule out the possibility of variation in meteorological parameters that might induce a mixing effect between groundwater and rainwater or newly recharged groundwater.
For uranium analyses, samples were acidified to pH 2 with 1N HNO3 solution and analyzed using inductively coupled plasma mass spectrometry (ICP-MS, DRC-II quadrupole, PerkinElmer, Waltham, MA, USA). For radon analyses, special care was taken to prevent air bubbles by turbulent flow or contact with air, which may cause a loss of radon gas during sampling. As described in the previous works [4,8,9,10], 8 mL groundwater was taken and injected into vials. Each vial contained 12 mL high-efficiency scintillation solution (Optiphase HiSafe3, PerkinElmer, Waltham, MA, USA). The vial was plugged and shaken until the scintillation solution and groundwater samples were evenly mixed. We employed an ultra-low-level liquid scintillation counter (Quantulus™ 1220, PerkinElmer, Waltham, MA, USA) to measure the radioactivity of 222Rn and its progeny at KIGAM. The detection limit was about 0.12 Bq/L for a pulse shape analysis (PSA) concentration of 100 Bq/L and a count time of 300 min.
For cation analysis (Ca, Na, K, Mg, Sr, SiO2), groundwater was collected after filtering using a 0.45 μm membrane and analyzed using inductively coupled plasma atomic emission spectrometry (ICP-AES, Optima 4300 DV, PerkinElmer, Waltham, MA, USA). Anion analyses (Cl−, SO42−, F−, NO3−) were conducted using ion chromatography (IC, DX-1500, Dionex, Sunnyvale, CA, USA) and total HCO3− was measured in the field by the titration method.
Basic statistical analyses on hydrogeological components including radionuclides, major elements, pH, Eh, EC, and so forth were conducted. Pearson’s correlation coefficients were calculated and factor analyses were performed to better understand the distribution behaviors of uranium and radon using SPSS software (IBM, Armonk, NY, USA). Correlation coefficients among various physicochemical parameters accounting for water quality were calculated. R-mode factor analyses were performed as principal components after Varimax rotation, which allowed verification of factor loadings related to percentages of the total variance within the data.
3. Results and Discussion
3.1. Groundwater Chemistry and Water Types
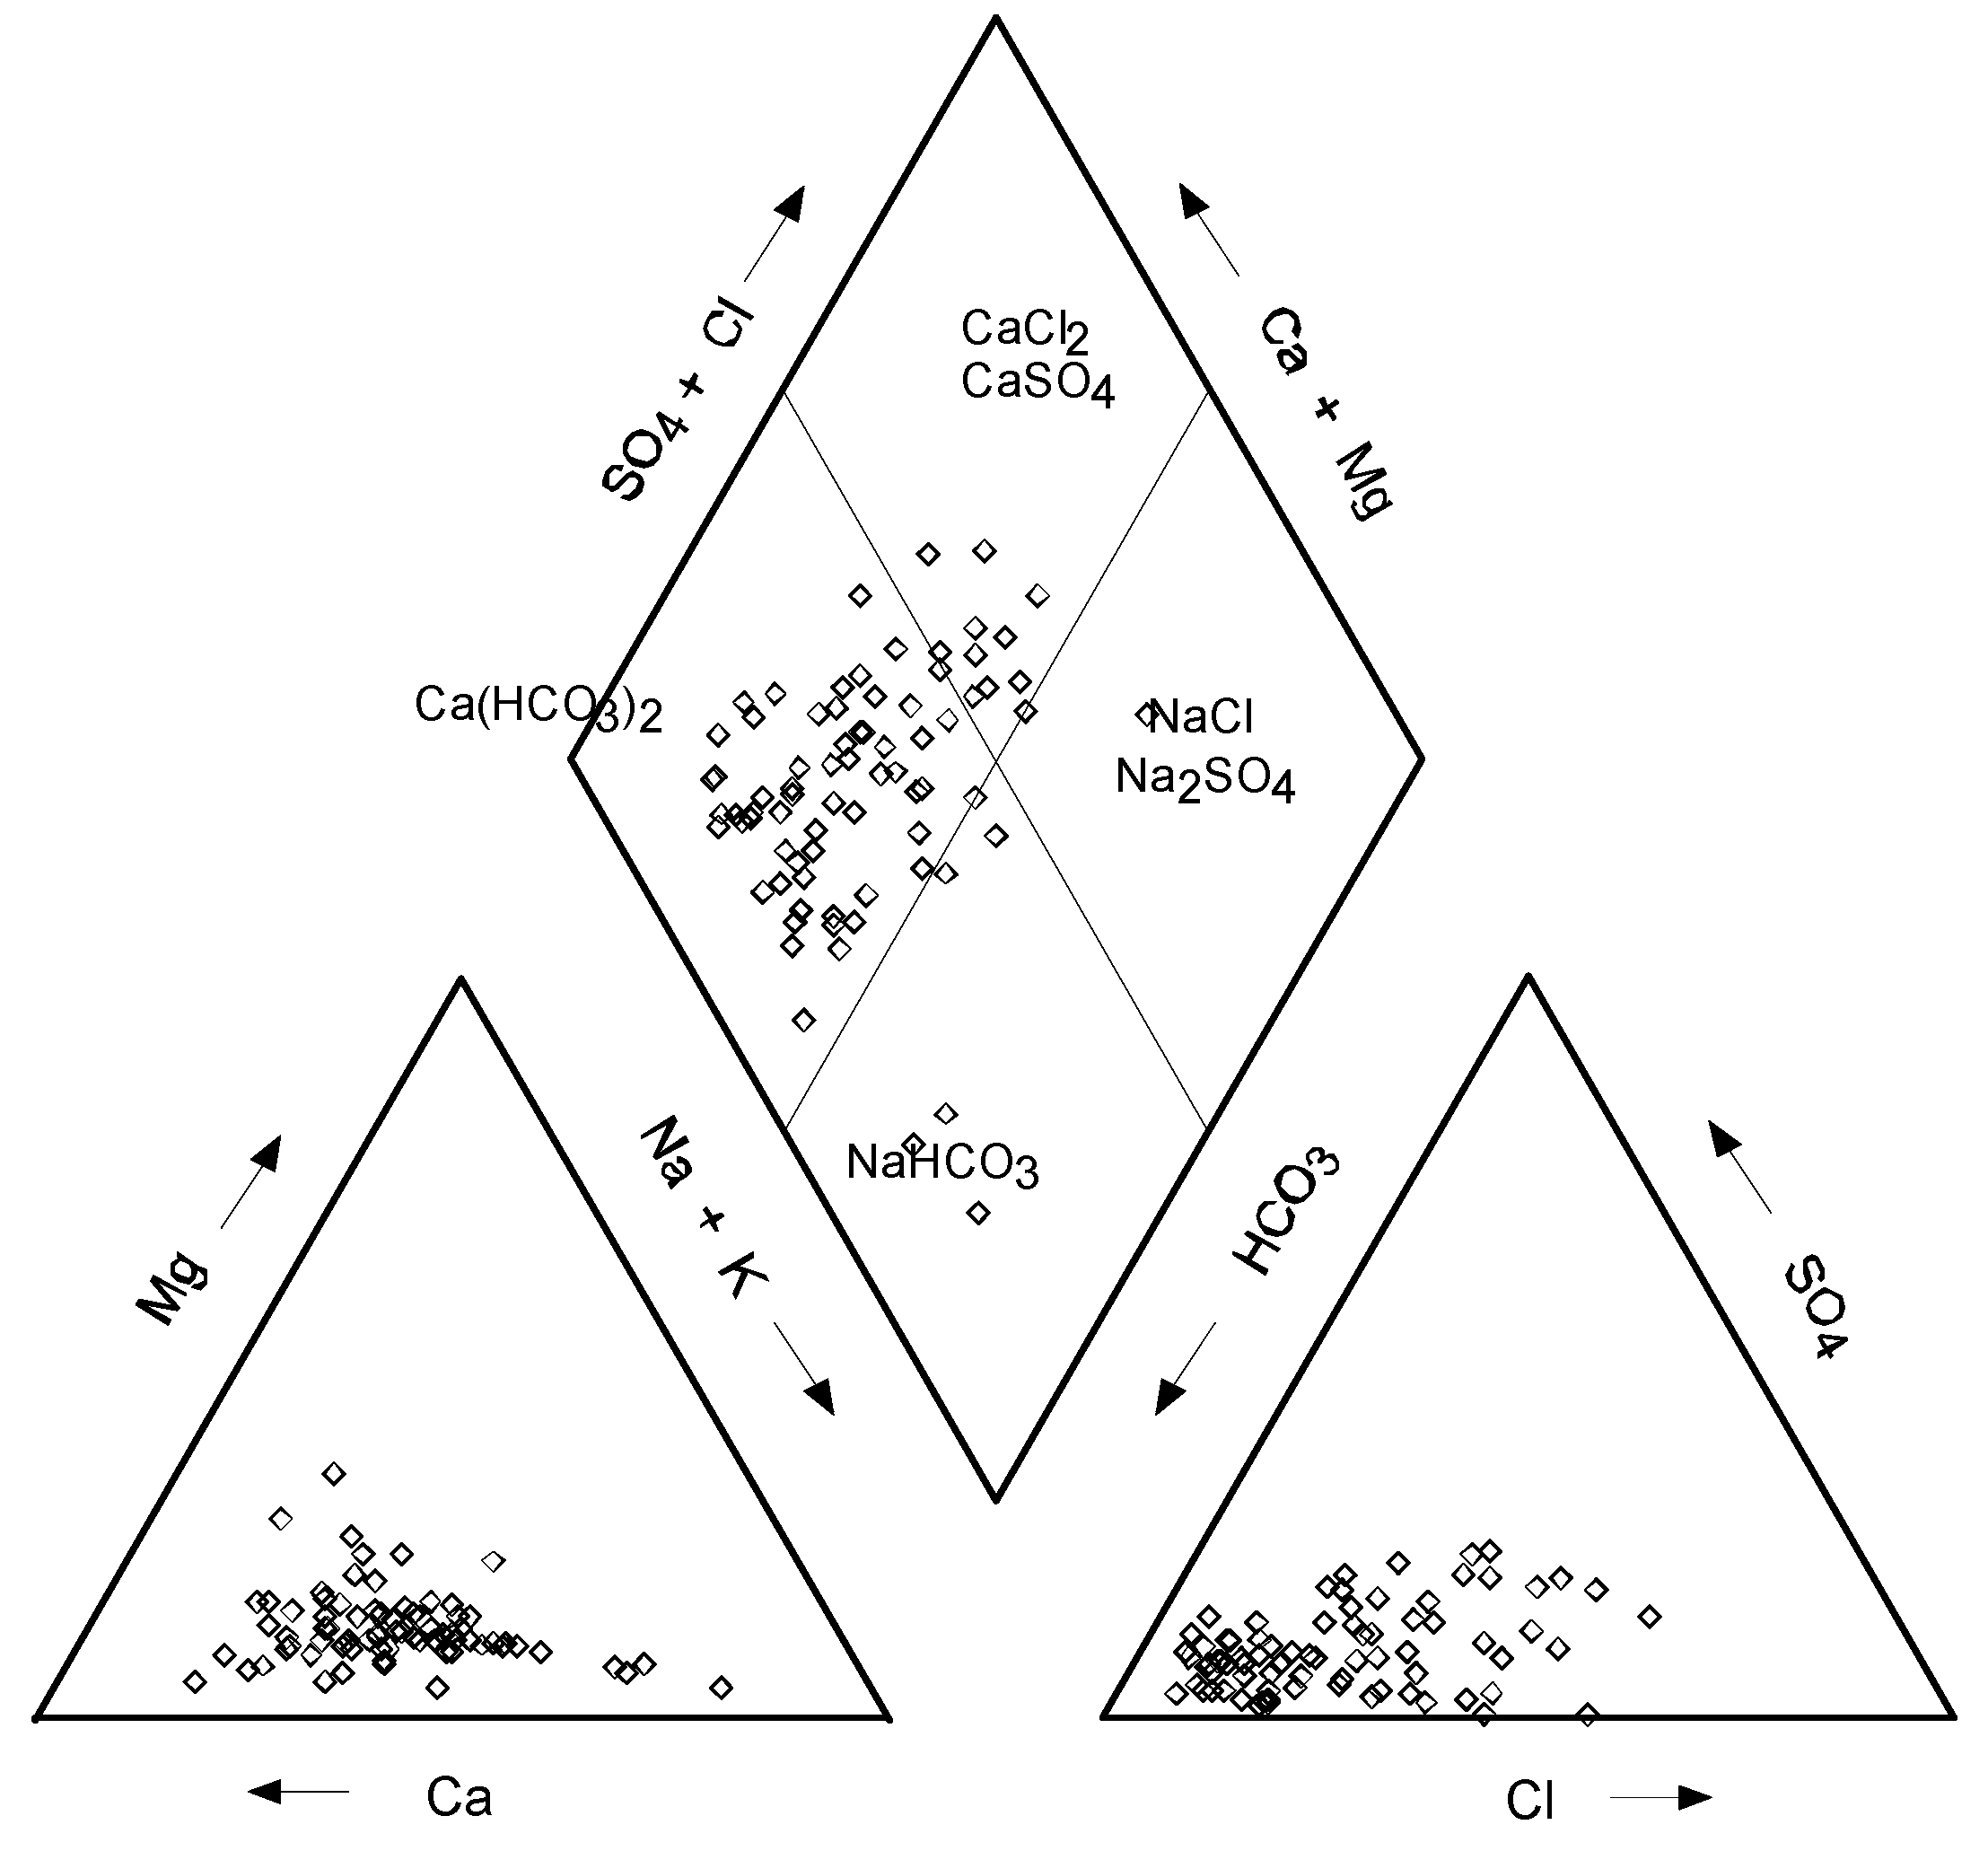
According to the hydrochemical data in Table 1, temperatures varied from 13.1 to 16.6 °C and the pH showed a wide range of 5.38–8.15. The EC ranged from 61 to 707 μS/cm, mostly lying in the range of 100–300 μS/cm. Eh varied from −139 to 350 mV with an average of 210.8 mV and dissolved oxygen (DO) was in the range of 0.86–11.0 mg/L. Interestingly, the sample with the lowest Eh (−139 mV) had the lowest DO (0.86 mg/L). Of 82 samples, 5 samples had negative Eh values. This means that the groundwater originated from an anoxic environment, quite different from most of the groundwater in the study area. The EC increased with increasing cation concentrations, including Na+, K+, Ca2+, and Mg2+, and anion concentrations, including HCO3−, Cl−, and SO42−. This indicates that the water chemistry was controlled by water–rock interactions. The cation concentrations were Ca2+ > Na+ > Mg2+ > K+ in order of abundance, while anions concentrations were HCO3− > Cl− > SO42− in order of abundance. As illustrated in Figure 1, water types plotted on a Piper diagram indicated that most groundwater samples belonged to the Ca-HCO3 or Ca-Na-HCO3 types, but some samples were of the Ca-SO4 and Na-HCO3 types, with one belonging to the Na-SO4 type. Water types of Ca-HCO3 or Ca-Na-HCO3 are typical of granite aquifer with feldspars. Ca-SO4, Na-HCO3, and Na-SO4 types represent specific groundwater from discharge areas or intermediate to lower zones in aquifer [21]. According to the characteristics of water types, the majority of groundwater in Icheon area mostly originates from the upper zone or recharge area, but some of the groundwater originates from the lower zone or discharge area.
3.2. Uranium Concentration and Spatial Distribution
Uranium concentrations showed a wide range from 0.02 to 1640 μg/L with a mean of 56.77 μg/L, a median of 3.03 μg/L, and a large standard deviation of 228.63 μg/L, indicating that uranium concentrations in groundwater greatly vary by several orders of magnitude.
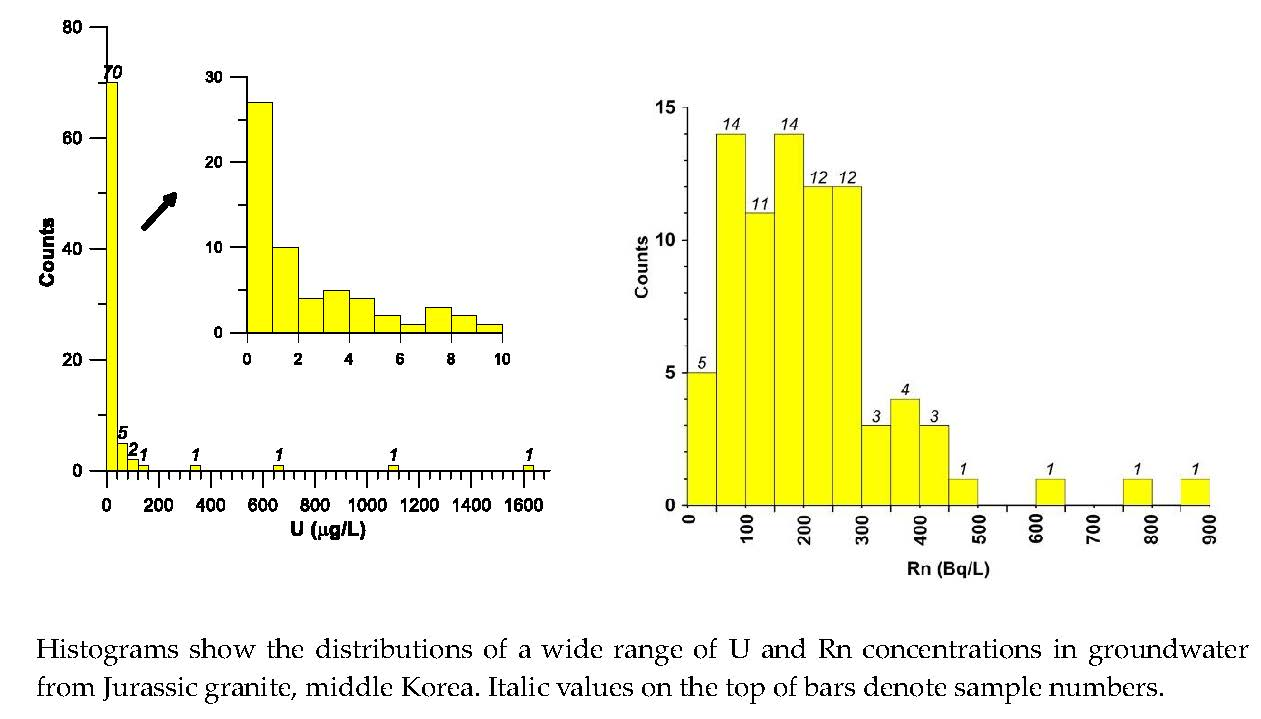
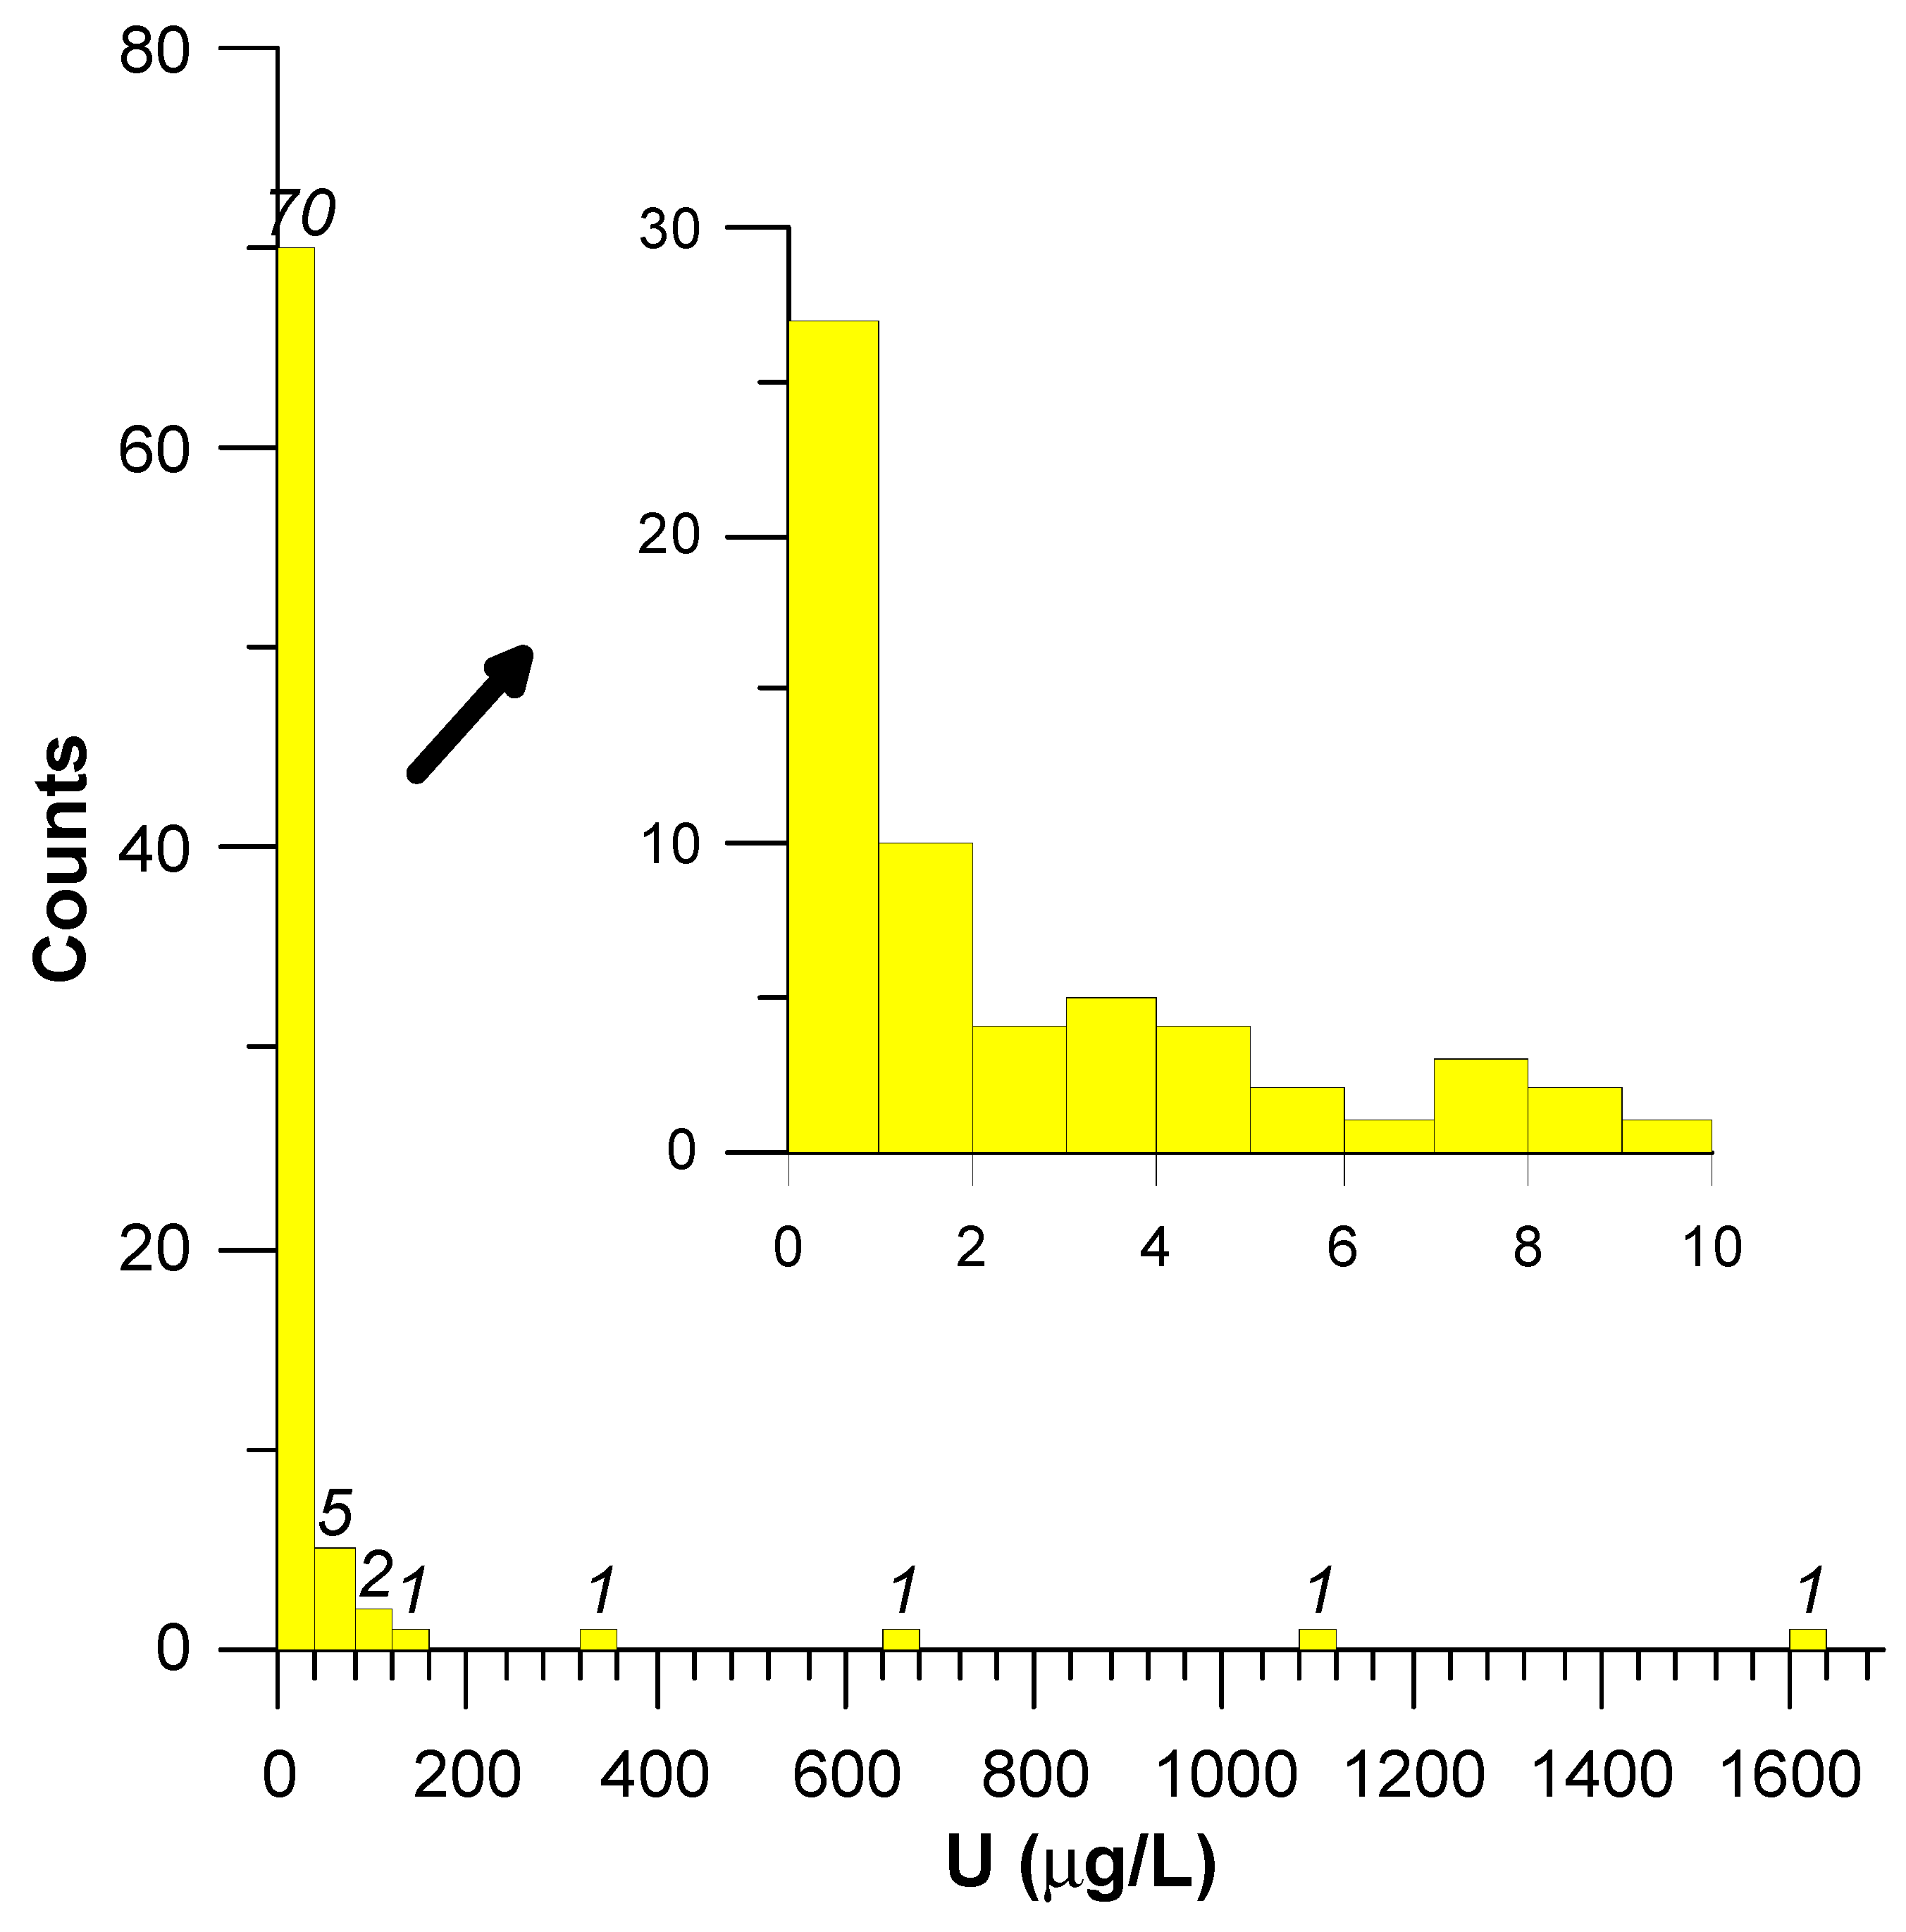
Figure 2 shows histograms of the distributions of a wide range of uranium concentrations in groundwater, indicating that most samples have very low uranium concentrations.
The difference between the mean and median values is very large, indicating that most samples had a very low uranium concentration. Of the 82 samples, 32.9% were below the levels of 1 μg/L and 15.9% exceeded the limit of the EPA MCL (30 μg/L), less than the rate (20.4%) of groundwater from Jurassic granite in Daejeon in central western Korea [22]. It has been known that the groundwater in Daejeon has the highest uranium concentrations in Korea [15,16,17,18,22,23,24]. In fact, median uranium concentrations in groundwater from most areas of Jurassic granite in Korea are quite low; 4.43 μg/L in Daejeon (south of Icheon), 3.46 μg/L in the Yeoju area (near Icheon), 1.33 μg/L in the Pocheon area (north of Icheon), and 1.24 μg/L in the Anseong area (southwest of Icheon), according to NIER [17,18]. These data indicate that uranium concentrations in groundwater from the Jurassic granite areas are generally low, except for a few sites. Maximum uranium concentrations in those areas are generally very high and can be up to several hundred or several thousand μg/L.
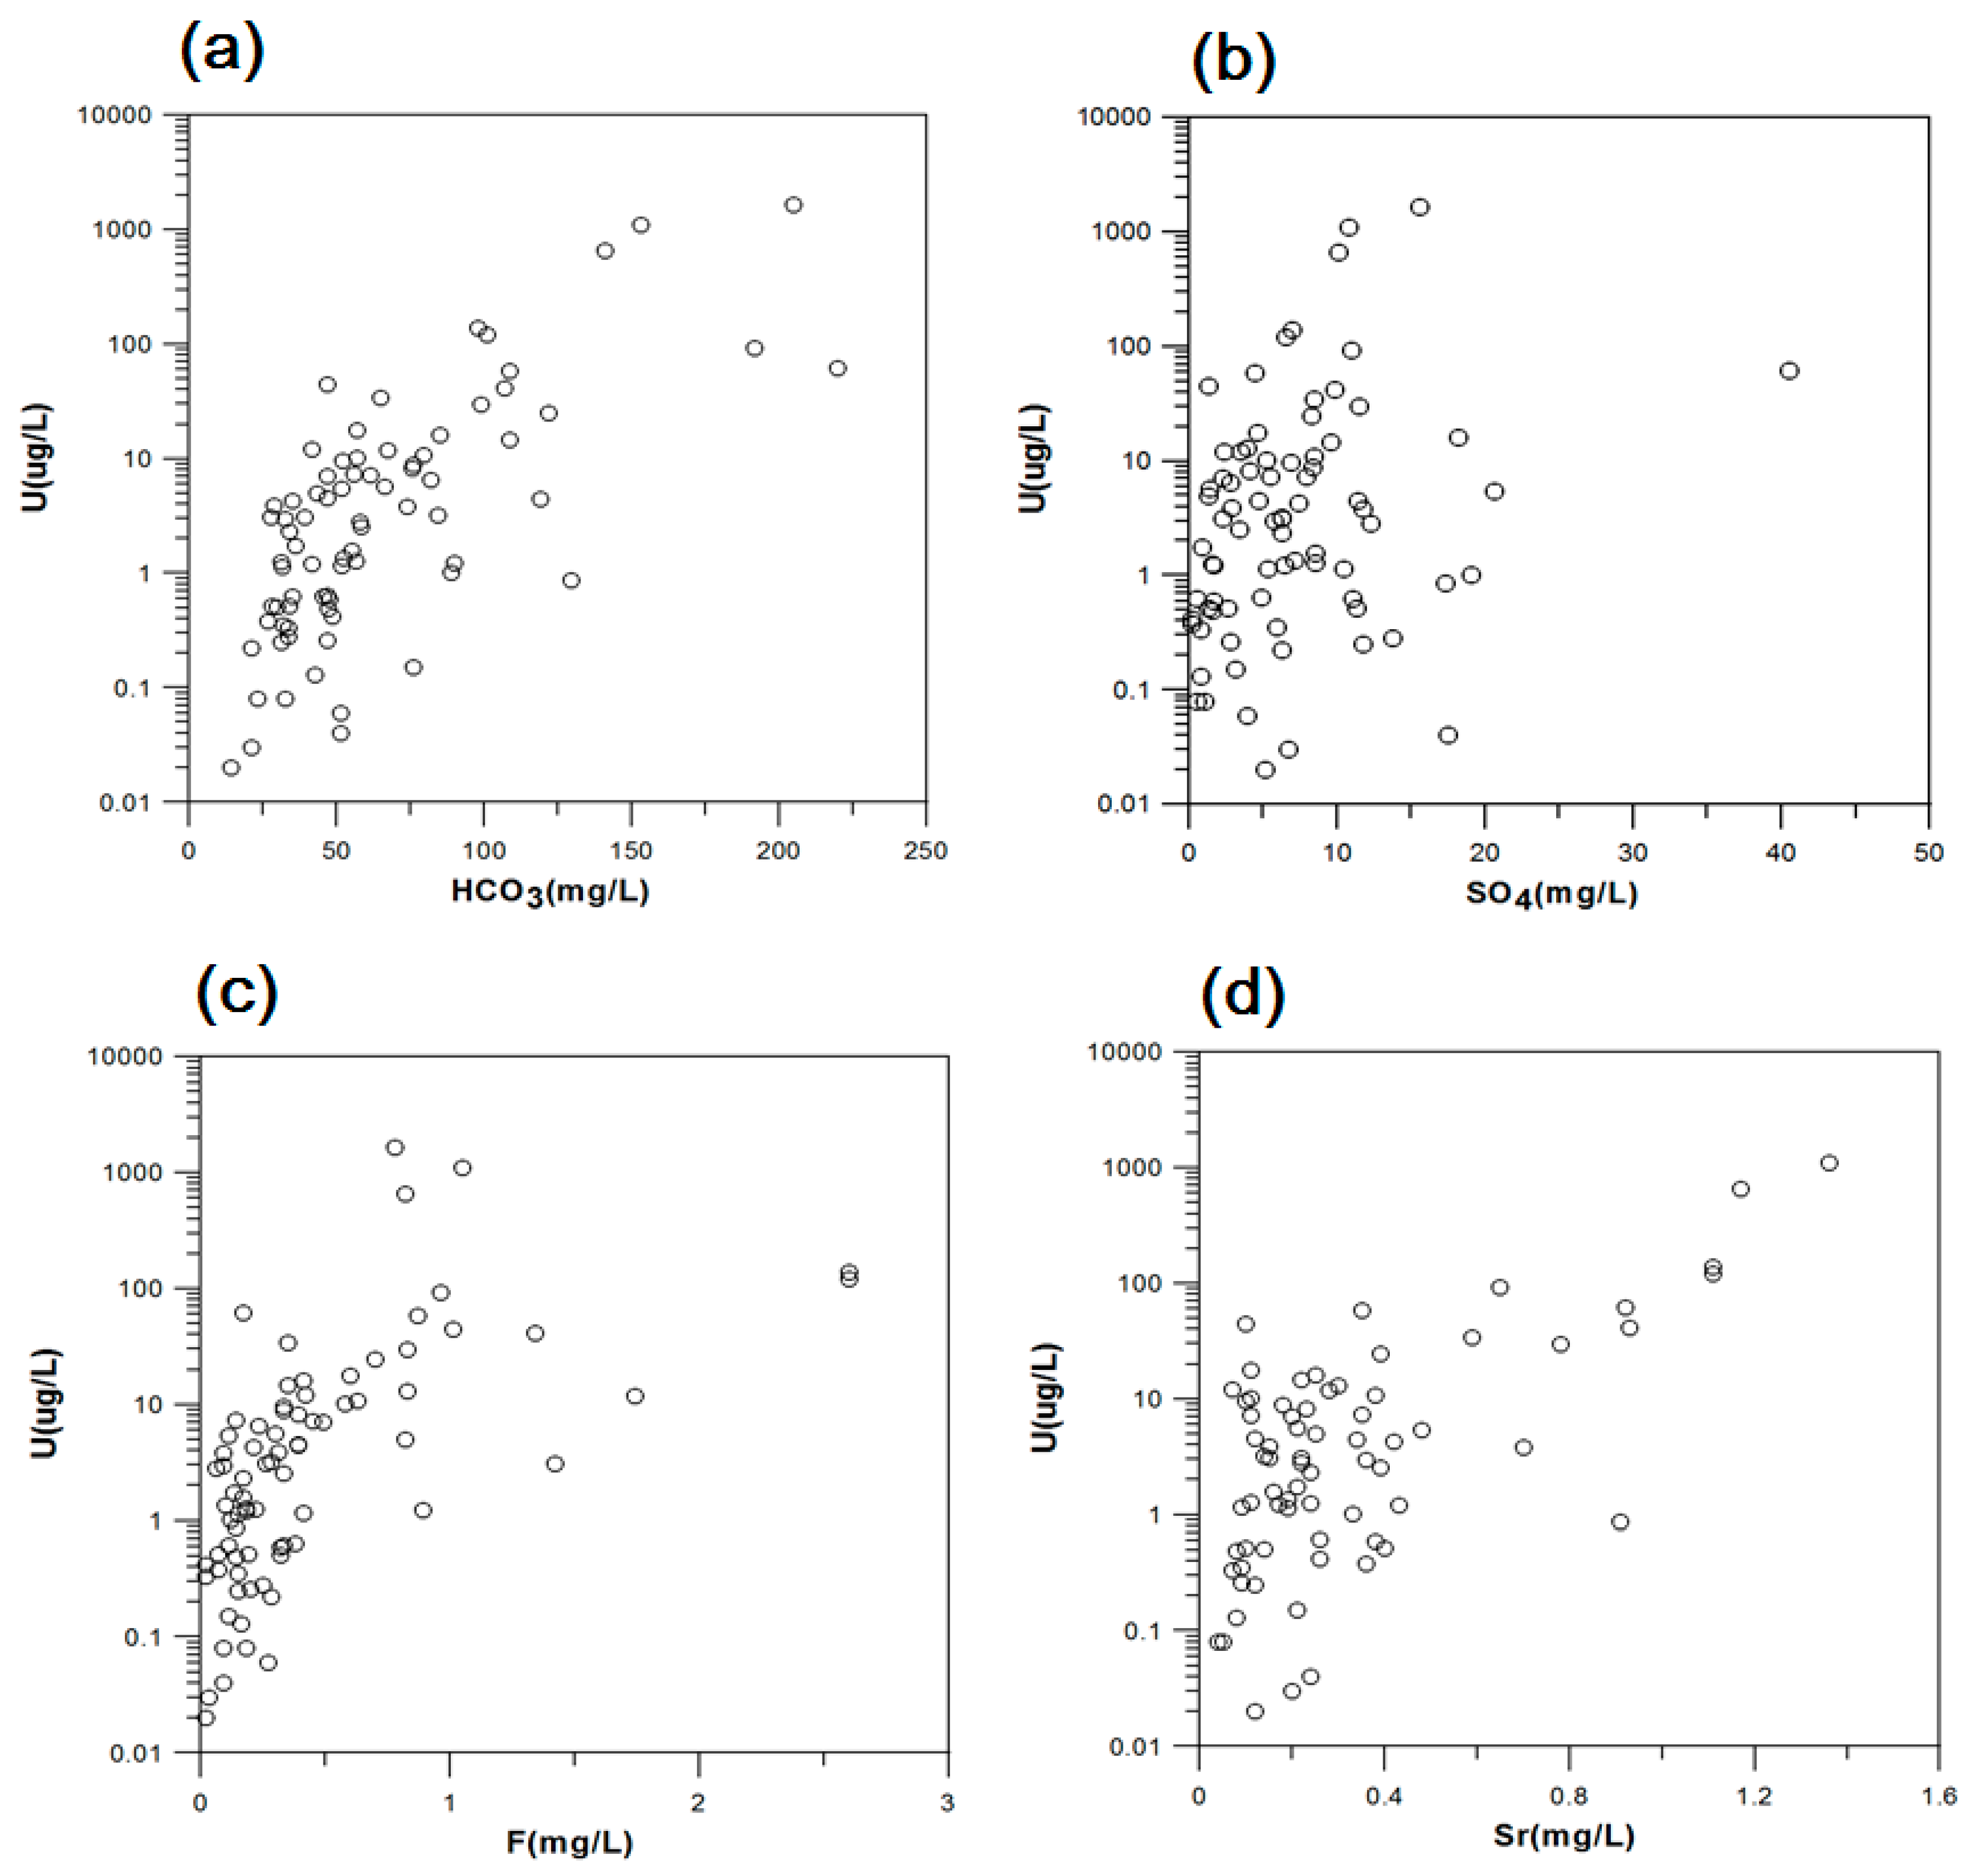
Uranium concentrations increase with increased certain cations and anions, some of which greatly contribute to EC. The bivariate plots of uranium and some components including HCO3−, SO42−, F−, and Sr show quite positive correlations, as shown in Figure 3. In the case of HCO3−, the correlation indicates that uranium species exists as uranyl-carbonate complex forms in aquifers [25]. It is unlikely that SO42− is derived from sulfate minerals including gypsum, anhydrite, or celestine (SrSO4) because the Jurassic granite has no such evaporite minerals. Rather, it is possible that SO42− was derived from sulfide minerals such as pyrite formed during the late stage of magma or hydrothermal alteration in granitic rocks. The other parameters were interpreted as originating from water–rock interactions. It is highly probable that fluorine originates from F-bearing minerals such as fluorite or micas in granite. Because Sr replaces Ca in carbonate minerals as fissure-fillings or coatings, or partly because it replaces Ca in plagioclase, Sr in groundwater is considered to originate from water–rock interactions. In summary, uranium concentrations in groundwater increase, resulting from water–rock interactions in Jurassic granite.
Uranium concentrations in groundwater varied significantly from place to place. In general, they were high in the central to northern areas, but even in these areas there was large variation (Figure 4). Such a heterogeneous spatial pattern of uranium concentration in groundwater renders us unable to track its distribution properties in groundwater of the Jurassic granite in Korea. For instance, some groundwater wells located 100–400 m away from wells with very high uranium concentrations (287–356 μg/L) only exhibited uranium concentrations of 1–6 μg/L in the same granite aquifer [17]. Likewise, even in adjacent wells in granitic aquifers of Finland, radionuclide concentrations differ by several orders of magnitudes [3]. Such results suggest that anomalously high uranium concentrations in groundwater are preferentially localized in the granite aquifer.
3.3. Radon Concentration and Spatial Distribution
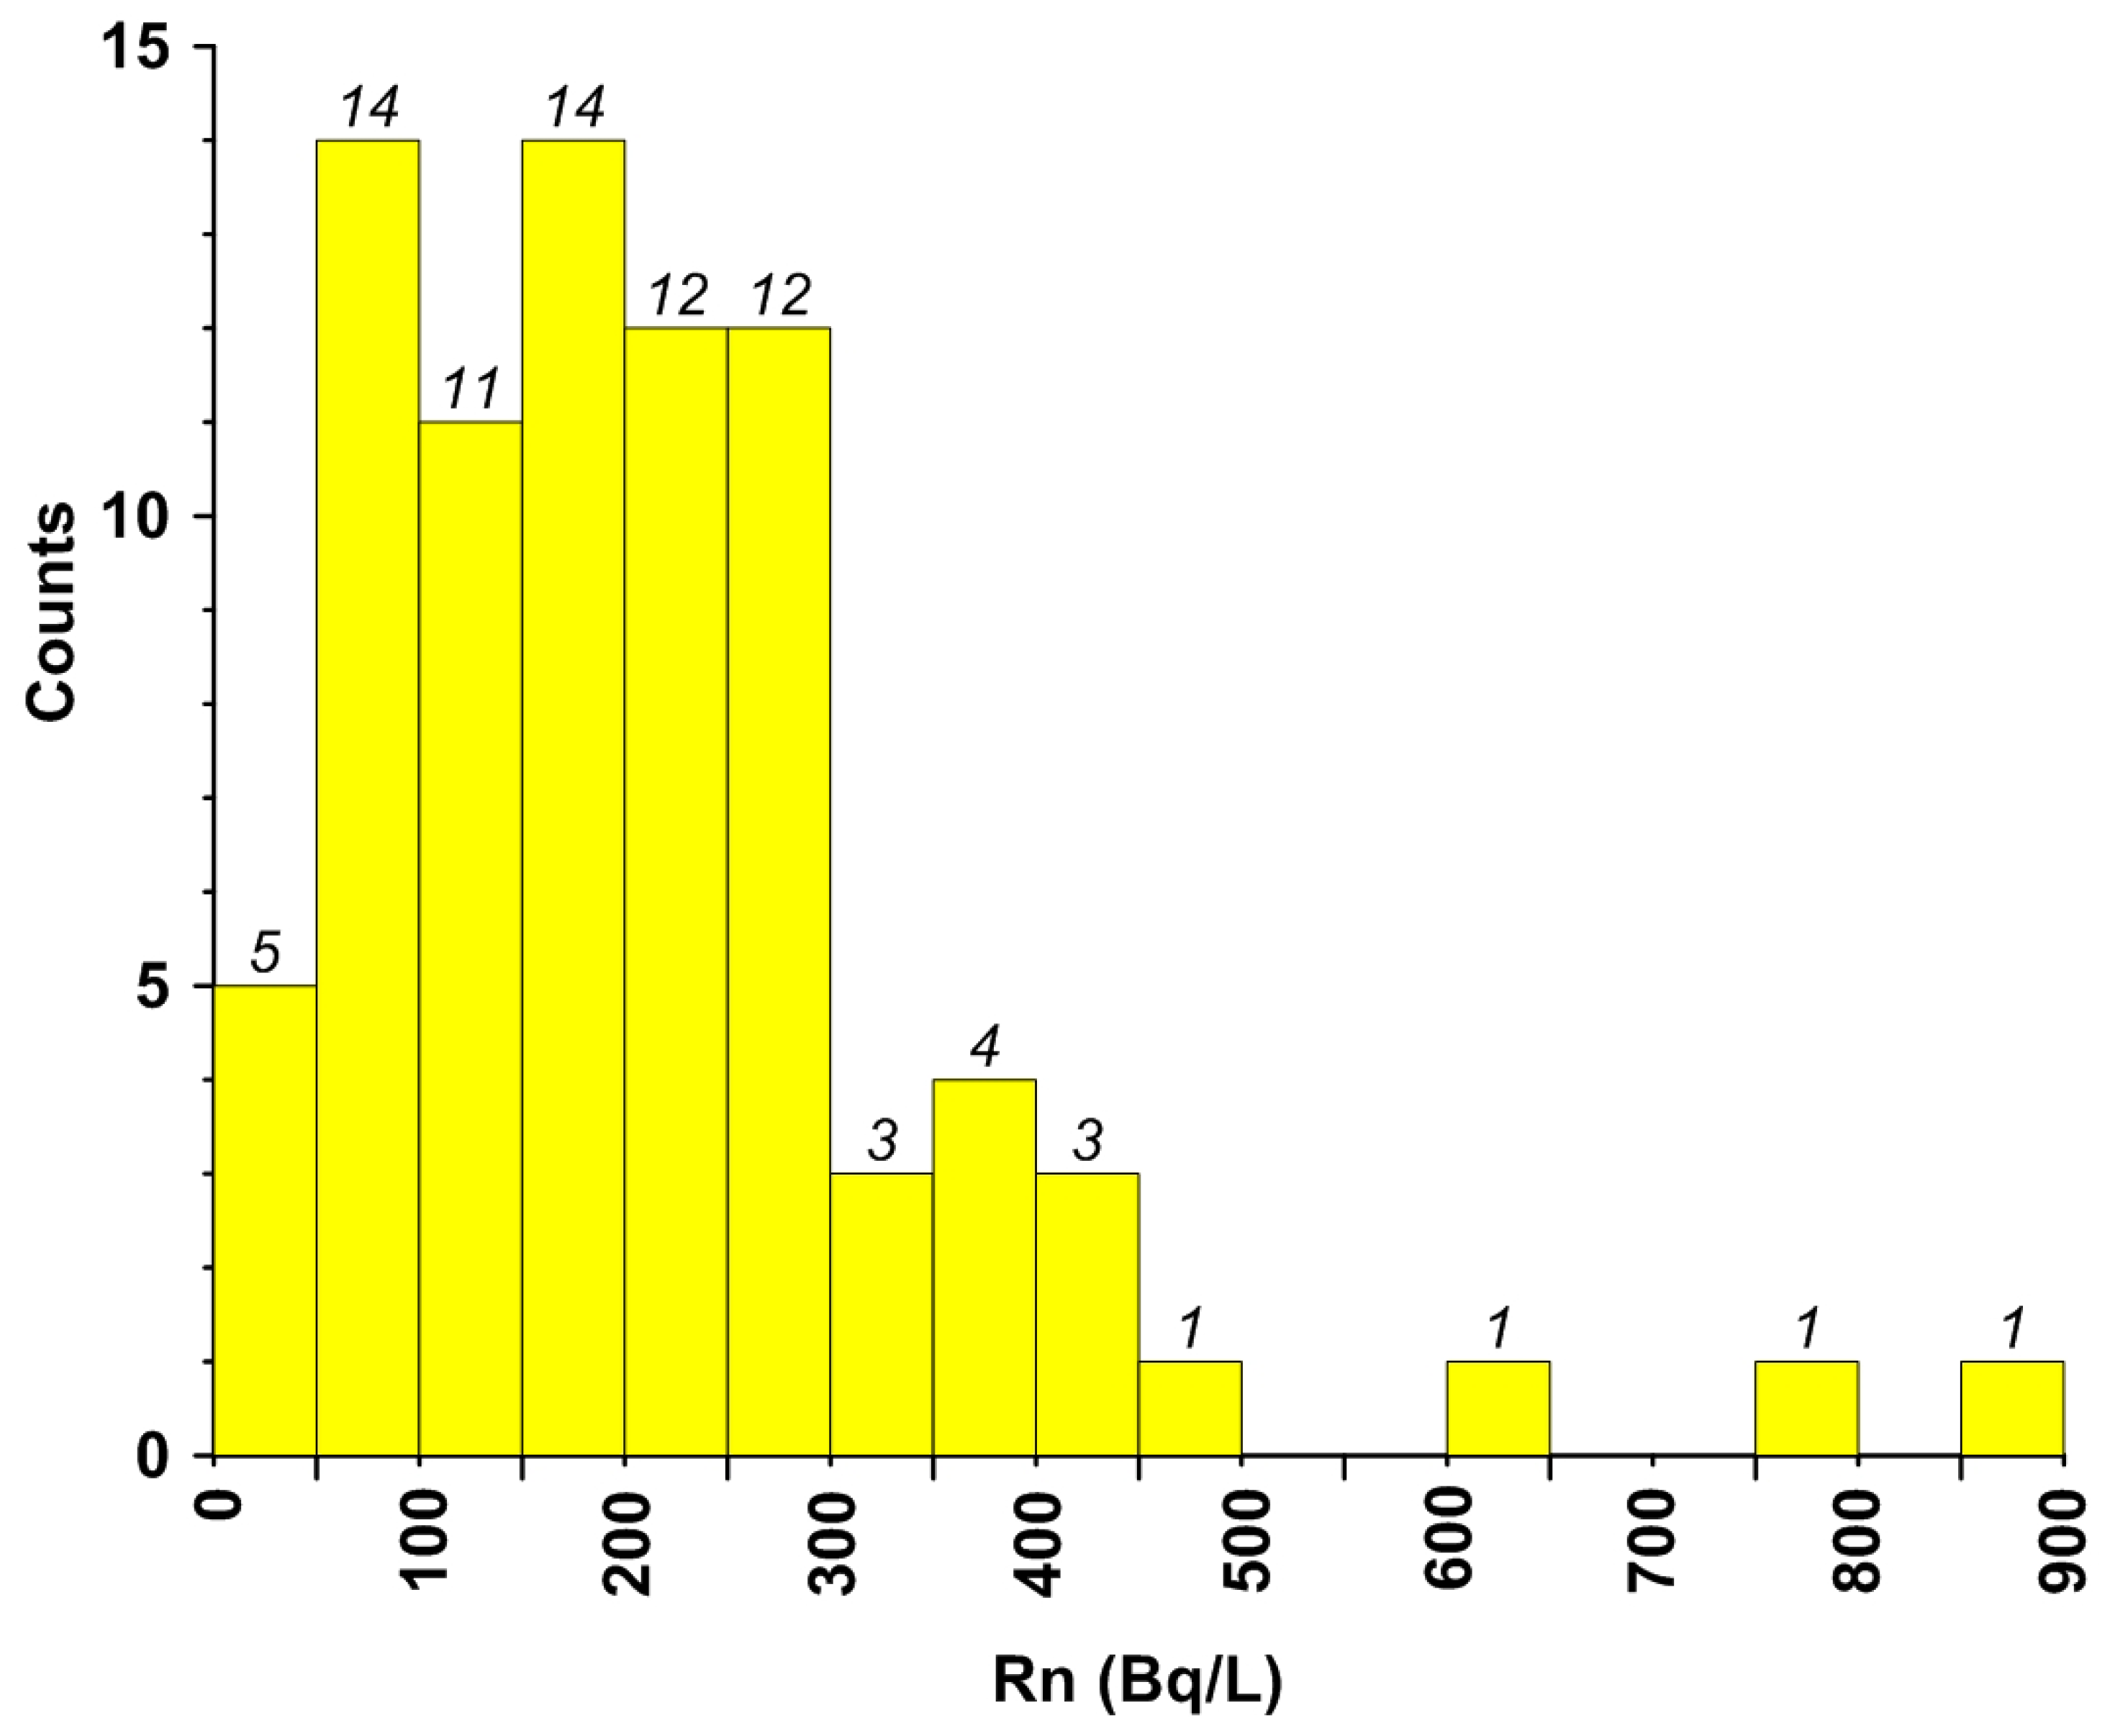
Radon concentrations also ranged widely, varying from 1.48 to 865.8 Bq/L (Table 1). The mean radon concentration was 211.29 Bq/L, with a median of 176.86 Bq/L and a standard deviation of 151.20 Bq/L. The differences between the mean and median radon concentrations in the study area are not significant in contrast with the uranium distributions. Radon concentrations in most samples are lower than 300 Bq/L (Figure 5). Regarding this, 64.6% the samples exceeded the alterntive maximum contaminant level (AMCL) limit of the EPA (that is, 4000 pCi/L or 148 Bq/L), a much higher proportion than the rate (18.1%) measured in 249 groundwater samples in Mesozoic granitic rocks [17]. The spatial distribution also varies by location, as shown in Figure 6. It is worth noting that sites with high radon concentrations are located near the boundary between bedrock and alluvium.
So far, it has been known that the highest radon level measured in Korea is 1665.37 Bq/L in groundwater in the Jurassic granite of the Daejeon area in central Korea [15,16,17,18], an area with some of the most popular hot springs in Korea. The high mean concentrations of radon in the study area are comparable to those in some groundwater sources in other Jurassic granite areas distributed in central Korea, for example, 123.54 Bq/L in Yeoju, 122.29 Bq/L in Anseong, and 98.61 Bq/L in Pocheon [15,16,17,18]. In the community groundwater system of Jurassic granite, the radon concentrations varied from 0.1 to 1635.9 Bq/L, with a mean of 137.9 Bq/L, a median of 103.0 Bq/L, and a standard deviation of 134.5 Bq/L, which were measured from 977 samples [10]. Overall, the mean radon level in groundwater from Icheon area was higher than that in most areas from other Jurassic granites.
3.4. Relationships between Uranium/Radon and pH/Eh
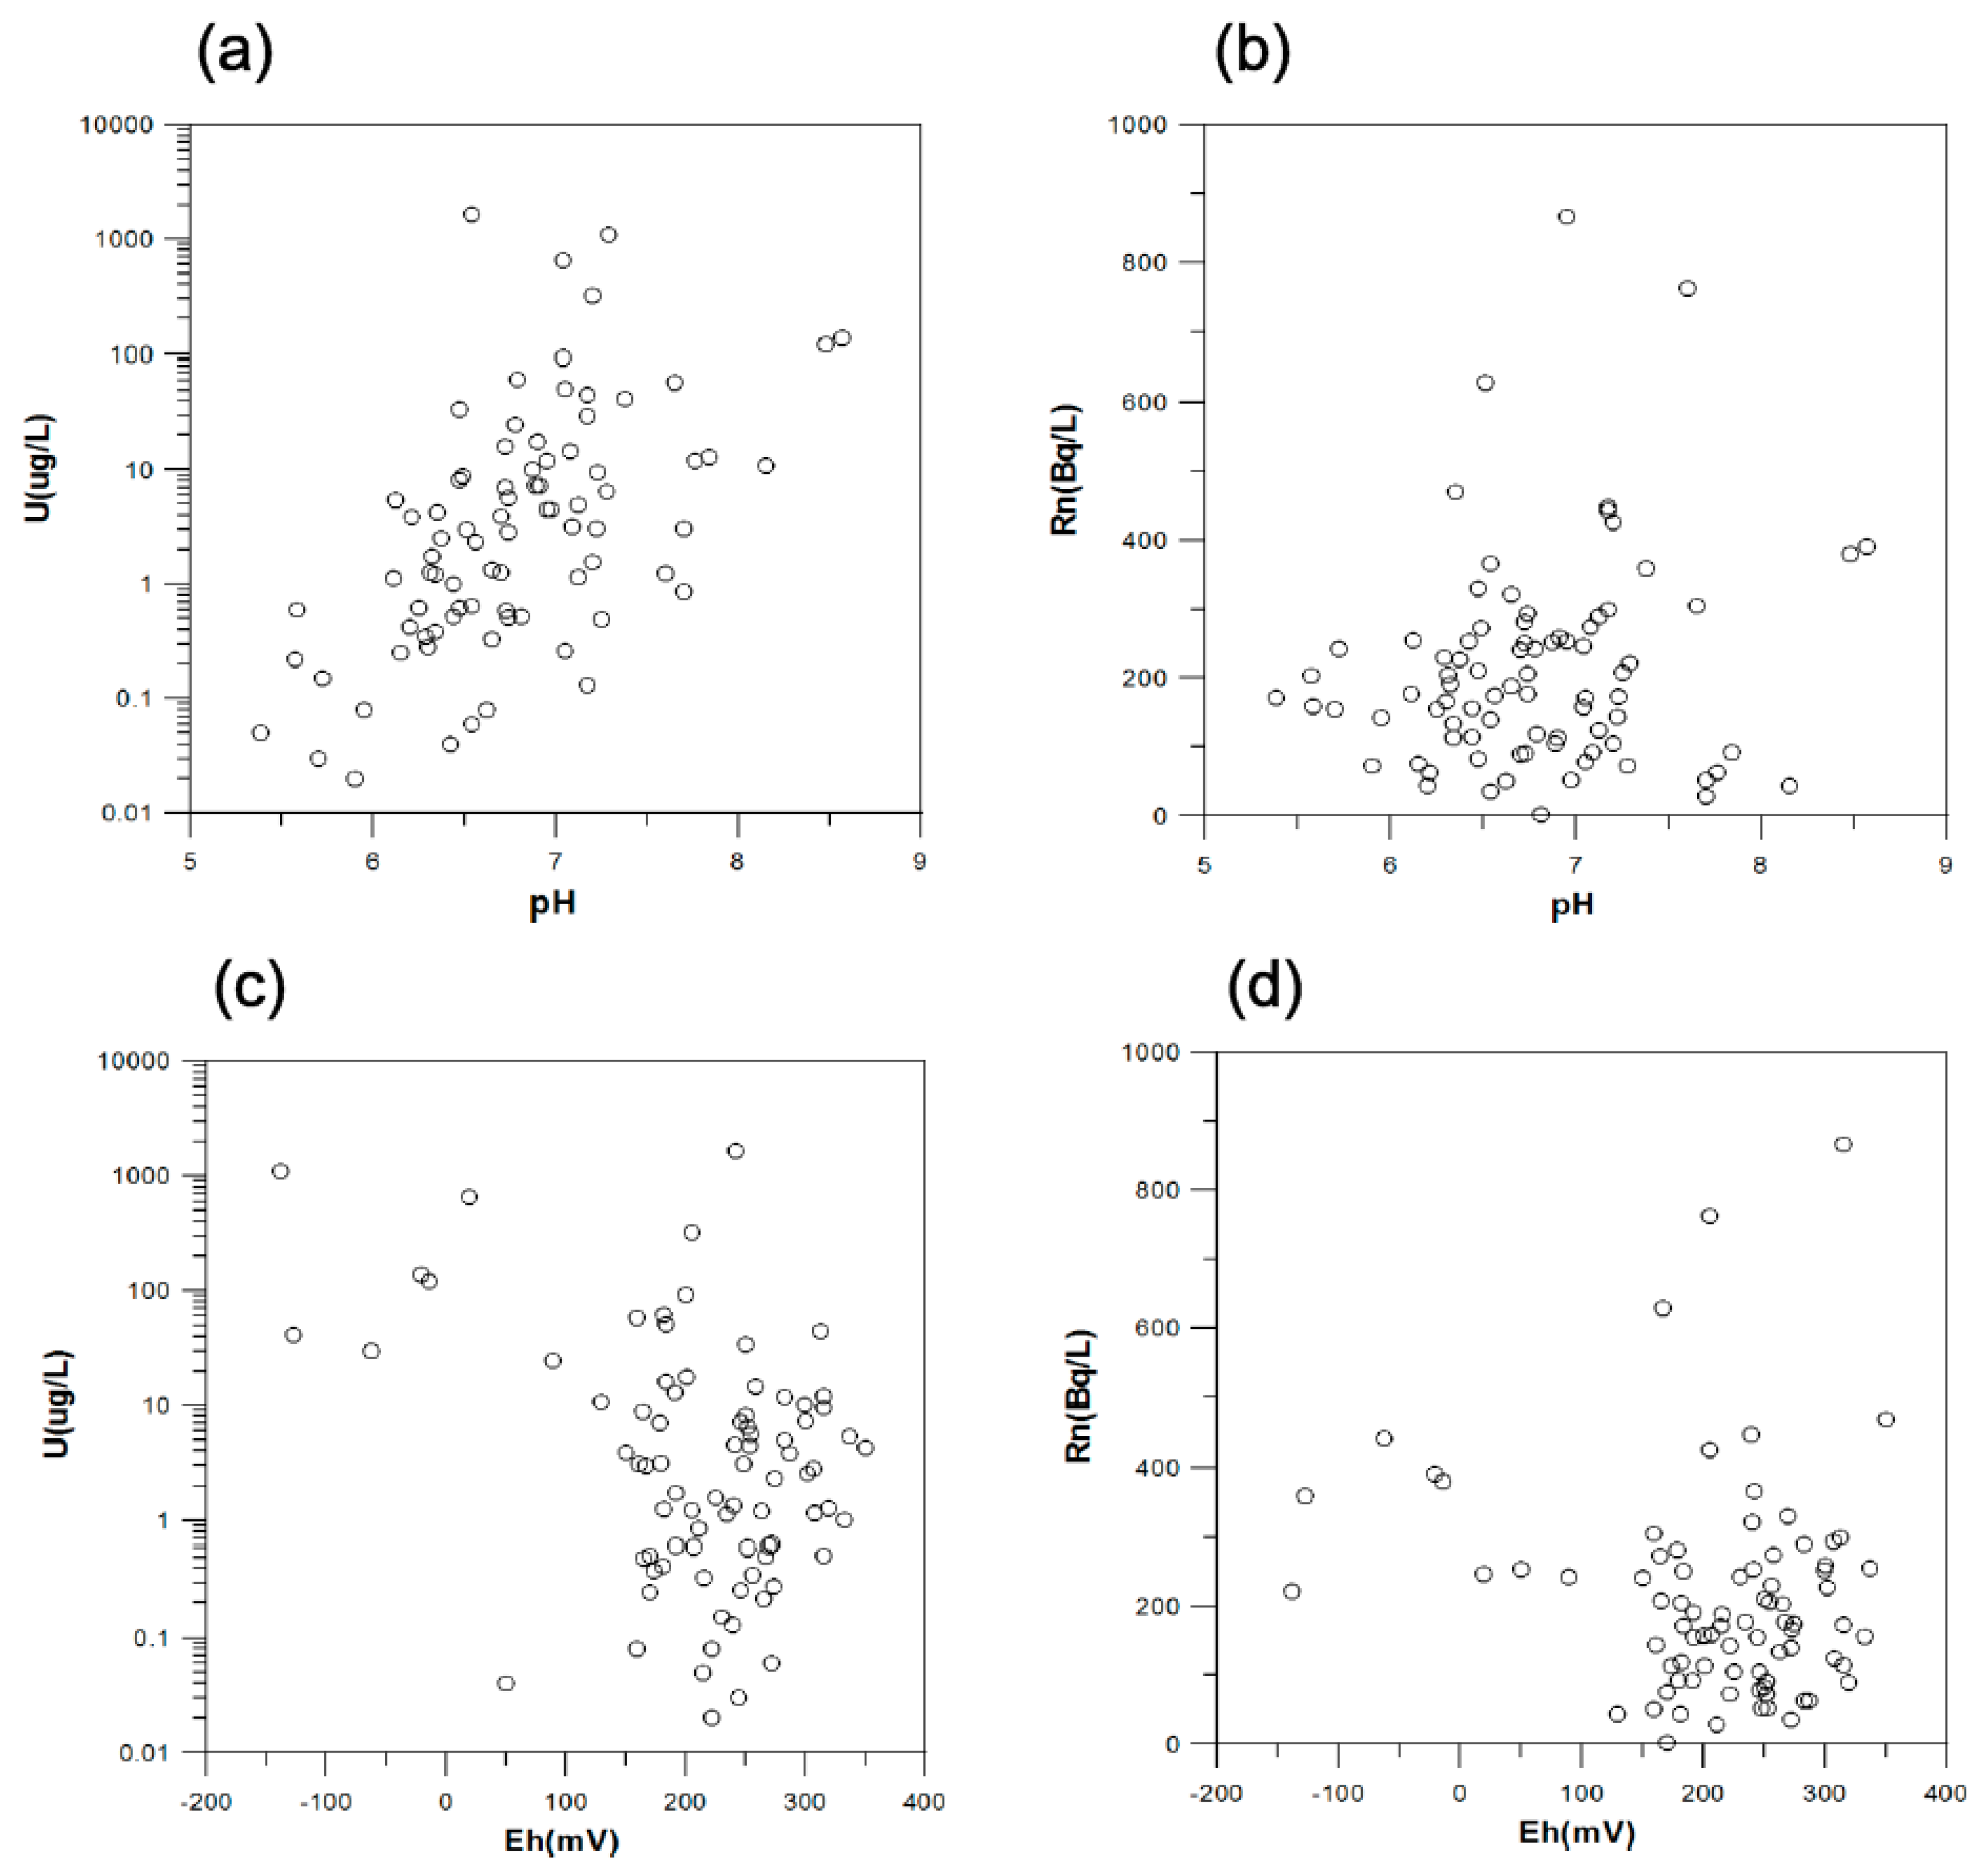
The pH and Eh in groundwater play an important role in controlling uranium mobility. Uranium is easily mobilized under oxidizing conditions, whereas it is immobilized under reducing conditions at a neutral pH [1]. Figure 7 shows some relationships between uranium and radon with respect to pH and Eh. The pH of groundwater ranges from slightly acidic to alkaline. Although the relationship is not clear, uranium concentrations are somewhat related to pH (Figure 7a). At a high pH, formation of uranium–carbonate complexes may accelerate uranium desorption from aquifer materials [26,27,28], giving rise to an increase in uranium in groundwater. That is, the concentrations are higher in neutral pH ranges than in slightly acidic ranges. No relationship between radon and pH was found because radon behaves independently (Figure 7b). There was no correlation between uranium concentrations and Eh (Figure 7c). In principle, the aqueous uranium concentration is lower under reducing conditions, due to the reduction of U(VI) and formation of U(IV) minerals with low solubility [2]. However, some high-uranium samples are in the low-Eh region in this study.
Under neutral to alkaline pH ranges and oxidative Eh ranges, the most dominant U(VI) uranyl species is the uranyl–carbonate complex UO2(CO3)22− in groundwater [1,28,29,30,31]. Therefore, uranyl–carbonate complexes tend to enhance the mobility of the uranyl ion under such conditions. Because uranium concentrations increase with increasing bicarbonate (HCO3−), the uranyl–carbonate complex plays an important role in controlling uranium concentrations in groundwater. There is no correlation between radon and Eh (Figure 7d), although a few samples with high radon concentrations are scattered in the high-Eh region. Because radon can easily migrate through porous media in the aquifer, it seems that Eh conditions do not strongly influence radon mobility. In summary, pH is closely related to uranium, but Eh has little effect on it. In contrast to the behavior of uranium, radon is not influenced by pH and Eh in groundwater.
3.5. Statistical Analyses of Groundwater
3.5.1. Correlation Coefficients
As summarized in Table 2, the correlation coefficient between uranium and radon is very low at 0.05, demonstrating that they seem to behave independently in groundwater. Hence, the elevated uranium levels do not always indicate high radon levels and vice versa [3,32,33,34]. In particular, radon concentrations in groundwater are highly variable depending on aquifer geology, water quality, and pumping characteristics [4,15,16,17,18].
Pearson’s correlation coefficients among hydrogeological components indicate that uranium is positively associated with Sr (0.63), HCO3− (0.45), K+ (0.31), Ca2+ (0.30), and F− (0.30), whereas it is negatively related with Eh (−0.54), DO (−0.51), and SiO2 (−0.44). The moderate correlation between uranium and HCO3− implies the presence of uranium-rich carbonates [3]. Because trace carbonates are commonly found as veinlets or fracture-coating minerals in Jurassic granite [34], uranium–carbonate complexes may easily form in groundwater.
Radon concentrations were not correlated with most hydrochemical components. As shown in Table 2, the correlation coefficients between radon and hydrochemical components were very low, mostly less than ±0.15, except for F (0.23), K (0.22), and SiO2 (−0.21). Overall, this pattern indicates that radon shows independent behavior with respect to most components in groundwater. However, some elements including F, K, and Si slightly contribute to radon concentrations, though negligible. Particularly, fluorine (F) is one of the most incompatible elements in granite, together with radioactive elements with large-ion lithophile elements (LILE) such as U and Th, all of which are preferentially concentrated on the late stage or pegmatite during magmatic evolution. The relationship of radionuclides and F is positive as water–rock interactions take place in Jurassic granite. High F and alkalinity concentrations in groundwater were found to be hydrogeochemical markers for elevated radon concentrations in fractured bedrock aquifers [35].
3.5.2. Factor Analysis
Factor analyses can also be used to extract important information on the relationships between the chemical components of groundwater and lithology [36,37,38,39]. Table 3 shows the results of R-mode factor analyses, where eigenvalue, cumulative eigenvalue, % variance explained, and cumulative % variance were illustrated with several factor loadings. Four factors were extracted and accepted as principal components for the present study. These four factors account for 78.69% of the total variance, which means that not a single strong factor significantly controls groundwater chemistry. That is, the main variables affecting the groundwater chemistry are largely dependent upon factor 1 and factor 2, which contribute to 63.74% of the total variance.
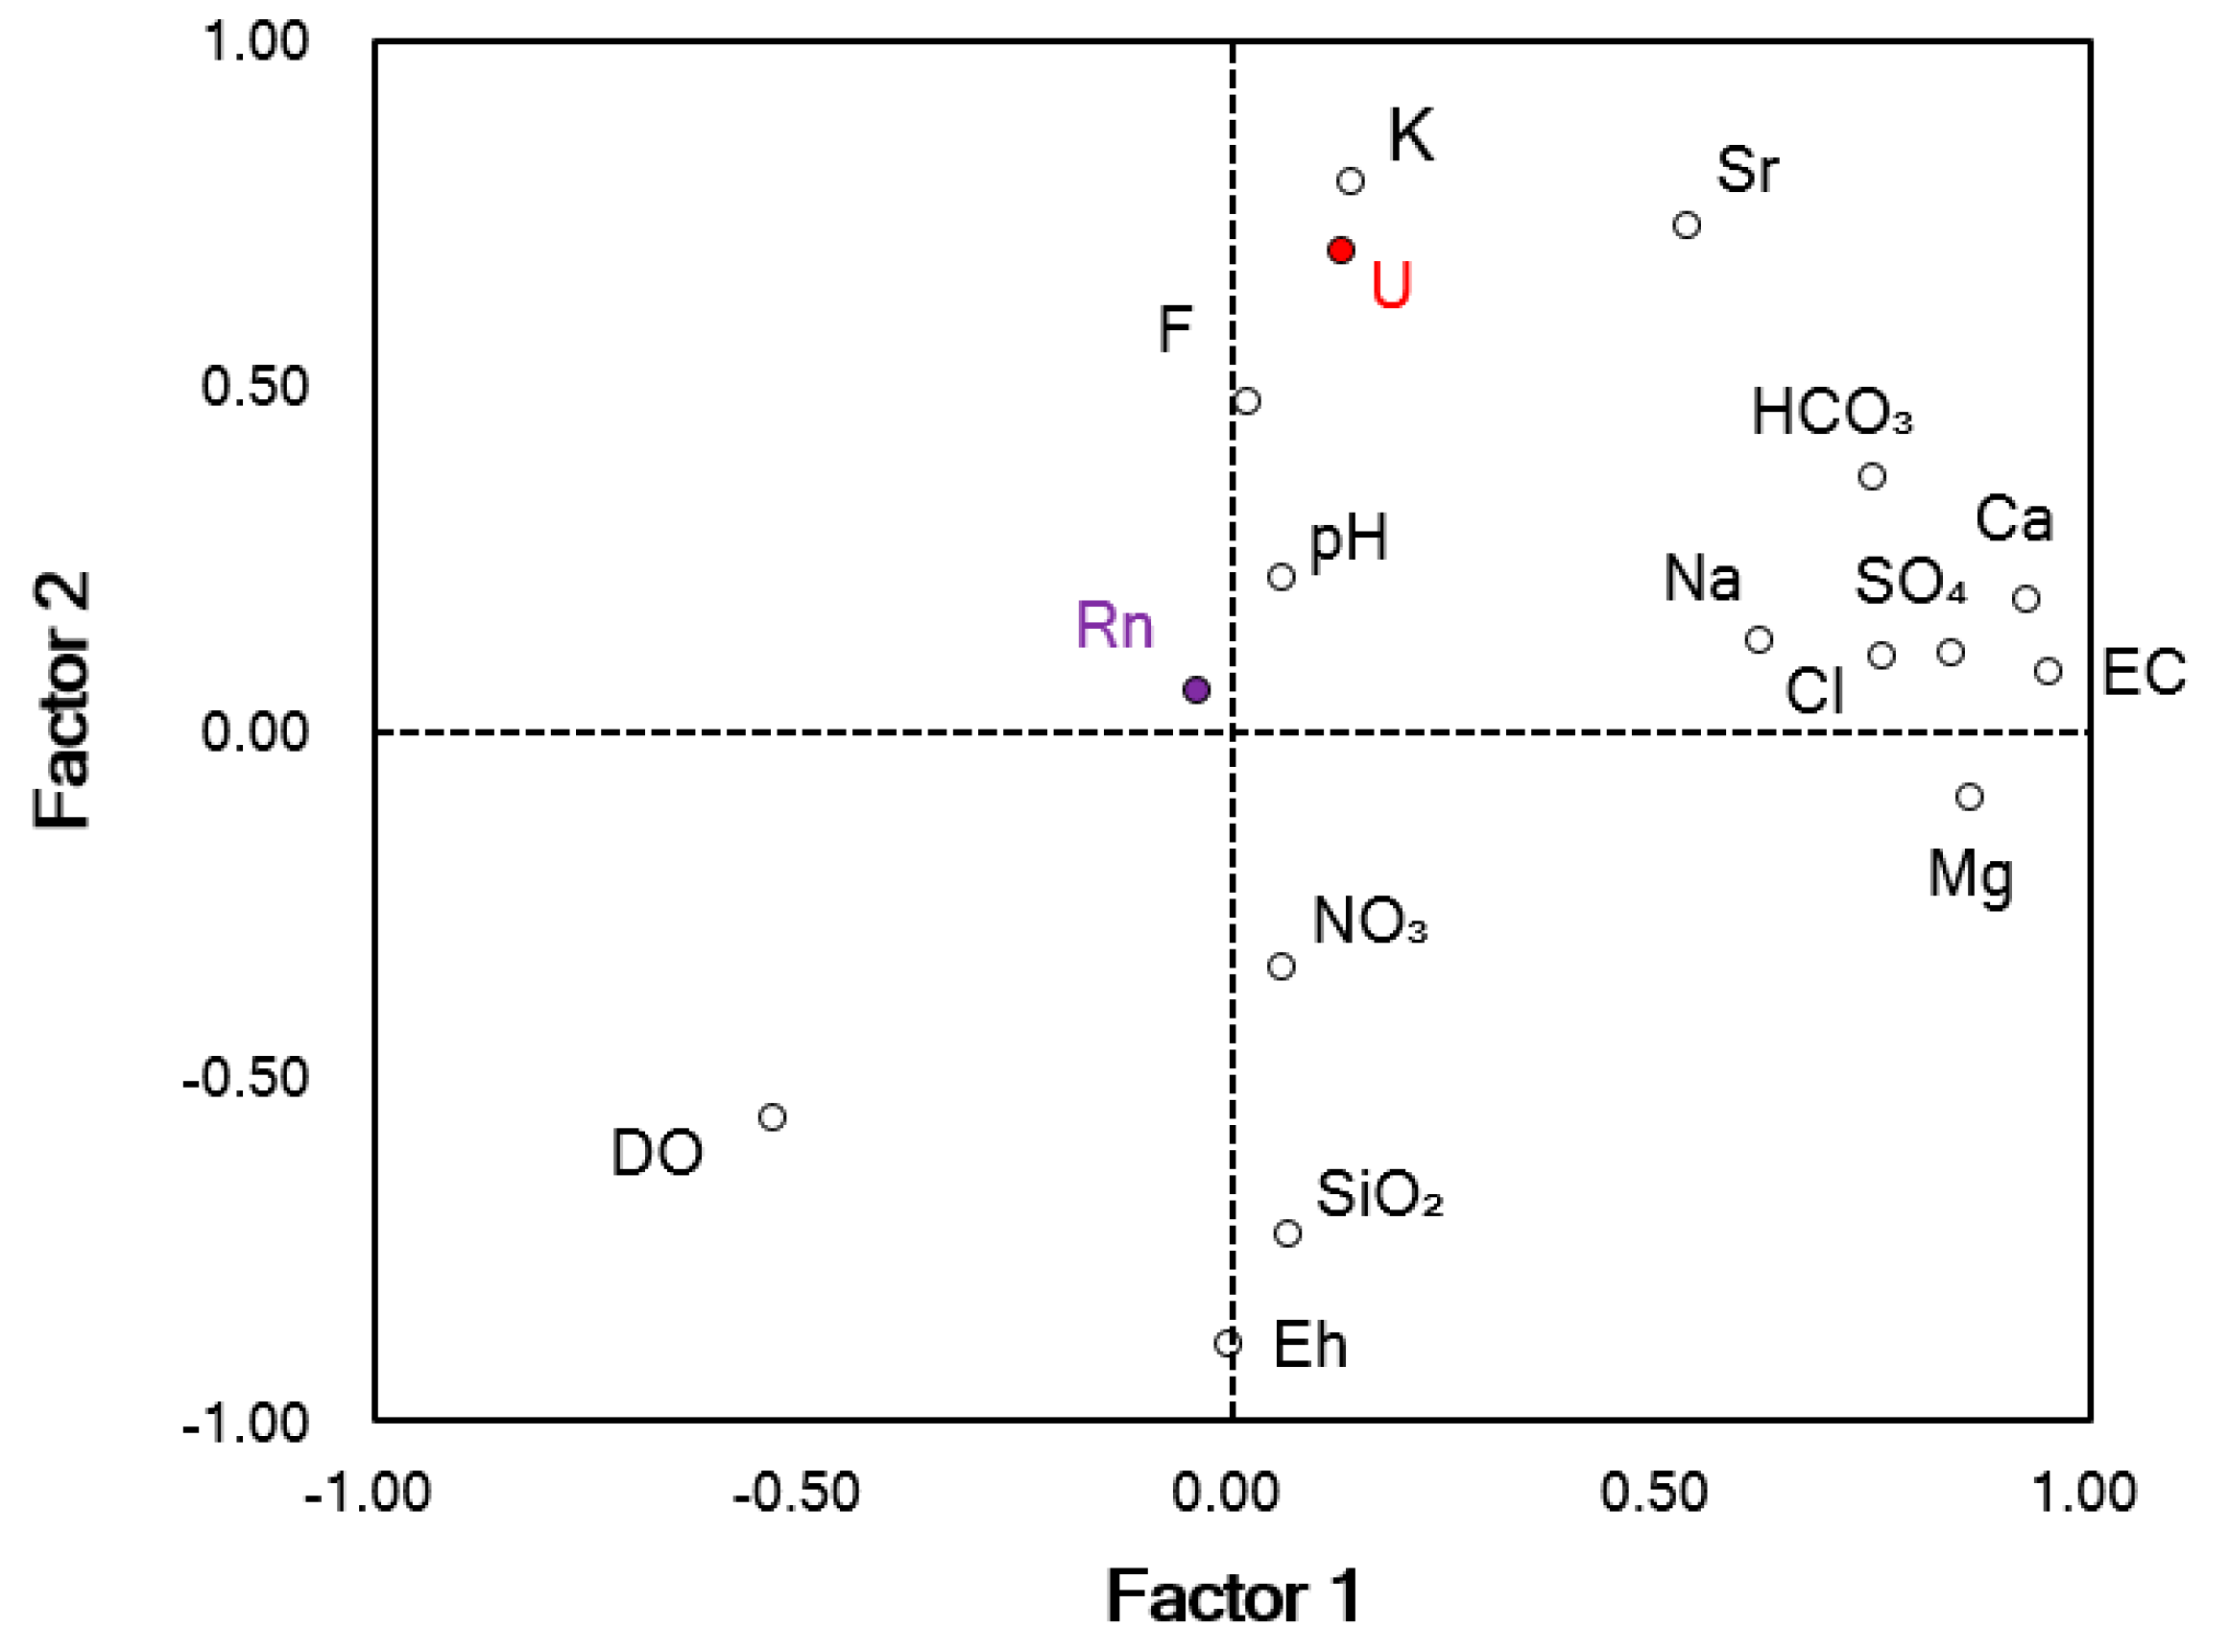
Figure 8 shows the plot of loadings considering two strong factors. It can be seen that some relationships among hydrogeological components are controlled by the two factors. EC, Ca2+, SO42−, Mg2+, Cl−, HCO3−, and Na+ have similar mobility behaviors, which are largely affected by factor 1. A close association of uranium with K and F can be seen with factor 2. Eh, SiO2, and DO have negative loadings by factor 2. Interestingly, radon is not affected by factor 1 and factor 2 at all.
As illustrated in Table 3, factor 1 contributes to 38.13% of the total variance, showing strong positive loadings on EC (0.95), Mg2+ (0.86), SO42− (0.84), Cl− (0.76), HCO3− (0.75), and Na+ (0.62). These are the main components that affect water hardness and may be attributed to geochemical sources such as Ca-bearing minerals and sulfate minerals. Factor 2 accounts for 25.61% of the variance and has a strong loading on K+ (0.79), Sr (0.73), U (0.69), Eh (−0.89), and SiO2 (−0.73). These elements may be attributed to dissolution of minerals such as micas and plagioclase in granitic rocks. Factor 3 accounts for 8.35% of the variance and have high loadings on NO3− (0.78), Na+ (0.67), and pH (−0.70). This suggests possible contamination of groundwater by anthropogenic or organic sources. Factor 4 accounts for 6.61% of the variance with a high loading on Rn (0.80), though its contribution to the total chemistry is quite small. Moderate-high variable loadings on F (0.57) and pH (0.48) are found, suggesting water–rock interactions in silicate-rich rocks. It is important to note that radon is nearly independent of factor 1 and factor 2, which means that there are no correlations between Rn and most components. This is also evidenced by correlation coefficients matrix.
3.6. Geochemical Implications for Jurassic Granite Aquifer
Apart from the hydrochemical data, the water type of Ca-HCO3 indicates that aquifers are generally oxidized under alkaline environments, which favors high mobility of uranium. Increased alkalinity and pH may increase uranium concentrations in groundwater because the desorption process from aquifer materials enhances uranium leaching [27]. The occurrence of carbonates as facture-coating minerals in Jurassic granite is common, consistent with correlations of U with HCO32− and Ca in groundwater. Since the uranium level is negatively constrained by DO and Eh, it can be inferred that high uranium was derived, not from swallow aquifer, but from moderate to deep aquifers, though it might be present as an insoluble species. Likewise, there is a decrease in the uranium level with increasing oxidizing condition [40].
Mostly uraniferous minerals in Jurassic granites occur as partial replacements in some accessory mineral phases such as monazite and apatite, or in rock-forming minerals such as feldspars and micas [41,42]. In addition, Jurassic granite of Daejeon, middle Korea includes a small amount of uraniferous minerals such as uraninite, coffinite, and uranophane in hydrothermal alteration zone which contains quartz veinlets within a fracture zone or dikes, in association with muscovite, chlorite, epidote, and calcite [24]. The solubility of radionuclides trapped in trace minerals is diverse and complicated and depends on geochemical conditions such as pH, Eh, alkalinity, adsorption/desorption, precipitation, and saturation index. Hence, the mechanism of uranium leaching from Jurassic granite is complex, though its amount is very small.
In the study area of Jurassic granite aquifer, high uranium concentrations did not coincide with high radon concentrations. A local lack of correlation between uranium and radon in bedrock and groundwater was similarly recorded in Helsinki, Finland [12] because the high radioactivity was caused mostly by uranium mineralization deposited in fissures of the bedrock.
Uranium, radium, and radon are transported by different mechanisms in groundwater because radon is a kind of volatile gas [43]. Hence, the high uranium concentrations in groundwater did not indicate elevated radon concentrations, giving rise to a high discrepancy between U and Rn in waters of the granite area, possibly due to trace uranium-bearing carbonate coatings in fractures [3]. Uranium could not explain the distribution of radon in groundwater [25]. No direct correlation was found between uranium concentration and radon concentration in water samples in sedimentary rocks near large rivers, India [44].
Although radon concentrations in groundwater are fundamentally dependent on emanation coefficients and time related to its short half-life, they change through aquifers [11,45,46,47]. Radon emanation coefficients are controlled in large part by the density and porosity of rock or soil [43], together with radium concentration as source element of radon. In principle, the concentrations of uranium, thorium, and radon in bedrock groundwater can be correlated with geological province and lithology [48]. However, radon does not show correlations with most geochemical parameters, though radon is basically derived from uranium in rocks [47]. Because the hydrochemistry of radionuclides is dominated by hydrodynamic factors, redox, pH conditions, and interactions between various dissolved species rather than purely by lithological content of uranium and thorium, the correlation between rock and groundwater may not exist [49].
The spatial fluctuations and ranges in uranium and radon concentrations in groundwater are very large in the Icheon area, as in granitic aquifers in Finland [3]. High concentrations of radionuclides in groundwater from Jurassic granite might be confined to very limited areas, possibly due to the presence of veinlets or a narrow alteration zone containing uranium minerals. Thick alluvium and intensively weathered soil zones developed in Jurassic granite favor porous media, which may help explain the complicated mobility and poor relationships among radionuclides, although water–rock interactions in granitic aquifer are considered important factors affecting groundwater chemistry in Jurassic granitic terrain of Korea.
Further investigations are still needed for better understanding geochemical behaviors of uranium and radon in groundwater from Jurassic granite areas, using mineralogical analyses on source rocks, isotopic methods including 234U/238U ratios and sulfur isotopes, and geochemical modeling for complexation with uranium species in groundwater.
4. Conclusions
Concentration distributions of uranium in groundwater ranged widely but most samples had very low levels. For radon, its concentration was independent or irrespective of most components in groundwater. No significant correlation was found between uranium and radon. Uranium concentrations in groundwater increased with increasing water–rock interactions. Radon migrated independently with respect to most factors. Anomalously high uranium and radon concentrations in groundwater are preferentially localized in granite areas and spatial distributions are remarkably heterogeneous. Contributions of anomalously high uranium and radon to the mean values are so significant that much attention must be given to interpreting hydrochemical properties of radionuclides in groundwater in areas with Jurassic granite.
Author Contributions
C.O.C. and B.W.C. prepared the article. They were responsible for field works, sample preparation, and data analyses.
Funding
This work was supported by the Korea Institute of Geosciences and Mineral Resources (Gp2015-014-2016(2)) and the National Institute of Environmental Research (NIER-SP2015-386).
Conflicts of Interest
The authors declare no conflict of interest. The funders had no role in the design of the study; in the collection, analyses, or interpretation of data; in the writing of the manuscript; or in the decision to publish the results.
References
- Langmuir, D. Actinides and Their Daughter and Fission Products. In Aqueous Environmental Geochemistry; Prentice Hall Inc.: Upper Saddle River, NJ, USA, 1997; pp. 486–557. [Google Scholar]
- Alam, M.S.; Cheng, T. Uranium release from sediment to groundwater: Influence of water chemistry and insights into release mechanisms. J. Contam. Hydrol. 2014, 164, 72–87. [Google Scholar] [CrossRef] [PubMed]
- Lahermo, P.; Juntunen, R. Radiogenic elements in Finnish soils and groundwaters. Appl. Geochem. 1991, 6, 169–183. [Google Scholar] [CrossRef]
- Cho, B.W.; Sung, I.H.; Cho, S.Y.; Park, S.K. A preliminary investigation of radon concentrations in groundwater of South Korea. J. Soil Ground. Environ. 2007, 12, 98–104. [Google Scholar]
- Prat, O.; Vercouter, T.; Ansoborlo, E.; Fichet, P.; Perret, P.; Kurttio, P.; Salonen, L. Uranium speciation in drinking-water from drilled wells in southern Finland and its potential links to health effects. Environ. Sci. Technol. 2009, 43, 3941–3946. [Google Scholar] [CrossRef] [PubMed]
- Thivya, C.; Chidambaram, S.; Tirumalesh, K.; Prasanna, M.V.; Thilagavathi, R.; Nepolian, M. Occurrence of the radionuclides in groundwater of crystalline hard rock regions of central Tamil Nadu, India. J. Radio. Nucl. Chem. 2014, 302, 1349–1355. [Google Scholar] [CrossRef]
- Thivya, C.; Chidambaram, S.; Keesari, T.; Prasanna, M.V.; Thilagavathi, R.V.S.; Adithya, V.S.; Singaraja, C. Lithological and hydrochemical controls on distribution and speciation of uranium in groundwaters of hard-rock granitic aquifers of Madurai District, Tamil Nadu (India). Environ. Geochem. Health 2016, 38, 497–509. [Google Scholar] [CrossRef] [PubMed]
- Cho, B.W.; Choo, C.O.; Kim, M.S.; Hwang, J.H.; Yun, U.; Lee, S. Spatial relationships between radon and topographical, geological, and geochemical factors and their relevance in all of South Korea. Environ. Earth Sci. 2015, 74, 5155–5168. [Google Scholar] [CrossRef]
- Yun, U.; Kim, T.S.; Kim, H.K.; Kim, M.S.; Cho, S.Y.; Choo, C.O.; Cho, B.W. Natural radon reduction rate of the community groundwater system in South Korea. Appl. Rad. Isotopes 2017, 126, 23–25. [Google Scholar] [CrossRef]
- Cho, B.W.; Kim, H.K.; Kim, M.S.; Hwang, J.H.; Yoon, U.; Cho, S.Y.; Choo, C.O. Radon concentrations in the community groundwater system of South Korea. Environ. Monit. Assess. 2019, 191, 181–190. [Google Scholar] [CrossRef]
- Knutsson, G.; Olofsson, B. Radon content in groundwater from drilled wells in the Stockholm region of Sweden. Norg. Geol. Under. Bull. 2002, 439, 79–85. [Google Scholar]
- Asikainen, M.; Kahlos, H. Anomalously high concentration of uranium, radium and radon in water from drilled wells in the Helsinki region. Geochim. Cosmochim. Acta 1979, 43, 1681–1686. [Google Scholar] [CrossRef]
- Frengstad, B.; Midtgard, A.K.; Banks, D.; Krog, R.K.; Siewers, U. The chemistry of Norwegian groundwater III. The distribution of trace elements in 476 crystalline bedrock groundwaters, as analyzed by ICP-MS techniques. Sci. Total Environ. 2000, 246, 21–40. [Google Scholar] [CrossRef]
- Jobbágy, V.; Altzitzoglou, T.; Malo, P.; Tanner, V.; Hult, M. A brief overview on radon measurements in drinking water. J. Environ. Radio. 2017, 173, 18–24. [Google Scholar] [CrossRef] [PubMed]
- National Institute of Environmental Research (NIER). Study on the Radionuclide Concentrations in Groundwater (I); KIGAM Report; Ministry of Environment of Korea: Seoul, Korea, 1997; p. 338.
- National Institute of Environmental Research (NIER). A Detailed Study on the Radionuclide Concentrations in the Groundwater (II); NIER Report; Ministry of Environment of Korea: Seoul, Korea, 2009; p. 273.
- National Institute of Environmental Research (NIER). Study on the Naturally Occurring Radionuclides in Groundwater of the Two High Potential Areas; KIGAM Report; Ministry of Environment of Korea: Seoul, Korea, 2011; p. 253.
- National Institute of Environmental Research (NIER). Studies on the Naturally Occurring Radionuclides in Groundwater; KIGAM Report; Ministry of Environment of Korea: Sejong, Korea, 2016; p. 213.
- Ministry of Environment (MOE). Standards for Drinking Water Quality. Ministry of Environment of Korea; Legislation 792 (acted on 1 January, 2019). Available online: http://www.law.go.kr/lsInfoP.do?urlMode=lsInfoP&lsId=007134#AJAX. (accessed on 20 April 2019).
- Korea Institute of Geoscience and Mineral Resources (KIGAM). Geological Report of the Icheon Sheet (1:50,000); KIGAM Report; Geological and Mining Institute Korea: Seoul, Korea, 1974.
- Freeze, R.A.; Cherry, J.A. Groundwater; Prentice Hall Inc.: Englewood Cliffs, NJ, USA, 1979. [Google Scholar]
- Cho, B.W.; Yun, U.; Choo, C.O. Uranium and radon concentration in groundwater of the Taejeon area, Korea. In Proceedings of the Groundwater Quality Sustainability, Krakow, Poland, 12–17 September 2010. [Google Scholar]
- Moon, S.H.; Hwang, J.; Lee, J.Y.; Hyun, S.P.; Bae, B.K.; Park, Y. Establishing the origin of elevated concentrations in groundwater near the central Ogcheon metamorphic belt, Korea. J. Environ. Qual. 2013, 42, 118–128. [Google Scholar] [CrossRef] [PubMed]
- Hwang, J. Occurrence of U-minerals and source of U in groundwater in Daebo granite, Daejeon area. J. Eng. Geol. 2013, 23, 399–407. [Google Scholar] [CrossRef]
- Atkins, M.L.; Santos, I.R.; Perkins, A.; Maher, D.T. Dissolved radon and uranium in groundwater in a potential coal seam gas development region (Richmond River Catchment, Australia). J. Environ. Radio. 2016, 154, 83–92. [Google Scholar] [CrossRef] [PubMed]
- Baradonett, M.O.; Jardine, P.M.; Brooks, S.C. U(VI) adsorption to heterogeneous subsurface media: Application of a surface complexation model. Environ. Sci. Technol. 2002, 36, 937–942. [Google Scholar] [CrossRef]
- Davis, J.A.; Meece, D.E.; Kohler, M.; Curtis, G.P. Approaches to surface complexation modeling of uranium (VI) adsorption on aquifer sediments. Geochim. Cosmochim. Acta 2004, 68, 3621–3641. [Google Scholar] [CrossRef]
- Krestou, A.; Panias, D. Uranium (VI) speciation diagrams in the UO22+/CO32−/H2O system at 25 °C. Eur. J. Miner. Process. Environ. Protec. 2004, 4, 113–129. [Google Scholar]
- Gavrilescu, M.; Pavel, L.V.; Cretescu, I. Characterization and remediation of soils contaminated with uranium. J. Hazard. Mat. 2009, 163, 475–510. [Google Scholar] [CrossRef]
- Mkandawire, M. Biogeochemical behaviour and bioremediation of uranium in waters of abandoned mines. Environ. Sci. Poll. Res. 2013, 20, 7740–7767. [Google Scholar] [CrossRef] [PubMed]
- Duff, M.; Hunter, D.; Bertsch, P.; Amrhein, C. Factors influencing uranium reduction and solubility in evaporation pond sediments. Biogeochem 1999, 45, 95–114. [Google Scholar] [CrossRef]
- Murphy, W.M.; Shock, E.L. Environmental aqueous geochemistry of actinides. In Uranium: Mineralogy, Geochemistry and the Environment; Burns, P.C., Finch, R., Eds.; Reviews in Mineralogy; Mineralogical Society of America: Washington, DC, USA, 1995; Volume 38, pp. 221–253. [Google Scholar]
- Vinson, D.S.; Vengosh, A.; Hirschfeld, D.; Dwyer, G.S. Relationships between radium and radon occurrence and hydrochemistry in fresh groundwater from fractured crystalline rocks, North Carolina (USA). Chem. Geol. 2009, 260, 159–171. [Google Scholar] [CrossRef]
- Jeong, C.H.; Kim, D.W.; Kim, M.S.; Lee, Y.J.; Kim, T.S.; Han, J.S.; Cho, B.W. Occurrence of natural radioactive materials in borehole groundwater and rockcore in the Icheon area. J. Eng. Geol. 2012, 22, 95–111. [Google Scholar] [CrossRef]
- Veeger, A.I.; Ruderman, N.C. Hydrogeologic controls on radon-222 a buried valley-fractured bedrock aquifer system. Ground Water 1998, 36, 596–604. [Google Scholar] [CrossRef]
- Dinelli, E.; Lima, A.; De Vivo, B.; Albanese, S.; Cicchella, D.; Valera, P. Hydrogeochemical analysis on Italian bottled mineral waters: Effects of geology. J. Geochem. Explor. 2010, 107, 317–335. [Google Scholar] [CrossRef]
- Lourenço, C.; Ribeiro, L.; Cruz, J. Classification of natural mineral and spring bottled waters of Portugal using principal component analysis. J. Geochem. Explor. 2010, 107, 362–372. [Google Scholar] [CrossRef]
- Oyebog, S.A.; Ako, A.A.; Nkeng, G.E.; Suh, E.C. Hydrogeochemical characteristics of some Cameroon bottled waters, investigated by multivariate statistical analyses. J. Geochem. Explor. 2012, 112, 118–130. [Google Scholar] [CrossRef]
- Ravikumar, P.; Somashekar, R.K. Principal component analysis and hydrochemical facies characterization to evaluate groundwater quality in Varahi river basin, Karnataka state, India. Appl. Water Sci. 2017, 7, 745–755. [Google Scholar] [CrossRef]
- Cizdziel, J.; Farmer, D.; Hodge, V.; Lindley, K.; Stetzenbach, K. 234U/238U isotope ratios in groundwater from Southern Nevada: A comparison of alpha counting and magnetic sector ICP-MS. Sci. Total Environ. 2005, 350, 248–260. [Google Scholar] [CrossRef]
- Choo, C.O. Characteristics of uraniferous minerals in Daebo granite and significance of mineral species. J. Miner. Soc. Korea 2002, 15, 11–21. [Google Scholar]
- Lee, S.Y.; Baik, M.H. Uranium and other trace elements’ distribution in Korean granite: Implications for the influence of iron oxides on uranium migration. Environ. Geochem. Health 2009, 31, 413–420. [Google Scholar] [CrossRef]
- Schumann, R.R.; Gunderson, L.C.S. Geologic and climatic controls on the radon emanation coefficient. Environ. Int. 1996, 22, 439–446. [Google Scholar] [CrossRef]
- Singh, J.; Singh, H.; Singh, S.; Bajwa, B.S. Estimation of uranium and radon concentration in some drinking water samples of Upper Siwaliks, India. Environ. Monit. Assess. 2009, 154, 15–22. [Google Scholar] [CrossRef] [PubMed]
- Tanner, A.B. Radon migration in the ground: A supplementary review. In Proceedings of the Natural Radiation Environment 111; Gessell, T.F., Lowder, W.M., Eds.; U.S. CONF-780422; Department of Energy Report: Wahsington, DC, USA, 1980; pp. 15–56. [Google Scholar]
- Przylibski, T.A. Estimating the radon emanation coefficient from crystalline rocks into groundwater. Appl. Rad. Isotopes 2000, 53, 473–479. [Google Scholar] [CrossRef]
- Yang, Q.; Smitherman, P.; Hess, C.T.; Culbertson, C.W.; Marvinney, R.G.; Smith, A.E.; Zheng, Y. Uranium and radon in private bedrock well water in Maine: Geospatial analysis at two scales. Environ. Sci. Technol. 2014, 48, 4298–4306. [Google Scholar] [CrossRef]
- Skeppström, K.; Olofsson, B. Uranium and radon in groundwater. Eur. Water 2007, 17/18, 51–62. [Google Scholar]
- Banks, D.; Røset, O.; Strand, T.; Skarphagen, H. Radioelement (U, Th, Rn) concentrations in Norwegian bedrock groundwaters. Environ. Geol. 1995, 25, 165–180. [Google Scholar] [CrossRef]
Figure 1.
A Piper diagram showing various water types in the Icheon groundwater.

Figure 2.
Histograms showing the distributions of a wide range of uranium concentrations in groundwater. The inset diagram (right) designed for low levels below 10 μg/L indicates that most samples have very low in uranium concentrations. Italic values on the top of bars denote sample numbers. The width of each bar at the bottom graph corresponds to 40 μg/L range.

Figure 3.
Bivariate plots for uranium versus (a) HCO3, (b) SO4, (c) F, and (d) Sr.

Figure 4.
Spatial distribution of uranium concentrations in groundwater on the geological map.

Figure 5.
Histogram showing the distributions of a wide range of radon concentrations in groundwater. The radon concentrations in most samples are lower than 300 Bq/L. Italic values on the top of bars denote sample numbers. The width of each bar corresponds to 50 Bq/L range.
Figure 5.
Histogram showing the distributions of a wide range of radon concentrations in groundwater. The radon concentrations in most samples are lower than 300 Bq/L. Italic values on the top of bars denote sample numbers. The width of each bar corresponds to 50 Bq/L range.

Figure 6.
Spatial distribution of radon concentrations in groundwater on the geological map.

Figure 7.
Comparison of uranium and radon with pH, and Eh. (a) Uranium versus pH, (b) radon versus pH, (c) uranium versus Eh, and (d) radon versus Eh.
Figure 7.
Comparison of uranium and radon with pH, and Eh. (a) Uranium versus pH, (b) radon versus pH, (c) uranium versus Eh, and (d) radon versus Eh.

Figure 8.
Plot of loadings for the strong two factors with Varimax normalized rotation showing some relationships among hydrogeological components in groundwater.
Figure 8.
Plot of loadings for the strong two factors with Varimax normalized rotation showing some relationships among hydrogeological components in groundwater.


Table 1.
Statistical summary on uranium and radon concentrations in groundwater. Concentrations are expressed in mg/L except uranium and radon. Max: Maximum; Min: Minimum; Med: Median; Std: Standard deviation.
Table 1.
Statistical summary on uranium and radon concentrations in groundwater. Concentrations are expressed in mg/L except uranium and radon. Max: Maximum; Min: Minimum; Med: Median; Std: Standard deviation.
| U (μg/L) | Rn (Bq/L) | pH | EC (μS/cm) | Eh(mV) | DO | K+ | Na+ | Ca2+ | Mg2+ | Cl− | SO42− | F− | NO3− | HCO3− | Sr | SiO2 | |
|---|---|---|---|---|---|---|---|---|---|---|---|---|---|---|---|---|---|
| Max. | 1640.0 | 865.8 | 8.57 | 707.0 | 350.0 | 11.0 | 5.14 | 36.23 | 88.90 | 12.30 | 75.80 | 40.50 | 2.60 | 78.60 | 219.8 | 1.36 | 43.20 |
| Min. | 0.02 | 1.48 | 5.38 | 61.0 | −139.0 | 0.86 | 0.34 | 6.49 | 2.13 | 0.30 | 1.98 | 0.19 | 0.02 | 0.05 | 14.10 | 0.04 | 7.40 |
| Mean | 56.77 | 211.29 | 6.77 | 216.15 | 210.8 | 7.22 | 1.29 | 14.48 | 22.29 | 2.98 | 12.50 | 7.01 | 0.43 | 24.63 | 64.46 | 0.32 | 26.92 |
| Med. | 3.03 | 176.86 | 6.74 | 205.50 | 232.0 | 8.20 | 0.91 | 13.85 | 19.20 | 2.59 | 9.13 | 6.11 | 0.28 | 20.0 | 51.50 | 0.22 | 29.40 |
| Std. | 228.63 | 151.20 | 0.61 | 98.59 | 96.0 | 2.57 | 1.07 | 5.18 | 14.21 | 1.90 | 11.18 | 6.19 | 0.49 | 20.12 | 41.48 | 0.30 | 8.13 |
Table 2.
Correlation matrix for hydrogeological components in groundwater. Bold values indicate moderate to strong correlation coefficients (−0.50< or >0.50). comp: components.
Table 2.
Correlation matrix for hydrogeological components in groundwater. Bold values indicate moderate to strong correlation coefficients (−0.50< or >0.50). comp: components.
| Comp. | U | Rn | pH | EC | Eh | DO | K | Na | Ca | Mg | Cl− | SO42− | F− | NO3− | HCO3− | Sr | SiO2 |
|---|---|---|---|---|---|---|---|---|---|---|---|---|---|---|---|---|---|
| U | 1.00 | ||||||||||||||||
| Rn | 0.05 | 1.00 | |||||||||||||||
| pH | 0.20 | 0.18 | 1.00 | ||||||||||||||
| EC | 0.16 | −0.03 | −0.06 | 1.00 | |||||||||||||
| Eh | −0.54 | −0.13 | −0.37 | −0.05 | 1.00 | ||||||||||||
| DO | −0.51 | −0.03 | −0.39 | −0.46 | 0.55 | 1.00 | |||||||||||
| K | 0.31 | 0.22 | 0.18 | 0.22 | −0.67 | −0.41 | 1.00 | ||||||||||
| Na | 0.05 | −0.08 | −0.30 | 0.75 | −0.02 | −0.14 | 0.18 | 1.00 | |||||||||
| Ca | 0.30 | 0.03 | 0.18 | 0.92 | −0.18 | −0.58 | 0.28 | 0.53 | 1.00 | ||||||||
| Mg | 0.05 | −0.01 | −0.05 | 0.79 | 0.07 | −0.39 | 0.12 | 0.41 | 0.71 | 1.00 | |||||||
| Cl− | −0.01 | −0.02 | −0.27 | 0.83 | −0.07 | −0.27 | 0.24 | 0.85 | 0.65 | 0.59 | 1.00 | ||||||
| SO42− | 0.13 | −0.05 | −0.01 | 0.77 | −0.09 | −0.46 | 0.26 | 0.52 | 0.74 | 0.71 | 0.67 | 1.00 | |||||
| F− | 0.30 | 0.23 | 0.76 | 0.01 | −0.49 | −0.44 | 0.44 | −0.12 | 0.21 | −0.13 | −0.17 | −0.05 | 1.00 | ||||
| NO3− | −0.23 | 0.02 | −0.46 | 0.24 | 0.49 | 0.49 | −0.17 | 0.48 | 0.02 | 0.11 | 0.22 | −0.07 | −0.36 | 1.00 | |||
| HCO3− | 0.45 | 0.04 | 0.40 | 0.65 | −0.41 | −0.77 | 0.36 | 0.18 | 0.85 | 0.59 | 0.35 | 0.60 | 0.37 | −0.43 | 1.00 | ||
| Sr | 0.63 | 0.09 | 0.37 | 0.55 | −0.62 | −0.74 | 0.64 | 0.39 | 0.64 | 0.39 | 0.38 | 0.44 | 0.53 | −0.14 | 0.69 | 1.00 | |
| SiO2 | −0.44 | −0.21 | −0.52 | 0.09 | 0.72 | 0.52 | −0.68 | 0.34 | −0.13 | 0.08 | 0.21 | −0.11 | −0.62 | 0.57 | −0.41 | −0.49 | 1.00 |
Table 3.
Rotated factor loadings for groundwater samples using hydrogeological components. Bold values indicate significant strong factor loadings (−0.70< or >0.70) and bold italic values indicate moderate to strong factor loadings (<−0.50 or >0.50).
Table 3.
Rotated factor loadings for groundwater samples using hydrogeological components. Bold values indicate significant strong factor loadings (−0.70< or >0.70) and bold italic values indicate moderate to strong factor loadings (<−0.50 or >0.50).
| Components | Factor 1 | Factor 2 | Factor 3 | Factor 4 |
|---|---|---|---|---|
| U | 0.13 | 0.69 | −0.14 | −0.12 |
| Rn | −0.04 | 0.06 | 0.05 | 0.80 |
| pH | 0.06 | 0.22 | −0.70 | 0.48 |
| EC | 0.95 | 0.09 | 0.22 | 0.04 |
| Eh | −0.00 | −0.89 | 0.17 | −0.06 |
| DO | −0.54 | −0.56 | 0.42 | 0.03 |
| K+ | 0.14 | 0.79 | 0.12 | 0.28 |
| Na+ | 0.62 | 0.13 | 0.67 | −0.00 |
| Ca2+ | 0.93 | 0.19 | −0.06 | 0.11 |
| Mg2+ | 0.86 | −0.10 | 0.00 | −0.03 |
| Cl− | 0.76 | 0.10 | 0.48 | −0.05 |
| SO42− | 0.84 | 0.11 | 0.01 | −0.10 |
| F− | 0.02 | 0.47 | −0.45 | 0.57 |
| NO3− | 0.06 | −0.35 | 0.78 | 0.18 |
| HCO3− | 0.75 | 0.37 | −0.46 | 0.02 |
| Sr | 0.53 | 0.73 | −0.06 | 0.18 |
| SiO2 | 0.07 | −0.73 | 0.47 | −0.22 |
| Eigenvalue | 6.48 | 4.35 | 1.42 | 1.12 |
| Cumulative | ||||
| eigenvalue | 6.48 | 10.82 | 12.24 | 13.37 |
| % Variance | ||||
| explained | 38.13 | 25.61 | 8.35 | 6.61 |
| Cumulative | ||||
| % variance | 38.13 | 63.74 | 72.08 | 78.69 |
© 2019 by the authors. Licensee MDPI, Basel, Switzerland. This article is an open access article distributed under the terms and conditions of the Creative Commons Attribution (CC BY) license (http://creativecommons.org/licenses/by/4.0/).
Share and Cite
MDPI and ACS Style
Cho, B.W.; Choo, C.O. Geochemical Behavior of Uranium and Radon in Groundwater of Jurassic Granite Area, Icheon, Middle Korea. Water 2019, 11, 1278. https://doi.org/10.3390/w11061278
AMA Style
Cho BW, Choo CO. Geochemical Behavior of Uranium and Radon in Groundwater of Jurassic Granite Area, Icheon, Middle Korea. Water. 2019; 11(6):1278. https://doi.org/10.3390/w11061278
Chicago/Turabian StyleCho, Byong Wook, and Chang Oh Choo. 2019. "Geochemical Behavior of Uranium and Radon in Groundwater of Jurassic Granite Area, Icheon, Middle Korea" Water 11, no. 6: 1278. https://doi.org/10.3390/w11061278
Note that from the first issue of 2016, this journal uses article numbers instead of page numbers. See further details here.