Soil Hydrothermal Characteristics among Three Typical Vegetation Types: An Eco-Hydrological Analysis in the Qilian Mountains, China


1
Institute of Qinghai-Tibetan Plateau, Southwest Minzu University, Chengdu 610041, China
2
State Key Laboratory of Urban and Regional Ecology, Research Center for Eco-Environmental Sciences, Chinese Academy of Sciences, Beijing 100085, China
3
University of Chinese Academy of Sciences, Beijing 100049, China
4
Policy Research Center for Environment and Economy, Ministry of Environmental Protection of the People’s Republic of China, Beijing 100029, China
*
Author to whom correspondence should be addressed.
Water 2019, 11(6), 1277; https://doi.org/10.3390/w11061277
Submission received: 1 May 2019
/
Revised: 27 May 2019
/
Accepted: 12 June 2019
/
Published: 19 June 2019
(This article belongs to the Section Hydrology)
Abstract
:Soil moisture is a central theme in eco-hydrology. Topography, soil characteristics, and vegetation types are significant factors impacting soil moisture dynamics. However, water loss (evapotranspiration and leakage) and its factors of the self-organized vegetation pattern are not clear, which has significant ecologic functions and contributes to different hydrological ecosystem services. From an eco-hydrological point of view, we relied on the observation of rainfall, soil moisture, and soil temperature in the growing season of a drought year to compare soil moisture and temperature dynamics in terms of frequency/probability distribution and water loss among three typical vegetation types in the Qilian Mountains, China. The results indicated that shrubland (the semi-shaded slope) had the highest average soil moisture at the surface soil (0–40 cm) and soil profile during the growing season, while grassland (the south-facing slope) had the lowest daily average soil moisture and highest daily average soil temperature at the surface soil and soil profile. Spruce forest (the shaded slope) had the lowest daily average soil temperature at the surface soil and soil profile (p < 0.001). Water loss among the three vegetation types has a clear positive relationship with soil water content and a negative relationship with soil temperature. The values of water loss between values of water loss at the wilting point and maximum evapotranspiration point tend to occur in wetter soil moisture under the spruce forest and shrubland, whereas that of grassland emerges in drier soil moisture. The spruce forest and shrubland experienced higher water loss than the grassland. Although the spruce forest and shrubland had a better capacity to retain soil water, they also consumed more soil water than the grassland. Soil moisture may be the main factor controlling the difference in water loss among the three vegetation types. These findings may contribute to improving our understanding of the relationship between the soil moisture dynamics and vegetation pattern, and may offer basic insights for ecosystem management for upstream water-controlled mountainous areas.
1. Introduction
Soil moisture is a critical element in eco-hydrology and the core variable synthesizing the interactions of climate, soil, vegetation, and hydrological cycle [1,2,3]. Topography modifies the temporal and spatial distribution of soil moisture by impacting the spatial difference in solar radiation input, soil properties, vegetation distribution, soil temperature, and organism activities [4,5,6,7,8]. Soil moisture dynamics directly affect vegetation patterns and the canopy structure, and vegetation types directly affect soil moisture inputs through precipitation partitioning, including canopy interception, throughfall, and infiltration processes [9]. In addition, soil characteristics serve as the storage and regulator compartments in the water flow of eco-hydrological systems, as storage of precipitation input allows this water to be used by vegetation, and water flux regulation controls the partition of the rainfall input between the major outflows, including runoff, evapotranspiration, and leakage [10,11,12,13]. Consequently, these three important factors—topography, soil characteristics, and vegetation types—directly impact soil moisture dynamics in the same climate zone.
Water loss, mainly consisting of evaporation from the land surface, transpiration from soil moisture extraction by vegetation, and leakage recharging runoff or groundwater, has significant ecological functions and provides essential ecological services. At the field scale, vegetation type controls the availability and variability in soil moisture due to the difference of plant transpiration rates, and soil moisture content, in turn, affects transpiration rates related to plant physiological activities [14,15,16,17]. For instance, water loss is directly related to rates of plant transpiration and photosynthesis, and impacts multi-ecosystem services, such as carbon sequestration, nitrogen assimilation, and timber production [5]. At larger spatial scales, ecosystems mostly change their own precipitation regimes and can impact the regional climate because of the interactions between the land surface and the atmosphere via water loss [18]. For example, the effect of soil water availability on canopy conductance regulates water vapor fluxes from soil–plant systems to the near-surface atmosphere environment, with important consequences for atmospheric moisture vapor and its cross-continental transport and contribution to soil moisture–climate and forest cover–climate interactions [19,20,21]. Soil temperature is closely related to soil moisture dynamics by directly impacting plant physiological and microbial activities [14,22,23]. Moreover, soil water content was determined as related to evapotranspiration losses at the point between the wilting point and the maximum evapotranspiration/leakage point, which directly influence plant transpiration and evaporation from the soil [3,12]. Thus, water loss appears to be influenced by the vegetation types and soil moisture and temperature dynamics.
Global environmental change caused by human activities is widely recognized and is an issue of great concern, especially in the increases in atmospheric CO2 concentration and temperature [24]. In addition, intensification in global atmospheric circulation and hydrologic cycles are predicted to change the global pattern of precipitation [24,25]. Shifts in precipitation and temperature patterns during the growing season could impact soil drought conditions at different soil depths and contribute to changes in soil hydrological dynamics [10,22]. Variability in rainfall may cause soil moisture anomalies, which affect the pulse response of individual plants and ecosystems to rainfall. There exists the obvious response difference of the duration and severity of soil water stress to variability in rainfall between mesic ecosystems and xeric systems [26]. Consequently, research on the variation of soil moisture and temperature under different vegetation types may improve our understanding of vegetation distribution and patterns in the context of changes in precipitation and temperature patterns.
The analysis of soil moisture dynamics and the effects of soil, climate, and vegetation types are complicated due to multidimensional dynamic interactions among vegetation, rainfall, and soils [5]. Soil moisture variability in spatio-temporal patterns through probability density functions was actively employed in field-scale studies to explain and characterize the stochastic nature of soil water dynamics and distribution patterns [1,3,27,28]. An understanding of the soil moisture probability density function (PDF) is important for characterizing the long-term variability of soil water availability and promoting to the understanding of effective hydrological fluxes at larger spatial scale [28,29]. Thus, the research on soil moisture dynamics needs a stochastic representation of the soil water balance [1,3]. However, few studies compared soil moisture and temperature probability distribution under different vegetation types and characteristics with the soil profile during the growing season in drought conditions.
The Qilian Mountains, in which China’s second largest inland river originates, is located in the arid region of northwestern China. They have important implications for self-restraint headwaters and water provision. Typical vegetation types in these mountains include spruce forest, grassland, and alpine shrub; they are the main vegetation types in this zone and have obvious self-organized spatial patterns [30,31]. In order to provide basic information for watershed ecosystem management and gain insights into the soil moisture probability density function (PDF), we examined differences in soil moisture and temperature and the factors influencing these among three typical vegetation types using probability/frequency distribution and water loss methods in a drought year. The objectives of this study were to (1) examine differences in soil temperature and soil water at different soil depths under three vegetation covers; (2) evaluate soil temperature and soil moisture probabilistic/frequency distribution at multiple soil layers and understand their stochastic dynamics in the context of climate change; (3) explore the relationship between evapotranspiration/leakage (water loss) and soil temperature and humidity, and evaluate the values between water loss at the wilting point and at maximum evapotranspiration/leakage point. This study may, thus, provide insight into the different vegetation types’ water retention and water use capacities. In line with the relationship between soil moisture and water loss depicted by Liao’s methods [12], we focused on the growing season because the greatest direct hydrological impacts on ecological processes are expected during this time period in most ecosystems.
2. Materials and Methods
2.1. Study Site
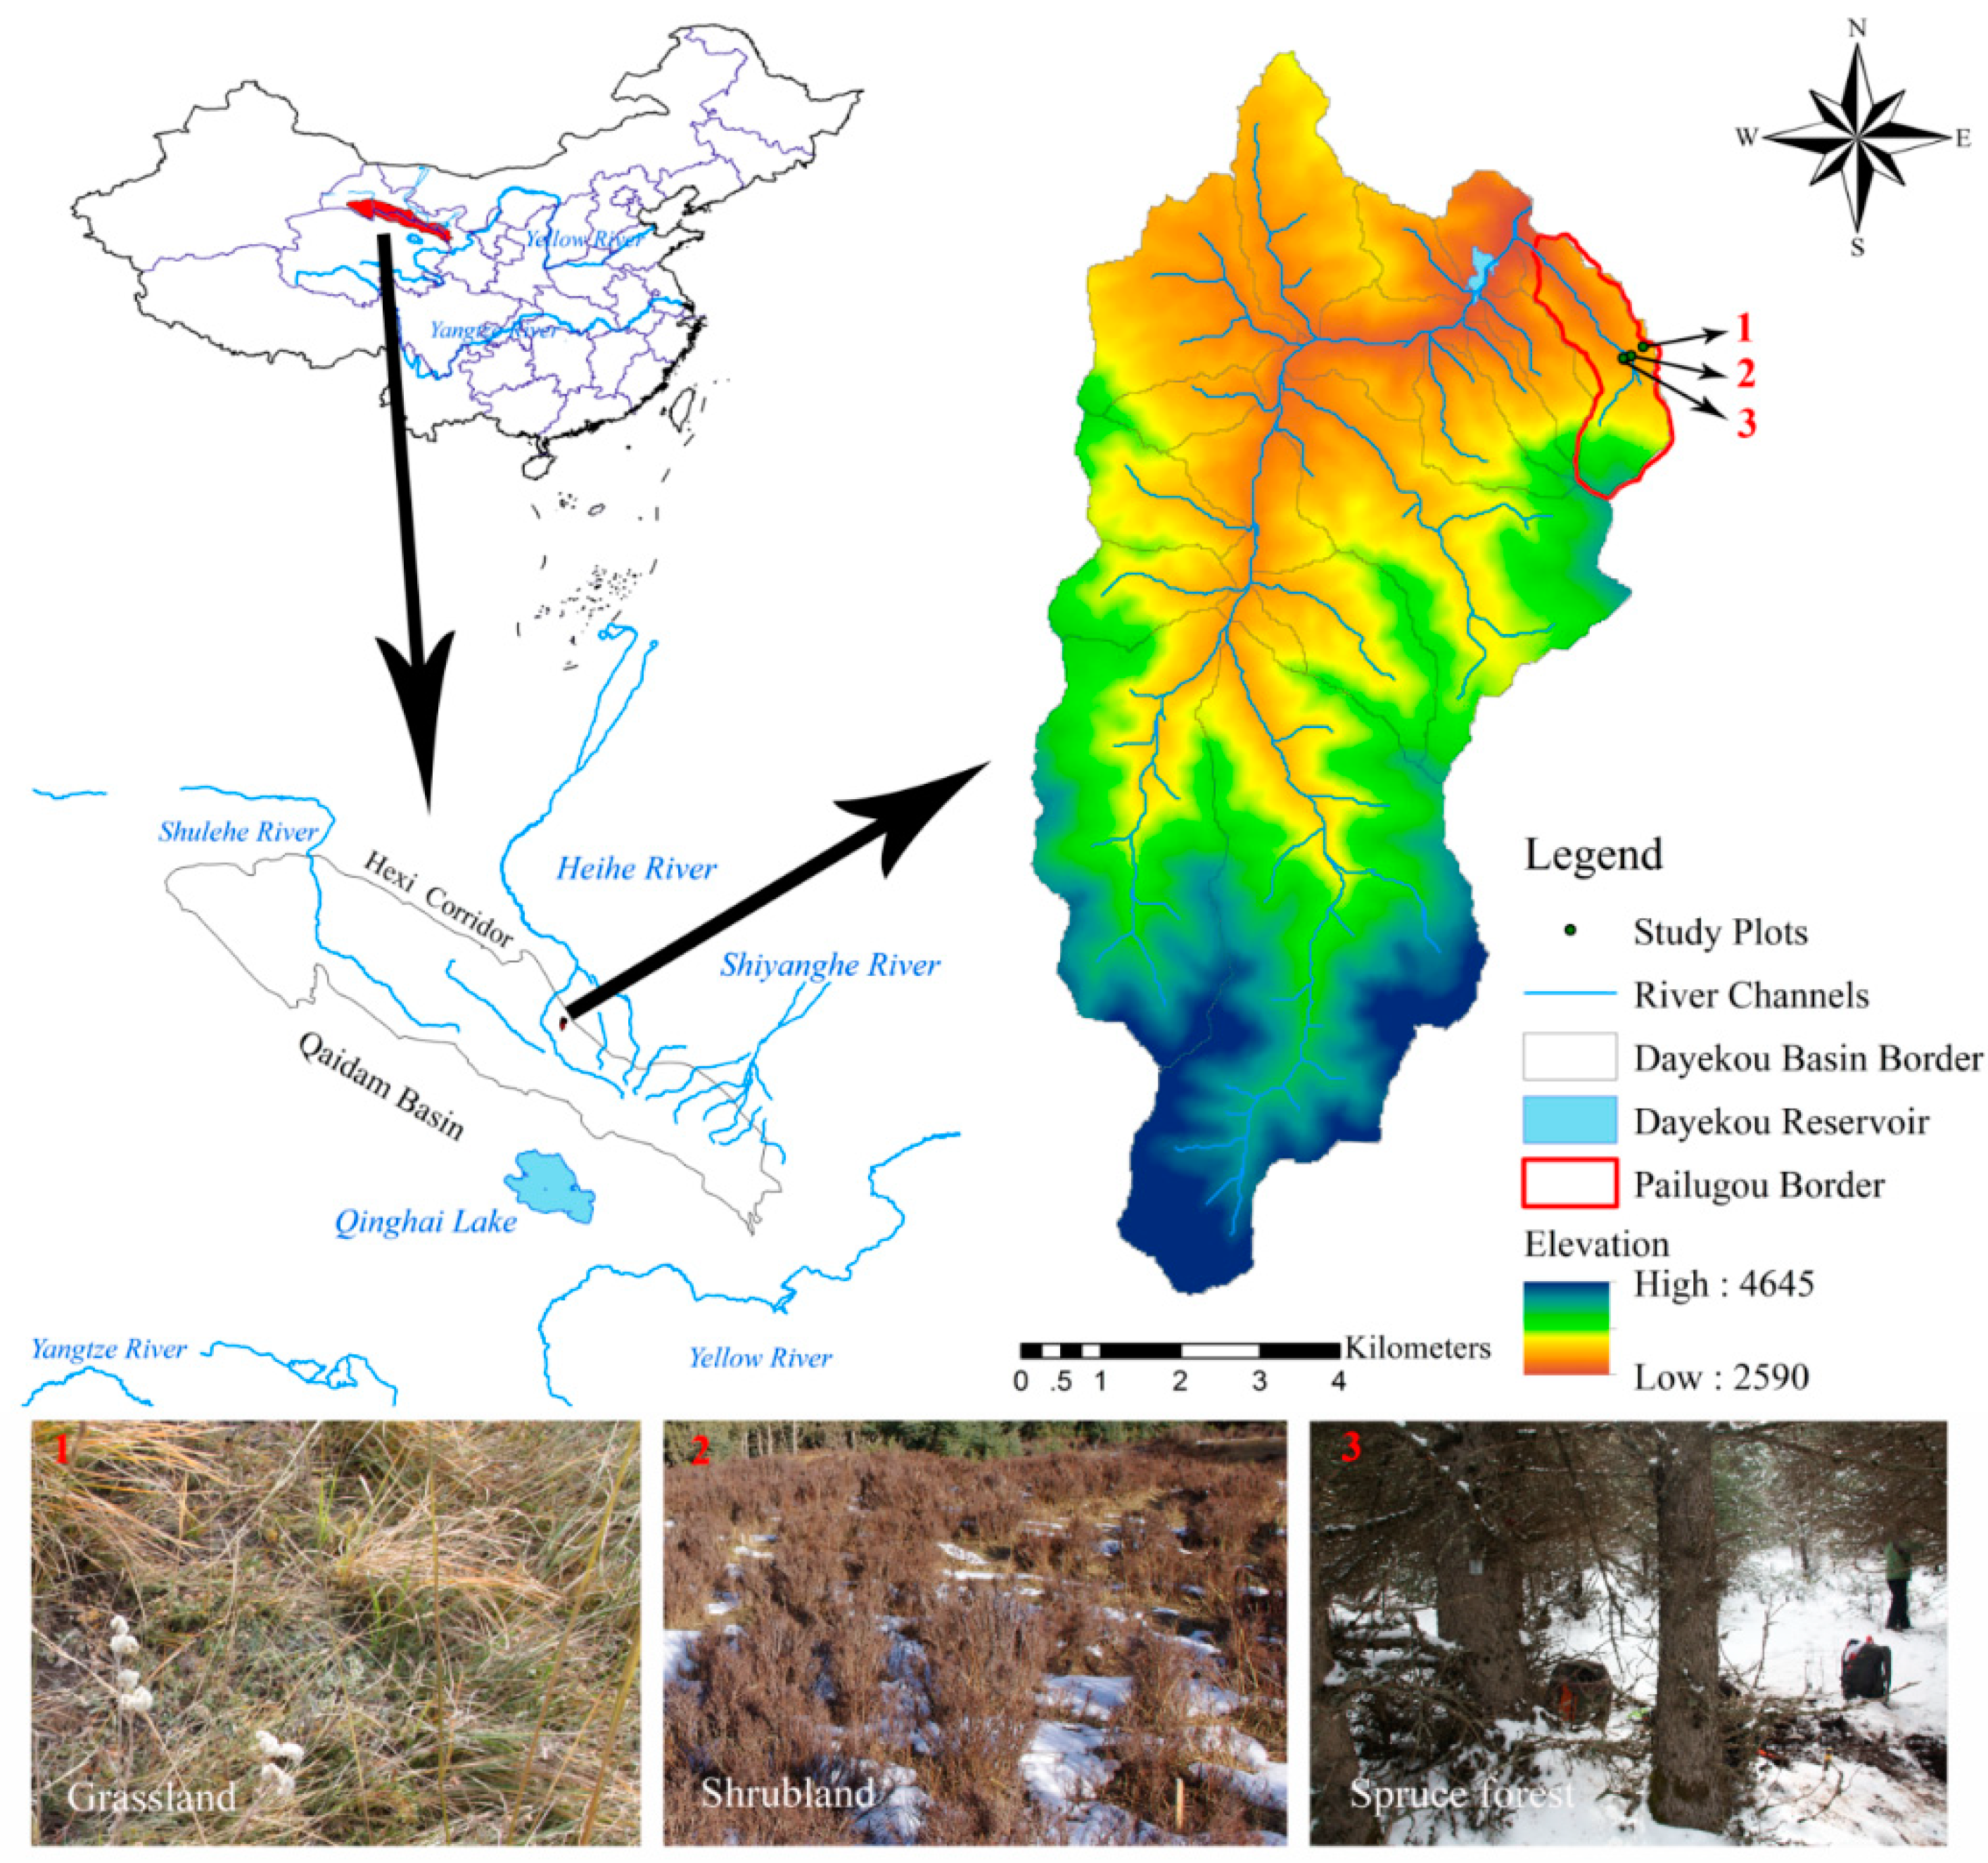
The study was conducted in the Pailugou small catchment, near the Dayekou watershed, which is located in the upper reaches of the Heihe River in the Qilian Mountains in the northeastern Chinese Tibetan Plateau (Figure 1). This catchment covers an area of about 3 km2 and the altitude ranges from 2620 to 3788 m. According to the long-term climate record from the meteorological station, the mean annual temperature is about 2.0 °C and the mean annual precipitation ranges from 374 to 407 mm at an elevation of 2700 m, while approximately 65% of the precipitation occurs during the growing season [31]. This region experiences obvious climate change such as an increase in temperature and a decrease in precipitation [32]. Compared with the climate in the adjacent plain region, the Qilian Mountains have characteristics of short growing seasons, low temperatures, and high soil water content [33]. Soil moisture has two major inputs, including snow melt in the late spring and rainfall in the summer. Due to the spatial differences in temperature and precipitation, the vegetation pattern presents a mosaic of patches of grassland, shrubland, and forest. At an elevation of 2900 m, we chose three typical vegetation types with similar slope position and slope degree (Figure 1). The forest site was dominated by Qinghai spruce forests (Picea crassifolia Kom.), which are preferentially located at shaded and semi-shaded slopes at an elevation range of 2600–3300 m. The shrub sites are mainly scattered on the shaded and semi-shaded slopes covered with Dasiphora fruticosa. The dominant species of the grass site are Achnatherum sibiricum, Artemisia frigida, Agropyrom cristatum, and Festuca ovina, which are found on the south-facing slopes.
2.2. Experimental Design and Data Measurements
Before installing the soil temperature and moisture monitoring system, three duplicates of soil samples at the three vegetation types plots were collected at every soil depth (0–10 cm, 10–20 cm, 20–40 cm, 40–60 cm, and 60–80 cm) using a soil auger for determining the average of particle size distribution, bulk density, soil organic matter, field capacity, and porosity within the entire soil observational zone (Table 1). Rainfall was measured by means of a tipping bucket rain gauge connecting to a data logger with a resolution of 0.2 mm. Three soil moisture and temperature logger systems (Decagon Devices Inc., Pullman, WA, USA) were placed in each typical vegetation plot, and five S-SMC-M005 soil moisture probes (Onset Computer Corporation, Bourne, MA, USA) and five S-TMB-M006 soil temperature probes (Onset Computer Corporation, Bourne, MA, USA) were installed at five soil depths of 10, 20, 40, 60, and 80 cm. Soil moisture and temperature data were automatically collected and recorded by the weather station logger at 30-min intervals during the growing season. Due to the high variability of rainfall distribution along with altitude, we found that a drought year emerged in 2013 comparing to the long-term meteorological observation at an elevation of 2550 m (mean annual rainfall ranged from 289.7 mm to 550.9 mm), where the gross rainfall was just 240.2 mm from 1 June to 30 September in 2013, accounting for about 85% of the year’s rainfall at an elevation of 2900 m. Thus, we chose that year as a respective drought year in our analysis because of the longest soil water loss event. Precipitation, soil temperature, and soil moisture data at a diurnal scale were selected for our analysis during the growing season.
2.3. Water Loss (Evapotranspiration and Leakage)
We chose the longest soil water recession period in the summer of the observational year, and this rainless period occurred during a 16-day stretch from 21 June to 6 July in 2013. The water loss from the soil was approximated to obtain an estimate of evapotranspiration and leakage under this rainless period. Water loss (Wl) can be calculated using the daily average of volumetric soil moisture at a given day (St) minus the daily average of volumetric soil moisture from the following day (St+1). Based on the soil water balance principle, water storage loss can be calculated as follows:
where df refers to the measure depth (cm), and Wl refers to the cumulative water loss (mm).
Wl = (St − St+1) × df,
In exploring the relationship between soil water loss and soil moisture at each depth, water loss of a particular layer can be calculated as follows:
where Wi.l refers to soil water loss in i depth at 10, 20, 40, 60, and 80 cm; Si,t, Si,t+1 represent volumetric soil moisture in i depth on a given day and the following day, respectively; and is a constant (10 cm) with which to compare every depth soil water loss.
Wi.l = (Si,t − Si,t+1) × d,
From an eco-hydrological point of view, soil water losses (evapotranspiration and leakage) as a function of soil water content play a critical role in understanding the difference in ecohydrological function under different vegetation types. In general, as long as soil water content is sufficient to permit the normal course of plant growth, water loss is assumed to occur at a maximum rate (Emax), while Emax decreases almost linearly to a value of water loss (Ew) at the so-called wilting point along with the reduction of soil moisture [12,22] Values of water loss were collected between Ew and Emax to analyze the effect of different vegetation types on water loss. Estimations of Ew and Emax were derived from calculations of Wl during the longest soil water recession period in the summer of the observation year. Wl among three vegetation types was then related to daily average soil moisture at the surface soil (0–40 cm), and Wi.l of the grassland was correlated with the daily average soil moisture at the soil profile (0–80 cm) because soil water loss was still obvious at deeper soil in grassland. At the same time, a scatter plot was made of the relationships between the values within Ew and Emax with the soil moisture dynamics, as well as the relationship of soil moisture and temperature, to show the differences in different vegetation types.
2.4. Statistical Analysis
One-factor analysis of variance (ANOVA) was conducted using SPSS 21.0 software (SPSS Inc., Chicago, IL, USA). One-way ANOVAs were performed to compare the soil moisture and soil temperature among the three vegetation types (grassland, shrubland, spruce forest) for the entire observation period. A multiple comparisons test was performed using the least significant difference (LSD) method for soil moisture and temperature across the three vegetation types. A linear regression analysis was conducted to determine the relationship between soil water loss and soil moisture. Next, average soil temperature and soil moisture at multiple depths during the growing season were depicted by box plot. In addition, soil moisture and temperature dynamics were analyzed by frequency distributions and cumulative frequency distributions at different depths using the OriginPro 9.0 software (OriginLab Corporation, Northampton, MA, USA). The level of significance for all statistical tests was set at p < 0.05.
3. Results
3.1. Soil Moisture Dynamics
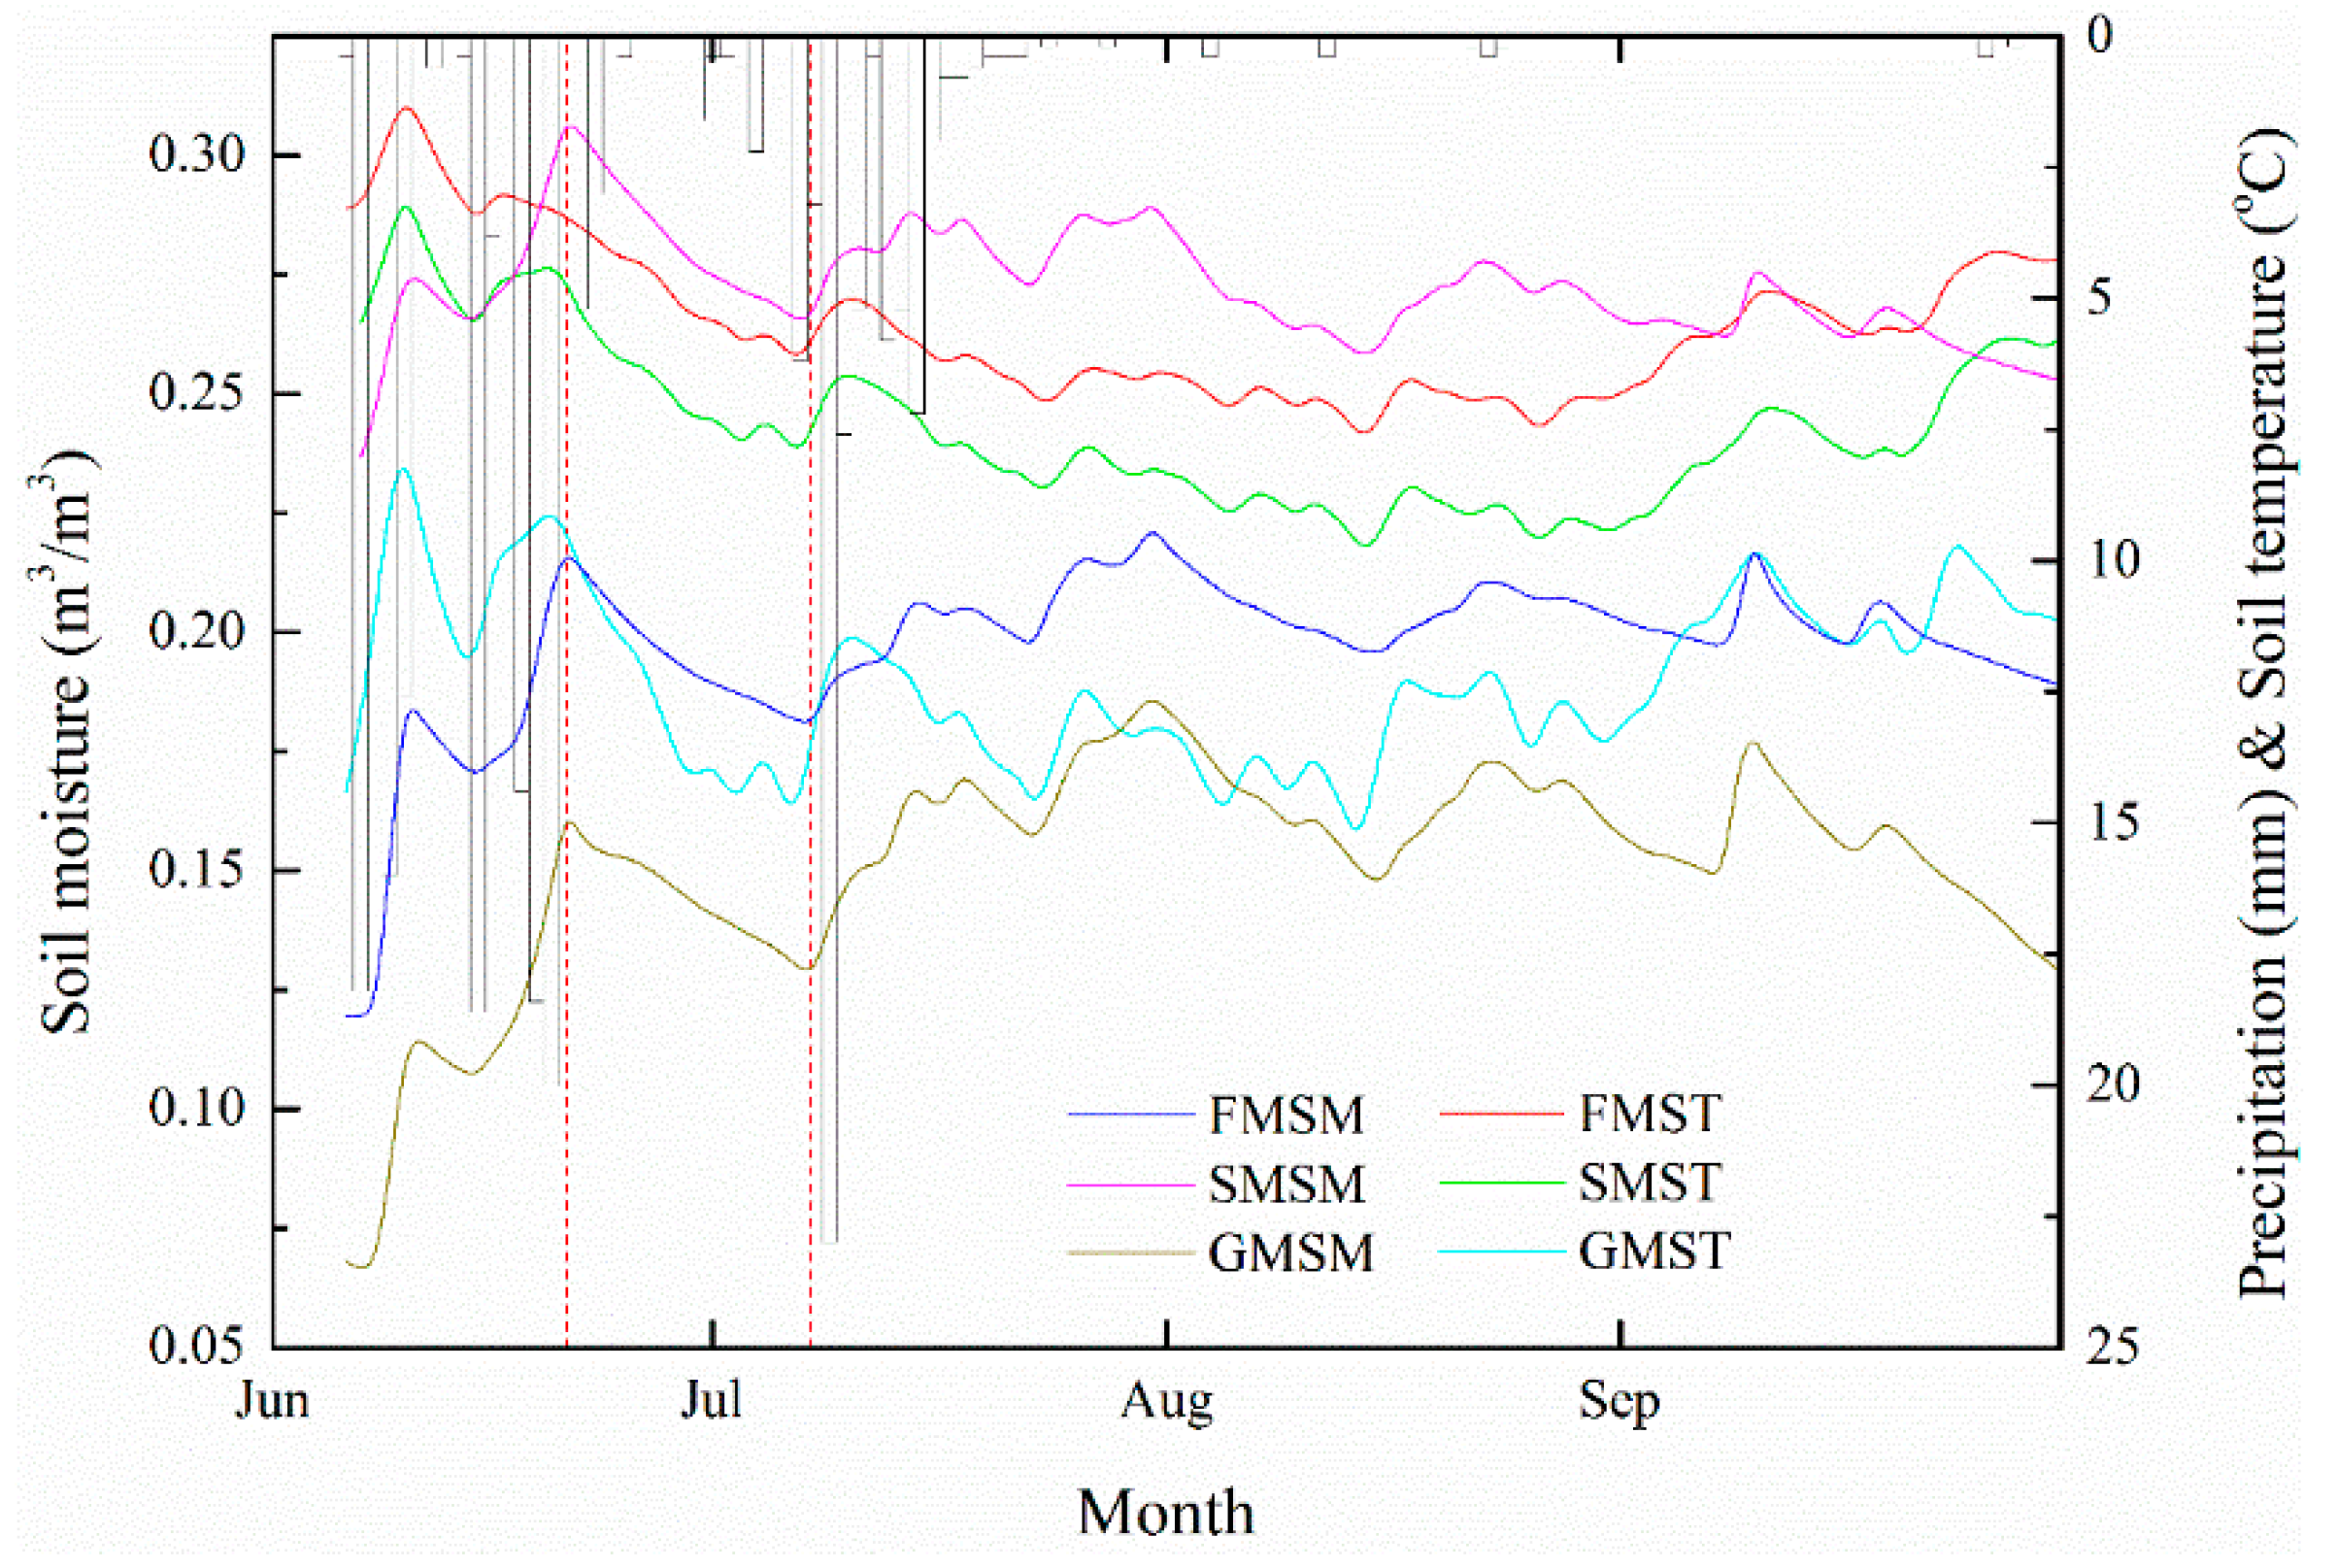
Rainy days at 2900 m accounted for 61.7% of rainfall during the growing season in 2013 (Figure 2). The precipitation patterns in the Qilian Mountain at 2900 m are obviously heterogeneous in terms of temporal distribution, and most of the rainfall occurred in June (164.8 mm) and July (73.2 mm). The total rainfall amounted to 240.2 mm from June to September in 2013, and the percentage of rainfall events of more than 5 mm during the growing season accounted for 38.3% of total rainfall events. Thus, the year 2013 was a drought year and the soil moisture dynamics soon represented the characteristics of a drought year compared to the long-term mean annual rainfall of 380.4 mm at an elevation of 2550 m. There is a clear positive response relationship between soil moisture and rainfall (Figure 2). Continuous heavy rainfall (>20mm) gave rise to the soil moisture’s strong response to precipitation for all vegetation covers. The highest peak of soil moisture dynamics occurred on 20 June because of five major rainfall events. Response time to rainfall was approximately one day apart in the three types of vegetation.
3.2. Comparison of Soil Moisture and Temperature under Three Typical Vegetation Types
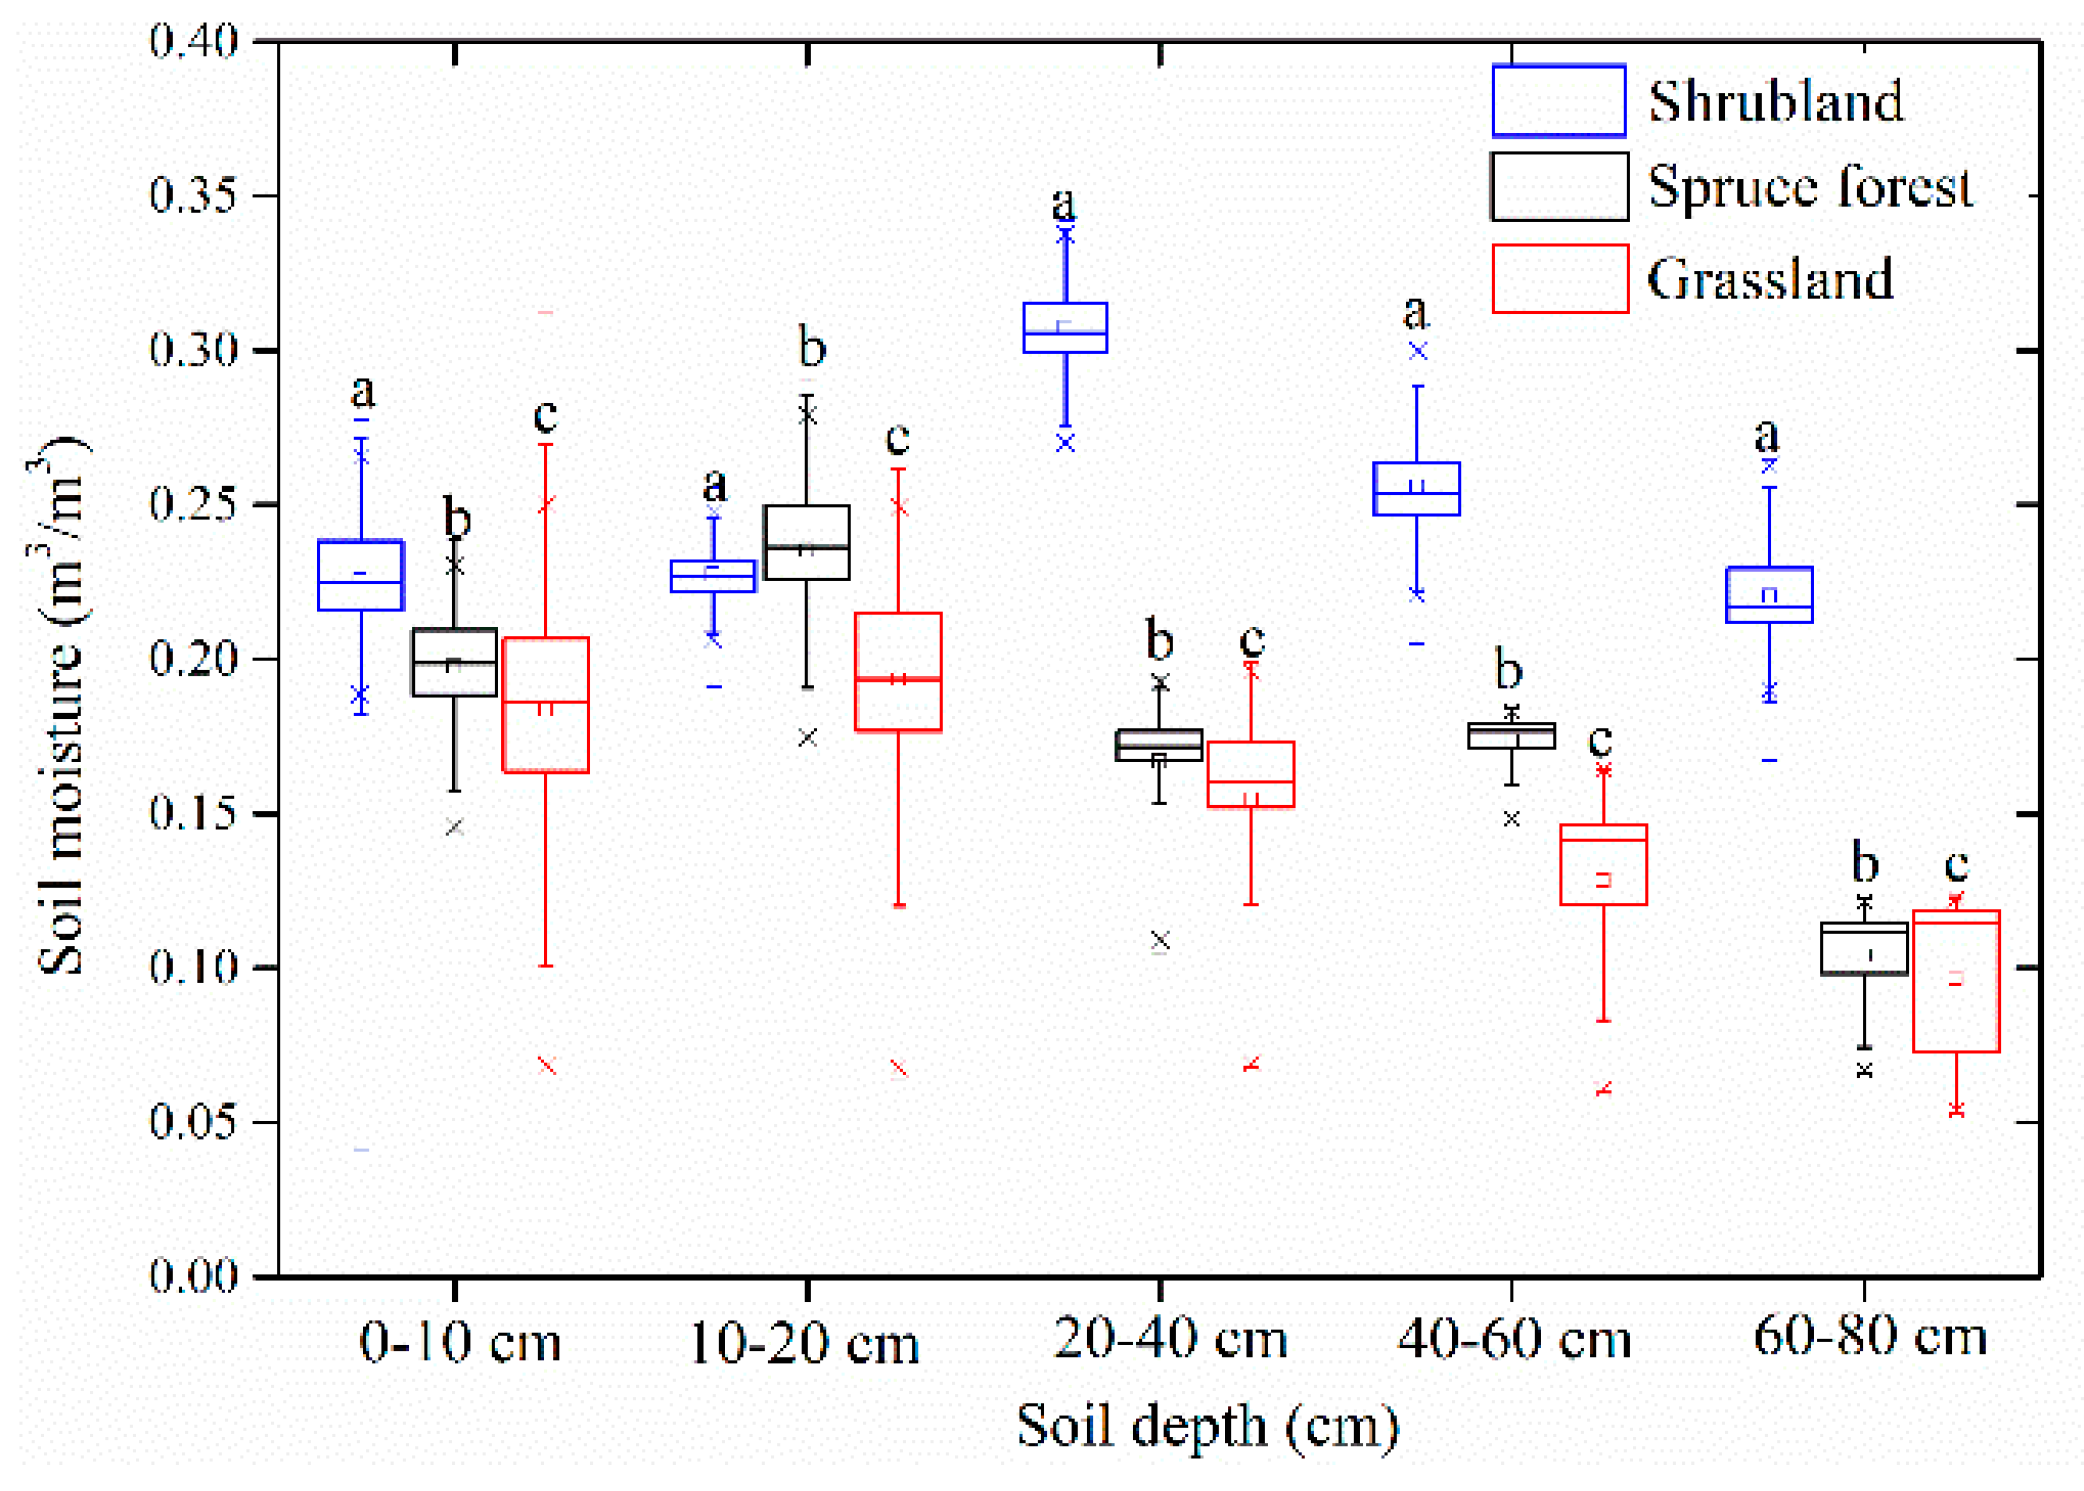
Soil moisture was found to vary between different vegetation cover conditions during the growing season. Although the response of soil moisture to rainfall under different vegetation types obviously differs, the order for daily average soil moisture at the surface soil (0–40 cm) remains consistent: shrubland > spruce forest > grassland (Figure 2). The soil moisture was significantly different at all soil depths (p < 0.05) (Table 2 and Figure 3). The wettest soil moisture conditions were observed in the shrubland at all depths; the spruce forest had increasingly higher soil moisture values at a soil depth of 0–60 cm than the grassland, while the grassland had slightly higher values at a soil depth of 60–80 cm than the spruce forest. The grassland had the lowest soil moisture values at a soil depth of 0–60 cm. In addition, an increase in soil moisture along with soil depth was also observed under spruce forest except at a soil depth of 60–80 cm, while a decrease in soil moisture of grassland was also seen at a soil depth of 10–80 cm (Figure 3). This pattern is consistent with the mean soil moisture vertical distribution during all growing seasons (Figure 3).
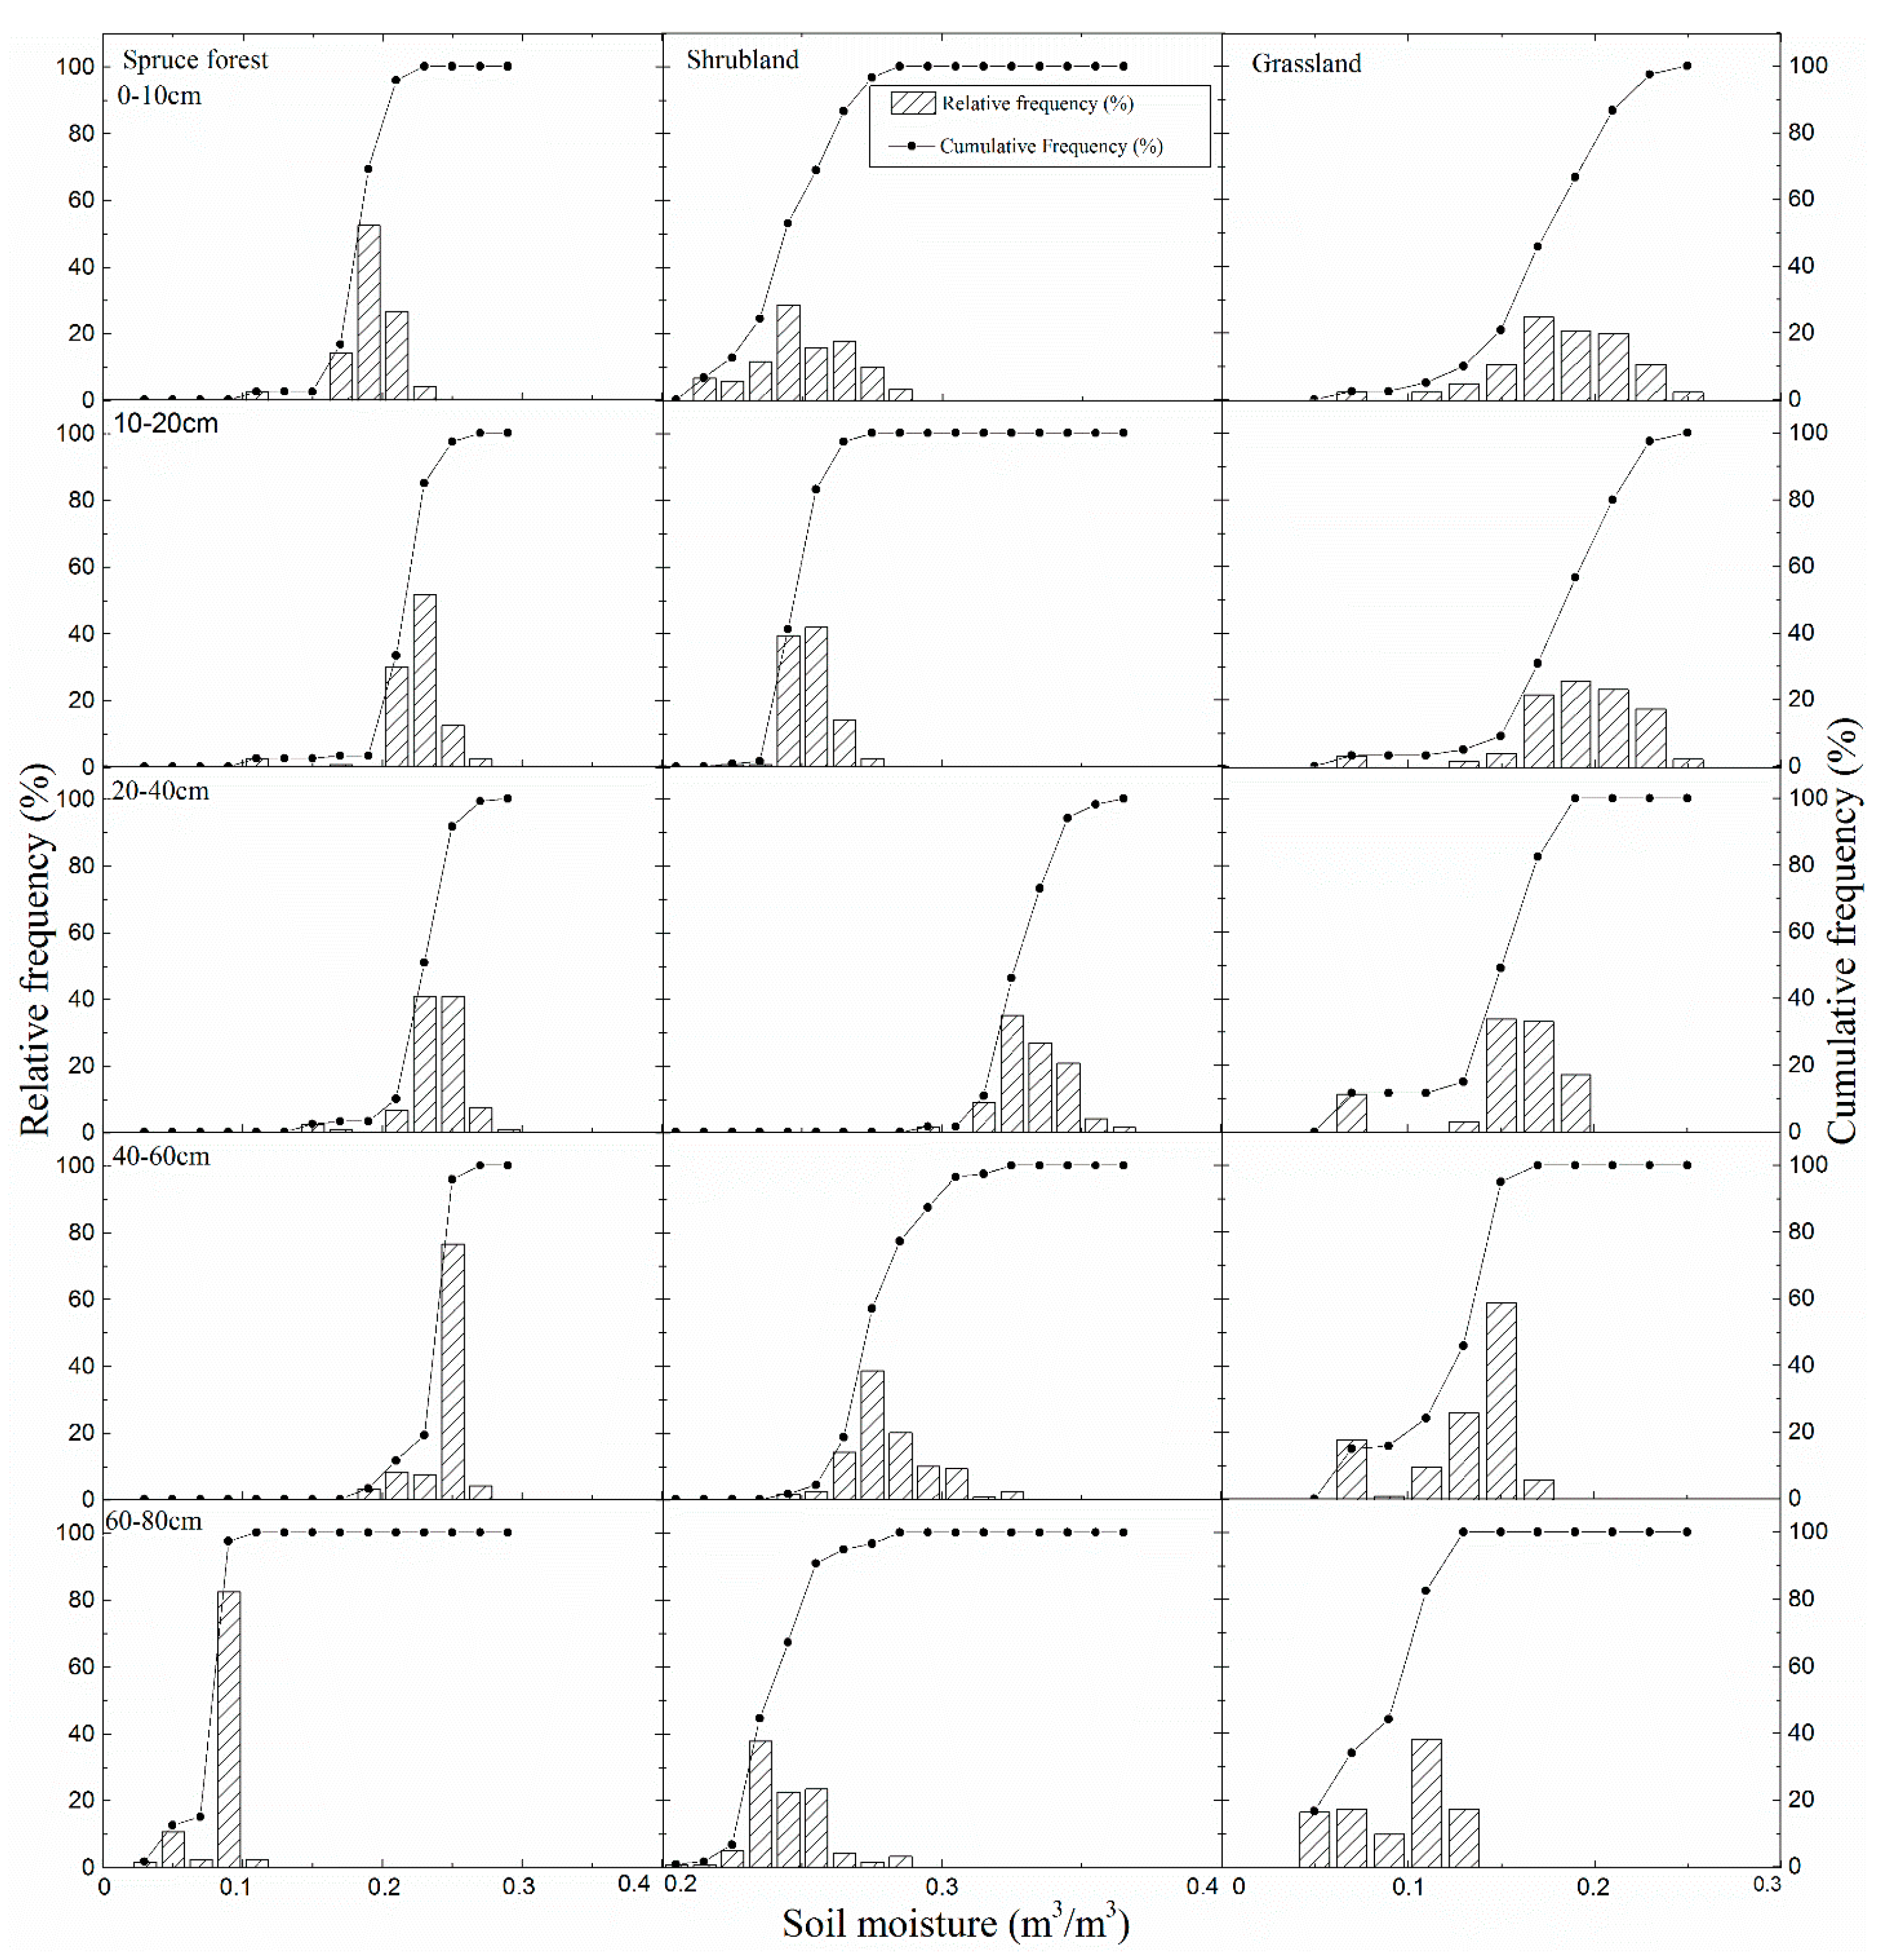
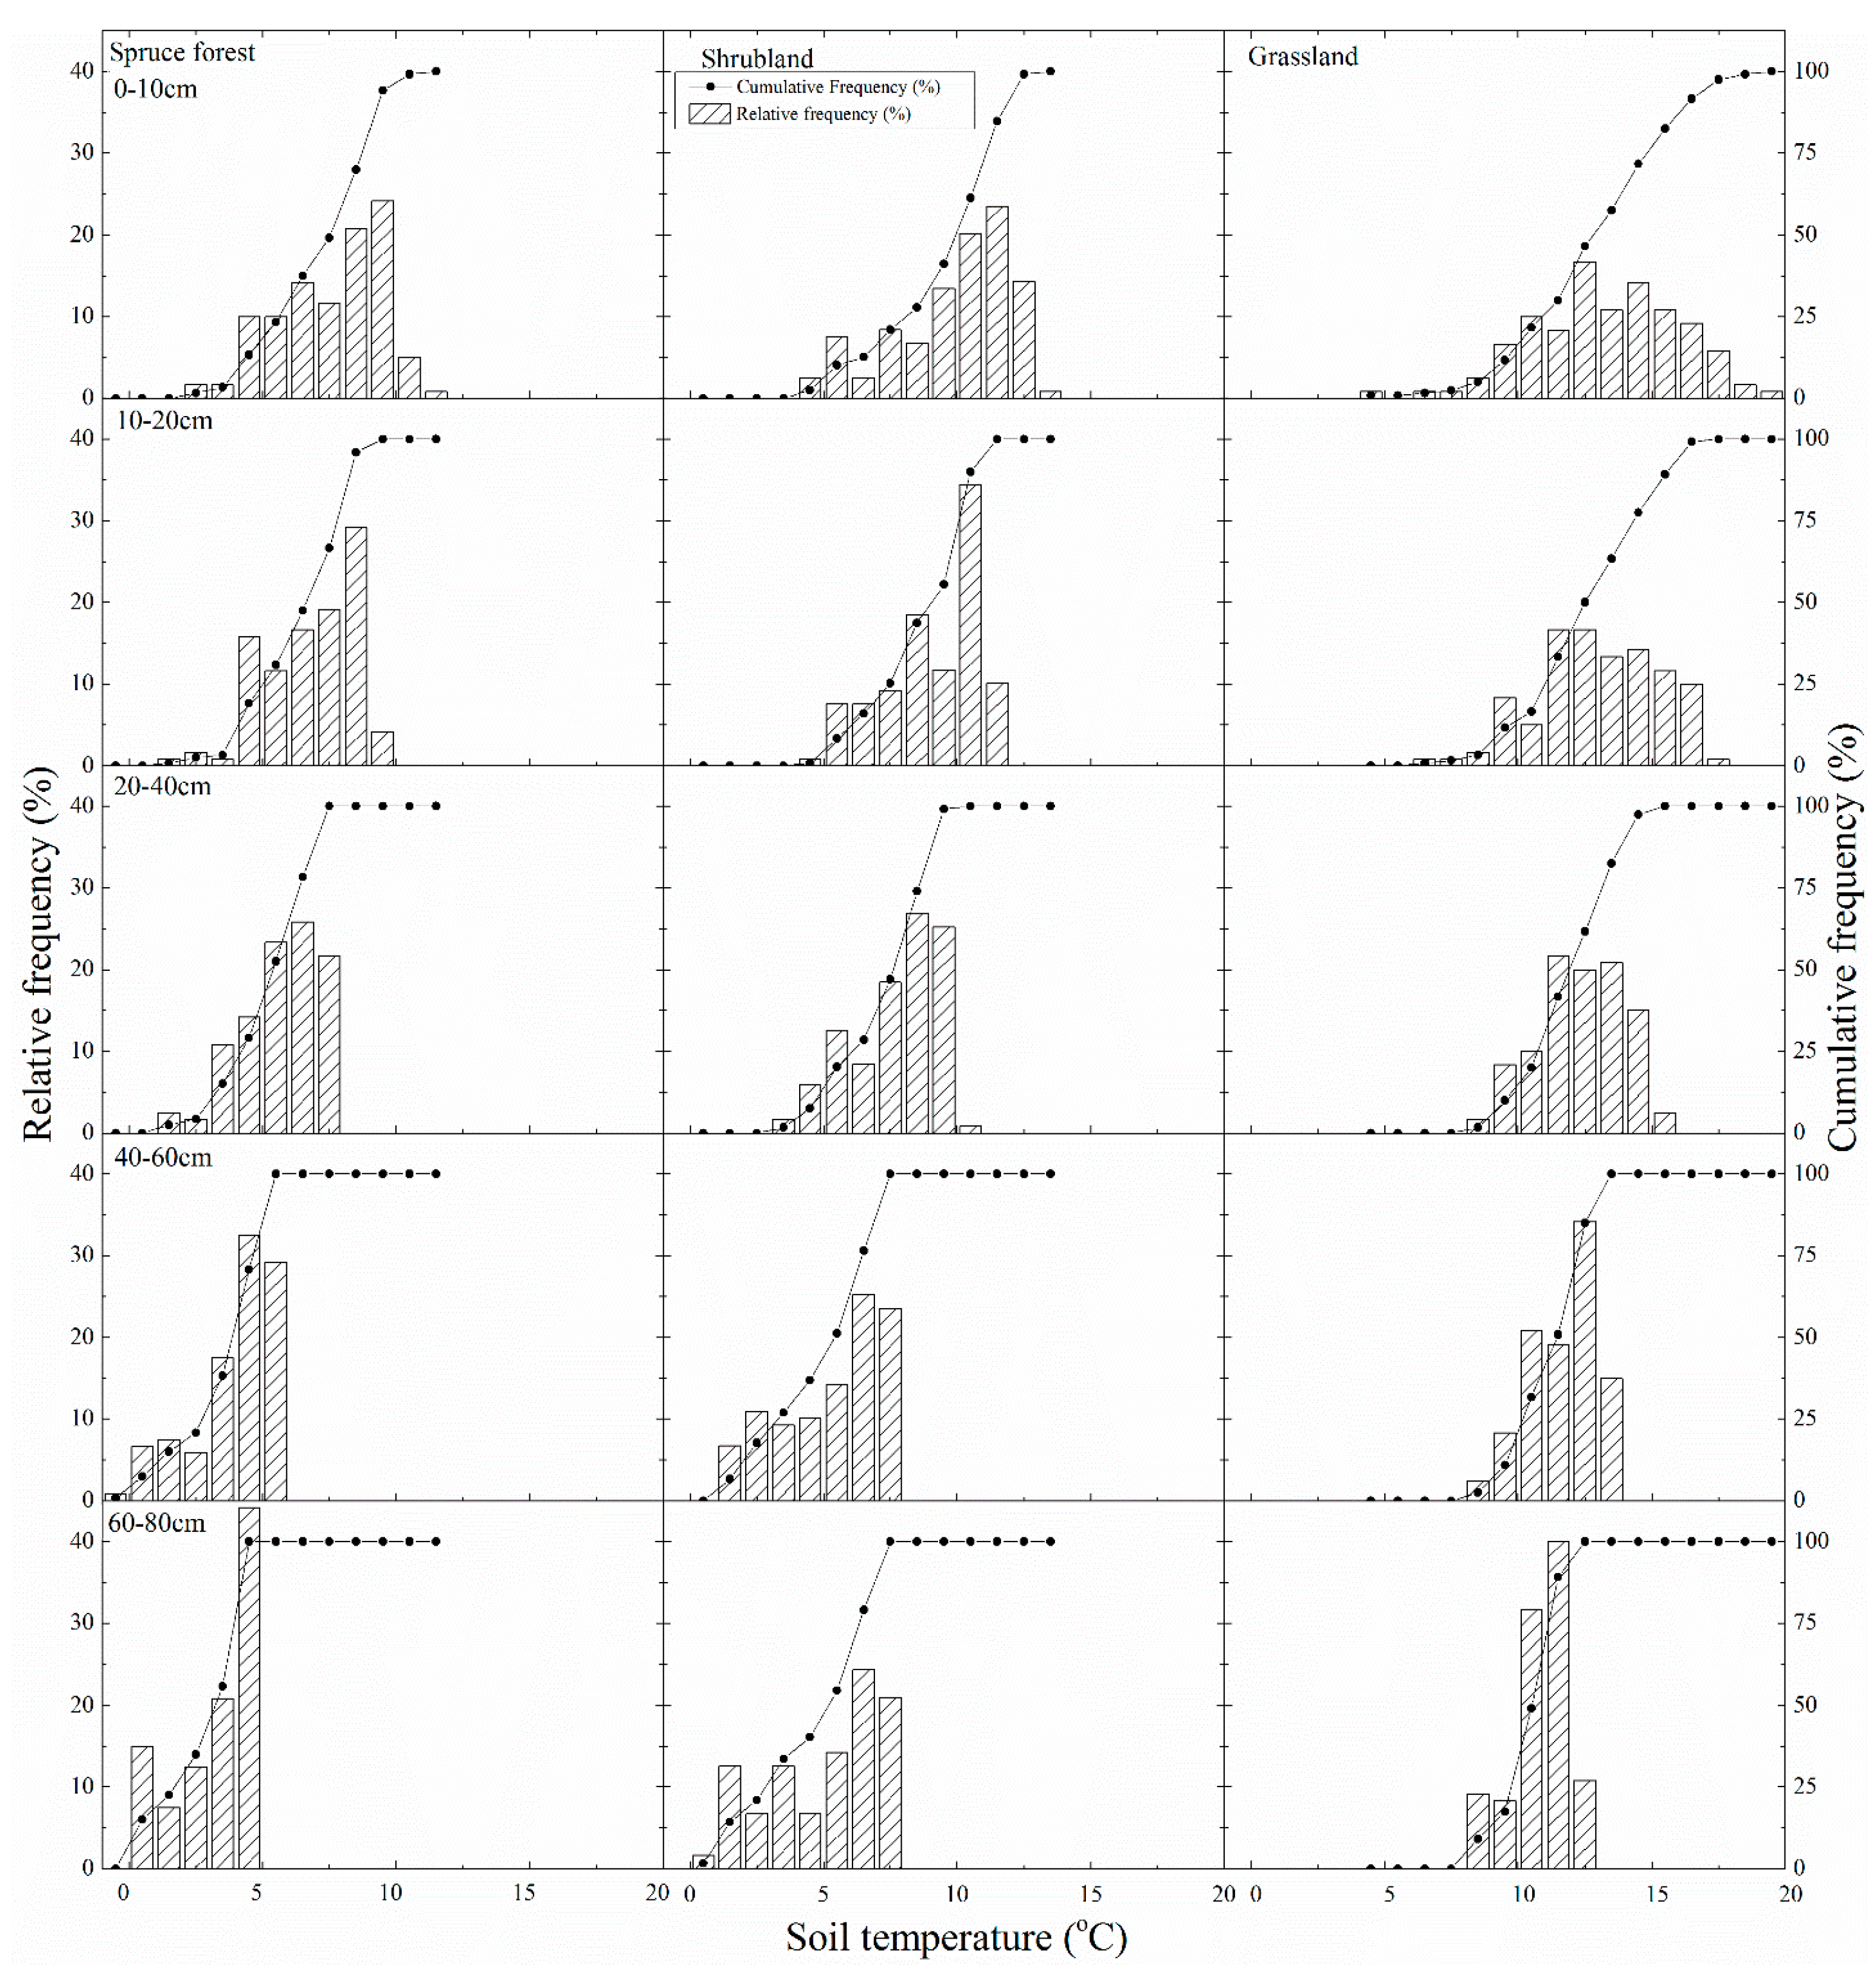
Patterns of difference in the frequency distributions of soil moisture were consistent with the soil moisture presented in Figure 3 at all soil depths (Figure 4). However, the shrubland had the wettest soil moisture frequency distributions in the soil profile (concentrated at a soil moisture content > 0.2 m3/m3), while the grassland had the driest soil moisture frequencies (concentrated at a soil moisture content < 0.2 m3/m3). In addition, grassland had a wetter soil moisture frequency distribution with soil depth, while spruce forest and shrubland had an increasing wetter soil moisture frequency distribution at a soil depth of 0–40 cm, which then gradually turned into a drier soil moisture frequency distribution at a soil depth of 40–80 cm. At a 60–80-cm soil depth, the spruce forest and grassland show a trend toward a drier soil moisture value than the shrubland. Cumulative frequency distribution shapes at all depths are similar to an extensive “S” in the grassland and shrubland, while the spruce forest has a cumulative frequency distribution shape with a steeper slope, especially in the shallowest soil layers. This finding shows that the spruce forest has a more concentrated soil moisture range, while the dynamics of soil water have a more extensive range in the grassland and shrubland.
Soil temperature decreased along the soil profile under all vegetation types (Figure 5). Both the grassland and shrubland showed significantly higher soil temperatures at all depths (0–10, 10–20, 20–40, 40–60, and 60–80 cm) compared to the spruce forest. A significant difference was found in soil temperature under the three vegetation covers at all depths (Table 3). This finding is illustrated in Figure 2 and Figure 5, which show the average growing season soil temperature and average daily soil temperature under the three vegetation types over time or space (vertical direction) as follows: grassland > shrubland > spruce forest.
The frequency distributions of soil temperature were consistent with the soil temperature patterns displayed in Figure 2 and Figure 5 (Figure 6). Furthermore, the shrubland and spruce forest had lower temperature frequency distributions in the soil profile (concentrated in soil temperatures < 10 °C), while the grassland showed the highest soil temperature frequency distributions (concentrated in soil temperatures > 10 °C). The three vegetation types have more wide-ranging soil temperature frequency distributions in the top layer. The cumulative frequency distribution shapes are also similar to an extensive “S” in all plant covers at shallow soil layers, while deeper soil layers have a cumulative frequency distribution shape with a steeper slope along with increasing soil depth. This result indicates that the top soil layer has a broader soil temperature range, while the soil temperature has a more concentrated range in deeper soil layers.
3.3. Water Loss and Its Relationship to Soil Moisture and Temperature
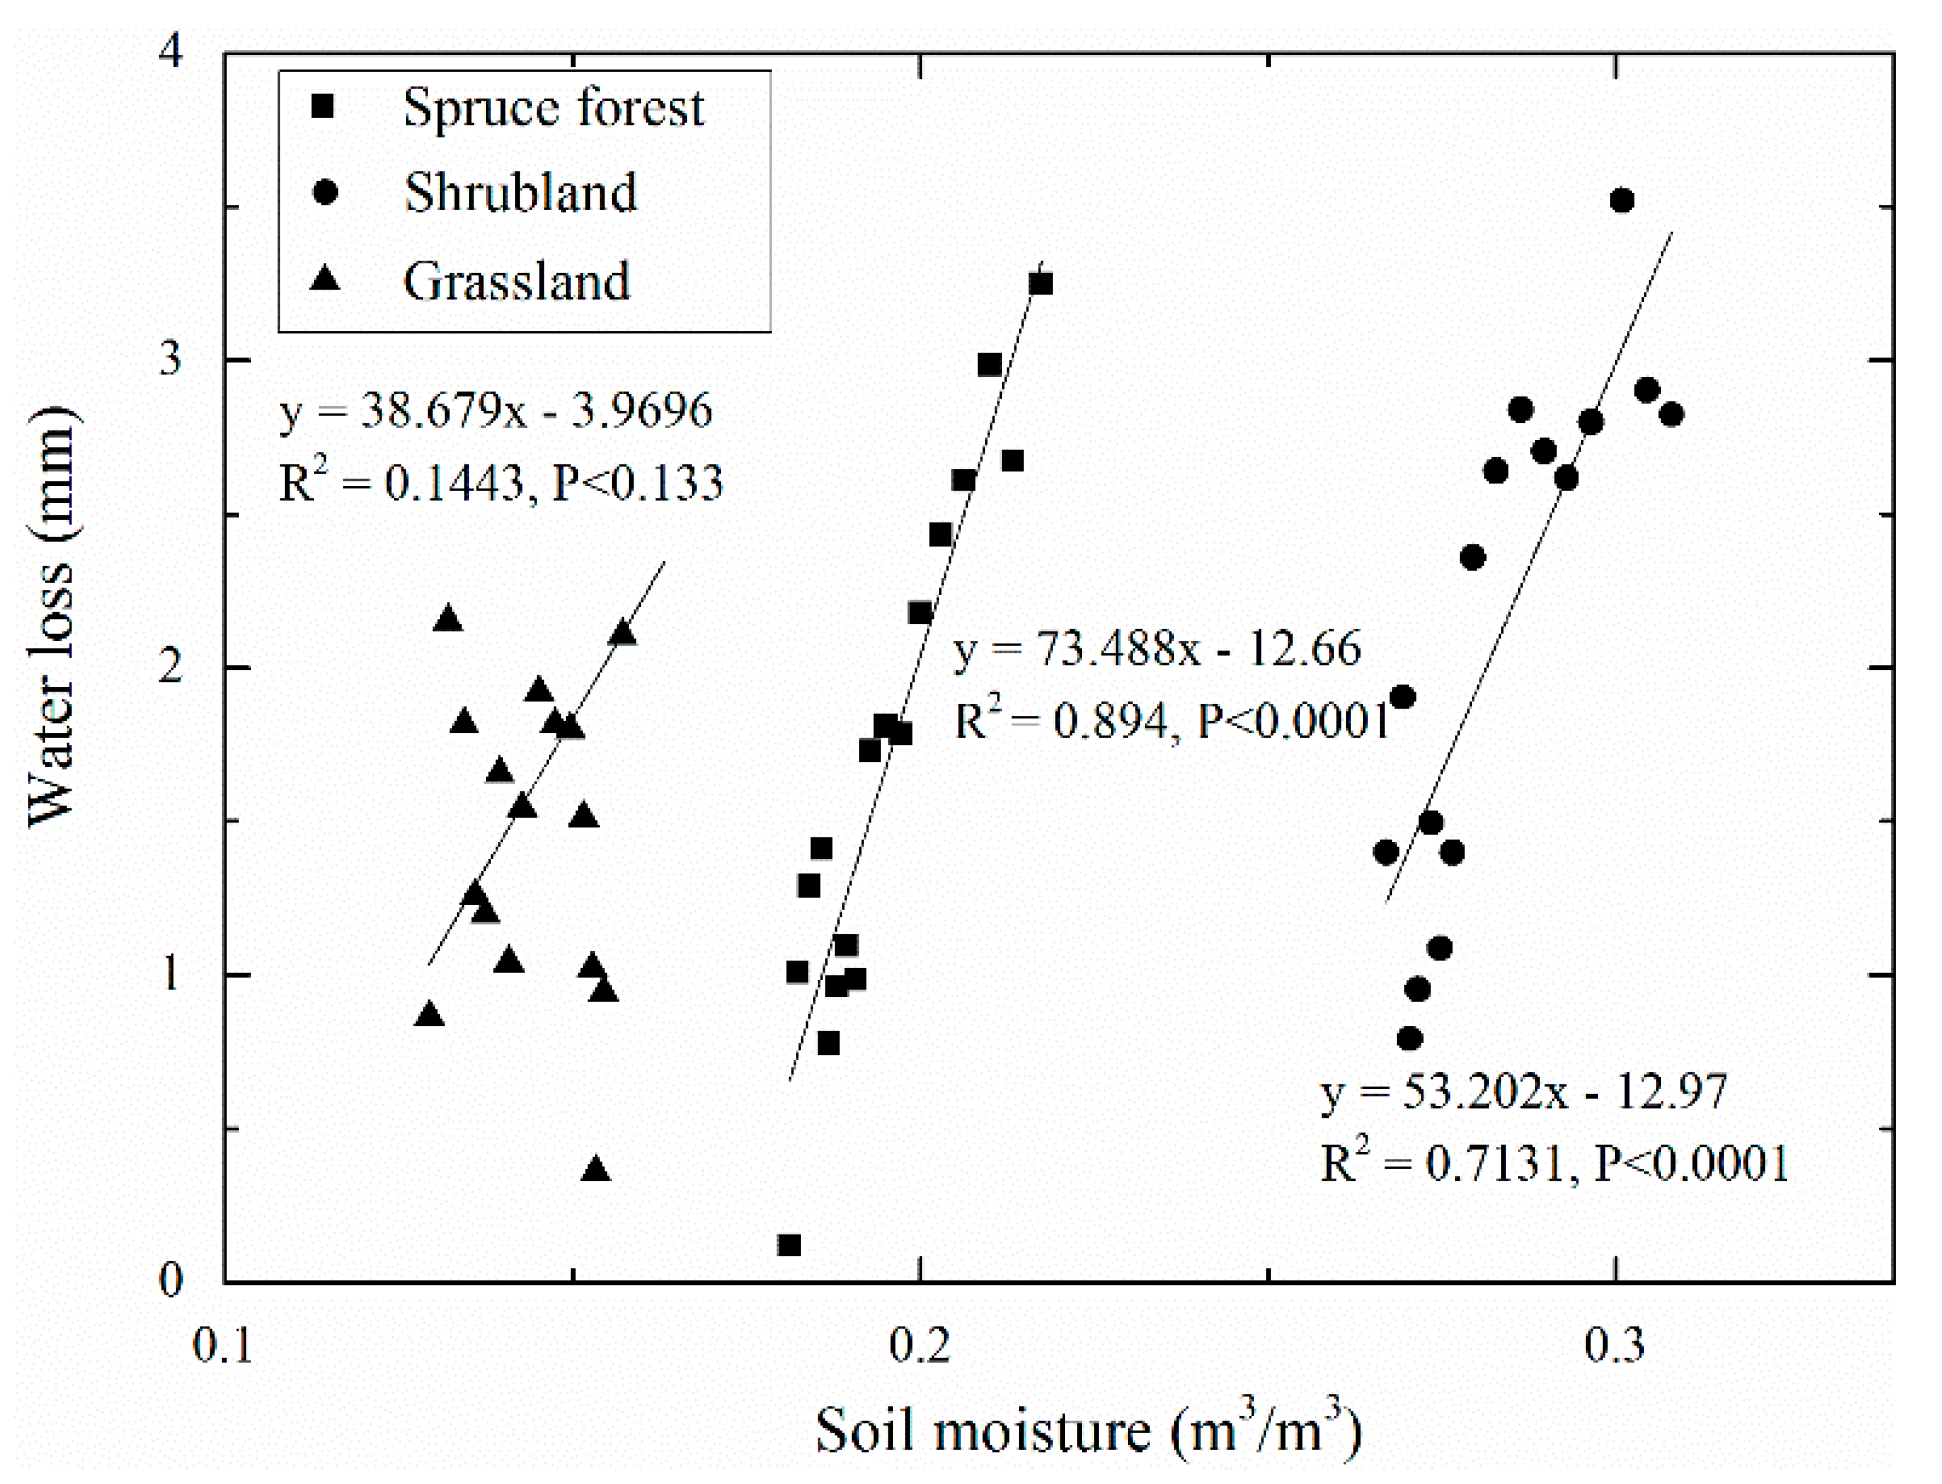
As shown in Figure 7, we found the values between the estimated and to show the differences in both the slope of the trend line and the position of the trend line under the three vegetation types. The grassland showed the lowest change of vegetation types examined in our research, and the values from to occurred in the driest soil moisture, while the wilting point occurred in soil water content of approximately 0.1 m3/m3. However, the spruce forest had the greatest variation of water loss from to , and the wilting point occurred in soil moisture content of approximately 0.17 m3/m3, while the shrubland displayed a greater change between and than the grassland, and the wilting point occurred in wetter soil moisture conditions of approximately 0.24 m3/m3. The position of the values from to in the spruce forest and shrubland occurred in wetter soil moisture content. In addition, the relationship between water loss and soil moisture in the spruce forest and shrubland was statistically analyzed, and the positive correlation was found to be significant, with soil water content directly impacting water loss.
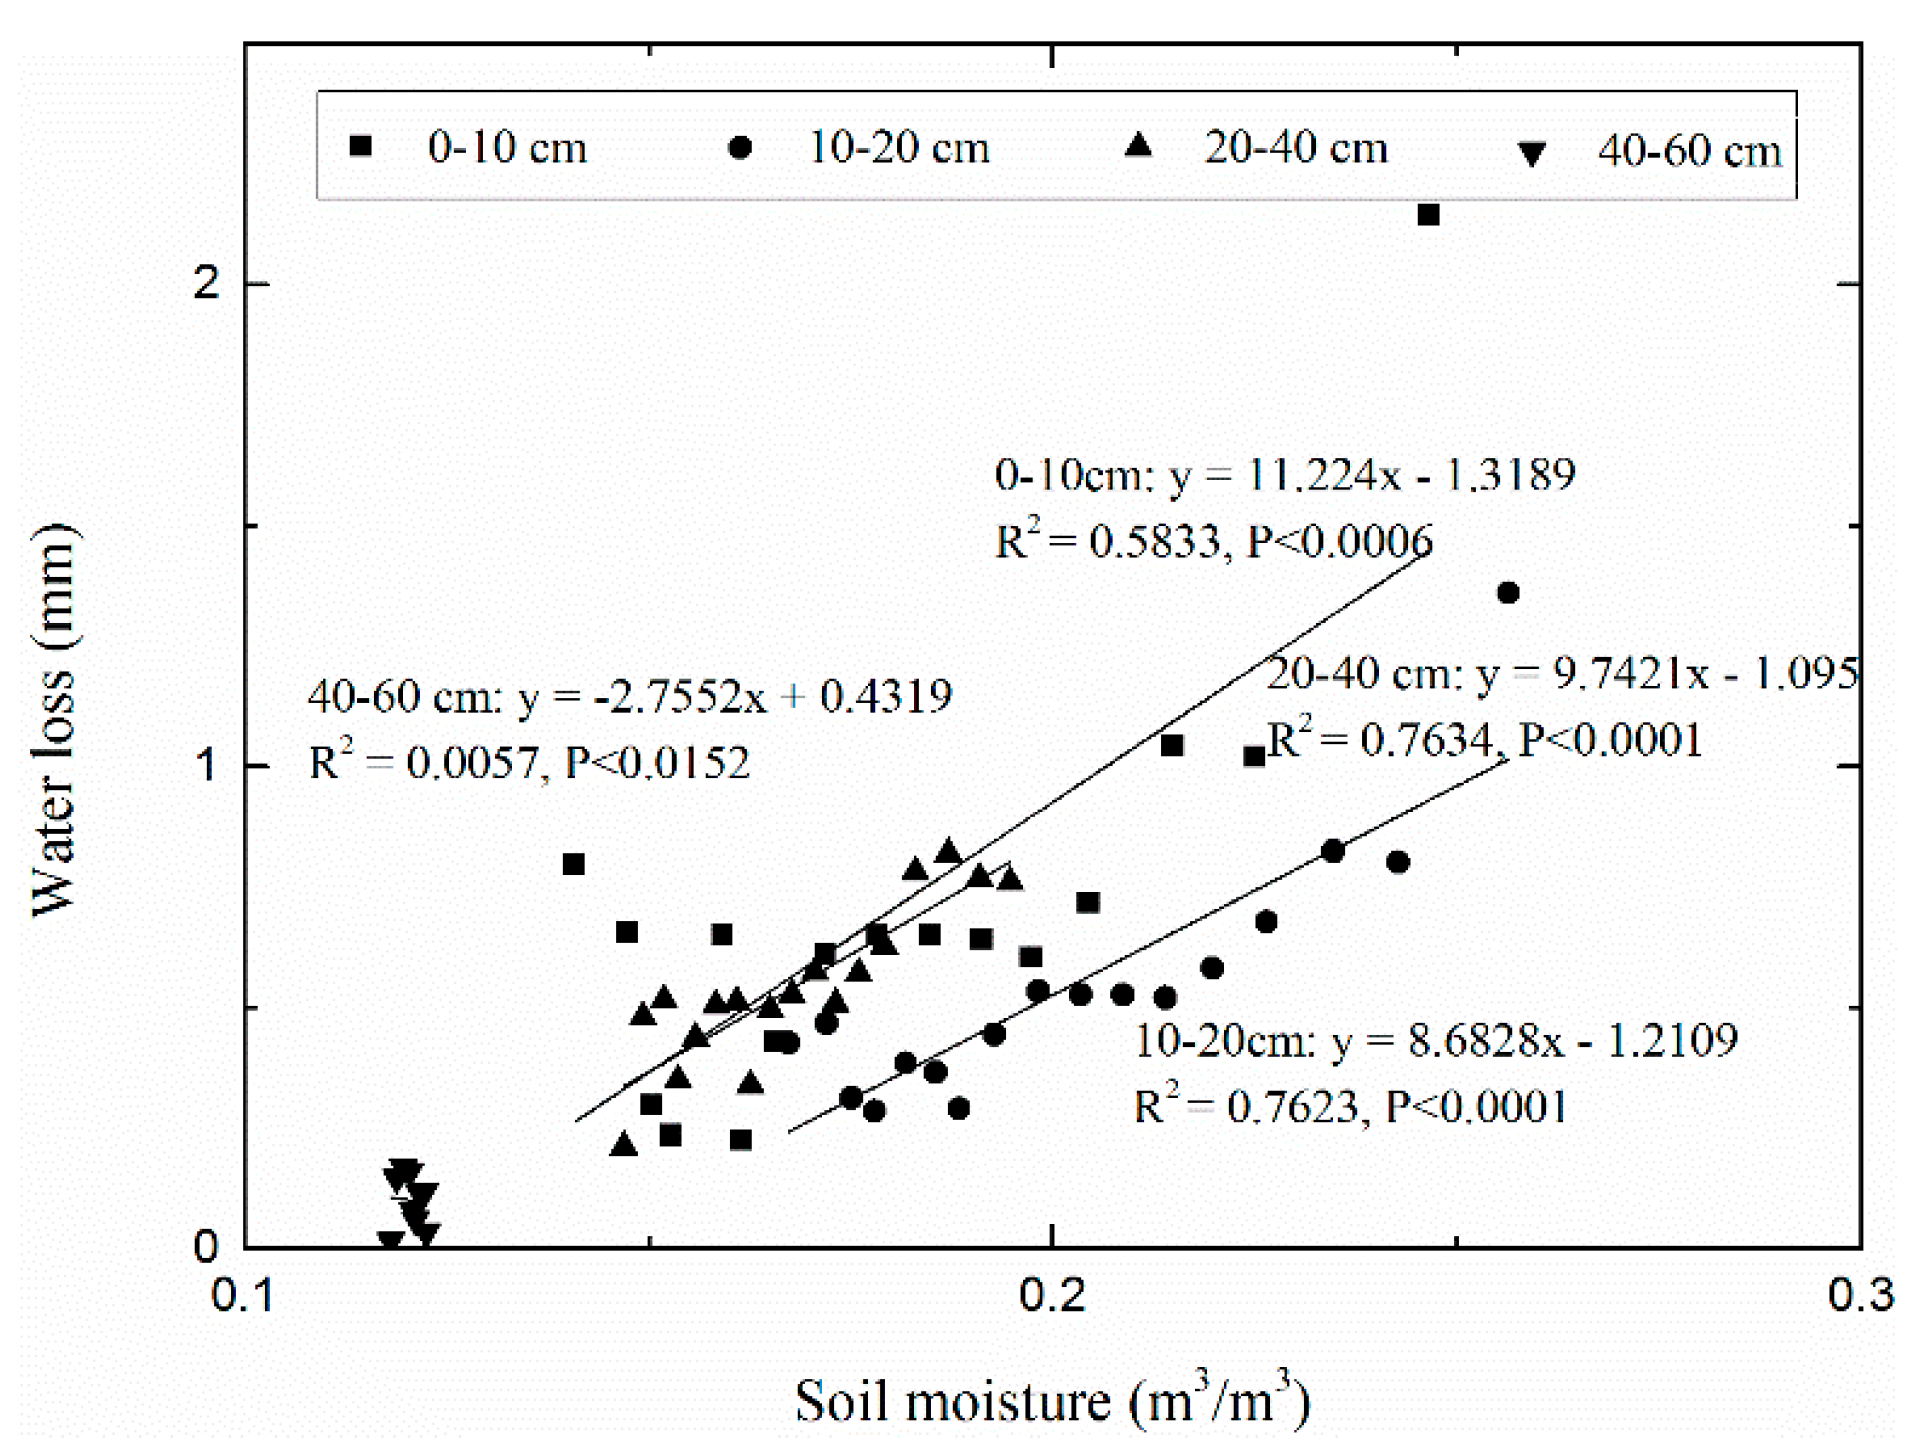
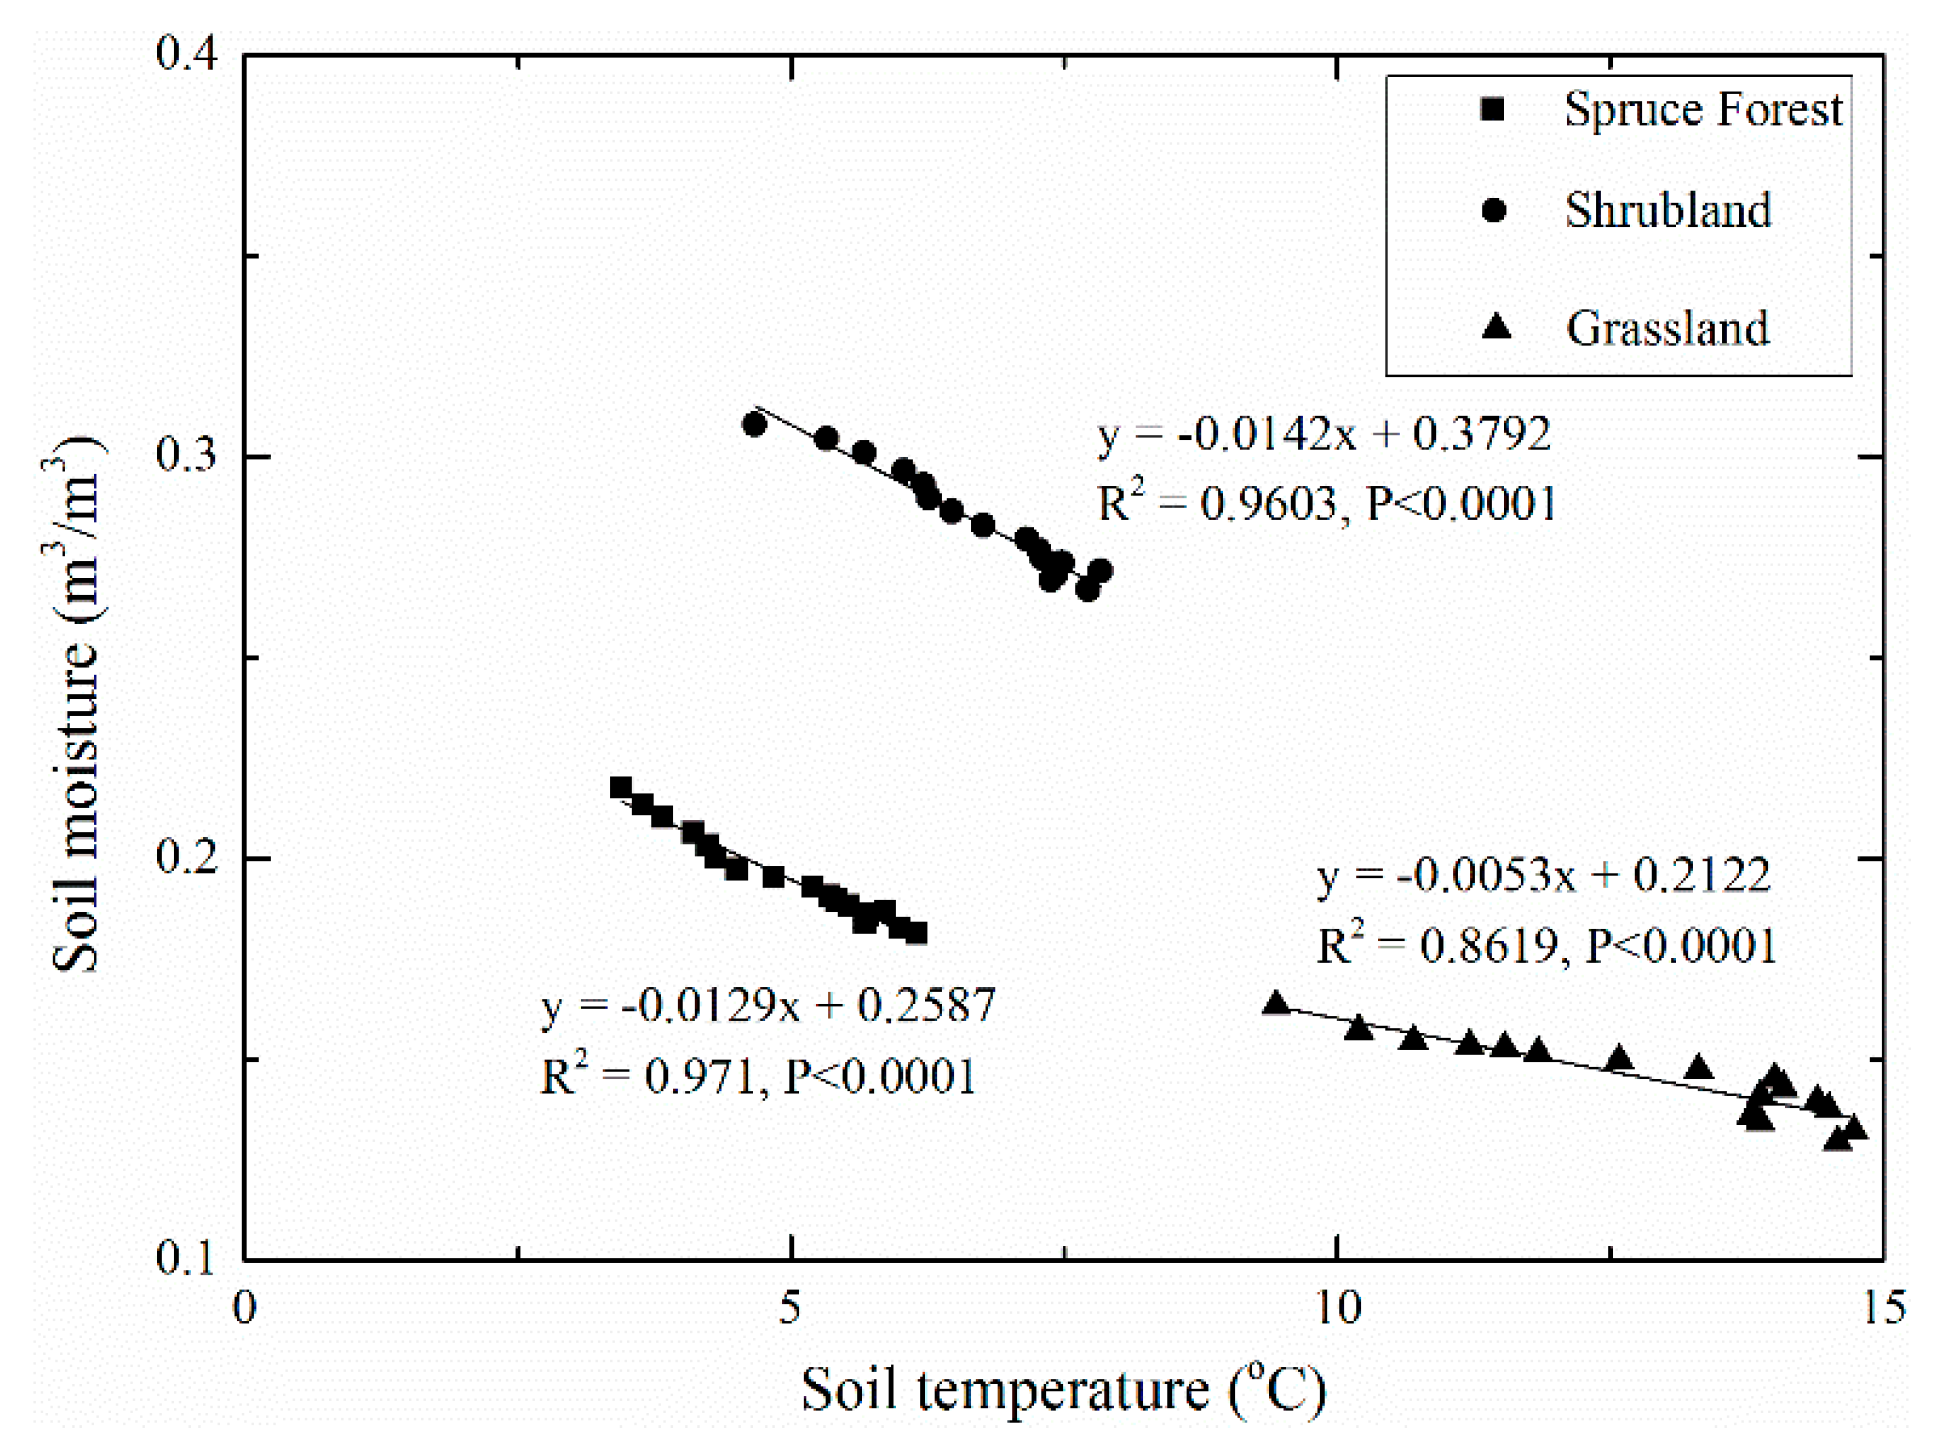
However, the linear regression between water loss and soil moisture under the grassland had the lowest degree of confidence (p < 0.133), which may be the result of ignoring the vertical difference in water loss caused by the uneven vertical distribution of soil moisture and root density. Consequently, Figure 8 depicts the correlation of water loss and volumetric soil moisture at different soil depths under different vegetation types. The result shows that the values between and showed a difference in the slope of the trend line and the position of the trend line with soil depth in the grassland. Moreover, the positive correlation of and soil moisture was statistically significant at soil depths of 0–10, 10–20, and 20–40 cm, while the linear regression between water loss and soil moisture had a lower degree of confidence at the 40–60-cm soil depth in the grassland. In addition, soil moisture under grassland increased at the 60–80-cm soil depth in this period. These results show that soil water content had a positive impact on water loss at soil depths of 0–10, 10–20, and 20–40 cm, while water loss underwent little change at the 40–60-cm soil depth, and no water loss occurred at the 60–80-cm soil depth. A significant negative correlation between soil moisture and soil temperature at the surface soil was found with differences in both the slope of the trend line and the position of the trend line in all vegetation types (Figure 9). The warmest soil was that in the driest grassland, while relatively cold soil temperature was found in the wetter soil under the spruce forest and shrubland. Overall, the spruce forest and shrubland had a higher sensitivity to soil temperature than the grassland.
4. Discussion
4.1. Soil Moisture Dynamics under the Three Vegetation Types
In water-controlled ecosystems, soil water availability is the water resource that closely limits ecological processes. Small rainfall events account for most of precipitation during growing season and are, thus, ecologically significant in semiarid regions [34]. In contrast with small rainfall events that do not obviously give rise to soil moisture pulses, large rainfall events cause an intensive effect on the obvious increase of soil moisture in surface soil and even in deeper soil depths [10]. In our study, we found that the events of rainfall amounting to less than 5mm accounted for most of the rainfall events during the growing season, and that daily mean soil moisture dynamics at the surface soil was pulsed by large rainfall events or continuous heavy rainfall events. This is consistent with a former study showing that large rainfall events (>20 mm) caused obvious pulses of soil moisture [10].
Soil moisture dynamics are controlled by many eco-hydrological factors, including rainfall, vegetation type, soil properties, and topography [7,10,16,17,35]. Soil properties directly influence soil infiltration capacity and runoff, while the canopy interception, pant root uptake, and transpiration rate are also influenced by vegetation [6,36,37]. The obvious difference in daily mean soil water storage at the surface soil under the three vegetation types mainly stems from the difference in vegetation types, soil properties, and topography (slope aspect). According to soil sample analysis, sand, soil organic matter, and porosity in the spruce forest and shrubland were found in higher proportions than in grassland, while bulk density was greater in grassland. Therefore, the Qinghai spruce forest and shrubland had a better capacity to conserve water at the root soil layer than the grassland in the Qilian Mountains [7,38]. In this study, the shrubland was observed to have the wettest soil moisture content in the soil profile, and the spruce forest had increasingly wetter soil moisture values at the 0–60-cm soil depth than the grassland. Meanwhile, grassland had the driest soil moisture values, aside for the bottom layer. There is slightly less soil moisture in the Qinghai spruce forest than the shrubland, as the Qinghai spruce forest consumes more soil water to sustain various life activities. Furthermore, the grassland on the sunny slopes (south-facing) has the highest soil temperature, while the Qinghai spruce forest on the shaded slopes (north-facing) has the lowest soil temperature among the three vegetation types. The main underlying reasons for this pattern involve the specific micro-climate depending on the vegetation and topography (slope aspect), resulting in lower temperature and reducing evapotranspiration (ET) [4,8]. Furthermore, vegetation cover and soil organic matter increase soil infiltration and reduce surface evaporation [39,40,41,42,43]. All in all, the vegetation can affect soil organic matter content, which directly influences the ability of the soil to reserve water. Because of the higher soil organic matter, the terrain, and the difference of the vegetation, the spruce forest and shrubland had a higher soil moisture and lower soil temperature than the grassland [14,38,40,43].
4.2. Soil Moisture and Soil Temperature Probability Distribution and Response to Climate Change
The probabilistic/frequency approach is an effective tool for evaluating soil moisture characteristics [3]. Drier soil moisture frequency distributions can also give rise to plant water stress, and the differences of vegetation type response to water stress can impact the composition of the vegetative community [44,45,46]. The shrubland and spruce forest were observed to have lower soil temperature and the wettest soil moisture of frequency distributions in the soil profile, while the grassland had the highest temperature and the driest soil moisture of frequency distributions in the soil profile. In addition, the surface soil was shown to have a more extensive soil temperature range, while the variety of soil temperature had a more concentrated range with soil depth; the spruce forest had a more concentrated soil moisture range, while the change in soil water had a more extensive range in the grassland and shrubland. Grassland had a drier soil moisture frequency distribution with soil depth, and the conditions were unable to support spruce forest and shrubland for survival. These results indicate a higher interaction between the soil and plants due to the difference in soil temperature and self-organization vegetation [18,47], and it is possible that deeper soil in grassland will go through more water stress, and a soil drought layer will emerge [10,22].
The combined effects of altered temperatures and precipitation regimes would impact soil moisture and temperature dynamics and would be representative of an unpredictable change to the exterior factors of ecosystem [21,26]. At a continental scale, soil moisture anomalies may affect the probability of the occurrence of subsequent precipitation and two preferential states between a “dry” and a “wet” state may explain the persistence of droughts in summer [20,48,49,50]. However, no significant bimodality was observed in the grassland ecosystem of Qilian Mountains, where the modality of soil moisture dynamics tends to be slightly more prone to drought [51]. Yin indicated that the annual mean air temperature and precipitation of the Qilian Mountains presented an increasing tendency during the most recent 50 years, and that climate warming and wetting are typical features in the Qilian Mountains [52]. Consequently, the soil moisture probability distribution would tend toward a wetter state among the three vegetation types, while the soil temperature probability distribution would tend toward hotter conditions in the context of climate warming and wetting of the Qilian Mountain region, whereas soil moisture dynamics under the grassland would be more complex [10,51].
4.3. Water Loss and Its Driving Factors
Soil moisture content directly impacts evaporation and transpiration, which represent vegetation eco-hydrological functions [3,12]. The values of water loss from water loss at wilting point () to the maximum evapotranspiration point () changed under typical vegetation types in the Qilian Mountains. The spruce forest and shrubland have higher soil moisture, resulting in the range from the wilting point to maximum evapotranspiration point occurring in wetter soil moisture content. The grassland has the driest soil conditions and the highest soil temperature. A lower soil moisture content and a higher soil temperature would cause water stress for plants [22,23,53]. The grassland would be able to withstand lower soil moisture content by increasing the root growth, while the spruce forest and shrubland may have less resistance to extreme drought events. Due to the loss of soil water being closely related to soil water content, water loss of the spruce forest and shrubland is greater than that in the grassland.
Temperature and root density are main factors leading to the loss of soil water [16,41,54]. Since the roots of grassland are mainly distributed in the surface soil (0–40 cm) [51], the linear regression between water loss () and mean soil moisture at the surface soil in the grassland had the lowest degree of confidence, while the linear relationship of and soil moisture had a higher testing statistical significance at the surface soil than at deeper soil depth. This result shows that roots in the grassland rarely contact and consume soil water below 40 cm in soil depth. In addition, we found that soil moisture decreased significantly with the increase in soil temperature at the surface soil under all three vegetation types. The spruce forest and shrubland have higher water loss values than the grassland due to higher root mass and higher soil moisture [41]. Among the three vegetation types, the grassland had the highest soil temperatures corresponding to less soil water losses, while the spruce forest and shrubland showed the strongest micro-climate effect due to high vegetation coverage and terrain, resulting in lower temperatures and greater water loss during the longest drying period. Soil temperature can affect plant root up-take and evaporation and, therefore, water loss [22]. These results indicate that soil moisture at the surface soil could not ignore the vertical difference in water loss caused by the soil moisture and root density in the soil profile, and that soil temperature plays a critical role in soil moisture dynamics. Although both soil moisture and soil temperature can lead to water loss, soil moisture may be the main factor controlling the difference in water loss under the three vegetation types.
5. Conclusions
The storage, use, and regulation of water as a key resource under a dry climate are critical scientific themes for dryland water and ecosystem management. In the drought year, the order for daily average soil moisture at the surface soil (0–40 cm) and the vertical distribution of mean soil moisture in the soil profile under the observed main vegetations during the growing season was as follows: shrubland > spruce forest > grassland. The Qinghai spruce forest and shrubland had lower soil temperature, while the grassland had the highest soil temperature. Furthermore, the shrubland demonstrated the wettest soil moisture content at soil profile. Vegetation, soil properties, and topography (slope aspect) were the main reasons giving rise to the difference in soil moisture and temperature and its probability distribution under the three vegetation types. This study shows that the Qinghai spruce forest and shrubland had a better capacity to conserve water at the surface soil layer than the grassland, and that the deeper soil in grassland is more likely to go through water stress. The soil moisture probability distributions of the three vegetation types would grow in a wetter state, while the soil temperature probability distribution of the three vegetation types would experience warmer conditions in the context of climate warming and increased wetting of the Qilian Mountain region. Due to the difference in soil moisture, the values between water loss at the wilting point and maximum evapotranspiration point occur in wetter soil moisture content under the spruce forest and shrubland, while that of grassland emerges in drier soil moisture. Therefore, soil moisture may serve as the main factor controlling the difference in water loss under the three vegetation types. Using a probability distribution method and water loss function from an eco-hydrological point of view contributes to an improved understanding of the relationship between the rainfall, soil moisture, and vegetation at a plot or field scale for a semi-arid mountain ecosystems.
Author Contributions
J.H. and Y.L. conceptualized the study; J.H., D.L., and F.S. performed the experiments; J.H. analyzed the results and wrote the manuscript with help from Y.C. and Q.Z.; Y.L. supported all stages.
Funding
This research was supported by the Chinese Academy of Sciences (No. XDA20020402), the Collaborative Innovation Center for Ecological Animal Husbandry of Qinghai–Tibetan Plateau Foundation (No. QZGYXT04), and the Chinese University Basal Research Fund Program (No. 2019NQN37).
Conflicts of Interest
The authors declare no conflict of interest.
References
- Eagleson, P.S. Ecohydrology: Darwinian Expression of Vegetation Form and Function, 2nd ed; Cambridge University Press: Cambridge, UK, 2004; pp. 170–206. [Google Scholar]
- Ma, Y.J.; Li, X.Y.; Guo, L.; Lin, H. Hydropedology: Interactions between pedologic and hydrologic processes across spatiotemporal scales. Earth-Sci. Rev. 2017, 171, 181–195. [Google Scholar] [CrossRef]
- Rodriguez-Iturbe, I.; Porporato, A. Ecohydrology of Water-controlled Ecosystems: Soil Moisture and Plant Dynamics; Cambridge University Press: Cambridge, UK, 2005; pp. 1–47. [Google Scholar]
- Berryman, E.M.; Barnard, H.R.; Adams, H.R.; Burns, M.A.; Gallo, E.; Brooks, P.D. Complex terrain alters temperature and moisture limitations of forest soil respiration across a semiarid to subalpine gradient. J. Geophys. Res. 2015, 120, 707–723. [Google Scholar] [CrossRef]
- D’Odorico, P.; Laio, F.; Porporato, A.; Ridolfi, L.; Rinaldo, A.; Rodriguez-Iturbe, I. Ecohydrology of terrestrial ecosystems. Bioscience 2010, 60, 898–907. [Google Scholar] [CrossRef]
- He, Z.B.; Zhao, M.M.; Zhu, X.; Du, J.; Chen, L.F.; Lin, P.F.; Li, J. Temporal stability of soil water storage in multiple soil layers in high-elevation forests. J. Hydrol. 2019, 569, 532–545. [Google Scholar] [CrossRef]
- Sun, F.; Lü, Y.; Wang, J.; Hu, J.; Fu, B. Soil moisture dynamics of typical ecosystems in response to precipitation: A monitoring-based analysis of hydrological service in the Qilian Mountains. Catena 2015, 129, 63–75. [Google Scholar] [CrossRef]
- Zou, C.B.; Barron-Gafford, G.A.; Breshears, D.D. Effects of topography and woody plant canopy cover on near-ground solar radiation: Relevant energy inputs for ecohydrology and hydropedology. Geophys. Res. Lett. 2007, 34, L24S21. [Google Scholar] [CrossRef]
- Legates, D.R.; Mahmood, R.; Levia, D.F.; DeLiberty, T.L.; Quiring, S.M.; Houser, C.; Nelson, F.E. Soil moisture: A central and unifying theme in physical geography. Prog. Phys. Geog. 2010, 35, 65–86. [Google Scholar] [CrossRef]
- He, Z.B.; Zhao, W.Z.; Liu, H.; Chang, X.X. The response of soil moisture to rainfall event size in subalpine grassland and meadows in a semi-arid mountain range: A case study in northwestern China’s Qilian Mountains. J. Hydrol. 2012, 420–421, 183–190. [Google Scholar] [CrossRef]
- Noy-Meir, I. Desert ecosystems: Environment and producers. Annu. Rev. Ecol. Evol. S. 1973, 4, 25–51. [Google Scholar] [CrossRef]
- Laio, F.; Porporato, A.; Ridolfi, L.; Rodrguez-Iturbe, I. Plants in water-controlled ecosystems: Active role in hydrologic processes and response to water stress II. Probabilistic soil moisture dynamics. Adv. Water Res. 2001, 24, 707–723. [Google Scholar] [CrossRef]
- Zhang, X.; Zhao, W.W.; Wang, L.X.; Liu, Y.X.; Liu, Y.; Feng, Q. Relationship between soil water content and soil particle size on typical slopes of the Loess Plateau during a drought year. Sci. Total Environ. 2019, 648, 943–954. [Google Scholar] [CrossRef] [PubMed]
- Migala, K.; Wojtun, B.; Szymanski, W.; Muskala, P. Soil moisture and temperature variation under different types of tundra vegetation during the growing season: A case study from the Fuglebekken catchment, SW Spitsbergen. Catena 2014, 116, 10–18. [Google Scholar] [CrossRef]
- Wang, S.; Fu, B.; Gao, G.; Liu, Y.; Zhou, J. Responses of soil moisture in different land cover types to rainfall events in a re-vegetation catchment area of the Loess Plateau, China. Catena 2013, 101, 122–128. [Google Scholar] [CrossRef]
- Wang, S.; Fu, B.J.; Gao, G.Y.; Yao, X.L.; Zhou, J. Soil moisture and evapotranspiration of different land cover types in the Loess Plateau, China. Hydrol. Earth Syst. Sc. 2012, 16, 2883–2892. [Google Scholar] [CrossRef] [Green Version]
- Zhu, Q.; Nie, X.F.; Zhou, X.B.; Liao, K.H.; Li, H.P. Soil moisture response to rainfall at different topographic positions along a mixed land-use hillslope. Catena 2014, 119, 61–70. [Google Scholar] [CrossRef]
- Katul, G.; Porporato, A.; Oren, R. Stochastic dynamics of plant-water interactions. Annu. Rev. Ecol. Evol. Syst. 2007, 38, 767–791. [Google Scholar] [CrossRef]
- Asbjornsen, H.; Goldsmith, G.R.; Alvarado-Barrientos, M.S.; Rebel, K.; Van Osch, F.P.; Rietkerk, M.; Chen, J.Q.; Gotsch, S.; Tobon, C.; Geissert, D.R.; et al. Ecohydrological advances and applications in plant-water relations research: A review. J. Plant Ecol. 2011, 4, 3–22. [Google Scholar] [CrossRef]
- D’Odorico, P.; Porporato, A. Preferential states in soil moisture and climate dynamics. Proc. Natl. Acad. Sci. USA 2004, 101, 8848–8851. [Google Scholar] [CrossRef] [PubMed] [Green Version]
- Seneviratne, S.I.; Corti, T.; Davin, E.L.; Hirschi, M.; Jaeger, E.B.; Lehner, I.; Orlowsky, B.; Teuling, A.J. Investigating soil moisture–climate interactions in a changing climate: A review. Earth-Sci. Rev. 2010, 99, 125–161. [Google Scholar] [CrossRef]
- Bell, J.E.; Sherry, R.; Luo, Y. Changes in soil water dynamics due to variation in precipitation and temperature: An ecohydrological analysis in a tallgrass prairie. Water Resour. Res. 2010, 46, W03523. [Google Scholar] [CrossRef]
- Zhang, S.Y.; Li, X.Y. Soil moisture and temperature dynamics in typical alpine ecosystems: A continuous multi-depth measurements-based analysis from the Qinghai-Tibet Plateau, China. Hydrol. Res. 2018, 49, 194–209. [Google Scholar] [CrossRef]
- Stocker, T.F.; Dahe, Q.; Plattner, G.K. Climate Change 2013: The Physical Science Basis. The Working Group I contribution to the Fifth Assessment Report of the Intergovernmental Panel on Climate Change (IPCC). 2013. Available online: http://www.ipcc.ch/report/ar5/wg1/ (accessed on 11 May 2015).
- Weltzin, J.F.; Loik, M.E.; Schwinning, S.; Williams, D.G.; Fay, P.A.; Haddad, B.M.; Harte, J.; Huxman, T.E.; Knapp, A.K.; Lin, G.H.; et al. Assessing the response of terrestrial ecosystems to potential changes in precipitation. Bioscience 2003, 53, 941–952. [Google Scholar] [CrossRef]
- Knapp, A.K.; Beier, C.; Briske, D.D.; Classen, A.T.; Luo, Y.; Reichstein, M.; Smith, M.D.; Smith, S.D.; Bell, J.E.; Fay, P.A.; et al. Consequences of more extreme precipitation regimes for terrestrial ecosystems. Bioscience 2008, 58, 811–821. [Google Scholar] [CrossRef]
- Gao, G.Y.; Zhan, H.B.; Feng, S.Y.; Fu, B.J.; Ma, Y.; Huang, G.H. A new mobile-immobile model for reactive solute transport with scale-dependent dispersion. Water Resour. Res. 2010, 46, W08533. [Google Scholar] [CrossRef]
- Vereecken, H.; Huisman, J.A.; Pachepsky, Y.; Montzka, C.; van der Kruk, J.; Bogena, H.; Weihermuller, L.; Herbst, M.; Martinez, G.; Vanderborght, J. On the spatio-temporal dynamics of soil moisture at the field scale. J. Hydrol. 2014, 516, 76–96. [Google Scholar] [CrossRef]
- Ryu, D.; Famiglietti, J.S. Characterization of footprint-scale surface soil moisture variability using Gaussian and beta distribution functions during the Southern Great Plains 1997 (SGP97) hydrology experiment. Water Resour. Res. 2005, 41, W12433. [Google Scholar] [CrossRef]
- Liu, H.; Zhao, W.Z.; He, Z.B. Self-organized vegetation patterning effects on surface soil hydraulic conductivity: A case study in the Qilian Mountains, China. Geoderma 2013, 192, 362–367. [Google Scholar] [CrossRef]
- He, Z.B.; Fang, S.; Chen, L.F.; Du, J.; Zhu, X.; Lin, P.F. Spatial patterns in natural Piceacrassifolia forests of northwestern China, as basis for close-to-nature forestry. J. Mt. Sci. 2018, 9, 1909–1919. [Google Scholar] [CrossRef]
- Lin, P.F.; He, Z.B.; Du, J.; Chen, L.F.; Zhu, X.; Li, J. Impacts of climate change on reference evapotranspirationin the Qilian Mountains of China: Historical trends and projected changes. Int. J. Climatol. 2018, 38, 2980–2993. [Google Scholar] [CrossRef]
- Zheng, X.L.; Zhao, C.Y.; Peng, S.Z.; Jian, S.Q.; Liang, B.; Wang, X.P.; Yang, S.F.; Wang, C.; Peng, H.H.; Wang, Y. Soil CO2 efflux along an elevation gradient in Qinghai spruce forests in the upper reaches of the Heihe River, northwest China. Environ. Earth Sci. 2014, 71, 2065–2076. [Google Scholar] [CrossRef]
- Sala, O.E.; Lauenroth, W.K. Small rainfall events: An ecological role in semiarid regions. Oecologia 1982, 53, 301–304. [Google Scholar] [CrossRef] [PubMed]
- Wang, X.P.; Cui, Y.; Pan, Y.X.; Li, X.R.; Yu, Z.; Young, M.H. Effects of rainfall characteristics on infiltration and redistribution patterns in revegetation-stabilized desert ecosystems. J. Hydrol. 2008, 358, 134–143. [Google Scholar] [CrossRef]
- Crockford, R.H.; Richardson, D.P. Partitioning of rainfall into throughfall, stemflow and interception: Effect of forest type, ground cover and climate. Hydrol. Process 2000, 14, 2903–2920. [Google Scholar] [CrossRef]
- Stavi, I.; Lavee, H.; Ungar, E.D.; Sarah, P. Ecogeomorphicfeedbacks in semiarid rangelands: A review. Pedosphere 2009, 19, 217–229. [Google Scholar] [CrossRef]
- Wang, C.; Zhao, C.; Xu, Z.; Wang, Y.; Peng, H. Effect of vegetation on soil water retention and storage in a semi-arid alpine forest catchment. J. Arid Land 2013, 5, 207–219. [Google Scholar] [CrossRef]
- D’Odorico, P.; Caylor, K.; Okin, G.S.; Scanlon, T.M. On soil moisture-vegetation feedbacks and their possible effects on the dynamics of dryland ecosystems. J. Geophys. Res. 2007, 112, G04010. [Google Scholar] [CrossRef]
- Ding, Y.; Huang, H.; Wang, L.; Zhang, Z.Q.; Zhang, W.H. Effect of different organic matter content on soil moisture dynamics. Appl. Mech. Mater. 2014, 477–478, 481–484. [Google Scholar] [CrossRef]
- Moran, M.S.; Hamerlynck, E.P.; Scott, R.L.; Stone, J.J.; Collins, C.D.H.; Keefer, T.O.; Bryant, R.; DeYoung, L.; Nearing, G.S.; Sugg, Z.; et al. Hydrologic response to precipitation pulses under and between shrubs in the Chihuahuan Desert, Arizona. Water Resour. Res. 2010, 46, W10509. [Google Scholar] [CrossRef]
- Pockman, W.T.; Small, E.E. The influence of spatial patterns of soil moisture on the grass and shrub responses to a summer rainstorm in a Chihuahuandesert ecotone. Ecosystems 2010, 13, 511–525. [Google Scholar] [CrossRef]
- Yang, F.; Zhang, G.L.; Yang, J.L.; Li, D.C.; Zhao, Y.G.; Liu, F.; Yang, R.M.; Yang, F. Organic matter controls of soil water retention in an alpine grassland and its significance for hydrological processes. J. Hydrol. 2014, 519, 3086–3093. [Google Scholar] [CrossRef]
- Caylor, K.K.; Shugart, H.H.; Rodriguez-Iturbe, I. Tree canopy effects on simulated water stress in Southern African savannas. Ecosystems 2005, 8, 17–32. [Google Scholar] [CrossRef]
- Porporato, A.; Laio, F.; Ridolfi, L.; Caylor, K.K.; Rodriguez-Iturbe, I. Soil moisture and plant stress dynamics along the Kalahari precipitation gradient. J. Geophys. Res. 2003, 108, 4127. [Google Scholar] [CrossRef]
- Porporato, A.; Laio, F.; Ridolfi, L.; Rodriguez-Iturbe, I. Plants in water-controlled ecosystems: Active role in hydrologic processes and response to water stress III. Vegetation water stress. Adv. Water Resour. 2001, 24, 725–744. [Google Scholar] [CrossRef]
- Jenerette, G.D.; Barron-Gafford, G.A.; Guswa, A.J.; McDonnell, J.J.; Villegas, J.C. Organization of complexity in water limited ecohydrology. Ecohydrology 2012, 5, 184–199. [Google Scholar] [CrossRef]
- D’Odorico, P.; Ridolfi, L.; Porporato, A.; Rodriguez-Iturbe, I. Preferential states of seasonal soil moisture: The impact of climate fluctuations. Water Resour. Res. 2000, 36, 2209–2219. [Google Scholar] [CrossRef] [Green Version]
- Lee, T.R.; Hornberger, G.M. Inferred bimodality in the distribution of soil moisture at Big Meadows, Shenandoah National Park, Virginia. Geophys. Res. Lett. 2006, 33, L06407. [Google Scholar] [CrossRef]
- Teuling, A.J.; Uijlenhoet, R.; Troch, P.A. On bimodality in warm season soil moisture observations. Geophys. Res. Lett. 2005, 32, L13402. [Google Scholar] [CrossRef]
- Liu, H.; Zhao, W.Z.; He, Z.B.; Zhang, L.J. Stochastic modelling of soil moisture dynamics in a grassland of Qilian Mountain at point scale. Sci. China Ser. D-Earth Sci. 2007, 50, 1844–1856. [Google Scholar] [CrossRef]
- Yin, X.Z.; Zhang, Q.; Xu, Q.Y.; Xue, W.X.; Guo, H.; Shi, Z.J. Characteristics of climate change in qilianmountains region in recent 50 years. Plateau Meteorol. 2009, 28, 85–90. (in Chinese). [Google Scholar]
- Turner, N.C.; Kramer, P.J. Adaptations of Plants to Water and High Temperature Stress; John Wiley: New York, NY, USA, 1980; pp. 1–20. [Google Scholar]
- Ferrante, D.; Oliva, G.E.; Fernández, R.J. Soil water dynamics, root systems, and plant responses in a semiarid grassland of Southern Patagonia. J. Arid Environ. 2014, 104, 52–58. [Google Scholar] [CrossRef]
Figure 1.
Map of the study area and the three typical vegetation types.

Figure 2.
Dynamics of the mean soil moisture, soil temperature, and precipitation profiles during June and September (FMSM—spruce forest mean soil moisture, SMSM—shrubland mean soil moisture, GMSM—grassland mean soil moisture, FMST—spruce forest mean soil temperature, SMST—shrubland mean soil temperature, and GMST—grassland mean soil temperature). The area between the two red dotted lines was chosen to calculate water loss.

Figure 3.
Analysis of soil moisture at multiple depths under different vegetation types during the growing season. The statistical differences are shown using a, b, and c (n = 120).
Figure 3.
Analysis of soil moisture at multiple depths under different vegetation types during the growing season. The statistical differences are shown using a, b, and c (n = 120).

Figure 4.
Frequency and cumulative frequency distribution of soil moisture at different soil depths in the three typical types of vegetation during the growing season.
Figure 4.
Frequency and cumulative frequency distribution of soil moisture at different soil depths in the three typical types of vegetation during the growing season.

Figure 5.
Analysis of soil temperature at different soil depths under different vegetation types during the growing season. The statistical differences are shown using a, b, and c (n = 120).
Figure 5.
Analysis of soil temperature at different soil depths under different vegetation types during the growing season. The statistical differences are shown using a, b, and c (n = 120).

Figure 6.
Frequency and cumulative frequency distribution of soil temperature at different soil depths in the three typical types of vegetation during the growing season.
Figure 6.
Frequency and cumulative frequency distribution of soil temperature at different soil depths in the three typical types of vegetation during the growing season.

Figure 7.
The regression relationship between water loss and daily average soil moisture at the surface soil (0–40 cm) under three vegetation types.
Figure 7.
The regression relationship between water loss and daily average soil moisture at the surface soil (0–40 cm) under three vegetation types.

Figure 8.
The regression relationship between water loss and soil moisture at different soil depths in grassland.
Figure 8.
The regression relationship between water loss and soil moisture at different soil depths in grassland.

Figure 9.
The regression relationship between average soil moisture and average soil temperature at the surface soil (0–40 cm) under three vegetation types.
Figure 9.
The regression relationship between average soil moisture and average soil temperature at the surface soil (0–40 cm) under three vegetation types.


Table 1.
The average of soil properties among three vegetation types within the entire observational zone.
Table 1.
The average of soil properties among three vegetation types within the entire observational zone.
| Soil Properties | Shrubland | Spruce Forest | Grassland | |||
|---|---|---|---|---|---|---|
| Mean | Standard Error | Mean | Standard Error | Mean | Standard Error | |
| Clay (%) | 0.71 | 0.08 | 0.81 | 0.02 | 2.20 | 0.17 |
| Silt (%) | 58.12 | 4.18 | 55.39 | 2.56 | 80.27 | 2.24 |
| Sand (%) | 41.17 | 4.23 | 43.80 | 2.58 | 17.53 | 2.40 |
| Bulk density (g/cm3) | 0.84 | 0.07 | 0.75 | 0.10 | 0.95 | 0.06 |
| Soil organic matter (g/kg) | 70.63 | 6.18 | 62.72 | 2.55 | 16.91 | 3.80 |
| Porosity (%) | 70.10 | 2.91 | 71.69 | 3.88 | 64.14 | 2.34 |
| Field capacity (%) | 47.83 | 3.13 | 45.29 | 5.99 | 39.77 | 1.71 |
Table 2.
Comparison of soil water content at different depths by one-factor analysis of variance.
| Soil Depth (cm) | Degrees of Freedom | Sum of Squares | Mean Square | F-Value | p-Value |
|---|---|---|---|---|---|
| 0–10 cm | 2 | 0.29653 | 0.14826 | 240.3421 | <0.0001 |
| 10–20 cm | 2 | 0.21465 | 0.10733 | 178.4466 | <0.0001 |
| 20–40 cm | 2 | 1.89643 | 0.94821 | 1766.88 | <0.0001 |
| 40–60 cm | 2 | 1.53584 | 0.76792 | 1702.211 | <0.0001 |
| 60–80 cm | 2 | 1.89761 | 0.9488 | 2647.561 | <0.0001 |
Table 3.
Comparison of soil temperature at different depths by one-factor analysis of variance.
| Soil Depth (cm) | Degrees of Freedom | Sum of Squares | Mean Square | F-Value | p-Value |
|---|---|---|---|---|---|
| 0–10 cm | 2 | 1989.968 | 994.9841 | 188.9363 | <0.0001 |
| 10–20 cm | 2 | 2398.674 | 1199.337 | 322.1715 | <0.0001 |
| 20–40 cm | 2 | 2800.094 | 1400.047 | 597.3742 | <0.0001 |
| 40–60 cm | 2 | 3950.727 | 1975.363 | 762.2848 | <0.0001 |
| 60–80 cm | 2 | 3773.258 | 1886.629 | 707.2228 | <0.0001 |
© 2019 by the authors. Licensee MDPI, Basel, Switzerland. This article is an open access article distributed under the terms and conditions of the Creative Commons Attribution (CC BY) license (http://creativecommons.org/licenses/by/4.0/).
Share and Cite
MDPI and ACS Style
Hu, J.; Lü, D.; Sun, F.; Lü, Y.; Chen, Y.; Zhou, Q. Soil Hydrothermal Characteristics among Three Typical Vegetation Types: An Eco-Hydrological Analysis in the Qilian Mountains, China. Water 2019, 11, 1277. https://doi.org/10.3390/w11061277
AMA Style
Hu J, Lü D, Sun F, Lü Y, Chen Y, Zhou Q. Soil Hydrothermal Characteristics among Three Typical Vegetation Types: An Eco-Hydrological Analysis in the Qilian Mountains, China. Water. 2019; 11(6):1277. https://doi.org/10.3390/w11061277
Chicago/Turabian StyleHu, Jian, Da Lü, Feixiang Sun, Yihe Lü, Youjun Chen, and Qingping Zhou. 2019. "Soil Hydrothermal Characteristics among Three Typical Vegetation Types: An Eco-Hydrological Analysis in the Qilian Mountains, China" Water 11, no. 6: 1277. https://doi.org/10.3390/w11061277
Note that from the first issue of 2016, this journal uses article numbers instead of page numbers. See further details here.