Experimental Analysis and Modeling of Nitrate Removal through Zero-Valent Magnesium Particles


Laboratory of Environmental Sanitary Engineering, Department of Environmental and Chemical Engineering, University of Calabria, P. Bucci, 87036 Rende, Italy
*
Author to whom correspondence should be addressed.
Water 2019, 11(6), 1276; https://doi.org/10.3390/w11061276
Submission received: 19 April 2019
/
Revised: 7 June 2019
/
Accepted: 14 June 2019
/
Published: 18 June 2019
(This article belongs to the Special Issue Challenges and Opportunities in Wastewater Reuse)
Abstract
:The pollution of water by nitrates represents an important environmental and health issue. The development of sustainable technologies that are able to efficiently remove this contaminant is a key challenge in the field of wastewater treatment. Chemical denitrification by means of zero-valent metallic elements is an interesting method to reduce the oxidized forms of nitrogen. Compared to other metallic reactants, zero-valent magnesium (ZVM) has many profitable aspects, but its use for nitrate removal has scarcely been investigated. In the present work, several batch tests were conducted to examine the concurrent effects of pH, initial nitrate concentration and Mg0 quantity on process performance. The experimental results proved that at pH 3, for a given initial nitrate concentration, the dose of ZVM largely influences process efficiency. In particular, with a ratio between Mg0 and initial N-NO3− amount (Mg/NNi) of 0.33 g/mg, it is possible to obtain complete denitrification within 30 min. Beyond this ratio, no further improvement of treatment was observed. The experiments allowed us to identify the nitrogen forms produced during the treatment. Nitrogen gas was generally the main reaction product, but the trends of the different compounds (NO3−, NO2−, NH4+ and N2) notably changed in response to the modification of operating parameters. Moreover, the results demonstrated that, in a highly acidic environment, when treating solutions with a low nitrate concentration, process performances are unsatisfactory even when using a high Mg/NNi ratio. By increasing the process pH to 5 and 7, a significant denitrification decline occurred. Furthermore, at these pH levels, the enhancement of nitrate concentration caused a progressive process deterioration. Through detailed analysis of experimental results, reactions kinetics and new mathematical equations, able to describe the trends of different nitrogen forms, have been defined. Moreover, reactions pathways have been proposed. Finally, the characterization of exhausted material allowed us to identify the corrosion products formed during the treatment.
1. Introduction
Nitrate, due to its elevated solubility and wide employment in many activities, is one of the most common pollutants of surface water bodies and groundwater [1]. The release of nitrogen contaminants into the environment is mainly attributable to the exploitation of chemical fertilizers and animal manure in agricultural practices and, furthermore, to the discharge of municipal and industrial wastewater [2,3,4,5]. High NO3− concentrations lead to severe environmental issues because they promote the occurrence of eutrophication phenomena. Moreover, the nitrate contamination of drinking water sources may cause diseases such as methemoglobinemia in infants and stomach cancer in adults [4]. Therefore, the development and application of sustainable technologies that are able to efficiently remove this contaminant represent important challenges in the field of wastewater treatment. Furthermore, the abatement of nitrogen compounds is a necessary objective for the reuse of wastewater, which has become a key factor in water resources management.
Several biological and physical-chemical techniques such as biological denitrification, adsorption, ion exchange and reverse osmosis have been applied for the removal of NO3−. Nevertheless, biological denitrification requires a source of organic matter and produces an excess of sludge which must be stabilized before disposal [6,7,8]. Furthermore, biological processes generally show slower reaction rates in comparison to chemical techniques and, in some cases, do not allow the fulfillment of the requirements for wastewater reuse. Adsorption, ion exchange and reverse osmosis are not nitrate selective, need a periodic regeneration of materials and, moreover, produce concentrated waste [6]. Therefore, these techniques are expensive and not profitable for field applications.
In recent years, among emerging treatment technologies, chemical denitrification through zero-valent metals, such as Fe0 and Al0, has gained great interest [8,9]. In particular, zero-valent iron has been largely investigated as a reactive material for NO3− removal from water and wastewater [9,10,11,12,13,14,15]. Indeed, the use of Fe0 has several advantages because this metal is plentiful, easily available, low in cost and its reduction treatments are easy to manage [10,11,12,13,14,15,16]. The efficiency of zero-valent iron (ZVI) processes is pH-dependent [11,12,13,14]. Appreciable NO3− removals occur at low pH values, which is most likely connected to the superior reactivity of iron in acid solutions [15,16,17]. At higher pH values, iron corrosion products, such as iron oxides and hydroxides, coat the Fe0 surface and significantly slow down the nitrate reduction process. To overcome some of these aspects, experiments were carried out on treatment solutions with the addition of Fe2+, which is able to locally convert corrosion products into reactive compounds and, thus, promote NO3− removal [17]. The process performance can be notably improved by using nanoscopic zero-valent iron particles (nZVI). In fact, compared to microscopic ZVI (mZVI), Fe0 nanoparticles, due to their greater specific surface and more active superficial sites, guarantee greater reactivity [18,19,20,21]. Nevertheless, due to magnetic interactions, nZVI tend to form larger agglomerates which have less reactivity. Moreover, nanoparticles can be easily transported by flow, causing secondary pollution phenomena in water bodies. In order to avoid these drawbacks of nanoparticles, research is in progress to test bimetallic systems, supported nanoparticles, ultrasound assisted processes and pretreatment with acids, among others [22,23,24,25,26,27,28]. Therefore, there is a need to identify low cost, abundant, readily available, non-toxic reactive materials that are able to efficiently remove pollutants under ambient conditions. In this regard, zero-valent Mg (ZVM) represents a valid reductant for potential applications in the treatment of aqueous solutions [4,29,30,31,32]. Indeed, ZVM is an environmentally friendly metal, which is characterized by a higher reduction potential (−2.363 V) compared to Fe0 (−0.44 V) [4]. In addition to its superior reactivity with respect to ZVI, Mg0 shows many other profitable aspects. In particular, in ZVM applications, surface passivation phenomena are less marked as a consequence of the higher solubility of magnesium corrosion products [4,29,30]. These reaction products (Mg2+ compounds), in any case, are not hazardous to water systems, do not cause health problems and can be easily removed [29,30]. Furthermore, zero-valent magnesium can be applied under both aerobic and anaerobic conditions [29,30]. Nevertheless, the application of ZVM for the removal of contaminants from water and wastewater has not yet been extensively investigated. In fact, there is a need to better clarify many aspects such as kinetics laws and reaction products formation during nitrate reduction.
To overcome these shortcomings, the objectives of this work were to investigate the concomitant factors affecting the process evolution, to analyze the mechanisms and the reaction kinetics of pollutants removal and to define a mathematical model describing the several transformations occurring during treatment. A thorough experimental investigation was conducted by using commercial zero-valent magnesium particles for the removal of nitrate from standard aqueous solutions under several operating conditions. In particular, batch tests were carried out to investigate the concurrent effects of pH, initial nitrate concentration and Mg0 quantity on process performances. The tests allowed us to identify the curves of nitrogen species (NO3−, NO2−, NH4+ and N2) in response to changes in process parameters. Through a detailed kinetic study, kinetics laws were defined and a mathematical model describing the trends of different nitrogen forms was developed. Moreover, reactions pathways were proposed. By means of SEM-WDS (scanning electron microscopy; wavelength dispersive spectroscopy) and XRD (X-ray diffraction), the modifications of ZVM after reaction with nitrate were identified.
2. Materials and Methods
2.1. Reagents
Tests were carried out using chemicals of analytical grade. Specifically, commercial microscopic Mg0, purchased from Sigma Aldrich (St Louis, Missouri, MO, USA), was used as a reactive material. The Mg0 powder was characterized in terms of dimension, specific surface area, morphology, microstructure and composition. The magnesium particles were applied in the experiments without any pretreatment or refinement. Potassium nitrate (KNO3), HCl (31%) and NaOH, supplied by Carlo Erba (Milan, Italy), were employed to perform the nitrate removal tests. Double-distilled water was used to prepare the reagents solutions.
2.2. Denitrification Batch Tests
The investigations aimed to identify the concomitant influence of ZVM quantity, pH and nitrate concentration on process performance. In this regard, in order to define the optimal quantity of reactive material, a first set of six experiments was performed at pH 3, by testing dosages of Mg0 between 0.5 and 10 g for the treatment of solutions with an initial N-NO3− concentration (NNi) of 20 mg/L (Table 1).
Afterwards, with the Mg0 amount identified through the first tests, further series of experiments were conducted at pH 3, 5 and 7 (Table 2). During each set, six tests were performed by treating solutions characterized by an initial nitrate nitrogen concentration (NNi) between 10 mg/L and 100 mg/L (Table 2).
All experiments were executed at room pressure and temperature (20 ± 2 °C) in 0.4 L glass beakers. In a typical test, the reactor was filled with 300 mL of a standard solution, prepared using KNO3 powder as the nitrate source, characterized by a fixed initial N-NO3− concentration. Subsequently, the pH was set to the planned value by means of HCl (1 M) and/or NaOH (4 M). Then, the quantity of ZVM particles was added to the reaction solution and the mixture was stirred at 350 rpm, using a magnetic stirrer (VelpScientifica, Arex-Monza and Brianza, Italy), for a reaction time of 185 min. During the tests, the pH was continuously monitored and HCl was added to hold it to the planned value. No action was taken to eliminate the oxygen dissolved in the reaction solutions. Samples of 5 mL were periodically withdrawn and immediately analyzed, after a filtration step, with respect to nitrogen compounds (N-NO3−, N-NO2− and N-NH4+) and to dissolved magnesium ions. Moreover, after the treatment, the residual reactive material was recovered and analyzed in terms of morphology, microstructure and composition.
2.3. Analytical Methods and the Presentation of Results
The values of temperature and pH for treatment solutions were monitored by means of a bench analyzer (Hanna Instruments, HI 9024-Woonsocket, Rhode Island, RI, USA). On samples withdrawn during the tests, the concentrations of nitrogen forms were measured through colorimetric methods [33], using a UV-visible spectrophotometer (ThermoFisher, Genesys 10 UV- Waltham, Massachusetts, MA, USA) [33]. Specifically, nitrate nitrogen (N-NO3−) was analyzed at a wavelength of 220 nm, nitrous nitrogen (N-NO2−) was measured by the sulphanilamide method at 543 nm, ammonium nitrogen (N-NH4+) was estimated by the phenate method at a wavelength of 640 nm, after removing di-valent magnesium ions at high pH [4]. The concentration of Mg2+ ions was determined through atomic absorption spectrometry (GBC, 933 plus-Hampshire, Illinois, IL, USA) [33].
The dimensions of magnesium particles were measured using a particle size analyzer (Malvern Mastersize 3000-Malvern, Worcestershire, UK), the specific surface area was estimated by means of the BET-N2 (Brunauer–Emmett–Teller) adsorption method (ThermoFisher, Sorptomatic 1990-Waltham, Massachusetts, MA, USA). X-ray diffraction (GNR, APD 2000 pro-Novara, Italy) scanning electron microscopy and wavelength dispersive spectroscopy (JEOL, JXA-8230-Peabody, Massachusetts, MA, USA) were applied to analyze the reactive materials before and after reaction with the NO3− solutions.
Each analysis was carried out in triplicate and the mean value was considered. The values of relative standard deviation were always lower than 5%.
3. Results and Discussion
3.1. Characteristics of the Reactive Material
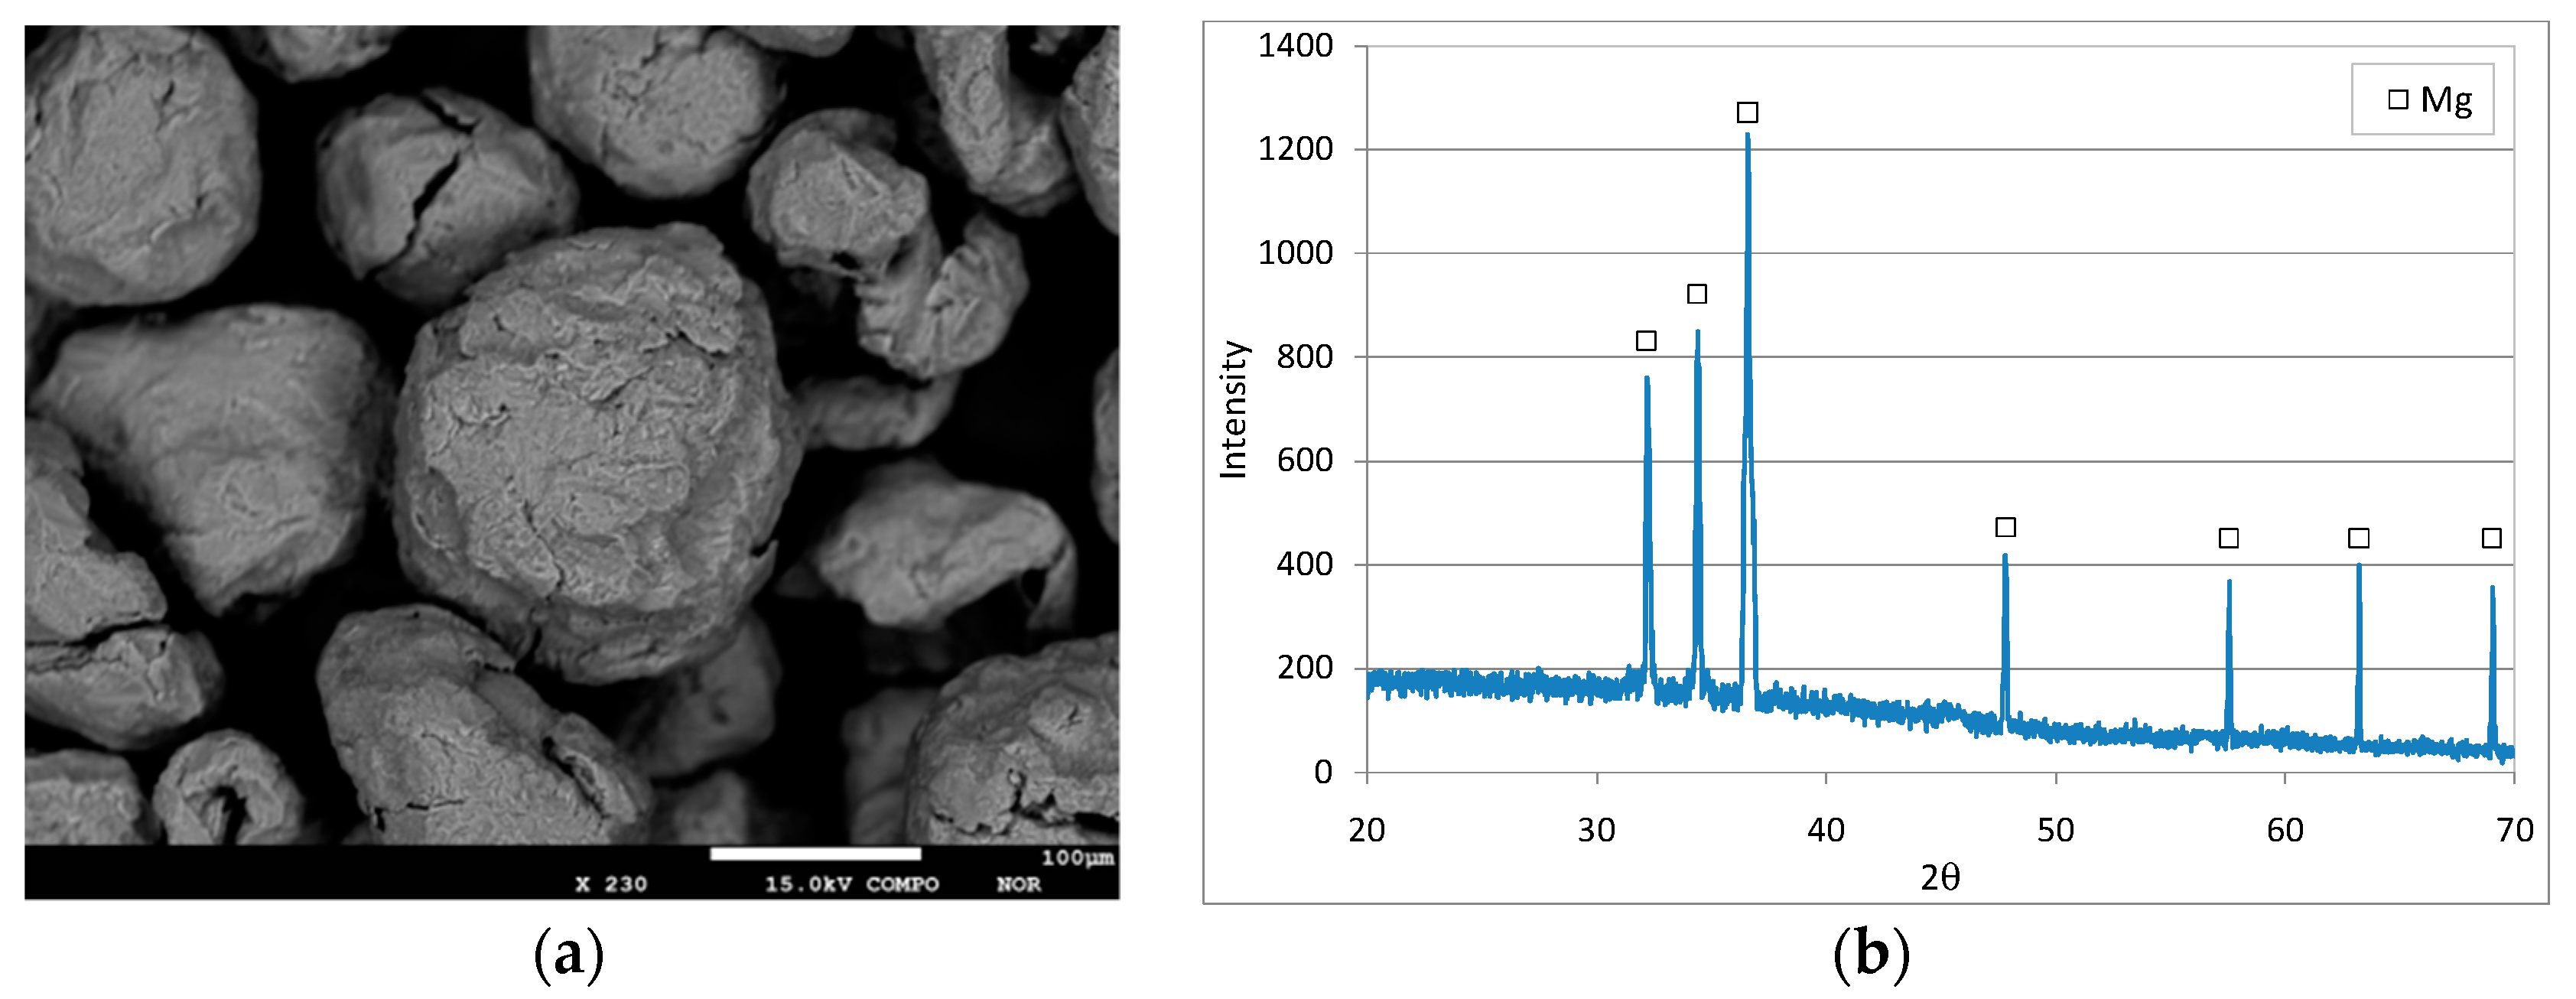
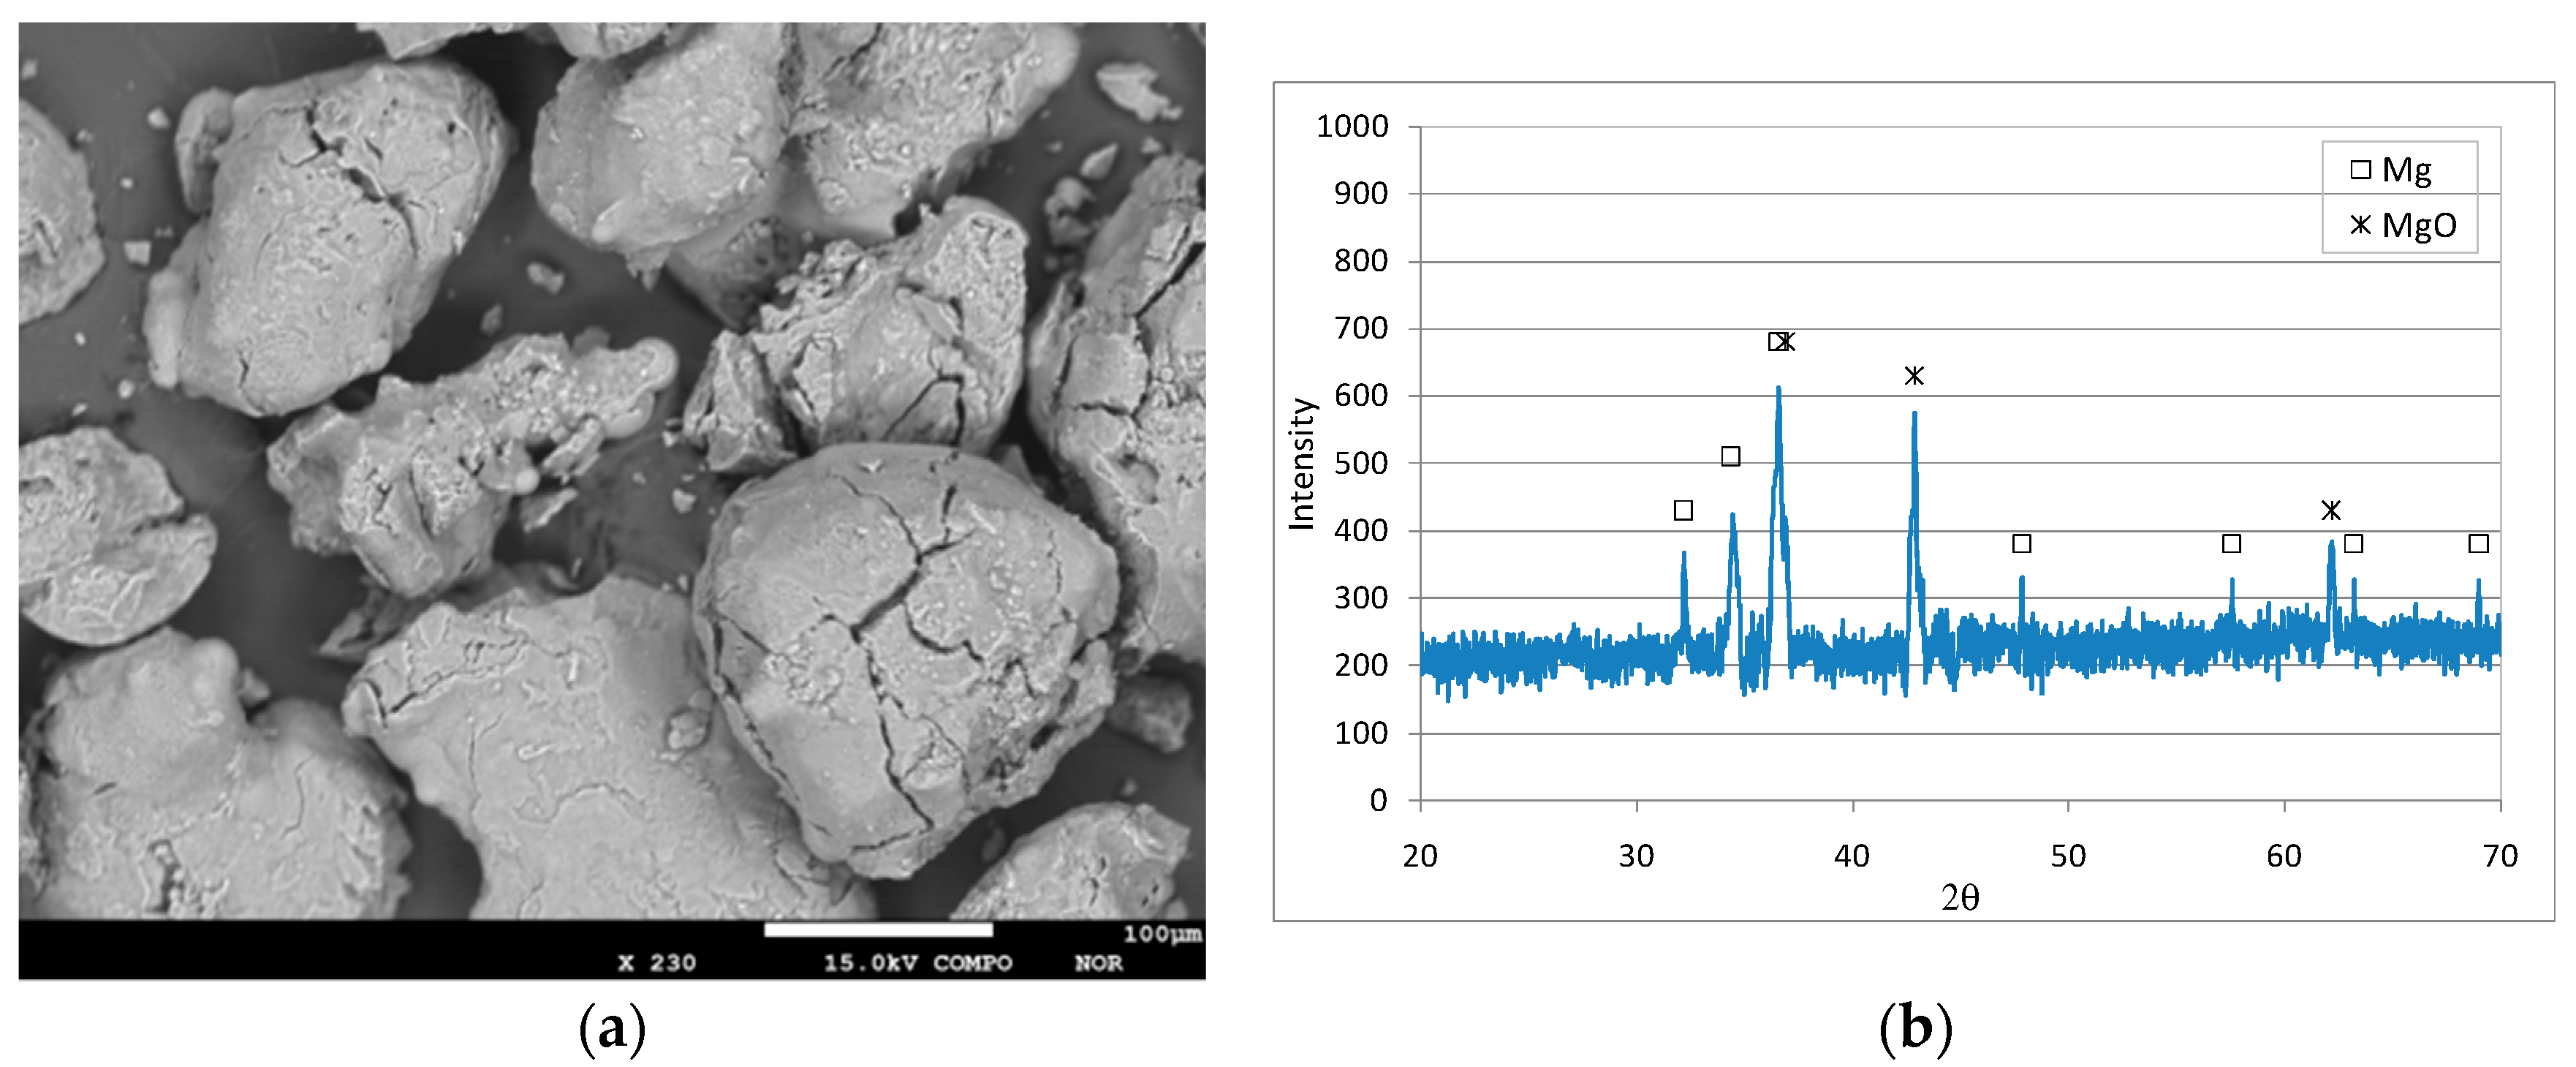
The magnesium particles (purity 99% and density 1.74 g/mL) used in this work had an overall size range of 60 μm and 510 μm, with the majority of particles characterized by dimensions between 200 μm and 300 μm. They showed both pseudo-spherical and irregular shapes, with a mildly rough and jagged surface. The specific surface area (A) was about 0.0204 m2/g.
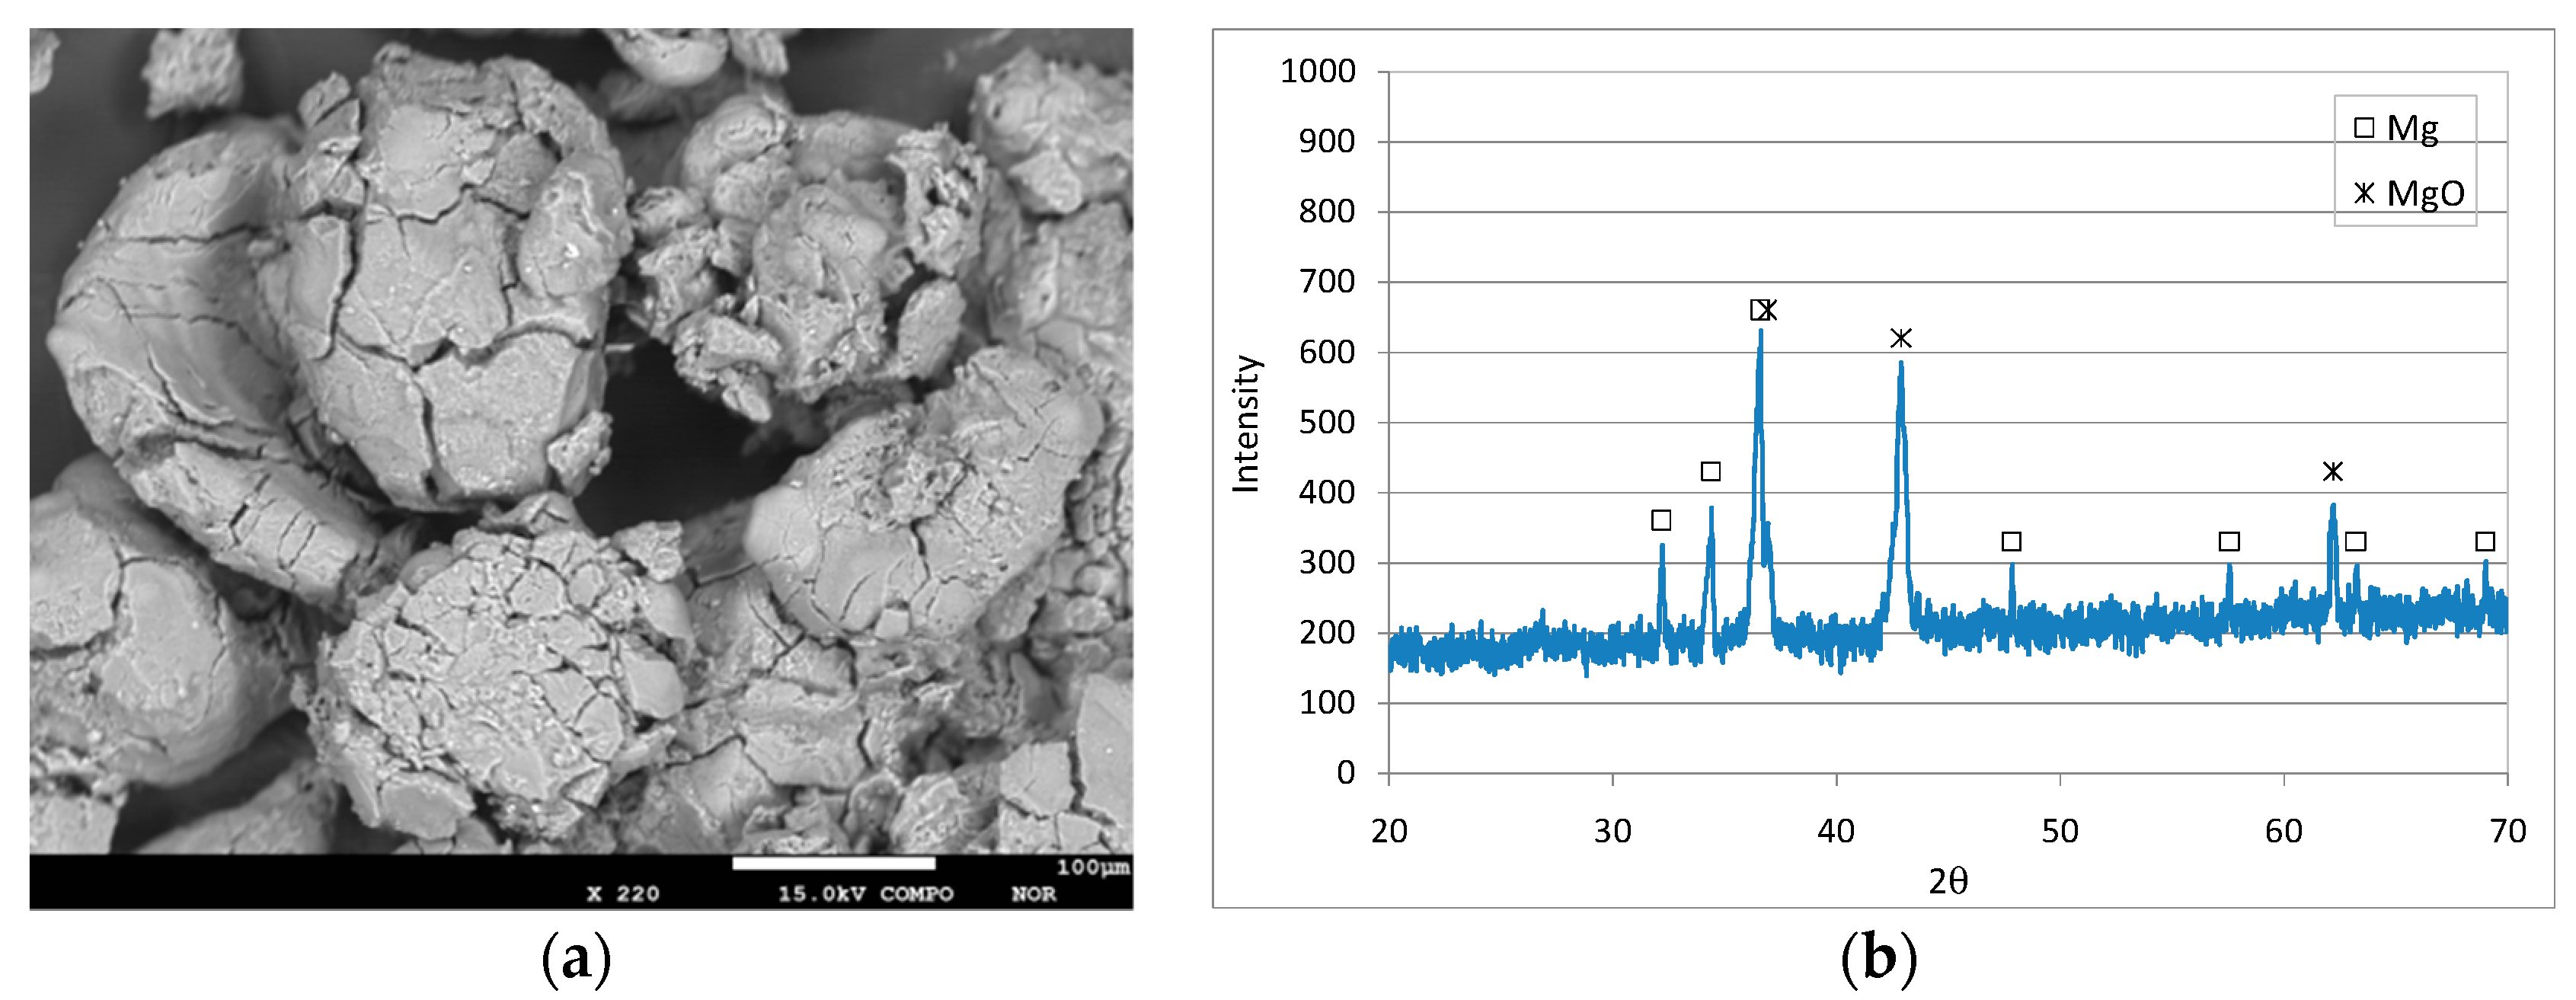
Figure 1 shows a SEM image and a diffractogram of the fresh reactive material. The XRD analysis clearly showed the typical peaks of zero-valent magnesium without significant evidence of any other compounds (Figure 1b). The WDS analysis confirmed that the material was almost completely composed of Mg0 (99.2%), with only small aliquots of oxygen (0.6%) and traces of other elements (0.2%). The matching of the detected diffractogram with the standard of zero-valent magnesium (Figure 1b) and the very low presence of oxygen measured by WDS analysis proved that the Mg0 particles were not oxidized before their application in denitrification tests.
3.2. Tests Conducted with Different Quantity of ZVM
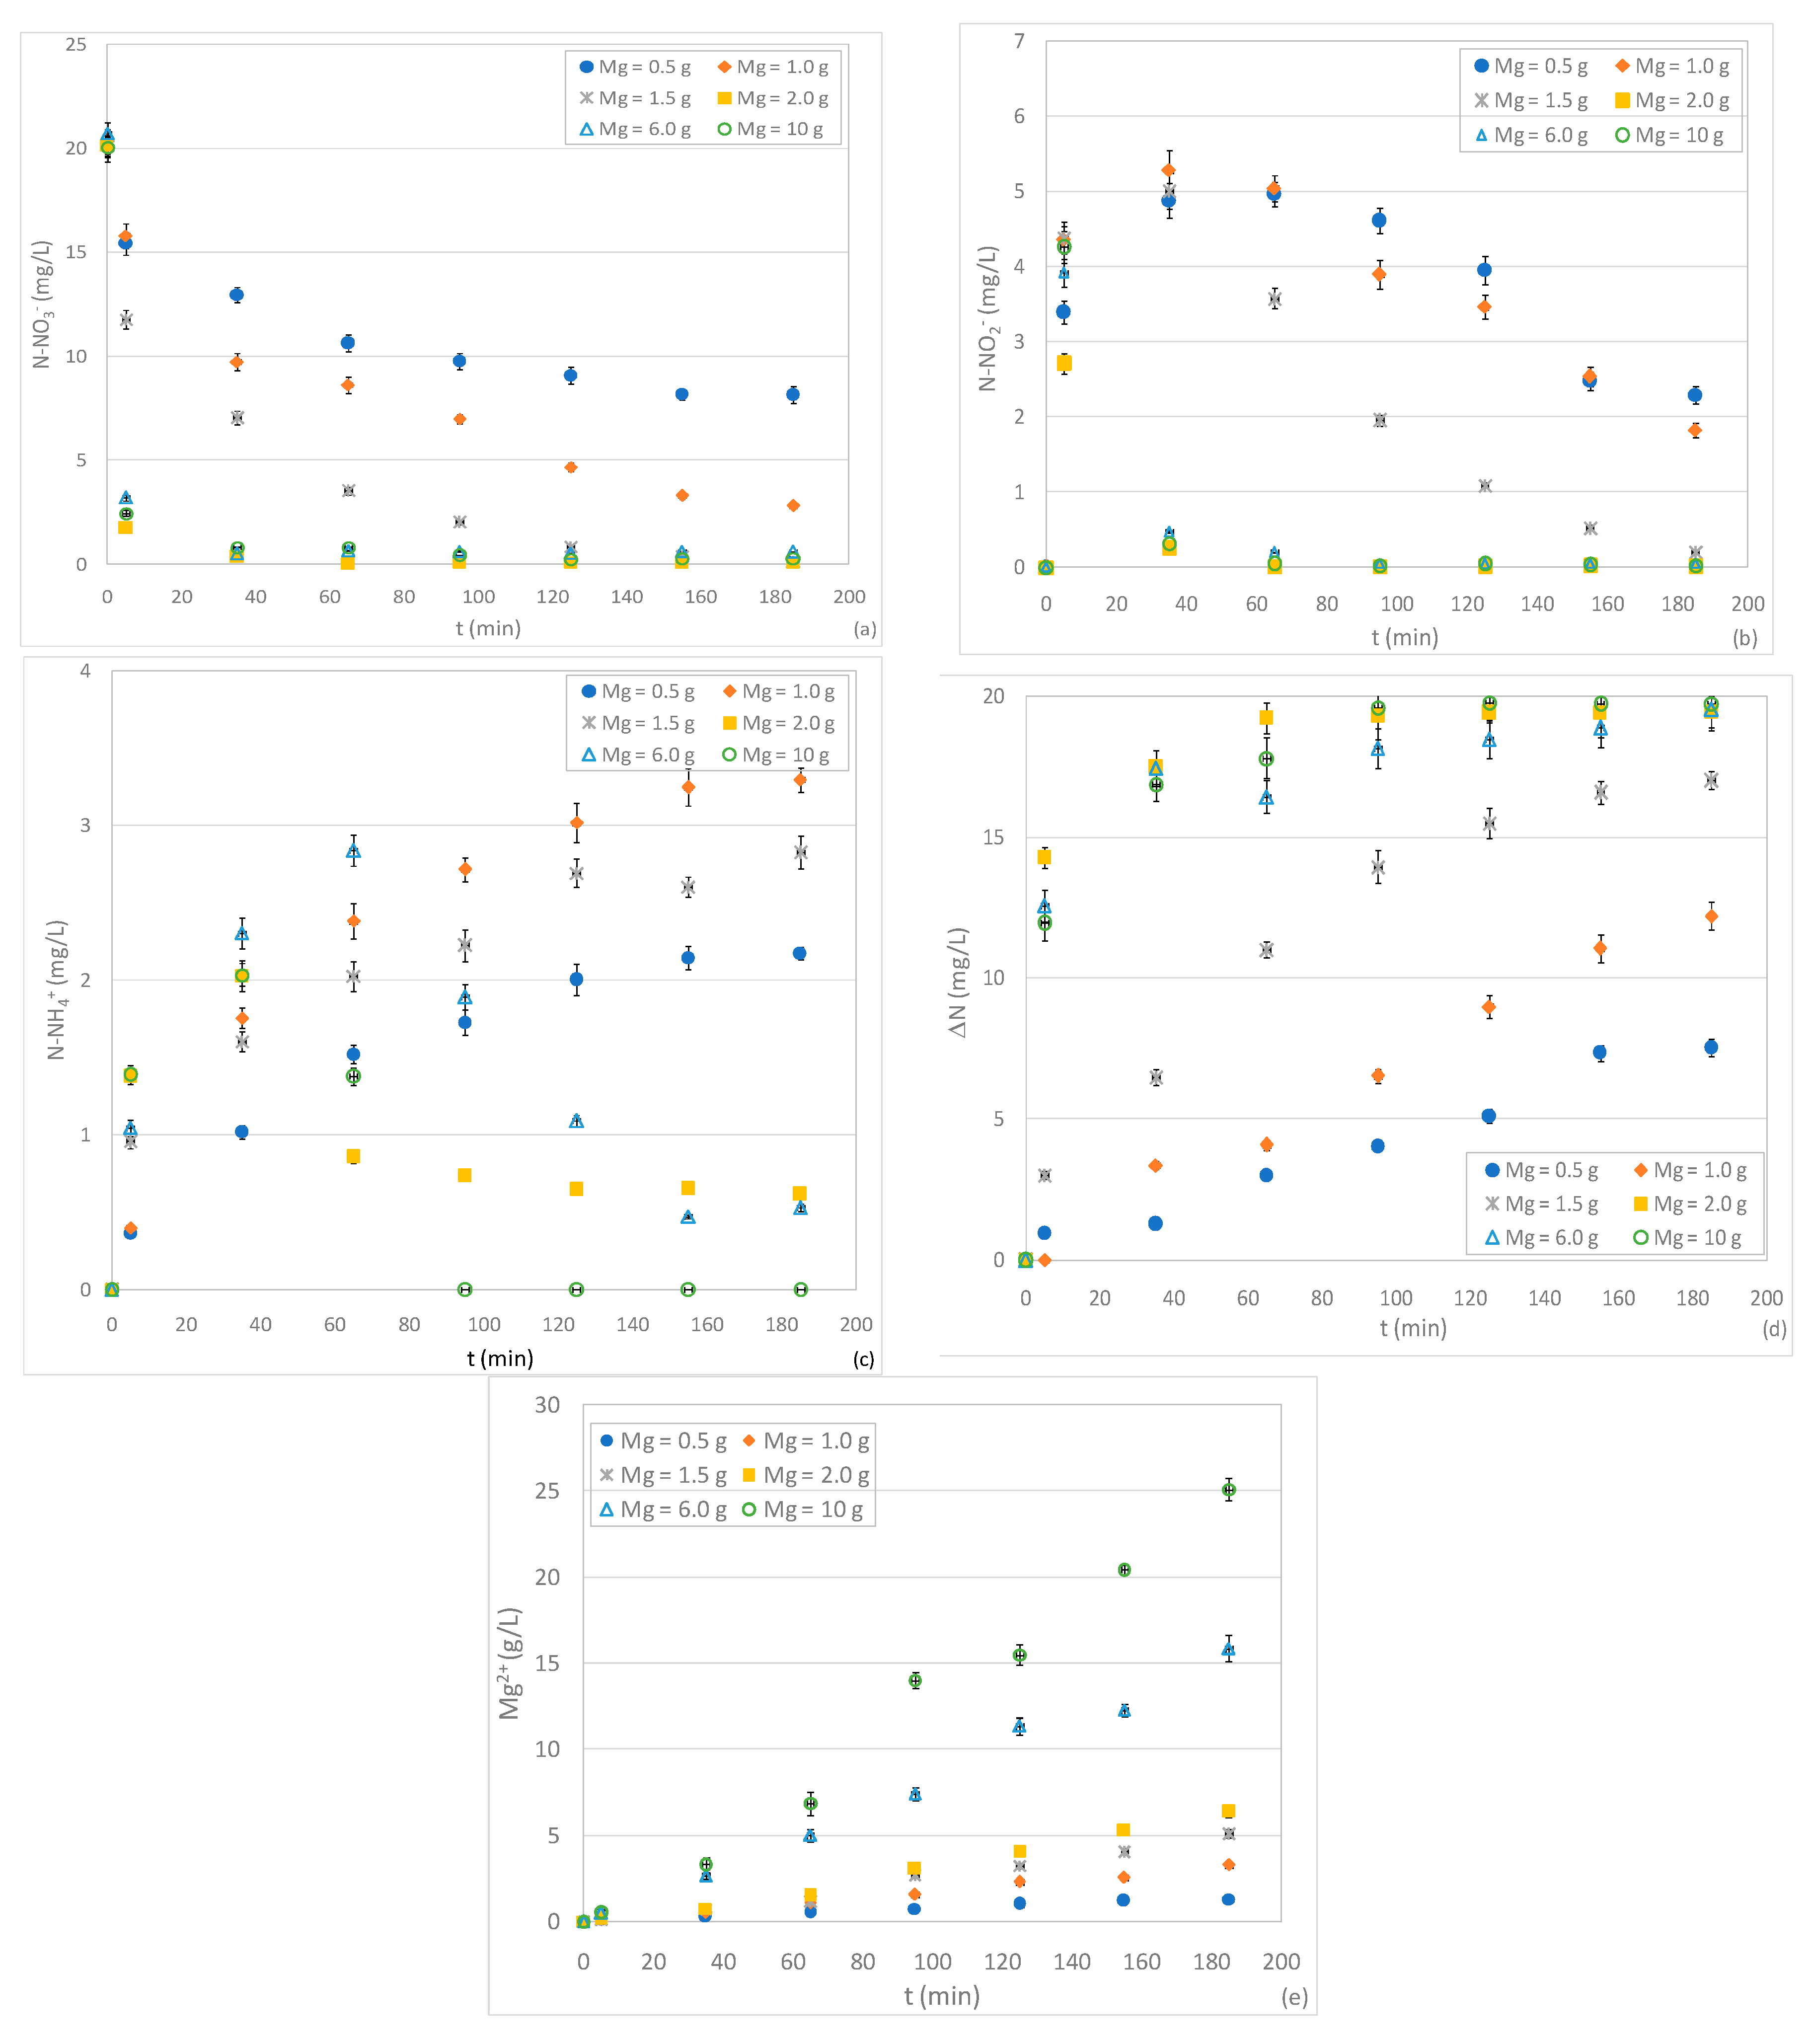
The first set of experiments was carried out to evaluate, for a given initial N-NO3− concentration (20 mg/L) and acid conditions (pH 3), the effect of zero-valent magnesium dosage on nitrate reduction. Six tests were performed with Mg0 amounts of 0.5, 1, 1.5, 2, 6 and 10 g. The obtained results showed time decreasing trends typical of batch processes. In particular, by using a magnesium quantity of 0.5 g, the curve of nitrate concentration reached an asymptotic value of about 8 mg/L, with an abatement percentage close to 60% (Figure 2a). The reaction rate quickly increased in response to the enhancement of reactive material amount. In fact, the overall removal yield grew to 86% and 99.5% by using ZVM dose of 1 and 1.5 g, respectively (Figure 2a). Furthermore, by increasing the Mg0 quantity to 2 g, an abatement of about 91% was reached during the first five minutes and the nitrate was almost completely reduced in about half an hour (Figure 2a). The further enhancement of reactive material did not produce any additional benefit on process performance. The positive effect of Mg0 quantity was observed in previous works which, however, did not identify the threshold dosage corresponding to the maximum denitrification yield [4,32], probably due to the ZVM and nitrate quantities that were tested [4,32]. On the basis of the results of the present study, it is clear that the reaction rate, the time needed to reach a given abatement, and the maximum efficiency are affected by the dose of Mg0 in relation to initial N-NO3− content. Indeed, by considering the ratio between Mg0 and initial N-NO3− amount (Mg/NNi), a value of 0.16 g/mg (1 g of Mg0) is sufficient to obtain a nitrate reduction higher than 85% in about 3 h. With the increase of Mg/NNi to 0.33 g/mg (2 g of Mg0), it is possible to reach the highest detectable abatement of about 91% in only 5 min.
Taking into account the specific surface area of reactive material A = 0.0204 m2/g and by reporting the nitrate content in terms of moles, the above Mg/NNi ratio (0.33 g/mg) results equal 95.2 m2/mol. This value is lower than that observed in previous studies conducted using zero-valent iron as a reactive material. Indeed, an iron/nitrate ratio of 120 m2/mol was recommended to achieve complete nitrate removal in a reaction time of about 1 h [10]. Therefore, the results of the conducted experiments confirmed the good performance of ZVM in nitrate reduction. However, the Mg/NNi ratios estimated in the present study are higher than the values reported by other authors who used zero-valent magnesium as a reactive material. Indeed, Kumar et al. calculated a magnesium/nitrate ratio of 19 m2/mol needed to reach a nitrate abatement of about 80% [4]. This ratio is probably a consequence of the applied operating modes, which were more favorable than those used in our experiments. Indeed, the above estimate refers to tests conducted at a lower pH (pH 2) and with a very high stirring speed (1500 rpm) [4]. These conditions improve nitrate reduction but make the process more complex and expensive.
In addition to the influence of Mg/NNi ratio on process performance, the experimental results allowed us to estimate the actual magnesium amount consumed through the reaction with nitrate solution. As is clearly shown in Figure 2e, the concentration of dissolved Mg2+ progressively increased during the overall treatment and higher releases were observed with greater ZVM doses. The dissolution of magnesium is mainly caused by the reaction with NO3− and water [29]. By using a ZVM dose of 2 g, in a reaction time of 5 min during which the major nitrate abatement occurred, the dissolved Mg2+ reached a concentration of about 140 mg/L (Figure 2e). This value can be considered the magnesium amount that was consumed through the reaction with NO3−. The further increase of Mg2+ over the reaction time is attributable to reactions with other species and water. On the basis of these considerations, it can be estimated that about 4.53 moles of magnesium were consumed per mole of nitrate reduced. This estimate is quite close to the theoretical stoichiometric values (reactions 13–14), which underlines that the reactions proceeded efficiently without an excessive loss of magnesium. Compared to the above value, the ratio between dissolved magnesium and nitrate was greater in all the other tests conducted with different initial doses of ZVM. This suggests a superior consumption of magnesium and a worse overall performance compared to the results detected with the Mg0 amount of 2 g, which was therefore confirmed to be the more favorable dose for nitrate reduction. During the experiments, the other reaction products besides Mg2+ were investigated. In previous works, the most common compounds associated with nitrate denitrification by means of zero-valent magnesium were nitrite (NO2−), ammonium (NH4+) and gaseous nitrogen (N2) [4,31]. Nevertheless, information concerning the byproducts trends over time and the effects of operating parameters on their formation is still poor. In this regard, for each test, in addition to N-NO3−, the concentrations of N-NO2− and N-NH4+ were monitored over the entire process. Furthermore, for each time instant, we estimated the missing nitrogen in the solution (ΔN) as the difference between the initial nitrate concentration and the sum of N-NO2−, N-NH4+ and residual N-NO3−. The experimental curves clearly show that the nitrite concentration initially grew until it reached a maximum value, and then progressively decreased (Figure 2b). These results underline how nitrites are initially formed by nitrate removal and, then, are themselves reduced over the treatment period. This is a positive aspect because the accumulation of nitrous nitrogen, which is more toxic than nitrate nitrogen, is avoided. The extension of the growing phase was very short in tests with ZVM doses higher than 1.5 g, while it was around 30–40 min in the other experiments. Furthermore, the nitrite concentration decreased more quickly with the increase of reactive material, reaching, in some tests, values close to zero (Figure 2b). Therefore, the reaction rates of nitrite formation and consumption are both related to Mg0 dosages. As regards the ammoniacal nitrogen, we observed a production phase during the early moments of each test. Nevertheless, the ultimate concentrations were always quite low (<3.5 mg/L) (Figure 2c). These results are in agreement with previous works in which gaseous nitrogen compounds are identified as the main final products of nitrate reduction [4,31]. Due to the low pH of the tests, the formation of free ammonia can be neglected. Therefore, besides some low aliquots of gaseous nitric oxides (NO), a production of mainly nitrogen gas (N2) can be hypothesized, which corresponds to the actual amount of removed nitrogen (ΔN). This aspect makes the process with Mg0 particularly advantageous compared to those with other zero-valent metals. Indeed, with Fe0, generally, ammonium was the detected end product of nitrate reduction [12,14,15,20]. Therefore, when using zero-valent iron as the reactive material, a post-treatment for NH4+ removal must be applied [2,3]. This, obviously, is not necessary when using Mg0, since N2 is an insoluble gas that quickly volatilizes in air. The experiments conducted in the present works showed other interesting results. Indeed, unexpectedly, the trends of ammonium changed in response of Mg0 amounts. In particular, for a ZVM quantity up to 1.5 g, N-NH4+ rapidly increased up to an asymptotic value. With higher Mg0 doses, after an initial growth phase, the ammonium concentration decreased, in some cases reaching values near to zero (Figure 2c). The consumption of ammonium may be attributable to the reactions with some intermediate compounds due to the Mg0 dose. This behavior was not previously reported and demonstrates that the final fraction of N-NH4+ varies with the Mg/NNi ratio. On the contrary, Kumar et al. observed a progressive growth of ammonium with the increase of Mg0 dose [4]. The differences with our results are probably due to the different dosages tested. As a consequence of N-NO3−, N-NO2− and N-NH4+ trends, the overall removed nitrogen (ΔN), which probably represents N2, exhibited cumulative trends with asymptotic values that increased in response to the enhancement of the quantity of reactive material. In agreement with these results, Ileri et al. [31], using an ultrasound-assisted ZVM system, observed an increase in nitrate conversion to nitrogen gas when increasing the magnesium dose up to an optimum amount of 5 g/L [31]. In our experiments, the ΔN fraction grew very quickly during the tests with higher Mg0 doses, attaining values close to the initial concentrations of N-NO3− (Figure 2d). This indicates that, by applying a Mg/NNi ratio of at least 0.33 g/mg, almost all the influent nitrate can be converted into nitrogen gas.
3.3. Tests Conducted at Different pHs and N-NO3− Concentrations
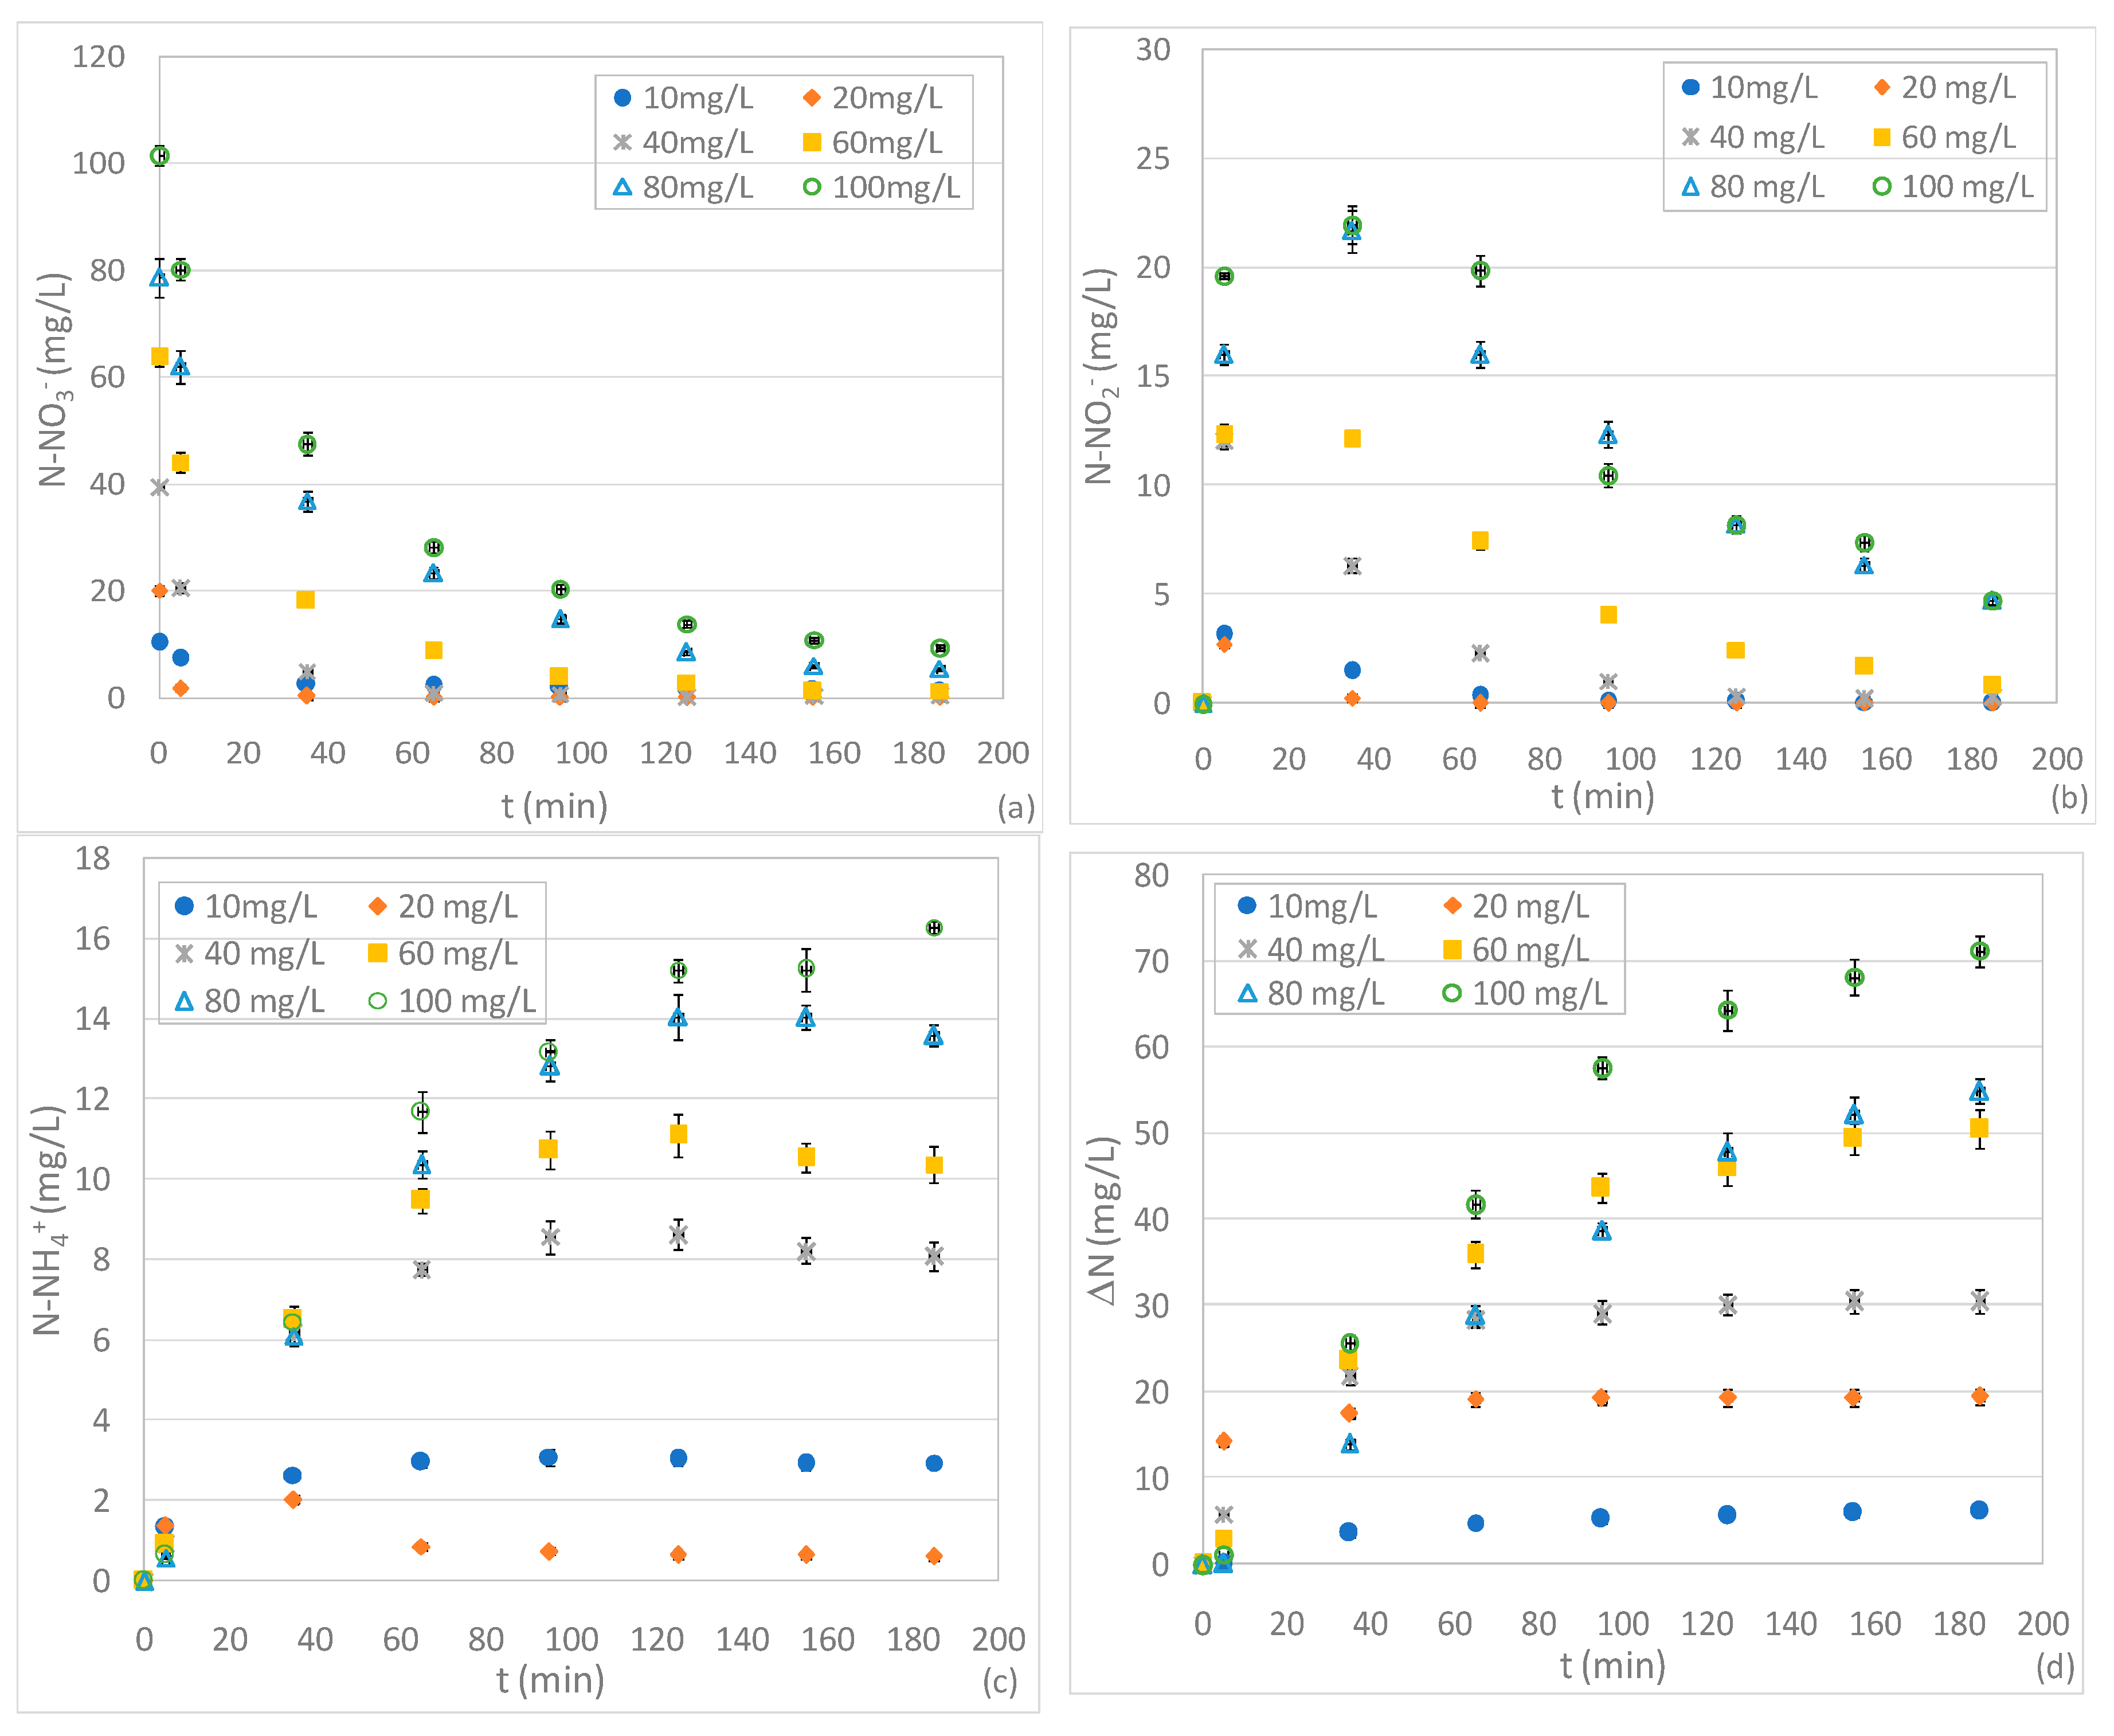
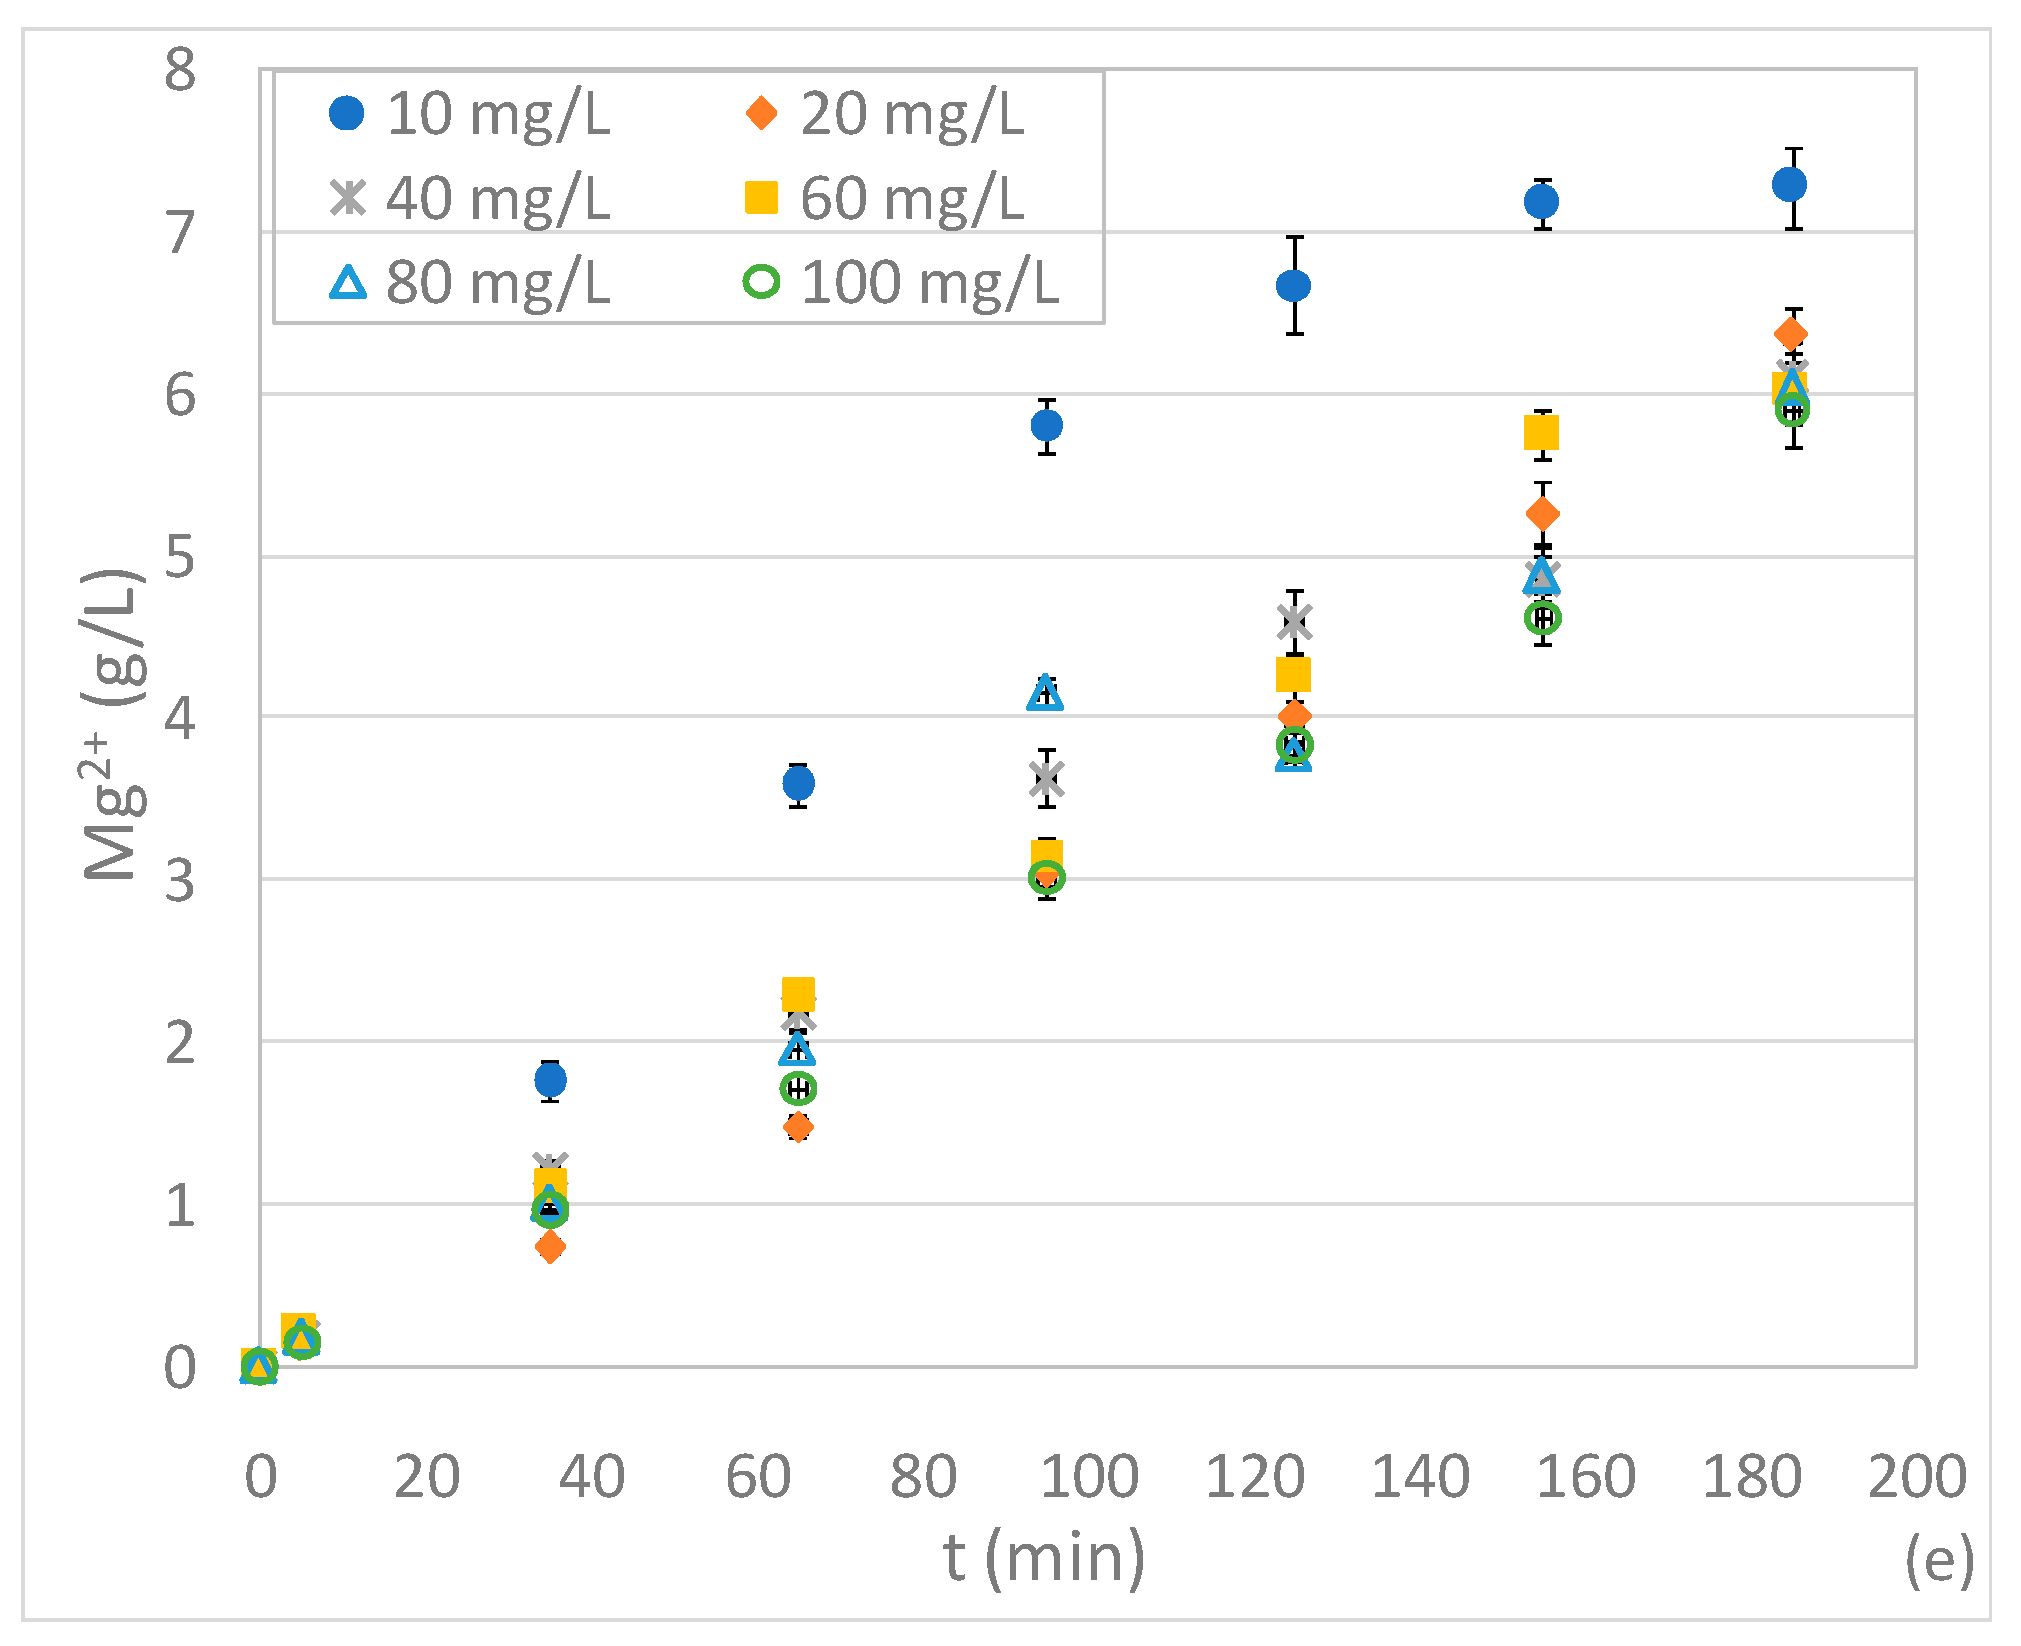
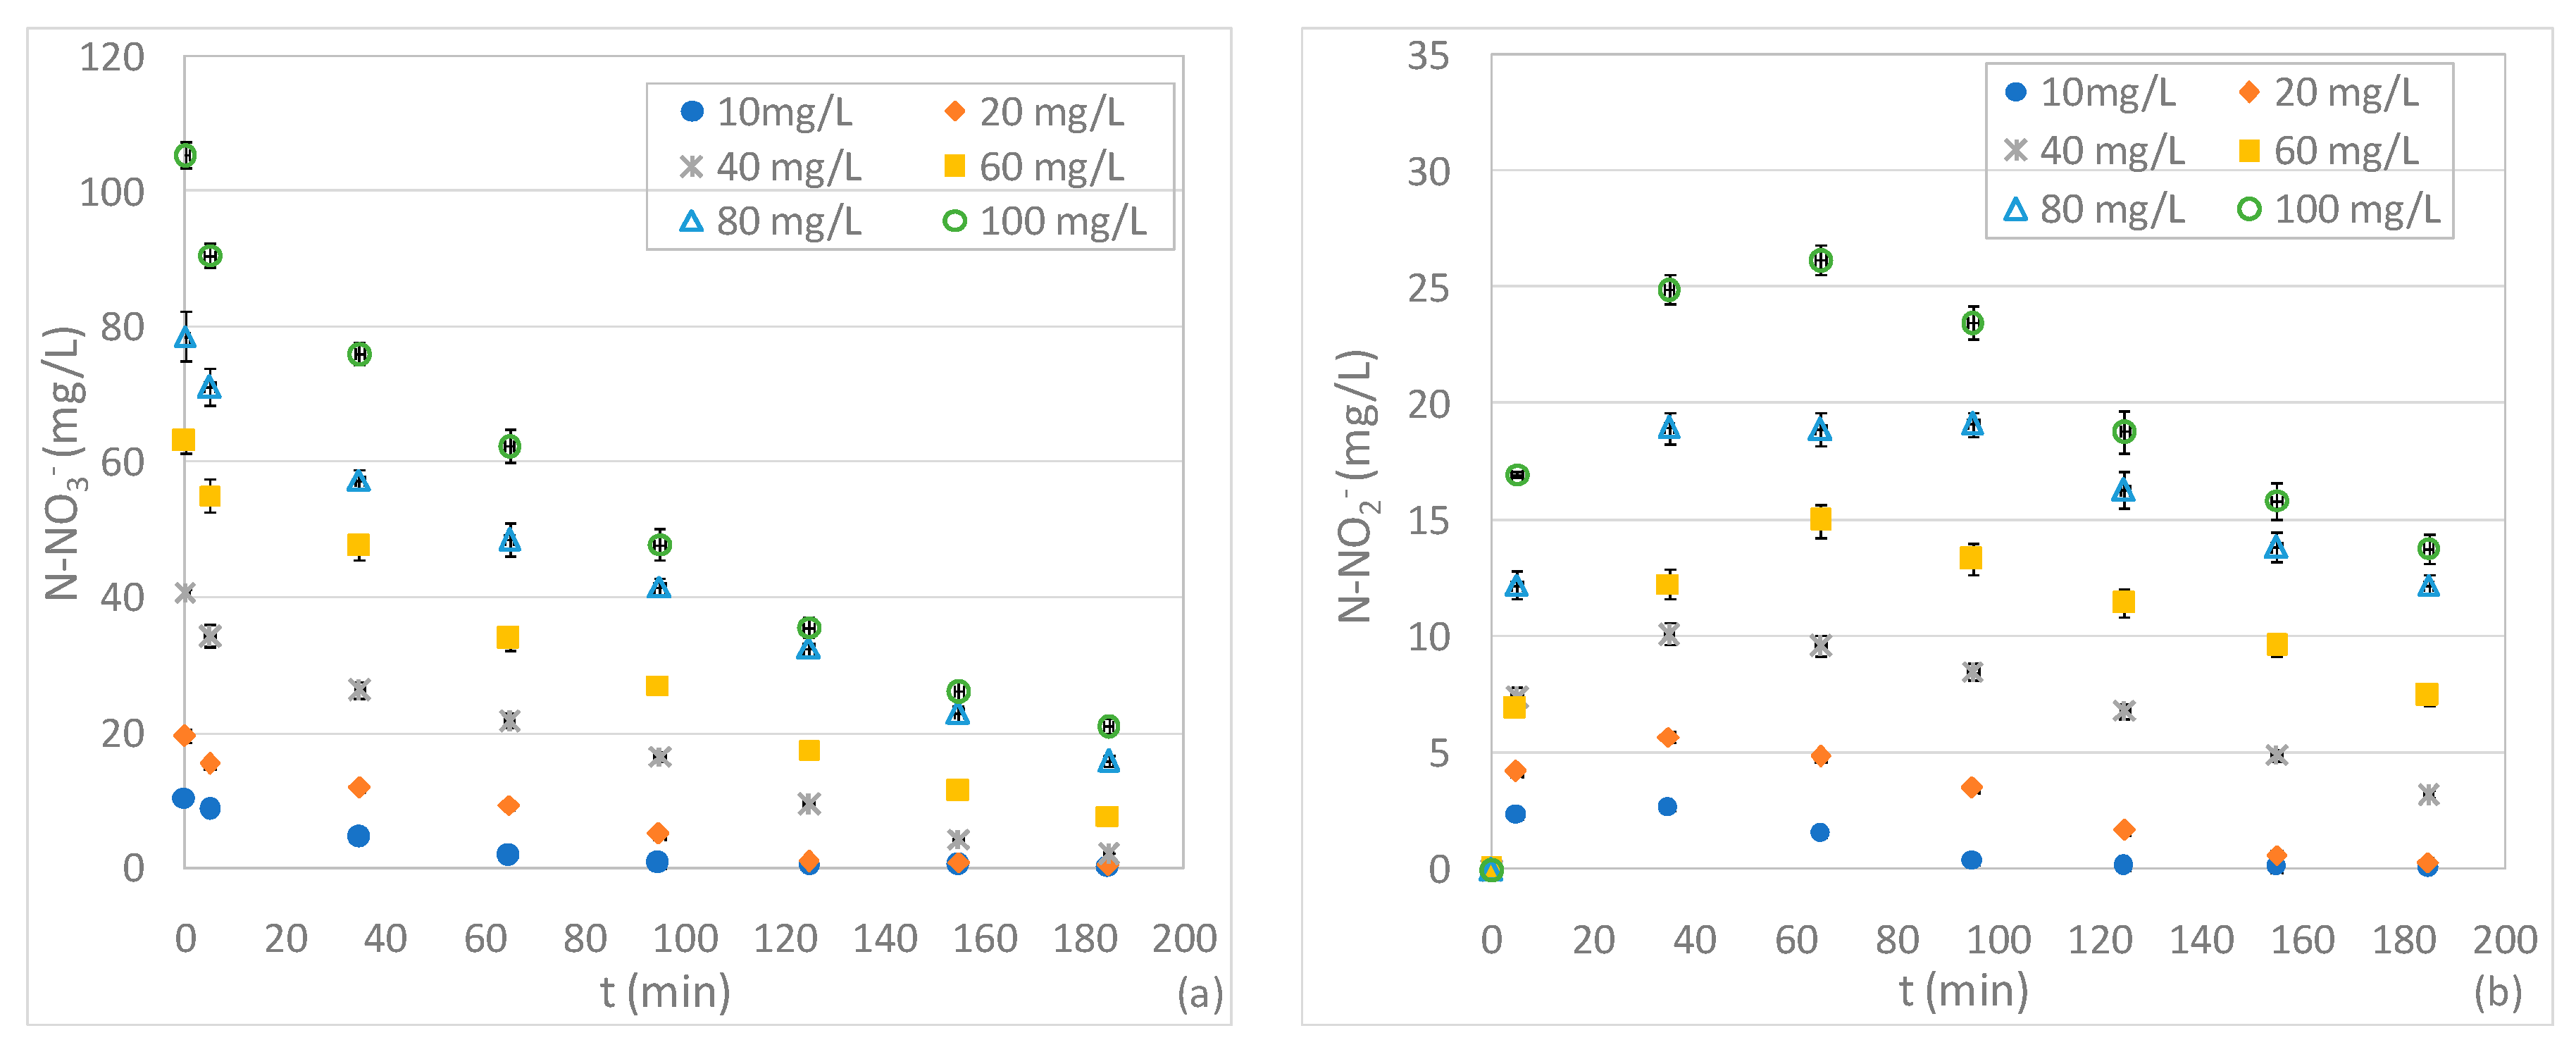
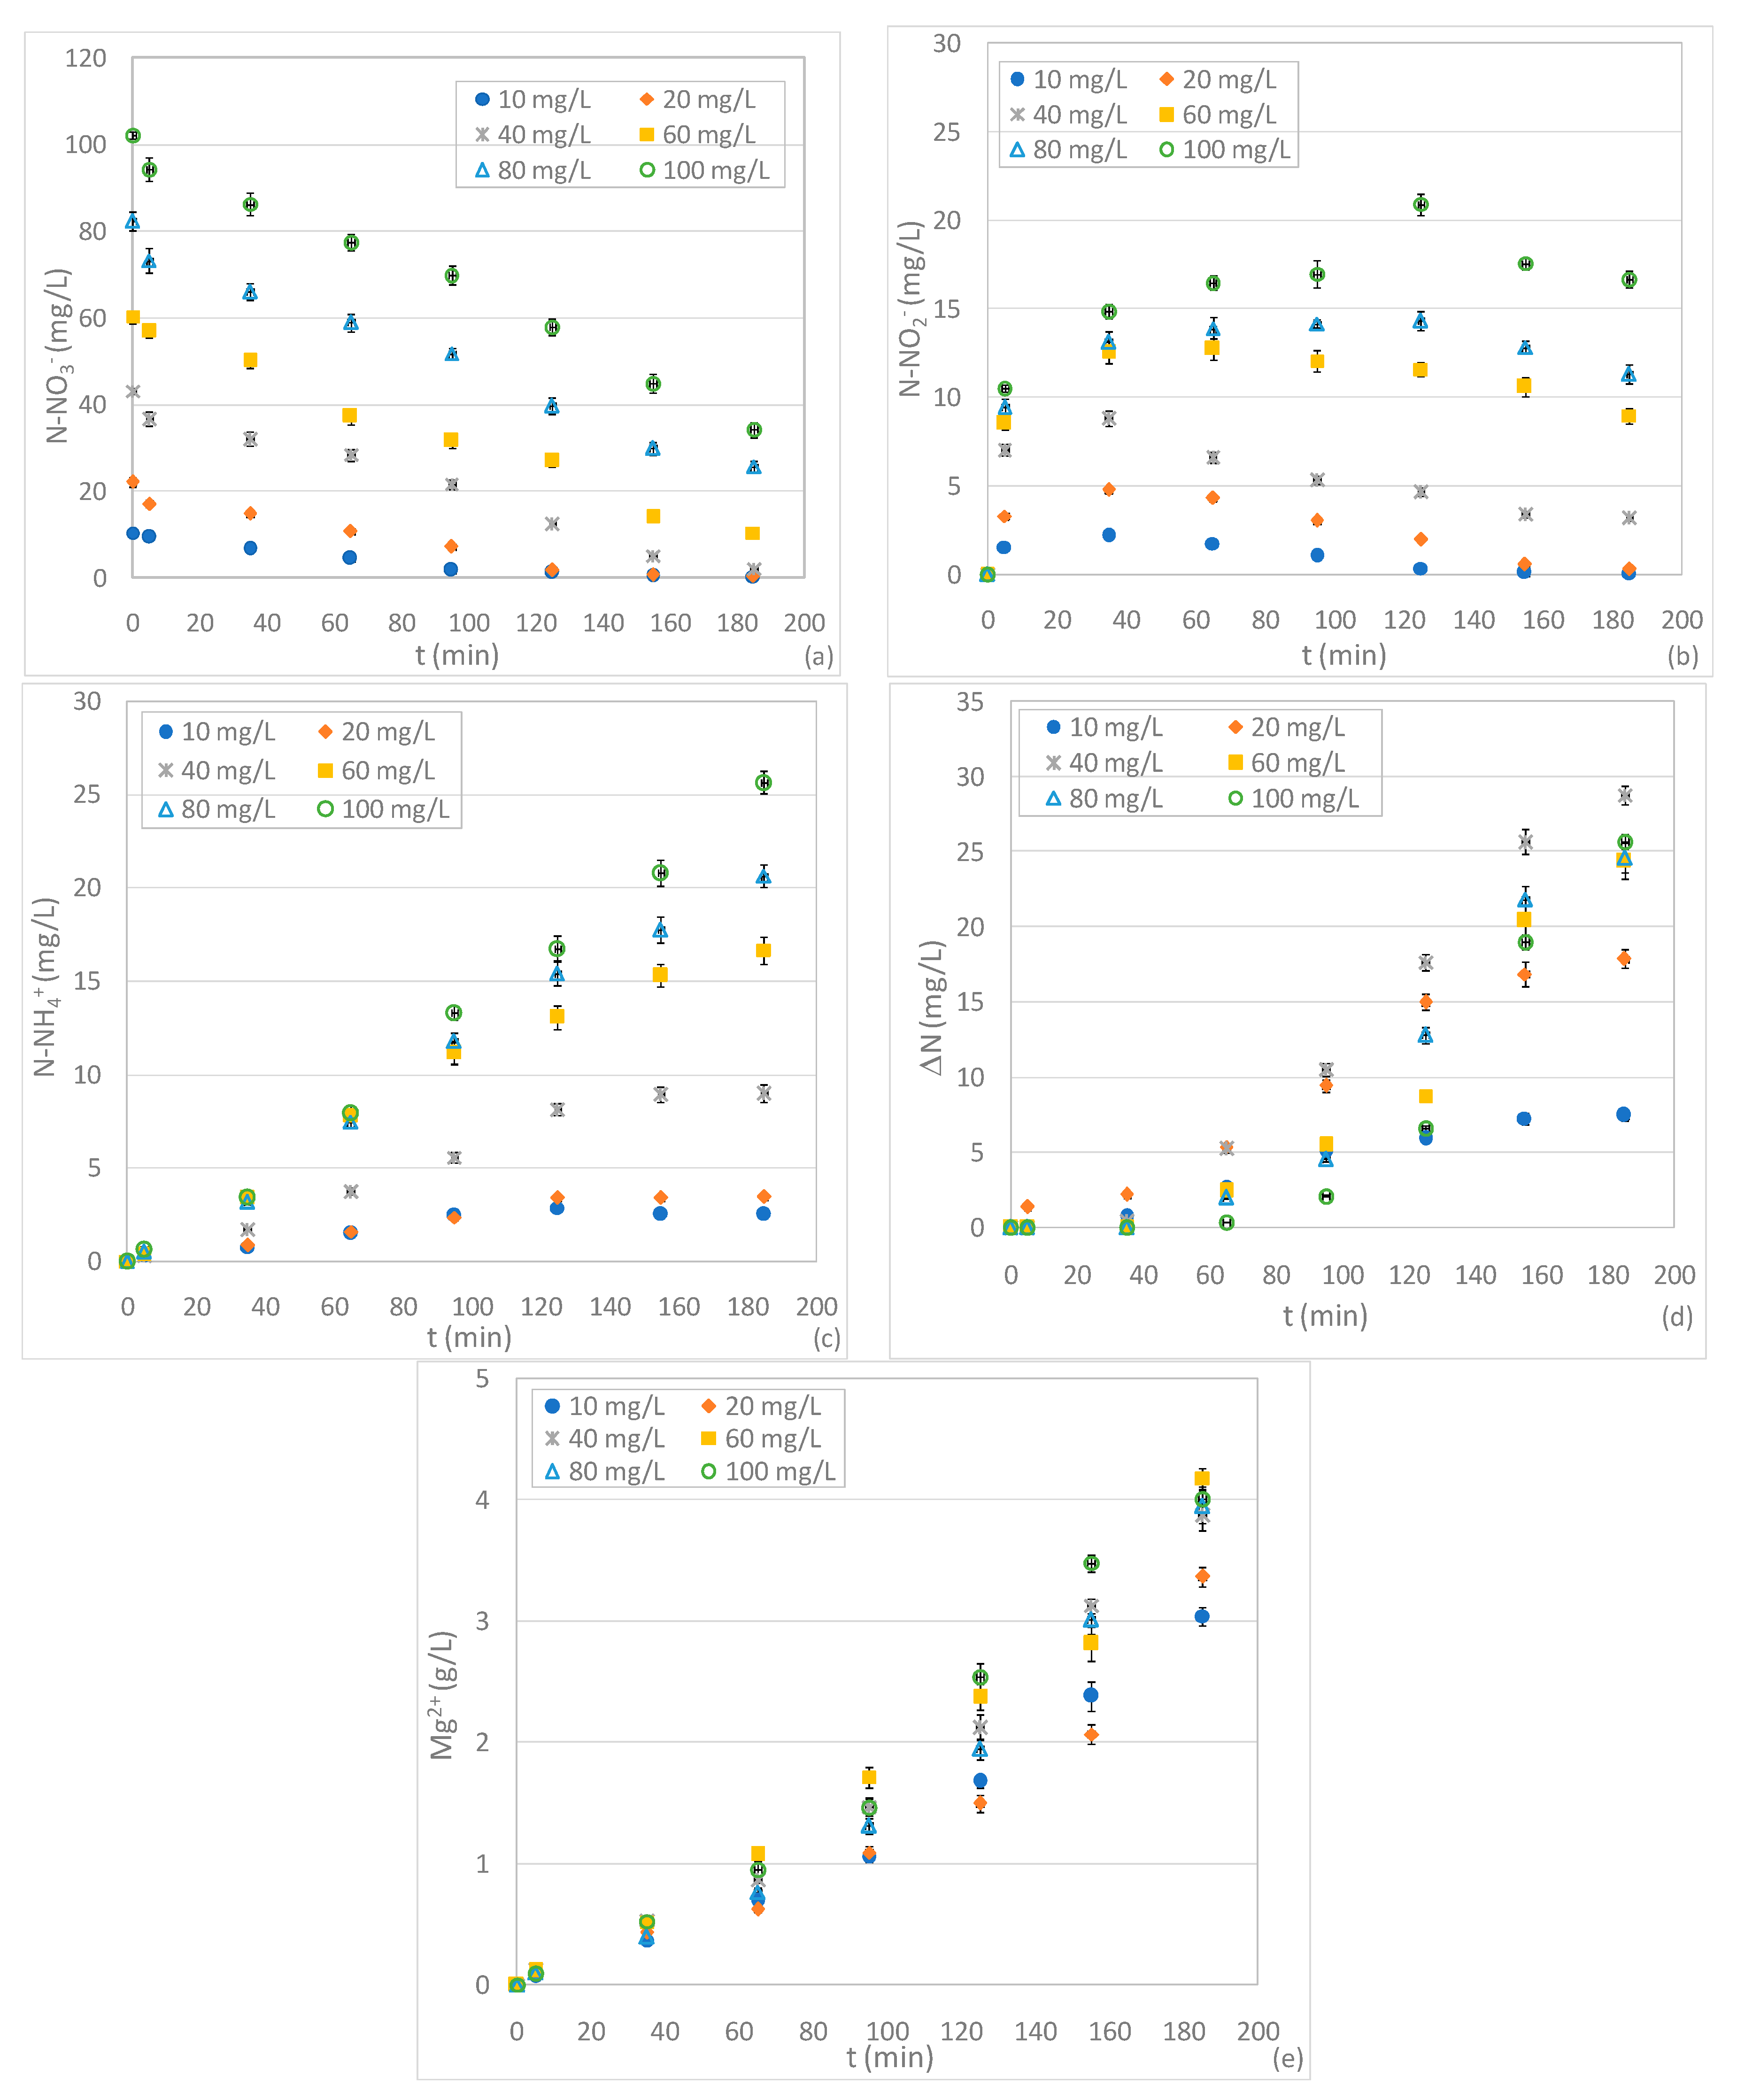
On the basis of the results of the first set of experiments, holding the Mg0 dosage at 2 g and the pH 3, further tests were carried out in order to investigate the effect of initial N-NO3− concentrations between 10 and 100 mg/L. As expected, compared to the findings discussed above, the process performance deteriorated when increasing the influent nitrate beyond 20 mg/L (Figure 3a). This behaviour disagrees with some literature reports that observed an increase in nitrate abatement with increased influent concentration [4]. In our tests, with initial concentrations of 40 mg/L and 60 mg/L, an almost complete nitrate removal was achieved in a reaction time of 65 minu and 155 min, respectively, instead of 35 min needed in the test with 20 mg/L (Figure 3a). Furthermore, in the case of solutions characterized by N-NO3− levels of 80 and 100 mg/L, it was not possible to attain full nitrate reduction and appreciable residual concentrations were observed in both tests (Figure 3a).
In addition to these results, a decline in performance was unexpectedly detected when reducing the initial nitrate amount below to 20 mg/L. In fact, in the test with 10 mg/L, an abatement of about 82% was reached after only 95 min (Figure 3a). This process deterioration occurred in spite of the high Mg/NNi ratio equal to 0.67 g/mg. These results suggest that, for pH 3, the ratio between the dosage of Mg0 and nitrate cannot be considered the univocal parameter upon which NO3− removal depends. In effect, it can be presumed that low initial nitrate concentrations slow down the reaction rate. Moreover, in the presence of low initial amounts of NO3−, in a strong acidic solution, Mg0 reacts mainly with water and oxygen causing an appreciable deterioration in performance. This hypothesis was confirmed by the trends of Mg2+ concentration over the reaction time (Figure 3e). Indeed, with 10 mg/L, despite the rather slow nitrate reduction, major accumulation of Mg2+ was observed due to the solubilization of Mg0 promoted by the marked acidic environment (Figure 3e). The ineffectual utilization of reactive material was demonstrated by the ratio between the Mg consumed and the nitrate removed which, even considering only the first minutes of treatment, was about 33.0 mol/mol. This value is notably higher than the 4.53 mol/mol previously mentioned and underlines a great loss of magnesium.
Similar to the experiments discussed in the previous section, the nitrite concentration showed initial growth trends followed by decrease phases (Figure 3b). The lower initial nitrite production was monitored by treating the solution with a nitrate concentration of 20 mg/L. In effect, the test with 10 mg/L also exhibited higher initial N-NO2− concentrations which, anyhow, were subsequently completely consumed (Figure 3b). The progressive increase in initial nitrate concentration in the standard solutions caused major nitrite productions and, consequently, the growth of residual N-NO2− (Figure 3b).
The deterioration of process performance induced by high levels of initial nitrate quantity was also confirmed by the trends of N-NH4+. Indeed, except for the test with 20 mg/L, the ammonium concentrations assumed typical cumulative curves with asymptotic values that increased in response to influent N-NO3− (Figure 3c). It is interesting to note that, by treating the solution with the lowest nitrate concentration, an ammonium concentration was reached that was almost four times higher than that detected in the test with 20 mg/L (Figure 3c). The enhancement of the level of ammonium in residual solutions is, obviously, a negative aspect because it means that a minor fraction of the initial nitrate amount is converted to gaseous compounds. Indeed, the overall removed nitrogen (ΔN) grew over time in all experiments, but only in the test with 20 mg/L did it reach a final value close to the initial nitrate amount (Figure 3d). In the other experiments the fraction of gaseous compounds (ΔN) was between 60% and 83% of the influent N-NO3−, which indicates an inferior nitrate conversion (Figure 3d). These results confirm that, at pH 3 and a given Mg0 amount, the best performances occur for a characteristic initial N-NO3− concentration. Clearly, this characteristic value can vary by changing the dose of reactive material.
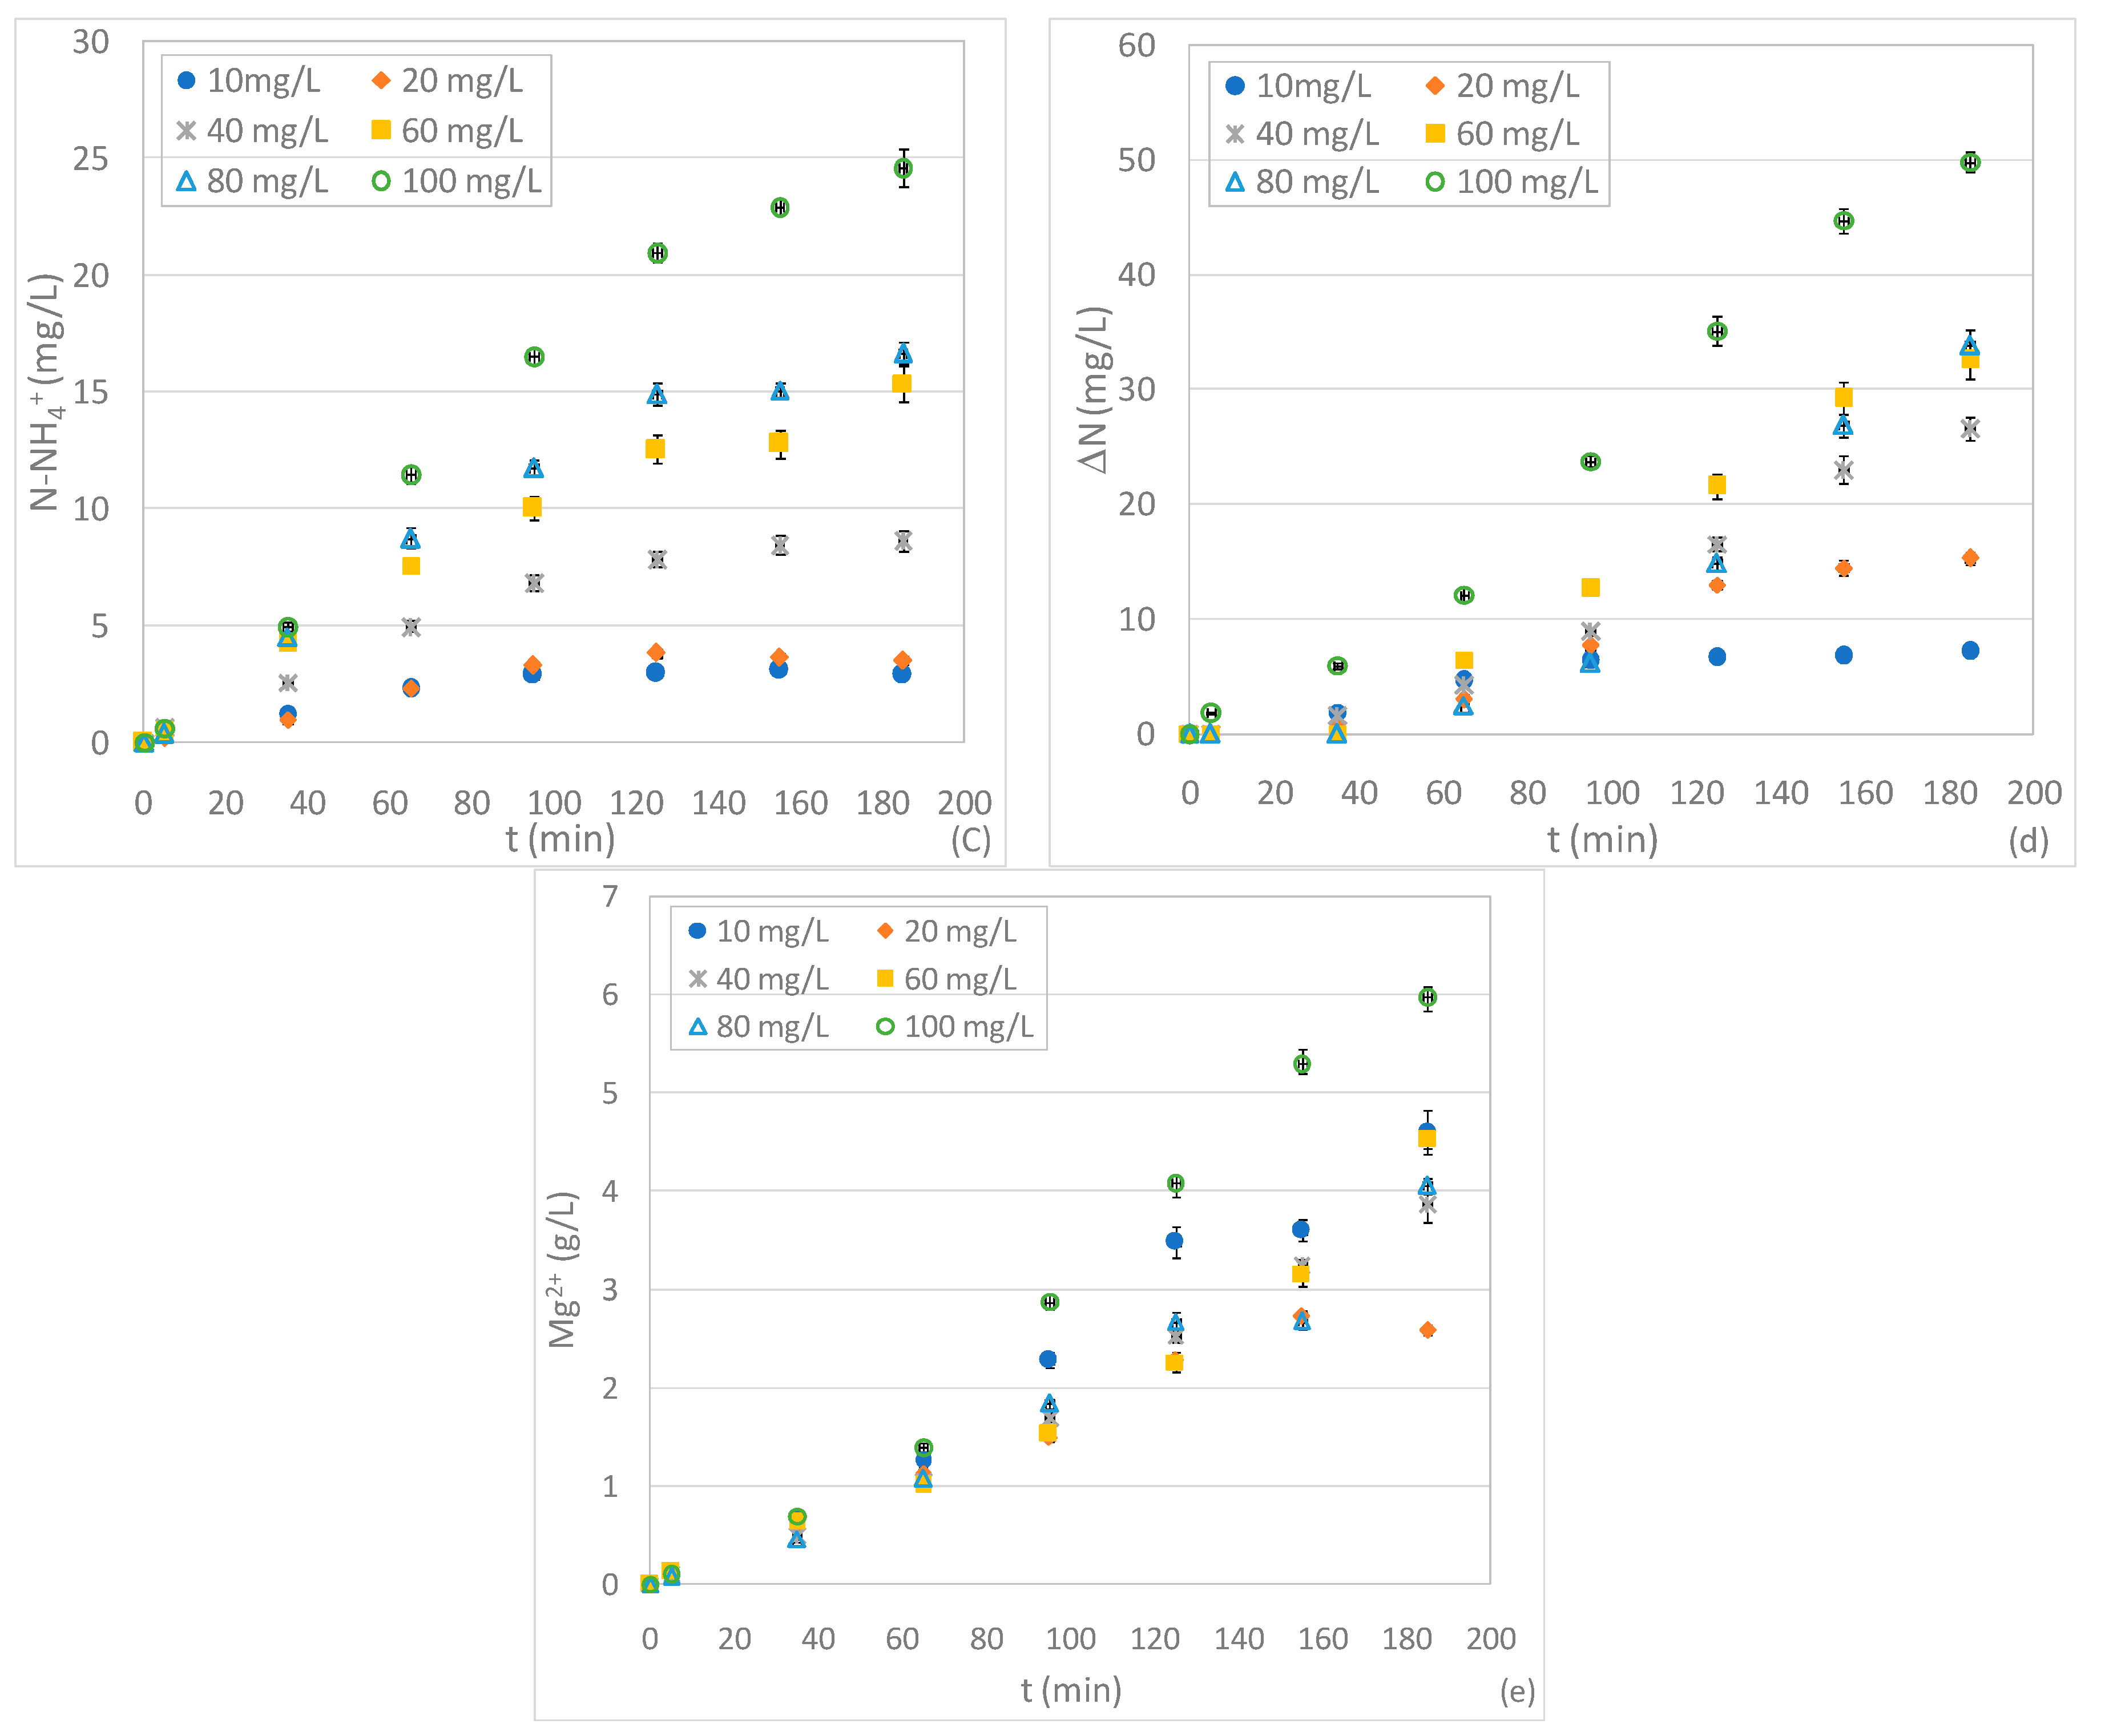
With the aim of investigating the influence of pH on nitrate denitrification, the same tests as discussed above were conducted at pH values of 5 and 7. The experimental results, in good agreement with the statements of other authors, showed a progressive general decline of process performance in response to pH increase [4,32]. Indeed, during chemical denitrification by means of Mg0 protons, consumption occurs; therefore, nitrate removal is hindered by the increase in pH [4,32]. Moreover, high pH values could promote the formation of insoluble reaction products, which could cause the passivation of the reactive material [4,31,32]. In our investigations, by carrying out the treatment at pH 5, appreciable decreases in reaction rates were detected for all experiments (Figure 4a). This decrease was less marked in the test conducted with an initial nitrate quantity of 10 mg/L. Indeed, at this concentration, in comparison to the trend monitored at pH 3, the denitrification, even if slower, proceeded to an almost complete nitrate removal (Figure 4a). This finding confirms that the weak performance detected at pH 3, with the lowest N-NO3− concentration, is mainly attributable to an ineffective consumption of Mg0 due to the strong acid conditions. This effect, obviously, is less marked when increasing the process pH to 5. Indeed, with these conditions a minor Mg2+ solubilization was observed during each test (Figure 4e). In the experiments with higher nitrate concentrations, the pH enhancement had a more harmful effect. Indeed, at 20 mg/L, complete nitrate removal was achieved only after 2 h (Figure 4a), while a partial denitrification occurred by treating the more concentrated solutions. In particular, the residual value of N-NO3− grew in response to the influent concentration. The process worsening at pH 5 was confirmed by the curves of N-NO2− and N-NH4+. In fact, the trends of nitrite concentrations were characterized by longer production phases and slower consumption rates (Figure 4b). Therefore, with the exception of the tests at 10 and 20 mg/L, remarkable residual N-NO2− concentrations were detected (Figure 4b). These values largely surpass those observed at pH 3. Besides this, superior productions of N-NH4+ were monitored at the end of tests conducted with pH 5. Moreover, it is possible to note that all the curves followed cumulative trends characterized by increasing asymptotic values (Figure 4c). This confirms that at moderate acidic conditions (pH 5), contrary to the behavior observed at the lowest pH, the process benefits progressively decrease with the enhancement of initial N-NO3− concentration. In particular, the fraction of overall removed nitrogen (ΔN) dropped to only around 50% in the tests conducted with the greater nitrate amount (Figure 4d).
The investigations carried out by holding a pH 7 showed a further deterioration of performance. In terms of the nitrate reduced, this decline was more evident by treating solutions with initial concentrations higher than 40 mg/L (Figure 5a). Indeed, compared to the tests conducted at pH 5, greater residual concentrations were monitored (Figure 5a). The above results agree with the statements of Mirabi et al., who observed a notable reduction of the denitrification ability of Mg0 and activated carbon in response to pH increase from 3 to 7 [32]. Indeed, similar to the results of the present study, for a given initial N-NO3− amount, a remarkable growth of residual nitrate concentration with the increase of process pH was observed [32]. As regards N-NO2− and N-NH4+, during our experiments, mild reductions of reaction yields were detected, and the final concentrations were not much different to those detected in the tests with pH 5 (Figure 4b,c and Figure 5b,c). The minor reduction of nitrate and the residual values both of nitrite and ammonium limited the generation of gaseous compounds. As shown in Figure 5d, the productions of gaseous forms (ΔN), in particular for the tests conducted with the higher N-NO3− concentrations, were quite slow and restricted amounts were reached at the end of treatments (Figure 5d). Indeed, in the worst conditions, the amount of nitrogen actually removed from the solution accounted to only 30% of the initial nitrate amount. The poor progression of chemical denitrification under a neutral environment is confirmed by the trends of magnesium ions dissolved in treatment solutions. In fact, when holding the process pH to −7, the Mg0 dissolution was always less marked in comparison to that monitored at lower pH values (Figure 5e). This, in addition to the less minor solubilization action due to the lower addition of acids, is attributable to weak reactions of ZVM with the nitrogen forms.
3.4. Kinetic Analysis and Process Modeling
The findings of the conducted experiments prove that chemical denitrification using zero-valent magnesium is affected by many factors. In order to further examine the impacts of these factors, an in-depth kinetic analysis was carried out. In the previous works, the kinetic law of nitrate removal was exclusively analyzed; to the best of our knowledge, no studies examined the kinetics of the other nitrogen forms. To overcome this lack of information, in the present study efforts were made to identify mathematical relations able to represent the experimental trends of each reaction compound. To model the chemical reduction of N-NO3− by means of zero-valent reactive materials, a strict first-order kinetic law is generally assumed [4,20]. Nevertheless, the findings of our tests indicate that, in some cases, a nitrate concentration can remain in the treated solution once it reached the steady state. To take into account this aspect, the following pseudo first order law was proposed:
where KN is the overall kinetic constant for the nitrate reduction, NN is the N-NO3− concentration and NN,R is the final N-NO3− at the stationary conditions.
From the experimental evidence, it can be observed that the nitrites are formed from nitrate but are then removed themselves; therefore, this relation was elaborated:
where NI represents the nitrite concentration, KNI is the constant representative of N-NO3− reduction into N-NO2− and KI is the kinetic constant of the overall nitrite removal.
The trends of ammonium nitrogen suggest that part of the nitrate is directly denitrified to N-NH4+, which can also be formed by nitrite reduction. Additionally, under certain conditions, ammonium removal can occur. All these phenomena are included in the following kinetic law:
where NA is the N-NH4+ concentration, KNA represents the kinetic constant of N-NO3− reduction to N-NH4+, fNA is the fraction of nitrate reduced to ammonium at the stationary state, NNu is the nitrate concentration removed at the stationary state (NNi − NN,R) and KA is the constant of the ammonium abatement.
As previously discussed, the nitrate can also be directly reduced to gaseous compounds, probably N2. The production of N2 can also occur through the abatement of nitrite and ammonium. Taking into account these aspects this relation was formulated:
where NG is the concentration of nitrogen converted to gaseous products, fNG is the fraction of nitrate reduced to gaseous nitrogen, and KNG and KIG are the kinetic constants representative of N-NO3− and N-NO2− reduction to gaseous nitrogen, respectively. The resolution of the above system of differential equations leads to the following expressions:
Nitric nitrogen:
Nitrous nitrogen:
Ammoniacal nitrogen:
Gaseous nitrogen:
The identified equations allowed us to simulate the several curves detected during the experiments. These simulations are reported in the Supplementary Material sections (Figures S1–S4). The match generally detected between the experimental results and theoretical predictions is a good validation of the proposed kinetic model (Figures S1–S4).
From the values of kinetic constants obtained through the conducted interpolations, it was possible to analyze the dependence of these constants on the pHs, Mg0 doses and initial N-NO3− concentration tested during the investigation. In particular, in the tests conducted by changing the dose of reactive material at pH 3 and with an initial N-NO3− concentration of 20 mg/L, the kinetic constant for the nitrate reduction (KN) reached a maximum value of about 0.531 min−1, at a Mg/NNi ratio of 0.33 g/mg (corresponding to a Mg amount of 2 g) (Table 1). This finding confirms that the overall nitrate reduction rate is positively affected by the increase in Mg/NNi until reaching the threshold ratio mentioned above. The maximum detected value of KN (0.531 min−1) is greater than that observed by other authors when using ZVM as reactive material [4]. Moreover, the above value of KN is even higher in comparison to the denitrification rate reached in our previous work conducted by using nanoscopic zero-valent iron particles, in conditions comparable to those of this study [20].
The rates of nitrate reduction to nitrite (KNI) and the rates of nitrite removal (KI) (Table 1), representative of N-NO2− curves, showed trends similar to that of KN. In contrast, regarding the kinetic constants of ammonium, the rate of nitrate conversion into N-NH4+ (KNA) increased up to Mg/NNi = 0.33 g/mg but, beyond this ratio, very low values of KNA were observed (Table 1). This suggests that, with higher Mg0 doses, ammonium formation is mainly attributable to the reduction of N-NO2−, as confirmed by the high values of the parameter KIA (Table 1). The greater Mg/NNi ratios also promoted the formation of gaseous nitrogen mostly from the nitrate reduction KNG (Table 1).
The interpolation of the experimental curves detected by changing the N-NO3− concentration, at pH 3 and with Mg0 = 2 g, clearly showed that the maximum nitrate reduction rate (KN = 0.531 min−1) was reached in the test with 20 mg/L (Table 2). Indeed, with respect to the value detected at this concentration, KN notably decreased by increasing the initial nitrate level (Table 2). However, a low KN value, close to 0.074 min−1, was unexpectedly observed in the test with the lowest initial N-NO3− amount (Table 2). This, as previously discussed, could be justified by considering that, in a strongly acidic environment, when treating solutions with small amounts of N-NO3−, the ZVM probably reacts mainly with water and oxygen causing an appreciable deteriorationof denitrification. Therefore, even using a high Mg/NNi ratio, low nitrate concentrations of around 10 mg/L can notably reduce the reactions rates.
The better performance in the treatment of solutions with 20 mg/L was further confirmed by the values of other kinetic parameters. In fact, at this concentration, greater values were observed for the constants representing the productions of nitrite (KNI), ammonium (KNA) and nitrogen gas (KNG) (Table 2). In particular, the parameter KNG was close to 0.19 min−1, much higher than those obtained in the other tests. Indeed, during the experiment, the initial N-NO3− amount of 20 mg/L was quickly reduced mainly into gaseous nitrogen (Figure 3a,d). Furthermore, the parameters representative of the conversion of nitrite (KI) and ammonium (KA) also reached the maximum values (Table 2).
The interpolation of curves obtained from the experiments conducted at pH 5 gave kinetic constants of nitrate reduction (KN) notably lower than those from the tests at pH 3. This finding is in good agreement with the literature reports, which state the negative impacts of pH increase on denitrification rate [4]. In our experiments, this negative effect was lower for the test conducted at 10 mg/L. In fact, at this concentration, the highest value of KN was observed, which progressively decreased in response to initial N-NO3− enhancement and, thus, decreasing Mg/NNi ratio (Table 2). Therefore, at pH 5, contrary to what was observed at pH 3, the denitrification rate was not negatively affected by the low values of N-NO3− (10 mg/L) in the treatment solution. These results confirmed that, at pH 3, the performance deterioration observed with the lowest N-NO3− concentration is mostly due to an ineffective consumption of Mg0 caused by the strongly acidic environment. This effect, obviously, is less marked with the increase in process pH. The other kinetic parameters generally showed decreasing trends with the enhancement of initial nitrate concentration (Table 2). This underlines that at pH 5 all the transformations occurring during the treatment slow down with an increasing amount of N-NO3− to be removed (Table 2). Compared to the values at pH 3, the constants representing N-NO3− conversion into gaseous nitrogen (KNG) were always much lower, while less marked differences were observed for the kinetic constants representative of nitrite (KNI) and ammonium (KNA) production in the tests conducted at higher N-NO3− concentrations (Table 2). This demonstrates that by increasing the pH and the initial concentration, N-NO3− is mainly transformed into N-NO2− and N-NH4+, instead of N2. In addition, the values of KI indicate that the nitrite is quite rapidly reduced. The N-NO2− reduction mostly caused the generation of N2, as is clearly shown by the values of KIG, which were even higher than those detected at pH 3 (Table 2).
Similar to the trends observed at pH 5, the kinetic constants detected at pH 7 decreased with the rise of the initial nitrate concentration. Moreover, the increase in process pH caused a further reduction of the overall denitrification rate (KN). Also, the parameters representative of nitrite (KNI) and ammonium formation (KNA) showed a decline. On the contrary, the constant representing the conversion of nitrite into ammonium (KIA) slightly increased. This underlines that at pH 7 the nitrite reduction to N-NH4+ was more marked. The parameters of nitrogen gas production were quite small and of the same order as those monitored at pH 5 (Table 2).
The above discussion clearly shows how the process evolution notably changes in response to the operating conditions. In general, reaction rates are positively affected by low pH and high Mg/NNi ratios. Moreover, under these conditions the nitrate is mainly reduced to N-NH4+ and N2. Therefore, the curves largely depend on the kinetic constants representative of the direct reduction of N-NO3− (KN, KNA, KNG), while the constants representing of partial transformations (KNI, KI, KIA, KIG) are less meaningful. On the contrary, increasing pH and decreasing Mg/NNi makes the denitrification less effective, and thus, increases the incidence of constants that are expressions of intermediate reactions (KNI, KI, KIA, KIG).
The pH, ZVM dose and initial nitrate concentration concurrently affected the process mechanisms. Indeed, for example, the trends of the nitrate removal constant (KN) as function of Mg/NNi ratio are notably different at the various pH values tested. Therefore, it was not possible to express the kinetic constants as univocal functions of process parameters.
3.5. Reaction Mechanisms and Characteristics of Exhausted Mg0
Chemical denitrification by means of Mg0 is a complex process whose mechanisms are not yet fully clarified. On the basis of several experimental trends detected by changing the operating conditions, the possible reaction pathways were identified and proposed. The nitrate removal evolves according to many reactions that can simultaneously occur. Among the different mechanisms, it must be considered that in aqueous solutions Mg0 is oxidized by water, oxygen and protons [29]:
The above reactions are more favorable in acidic environments; in effect, in our investigation, a superior Mg0 solubilization was observed by decreasing the pH. In solutions containing NO3− ions, the zero-valent magnesium can trigger many other reactions. According to the trends observed in the conducted experiments, during the first minutes of treatment the nitrate is reduced to nitrite. Furthermore, depending on the operating conditions, an early production of NH4+ and its subsequent conversion into gaseous compounds, probably N2, were also observed. The experimental results agree with the reactions reported in the literature [4]:
The protons requirement in these reactions justifies the better performance detected with the lowest tested pH. Nitrate reduction could further occur by means of the hydrogen gas produced in reactions 9 and 10 [32]:
The trends monitored in the present study proved that the nitrite also undergoes a progressive reduction. This condition suggests that zero valent magnesium can react with NO2− ions forming NH4+ and/or N2. According to these considerations, we propose the following reactions:
The nitrite can be further reduced through a reaction with ammonium [28]:
In addition, as reported in previous works, in a reducing environment, NO2− ions can yield some other intermediate species, such as hyponitrite (N2O22−) [34]. We hypothesize that these species could also be further reduced by reacting with NH4+:
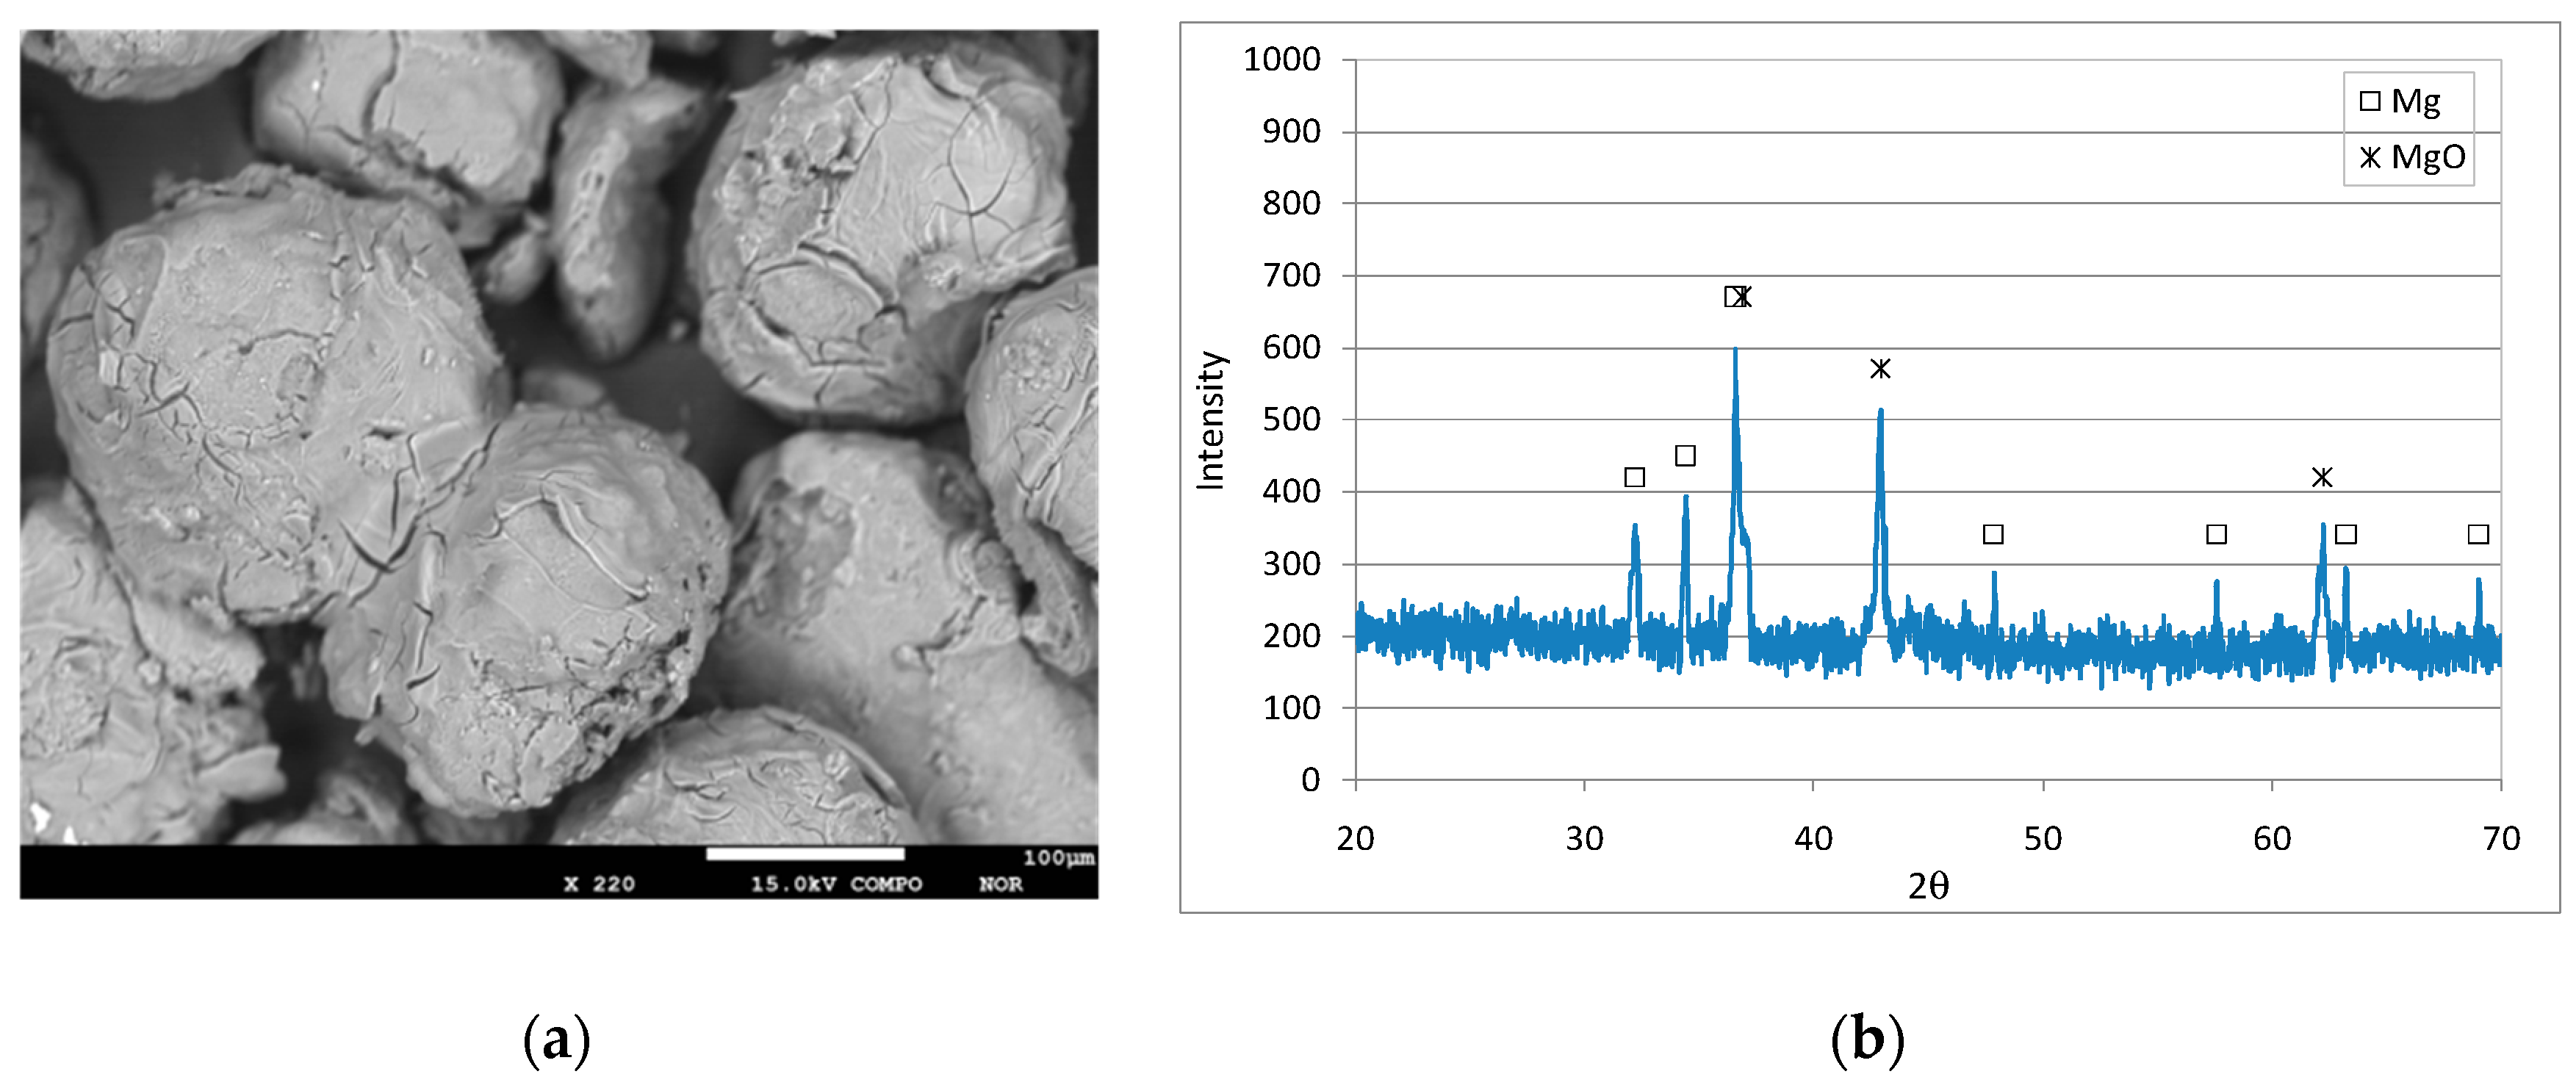
The above mechanisms could explain the ammonium abatement observed under certain conditions during our tests. As a consequence of the reaction with the nitrate solution, the reactive material undergoes remarkable modifications. The properties of exhausted materials were analyzed by means of scanning electron microscopy (SEM), wavelength dispersive spectroscopy (WDS) and X-ray diffractometry (XRD). In particular, for each pH, the Mg0 particles recovered at the end of tests with concentration of 20 mg/L were analyzed. After the treatment, the reactive material lost its metallic glaze and the outer surface was much more fractured compared to that of particles before treatment (Figure 6a, Figure 7a and Figure 8a). The above modifications are clearly attributable to the action of nitrogen forms and acidic solutions on magnesium grains. In addition, the surface of the particles partially changed to white. This last observation clearly indicates the formation of some corrosion products. The WDS analysis showed almost exclusively the presence of magnesium and oxygen on the exhausted materials. The absence of significant amount of nitrogen on the material surface proved that no adsorption of nitrogen ions occurred during the treatment with Mg0. This finding confirms the supposed reaction mechanisms according to which the nitrogen removed from the solution is converted into gaseous form. In particular, the percentages of main elements were Mg = 57.5% and O = 42.3% in the test at pH 3, Mg = 58.3% and O = 41.3% at pH 5, and Mg = 57.9% and O = 41.6% at a neutral pH. The above values suggest the presence of magnesium oxide in all the analyzed samples. The formation of magnesium oxide was confirmed by the diffractograms detected on the exhausted materials. In effect, the typical peaks of MgO appeared while those of metallic magnesium became less marked after the treatment with nitrate solutions. The formation of other possible corrosion products, such as Mg(OH)2, can be presumed to be inhibited by the pH values applied during the experiments [4]. Consistent with these findings, Kumar et al. reported only the formation of magnesium oxide as a corrosion product during chemical denitrification conducted in an acidic environment [4]. On the contrary, Mirabi et al. detected the production of Mg(OH)2 as a consequence of the basic conditions reached during tests conducted without pH control [31].
4. Conclusions
The experimental investigation carried out in this work allowed us to analyze and model the nitrate reduction process by means of zero-valent magnesium particles. In particular, through performing a large number of batch tests, the concurrent effects of pH, initial nitrate concentration and Mg0 dosage on process performances were identified. At pH 3, for a given initial nitrate concentration, the dose of Mg0 largely affected the process efficiency. Indeed, with a Mg/NNi ratio of 0.33 g/mg a nitrate abatement of about 91% was reached in only 5 min, and a complete denitrification after 30 min. By operating with this ratio, it was estimated that about 4.53 moles of magnesium were consumed per mole of nitrate reduced, quite close to the theoretical stoichiometric values. An increase in Mg0 dose beyond the above value did not produce any improvement of the treatment. The reaction products’ trends in response to the variation of operating conditions were also examined. The nitrite curves showed initial growth phases followed by consumption trends. The ammonium nitrogen concentration assumed increasing trends; however, with a greater Mg/NNi ratio, after initial growth phases, the N-NH4+ decreased to reach values close to zero. The main reaction product was gaseous nitrogen, which exhibited cumulative behaviors, with asymptotic increasing values in response to Mg/NNi enhancement.
By holding the pH at 3 and the Mg0 at 2 g, the process performance deteriorated when increasing the influent nitrate nitrogen beyond 20 mg/L, corresponding to a ratio of Mg/NNi = 0.33 g/mg. Indeed, the reaction rates progressively decreased and, with the higher nitrate concentrations, it was not possible to reach complete denitrification. Moreover, an increase in the final fraction of ammonium was observed and, consequently, there was a decrease in gaseous nitrogen aliquots. Unexpectedly, a decline of process performance was also detected when the initial nitrate amount was reduced to 10 mg/L, which corresponds to a high Mg/NNi value of 0.67 g/mg. Therefore, in strongly acidic solutions, the Mg/NNi ratio is not the univocal parameter affecting the process. In fact, in these conditions, by using a low quantity of nitrate, the Mg0 is mainly consumed by water and oxygen, which limits the NO3− reduction.
The experimental results carried out at pH 5 and 7 showed a significant deterioration of chemical denitrification. This occurred because the increase of pH reduced the availability of protons, and thus, the reactivity of the reactive material. Furthermore, with these pH values, the growth of nitrate concentration caused a progressive process deterioration.
On the basis of the detected results, original kinetic laws that are representative of the transformations of every nitrogen species were developed. The resolution of these laws led to mathematical equations by which it was possible to accurately simulate the experimental curves. The kinetic constants obtained through the interpolations allowed us to analyze the modification of the reactions rates in response to the operating conditions tested. Moreover, the possible reaction pathways were identified and proposed. The characterization of exhausted Mg0 proved the formation of magnesium oxide and the absence of asignificant amount of nitrogen ions adsorbed on the reactive material.
In conclusion, the results obtained in this work provide some relevant findings regarding the development of chemical denitrification by means of zero-valent magnesium. Nevertheless, further investigations at pilot scale are necessary to verify the actual applicability in field conditions. Moreover, in order to minimize the costs of treatment, the use of waste magnesium particles must be tested, such as those resulting from the automotive, electronic device, weapon and aerospace industries, which use large amounts of zero-valent magnesium. Indeed, the utilization of pure metallic Mg0, whose industrial price is difficult to estimate, could make the process expensive. In addition, the possibility to employing buffer solutions to control the process pH and reduce the consumption of acids should be examined.
Supplementary Materials
The following are available online at https://www.mdpi.com/2073-4441/11/6/1276/s1, Figure S1: Modeling of the experimental curves of N-NO3− (a), N-NO2− (b), N-NH4+ (c) and ΔN (d) obtained during the tests carried out at pH = 3, initial N-NO3− concentration of 20 mg/L and varying the Mg0 amount, Figure S2: Modeling of the experimental curves of N-NO3− (a), N-NO2− (b), N-NH4+ (c) and ΔN (d) obtained during the tests carried out at pH = 3, with Mg0 = 2 g and varying the initial N-NO3− concentration between 10 mg/L and 100 mg/L, Figure S3: Modeling of the experimental curves of N-NO3− (a), N-NO2− (b), N-NH4+ (c) and ΔN (d) obtained during the tests carried out at pH = 5, with Mg0 = 2 g and varying the initial N-NO3− concentration between 10 mg/L and 100 mg/L, Figure S4: Modeling of the experimental curves of N-NO3− (a), N-NO2− (b), N-NH4+ (c) and ΔN (d) obtained during the tests carried out at pH = 7, with Mg0 = 2 g and varying the initial N-NO3− concentration between 10 mg/L and 100 mg/L.
Author Contributions
A.S. conceived the experiments, elaborated the kinetic model and wrote the manuscript; G.M.C. carried out the experiments and elaborated the results; G.M.C. and C.L. executed the simulations.
Funding
This research received no external funding.
Conflicts of Interest
The authors declare no conflict of interest.
References
- Bhatnagar, A.; Sillanpää, M. A review of emerging adsorbents for nitrate removal from water. Chem. Eng. J. 2011, 168, 493–504. [Google Scholar] [CrossRef]
- Siciliano, A. Assessment of fertilizer potential of the struvite produced from the treatment of methanogenic landfill leachate using low-cost reagents. Environ. Sci. Pollut. Res. 2016, 23, 5949–5959. [Google Scholar] [CrossRef] [PubMed]
- Siciliano, A.; Stillitano, M.A.; Limonti, C.; Marchio, F. Ammonium removal from landfill leachate by means of multiple recycling of struvite residues obtained through acid decomposition. Appl. Sci. 2016, 6, 345. [Google Scholar] [CrossRef]
- Kumar, M.; Chakraborty, S. Chemical denitrification of water by zero-valent magnesium powder. J. Hazard. Mater. 2006, B135, 112–121. [Google Scholar] [CrossRef] [PubMed]
- Siciliano, A.; Stillitano, M.A.; De Rosa, S. Increase of the anaerobic biodegradability of olive mill wastewaters through a pre-treatment with hydrogen peroxide in alkaline conditions. Desalin. Water Treat. 2014, 55, 1735–1746. [Google Scholar] [CrossRef]
- Hwang, Y.-H.; Kim, D.-G.; Shin, H.-S. Mechanism study of nitrate reduction by nano zero valent iron. J. Hazard. Mater. 2011, 185, 1513–1521. [Google Scholar] [CrossRef] [PubMed]
- Siciliano, A.; De Rosa, S. Experimental formulation of a kinetic model describing the nitrification process in biological aerated filters filled with plastic elements. Environ. Technol. 2015, 36, 293–301. [Google Scholar] [CrossRef]
- Siciliano, A.; De Rosa, S. An experimental model of COD abatement in MBBR based on biofilm growth dynamic and on substrates’ removal kinetics. Environ. Technol. 2016, 37, 2058–2071. [Google Scholar] [CrossRef]
- Luk, G.K.; Au-Yeung, W.C. Experimental investigation on the chemical reduction of nitrate from groundwater. Adv. Environ. Res. 2002, 6, 441–453. [Google Scholar] [CrossRef]
- Huang, C.-P.; Wang, H.-W.; Chiu, P.C. Nitrate reduction by metallic iron. Water Res. 1998, 32, 2257–2264. [Google Scholar] [CrossRef]
- Ruangchainikom, C.; Liao, C.-H.; Anotai, J.; Lee, M.-T. Effects of water characteristics on nitrate reduction by the Fe0/CO2 process. Chemosphere 2006, 63, 335–343. [Google Scholar] [CrossRef] [PubMed]
- Cheng, F.; Muftikian, R.; Fernando, Q.; Korte, N. Reduction of nitrate to ammonia by zero-valent iron. Chemosphere 1997, 35, 2689–2695. [Google Scholar] [CrossRef]
- Rodríguez-Maroto, J.M.; García-Herruzo, F.; García-Rubio, A.; Gómez-Lahoz, C.; Vereda-Alonso, C. Kinetics of the chemical reduction of nitrate by zero-valent iron. Chemosphere 2009, 74, 804–809. [Google Scholar] [CrossRef] [PubMed]
- Choe, S.; Liljestrand, H.M.; Khim, J. Nitrate reduction by zero-valent iron under different pH regimes. Appl. Geochem. 2004, 19, 335–342. [Google Scholar] [CrossRef]
- Huang, Y.H.; Zhang, T.C. Effects of low pH on nitrate reduction by iron powder. Water Res. 2004, 38, 2631–2642. [Google Scholar] [CrossRef] [PubMed]
- Luo, H.; Jin, S.; Fallgren, P.H.; Colberg, P.J.S.; Johnson, P.A. Prevention of iron passivation and enhancement of nitrate reduction by electron supplementation. Chem. Eng. J. 2010, 160, 185–189. [Google Scholar] [CrossRef]
- Huang, Y.H.; Zhang, T.C. Effects of dissolved oxygen on formation of corrosion products and concomitant oxygen and nitrate reduction in zero-valent iron systems with or without aqueous Fe2+. Water Res. 2005, 39, 1751–1760. [Google Scholar] [CrossRef]
- Noubactep, C.; Caré, S. On nanoscale metallic iron for groundwater remediation. J. Hazard. Mater. 2010, 182, 923–927. [Google Scholar] [CrossRef] [Green Version]
- Yang, G.C.C.; Lee, H.L. Chemical reduction of nitrate by nanosized iron:Kinetics and Pathways. Water Res. 2005, 39, 884–894. [Google Scholar] [CrossRef]
- Siciliano, A. Use of nanoscale zero-valent iron (NZVI) particles for chemical denitrification under different operating conditions. Metals 2015, 5, 1507–1519. [Google Scholar] [CrossRef]
- Kassaee, M.Z.; Motamedi, E.; Mikhak, A.; Rahnemaie, R. Nitrate removal from water using iron nanoparticles produced by arc discharge vs. Reduction. Chem. Eng. J. 2011, 166, 490–495. [Google Scholar] [CrossRef]
- Liou, Y.H.; Lo, S.-L.; Lin, C.-J.; Kuan, W.H.; Weng, S.C. Chemical reduction of an unbuffered nitrate solution using catalyzed and uncatalyzed nanoscale iron particles. J. Hazard. Mater. 2005, B127, 102–110. [Google Scholar] [CrossRef] [PubMed]
- Tsai, Y.-J.; Chou, F.-C.; Cheng, T.-C. Coupled acidification and ultrasound with iron enhances nitrate reduction. J. Hazard. Mater. 2009, 163, 743–747. [Google Scholar] [CrossRef] [PubMed]
- Siciliano, A. Removal of Cr(VI) from water using a new reactive material: Magnesium Oxide supported nanoscale zero-valent iron. Materials 2016, 9, 666. [Google Scholar] [CrossRef] [PubMed]
- Siciliano, A.; Limonti, C. Nanoscopic zero-valent iron supported on MgO for lead removal from waters. Water 2018, 10, 404. [Google Scholar] [CrossRef]
- Liou, Y.H.; Lo, S.H.; Lin, C.J.; Hu, C.Y.; Kuan, W.H.; Weng, S.C. Methods for accelerating nitrate reduction using zerovalent iron atnear-neutral pH: Effects ofH2-reducing pretreatment andcopper deposition. Environ. Sci. Technol. 2005, 39, 9643–9648. [Google Scholar] [CrossRef]
- Mossa Hosseini, S.; Ataie-Ashtiani, B.; Kholghi, M. Nitrate reduction by nano-Fe/Cu particles in packed column. Desalination 2011, 276, 214–221. [Google Scholar] [CrossRef]
- Chang Ahn, S.; Oh, S.-Y.; Cha, D.K. Enhanced reduction of nitrate by zero-valent iron at elevated temperatures. J. Hazard. Mater. 2008, 156, 17–22. [Google Scholar]
- Lee, G.; Park, J. Reaction of zero-valent magnesium with water: Potential applications in environmental remediation. Geochim.Cosmochim. Acta 2013, 102, 162–174. [Google Scholar] [CrossRef]
- Lee, G.; Park, J.; Harvey, O.R. Reduction of Chromium (VI) mediated by zero-valent magnesium under neutral pH conditions. Water Res. 2013, 47, 1136–1146. [Google Scholar] [CrossRef]
- Ileri, B.; Ayyildiz, O.; Apaydin, O. Ultrasound-assisted activation of zero-valent magnesium for nitrate denitrification: Identification of reaction by-products and pathways. J. Hazard. Mater. 2015, 292, 1–8. [Google Scholar] [CrossRef] [PubMed]
- Mirabi, M.; Ghaderi, E.; Sadabad, H.R. Nitrate reduction using hybrid system consisting of zero valent magnesium powder/activated carbon (Mg0/AC) from water. Process Saf. Environ. Prot. 2017, 111, 627–634. [Google Scholar] [CrossRef]
- APHA. Standard Methods for the Examination of Water and Wastewater, 20th eds.; American Public Health Association: Washington, DC, USA, 1998. [Google Scholar]
- Peel, J.W.; Reddy, K.J.; Sullivan, B.P.; Bowen, J.M. Electrocatalytic reduction of nitrate in water. Water Res. 2003, 37, 2512–2519. [Google Scholar] [CrossRef]
Figure 1.
SEM image (a) and XRD diffractogram (b) of Mg0 particles.

Figure 2.
Concentrations of N-NO3− (a), N-NO2− (b), N-NH4+ (c), ΔN (d) and Mg2+ (e) during the tests carried out at pH 3, with an initial N-NO3− concentration of 20 mg/L, varying the amount of Mg0.
Figure 2.
Concentrations of N-NO3− (a), N-NO2− (b), N-NH4+ (c), ΔN (d) and Mg2+ (e) during the tests carried out at pH 3, with an initial N-NO3− concentration of 20 mg/L, varying the amount of Mg0.

Figure 3.
Concentrations of N-NO3− (a), N-NO2− (b), N-NH4+ (c), ΔN (d) and Mg2+ (e) during the tests carried out at pH 3, with 2 g of Mg0, varying the initial N-NO3− concentration between 10 and 100 mg/L.
Figure 3.
Concentrations of N-NO3− (a), N-NO2− (b), N-NH4+ (c), ΔN (d) and Mg2+ (e) during the tests carried out at pH 3, with 2 g of Mg0, varying the initial N-NO3− concentration between 10 and 100 mg/L.


Figure 4.
Concentrations of N-NO3− (a), N-NO2− (b), N-NH4+ (c), ΔN (d) and Mg2+ (e) during the tests carried out at pH 5, with 2 g of Mg0,varying the initial N-NO3− concentration between 10 mg/L and 100 mg/L.
Figure 4.
Concentrations of N-NO3− (a), N-NO2− (b), N-NH4+ (c), ΔN (d) and Mg2+ (e) during the tests carried out at pH 5, with 2 g of Mg0,varying the initial N-NO3− concentration between 10 mg/L and 100 mg/L.


Figure 5.
Concentrations of N-NO3− (a), N-NO2− (b), N-NH4+ (c), ΔN (d) and Mg2+ (e) during the tests carried out at pH 7, with 2 g of Mg0,varying the initial N-NO3− concentration between 10 mg/L and 100 mg/L.
Figure 5.
Concentrations of N-NO3− (a), N-NO2− (b), N-NH4+ (c), ΔN (d) and Mg2+ (e) during the tests carried out at pH 7, with 2 g of Mg0,varying the initial N-NO3− concentration between 10 mg/L and 100 mg/L.

Figure 6.
SEM image (a) and XRD diffractogram (b) of Mg0 particles after the treatment of the solution with initial N-NO3− = 20 mg/L at pH 3.
Figure 6.
SEM image (a) and XRD diffractogram (b) of Mg0 particles after the treatment of the solution with initial N-NO3− = 20 mg/L at pH 3.

Figure 7.
SEM image (a) and XRD diffractogram (b) of Mg0 particles after the treatment of the solution with initial N-NO3− = 20 mg/L at pH 5.
Figure 7.
SEM image (a) and XRD diffractogram (b) of Mg0 particles after the treatment of the solution with initial N-NO3− = 20 mg/L at pH 5.

Figure 8.
SEM image (a) and XRD diffractogram (b) of Mg0 particles after the treatment of the solution with initial N-NO3− = 20 mg/L at pH 7.
Figure 8.
SEM image (a) and XRD diffractogram (b) of Mg0 particles after the treatment of the solution with initial N-NO3− = 20 mg/L at pH 7.


Table 1.
Constants obtained from the interpolation of experimental curves of tests at pH 3, with an initial N-NO3− concentration of 20 mg/L and varied amounts of Mg0.
Table 1.
Constants obtained from the interpolation of experimental curves of tests at pH 3, with an initial N-NO3− concentration of 20 mg/L and varied amounts of Mg0.
| Operating Conditions Tested | Kinetic Constants | |||||||||||||
|---|---|---|---|---|---|---|---|---|---|---|---|---|---|---|
| pH | Mg0 g | NNi mg/L | Mg/NNi g/mg | KN min−1 | NN,R mg/L | KNI min−1 | KI min−1 | KNA min−1 | KIA min−1 | KA min−1 | fNA - | KNG min−1 | KIG min−1 | fNG - |
| 3 | 0.5 | 20 | 0.083 | 0.03213 | 8.665 | 0.02661 | 0.01035 | 0.01022 | 0.00305 | 0.00040 | 0.1329 | 0.00347 | 0.00326 | 0.99 |
| 1 | 0.167 | 0.02243 | 3.457 | 0.02011 | 0.01945 | 0.01168 | 0.00308 | 0.00052 | 0.1815 | 0.00405 | 0.00610 | 0.99 | ||
| 1.5 | 0.250 | 0.04367 | 1.151 | 0.02913 | 0.02955 | 0.01538 | 0.00305 | 0.00101 | 0.1453 | 0.00972 | 0.0095 | 0.99 | ||
| 2 | 0.333 | 0.5310 | 0.060 | 0.142 | 0.08144 | 0.0651 | 0.09474 | 0.00358 | 0.03609 | 0.1866 | 0.0100 | 0.97 | ||
| 6 | 1.00 | 0.4474 | 0.602 | 0.1277 | 0.07423 | 0.00787 | 0.065 | 0.0071 | 0.00109 | 0.1220 | 0.0095 | 0.92 | ||
| 10 | 1.67 | 0.4736 | 0.301 | 0.1555 | 0.09147 | 0.0079410 | 0.06711 | 0.02591 | 0.00292 | 0.0870 | 0.0087 | 0.99 | ||
Table 2.
Kinetic constants obtained from the interpolation of the experimental curves of tests with Mg0 = 2 g, varying the pH and the initial N-NO3− concentration.
Table 2.
Kinetic constants obtained from the interpolation of the experimental curves of tests with Mg0 = 2 g, varying the pH and the initial N-NO3− concentration.
| Operating Conditions Tested | Kinetic Constants | |||||||||||||
|---|---|---|---|---|---|---|---|---|---|---|---|---|---|---|
| pH | Mg0 | NNi | Mg/NNi | KN | NN,R | KNI | KI | KNA | KIA | KA | fNA | KNG | KIG | fNG |
| g | mg/L | g/mg | min−1 | mg/L | min−1 | min−1 | min−1 | min−1 | min−1 | - | min−1 | min−1 | - | |
| 3 | 2 | 10 | 0.667 | 0.07384 | 1.686 | 0.0842 | 0.0794 | 0.056 | 0.00160 | 0.00183 | 0.3618 | 0.02471 | 0.00882 | 0.65 |
| 20 | 0.333 | 0.53100 | 0.06 | 0.1420 | 0.08144 | 0.0651 | 0.09474 | 0.00358 | 0.03609 | 0.1866 | 0.0100 | 0.97 | ||
| 40 | 0.167 | 0.13040 | 1.16 | 0.0977 | 0.05408 | 0.00876 | 0.01056 | 0.00149 | 0.2570 | 0.03921 | 0.0085 | 0.78 | ||
| 60 | 0.111 | 0.04569 | 2.889 | 0.0280 | 0.0330 | 0.00688 | 0.00986 | 0.00100 | 0.1862 | 0.0154 | 0.00675 | 0.83 | ||
| 80 | 0.083 | 0.02384 | 5.338 | 0.0256 | 0.0314 | 0.00321 | 0.00657 | 0.00079 | 0.1397 | 0.00854 | 0.00722 | 0.78 | ||
| 100 | 0.067 | 0.02649 | 10.45 | 0.0210 | 0.0258 | 0.00295 | 0.00600 | 0.00054 | 0.14495 | 0.00937 | 0.00635 | 0.85 | ||
| 5 | 2 | 10 | 0.667 | 0.02545 | 0.00070 | 0.0400 | 0.0750 | 0.00815 | 0.01186 | 0.00057 | 0.278 | 0.00511 | 0.01710 | 0.81 |
| 20 | 0.333 | 0.01527 | 0.00026 | 0.0380 | 0.0701 | 0.00680 | 0.00609 | 0.00049 | 0.151 | 0.00353 | 0.01378 | 0.76 | ||
| 40 | 0.167 | 0.01150 | 0.00011 | 0.0241 | 0.0482 | 0.00627 | 0.00607 | 0.00002 | 0.126 | 0.00111 | 0.0110 | 0.81 | ||
| 60 | 0.111 | 0.00992 | 0.00011 | 0.01082 | 0.02434 | 0.00651 | 0.00627 | 0.00001 | 0.162 | 0.00088 | 0.0116 | 0.87 | ||
| 80 | 0.083 | 0.00764 | 0.00034 | 0.01007 | 0.02278 | 0.00655 | 0.00522 | 0.00005 | 0.134 | 0.00006 | 0.00960 | 0.55 | ||
| 100 | 0.067 | 0.00879 | 0.00034 | 0.01006 | 0.0166 | 0.00650 | 0.00358 | 0.00002 | 0.241 | 0.00003 | 0.01248 | 0.50 | ||
| 7 | 2 | 10 | 0.667 | 0.01317 | 0.00012 | 0.02180 | 0.0730 | 0.00186 | 0.01293 | 0.00051 | 0.24 | 0.00508 | 0.01495 | 0.83 |
| 20 | 0.333 | 0.01329 | 0.00034 | 0.02028 | 0.06056 | 0.00151 | 0.00750 | 0.00044 | 0.15 | 0.00346 | 0.0138 | 0.98 | ||
| 40 | 0.167 | 0.00953 | 0.00024 | 0.01340 | 0.04552 | 0.00148 | 0.00716 | 0.00001 | 0.28 | 0.00111 | 0.01424 | 0.98 | ||
| 60 | 0.111 | 0.00762 | 0.00043 | 0.00871 | 0.0206 | 0.00137 | 0.00792 | 0.00009 | 0.33 | 0.00027 | 0.0088 | 0.96 | ||
| 80 | 0.083 | 0.00622 | 0.00021 | 0.00609 | 0.0188 | 0.00124 | 0.00711 | 0.00001 | 0.39 | 0.00002 | 0.00668 | 0.98 | ||
| 100 | 0.067 | 0.00494 | 0.00081 | 0.00496 | 0.01547 | 0.00116 | 0.00674 | 0.00001 | 0.38 | 0.00001 | 0.00653 | 0.98 | ||
© 2019 by the authors. Licensee MDPI, Basel, Switzerland. This article is an open access article distributed under the terms and conditions of the Creative Commons Attribution (CC BY) license (http://creativecommons.org/licenses/by/4.0/).
Share and Cite
MDPI and ACS Style
Siciliano, A.; Curcio, G.M.; Limonti, C. Experimental Analysis and Modeling of Nitrate Removal through Zero-Valent Magnesium Particles. Water 2019, 11, 1276. https://doi.org/10.3390/w11061276
AMA Style
Siciliano A, Curcio GM, Limonti C. Experimental Analysis and Modeling of Nitrate Removal through Zero-Valent Magnesium Particles. Water. 2019; 11(6):1276. https://doi.org/10.3390/w11061276
Chicago/Turabian StyleSiciliano, Alessio, Giulia Maria Curcio, and Carlo Limonti. 2019. "Experimental Analysis and Modeling of Nitrate Removal through Zero-Valent Magnesium Particles" Water 11, no. 6: 1276. https://doi.org/10.3390/w11061276
Note that from the first issue of 2016, this journal uses article numbers instead of page numbers. See further details here.