Grazing Potential—A Functional Plankton Food Web Metric for Ecological Water Quality Assessment in Mediterranean Lakes


1
Department of Zoology, School of Biology, Aristotle University of Thessaloniki, 54124 Thessaloniki, Greece
2
EYATH SA, Water Supply Division/Drinking Water Treatment Facility, Nea Ionia, 57008 Thessaloniki, Greece
3
Department of Botany, School of Biology, Aristotle University of Thessaloniki, 54124 Thessaloniki, Greece
*
Author to whom correspondence should be addressed.
Water 2019, 11(6), 1274; https://doi.org/10.3390/w11061274
Submission received: 23 May 2019
/
Revised: 14 June 2019
/
Accepted: 15 June 2019
/
Published: 18 June 2019
(This article belongs to the Special Issue Selected Papers from HydroMediT 2018)
Abstract
:Grazing potential (GP, in % day−1) was estimated for the plankton communities of 13 Greek lakes covering the trophic spectrum, in order to examine its sensitiveness in discriminating different classes of ecological water quality. Lakes with high GP values exhibited high zooplankton biomass dominated by large cladocerans or/and calanoids while lakes with low GP values had increased phytoplankton biomass and/or domination of small-bodied zooplankton indicating intensive fish predation. GP successfully distinguished among ecological water quality classes (estimated using the phytoplankton water quality index PhyCoI) indicating its potential use as a metric for ecological water quality assessment. As a next step, PhyCoI index was modified to include GP as a metric in order to enhance the phytoplankton-based ecological status classification of lakes incorporating zooplankton as a supporting factor. The PhyCoIGP successfully assessed the ecological water quality in accordance with PhyCoI classification whereas it was significantly correlated with the eutrophication proxy TSISD based on Secchi Depth. Thus, we propose to use the modified phytoplankton index PhyCoIGP for monitoring the ecological water quality of lakes.
1. Introduction
Over the last two decades, different legislation acts such as the Water Framework Directive (WFD) and the Marine Strategy Framework Directive (MSFD) in Europe, the Water Act in Australia, the US Clean Water Act (CWA) and the South African National Water Act, all having as a main goal to maintain and enhance the ecological integrity of freshwater and marine ecosystems, focus on the assessment of the ecological water quality of water bodies [1]. In Europe, the Water Framework Directive 2000/60/EC [2] introduced the ecological status classification of water bodies based on biological quality elements (BQEs), i.e., phytoplankton, benthic macroinvertebrates, fish, aquatic macrophytes and phytobenthos. The EU Member States and other participating countries have developed and adopted legislation for the assessment of the ecological integrity of surface waters with the intercalibration of 230 evaluation systems and the development of numerous indices/metrics for each BQE (e.g., benthic macroinvertebrates: Lake Acidification Macroinvertebrate Metric (LAMM), ETO (Ephemeroptera, Trichoptera and Odonata) taxa richness and Chironomid pupal exuvial technique (CPET) index; fish: Abundance index of alien species, mean catch per unit effort in terms of number (NPUE) of the guiding species and in terms of biomass (BPUE) of the maximum length of dominant species; macrophytes: Lake Macrophyte Nutrient Index (LMNI), Percent Model Affinity Index (PMA) and Growth form metrics; phytoplankton: Mediterranean Phytoplankton Trophic Index (MedPTI), Phytoplankton Taxa Lake Index (PTSI) and Index Des Grups Algals (IGA); phytobenthos: Eutrophication/Pollution Index-Diatom (EPI-D) Diatom Assessment Of Lake Ecological Quality (DARLEQ) and Specific Pollution sensitivity Index (IPS) [1]). Surprisingly for most ecologists, zooplankton has not been included as a BQE in the WFD and no well-argued scientific explanation exists for its omission [3,4,5]. However, zooplankton is an important component of the pelagic food web, since it contributes to many ecosystem functions such as the transfer of primary production biomass to higher organisms [6], and the increase of water clarity through grazing of the available phytoplankton biomass [7,8]. Moreover, zooplankton communities, due to their quick response to changes resulting from trophic cascades either through bottom-up or top-down control [6], have been used in trophic state assessments [9,10,11], in aquatic ecotoxicology [12,13,14], and in providing information about water quality [15,16] and for discriminating anthropogenically disturbed lakes [17]. Thus, the knowledge of this part of the food web is essential for understanding the function and the structure of lake ecosystems and should be used in monitoring programs [5]. Zooplankton ratios have been included in one of the first schemes developed for the implementation of the WFD, the ECOFRAME [18] incorporating a holistic approach using all biological communities, even before the inclusion of zooplankton in the checklist for a holistic lake assessment [19]. The Common Implementation Strategy (CIS) acknowledging the need of monitoring the top-down control indicates zooplankton as a ‘supportive/interpretative parameter’ of fish ‘often/typically measured or sampled at the same time’ [20] and zooplankton grazing as ‘an additional lake specific factor’ for supporting environmental factor featuring the eutrophication impact [19].
Zooplankton community structure can provide a surrogate, to some extent, for the top down control of fish communities and zooplankton grazing can further be used as a measure of the cascade effects to phytoplankton [18,21]. A commonly used measure of zooplankton grazing is the ratio of zooplankton (or crustacean zooplankton) dry biomass to phytoplankton dry biomass (BZoo/BPhyto). This ratio decreases across the eutrophication gradient [22] and it has been used for water quality assessment in ECOFRAME [18] and as a metric of the Ecosystem Health Index Methodology (EHIM) for lake ecosystem health assessment [23] and the Planktonic Index of Biotic Integrity (P-IBI) [24]. Another promising index reflecting zooplankton grazing is the grazing potential (GP, in % day−1) which is basically a measure of the potential top-down control of phytoplankton by zooplankton, showing the percentage of the phytoplankton biomass ingested per day [25]. GP was developed and later modified according to the theory of the functional characteristics of plankton communities, such as the size and the shape of phytoplankton which affect their susceptibility and edibility [26] and the feeding strategies of zooplankton groups [27]. In the original description of GP, only crustacean biomass was used assuming that cladocerans and copepods ingest phytoplankton corresponding to 100% and 50%, respectively, of their biomass per day; copepods especially cyclopoids are not only herbivorous eating algae and diatoms but also carnivorous [28,29]. Later, GP was modified twice, first by Arp & Deneke [30] with phytoplankton taxonomic groups getting weighting factors in order to estimate only the edible phytoplankton biomass and finally, by Arp et al. [31] with the addition of rotifers biomass in order for the whole zooplankton community to be represented.
GP was developed using data from Danish lakes [25] and it was modified later based on data from German lakes [30,31]. It shows seasonal variation with low values during summer and tends to decrease across the eutrophication gradient [25]. However, it should be taken into consideration that patterns established from the knowledge derived from the well-studied cold-temperate European lakes might be differentiated in other climatic zones, as the Plankton Ecology Group model (PEG-model) does for polar, tropical [32] and Mediterranean lakes [21]. Mediterranean lakes are differentiated from temperate lakes not only by morphometric (basin size/lake size) and climatic characteristics [33] but there are also biologically important differences due to the increased availability of solar radiation in winter months [21]. As a result, there is no biological winter (continuous increase of phytoplankton mainly during late-autumn and winter months) while strong fish predation leads to small-bodied zooplankton dominance, therefore lower grazing pressure on -phytoplankton [21].
Taking into consideration the above particularities of the Mediterranean climatic zone, various indices have been developed lately for the assessment of the ecological water quality of Mediterranean lakes using different biological elements; e.g., Greek Lake Benthic macroinvertebrate Index (GLBiI) based on benthic macroinvertebrates [34], QAELS 2010 e based on microcrustaceans and insects, EQAT based on Chironomidae pupal exuviae [35] and Greek Lake’s Fish Index (GLFI) based on fish [36], all using data from Mediterranean ecosystems. Another recently developed index is the Phytoplankton Community Index (PhyCoI) [37] which is a multimetric index covering all the individual properties of phytoplankton community (diversity, composition, dominance, biomass, blooms). It is an easily calculated, ecologically sound and effective index for assessing the status and ecological integrity of Mediterranean lakes [37].
Acknowledging the importance of both phytoplankton and zooplankton in the ecological water quality assessment of lakes and the need for indices that interpret ecosystem function for water quality assessments of lakes and freshwaters in general, the aim of our study was two-fold. First to examine the sensitiveness of the GP in distinguishing between classes of ecological water quality and second to include and test the GP as a metric into an existing phytoplankton index so as to enhance the detection of phytoplankton-based food web functioning impact on the ecological status classification of lakes.
We hypothesized that GP can differentiate along the ecological water quality spectrum. In order to test this hypothesis, we examined the ability of GP in distinguishing among ecological water quality classes as estimated using the phytoplankton water quality index PhyCoI. We chose PhyCoI as the most appropriate index for the ecological water quality since it was developed using phytoplankton data from Greek/transboundary Balkan lakes [37]. As a next step, we proposed a modified index, namely PhyCoIGP, including the GP as a metric in PhyCoI. We hypothesized that this more functional phytoplankton community index incorporating zooplankton as a supporting factor, will improve the assessment of lake ecological water quality compared to PhyCoI. In order to test that we examined the PhyCoIGP and PhyCoI application in Greek/transboundary lakes and their relation to the eutrophication proxy TSISD index based on water transparency measured as Secchi Depth (TSISD) [38].
2. Materials and Methods
2.1. Data Collection
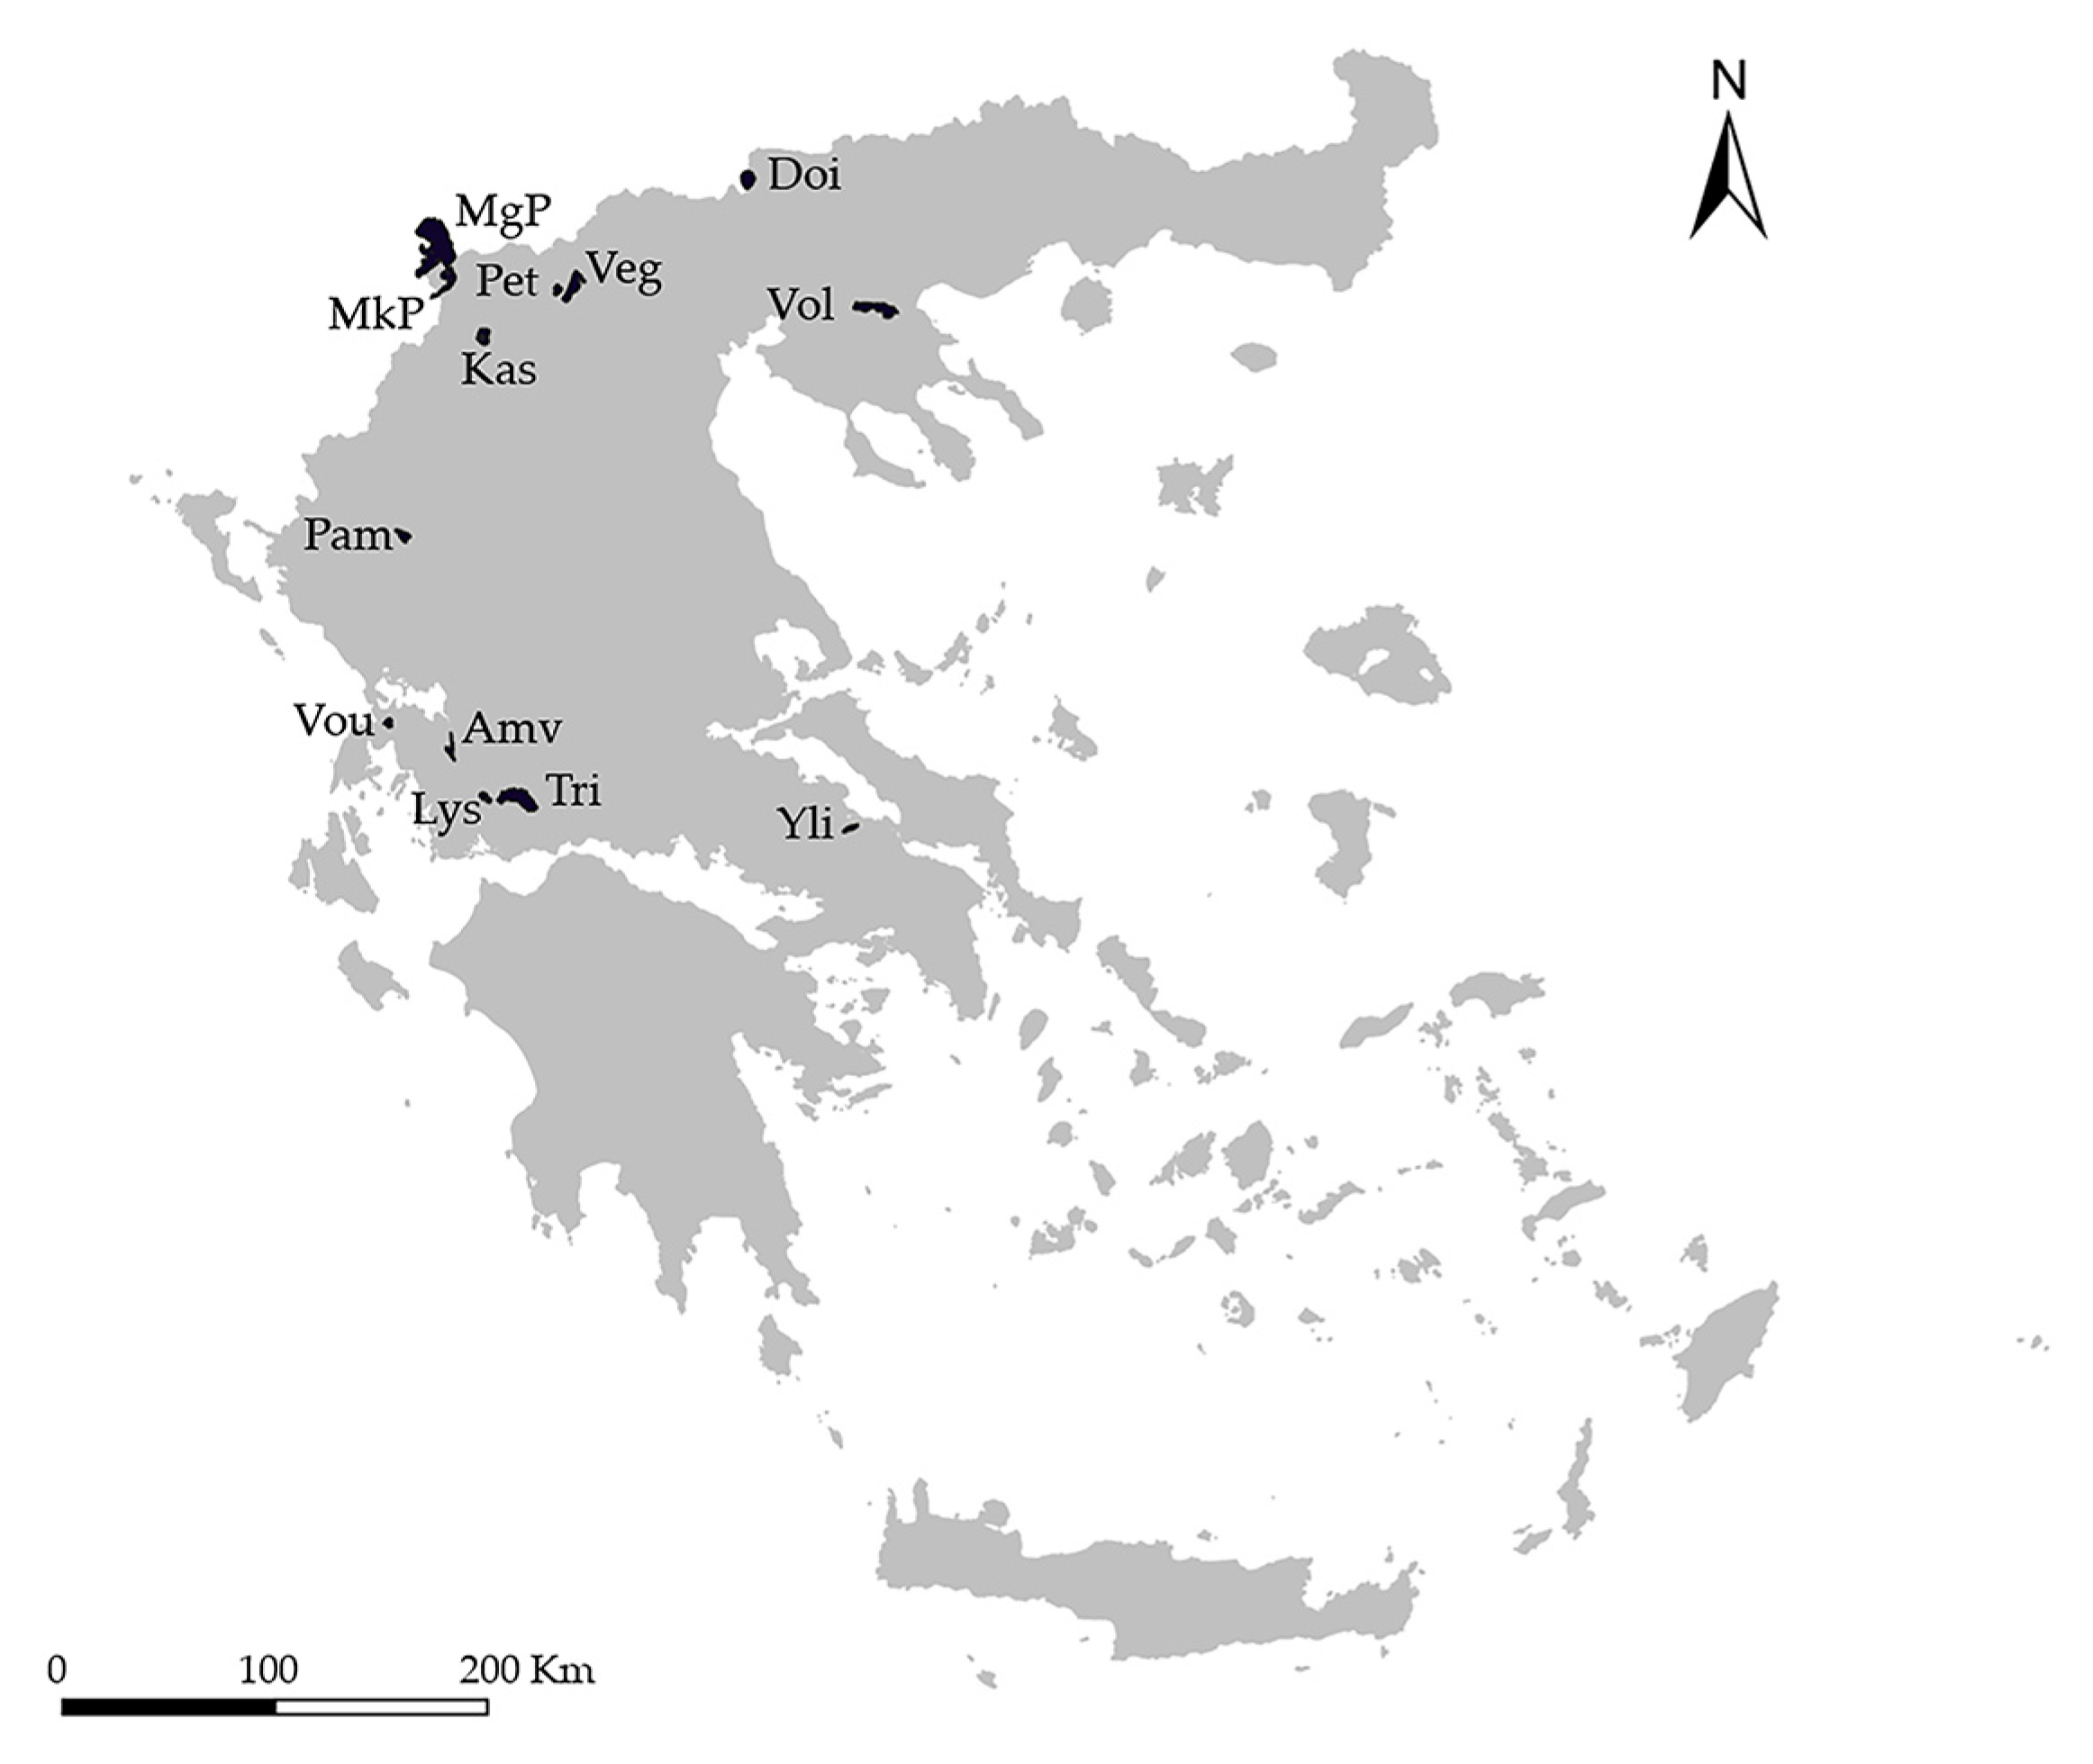
The present study comprised data from 13 natural Greek lakes of different altitude, surface area, depth and trophic state (Figure 1; Table 1). The dataset includes published (from 1984 to 2017) and new data from Lake Lysimachia (2016) (Table A1). The warm period was chosen because it is the period used for the lake ecological status assessment in Greece/Mediterranean region [36,37,39]. The number of collected samples per lake ranged from three to 12 (three samplings during the period June to September) (Table A1). The same sampling protocol for phytoplankton and zooplankton described by Mazaris et al. [40] and Moustaka-Gouni et al. [21] was followed for all lakes. Detailed information regarding the microscopic analyses of phytoplankton and zooplankton identification and biomass calculation is well described in Stamou et al. [11]. Phytoplankton wet biomass was converted to dry biomass according to Reynolds [41].
2.2. Grazing Potential
The modified GP (in % day−1) [25,30,31] was calculated according to Equation (1) based on weighted dry biomass of zooplankton and phytoplankton groups. The weighted phytoplankton groups comprise the edible phytoplankton biomass (BED) according to Equation (2).
where: B is the dry biomass (mg L−1) of rotifers (ROT), cladocerans (CLAD), copepods (COP), cyanobacteria (CYANO), chlorophytes (CHLORO), chrysophytes (CHRYSO), cryptophytes (CRYPTO), prymnesiophytes (PRYMNESIO), diatoms (DIATOMS), dinophytes (DINO) and conjugatophytes (CONJ).
The relative edibility of the phytoplankton ranges from very good (1) to not at all (0) edible.
2.3. Water Quality Assessment
The assessment of the ecological water quality was made using the phytoplankton PhyCoI index according to Katsiapi et al. [37]. For this, five metrics/sub-indices (total phytoplankton biovolume (TB), cyanobacterial biovolume according to WHO (World Health Organization) Guidelines (WG), modified Nygaard sub-index based on the biomass of indicator taxonomic groups (NB), modified Nygaard sub-index based on species richness of indicator taxonomic groups (NS), Quality Group species Index (QG)) were calculated. PhyCoI was calculated as the sum of the scores of the five metrics/sub-indices as they are defined in Katsiapi et al. [37]; for the metric TB the classification scheme was updated according to expert judgment from coarse type-specific to site-specific reference values for the studied lakes and it is presented in Table A2.
PhyCoI ranges from zero to five. This index range is divided in five classes of ecological quality: 0–1: Bad, >1–2: Poor, >2–3: Moderate, >3–4: Good, >4–5: High/reference.
2.4. The PhyCoIGP Index
The PhyCoIGP index is a modified PhyCoI index incorporating as a metric GP, thus it is a phytoplankton community index incorporating zooplankton as a supporting factor including additional information on the lake plankton community for ecological water quality assessments. In particular, PhyCoIGP includes the five metrics/sub-indices (TB, WG, NB, NS, QG) originally included in PhyCoI and an additional sixth metric, the GP. It is calculated as the sum of the scores of the six metrics/sub-indices (Table 2; Equation (3)):
In order for PhyCoIGP to follow PhyCoI values range and thus the same boundaries for ecological water quality assessment, the scores of the five metrics in PhyCoI were re-assigned in order to include in the same total score of PhyCoI the 6th metric of GP. The selected scoring system for PhyCoIGP is giving a specific weight to the different metrics/sub-indices according to their importance on detecting water quality changes [37]. Since GP is a food web metric combining the functional trait characteristics of both zooplankton and phytoplankton communities it was given 0.8 as a reference score, which is comparable to the corresponding ones of the rest of the metrics/sub-indices (0.5 to 0.8) except for the higher score (1.8) of the metric TB. The PhyCoIGP scores for WG, NB, NS and QG metrics/sub-indices were based on their calculation and the classification schemes as they are described in Katsiapi et al. [37]. In order to set the boundaries of the GP metric for the five quality classes, the studied lakes were classified into ecological water quality classes according to PhyCoI and then the GP mean values of each class was used as the lower boundary for each class of ecological water quality.
PhyCoIGP ranges from zero to five representing five classes of ecological quality: 0–1: Bad, >1–2: Poor, >2–3: Moderate, >3–4: Good, >4–5: High/reference.
2.5. Statistical Analysis
Linear Regression and Analysis of Variance (ANOVA) were applied to test the dependence of GP on ecological water quality as assessed by PhyCoI. Moreover, in order to evaluate the application of GP in assessing ecological water quality, we used the ecological water quality classification (high, good, moderate and poor; none of the lakes of the present study were classified as “bad”) for each sampling data based on PhyCoI. ANOVA and Bonferroni correction were applied to reveal if the GP differed among the four groups of ecological water quality. Weight cases for each parameter were used to reduce bias due to there being different number of lakes or samplings in each group.
We also tested how GP, PhyCoIGP and PhyCoI of the studied lakes are related to the eutrophication proxy TSI index based on Secchi depth. The respective TSISD values according to Stamou et al. [11] were used. Relationships between the PhyCoIGP index and the TSISD index were examined using Linear Regression and ANOVA.
All statistical analyses were performed using IBM-SPSS Statistics 25.
3. Results
3.1. Grazing Potential across Lake Trophic Spectrum and Ecological Water Quality
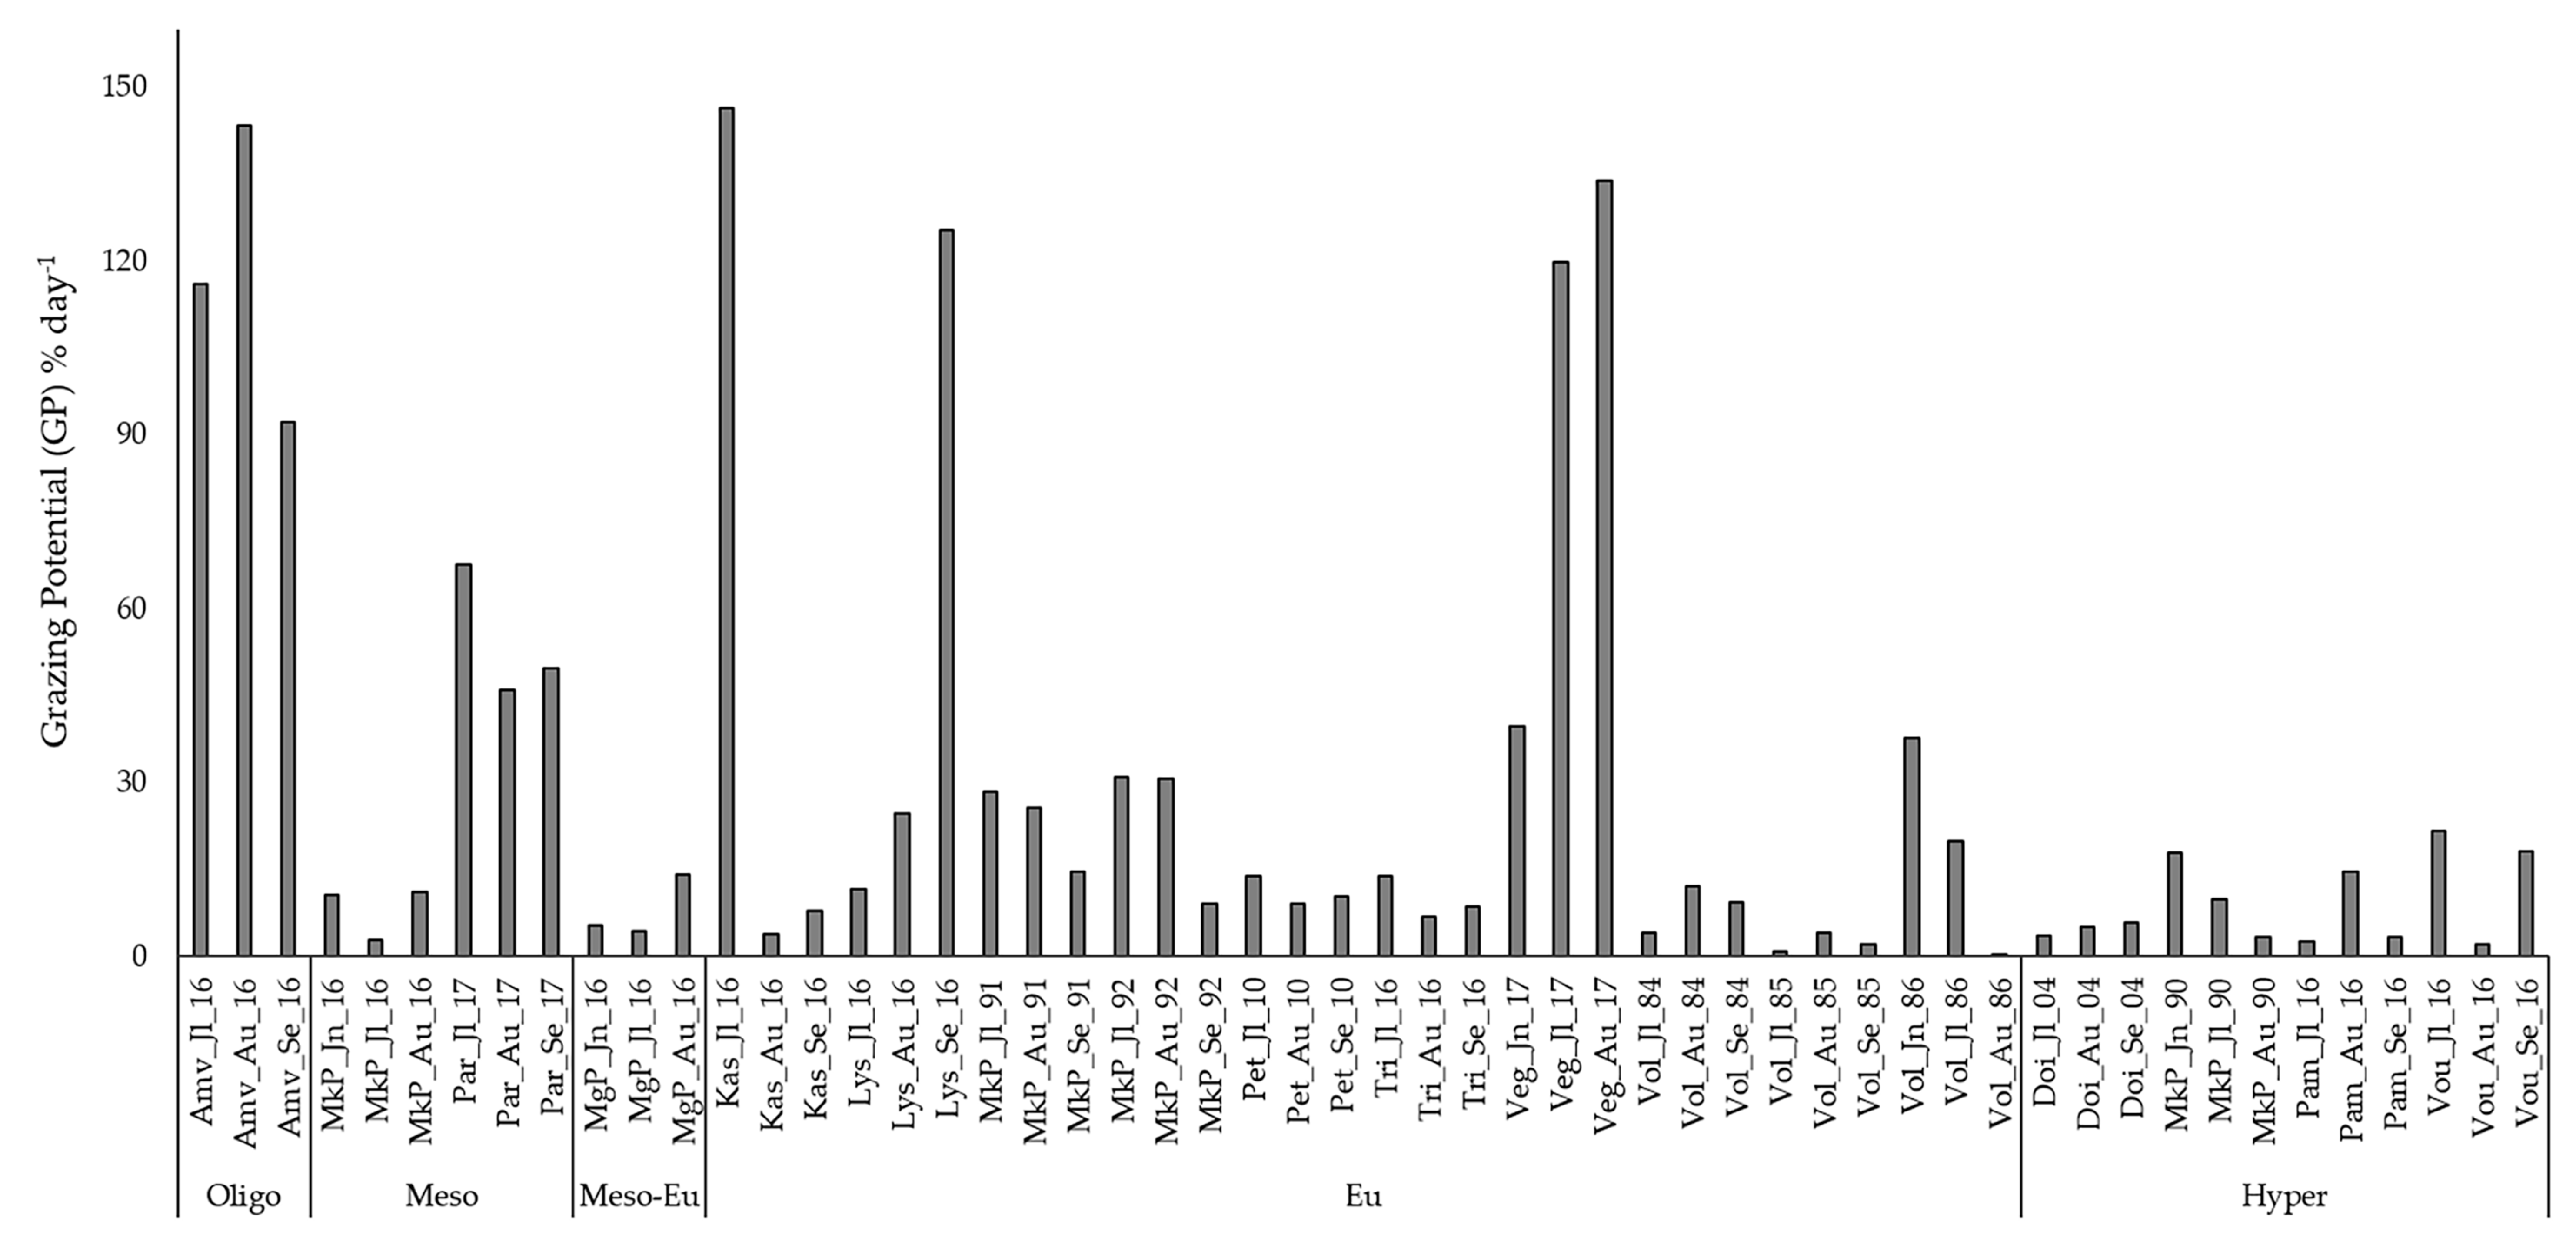
Grazing potential (GP) applied in the 13 Greek studied lakes ranged from 0.18% day−1 (Lake Voulkaria in July 2016) to 146.55% day−1 (Lake Kastoria in July 2016) (Figure 2). GP did not show a specific pattern along the trophic spectrum.
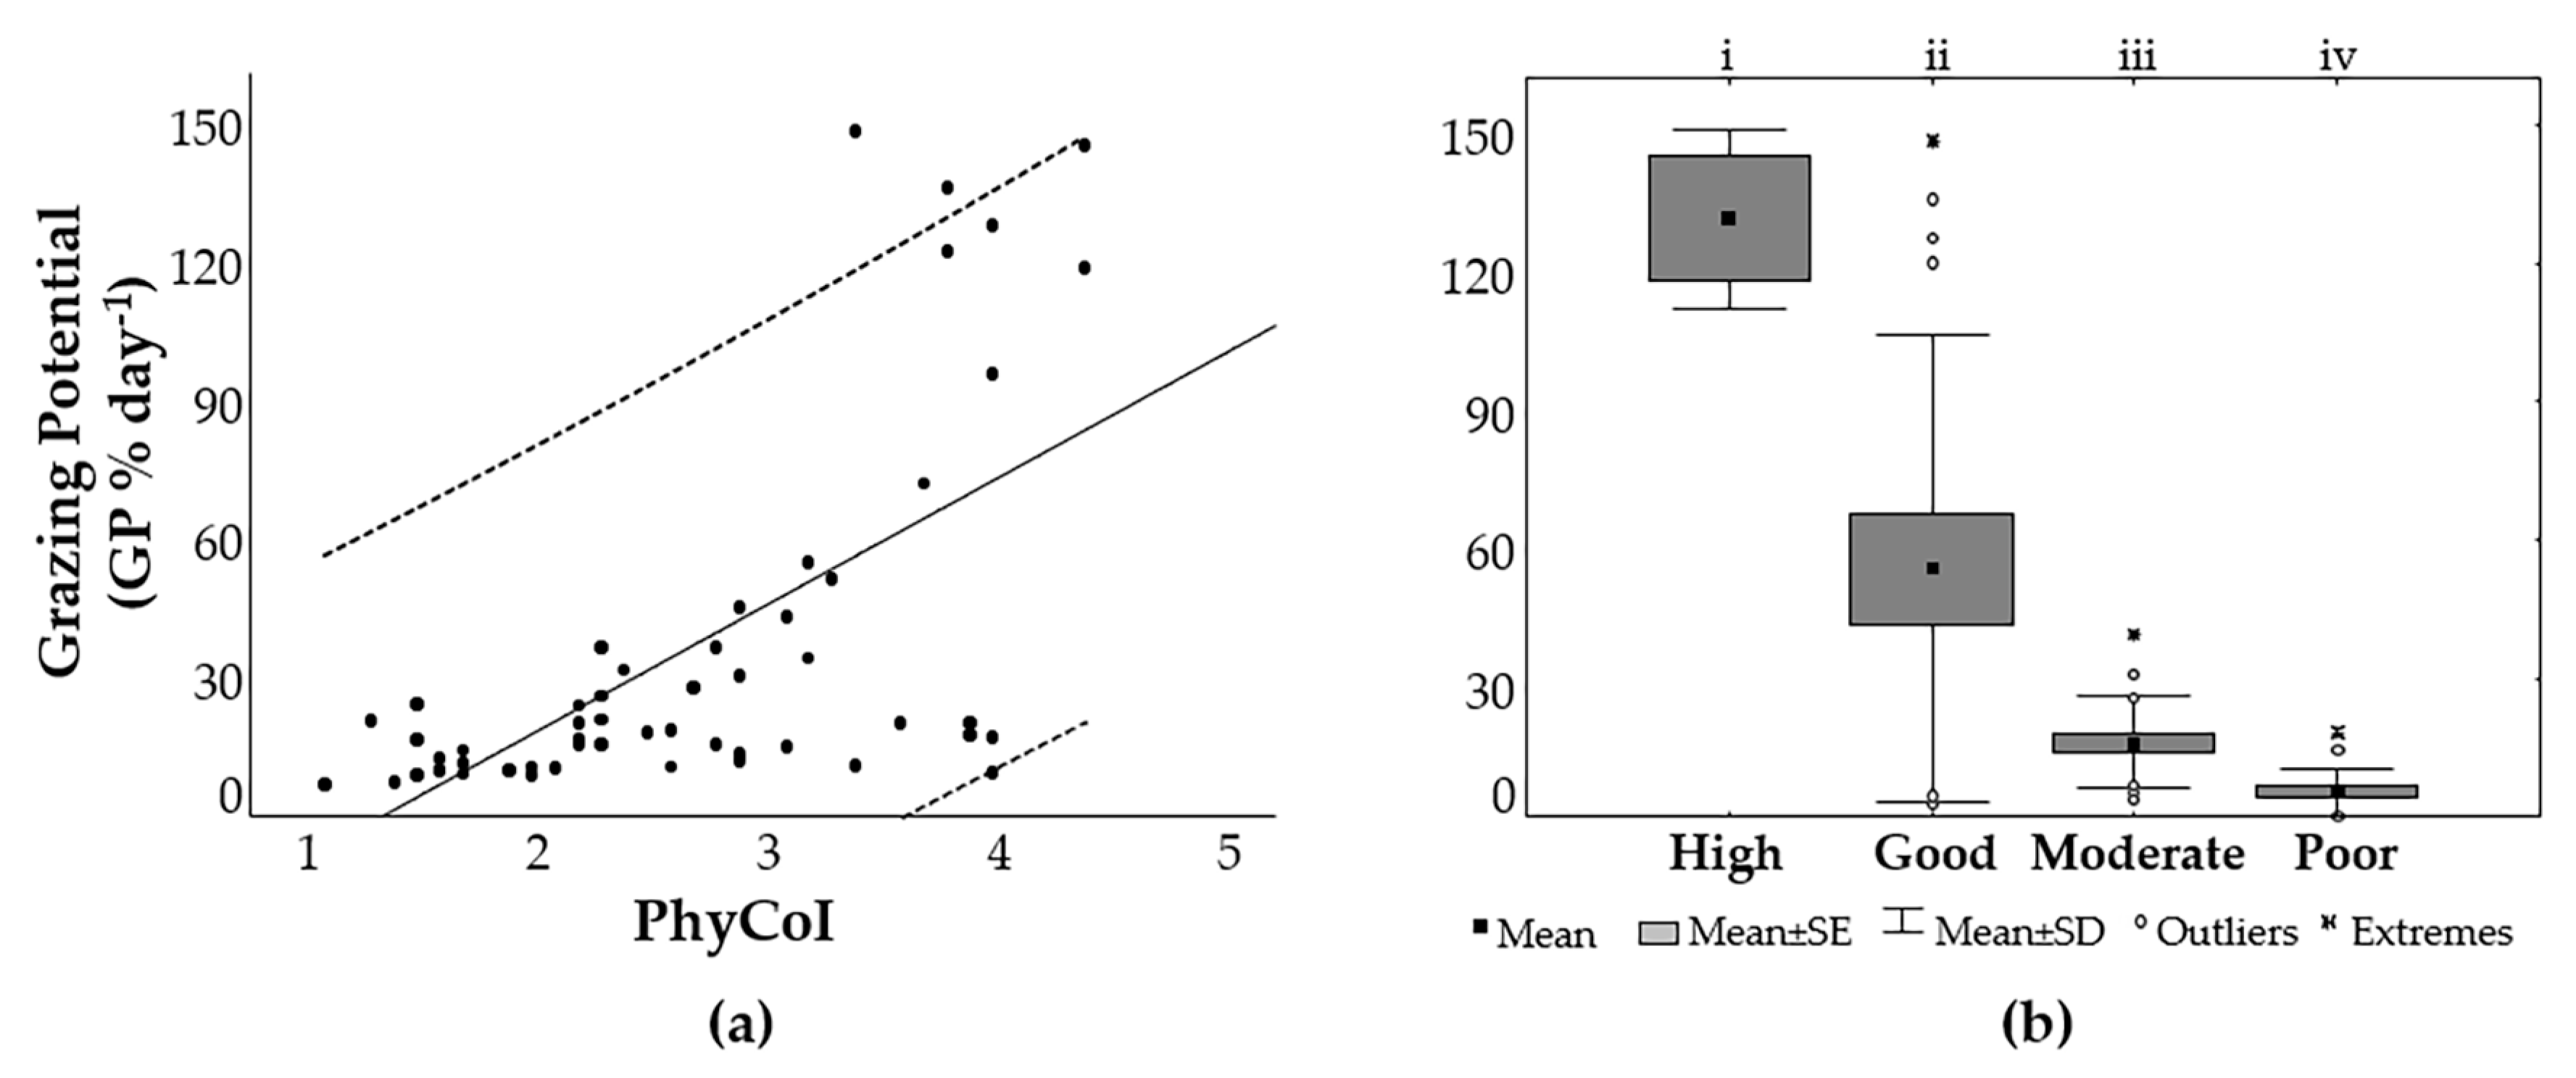
GP was significantly correlated according to linear regression with PhyCoI (GP = 28.405 PhyCoI − 46.711; R2 = 0.403 and p < 0.0001) (Figure 3a). GP detected different classes of ecological water quality as estimated by PhyCoI (ANOVA: F = 305.139, p < 0.0001) and the pairwise test also indicated significant differences among the categories (Bonferroni: p < 0.0001). However, range overlaps can be seen among the different ecological water quality classes with almost 28% of the cases being extremes and outliers. In particular, the extreme values were Lake Kastoria (July 2016) for good class, Lake Vegoritis (June 2017) for the moderate class and Lake Voulkaria (September 2016) for the poor class; high value outliers were lakes Vegoritis (July and August 2017) and Lysimachia (September 2016) for the good class, Lake Mikri Prespa (July and August 1992) for the moderate class and Lake Pamvotis (August 2016) for the poor class; and low value outliers were lakes Mikri Prespa and Megali Prespa (July 2016) for the good class, lakes Kastoria (August 2016), Volvi (July 1984) and Megali Prespa (June 2016) for the moderate class and Lake Voulkaria (July 2016) for poor class (Figure 3b).
3.2. PhyCoIGP Application versus PhyCoI
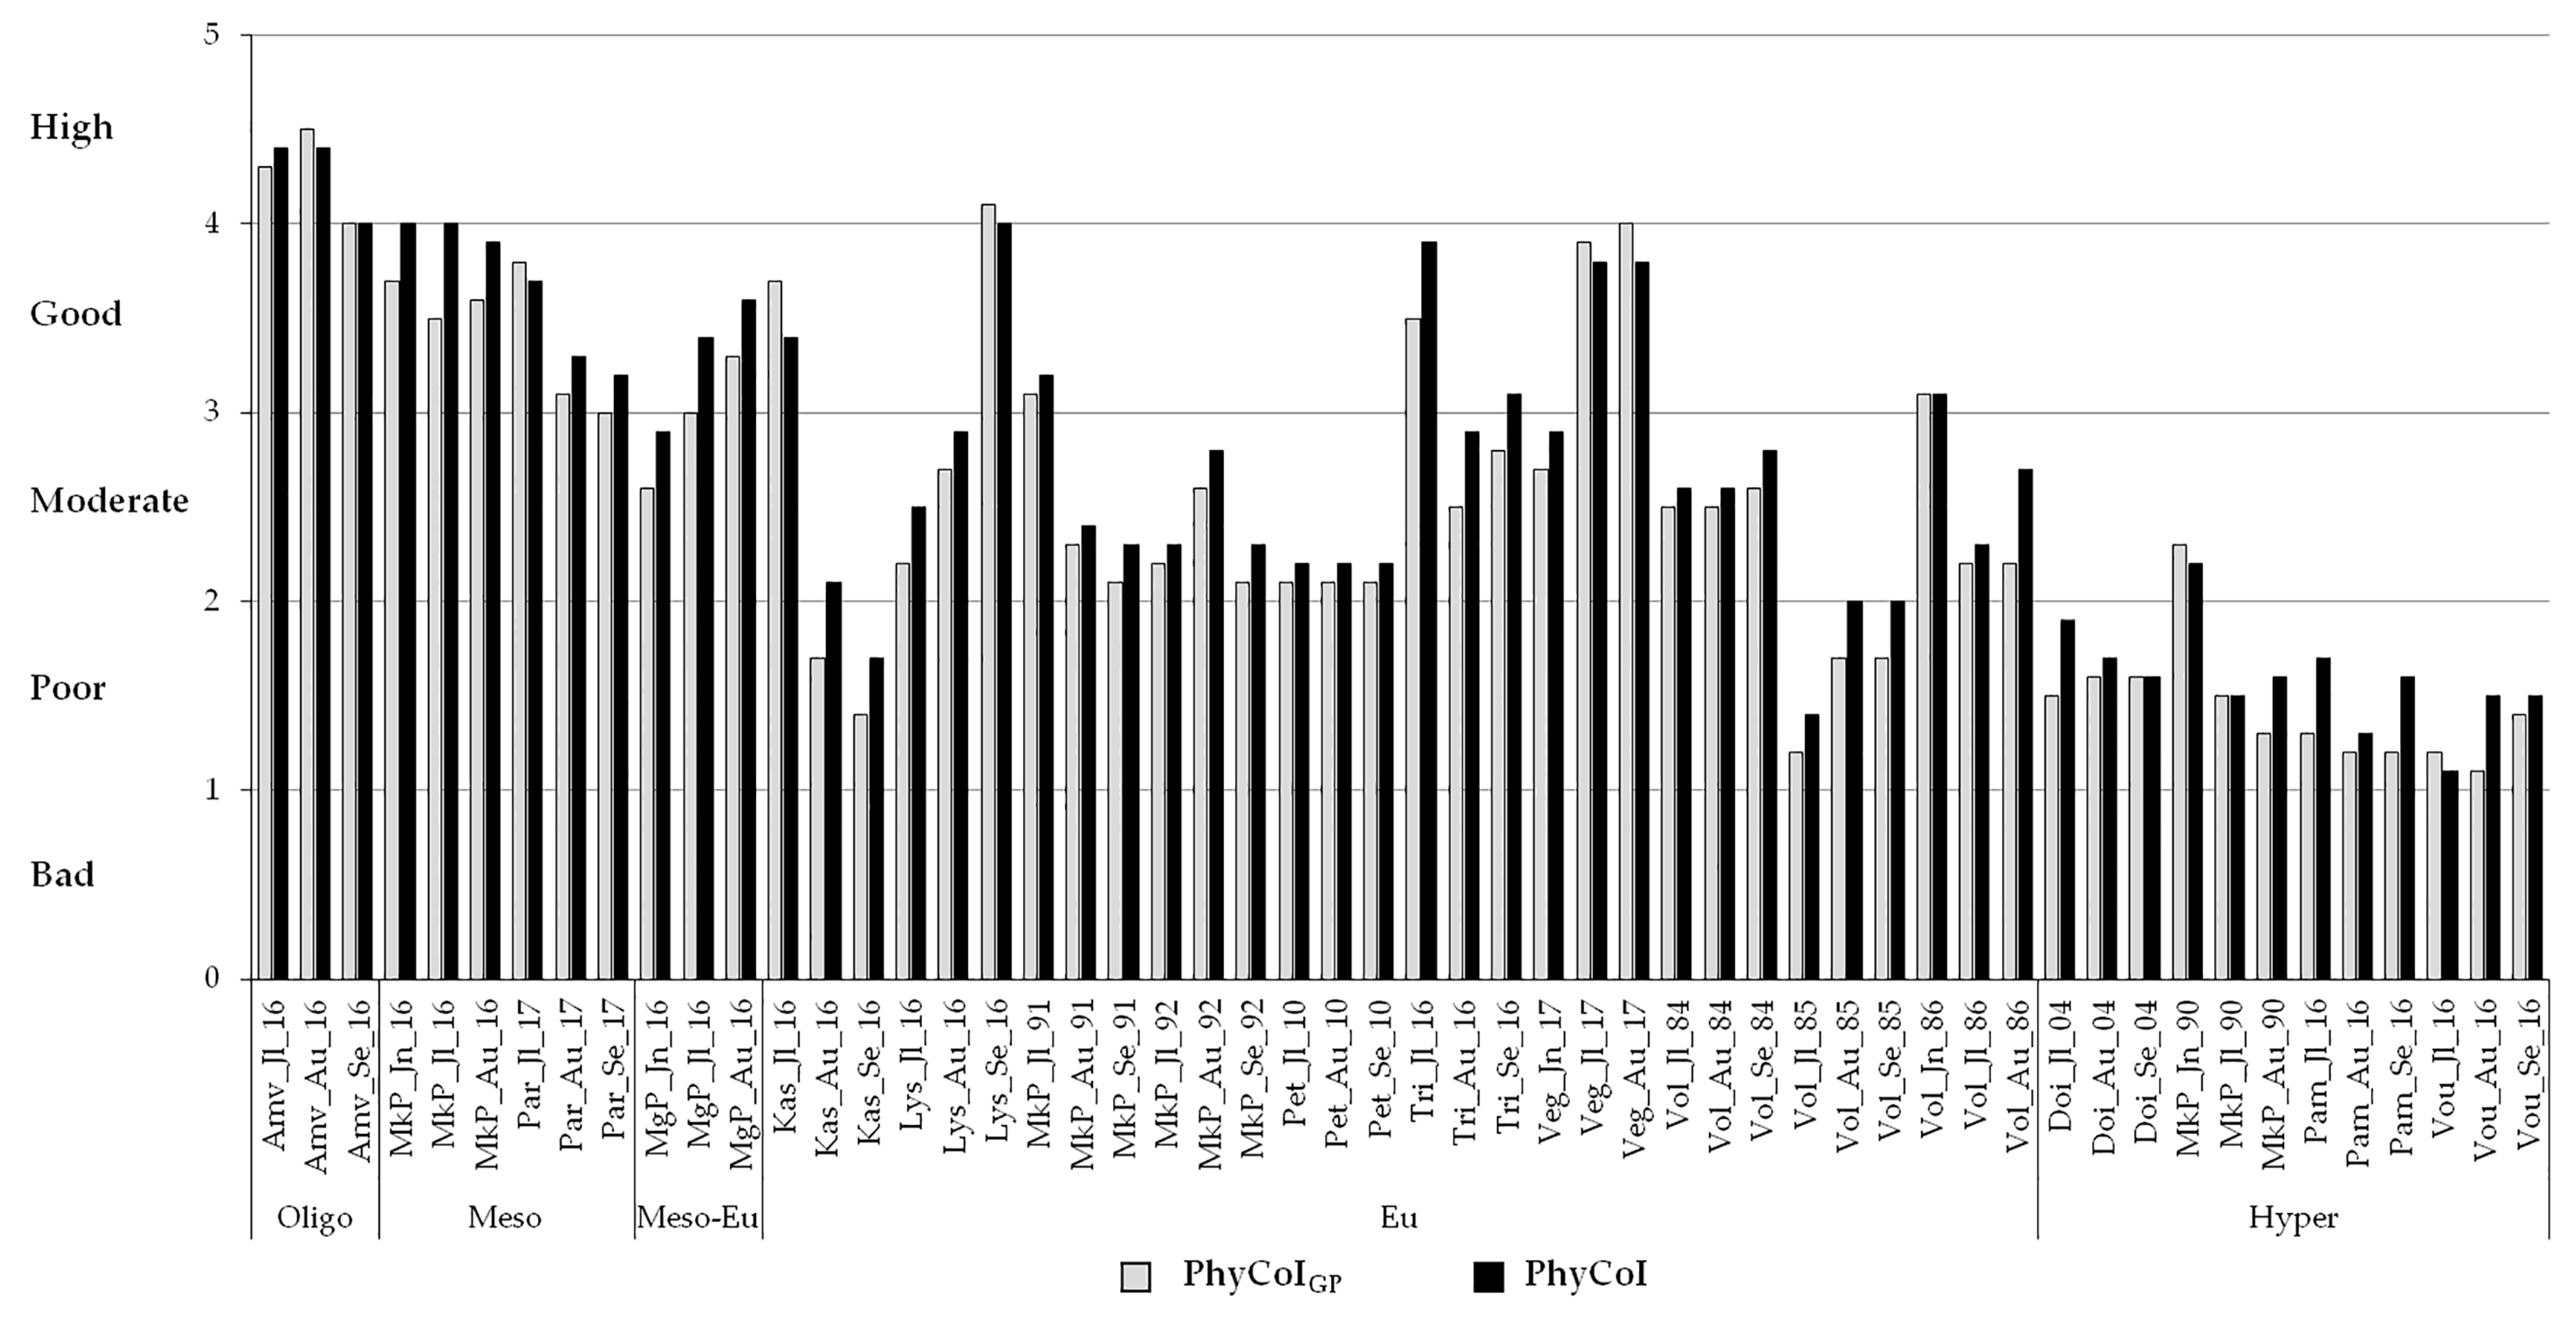
The PhyCoIGP index is a phytoplankton community index incorporating zooplankton as a supporting factor for ecological water quality assessment since it is a modification of the PhyCoI index incorporating GP. Both PhyCoI and PhyCoIGP indices were used to assess and classify the ecological water quality of the 13 studied lakes and their values are presented in Figure 4. The PhyCoI index ranged from 1.1 (Lake Voulkaria in July 2016) to 4.4 (Lake Amvrakia in July and August 2016). The PhyCoIGP index ranged from 1.1 (Lake Voulkaria in August 2016) to 4.5 (Lake Amvrakia in August 2016).
Both PhyCoI and PhyCoIGP classified the ecological water quality of the 13 lakes in the same category except for the cases of Lake Kastoria in August 2016, Lake Lysimachia in September 2016, Lake Megali Prespa in July 2016, Lake Paralimni in September 2017 and Lake Trichonis in September 2016. Both PhyCoI and PhyCoIGP values exhibited great variability within the same lake (Figure 4).
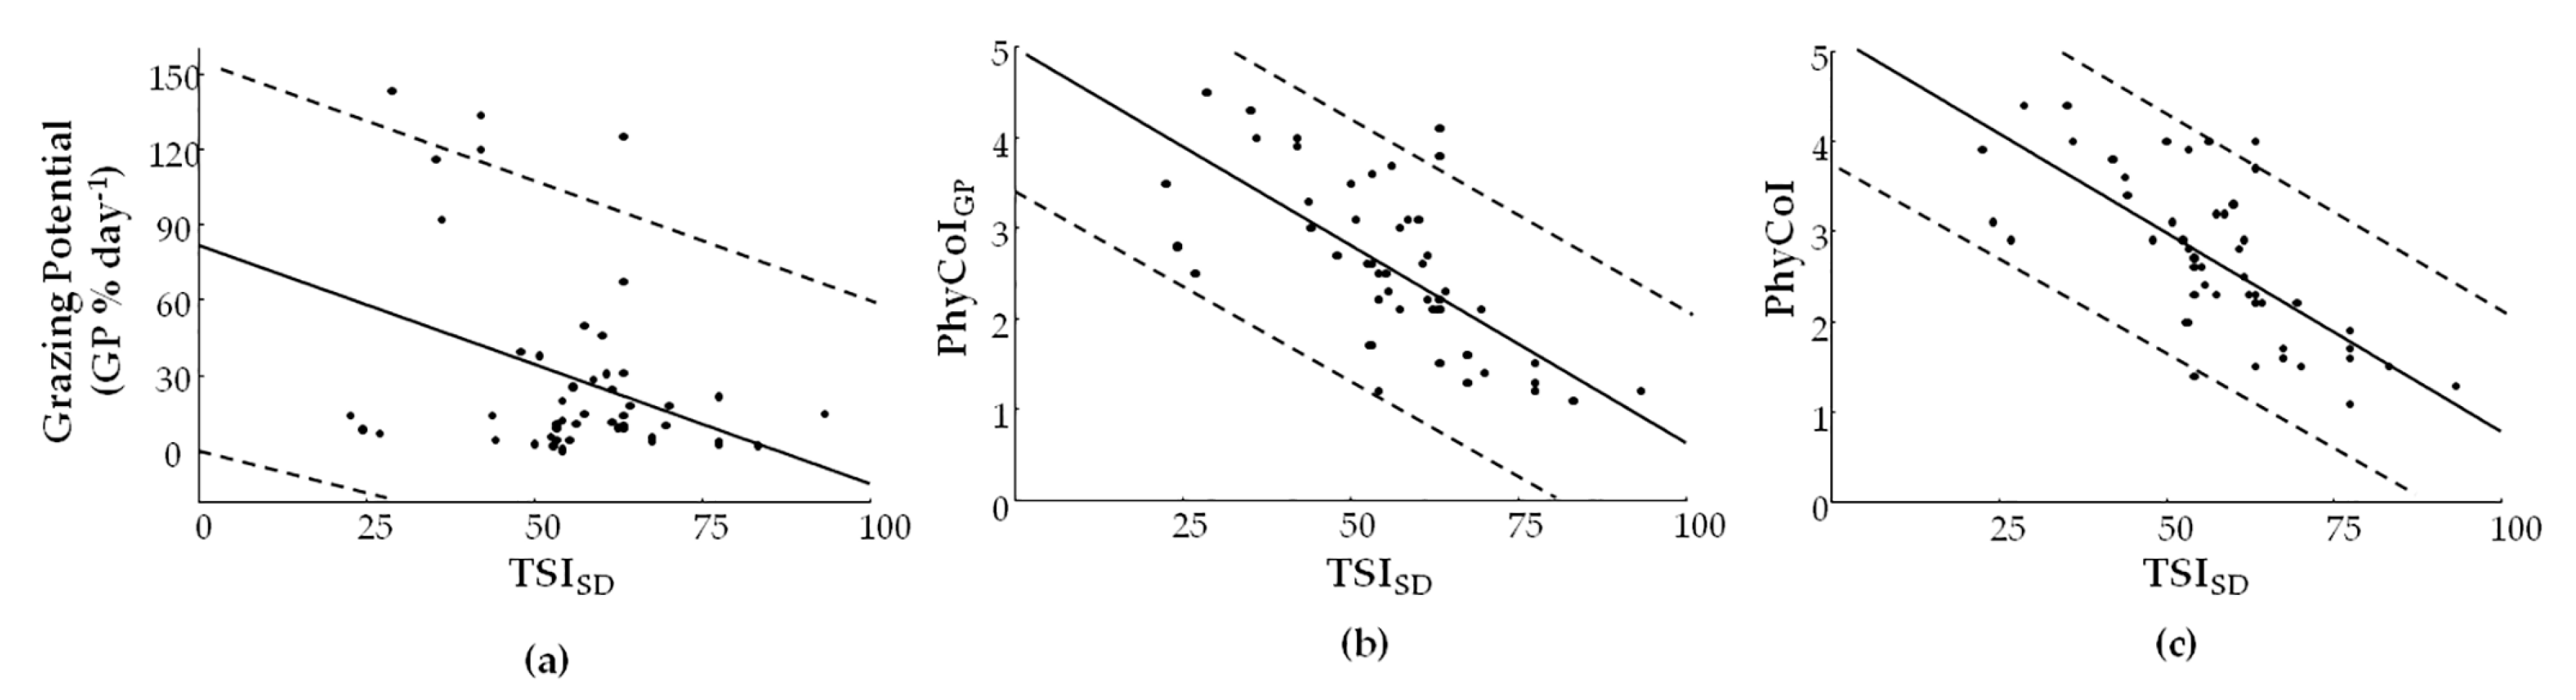
3.3. GP, PhyCoIGP and PhyCoI versus the Eutrophication Proxy TSISD
Based on the dataset of the studied lakes, the linear regression analysis revealed that GP, PhyCoIGP and PhyCoI had a significant negative relationship with the eutrophication proxy TSISD index (Table 3, Figure 5). All the sites were included within the prediction limits of the model except for the cases with high GP values (Lake Amvrakia in August 2016, Lake Vegoritis in July and August 2017 and Lake Lysimachia in September 2016); and for PhyCoIGP and PhyCoI the cases of Lake Lysimachia in September 2016, Lake Paralimni in July 2017 and Lake Volvi in August 1985. Both lakes Lysimachia and Paralimni are shallow with sediment resuspension affecting the TSISD as indicated by microscopy analysis of lake water; while in the cases of the deep lakes Vegoritis and Amvrakia, they have suffered from drastic water level changes within the last decade, which might also affect the TSISD.
4. Discussion
4.1. Grazing Potential across Lake Trophic Spectrum and Ecological Water Quality
This is the first application of the functional index grazing potential (GP) in the Mediterranean region, a region quite different (climatic and biological differences) compared to temperate regions [21,33]. Moreover, it is a first attempt to evaluate its use for assessing the ecological water quality of lakes using at the same time the phytoplankton based PhyCoI index. So far, GP has been only correlated with eutrophication, in temperate lakes [25].
The GP in relation to PhyCoI classification using zooplankton and phytoplankton data from 13 Greek lakes revealed that it is significantly correlated with ecological water quality and it can distinguish among the different ecological water quality classes. However, since GP depends both on zooplankton and phytoplankton communities, it can exhibit high values either when zooplankton is dominated by large individuals (cladocerans or calanoid copepods) or when phytoplankton biomass is low (e.g., in the oligotrophic Lake Amvrakia) or is mainly dominated by non-edible species. In the studied lakes, high GP values were recorded in cases of good and moderate ecological water quality, such as Lake Kastoria, Lake Vegoritis and Lake Mikri Prespa. Particularly, in Lake Kastoria (July 2016) high GP values due to the domination of Daphnia (Daphnia) galeata Sars, 1864 (69% contribution to total zooplankton biomass) coincided with an extreme value of good ecological water quality. Lake Kastoria is an urban eutrophic lake under restoration and the assessment of good quality is restricted to a specific time period reflecting the restored lake plankton community [43]. Lake Vegoritis (2017) and Lake Mikri Prespa (1992) exhibited high values of GP due to either domination of calanoid copepods or their co-dominance with large bodied cladocerans (such as genera Diaphanosoma Fischer, 1850 and Daphnia O. F. Mueller, 1785). It is well known that domination of daphnids can lead to the spring clear water phase and when followed by increased zooplankton biomass dominated by daphnids and calanoids can maintain the increased water clarity even in summer [44,45]. This co-domination of large bodied zooplankton performs an affective grazing pressure on the entire phytoplankton size spectrum by complementary feeding on different size spectra of phytoplankton [46]. On the other hand, Lake Voulkaria (September 2016) and Lake Pamvotis (August 2016) had higher GP values (extreme and outlier, respectively) than the rest of the cases of the poor quality class due to high zooplankton biomass which was nevertheless dominated by small sized individuals of the genera Bosmina Baird, 1845 and Chydorus Leach, 1816 coinciding with cyanobacterial blooms. These lakes as the majority of the eutrophic Mediterranean freshwater systems can exhibit prolonged cyanobacterial blooms (up to eight months), with cyanobacterial domination up to more than 90% of the total phytoplankton biomass [47], as in the case of Lake Pamvotis [11]. In such systems with persistent cyanobacterial blooms, small and selective grazing taxa such as Bosmina, Chydorus, cyclopoid copepods, and rotifers can reach high abundances [48,49].
The low values of GP (<40) and thus the outliers of the low values of good ecological water quality class as well as the lower quality classes correspond to either increased phytoplankton biomass or low zooplankton biomass, indicating possible fish predation. Thus, the eutrophic and hypertrophic lakes were expected to have low GP values due to high phytoplankton biomass as it is also described for the GP pattern of the temperate lakes [25]. This was quite evident also in the studied hypertrophic lakes, which were of poor ecological water quality according to PhyCoI such as Lake Voulkaria (especially in July 2016), which exhibited the highest phytoplankton biomass recorded in the present study. As for the cases with low zooplankton biomass dominated by small-bodied species they could indicate the impact of planktivorous fish predation [50,51]. Planktivorous fish and their pressure on zooplankton community have been described in Greek lakes; for example, the case of Alosa macedonica (Vinciguerra, 1921) in Lake Volvi [52] and Atherina boyeri Risso, 1810 in Lake Trichonis [53] could explain the low values of GP in these two lakes. Moreover, in the Mediterranean lakes the increased fish predation to zooplankton even without planktivorous fish can be explained by the extended reproductive period of fish with high fecundity and more than one spawning bouts per year [21,54], due to the continuous numbers of fish larva, juveniles and species with ontogenetic shifts in fish diet [55]. Additionally, the predation of omnivorous species can be important especially in more eutrophic lakes [56] and lower latitudes [57] showing feeding plasticity by adapting their diet due to prey availability in each season [58]. Such cases with low GP values were lakes Megali and Mikri Prespa, which exhibit a high production of the omnivorous species Pseudorasbora parva (Temminck & Schlegel, 1846) and Lepomis gibossus (Linnaeus, 1758) [59]. The impact of P. parva on zooplankton has been described for Mikri Prespa [60] while fish predation has increased after the introduction of L. gibossus, a species with zooplankton preference depending both on body size and food availability [61,62]. Hence, the increase of fish predation may explain the lower GP values of the samplings of 2016.
Considering the above, it is therefore important to identify how the GP values are derived and how differences in zooplankton community composition explain the outliers and extreme values of the ecological water quality classes.
4.2. PhyCoIGP Application versus PhyCoI
Recently, the use of functional traits has proven a promising and effective approach for studying the link between plankton communities’ structures and ecosystem functioning [26,63]; pointing to its use in environmental assessments [64]. However, functional metrics are rarely included in the indices used by the Member States for the ecological water quality assessment according to the WFD [1]. Such a metric is GP, a plankton community metric, combining the functional trait characteristics of both zooplankton and phytoplankton communities which was used in the present study for modifying PhyCoI, an index developed for ecological water quality assessment.
The integration of GP in the PhyCoI index and the restructuring of the latter so as to track besides eutrophication impacts, since both PhyCoIGP and PhyCoI had almost equally strong correlation with eutrophication, changes in the fish community resulted in the introduction of a modified plankton index, the PhyCoIGP index. PhyCoIGP may prove an initial plankton food web index effective and promising tool for the ecological water quality assessment of lakes as demonstrated by its application to the 13 Greek lakes of different trophic status. It successfully assessed the ecological quality of the studied lakes, since, it not only assessed the same ecological water quality as the PhyCoI index but also identified cases with particularities. For example, a) the improvement in the ecological water quality of Lake Kastoria in June and July 2016 after the implementation of the lake water flushing method [65] and b) the moderate quality of Lake Megali Prespa in July 2016 following a conspicuous cyanobacterial Dolichospermum (Anabaena) lemmermannii (Richter) P. Wacklin, L. Hoffmann & J. Komárek, 2009 bloom [66] while signs of its degradation have been reported in the last decade [67]. Another case was the moderate quality of Lake Paralimni in September 2017 (classified as good by the PhyCoI Index) that is in agreement with increased cyanobacterial biovolume and dominance of Microcystis aeruginosa (Kützing) Kützing, 1846 and Microcystis panniformis Komárek, Komárková-Legnerová, Sant’Anna, M.T.P. Azevedo & P.A.C. Senna, 2002 [66].
Even though, GP has a slightly significant correlation with eutrophication as indicated by TSISD, its combination with PhyCoI resulted in the PhyCoIGP having a strong correlation between PhyCoIGP and Secchi Depth (except for two lakes with high non-algal turbidity). This, allows the use of high frequency Secchi Depth measurements all over the year combined with low frequency phytoplankton and zooplankton samplings during the warm period. Considering that TSISD index is commonly used as a low-cost variable of measuring eutrophication even though it is influenced both by phytoplankton abundance and nonalgal particulate matter [38] and that phytoplankton biomass is considered as the more appropriate measure of eutrophication [68] ecosystem monitoring cannot be based only on Secchi Depth measurements. Thus, we propose low frequency of PhyCoIGP determinations, as proposed for PhyCoI [37], especially during the warm period in natural lakes combined with a high frequency Secchi Depth measurements especially in monitoring programs that encompass a multitude of water bodies.
The PhyCoIGP index continues to incorporate the potentials and limitations described in Katsiapi et al. [37] such as the combination of several metrics covering the composition and function of plankton communities reflecting complementarily the environmental changes. Even though it might seem that PhyCoIGP is a more complex and time-consuming index, further including data of zooplankton communites, it is worthy due to its sensitiveness in cases such as the eutrophic Lake Kastoria under restoration. This indicates the potential use of PhyCoIGP not only for monitoring purposes but also during the implementation of restoration measures to prevent further deterioration and protect lakes. The PhyCoIGP is in agreement with the ecological foundation of WFD as a useful tool for the associated remedial measures in restoring eutrophic lakes in the River Basin Management Plans. So far, PhyCoIGP has only been tested on 13 lakes in Greece. It would be desirable to expand testing to other lakes, both in the Mediterranean climate as well as in other temperate areas. A multimetric index as the PhyCoIGP, combining data of the plankton community, can be the base for the establishment of a fully functional plankton index balancing both communities’ importance in lake ecosystems in regard to metric/sub-indices weights and scores. For such a balanced index, more lake-year data are needed; moreover, the role of distinctive zooplankton features (e.g., morphological: The role of large bodied cladocerans/crustaceans, functional: The ratio of calanoids to cyclopoids) in explaining water quality deterioration in lakes needs to be further examined.
5. Conclusions
In this study, we have shown that the grazing potential (GP) index applied to zooplankton and phytoplankton communities of lakes can identify different classes of ecological water quality based on the functional traits of both plankton communities weighting copepods as partially inefficient grazers and some phytoplankton groups of poorly edible algae. Lakes with high GP values have high zooplankton biomass dominated by large cladocerans or/and calanoids while lakes with low GP values are characterized by increased phytoplankton biomass and/or by small bodied zooplankton indicating intensive fish predation. Thus, grazing potential may prove to be a useful metric for indices developed for ecosystem monitoring combined with other zooplanktonic or/and phytoplanktonic metrics, since it can provide critical information on food web functioning (phytoplankton and zooplankton communities and fish) in an easy (low identification skills—GP relies on group level) and cost-effective way (inexpensive to sample zooplankton and phytoplankton at the same time). Based on the above, GP was included in a modified version of PhyCoI, the PhyCoIGP index. The PhyCoIGP successfully assessed the water quality of the studied lakes evaluated by PhyCoI appearing more sensitive in some cases. At this end, PhyCoIGP through the combination of different plankton metrics covering various aspects of the structure and function of the plankton community aims to capture the complexities of the lake ecosystem yet remain simple enough to be easily and routinely used. Thus, we propose PhyCoIGP to be used in ecological water quality assessment and restoration monitoring programs where it can be also combined with high frequency monitoring of water clarity.
Author Contributions
Conceptualization, E.M., G.S., M.K. and M.M.-G.; Validation, G.S. and M.K.; Formal Analysis, G.S. and M.K.; Investigation, G.S. and M.K.; Resources, E.M., G.S, M.K. and M.M.-G.; Data Curation, E.M, G.S, M.K and M.M.-G.; Writing—Original Draft Preparation, E.M., G.S, M.K. and M.M.-G.; Writing—Review and Editing, E.M., G.S, M.K. and M.M.-G.; Visualization, G.S.; Supervision, E.M and M.M.-G.; Project Administration, E.M.; Funding Acquisition, G.S.
Funding
This research is co-financed by Greece and the European Union (European Social Fund—ESF) through the Operational Programme Human Resources Development, Education and Lifelong Learning in the context of the project “Strengthening Human Resources Research Potential via Doctorate Research’’ (MIS-5000432), implemented by the State Scholarships Foundation (IKY).
Conflicts of Interest
The authors declare no conflict of interest. The funders had no role in the design of the study; in the collection, analyses, or interpretation of data; in the writing of the manuscript, or in the decision to publish the results.
Appendix A

Table A1.
Year and number of samplings for the studied 13 Greek lakes and the literature of phytoplankton and zooplankton data.
Table A1.
Year and number of samplings for the studied 13 Greek lakes and the literature of phytoplankton and zooplankton data.
| Lake | Year | Number of Samplings | Phytoplankton Data Literature | Zooplankton Data Literature |
|---|---|---|---|---|
| Amvrakia | 2016 | 3 | [11] | [11] |
| Doirani | 2004 | 3 | [69] | [11] |
| Kastoria | 2016 | 3 | [11] | [11] |
| Lysimachia | 2016 | 3 | Present study | Present study |
| Megali Prespa | 2016 | 3 | [70] | [70] |
| Mikri Prespa | 1990–1992; 2016 | 12 | [70,71] | [70,72] |
| Pamvotis | 2016 | 3 | [11] | [11] |
| Paralimni | 2016 | 3 | [11] | [11] |
| Petron | 2010 | 3 | [73] | [73] |
| Trichonis | 2016 | 3 | [11] | [11] |
| Vegoritis | 2017 | 3 | [11] | [11] |
| Volvi | 1984–1986 | 9 | [74] | [75] |
| Voulkaria | 2016 | 3 | [11] | [11] |
Table A2.
Class boundaries for total phytoplankton biovolume for studied Greek lakes.
| Type | Lake | Reference Values and Class Boundaries for Total Phytoplankton Biovolume (mm3 L−1) |
|---|---|---|
| 1 | Megali Prespa | 1. Reference: 0.6 |
| 2. Good-Moderate: 1.7 | ||
| 3. Moderate-Poor: 5.0 | ||
| 4. Poor-Bad: 12.0 | ||
| 2 | Vegoritis | 1. Reference: 0.7 |
| 2. Good-Moderate: 2.2 | ||
| 3. Moderate-Poor: 7.0 | ||
| 4. Poor-Bad: 19.0 | ||
| 3 | Trichonis, Amvrakia | 1. Reference: 0.9 |
| 2. Good-Moderate: 2.8 | ||
| 3. Moderate-Poor: 8.8 | ||
| 4. Poor-Bad: 23.0 | ||
| 4 | Volvi | 1. Reference: 1.1 |
| 2. Good-Moderate: 3.2 | ||
| 3. Moderate-Poor: 9.0 | ||
| 4. Poor-Bad: 27 | ||
| 5 | Mikri Prespa | 1. Reference: 1.1 |
| 2. Good-Moderate: 3.5 | ||
| 3. Moderate-Poor: 10.5 | ||
| 4. Poor-Bad: 28.5 | ||
| 6 | Kastoria, Pamvotis, Lysimachia | 1. Reference: 1.1 |
| 2. Good-Moderate: 4.5 | ||
| 3. Moderate-Poor: 13.5 | ||
| 4. Poor-Bad: 40.5 | ||
| 7 | Doirani, Petron, Paralimni | 1. Reference: 1.34 |
| 2. Good-Moderate: 6.0 | ||
| 3. Moderate-Poor: 18.0 | ||
| 4. Poor-Bad: 54.0 | ||
| 8 | Voulkaria | 1. Reference: 2.3 |
| 2. Good-Moderate: 12.0 | ||
| 3. Moderate-Poor: 36.0 | ||
| 4. Poor-Bad: 108.0 |
References
- Poikane, S.; Birk, S.; Böhmer, J.; Carvalho, L.; de Hoyos, C.; Gassner, H.; Hellsten, S.; Kelly, M.; Lyche Solheim, A.; Olin, M.; et al. A hitchhiker’s guide to European lake ecological assessment and intercalibration. Ecol. Indic. 2015, 52, 533–544. [Google Scholar] [CrossRef]
- European Commission. Directive 2000/60/EC of the European Parliament and of the Council of 23 October 2000 Establishing a Framework for Community Action in the Field of Water Policy. J. Eur. Communities 2000, L37, 1–72. [Google Scholar]
- Moss, B. Shallow lakes, the water framework directive and life. What should it all be about? Hydrobiologia 2007, 584, 381–394. [Google Scholar] [CrossRef]
- Caroni, R.; Irvine, K. The potential of zooplankton communities for ecological assessment of lakes: redundant concept or political oversight? Biol. Environ. Proc. R. Ir. Acad. 2010, 110B, 35–53. [Google Scholar] [CrossRef]
- Jeppesen, E.; Nõges, P.; Davidson, T.A.; Haberman, J.; Nõges, T.; Blank, K.; Lauridsen, T.L.; Søndergaard, M.; Sayer, C.; Laugaste, R.; et al. Zooplankton as indicators in lakes: a scientific-based plea for including zooplankton in the ecological quality assessment of lakes according to the European Water Framework Directive (WFD). Hydrobiologia 2011, 676, 279–297. [Google Scholar] [CrossRef]
- Carpenter, S.R.; Kitchell, J.F.; Hodgson, J.R. Cascading trophic interactions and lake productivity. BioScience 1985, 35, 634–639. [Google Scholar] [CrossRef]
- Pace, M.L.; Orcutt, J.D. The relative importance of protozoans, rotifers, and crustaceans in a freshwater zooplankton community. Limnol. Oceanogr. 1981, 26, 822–830. [Google Scholar] [CrossRef]
- Sommer, U.; Gliwicz, Z.M.; Lampert, W.; Duncan, A. The PEG-model of seasonal succession of planktonic events in fresh waters. Arch. Für Hydrobiol. 1986, 106, 433–471. [Google Scholar]
- Ejsmont-Karabin, J. The usefulness of zooplankton as lake ecosystem indicators: rotifer trophic state index. Pol. J. Ecol. 2012, 60, 339–350. [Google Scholar]
- Ejsmont-Karabin, J.; Karabin, A. The suitability of zooplankton as lake ecosystem indicators: crustacean trophic state index. Pol. J. Ecol. 2013, 61, 561–573. [Google Scholar]
- Stamou, G.; Katsiapi, M.; Moustaka-Gouni, M.; Michaloudi, E. Trophic state assessment based on zooplankton communities in Mediterranean lakes. Hydrobiologia 2019. [Google Scholar] [CrossRef]
- Sarma, S.S.S.; Nandini, S. Review of Recent Ecotoxicological Studies on Cladocerans. J. Environ. Sci. Health Part B 2006, 41, 1417–1430. [Google Scholar] [CrossRef] [PubMed]
- Snell, T.W.; Joaquim-Justo, C. Workshop on rotifers in ecotoxicology. Hydrobiologia 2007, 593, 227–232. [Google Scholar] [CrossRef]
- Kulkarni, D.; Gergs, A.; Hommen, U.; Ratte, H.T.; Preuss, T.G. A plea for the use of copepods in freshwater ecotoxicology. Environ. Sci. Pollut. Res. 2013, 20, 75–85. [Google Scholar] [CrossRef] [PubMed]
- Haberman, J.; Haldna, M. Indices of zooplankton community as valuable tools in assessing the trophic state and water quality of eutrophic lakes: long term study of Lake Võrtsjärv. J. Limnol. 2014, 73. [Google Scholar] [CrossRef]
- García-Chicote, J.; Armengol, X.; Rojo, C. Zooplankton species as indicators of trophic state in reservoirs from Mediterranean river basins. Inland Waters 2019, 9, 1–11. [Google Scholar] [CrossRef]
- Stamou, G.; Polyzou, C.; Karagianni, A.; Michaloudi, E. Taxonomic distinctness indices for discriminating patterns in freshwater rotifer assemblages. Hydrobiologia 2017, 796, 319–331. [Google Scholar] [CrossRef]
- Moss, B.; Stephen, D.; Alvarez, C.; Becares, E.; Bund, W.V.D.; Collings, S.E.; Donk, E.V.; Eyto, E.D.; Feldmann, T.; Fernández-Aláez, C.; et al. The determination of ecological status in shallow lakes - a tested system (ECOFRAME) for implementation of the European Water Framework Directive: the determination of ecological status in shallow lakes. Aquat. Conserv. Mar. Freshw. Ecosyst. 2003, 13, 507–549. [Google Scholar] [CrossRef]
- Directorate-General for the Environment (European Commission). Guidance Document on Eutrophication Assessment in the Context of European Water Policies No 23; Office for Official Publications of the European Communities (OPOCE): Luxembourg, Luxembourg, 2009; ISBN 978-92-79-12987-2. [Google Scholar]
- Directorate-General for the Environment (European Commission). Monitoring under the Water Framework Directive No 7; Office for Official Publications of the European Communities (OPOCE): Luxembourg, Luxembourg, 2003; ISBN 978-92-894-5127-7. [Google Scholar]
- Moustaka-Gouni, M.; Michaloudi, E.; Sommer, U. Modifying the PEG model for Mediterranean lakes - no biological winter and strong fish predation. Freshw. Biol. 2014, 59, 1136–1144. [Google Scholar] [CrossRef] [Green Version]
- McCauley, E.; Kalff, J. Empirical relationships between phytoplankton and zooplankton biomass in lakes. Can. J. Fish. Aquat. Sci. 1981, 38, 458–463. [Google Scholar] [CrossRef]
- Xu, F.-L.; Zhao, Z.-Y.; Zhan, W.; Zhao, S.-S.; Dawson, R.W.; Tao, S. An ecosystem health index methodology (EHIM) for lake ecosystem health assessment. Ecol. Model. 2005, 188, 327–339. [Google Scholar] [CrossRef]
- Kane, D.D.; Gordon, S.I.; Munawar, M.; Charlton, M.N.; Culver, D.A. The Planktonic Index of Biotic Integrity (P-IBI): An approach for assessing lake ecosystem health. Ecol. Indic. 2009, 9, 1234–1247. [Google Scholar] [CrossRef]
- Jeppesen, E.; Peder Jensen, J.; Søndergaard, M.; Lauridsen, T.; Junge Pedersen, L.; Jensen, L. Top-down control in freshwater lakes: the role of nutrient state, submerged macrophytes and water depth. Hydrobiologia 1997, 342, 151–164. [Google Scholar] [CrossRef]
- Weithoff, G. The concepts of “plant functional types” and “functional diversity” in lake phytoplankton - a new understanding of phytoplankton ecology? Freshw. Biol. 2003, 48, 1669–1675. [Google Scholar] [CrossRef]
- Barnett, A.J.; Finlay, K.; Beisner, B.E. Functional diversity of crustacean zooplankton communities: towards a trait-based classification. Freshw. Biol. 2007, 52, 796–813. [Google Scholar] [CrossRef]
- Fryer, G. The feeding mechanism of some freshwater cyclopoid copepods. Proc. Zool. Soc. Lond. 2009, 129, 1–25. [Google Scholar] [CrossRef]
- Brandl, Z. Feeding strategies of planktonic cyclopoids in lacustrine ecosystems. J. Mar. Syst. 1998, 15, 87–95. [Google Scholar] [CrossRef]
- Arp, W.; Deneke, R. Untersuchungen des Phyto- und Zooplanktons schleswig-holsteinischer Seen 2006; State Office for Agriculture, Environment and Rural Areas of Schleswig-Holstein: Berlin, Germany, 2007; p. 22.
- Arp, W.; Kasten, J.; Maier, G. Untersuchungen des Phyto- und Zooplanktons schleswig-holsteinischer Seen 2009; Landesamt für Natur und Umwelt: Berlin, Germany, 2010; p. 248.
- De Senerpont Domis, L.N.; Elser, J.J.; Gsell, A.S.; Huszar, V.L.M.; Ibelings, B.W.; Jeppesen, E.; Kosten, S.; Mooij, W.M.; Roland, F.; Sommer, U.; et al. Plankton dynamics under different climatic conditions in space and time: Plankton dynamics under different climatic conditions. Freshw. Biol. 2013, 58, 463–482. [Google Scholar] [CrossRef]
- Alvarez Cobelas, M.; Rojo, C.; Angeler, D.G. Mediterranean limnology: current status, gaps and the future. J. Limnol. 2005, 64, 13. [Google Scholar] [CrossRef]
- Ntislidou, C.; Lazaridou, M.; Tsiaoussi, V.; Bobori, D.C. A new multimetric macroinvertebrate index for the ecological assessment of Mediterranean lakes. Ecol. Indic. 2018, 93, 1020–1033. [Google Scholar] [CrossRef]
- Quintana, X.D.; Cañedo-Argüelles, M.; Nebra, A.; Gascón, S.; Rieradevall, M.; Caiola, N.; Sala, J.; Ibàñez, C.; Sánchez-Millaruelo, N.; Boix, D. New tools to analyse the ecological status of Mediterranean wetlands and shallow lakes. In Experiences from Surface Water Quality Monitoring: The EU Water Framework Directive Implementation in the Catalan River Basin District (Part I); Munné, A., Ginebreda, A., Prat, N., Eds.; The Handbook of Environmental Chemistry; Springer International Publishing: Cham, Switzerland, 2016; pp. 171–199. ISBN 978-3-319-23895-1. [Google Scholar]
- Petriki, O.; Lazaridou, M.; Bobori, D.C. A fish-based index for the assessment of the ecological quality of temperate lakes. Ecol. Indic. 2017, 78, 556–565. [Google Scholar] [CrossRef]
- Katsiapi, M.; Moustaka-Gouni, M.; Sommer, U. Assessing ecological water quality of freshwaters: PhyCoI—a new phytoplankton community Index. Ecol. Inform. 2016, 31, 22–29. [Google Scholar] [CrossRef]
- Carlson, R.E. A trophic state index for lakes1: Trophic state index. Limnol. Oceanogr. 1977, 22, 361–369. [Google Scholar] [CrossRef]
- Pahissa, J.; Catalan, J.; Morabito, G.; Dörflinger, G.; Ferreira, J.; Laplace-Treyture, C.; Gîrbea, R.; Marchetto, A.; Polykarpou, P.; de Hoyos, C. Benefits and limitations of an intercalibration of phytoplankton assessment methods based on the Mediterranean GIG reservoir experience. Sci. Total Environ. 2015, 538, 169–179. [Google Scholar] [CrossRef] [PubMed]
- Mazaris, A.D.; Moustaka-Gouni, M.; Michaloudi, E.; Bobori, D.C. Biogeographical patterns of freshwater micro- and macroorganisms: a comparison between phytoplankton, zooplankton and fish in the eastern Mediterranean: Biogeography of freshwater micro- and macroorganisms. J. Biogeogr. 2010, 37, 1341–1351. [Google Scholar] [CrossRef]
- Reynolds, C.S. The Ecology of Phytoplankton; Cambridge University Press: Cambridge, UK, 2006; ISBN 978-1-139-45489-6. [Google Scholar]
- Smith, V.H. Eutrophication of freshwater and coastal marine ecosystems a global problem. Environ. Sci. Pollut. Res. 2003, 10, 126–139. [Google Scholar] [CrossRef]
- Katsiapi, M.; Moustaka-Gouni, M.; Vardaka, E.; Kormas, K.A.R. Different phytoplankton descriptors show asynchronous changes in a shallow urban lake (L. Kastoria, Greece) after sewage diversion. Fundam. Appl. Limnol. Arch. Für Hydrobiol. 2013, 182, 219–230. [Google Scholar] [CrossRef]
- Lathrop, R.C.; Carpenter, S.R.; Robertson, D.M. Summer water clarity responses to phosphorus, Daphnia grazing, and internal mixing in Lake Mendota. Limnol. Oceanogr. 1999, 44, 137–146. [Google Scholar] [CrossRef]
- Lampert, W.; Fleckner, W.; Rai, H.; Taylor, B.E. Phytoplankton control by grazing zooplankton: A study on the spring clear-water phase. Limnol. Oceanogr. 1986, 31, 478–490. [Google Scholar] [CrossRef]
- Sommer, U.; Sommer, F. Cladocerans versus copepods: the cause of contrasting top–down controls on freshwater and marine phytoplankton. Oecologia 2006, 147, 183–194. [Google Scholar] [CrossRef] [PubMed]
- Vardaka, E.; Moustaka-Gouni, M.; Cook, C.M.; Lanaras, T. Cyanobacterial blooms and water quality in Greek waterbodies. J. Appl. Phycol. 2005, 17, 391–401. [Google Scholar] [CrossRef]
- Hansson, L.-A.; Gustafsson, S.; Rengefors, K.; Bomark, L. Cyanobacterial chemical warfare affects zooplankton community composition. Freshw. Biol. 2007, 52, 1290–1301. [Google Scholar] [CrossRef]
- Vijverberg, J.; Boersma, M. Long-term dynamics of small-bodied and large-bodied cladocerans during the eutrophication of a shallow reservoir, with special attention for Chydorus sphaericus. Hydrobiologia 1997, 360, 233–242. [Google Scholar] [CrossRef]
- Jeppesen, E.; Peder Jensen, J.; SØndergaard, M.; Lauridsen, T.; Landkildehus, F. Trophic structure, species richness and biodiversity in Danish lakes: changes along a phosphorus gradient: A detailed study of Danish lakes along a phosphorus gradient. Freshw. Biol. 2000, 45, 201–218. [Google Scholar] [CrossRef]
- Brooks, J.L.; Dodson, S.I. Predation, body size, and composition of plankton. Science 1965, 150, 28–35. [Google Scholar] [CrossRef]
- Kleanthidis, P.K.; Sinis, A.I. Feeding habits of the macedonian shad, Alosa macedonica (Vinciguerra, 1921) in Lake Volvi (Greece): seasonal and ontogenetic changes. Isr. J. Zool. 2001, 47, 213–232. [Google Scholar] [CrossRef]
- Chrisafi, E.; Kaspiris, P.; Katselis, G. Feeding habits of sand smelt (Atherina boyeri, Risso 1810) in Trichonis Lake (Western Greece). J. Appl. Ichthyol. 2007, 23, 209–214. [Google Scholar] [CrossRef]
- Meerhoff, M.; Iglesias, C.; De Mello, F.T.; Clemente, J.M.; Jensen, E.; Lauridsen, T.L.; Jeppesen, E. Effects of habitat complexity on community structure and predator avoidance behaviour of littoral zooplankton in temperate versus subtropical shallow lakes. Freshw. Biol. 2007, 52, 1009–1021. [Google Scholar] [CrossRef]
- Mehner, T.; Thiel, R. A review of predation impact by 0+ fish on zooplankton in fresh and brackish waters of the temperate northern hemisphere. Environ. Biol. Fishes 1999, 56, 169–181. [Google Scholar] [CrossRef]
- Drenner, R.W.; Smith, J.D.; Threlkeld, S.T. Lake trophic state and the limnological effects of omnivorous fish. Hydrobiologia 1996, 319, 213–223. [Google Scholar] [CrossRef]
- Jeppesen, E.; Meerhoff, M.; Holmgren, K.; González-Bergonzoni, I.; Teixeira-de Mello, F.; Declerck, S.A.J.; De Meester, L.; Søndergaard, M.; Lauridsen, T.L.; Bjerring, R.; et al. Impacts of climate warming on lake fish community structure and potential effects on ecosystem function. Hydrobiologia 2010, 646, 73–90. [Google Scholar] [CrossRef]
- Bobori, D.C.; Salvarina, I.; Michaloudi, E. Fish dietary patterns in the eutrophic Lake Volvi (East Mediterranean). J. Biol. Res. Thessalon. 2013, 19, 139–149. [Google Scholar]
- Varveris, T. Monitoring Results of Biotic Parameters of Fish at Prespa Lakes. Del. 4.4.1 IPA Project “ProLife—The Quality of Life Prerequisite for Progress and Sustainable Development in the Cross Border Area”; Region of Western Macedonia: Kozani, Greece, 2016; p. 34. [Google Scholar]
- Rosecchi, E.; Crivelli, A.J.; Catsadorakis, G. The establishment and impact of Pseudorasbora parva, an exotic fish species introduced into Lake Mikri Prespa (north-western Greece). Aquat. Conserv. Mar. Freshw. Ecosyst. 1993, 3, 223–231. [Google Scholar] [CrossRef]
- Almeida, D.; Almodóvar, A.; Nicola, G.G.; Elvira, B. Feeding tactics and body condition of two introduced populations of pumpkinseed Lepomis gibbosus: taking advantages of human disturbances? Ecol. Freshw. Fish 2009, 18, 15–23. [Google Scholar] [CrossRef]
- Rezsu, E.; Specziár, A. Ontogenetic diet profiles and size-dependent diet partitioning of ruffe Gymnocephalus cernuus, perch Perca fluviatilis and pumpkinseed Lepomis gibbosus in Lake Balaton. Ecol. Freshw. Fish 2006, 15, 339–349. [Google Scholar] [CrossRef]
- Hébert, M.-P.; Beisner, B.E.; Maranger, R. Linking zooplankton communities to ecosystem functioning: toward an effect-trait framework. J. Plankton Res. 2017, 39, 3–12. [Google Scholar] [CrossRef]
- Baird, D.J.; Rubach, M.N.; den Brinkt, P.J.V. Trait-based ecological risk assessment (TERA): The new frontier? Integr. Environ. Assess. Manag. 2008, 4, 2–3. [Google Scholar] [CrossRef]
- Moustaka-Gouni, M.; Katsiapi, M.; Stefanidou, N.; Vardaka, E.; Genitsaris, S.; Kormas, K.A.; Georgoulis, F. Restoration of two Greek lakes (Kastoria and Koronia): Success stories? In Proceedings of the Book of abstracts International Conference Protection and Restoration of the Environment XIV, Thessaloniki, Greece, 3–6 July 2018; p. 102. [Google Scholar]
- Moustaka-Gouni, M.; Sommer, U.; Economou-Amilli, A.; Arhonditsis, G.B.; Katsiapi, M.; Papastergiadou, E.; Kormas, K.A.; Vardaka, E.; Karayanni, H.; Papadimitriou, T. Implementation of the Water Framework Directive: Lessons learned and future perspectives for an ecologically meaningful classification of the status of Greek lakes, Mediterranean region. BioRxiv 2018, 371799. [Google Scholar] [CrossRef]
- Katsiapi, M.; Michaloudi, E.; Moustaka-Gouni, M.; Pahissa Lopez, J. First ecological evaluation of the ancient Balkan Lake Megali Prespa based on plankton. J. Biol. Res.-Thessalon. 2012, 17, 51–56. [Google Scholar]
- Lyche-Solheim, A.; Feld, C.K.; Birk, S.; Phillips, G.; Carvalho, L.; Morabito, G.; Mischke, U.; Willby, N.; Søndergaard, M.; Hellsten, S.; et al. Ecological status assessment of European lakes: a comparison of metrics for phytoplankton, macrophytes, benthic invertebrates and fish. Hydrobiologia 2013, 704, 57–74. [Google Scholar] [CrossRef] [Green Version]
- Polykarpou, P. Phytoplankton and microbial food web in Lake Doirani: assessment of ecological status. Master’s Thesis, Aristotle University of Thessaloniki, Thessaloniki, Greece, 2006. [Google Scholar]
- Katsiapi, S.; Michaloudi, E.; Moustaka-Gouni, M. Phytoplankton, Zooplankton and Ecological Water Quality. Del. 4.3.1. IPA Project “ProLife—The Quality of Life Prerequisite for Progress and Sustainable Development in the Cross Border Area”; Region of Western Macedonia: Kozani, Greece, 2016; p. 62. [Google Scholar]
- Tryfon, E.; Moustaka-Gouni, M. Species composition and seasonal cycles of phytoplankton with special reference to the nanoplankton of Lake Mikri Prespa. Hydrobiologia 1997, 351, 61–75. [Google Scholar] [CrossRef]
- Michaloudi, E.; Zarfdjian, M.; Economidis, P.S. The zooplankton of Lake Mikri Prespa. Hydrobiologia 1997, 361, 77–94. [Google Scholar] [CrossRef]
- Vourka, A. Assessment of the ecological quality of Lake Petron based on phytoplankton and zooplankton. Master’s Thesis, Aristotle University of Thessaloniki, Thessaloniki, Greece, 2011. [Google Scholar]
- Moustaka-Gouni, M. Phytoplankton succession and diversity in a warm monomictic, relatively shallow lake: Lake Volvi, Macedonia, Greece. Hydrobiologia 1993, 249, 33–42. [Google Scholar] [CrossRef]
- Zarfdjian, M.H.; Vranovský, M.; Economidis, P.S. Les invertébrés planctoniques du Lac Volvi (Macédoine, Grèce). Int. Rev. Gesamten Hydrobiol. Hydrogr. 1990, 75, 403–412. [Google Scholar] [CrossRef]
Figure 1.
Map of Greece showing the location of the 13 studied lakes. Abbreviations are according to Table 1.
Figure 1.
Map of Greece showing the location of the 13 studied lakes. Abbreviations are according to Table 1.

Figure 2.
Grazing potential values of the studied lakes in the various dates (lake abbreviations according to Table 1 followed by month and year of sampling) across the trophic spectrum (Oligo: Oligotrophic, Meso: Mesotrophic, Meso-Eu: Meso-eutrophic, Eu: Eutrophic and Hyper: Hypertrophic).
Figure 2.
Grazing potential values of the studied lakes in the various dates (lake abbreviations according to Table 1 followed by month and year of sampling) across the trophic spectrum (Oligo: Oligotrophic, Meso: Mesotrophic, Meso-Eu: Meso-eutrophic, Eu: Eutrophic and Hyper: Hypertrophic).

Figure 3.
(a) Scatter plot of grazing potential (GP) against PhyCoI, solid line indicates the linear regression line and dashed lines indicate 95% prediction limits of the model; (b) box plot of grazing potential based on data of plankton communities from the 13 Greek lakes grouped into ecological water quality classes according to PhyCoI. i, ii, iii indicate significant differences (Post-hoc Bonferroni correction).

Figure 4.
PhyCoI (black) and PhyCoIGP (grey) values for the studied lakes in the various sampling dates (lake abbreviations according to Table 1 followed by month and year of sampling).
Figure 4.
PhyCoI (black) and PhyCoIGP (grey) values for the studied lakes in the various sampling dates (lake abbreviations according to Table 1 followed by month and year of sampling).

Figure 5.
Scatter diagram of the (a) GP, (b) PhyCoIGP and (c) PhyCoI index compared to trophic state index (TSISD) for the studied lakes (n = 54). The solid line indicates the linear regression line. The dashed lines indicate the (95%) prediction limits of the model.
Figure 5.
Scatter diagram of the (a) GP, (b) PhyCoIGP and (c) PhyCoI index compared to trophic state index (TSISD) for the studied lakes (n = 54). The solid line indicates the linear regression line. The dashed lines indicate the (95%) prediction limits of the model.

Table 1.
Topographic, morphological data and the trophic state for the 13 studied Greek lakes.
| Lake | Abbreviations | Latitude | Longtitude | Surface Area (Km2) | Altitude (m a.s.l.) | Mean Depth (m) | Max Depth (m) | Trophic State 1 |
|---|---|---|---|---|---|---|---|---|
| Amvrakia | Amv | 38°45′15.60″ | 21°10′55.09″ | 14.5 | 25 | 22 | 53 | Oligo |
| Doirani | Doi | 41°12′55.52″ | 22°44′48.34″ | 34.8 | 142 | 3 | 8 | Hyper |
| Kastoria | Kas | 40°31′09.59″ | 21°17′36.13″ | 30 | 629 | 4 | 9 | Eu |
| Lysimachia | Lys | 38°33′38.09″ | 21°22′22.59″ | 13 | 14.5 | 3.9 | 9 | Meso |
| Megali Prespa | MgP | 40°52′03.87″ | 21°01′29.31″ | 256.8 | 844 | 18 | 55 | Meso-Eu |
| Mikri Prespa | MkP | 40°46′22.80″ | 21°05′05.96″ | 39.2 | 850 | 4 | 9 | Eu |
| Pamvotis | Pam | 39°39′45.57″ | 20°53′27.68″ | 22 | 470 | 4.3 | 9.2 | Hyper |
| Paralimni | Par | 38°27′53.70″ | 23°20′55.50″ | 10 | 51 | 4 | 8 | Meso |
| Petron | Pet | 40°43′38.79″ | 21°41′49.60″ | 11 | 572 | 3 | 6 | Eu |
| Trichonis | Tri | 38°32′47.10″ | 21°35′12.70″ | 97.2 | 16 | 30 | 59 | Eu |
| Vegoritis | Veg | 40°45′11.06″ | 21°47′13.76″ | 46 | 524 | 25 | 52 | Eu |
| Volvi | Vol | 40°40′37.57″ | 23°28′50.61″ | 68.6 | 37 | 13 | 28 | Eu |
| Voulkaria | Vou | 38°52′12.80″ | 20°50′24.20″ | 9.4 | 5 | 1.6 | 2.5 | Hyper |
Note: 1 Lakes’ trophic state (oligo: Oligotrophic, meso: Mesotrophic, eu: Eutrophic and hyper: Hypertrophic) according to mean summer phytoplankton biovolume according to Stamou et al. [11] except for Lake Lysimachia; Lake Mikri Prespa was determined as hypertrophic in 1990, eutrophic in 1991 and 1992 and mesotrophic in 2016.
Table 2.
Included in the phytoplankton community (PhyCoIGP), their classification scheme and respective scores for its calculation (ExJu = Expert Judgment Boundaries, NaBo = National Boundaries); Boundaries for trophic state of Greek lakes according to Katsiapi et al. [37] and trophic state classification as suggested by Smith [42].
| Metrics/Sub-Indices | Scores | |||||
|---|---|---|---|---|---|---|
| Total Phytoplankton Biovolume (TB) | Classification scheme | Reference (ΕxJu/NaBo) or Ultra-oligo/Oligotrophic | Good (ΕxJu/NaBo) or Mesotrophic | Moderate (ΕxJu/NaBo) or Eutrophic I | Poor (ΕxJu/NaBo) or Eutrophic II | Bad (ΕxJu/NaBo) or Hypertrophic |
| PhyCoIGP Score | 1.8 | 1.4 | 0.8 | 0.4 | 0.2 | |
| WHO Guidelines (WG) | Classification scheme | <Level 1 | Level 1: 0.2–1 mm3 L−1 | Level 1: >1 mm3 L−1 | Level 2: >10 mm3 L−1 | Scum formation |
| PhyCoIGP Score | 0.8 | 0.7 | 0.4 | 0.3 | 0.1 | |
| Nygaard Biomass (NB) | Classification scheme | 0–1 | 1–10 | 10–100 | 100–1000 | >1000 |
| PhyCoIGP Score | 0.5 | 0.4 | 0.3 | 0.2 | 0.1 | |
| Nygaard Species (NS) | Classification scheme | <2 | 2–4 | >4–6 | >6–8 | >8 |
| PhyCoIGP Score | 0.6 | 0.5 | 0.3 | 0.2 | 0.1 | |
| Quality Group species sub-Index (QG) | Classification scheme | >60 | 46–60 | 31–45 | 16-30 | <16 |
| PhyCoIGP Score | 0.5 | 0.4 | 0.3 | 0.2 | 0.1 | |
| Grazing Potential (GP) | Classification scheme | >120 | 55–120 | 15–55 | 5–15 | <5 |
| PhyCoIGP Score | 0.8 | 0.7 | 0.4 | 0.3 | 0.1 | |
Table 3.
Linear Regression and ANOVA results of correlations with eutrophication (TSISD).
| Index | Equation | R2 | p |
|---|---|---|---|
| GP | y = 81.45 − 0.94 x | 0.13 | 0.008 |
| PhyCoIGP | y = 5 − 0.04 x | 0.46 | <0.0001 |
| PhyCoI | y = 5.19 − 0.04 x | 0.50 | <0.0001 |
© 2019 by the authors. Licensee MDPI, Basel, Switzerland. This article is an open access article distributed under the terms and conditions of the Creative Commons Attribution (CC BY) license (http://creativecommons.org/licenses/by/4.0/).
Share and Cite
MDPI and ACS Style
Stamou, G.; Katsiapi, M.; Moustaka-Gouni, M.; Michaloudi, E. Grazing Potential—A Functional Plankton Food Web Metric for Ecological Water Quality Assessment in Mediterranean Lakes. Water 2019, 11, 1274. https://doi.org/10.3390/w11061274
AMA Style
Stamou G, Katsiapi M, Moustaka-Gouni M, Michaloudi E. Grazing Potential—A Functional Plankton Food Web Metric for Ecological Water Quality Assessment in Mediterranean Lakes. Water. 2019; 11(6):1274. https://doi.org/10.3390/w11061274
Chicago/Turabian StyleStamou, Georgia, Matina Katsiapi, Maria Moustaka-Gouni, and Evangelia Michaloudi. 2019. "Grazing Potential—A Functional Plankton Food Web Metric for Ecological Water Quality Assessment in Mediterranean Lakes" Water 11, no. 6: 1274. https://doi.org/10.3390/w11061274
Note that from the first issue of 2016, this journal uses article numbers instead of page numbers. See further details here.