Priority Pollutants in Water and Sediments of a River for Control Basing on Benthic Macroinvertebrate Community Structure


1
State Key Laboratory of Hydrology-Water Resources and Hydraulic Engineering, Nanjing 210029, China
2
Center for Eco-Environmental Research, Nanjing Hydraulic Research Institute, Nanjing 210029, China
3
State Key Joint Laboratory of Environment Simulation and Pollution Control, School of Environment, Tsinghua University, Beijing 100084, China
4
School of Civil Engineering, Yantai University, Yantai 264005, China
*
Author to whom correspondence should be addressed.
Water 2019, 11(6), 1267; https://doi.org/10.3390/w11061267
Submission received: 22 May 2019
/
Revised: 13 June 2019
/
Accepted: 14 June 2019
/
Published: 17 June 2019
(This article belongs to the Special Issue Lake and River Restoration: Method, Evaluation and Management)
Abstract
:Understanding the drivers of macroinvertebrate community structure is fundamental for adequately controlling pollutants and managing ecosystems under global change. In this study, the abundance and diversity of benthic macroinvertebrates, as well as their chemical parameters, were investigated quarterly from August 2014 to April 2015 in four reaches of the Huai River basin (HRB). The self-organizing map (SOM) algorithm and canonical correspondence analysis (CCA) were simultaneously applied to identify the main factors structuring the benthic community. The results showed that the benthic community structure was always dominated by gastropoda and insecta over seasons and presented obvious spatial and temporal heterogeneity along different pollution levels. The insects were always the top contributors to number density of the benthic community, except for the summer, and the biomass was mainly characterized by mollusca in all seasons. Statistical analysis indicated that TN and NH3-N in water, as well as Hg, As, Cd, and Zn in sediments, were the dominant factors structuring the community, which determined the importance of sediment heavy metal concentrations in explaining the benthic community composition in comparison with other factors. These major factors should be given priority in the process of river pollutant control, which might be rated as a promising way to scientifically improve river health management and ecological restoration.
1. Introduction
Rivers are the most essential component of natural ecosystems, which are often seen as the ecological channel of material circulation and energy flow between terrestrial ecosystems and aquatic ecosystems [1,2]. They provide some irreplaceable functions in sustaining human beings, such as water supply, irrigation, food production, and transportation [3,4]. However, in recent decades, most rivers have been gradually affected by different anthropogenic disturbances, such as pollution, habitat deterioration, channelization, and spatial isolation [5,6]. All these pressures have imposed severe threats to human water security and biodiversity loss [7]. Since well-balanced and adaptive communities can only be maintained by a healthy aquatic ecosystem, the biological community structure is the best indicator of the health of aquatic ecosystems. Therefore, an in-depth understanding of community–environment relationships is of great concern for the ecological management of rivers, especially for chemical pollutants in water and sediments.
Up to now, rapid industrialization and urbanization have caused increasing pollution in rivers, through the discharge of runoff, urban sewage, and industrial wastewater [8,9]. A large number of sluices and dams have been built across rivers for flood management and water resource utilization, which have adversely altered the hydrological regimes and indirectly interfere with both the migration and transformation of pollutants [10,11]. The nutrients (N, P) and organic matter in water directly lead to the environmental problems of eutrophication and make water black and smelly. Consequently, rivers are undergoing a perennial challenge linking the aquatic organisms to water environment degradation, due to a high level of pollutant accumulation.
It is well known that sediments act as sinks, and may in turn act as sources of pollution [12]. A large quantity of hazardous chemicals (e.g., heavy metals and persistent organic pollutants) can be absorbed by suspended solids and then accumulate in sediments. In particular, heavy metals may be transformed into persistent metallic compounds with high toxicity, that first bioaccumulate in organisms, subsequently magnify in the food chain, and ultimately threaten human health [13,14]. However, they are easily released into water columns worldwide under altered pH and redox potential, hydrodynamic disturbances, and movement of benthic biota [11,15], which have posed severe threats to the aquatic flora and fauna due to their toxicity, ubiquity, and persistence.
In 2000, the European Union passed the Water Framework Directive (WFD, European Parliament Council, 2000), mandating the use of different organismal groups to monitor the ecological status of surface waters [16]. Therefore, comprehensive evaluations, including the aquatic community structure and the chemicals in water or sediments, have been widely conducted [9,17]. In the aquatic food webs, benthic macroinvertebrates—sediment-dwelling organisms—are ubiquitous in freshwater ecosystems, which are regarded as the primary material exchangers across the sediment–water interface [18,19]. In addition, they also play important roles in trophic dynamics by cycling nutrients and providing food for higher trophic levels [20]. They are among the most diverse and abundant organisms in freshwater ecosystems that are vital for ecological functions. At present, the integrity of their community structure is successfully used to detect the evolution of water ecology on the temporal and spatial scale [7,21,22]. Thus, there is an increasing trend to use benthic macroinvertebrate communities in rivers as indicators for the environmental quality or diagnosing which pollutants should be controlled preferentially, according to the response of organisms.
Here, the objectives of this study were to: (1) analyze the characteristics of the environment and macroinvertebrate community from the time scale in a river basin; (2) establish an approach to reveal community–environment relationships and identify priority pollutants for control from the perspective of water ecological health protection. The study was also expected to provide new knowledge on biomonitoring and river basin management.
2. Material and Methods
2.1. Study Area
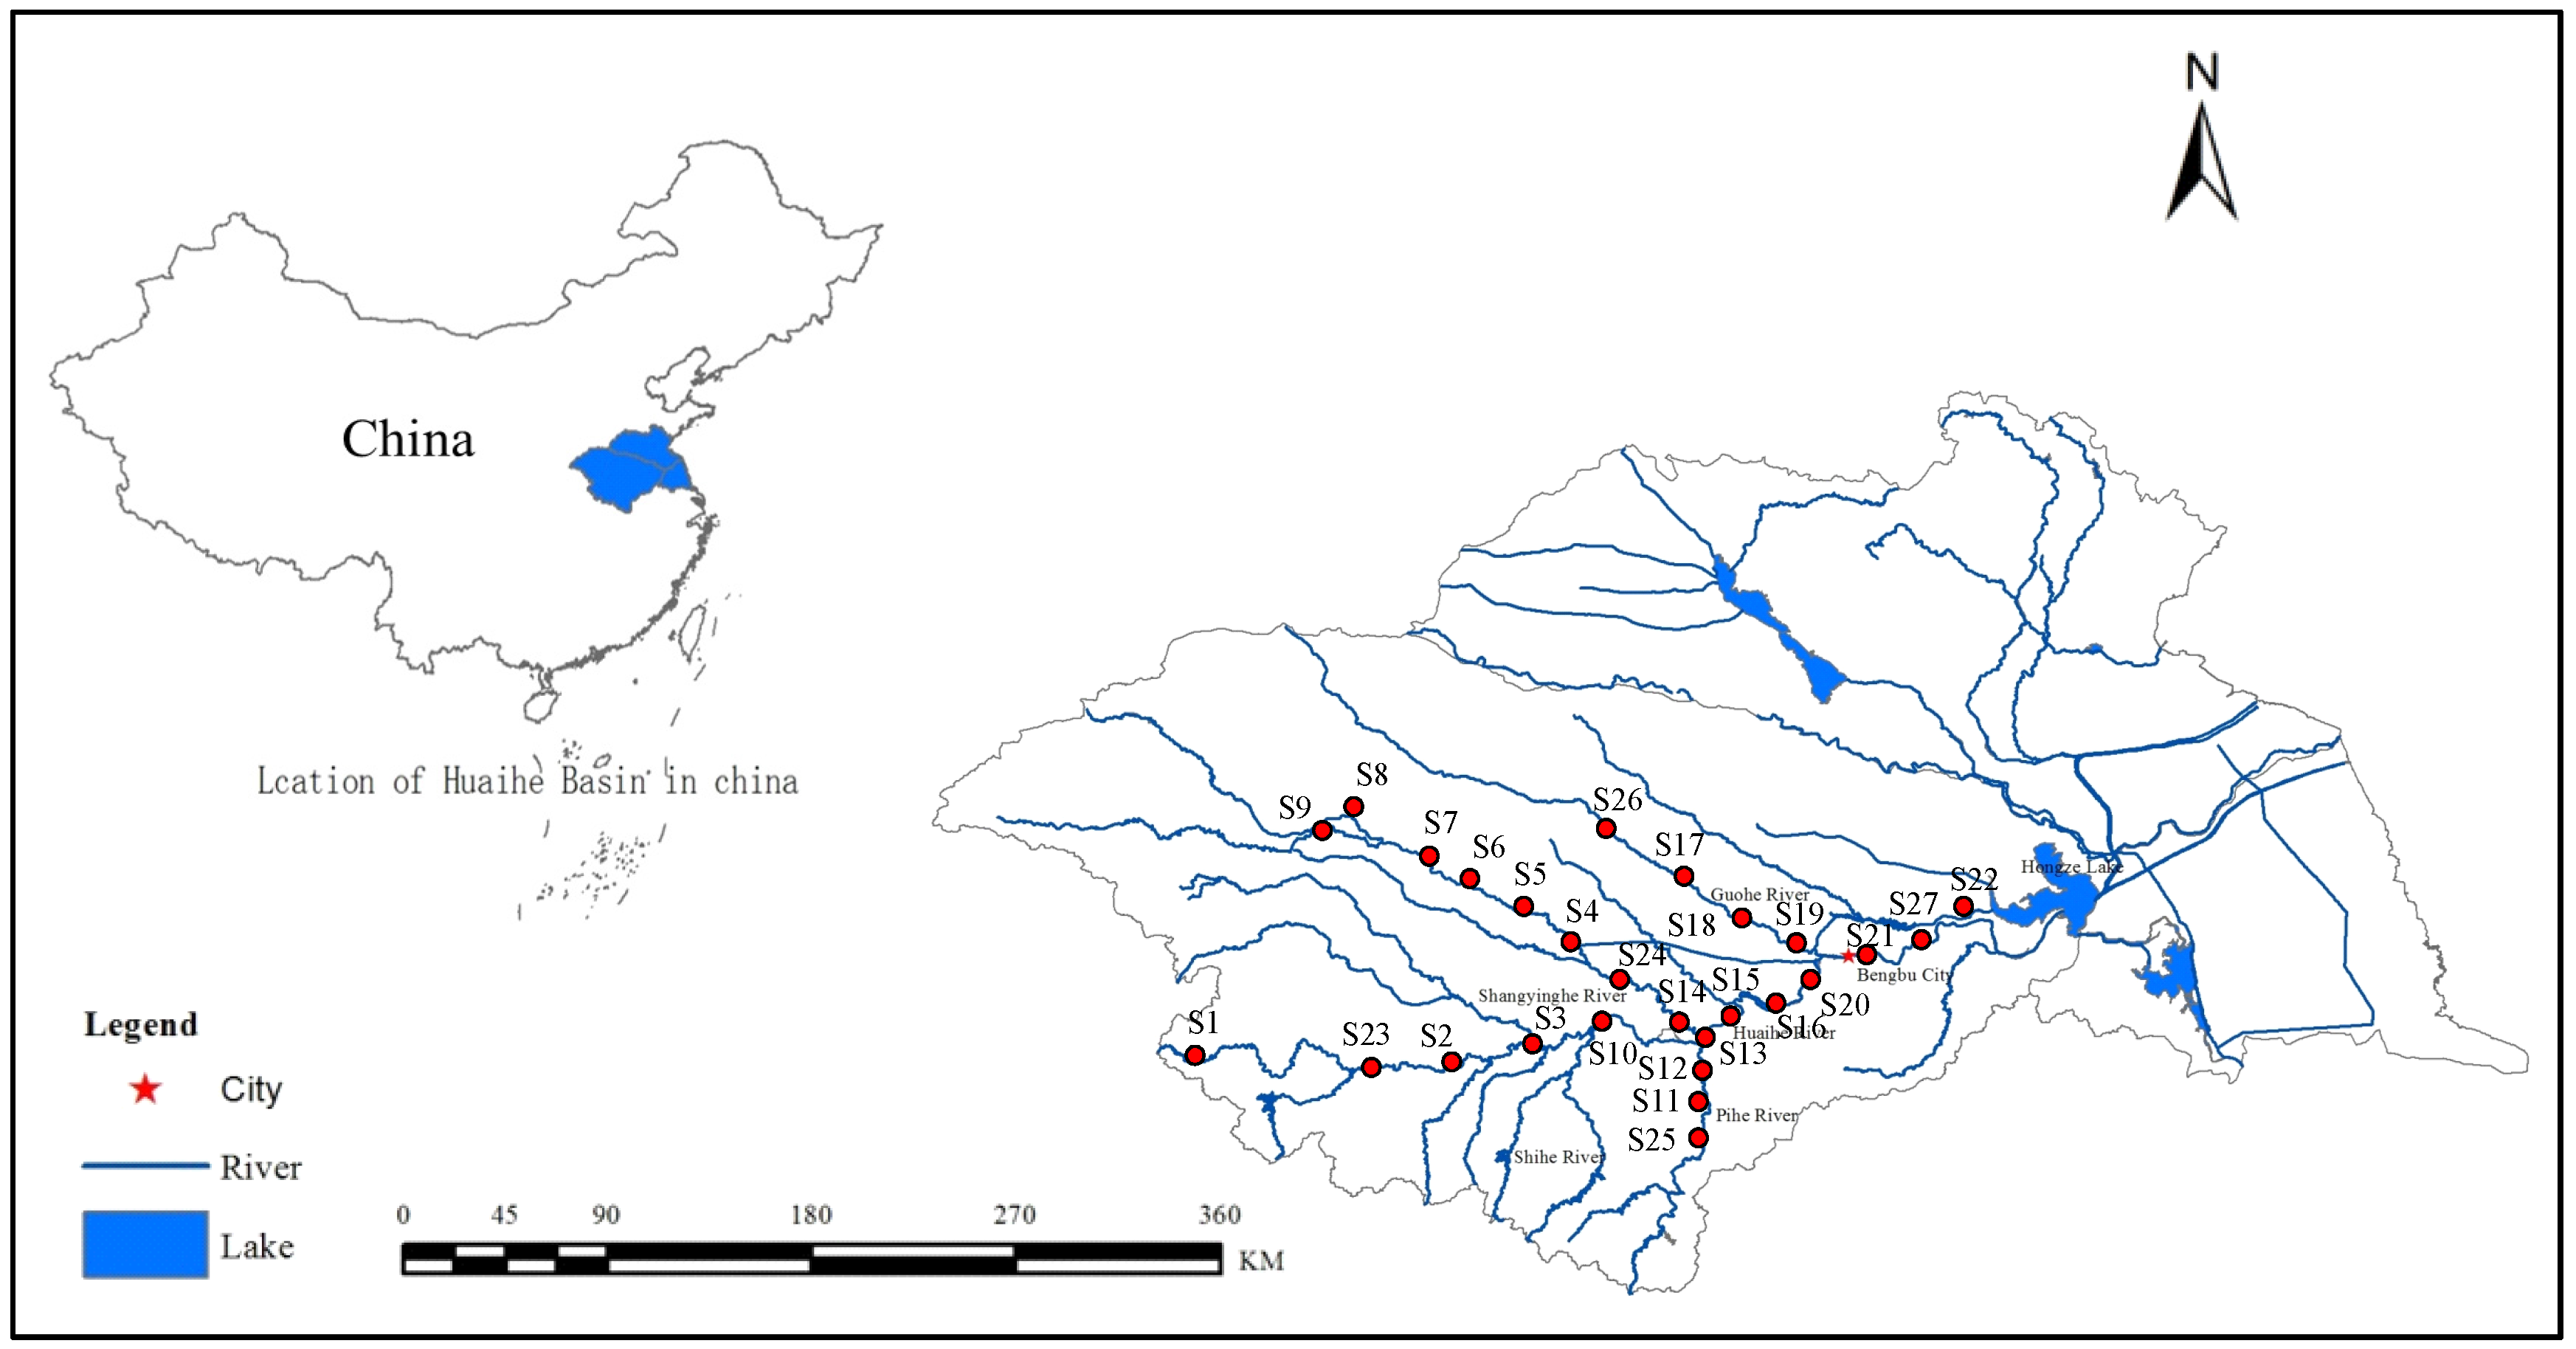
The study was conducted in the Huai River basin (HRB, 30°55′–36°36′ N, 111°55′–121°25′ E), China (Figure 1), which is located between the Yangtze River and the Yellow River, with a drainage area of 270,000 km2, and provides some services, including water supply, agricultural irrigation, flood control, shipping, and aquaculture. The mainstream originates from Tongbai Mountain in Henan Province and flows eastward for approximately 1000 km through four provinces (Henan, Hubei, Anhui, and Jiangsu), before joining the Yangtze River in Sanjiangying in Jiangsu Province. The Shaying River is the largest tributary, which is 557 km long, and Hongze Lake is the largest lake of the HRB.
The HRB is an important agriculture production area and the most crowded region in terms of population and water projects. By 2005, the population had accounted for 13.1% of the national total [23]. There were about 11,000 dams and sluices built by the end of 2010, accounting for approximately half of those in China [24]. Furthermore, severe channelization, sand mining, and excessive pollutant discharge have directly disturbed the river ecosystem [25], and the HRB is facing serious risks of water quality deterioration and ecosystem degradation.
Previous studies have shown that approximately 80% of the reaches of the Huai River were contaminated by high concentrations of chemical oxygen demand (CODMn) and ammonia nitrogen (NH3-N) [26,27], and the water quality ranked between Class IV and V of the Environmental Quality Standard for Surface Water (GB 3838-2002). Meanwhile, the middle parts of the Shaying River and Guo River were highly polluted by organic pollutants [26]. In addition, 98.15% of the sediments in the Huai River, particularly the reaches within Anhui Province, were highly enriched with heavy metals due to anthropogenic activities [27].
2.2. Field Sampling and Data Collection
To better diagnose the riverine ecosystem health of key regions and identify main pollutant structuring communities, water, sediments, and benthic macroinvertebrates were sampled at 27 sites (Figure 1). Four field surveys were conducted in summer (August), autumn (November), winter (January), and spring (April) from 2014 to 2015.
Water samples for chemical analysis were collected at about 50 cm below the river surface, and were conserved in 500 mL polyethylene bottle with the addition of 1 mL concentrated sulfuric acid (analytical reagent) to inhibit microbial activity. All water samples were placed in an ice chest at 4 °C, and were analyzed immediately after the samples arrived at the laboratory. Water variables such as the suspended solids (SS), chemical oxygen demand (CODMn), total nitrogen (TN), ammonia nitrogen (NH3-N), nitrate nitrogen (NO3−-N), nitrite nitrogen (NO2−-N), and total phosphorus (TP) were measured based on procedures from the National Environment Protection Agency (NEPA, 2012). Besides this, dissolved oxygen (DO) was measured in situ at all sampling sites with multiparameter water quality sonde (YSI EXO2, SonTech, OH, USA). For the measurement of NH3-N, NO2—N, and NO3−-N, water samples were filtrated using 0.45 μm nitrocellulose filters. Heavy metals, including nickel (Ni), zinc (Zn), copper (Cu), chromium (Cr), cadmium (Cd), lead (Pb), arsenic (As), and mercury (Hg), were measured via inductively coupled plasma mass spectrometry (ICP-MS, XSERIES 2).
Sediments were collected using grabs at a depth of 0–10 cm and were sealed immediately in polyethylene airtight bags for heavy metal analysis. Sediment samples were first dried at room temperature. Subsequently, they were all ground with a mortar and sieved through a 100-mesh nylon, prior to analysis. Sediment samples (0.2000 g each) were digested with an HCl-HNO3-HF-HClO4 mixture and then measured by instruments three times. Heavy metals, including Ni, Zn, Cu, Cr, Cd, and Pb were also analyzed by ICP-MS (XSERIES 2), except for As and Hg, which were digested using HCl-HNO3 and measured by the reduction gasification-atomic fluorescence spectrophotometer (AFS-230E) method.
Benthic macroinvertebrates were collected simultaneously with water and sediment samples. Different replicates of samples were collected with a 30 cm wide D-frame kick net of 500 μm mesh at each site, according to the occurrence of different habitats. All samples from the randomly selected sampling sites were field rinsed on a sieve (500 μm mesh size) to remove silt and detritus. Then, the D-net was inspected for macroinvertebrates adhering to the mesh. The macroinvertebrates were put into sealed plastic bags and preserved with 75% ethanol for later classification in the laboratory. Organisms were mainly identified to the species or genus level with a stereoscopic dissection microscope (LEICA MZ 95). Some groups were only identified to the higher taxonomic level, limited by their identification ability. For instance, Ephemeroptera, Plecoptera, and Trichoptera larvae were identified to the lowest taxonomic level, mostly to the genus level, while Odonata, Hemiptera, and Diptera were only identified to the family level, and the non-insect taxa to the order level. Identification of macroinvertebrates followed the key of Kawai (1985), Kang (1993), Morse et al. (1994), and Merritt et al. (2008) [28,29,30,31].
2.3. Data Analysis
The self-organizing map (SOM) is an adaptive unsupervised learning algorithm [32] and is often used to visualize and explore linear and non-linear relationships in high-dimensional datasets [33]. Up to now, this method has been widely used to find out which environmental variables had major influences on the presence of organisms [34]. SOM consists of two layers of input and output connected with computational weights [35]. The input layer acquires information from a data matrix (environmental variables or taxa abundance), whereas the output layer consists of a two-dimensional network of nodes arranged in a hexagonal lattice. The number of output neurons in an SOM can be selected using the heuristic rule suggested by Vesanto et al. (2000) [36] and applied in Park et al. (2006) [37]. The optimal number of map units is close to 5, where n is the number of training samples. An alternative to the calculation of eigenvalues is to consider quantization error (QE) and topographic error (TE) [38]. Here, the SOM is trained with different map sizes, and the optimum size is selected based on minimum values for QE and TE. In general, the more complex the structure of the neural network, the stronger the ability to deal with non-linear problems, but the training time will be prolonged [39]. This calculation procedure was realized in the SOM toolbox package (Ver. 2.0, Laboratory of Information and Computer Science, Espoo, Helsinki, Finland) for Matlab R 2013b.
Detrended correspondence analysis (DCA) was applied using CANOCO (4.5, Centre for Biometry, Wageningen, Gelderland, the Netherlands) to examine whether redundancy analysis (RDA) or canonical correspondence analysis (CCA) would be appropriate to analyze the data [40]. If the gradient lengths analyzed by DCA were higher than three standard deviations, CCA was used to analyze the relationships between organisms and environmental variables. Prior to the multivariate statistical analysis, macroinvertebrate abundances were log (x + 1) transformed to obtain homogeneity of variances [41]. After the forward selection and Monte-Carlo permutation test (p < 0.05), ten environmental variables were selected as independent factors. All data were used together to construct the plots. The nonmetric multi-dimensional scale (NMDS) was applied to perform the benthic community structure, using PC-ORD for Windows 4.0 (MjM Software Design, Gleneden Beach, OR, USA) based on the Bray–Curtis distance measure.
3. Results
3.1. Environmental Variables
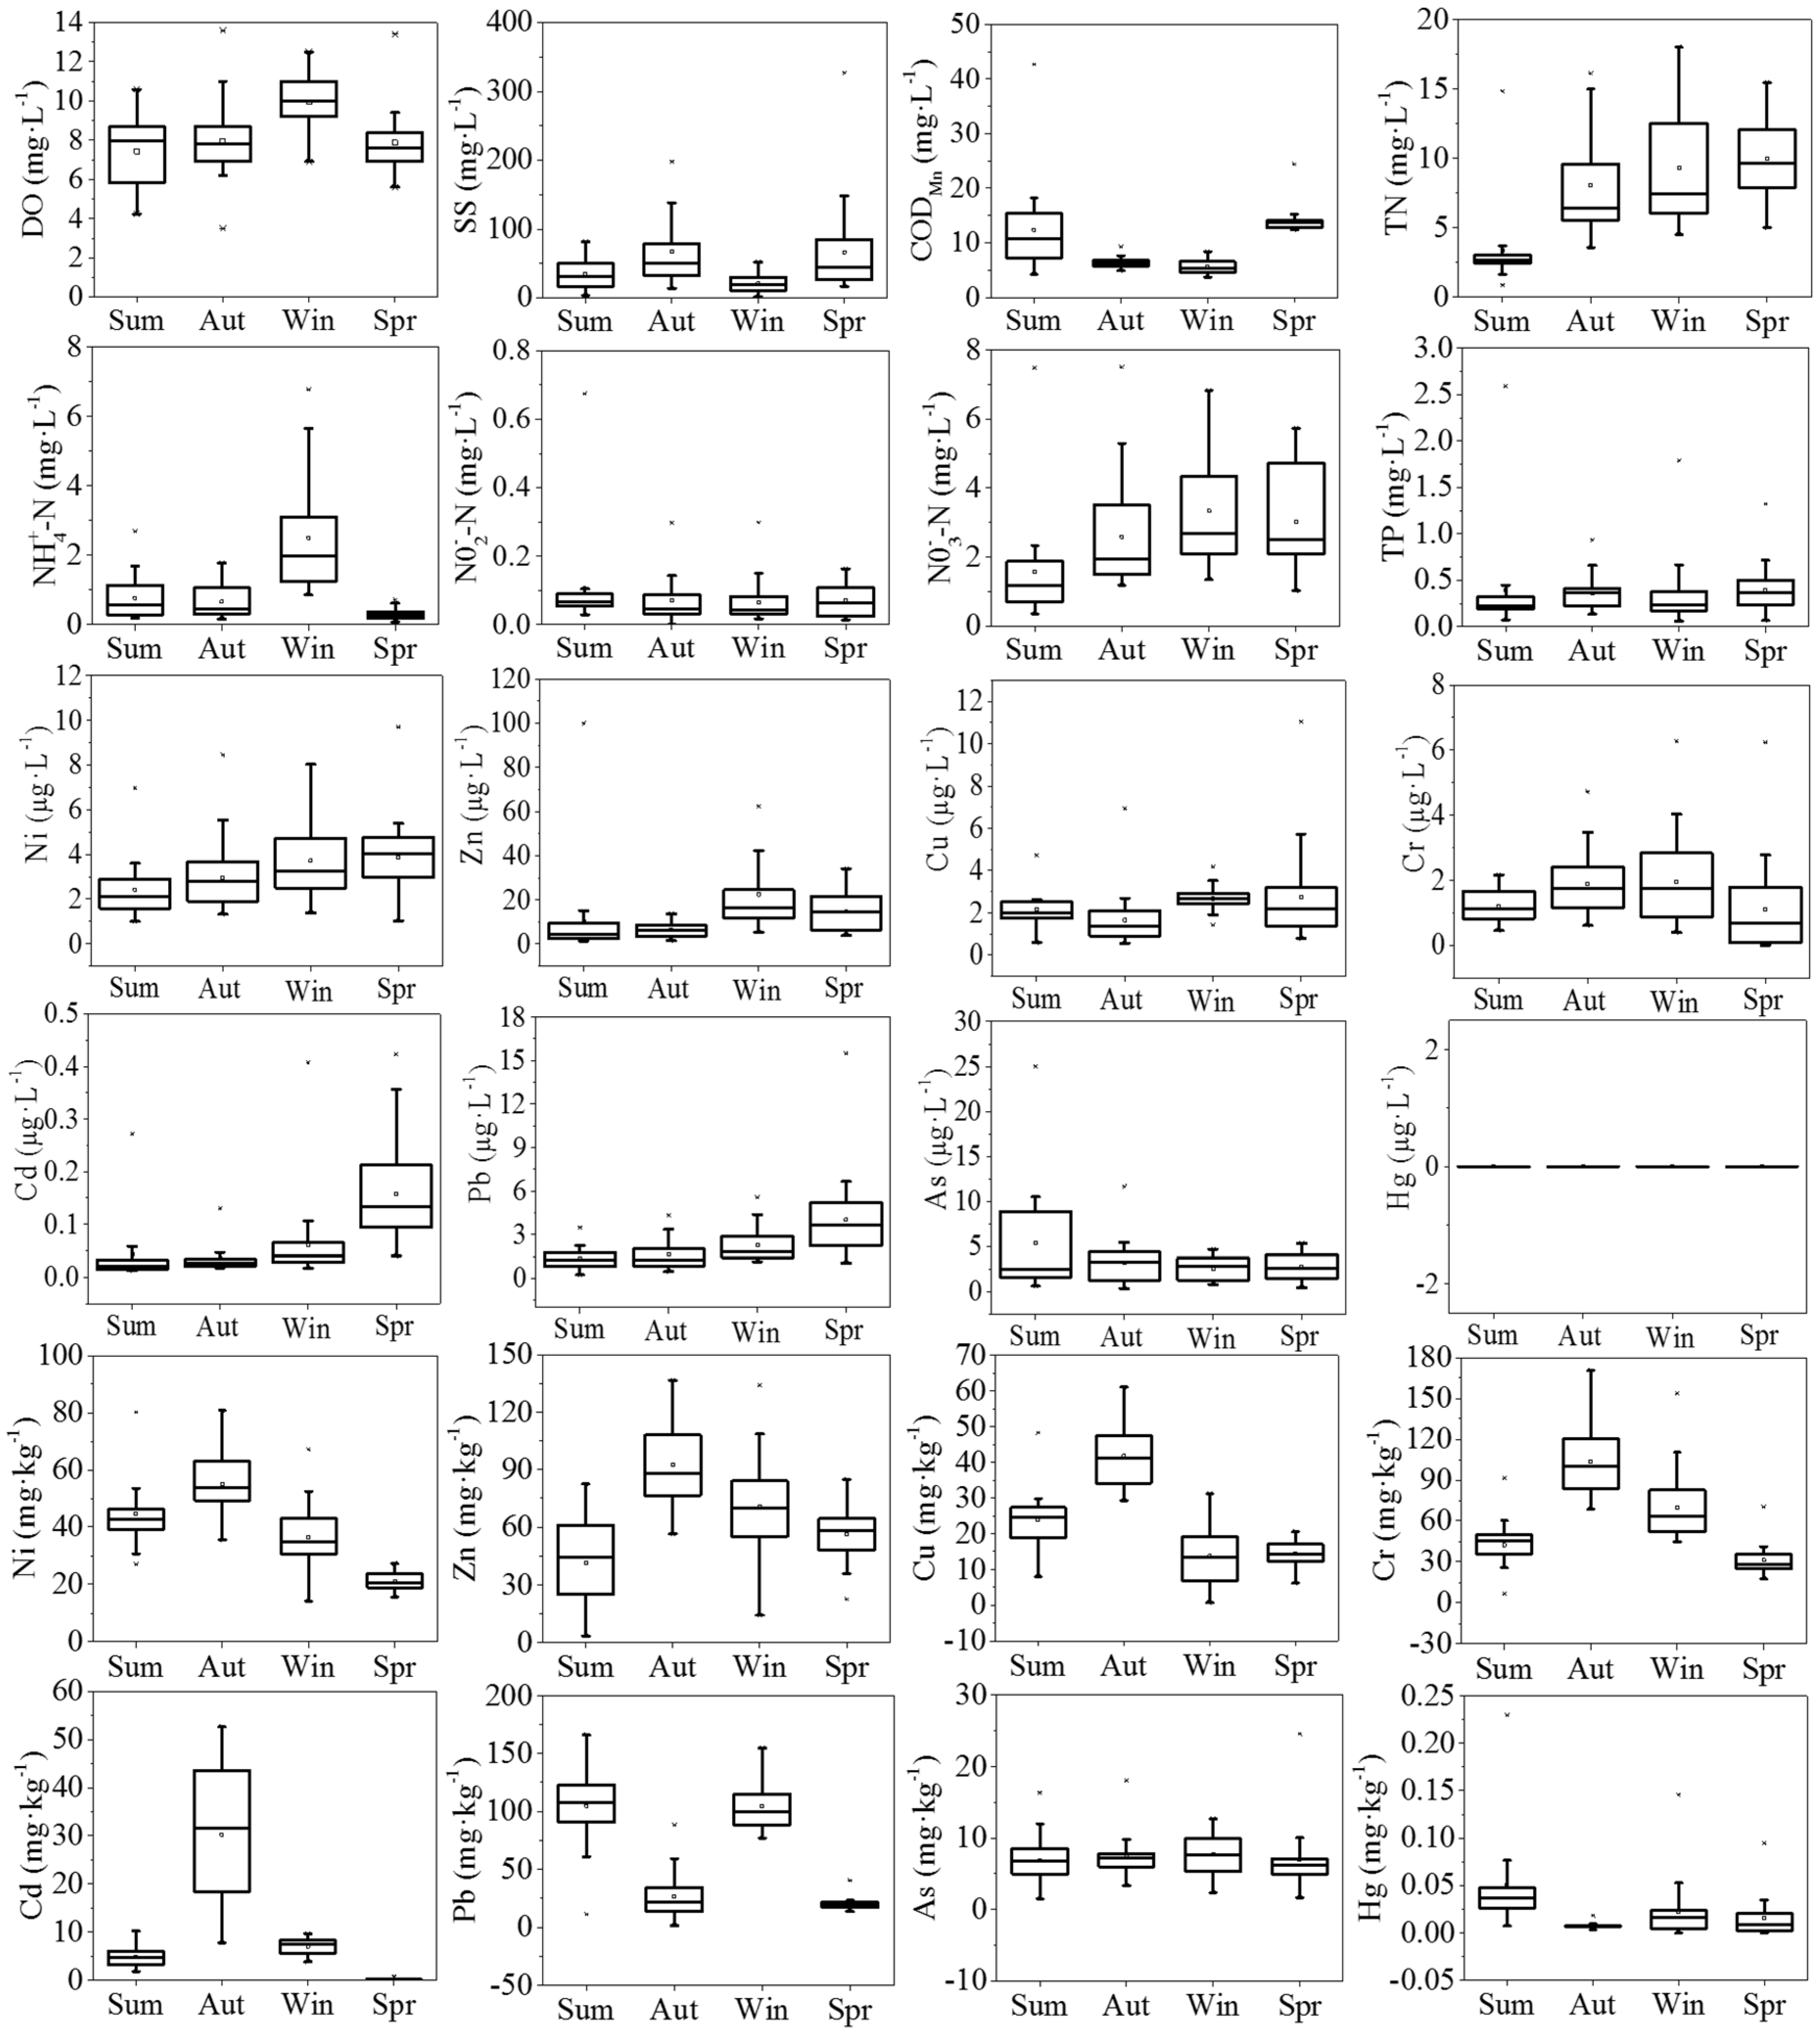
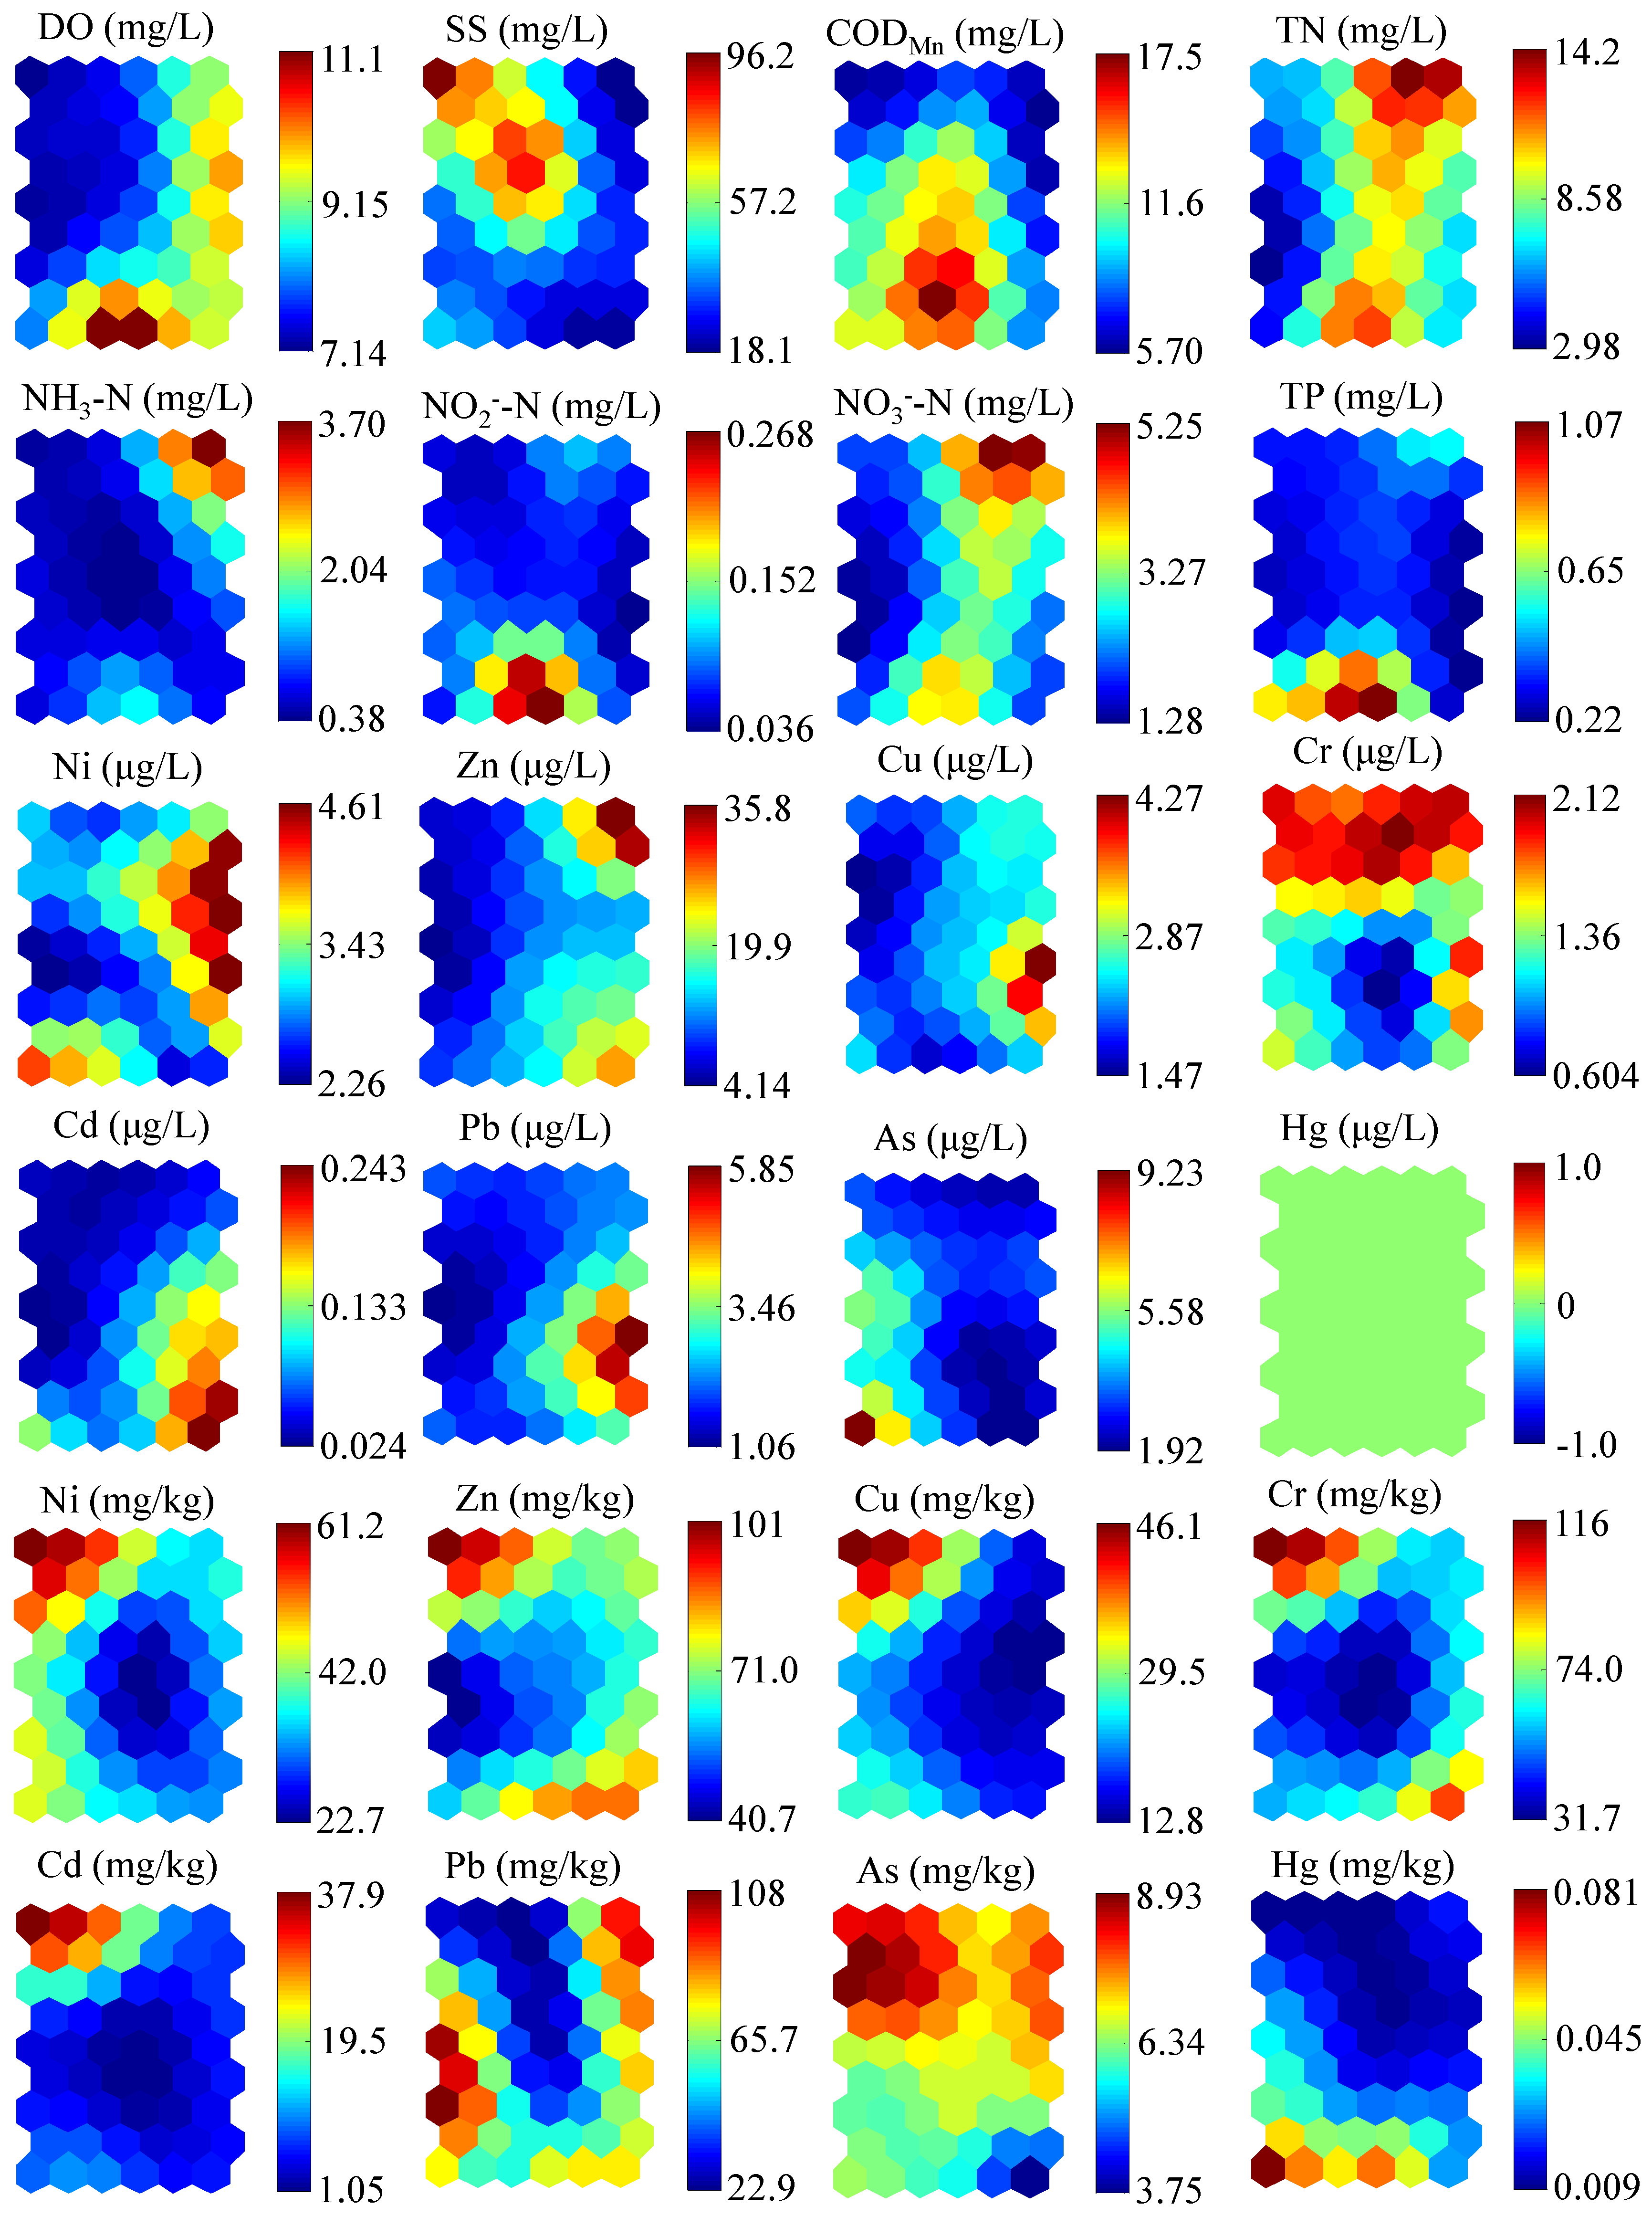
Variations of environmental variables, including DO, SS, CODMn, TN, NH3-N, NO2−-N, NO3−-N, and TP in water columns and Ni, Zn, Cu, Cr, Cd, Pb, As, and Hg in sediments in all seasons across the HRB are summarized in Figure 2. As a whole, HRB was suffering from a severe contamination in comparison to other sub-basins, especially for the pollution of TN, Cd, and Pb.
In water, the DO in winter, with an average value of 9.94 mg/L, was significantly higher than that in the other seasons (ANOVA: Dunnett T3, p < 0.001). The SS concentrations were lower in summer and winter, whereas relatively high concentrations occurred in autumn and spring. The mean CODMn concentration varied between seasons, with the high mean value in spring (13.86 mg/L). The most severe pollutant was TN, with a water quality level worse than Grade V through the year, and a concentration in summer significantly lower than that in the other seasons (ANOVA: Dunnett T3, p < 0.001). NO3−-N had similar trends to TN, with the lowest concentration in summer, but the highest concentration of NO3−-N occurred in winter, which was slightly different to the change in TN. NH3-N also varied seasonally, with the highest concentration occurring in winter. NO2−-N and TP levels had no significant difference among the four periods. Concentrations of heavy metals in water were relatively low, all of which were detected at the microgram level. In particular, Hg was not detected at any sampling sites over the seasons.
In sediments, the concentrations of Ni, Zn, Cu, Cr, and Cd had similar trends, with the high concentrations occurring in autumn. As and Hg levels were relatively stable during the four seasons. In particular, the average concentration of Cd was highest in autumn and achieved approximately 400 times the background concentration (0.079 mg/kg). The average concentration of Pb was higher in summer and winter than that in the other two seasons, which were about 4.5 times the background concentration (23.50 mg/kg) on the whole.
3.2. Macroinvertebrate Community Structure
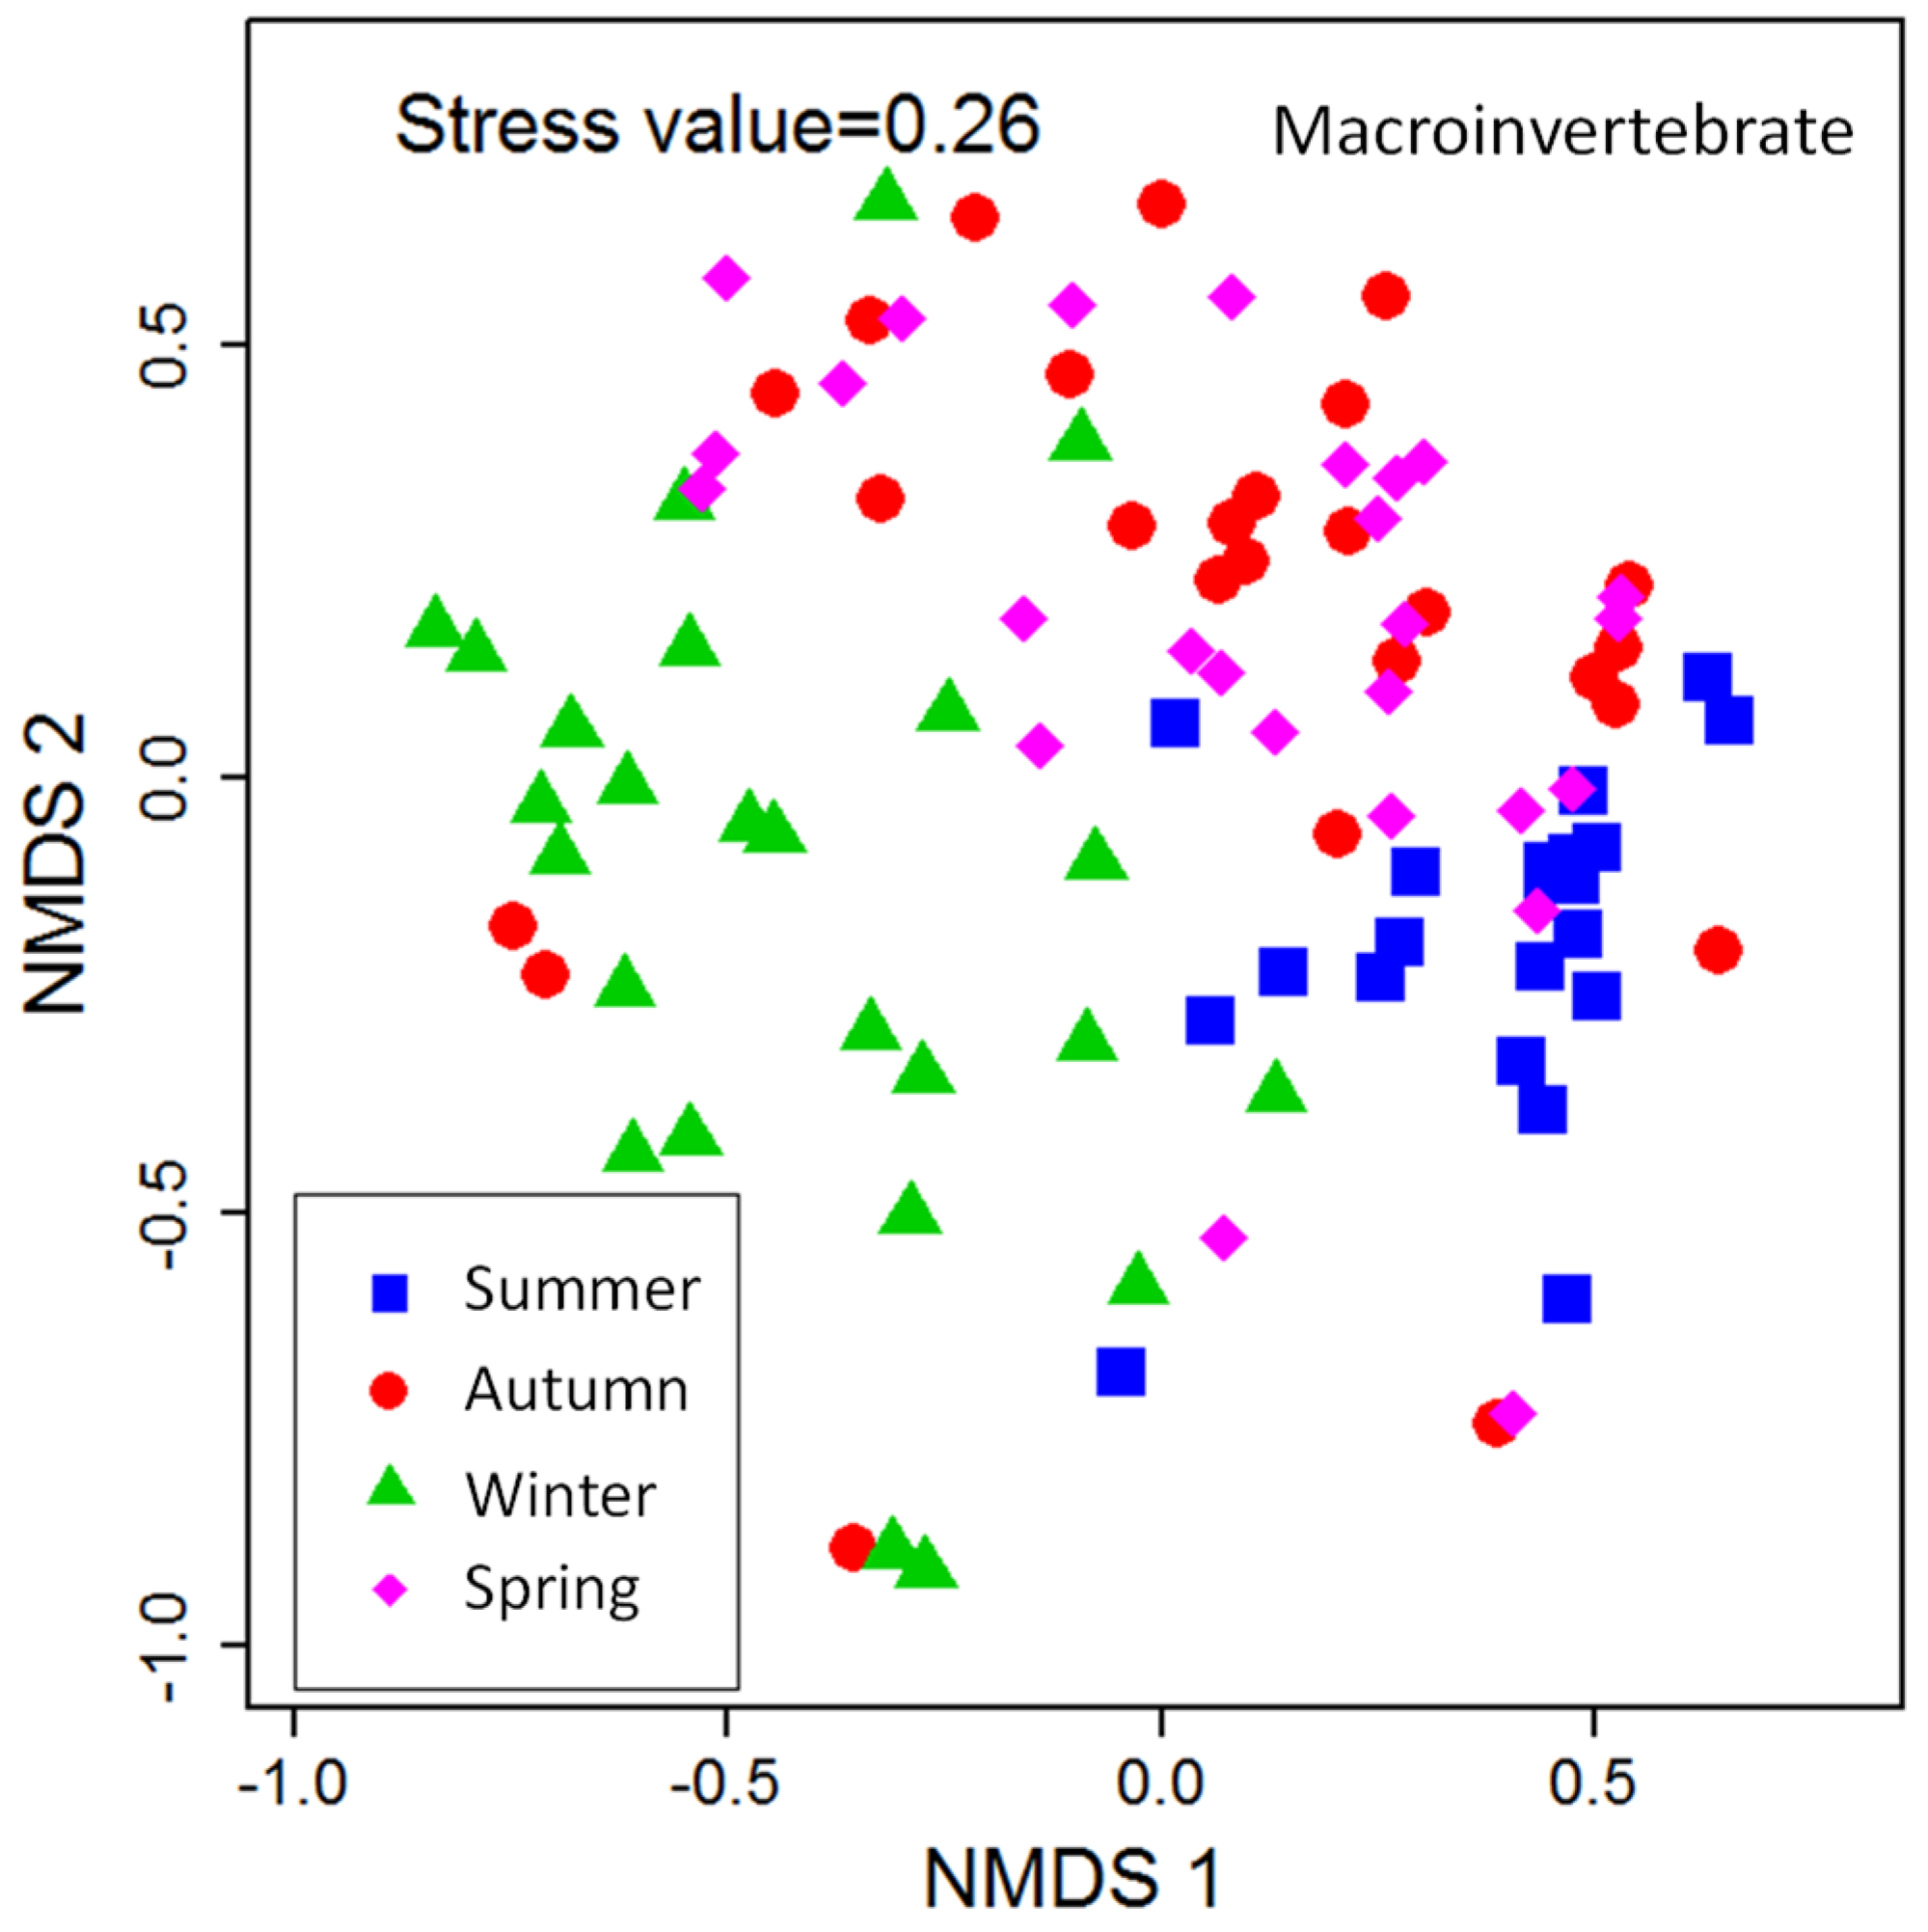
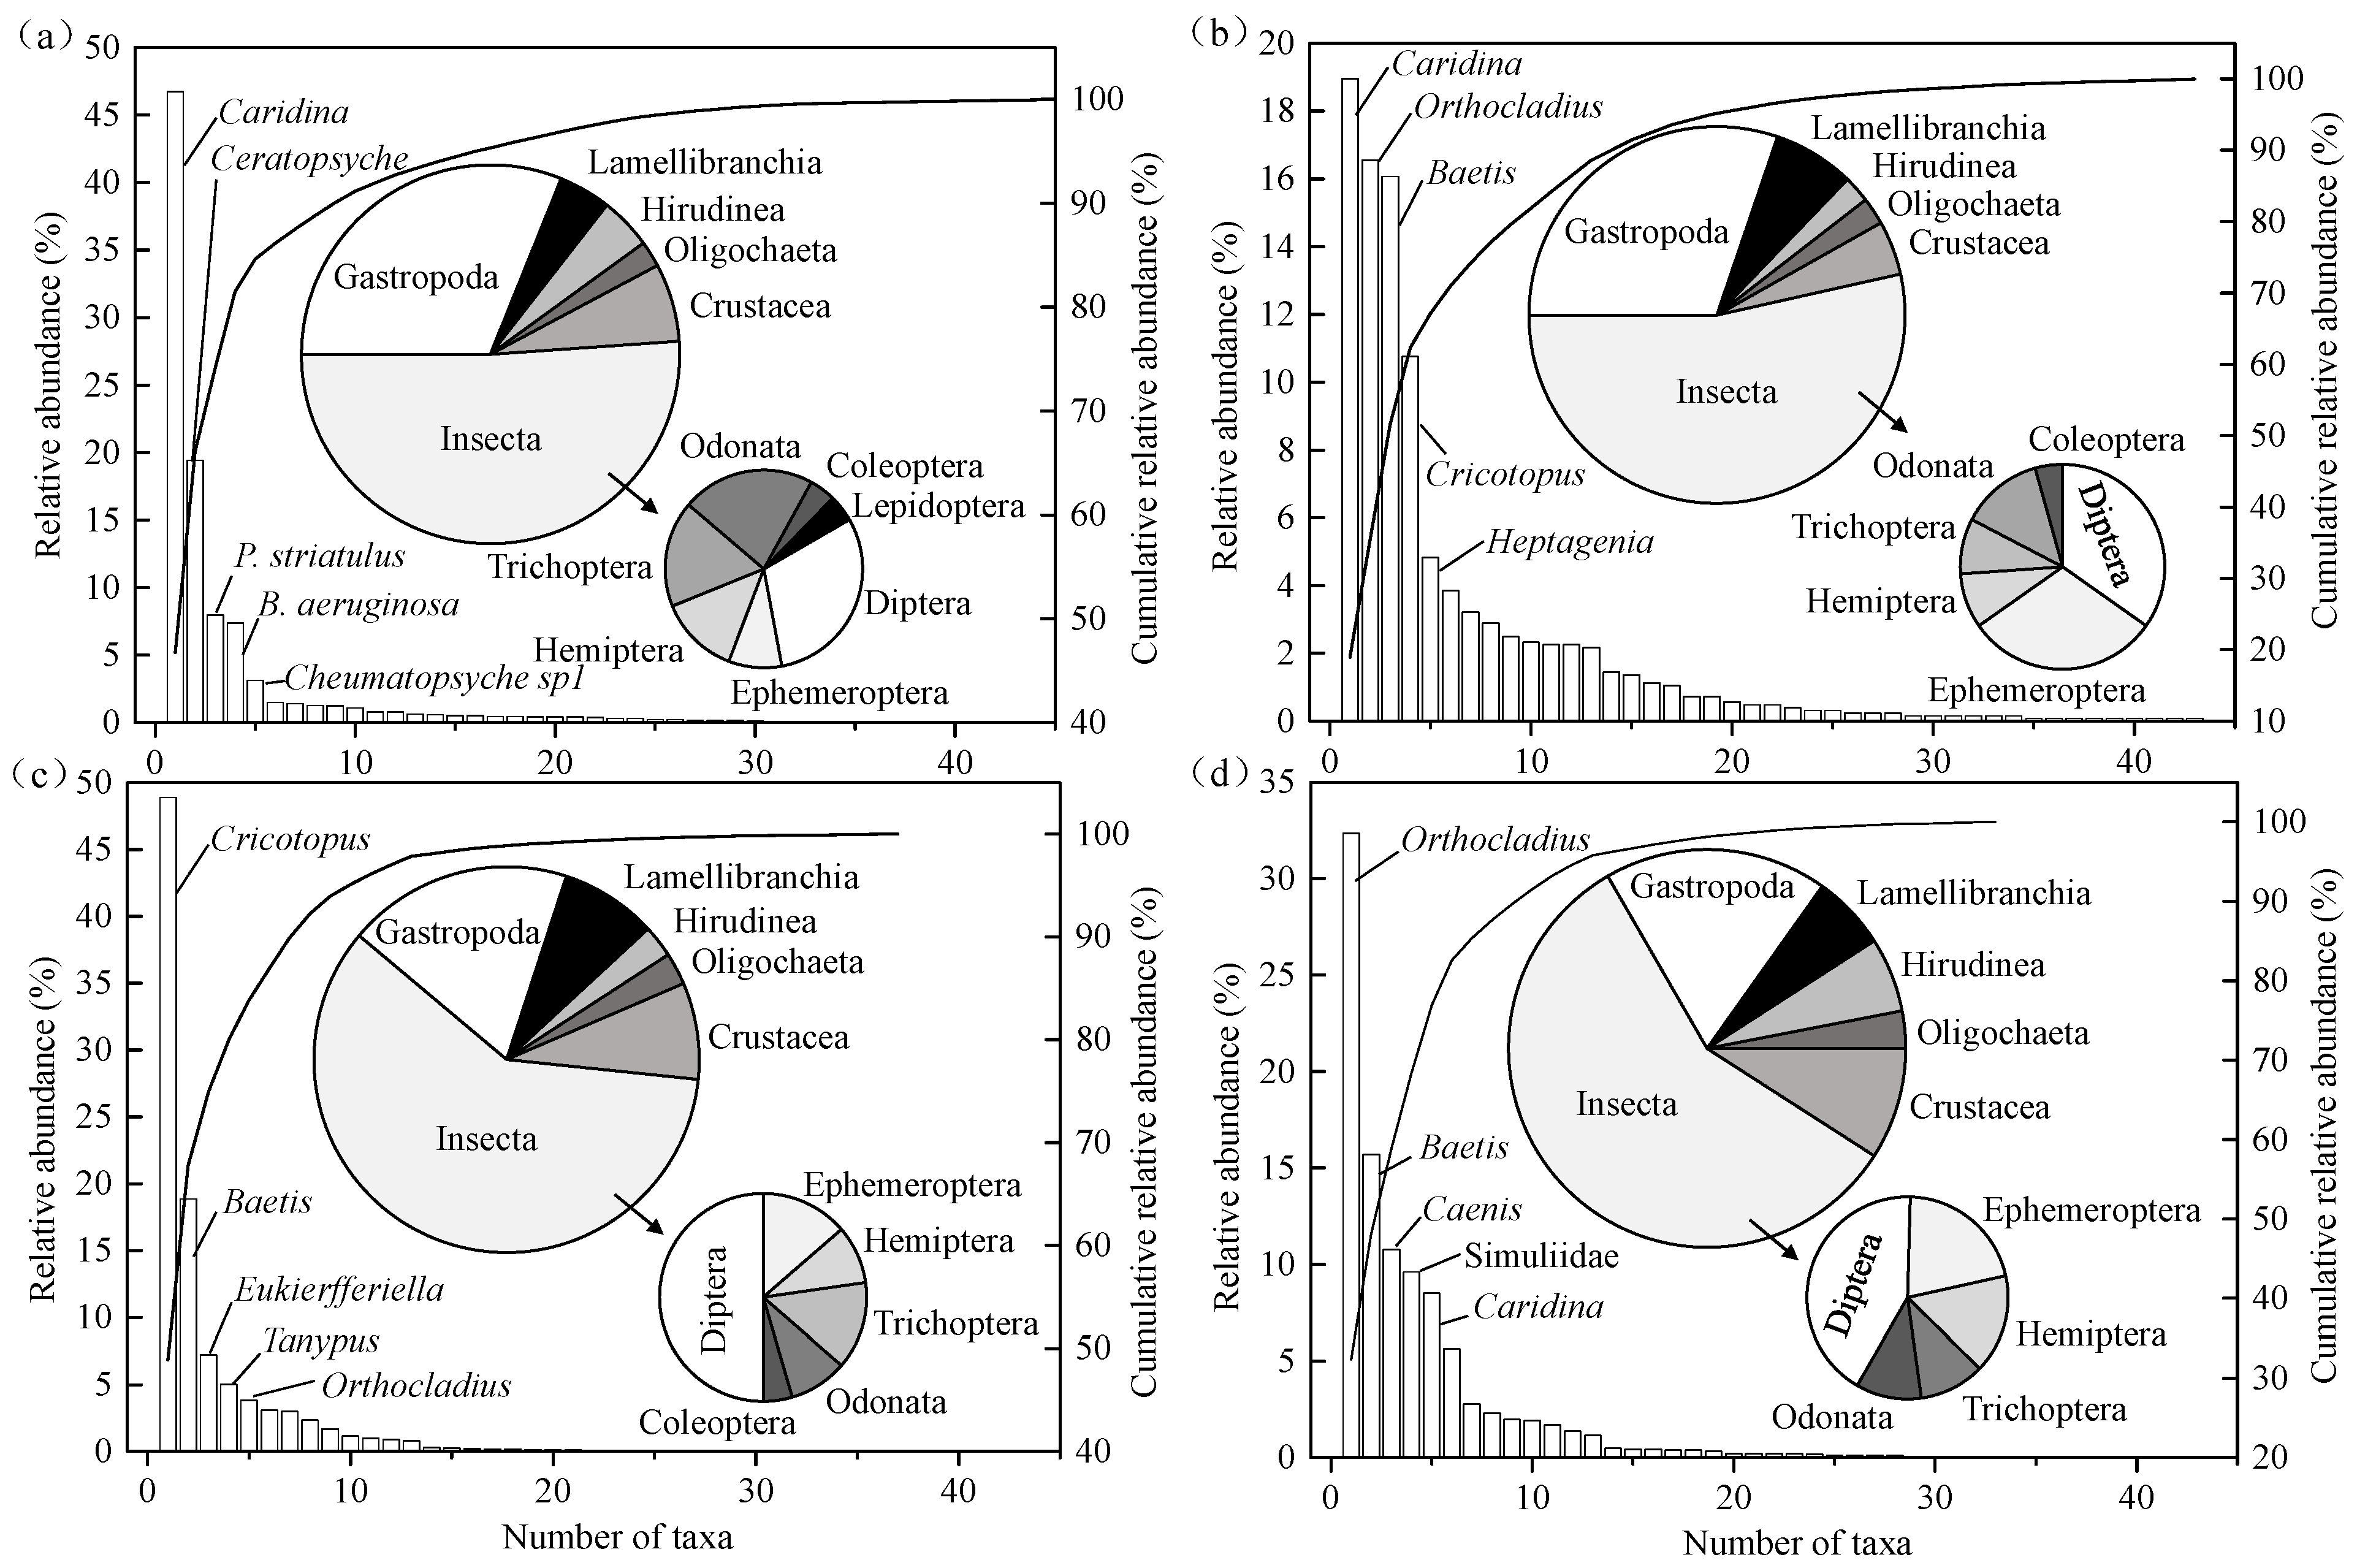
A total of 10,722 individuals belonging to 3 phyla, 6 classes, 18 orders, 42 families, and 61 genera were collected from the 103 samples distributed in the typical reaches of HRB in the year 2014–2015. Nonparametric multidimensional scaling (NMDS) ordination was performed and is shown in Figure 3. The benthic community structure changed with the seasons, and its community in summer and winter presented obvious differences, whereas a certain degree of similarity was observed in autumn and spring. As shown in Figure 4, in particular, the composition of the benthic community based on the number of taxa showed a similar trend over seasons, including Gastropoda, Lamellibranchia, Hirudinea, Oligochaeta, Crustacea, and Insecta. Among these, Insecta and Gastropoda were the main components of the genera collected in the basin, ranging from 51.11% to 59.46% and 18.18% to 31.11%, respectively.
With regard to relative abundance, the five most-abundant taxa of genera also varied between seasons (Figure 4). In summer (Figure 4a), the most abundant species was in the genus Caridina, representing 46.72% of total abundance, and the other four dominant species were within the genera Ceratopsyche, P. striatulus, B. aeruginosa, and Cheumatopsyche sp1. In autumn (Figure 4b), the most abundant species was still in the genus Caridina, representing 18.96% of total abundance, and the other four dominant species were within the genera Orthocladius, Baetis, Cricotopus, and Heptagenia. In winter (Figure 4c), the most abundant species was in the genus Cricotopus, representing 48.90% of total abundance, and the other four dominant species were within the genera Baetis, Eukierfferiella, Tanypus, and Orthocladius. In spring (Figure 4d), the most abundant species in the genus Orthocladius, representing 32.36% of total abundance, and the other four dominant species were within the genera Baetis, Caenis, Simuliidae, and Caridina.
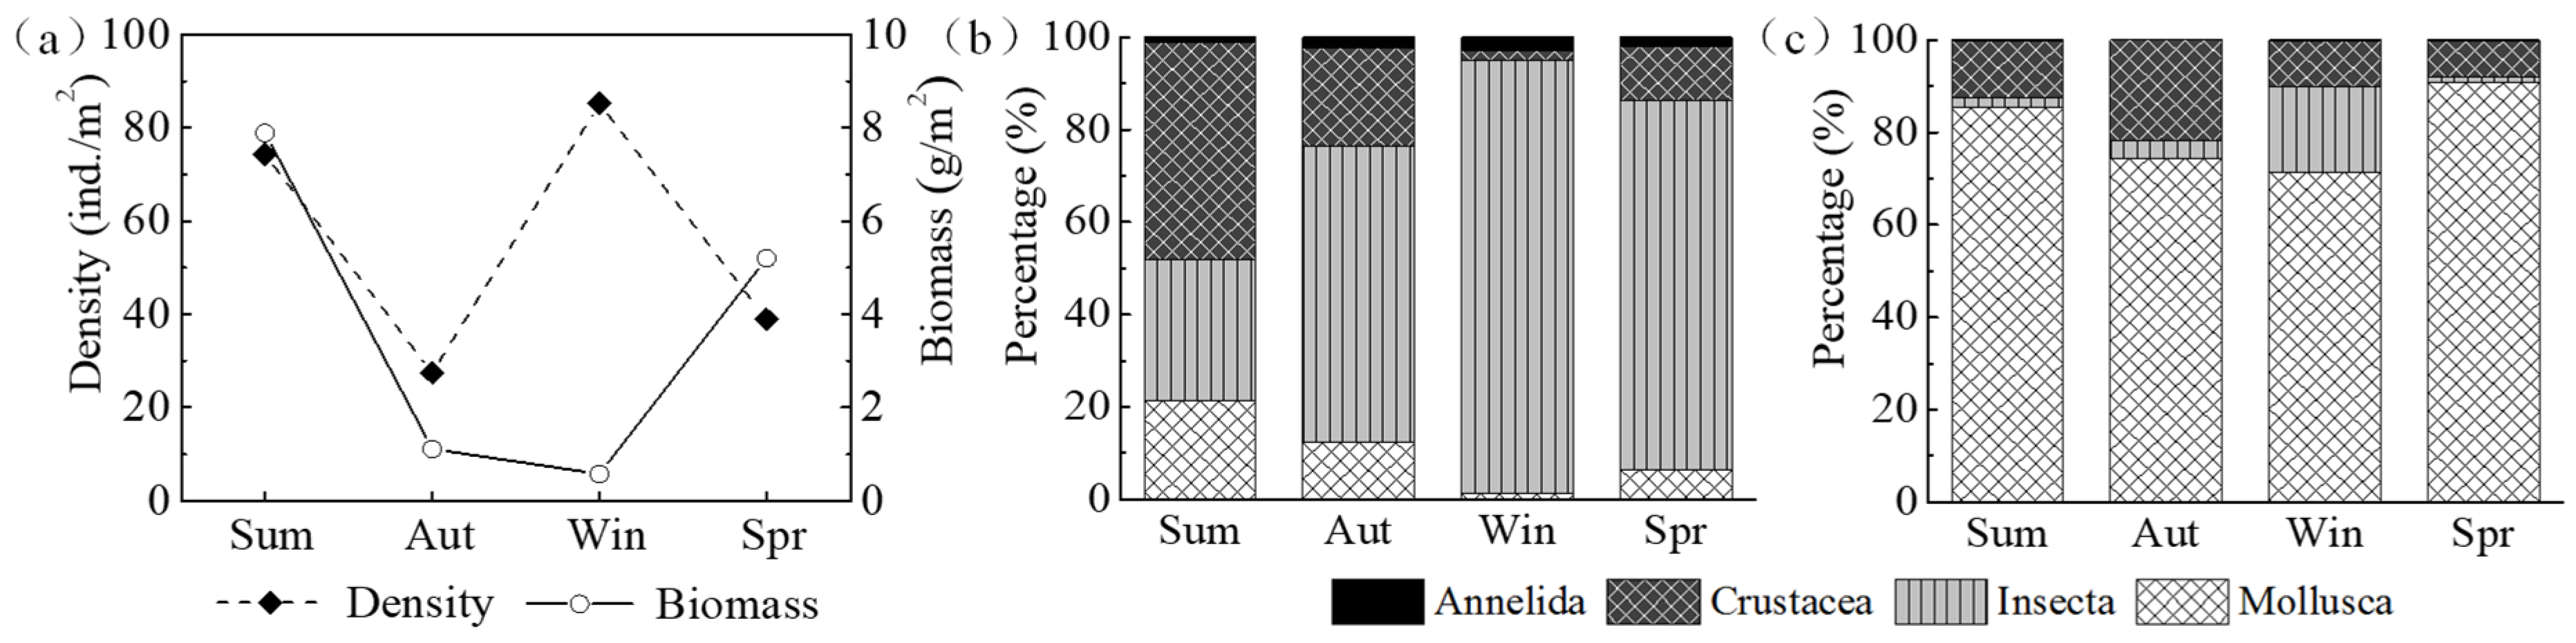
The density and biomass of macroinvertebrates fluctuated sharply throughout seasons (Figure 5a). The highest density was recorded in winter (85.20 ind./m2) and the lowest value was observed in autumn (27.48 ind./m2). Insecta was an important contributor, which accounted for more than 60% of the total number density, except that crustacea exhibited a relatively higher percentage than other species in summer (Figure 5b). In contrast, the biomass decreased from summer to winter, and then increased over time, showing a maximum value of 7.86 g/m2 in summer and a minimum value of 0.57 g/m2 in winter (Figure 5a). The biomass of mollusca was remarkably higher than other species, whereas annelida accounted for less than 1% of the total biomass in all seasons (Figure 5c).
3.3. Macroinvertebrate Community Structure in Relation to Environmental Variables
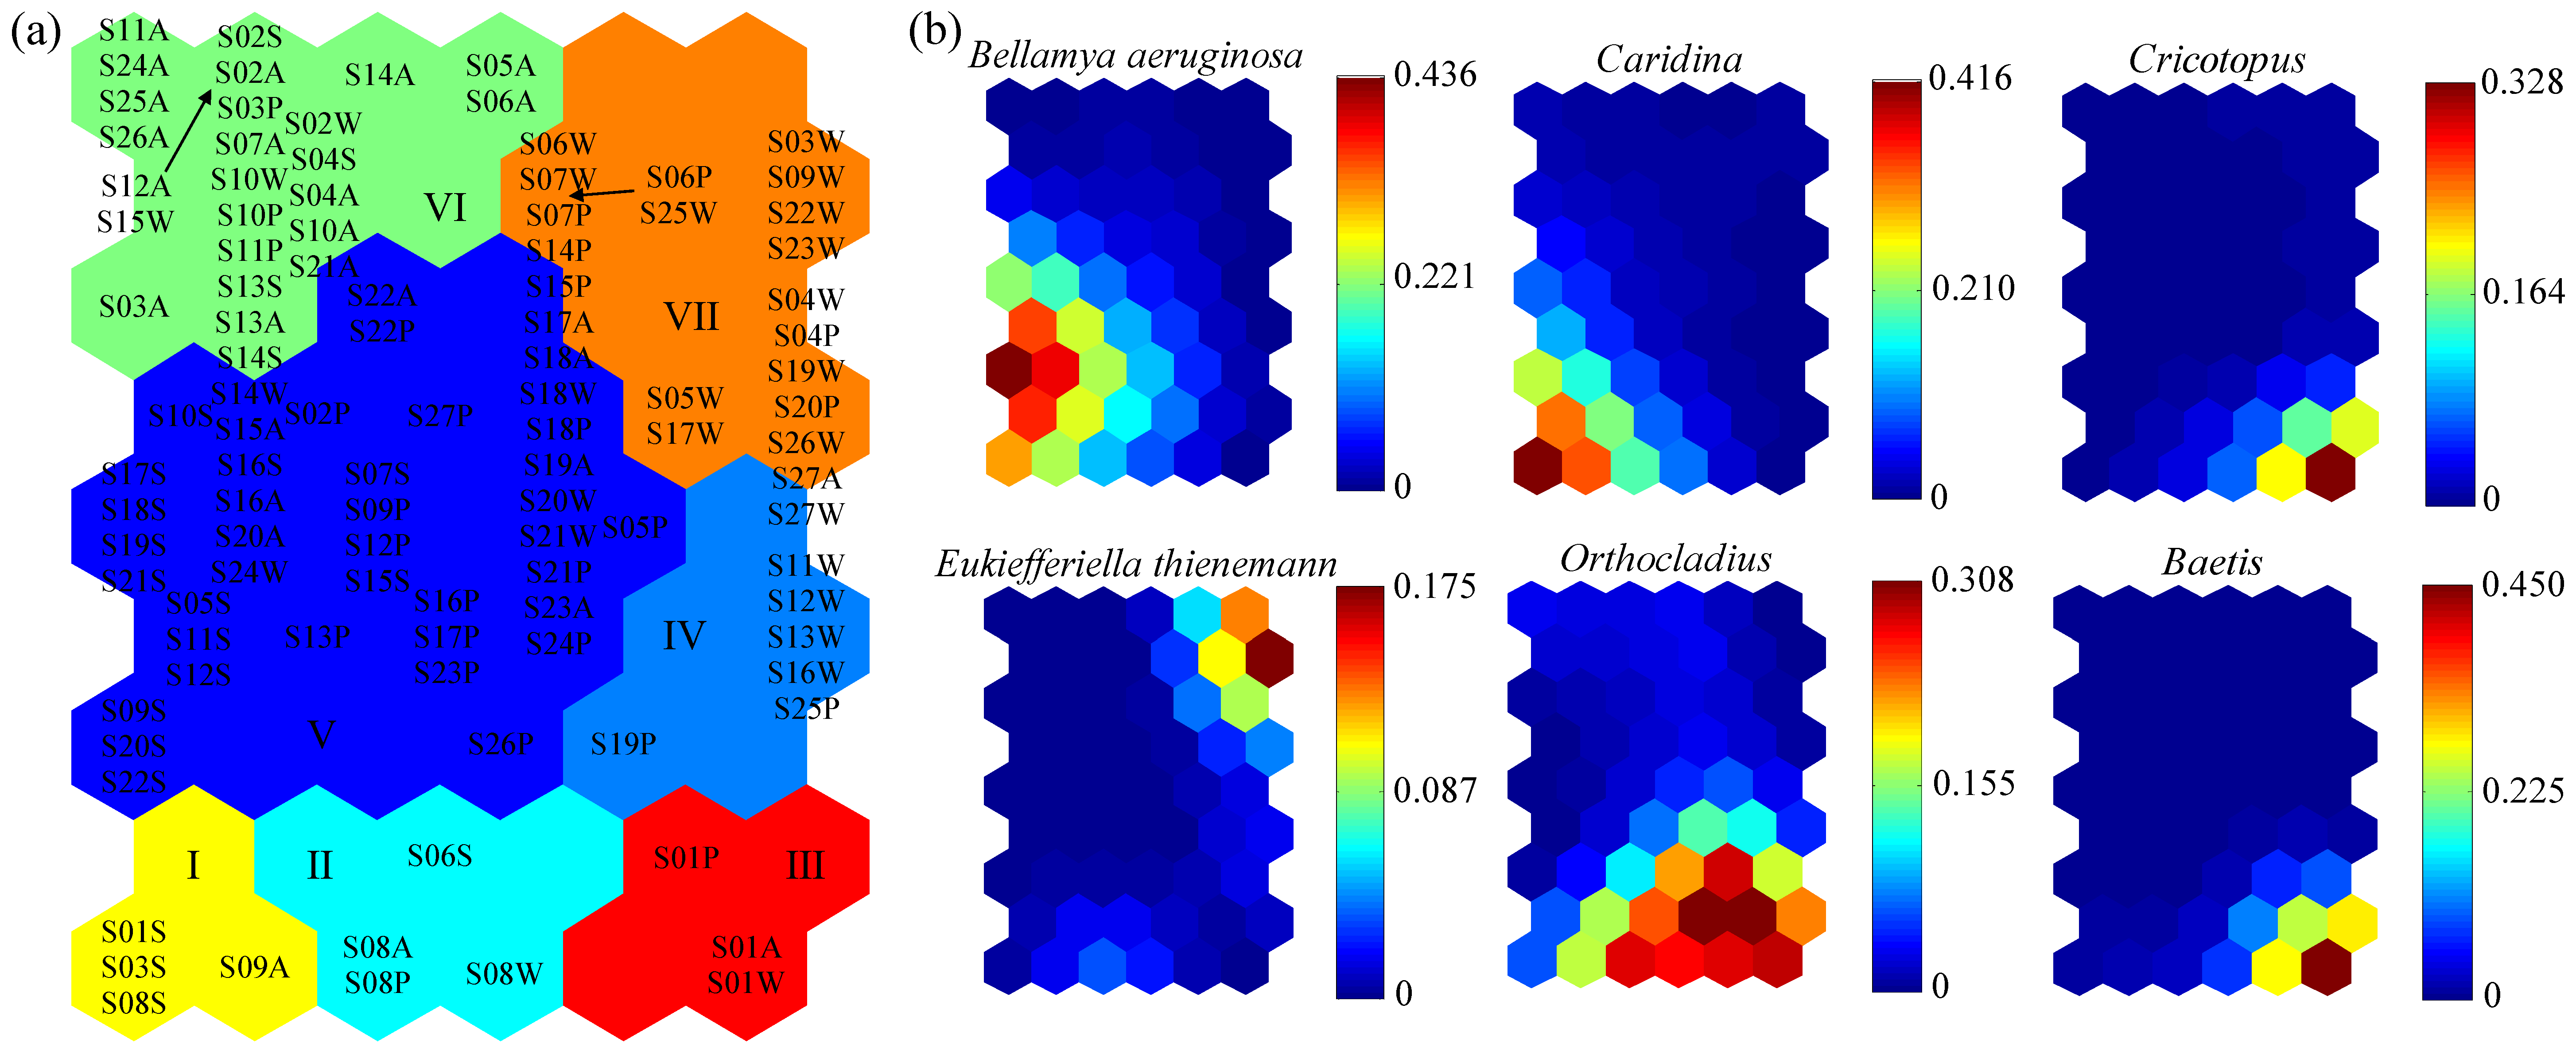
The macroinvertebrate communities were patterned according to the similarity of community compositions through training the SOM (54 = 9 × 6) (Figure 6). The sampling sites were reasonably well distributed in the SOM (Figure 6a), and the final values of QE and TE were 1.1499 and 0, respectively, indicating a good fit for the SOM training. According to the cluster analysis of k-means, seven main clusters were formed under the minimum principle of the Davies–Bouldin index (DBI) (Figure 6a). Six dominant species were associated with different clusters under a variety of pollution gradients (Figure 6b). Clusters V and VI were two larger groups located on the left of the SOM map, which were dominated by Bellamya aeruginosa. Clusters I, II and III were located in the bottom fourth of the SOM map, and were dominated by Caridina, Orthocladius, Cricotopus, and Baetis. Among them, the sampling sites in Cluster I were distributed in the upstream of the Huai river mainstream and Shaying River. The sampling sites in Cluster II were only distributed in the headwater region of Shaying River, and the sampling sites in Cluster III were only distributed in the headwater region of Huai river mainstream. Clusters IV and VII were located on the right of the SOM map, and were dominated by Eukiefferiella thienemann.
Twenty-four environmental variables involving water and sediments were observed at the sites and clustered in the SOM (Figure 7). Through the comparison and analysis of Figure 6 and Figure 7, the qualitative influence of each pollutant on the benthic community structure can be clearly seen. In particular, none of the six dominant species adapted to the high concentration of SS. However, the influence of TN on the benthic community structure was not an absolutely negative effect. For example, E. thienemann could largely survive under a high concentration of TN, whereas the abundance of B. aeruginosa could be highly affected by TN. Meanwhile, E. thienemann was still positive with the high concentration of NH3-N, and the influence caused by NO3−-N presented a similar trend with TN. The concentrations of CODMn, NO2—N, and TP had no significant influence on the benthic community. As for the heavy metals in water with relatively low concentrations, they posed no regular influence on the benthic community, and even some positive effects were observed, like Cd on Cricotopus and Baetis, and As on Caridina. However, for the heavy metals in sediments, the abundance of E. thienemann showed a negative effect on the Hg concentration, and the pollution of Cu, Cd, and As generally posed negative effects on the benthic community.
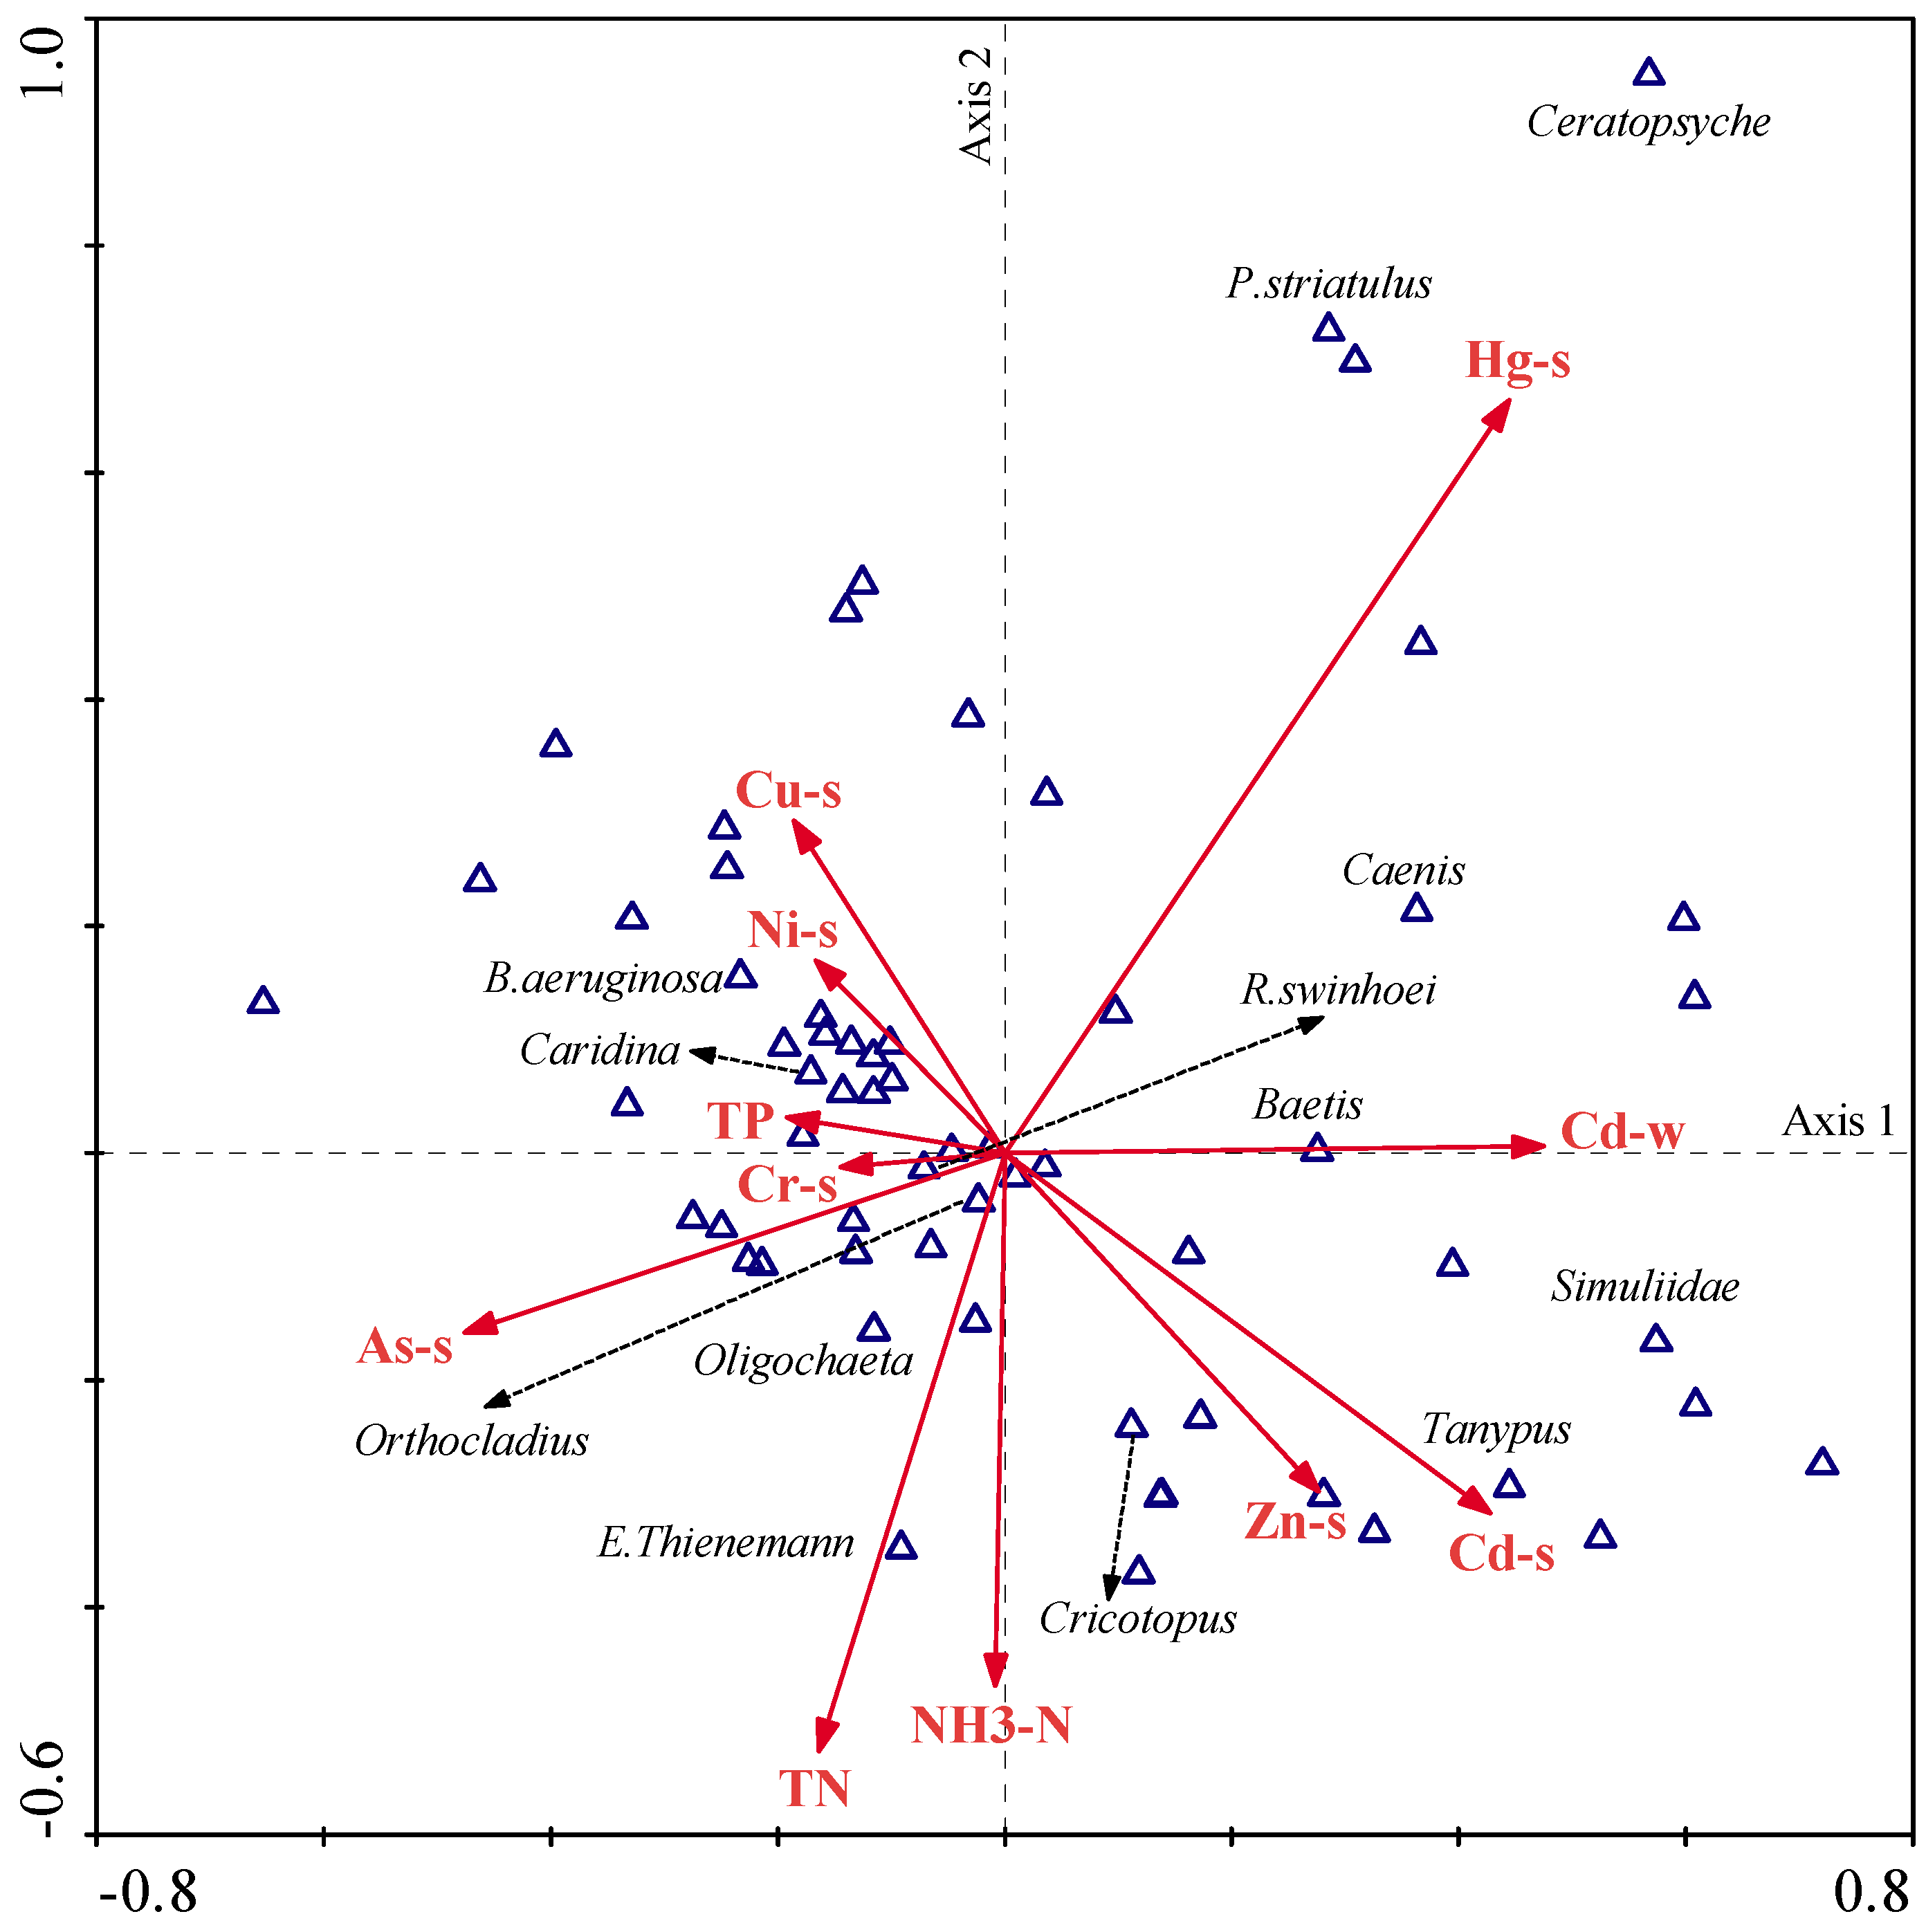
Results obtained from CCA showed strong relationships between the macroinvertebrate community and environmental variables (Figure 8). After the forward selection and Monte Carlo permutation test (p < 0.05), 11 environmental variables, mainly including TN, TP, NH3-N, and Cd in water and Ni, Zn, Cu, Cr, Cd, Hg, and As in sediments, were selected and could interpret 69.60% of data variability in the first two axes. The species–environment correlations of CCA axes 1 and 2 were 0.908 and 0.892, respectively, and the first two axes accounted for 41.40% of the variance of species–environment relationship.
Of these, Hg, As, Cd, and Zn were the most important representative factors in sediments, and TN and NH3-N were the most significant representative factors in water. Hg pollution was the first important factor, and most of the species, such as R. swinhoei, Orthocladius, Oligochaeta, and E. thienemann, showed a negative correlation with Hg level, whereas P. striatulus, Caenis, and Baetis presented their preferences to the relatively higher level of Hg. In addition, E. thienemann and Oligochaeta were strongly positive with TN. Orthocladius and R. swinhoei showed preferences to As and B. aeruginosa. Moreover, Caridina was positive to the levels of Cu and Ni, but negatively related to the levels of Cd and Zn.
4. Discussion
With the rapid development of the economy, water quality deterioration has become a prominent issue threatening river ecological health and water security throughout the world [42]. HRB, as the sixth largest basin in China, is faced with the most severe pollution, both in water and sediments, which is closely related to the industrial structure, environmental management, and the surrounding land use. Due to the construction of wastewater treatment plants and pipeline networks, point source pollution has been effectively controlled, and urban domestic sewage for COD has decreased by 44.57% from 1993 to 2005 [26]. Of course, some wastewater randomly discharged by small enterprises with no permission could be another important factor for water quality degradation in the HRB, which is usually accompanied by the occurrence of sudden pollution events. Additionally, non-point source pollution arising from the daily lives of village residents and framing might be an underlying and increasing driving factor for the deterioration of water quality. Besides this, various types of land use also have significant influences on the degradation of water quality. In the HRB, as the first leading industry and the contribution of agricultural non-point source pollution, agriculture could account for almost 70% of the total pollutants during the flood season, especially for the SS and nutrients [5,43]. In this study, the high concentrations of nutrients (N, P) observed in the typical reaches of the HRB were probably due to the use of too much fertilizer in agricultural activities. Water quality improvement during the flood season could be further attributed to the dilution function of rivers. However, a large number of tannery and electroplating factories distributed in the HRB might be the main point source contributing to the heavy metal pollution. For instance, Shaying River flows through an area of paper mills and tanneries, where high concentrations of metals were observed. With regard to the spatio–temporal variation in pollutants in surface sediments, this may be attributed to the highly regulated sluices closed for water supply in the non-flood season and opened for flood control in the flood season [26,44].
So far, in addition to a focus on how to reduce the concentration of pollutants, we are more concerned with their ecological effects under the proposal of water ecological civilization construction. Benthic macroinvertebrates, as the middle ecological niche in the aquatic food chains, have a lot of advantages in evaluating the water ecological health when compared to other aquatic organisms [15,20]. They survive perennially in the water–sediment interface and are highly sensitive to the pollutants both in the water and sediment. In recent years, many studies have demonstrated that the benthic community structure is highly correlated with environmental variables, including physical and chemical factors, which have therefore been considered as outstanding indicators for environmental conditions [7,45].
Understanding the drivers of community structure is a fundamental work for adequately controlling pollutants and managing ecosystems. In this study, community–environment relationships were established by SOM and CCA and received reliable results by complementing and verifying each other. The SOM approach can complete the site clustering, based on the similarity of community structure and present visualization effects. Our study suggested that several chemical parameters, such as TN and NH3-N in water, as well as some heavy metals in sediment, such as Hg, As, Cd, and Zn, had the largest contribution to the macroinvertebrate taxonomic variation. Due to the sensitivity difference of species to different environmental pollutants, the influential mechanisms of environmental factors on organisms are various. Some of these factors, particularly nutrient concentrations, have a direct influence on primary production characteristics and food availability, as well as on the dispersal and reproduction of benthic macroinvertebrates [46]. Previous studies showed that nutrients (N, P) can cause eutrophication with a change of benthic algal composition [47], and further affect macroinvertebrate assemblages by bottom-up regulation [48]. On the other hand, they can also easily change the DO concentration and the transparency of water [16]. These two aspects may be the main reasons for the influence of nutrients on the structure of benthic communities.
This study found that heavy metals in water and sediment can have an impact on benthic fauna to different degrees, but the effects of heavy metals in sediments explained a larger part of the variation in the benthic community structure. Zhang et al. (2014) fund that Cu, Zn, and Pb in sediment were the main elements affecting the benthic community structure in the Baiyang, especially for insects [49]. Iwasaki and Ormerod (2012) showed that the total abundance and richness of Trichoptera had strong negative correlations with heavy metals [50]. Thus, we can conclude from the above results that different heavy metals have different effects on the benthic community in different water periods, and the influence of heavy metals on macroinvertebrates is mainly attributed to their genotoxic and neurotoxic effects, which can further affect many physiological and cellular processes in different macroinvertebrates [51,52]. However, the response difference of benthic communities to heavy metals can be modified by chemical conditions, tolerance values, biomass, community composition, and species interactions [53]. For example, it has been found that some Ephemeroptera and Trichoptera taxa were highly tolerant of metals [54]. Thus, facing the community–environment relationships, the more factors are considered, the more accurate the results are.
However, it is also worth mentioning that some limitations still exist in this study. For example, the effects of physical factors, including hydrological conditions, habitat type, and riparian vegetation on the benthic community structure are currently not considered. Secondly, we only focused on the effects of conventional water quality parameters and heavy metals on macroinvertebrates, ignoring the other toxic organic matters, such as pesticides. Additionally, the data analysis method applied in this study generally still stays on the qualitative level. However, omitting these effects at the current stage did not represent an oversimplification. In the next work, more factors will be focused on during the field study and the specific quantitative study on environmental variables on the individual of benthos under controlled laboratory will be soon addressed. In a possible situation, we can further study the toxic-mode-of-action of different chemical classes to macroinvertebrates by molecular biotechnology.
5. Conclusions
The abundance and diversity of benthic macroinvertebrates, as well as chemical parameters, were investigated quarterly in the HRB, and the impacts of environmental variables on macroinvertebrate assemblages were determined clearly. Our results showed that the benthic community structure showed significant spatial and temporal heterogeneity along the different pollutant levels, but it was always dominated by gastropoda and insecta throughout the year. Dominant species in the studied area were B. aeruginosa, Caridina, Cricotopus, E. thienemann, Orthocladius, and Baetis. Community–environment relationships were analyzed by a combination of SOM and CCA, indicating that TN and NH3-N in water and Hg, As, Cd, and Zn in sediments were the main factors structuring the community. Meanwhile, results also revealed that heavy metals in sediments explained a larger part of the variation in the benthic community structure as compared to other water parameters. Hence, these main factors could be listed as priority pollutants for river ecological management in the HRB, and macroinvertebrate assemblages could also be used as a biomonitoring tool to better assess water quality in the river system.
Author Contributions
Conceptualization, X.L. and W.S.; Methodology, X.L. and K.C.; Software, X.L.; Validation, X.L., K.C. and W.S.; Formal Analysis, X.L.; Investigation, X.L., M.W., K.C. and L.W.; Resources, W.S.; Data Curation, W.S.; Writing-Original Draft Preparation, X.L.; Writing-Review & Editing, J.Z.; Visualization, X.L. and J.Z.; Supervision, W.S.; Project Administration, W.S. and K.C.; Funding Acquisition, W.S.
Funding
This research was funded by National Natural Science Foundation of China (51425902, 91547206) and the National Water Pollution Control and Treatment Major Science and Technology Project (2014ZX07204-006-01) and the Special Fund for Scientific Research in the Public Interest (201501007).
Conflicts of Interest
The authors declare no conflict of interest.
References
- Fullerton, A.H.; Burnett, K.M.; Steel, E.A.; Flitcroft, R.L.; Pess, G.R.; Feist, B.E.; Torgersen, C.E.; Miller, D.J.; Sanderson, B.L. Hydrological connectivity for riverine fish: Measurement challenges and research opportunities. Freshw. Biol. 2010, 55, 2215–2237. [Google Scholar] [CrossRef]
- Islam, M.S.; Ahmed, M.K.; Raknuzzaman, M.; Habibullah-Al-Mamun, M.; Islam, M.K. Heavy metal pollution in surface water and sediment: A preliminary assessment of an urban river in a developing country. Environ. Int. 2015, 48, 282–291. [Google Scholar] [CrossRef]
- Gordon, L.J.; Finlayson, C.M.; Falkenmark, M. Managing water in agriculture for food production and other ecosystem services. Agric. Water Manag. 2010, 97, 512–519. [Google Scholar] [CrossRef]
- Pan, B.Z.; Wang, Z.Y.; Xu, M.Z.; Xing, L.H. Relation between stream habitat conditions and macroinvertebrate assemblages in three Chinese rivers. Quat. Int. 2012, 282, 178–183. [Google Scholar] [CrossRef]
- Tang, T.; Cai, Q.H.; Liu, R.Q.; Xie, Z.C. Distribution of epilithic algae in the Xiangxi River system and their relationships with environmental factors. J. Freshw. Ecol. 2002, 17, 345–352. [Google Scholar] [CrossRef]
- Yi, Y.J.; Yang, Z.F.; Zhang, S.H. Ecological risk assessment of heavy metals in sediment and human health risk assessment of heavy metals in fishes in the middle and lower reaches of the Yangtze River basin. Environ. Pollut. 2011, 159, 2575–2585. [Google Scholar] [CrossRef] [PubMed]
- Carlson, P.E.; Johnson, R.K.; Mckie, B.G. Optimizing stream bioassessment: Habitat, season, and the impacts of land use on benthic macroinvertebrates. Hydrobiologia 2013, 704, 363–373. [Google Scholar] [CrossRef]
- Hilton, J.; O’Hare, M.; Bowes, M.J. How green is my river? A new paradigm of eutrophication in rivers. Sci. Total Environ. 2006, 365, 66–83. [Google Scholar] [CrossRef]
- Roig, N.; Sierra, J.; Ortiz, J.D.; Merseburger, G.; Schuhmacher, M.; Domingo, J.L.; Nada, M. Integrated study of metal behavior in Mediterranean stream ecosystems: A case-study. J. Hazard. Mater. 2013, 263, 122–130. [Google Scholar] [CrossRef]
- Zhang, M.; Shao, M.L.; Xu, Y.Y.; Cai, Q.H. Effect of hydrological regime on the macroinvertebrate community in Three-Gorges Reservoir, China. Quat. Int. 2010, 226, 129–135. [Google Scholar] [CrossRef]
- Grill, G.; Dallaire, C.O.; Chouinard, E.F.; Sindorf, N.; Lehner, B. Development of new indicators to evaluate river fragmentation and flow regulation at large scales: A case study for the Mekong River Basin. Ecol. Indic. 2014, 45, 148–159. [Google Scholar] [CrossRef]
- Suresh, G.; Ramasamy, V.; Meenakshisundaram, V.; Venkatachalapathy, R.; Ponnusamy, V. Influence of mineralogical and heavy metal composition on natural radionuclide contents in the river sediments. Appl. Radiat. Isot. 2011, 69, 1466–1474. [Google Scholar] [CrossRef] [PubMed]
- Su, L.Y.; Liu, J.L.; Christensen, P. Spatial distribution and ecological risk assessment of metals in sediments of Baiyangdian wetland ecosystem. Ecotoxicity 2011, 20, 1107–1116. [Google Scholar] [CrossRef] [PubMed]
- Li, C.; Song, C.W.; Yin, Y.Y.; Sun, M.H.; Tao, P.; Shao, M.H. Spatial distribution and risk assessment of heavy metals in sediments of Shuangtaizi estuary. China Mar. Pollut. Bull. 2015, 98, 358–364. [Google Scholar] [CrossRef] [PubMed]
- Colas, F.; Vigneron, A.; Felten, V.; Devin, S. The contribution of a niche-based approach to ecological risk assessment: Using macroinvertebrate species under multiple stressors. Environ. Pollut. 2014, 185, 24–34. [Google Scholar] [CrossRef] [PubMed]
- Virtanen, L.K.; Soininen, J. Temporal variation in community–environment relationships and stream classifications in benthic diatoms: Implications for bioassessment. Limnologica 2016, 58, 11–19. [Google Scholar] [CrossRef]
- Fu, J.; Zhao, C.P.; Luo, Y.P.; Liu, C.S.; Kyzas, G.Z.; Luo, Y.; Zhao, D.Y.; An, S.Q.; Zhu, H.L. Heavy metals in surface sediments of the Jialu River, China: Their relations to environmental factors. J. Hazard. Mater. 2014, 270, 102–109. [Google Scholar] [CrossRef]
- Keizer-Vlek, H.E.; Verdonschot, P.F.M.; Verdonschot, R.C.M.; Goedhart, P.W. Quantifying spatial and temporal variability of macroinvertebrate metrics. Ecol. Indic. 2012, 23, 384–393. [Google Scholar] [CrossRef]
- Hussain, Q.A.; Pandit, A.K. Macroinvertebrates in streams: A review of some ecological factors. Int. J. Fish. Aquacult. 2012, 4, 114–123. [Google Scholar]
- Teferi, E.; Uhlenbrook, S.; Bewket, W.; Wenninger, J.; Simane, B. The use of remote sensing to quantify wetland loss in the Choke Mountain range, Upper Blue Nile basin, Ethiopia. Hydrol. Earth Syst. Sci. 2010, 14, 2415–2428. [Google Scholar] [CrossRef] [Green Version]
- Gray, N.F.; Delaney, E. Comparison of benthic macroinvertebrate indices for the assessment of the impact of acid mine drainage on an Irish river below an abandoned Cu-S mine. Environ. Pollut. 2008, 155, 31–40. [Google Scholar] [CrossRef]
- Giorgio, A.; Bonis, S.D.; Guida, M. Macroinvertebrate and diatom communities as indicators for the biological assessment of river Picentino (Campania, Italy). Ecol. Indic. 2016, 64, 85–91. [Google Scholar] [CrossRef]
- Xia, J.; Zhang, Y.Y.; Zhan, C.S.; Ye, A.Z. Water quality management in China: The case of the Huai River Basin. Int. J. Water Resour. Dev. 2011, 27, 167–180. [Google Scholar] [CrossRef]
- Liu, C.M.; Zhao, C.S.; Xia, J.; Sun, C.L.; Wang, R.; Liu, T. An instream ecological flow method for data-scarce regulated rivers. J. Hydrol. 2011, 398, 17–25. [Google Scholar] [CrossRef]
- Kagalou, I.I.; Kosiori, A.; Leonardos, I.D. Assessing the zooplankton community and environmental factors in a Mediterranean wetland. Environ. Monit. Assess. 2010, 170, 445–455. [Google Scholar] [CrossRef] [PubMed]
- Zhai, X.Y.; Xia, J.; Zhang, Y.Y. Water quality variation in the highly disturbed Huai River Basin, China from 1994 to 2005 by multi-statistical analyses. Sci. Total Environ. 2014, 496, 594–606. [Google Scholar] [CrossRef]
- Wang, J.; Liu, G.J.; Lu, L.L. Geochemical normalization and assessment of heavy metals (Cu, Pb, Zn, and Ni) in sediments from the Huaihe River, Anhui, China. Catena 2015, 129, 30–38. [Google Scholar] [CrossRef]
- Kawai, T. An Illustrated Book of Aquatic Insects of Japan; Tokai Univ. Press: Tokyo, Japan, 1985. [Google Scholar]
- Kang, S.C. Ephemeroptera of Taiwan (Excluding Baetidae); National Chung Hsing University: Taichung, Taiwan, 1993. [Google Scholar]
- Morse, J.C.; Yang, L.F.; Tian, L.X. (Eds.) Aquatic Insects of China Useful for Monitoring Water Quality; Hohai University Press: Nanjing, China, 1994. [Google Scholar]
- Merritt, R.W.; Cummins, K.W.; Berg, M.B. An Introduction to the Aquatic Insects of North America, 4th ed.; Kendall/Hunt Publishing Company: Dubuque, IA, USA, 2008. [Google Scholar]
- Kohonen, T. Self-organized formation of topologically correct feature maps. Biol. Cybern. 1982, 43, 59–69. [Google Scholar] [CrossRef]
- Chon, T.S. Self-Organizing Maps applied to ecological sciences. Ecol. Inf. 2011, 6, 50–61. [Google Scholar] [CrossRef]
- Park, Y.S.; Chon, T.S.; Kwak, I.S.; Lek, S. Hierarchical community classification and assessment of aquatic ecosystems using artificial neural networks. Sci. Total Environ. 2004, 327, 105–122. [Google Scholar] [CrossRef] [PubMed]
- Li, F.Q.; Cai, Q.H.; Qu, X.D. Characterizing macroinvertebrate communities across China: Large-scale implementation of a self-organizing map. Ecol. Indic. 2012, 23, 394–401. [Google Scholar] [CrossRef]
- Vesanto, J.; Himberg, J.; Alhoniemi, E.; Parhankangas, J. SOM Toolbox for Matlab 5. Technical Report A57; Neural Networks Research Centre, Helsinki University of Technology: Helsinki, Finland, 2000. [Google Scholar]
- Park, Y.S.; Tison, J.; Lek, S.; Giraudel, J.L.; Coste, M.; Delmas, F. Application of a self-organizing map to select representative species in multivariate analysis: A case study determining diatom distribution patterns across France. Ecol. Inf. 2006, 1, 247–257. [Google Scholar] [CrossRef]
- Park, Y.S.; Céréghino, R.; Compin, A.; Lek, S. Applications of artificial neural networks for patterning and predicting aquatic insect species richness in running waters. Ecol. Model. 2003, 60, 265–280. [Google Scholar] [CrossRef]
- Song, M.Y.; Hwang, H.J.; Kwak, I.S. Self-organizing mapping of benthic macroinvertebrate communities implemented to community assessment and water quality evaluation. Ecol. Model. 2007, 203, 18–25. [Google Scholar] [CrossRef]
- ter Braak, C.J.F.; Smilauer, P. CANOCO Reference Manual and CanocoDraw for Windows User’s Guide: Software for Canonical Community Ordination (version 4.5); Centre for Biometry: Wageningen, the Netherlands, 2002. [Google Scholar]
- Mereta, S.T.; Boets, P.; Bayih, A.A. Analysis of environmental factors determining the abundance and diversity of macroinvertebrate taxa in natural wetlands of Southwest Ethiopia. Ecol. Inf. 2012, 7, 52–61. [Google Scholar] [CrossRef]
- Khadse, G.K.; Patni, P.M.; Kelkar, P.S.; Devotta, S. Qualitative evaluation of Kanhan river and its tributaries flowing over central Indian plateau. Environ. Monit. Assess. 2008, 147, 83–92. [Google Scholar] [CrossRef]
- Lehner, B.; Reidy Liermann, C.; Revenga, C.; Vörösmarty, C.; Fekete, B.; Crouzet, P.; Döll, P.; Endejan, M.; Frenken, K.; Magome, J.; et al. High-resolution mapping of the world’s reservoirs and dams for sustainable river-flow management. Front. Ecol. Environ. 2011, 9, 494–502. [Google Scholar] [CrossRef]
- Suthar, S.; Nema, A.K.; Chabukdhare, M.; Gupta, S.K. Assessment of metals in water and sediments of Hindon River, India: Impact of industrial and urban discharge. J. Hazard. Mater. 2009, 171, 1088–1095. [Google Scholar] [CrossRef]
- Zamora-Muñoz, C.; Sáinz-Cantero, C.E.; Sánchez-Ortega, A.; Alba-Tercedor, J. Are biological indices BMPW’ and ASPT’ and their significance regarding water quality seasonally dependent? Factors explaining their variations. Water Res. 1995, 29, 285–290. [Google Scholar] [CrossRef]
- Wolfram, G.; Höss, S.; Orendt, C.; Schmitt, C.; Adámek, Z.; Bandow, N.; Großschartner, M.; Kukkonen, J.V.K.; Leloup, V.; López Doval, J.C.; et al. Assessing the impact of chemical pollution on benthic invertebrates from three different European rivers using a weight-of-evidence approach. Sci. Total Environ. 2012, 438, 498–509. [Google Scholar] [CrossRef]
- Leland, H.V.; Porter, S.D. Distribution of benthic algae in the upper Illinois River basin in relation to geology and land use. Freshw. Biol. 2000, 44, 279–301. [Google Scholar] [CrossRef]
- Wang, X.; Tan, X. Macroinvertebrate community in relation to water quality and riparian land use in a substropical mountain stream, China. Environ. Sci. Pollut. Res. Int. 2017, 3, 1–8. [Google Scholar] [CrossRef] [PubMed]
- Zhang, L.L.; Liu, J.L. Relationships between ecological risk indices for metals and benthic communities metrics in a macrophyte-dominated lake. Ecol. Indic. 2014, 40, 162–174. [Google Scholar] [CrossRef]
- Iwasaki, Y.; Ormerod, S.J. Estimating safe concentrations of trace metals from inter-continental field data on river macroinvertebrates. Environ. Pollut. 2012, 166, 182–186. [Google Scholar] [CrossRef]
- Martins, R.J.E.; Pardob, R.; Boaventura, R.A.R. Cadmium (II) and zinc (II) adsorption by the aquatic moss Fontinalis antipyretica: Effect of temperature, pH and water hardness. Water Res. 2004, 38, 693–699. [Google Scholar] [CrossRef] [PubMed]
- Michailova, P.; Warchalowska-Śliwa, E.; Szarek-Gwiazda, E.; Kownacki, A. Does biodiversity of macroinvertebrates and genome response of Chironomidae larvae (Diptera) reflect heavy metal pollution in a small pond? Environ. Monit. Assess. 2012, 184, 1–14. [Google Scholar] [CrossRef] [PubMed]
- Bian, B.; Zhou, Y.; Fang, B.B. Distribution of heavy metals and benthic macroinvertebrates: Impacts from typical inflow river sediments in the Taihu Basin, China. Ecol. Indic. 2016, 69, 348–359. [Google Scholar] [CrossRef]
- Bere, T.; Dalu, T.; Mwedzi, T. Detecting the impact of heavy metal contaminated sediment on benthic macroinvertebrate communities in tropical streams. Sci. Total Environ. 2016, 572, 147–156. [Google Scholar] [CrossRef]
Figure 1.
Location of study area, distribution of the sampling sites for the benthic community and environmental variables in the mainstream and other three important tributaries of the Huai River basin (HRB).
Figure 1.
Location of study area, distribution of the sampling sites for the benthic community and environmental variables in the mainstream and other three important tributaries of the Huai River basin (HRB).

Figure 2.
The temporal variations of environmental variables, including water quality and heavy metals pollution, in sediments at 27 monitoring stations of Huai River basin in the year 2014–2015.
Figure 2.
The temporal variations of environmental variables, including water quality and heavy metals pollution, in sediments at 27 monitoring stations of Huai River basin in the year 2014–2015.

Figure 3.
Nonparametric multidimensional scaling (NMDS) ordination of sampling sites based on the relative abundance data of benthic macroinvertebrates across different seasons.
Figure 3.
Nonparametric multidimensional scaling (NMDS) ordination of sampling sites based on the relative abundance data of benthic macroinvertebrates across different seasons.

Figure 4.
Macroinvertebrate communities of the Huai River basin sampled on summer (a), autumn (b), winter (c), and spring (d) in the year 2014–2015. Vertical bars represent relative abundances of each taxon from all sites in the study region, with the five most abundant taxa labeled. Solid lines depict the asymptotic nature of cumulative relative abundance in these communities (right-hand axis). Pie graphs show the composition of macroinvertebrates among classes based on the number of taxa. The small pie graphs show the detailed composition of Insecta among orders.

Figure 5.
Seasonal changes of macroinvertebrate density and biomass (a), the percentage of different components in density (b), and biomass (c) in the typical reaches of the Huai River basin. The ind. represents individuals.
Figure 5.
Seasonal changes of macroinvertebrate density and biomass (a), the percentage of different components in density (b), and biomass (c) in the typical reaches of the Huai River basin. The ind. represents individuals.

Figure 6.
(a): distribution and clustering of samples on the self-organizing map (SOM) according to the abundance of 72 macroinvertebrate taxa. Codes within each hexagon correspond to individual samples (S: summer, A: autumn, W: winter, P: spring, 01–27 sampling stations) which were derived from the k-means algorithm applied to the weights of the 72 taxa in the 60 output neurons of the SOM; (b): profile of abundance of the prevalent taxa matched to clusters based on the trained SOM. The values in the vertical bar indicate densities (individuals/m2).

Figure 7.
Visualization of environmental variables in waters and sediments. The mean value for each variable was calculated in each output neuron of the SOM previously trained with macroinvertebrate data.
Figure 7.
Visualization of environmental variables in waters and sediments. The mean value for each variable was calculated in each output neuron of the SOM previously trained with macroinvertebrate data.

Figure 8.
Ordination diagram of canonical correspondence analysis (CCA) on species abundances and selected environmental variables in the typical reaches of the Huai River basin (some high abundance species are marked on the diagram).
Figure 8.
Ordination diagram of canonical correspondence analysis (CCA) on species abundances and selected environmental variables in the typical reaches of the Huai River basin (some high abundance species are marked on the diagram).

© 2019 by the authors. Licensee MDPI, Basel, Switzerland. This article is an open access article distributed under the terms and conditions of the Creative Commons Attribution (CC BY) license (http://creativecommons.org/licenses/by/4.0/).
Share and Cite
MDPI and ACS Style
Liu, X.; Zhang, J.; Shi, W.; Wang, M.; Chen, K.; Wang, L. Priority Pollutants in Water and Sediments of a River for Control Basing on Benthic Macroinvertebrate Community Structure. Water 2019, 11, 1267. https://doi.org/10.3390/w11061267
AMA Style
Liu X, Zhang J, Shi W, Wang M, Chen K, Wang L. Priority Pollutants in Water and Sediments of a River for Control Basing on Benthic Macroinvertebrate Community Structure. Water. 2019; 11(6):1267. https://doi.org/10.3390/w11061267
Chicago/Turabian StyleLiu, Xiang, Jin Zhang, Wenqing Shi, Min Wang, Kai Chen, and Li Wang. 2019. "Priority Pollutants in Water and Sediments of a River for Control Basing on Benthic Macroinvertebrate Community Structure" Water 11, no. 6: 1267. https://doi.org/10.3390/w11061267
Note that from the first issue of 2016, this journal uses article numbers instead of page numbers. See further details here.