Comparative Analysis of Splash Erosion Devices for Rainfall Simulation Experiments: A Laboratory Study


1
Department of Applied Physics, University of Leon, 24071 León, Spain
2
Department of Environmental Quality and Soil, Desertification Research Centre-CIDE (CSIC, UV. GV), 46113 Valencia, Spain
3
Instituto de Geomorfología y Suelos, Department of Geography, University of Málaga, 29071 Málaga, Spain
4
Wageningen Environmental Research, Team Soil, Water and Land Use, P.O. Box 47, 6700AA Wageningen, The Netherlands
5
Civil, Surveying and Environmental Engineering, The University of Newcastle, Callaghan, NSW 2308, Australia
*
Author to whom correspondence should be addressed.
Water 2019, 11(6), 1228; https://doi.org/10.3390/w11061228
Submission received: 24 May 2019
/
Revised: 6 June 2019
/
Accepted: 10 June 2019
/
Published: 12 June 2019
(This article belongs to the Special Issue The Effect of Hydrology on Soil Erosion)
Abstract
:For the study of soil erosion it is important to set up the experiments well. In the experimental design one of the key factors is the choice of the measurement device. This is especially important when one part of the erosion process needs to be isolated, such as for splash erosion. Therefore, the main aim of this research is to list the general characteristics of the commonly used splash erosion devices and to discuss the performance, to be able to relate them, and make suggestions regarding their use. The devices we selected for this comparative comparison were: the splash cup, funnel, Morgan tray, Tübingen cup, tower, and the gutter. The devices were tested under the same conditions (rainfall characteristics, slope, and soil type) to assess their hydrological response under different intensities of simulated rainfall. All devices were installed on a sloping plot (10°) with sandy soil, and were exposed to 10 min. of simulated rain with intensities ranging from 60 to 172 mm/h to measure the splashed sediment, and to describe problems and differences among them. The results showed that the Tübingen cup was the best performing device to measure kinetic energy of the rain, but, because of its design, it is not possible to measure the detached splashed sediment under natural (field) conditions. On the other hand, the funnel device showed a significant relation with rain intensity because it loses little sediment to washing. In addition, the device is easy to use and cheap. Therefore, this device is highly recommended to estimated splash erosion. to the good performance measuring the actual splash erosion, because it loses little sediment by washing. The device is also cheap and easy to install and manage.
1. Introduction
Splash erosion is the process of detachment of soil particles due to the impact of falling raindrops, and the deposit of those particles on adjacent sites [1,2,3]. Splash erosion is the first mechanism of soil erosion, and it is the one that produces most of the detachment work [4], and it affects other processes, such as infiltration [5], soil water repellency [6], overland flow [7], roughness [8], and the final soil erosion rates [9], as it changes the soil surface characteristics. The splash erosion process initiates movements that are concentrated at the surface and it affects the composition of the material on the soil, such as minerals and organic particles [10]. As a result, the transported material could be even rich in organic carbon [11], with splash erosion being one of the key factors that are responsible for the redistribution of the minerals on the soil surface [12]; however, the microtopography should be also considered as the key factor for soil erosion on small scales [13,14].
In arid and semi-arid areas, splash erosion also plays a major role in forming the landscape due to the control that exerts on shaping the landforms [15,16]. This is because the bare soils allow for the raindrop impact to develop a crust, and then to enhance surface runoff generation, which is a key process in the Mediterranean and temperate areas, such as Spain [17], Italy [18,19], Israel [20], or Iran [21]. The kinetic energy of the raindrops is responsible for breaking up soil aggregates and finer materials, such as fine sand, silt, clay, and organic particles that are detached by raindrops are carried away by runoff, leaving larger sand grains, pebbles, and gravel behind [22]. On a flat surface, the fine particles may clog up pores and facilitate ponding [23]. However, if the area is on a steep slope, the water that did not infiltrate may flow downslope as sheet erosion [24,25], carrying the soil particles that have been loosened by the raindrop impacts away [26]. Hills and ridges that are shaped by splash erosion use tend to have gently rounded tops that are very different from the sharper profiles that are created by other forms of water erosion [27].
Research in erosion processes is time-consuming and expensive [28]. To be effective, the erosion measurements should be precise, controlled, and replicable, and erosion measurement devices should be properly designed, constructed, well calibrated, and they also should be operated by a trained researcher or technician to assure effectiveness, [29]. The equipment is constantly redesigned, making the measurements not comparable and furthermore, creating a lack of available standardized devices because researchers try to improve old devices [30]. This lack of standardization is especially important in the case of splash erosion, as it is, by nature, a complex mechanism that is key for understanding soil erosion processes [31]. Moreover, it is very difficult to isolate the measurements of splash erosion from those of sheet and rill surface erosion since they all interact [32]. In general, soil erosion rates that are measured under simulated and natural rainfall by means of plots, erosion pins, silt fences, or flumes [33,34] can measure the soil erosion processes, but they cannot detect the individual mechanisms: splash, sheet surface wash, and rill flow. The information that is generated from experiments that separate individual soil erosion mechanisms, such as the one developed here, will be very effective in producing soil erosion models to foresee the soil loss changes in time and space.
There are many different types of devices that claim to measure splash erosion, and the number increases due to the contribution of new ideas. The objective of these changes in the designs are improving the sensitivity of the device with a little amount of splash erosion or changes in erosivity and precision shown in the standard deviation of the measurements under the same conditions [3]. However, all of the designs show important measurement limitations, which are yet to be well quantified. As a result, the research on splash erosion involves a high variability that is related to the different locations of the studies (i.e., soil and weather characteristics) and the different devices used for measurement (different design for reception and accumulation of the sample), which makes any comparison very difficult.
Within the devices that are used to characterize splash erosion, the first classification that can be made is whether the device is unbounded or bounded, depending on which surface the splashed sediment originates [3]. Bounded devices have a specific surface that is used to assess the soil erodibility, while the unbounded devices measure the amount of sediment that is received in the form of splashed sediment from the (unbounded) surrounding area. The unbounded devices that were selected for this study were: the funnel [35], the cup [36,37], and the gutter [38]. Another unbounded device, the tower of funnels, was also included in this research, although it has never been used before due to the different structure and data that can be obtained. All of the unbounded devices only measure a cumulative amount of splashed sediment (g) over the total measuring period, originated from an unknown area, which means that no traditional rate of splash (g m−2) can be determined. For the bounded devices, the most common devices selected were the Tübingen cup (Tcup) [9,39] and the Morgan tray [40,41], which allow for calculating the quantitative splash rates, because the amount of sediment can be related to a known surface.
Our hypothesis is that the measurements of the splash erosion that were obtained with any of these devices should be related by an equation to enable a good comparison of the data obtained with different splash erosion device. The main goal of this research was to compare the measurements that were obtained with six different splash erosion devices (using the same soil, slope angle, and rain characteristics), and to try to propose a relation among the obtained data that is able to help to make the results of earlier and new research comparable. Additionally, this study aims to describe the specific problems that a researcher needs to take into account when dealing with splash erosion, while paying special attention to the sensitivity, the cost, and the user-friendliness of the device.
2. Materials and Methods
2.1. Description of Selected Splash Devices
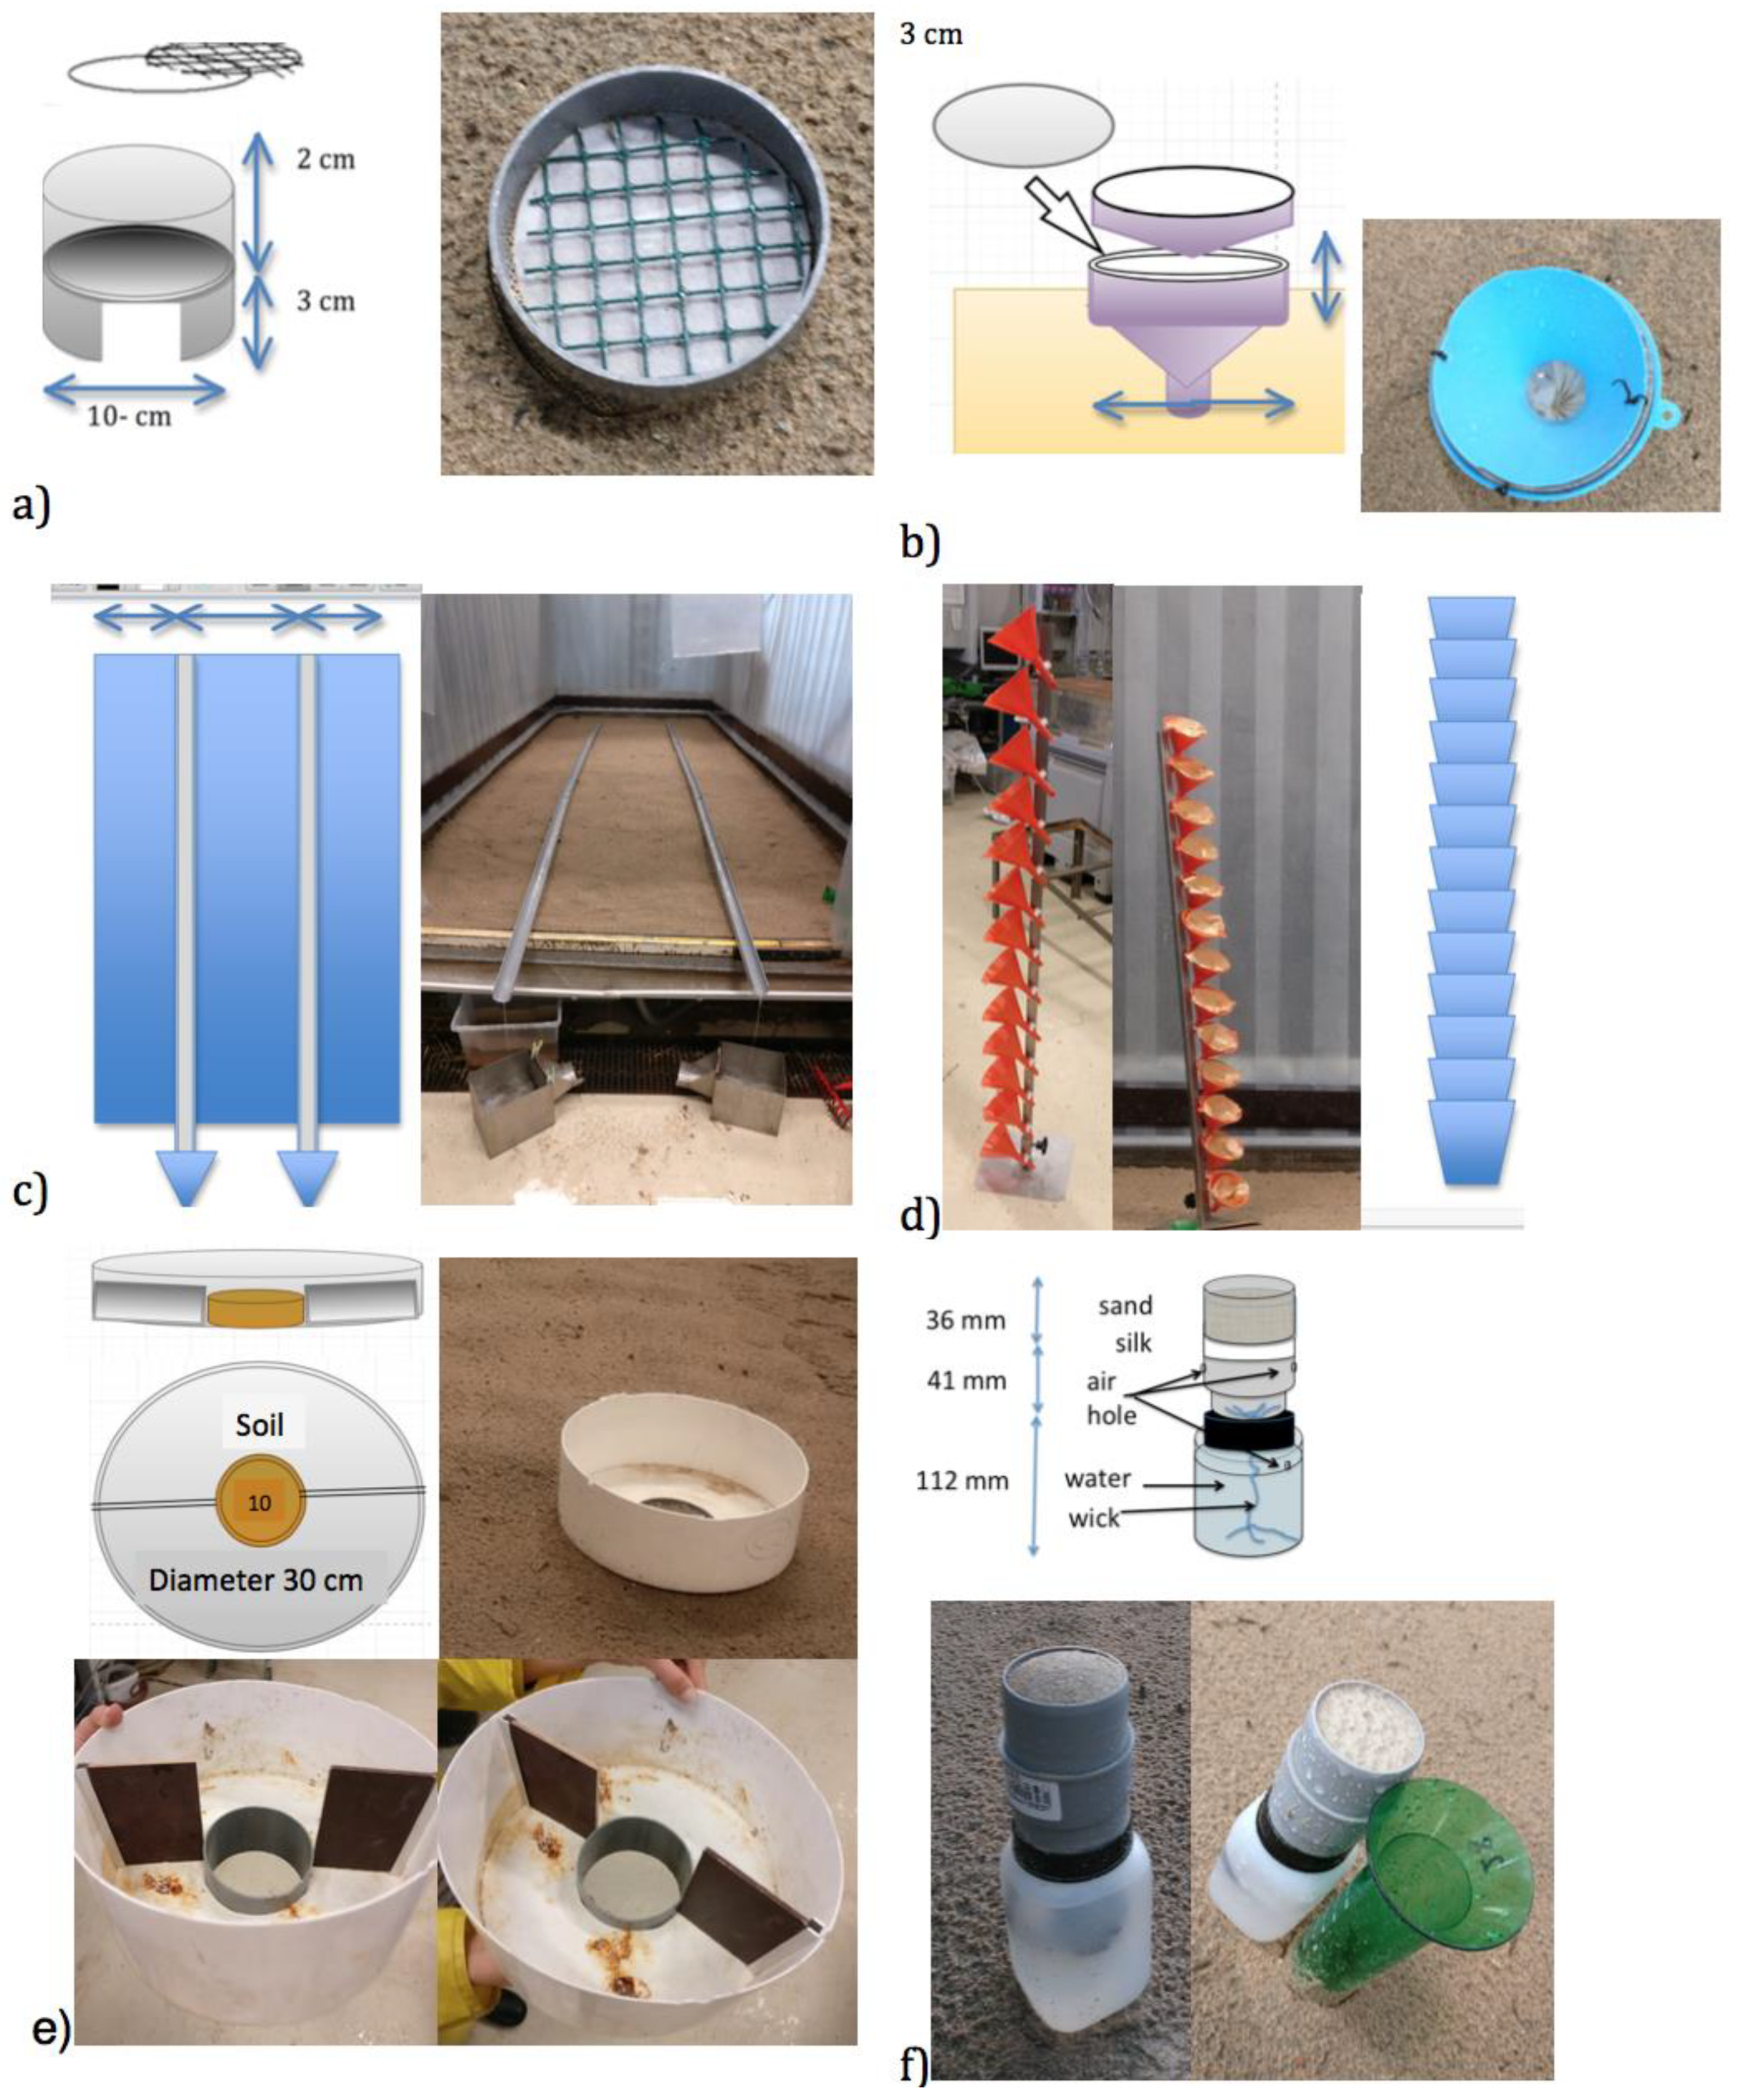
The selection of splash devices for this study intends to provide a wide representation of the main types of splash systems that are commonly used (Figure 1). Starting with the unbounded area devices, the splash cup (Figure 1a) is currently one of the most common devices to measure splash erosion [3]. It consists of an aluminium or PVC cylinder with a paper filter at 2 cm from the upper edge, placed between a metal mesh, which is fixed, and a coarser mesh on top of it. This cylinder has a standing height of 7 cm and a diameter of 10 cm, and the lower part is cut open to allow for runoff to flow freely underneath the cup. It is inserted in the ground until only 3 cm protrudes. When empty, this device usually acts as a receptor, but it could also be used to estimate erosion when it is initially filled with a known quantity of soil and the remaining amount of soil after the rain impact is measured [42]. It has a measuring area of 0.0079 m2.
The funnel device (Figure 1b) was specifically designed for minimizing the loss of particles that were already accumulated within the device by the washing out caused by raindrops that fall inside the device after the deposit of some particles [35]. It consists of a couple of piled-up funnels, with a filter paper in between that should be weighed before and after the rainfall event. The diameter of funnels is 12 cm, and they are inserted in the ground until only 3 cm protrudes. It has a measurement surface of 0.0095 m2.
The collection pipe or gutter [38] is a plastic gutter (Figure 1c) of 5.95 m long and 6.5 cm width with the upper part open, at a height of 3 cm, from the soil surface. This gutter is installed across the studied area and it allows for collecting the splashed soil particles in the lower part by filtering the water. It has a measurement area of 0.37 m2.
The tower of funnels (Figure 1d) was designed for this experiment as a device that enables the determination of the vertical transport of splash erosion. This system or the Leguédois tray only obtain this information [43]. 13 funnels that are attached to a vertical bar with an angle of 45 degrees, and the lower funnel at 7.5 cm from the surface form it. There is a filter paper inside each funnel. Each of the 13 funnels has an area of 0.011 m2.
In the group of bounded area, the Morgan tray and the Tübingen cup are the devices. The Morgan tray [44] collects all of the soil splashed from a well-defined eroding area, allowing for the calculation of the splash rate. This device (Figure 1e) consists of a 10 cm diameter cylinder that was placed directly on the soil, which is surrounded by plastic and closed circular plate of 30 cm in diameter. Raindrops impacting the bare soil surface in the inner circle detached soil particles, and later they jump over the rim and fall on the outer circle. The outer rim of the tray has a wall of 20 cm height to avoid the contamination of splashed material from the outside soil. The device has a source area of soil to be eroded of 0.0079 m2.
The Tübingen cup or Tcup [45] consists of a plastic flask that is filled with a known quantity of sand of 212.50 μm with a carrier system attached (Figure 1f). It measures the difference in weight of the sand before and after the rain, and therefore measures the splash erosion that is generated by the applied rainfall for a given particle size of quartz. A silk cover separates the flask and the carrier systems, which prevents the loss of sand and guarantees free drainage of water between the cup and the carrier. It does not estimate splash erosion rates of natural soil because it only measures the loss of sand. Nevertheless, the measurement of this sand can be related somehow to the raindrop impact on the soil or to the kinetic energy affecting the area. It has a source measuring area of 0.002 m2.
2.2. The Wageningen Rainfall Simulator
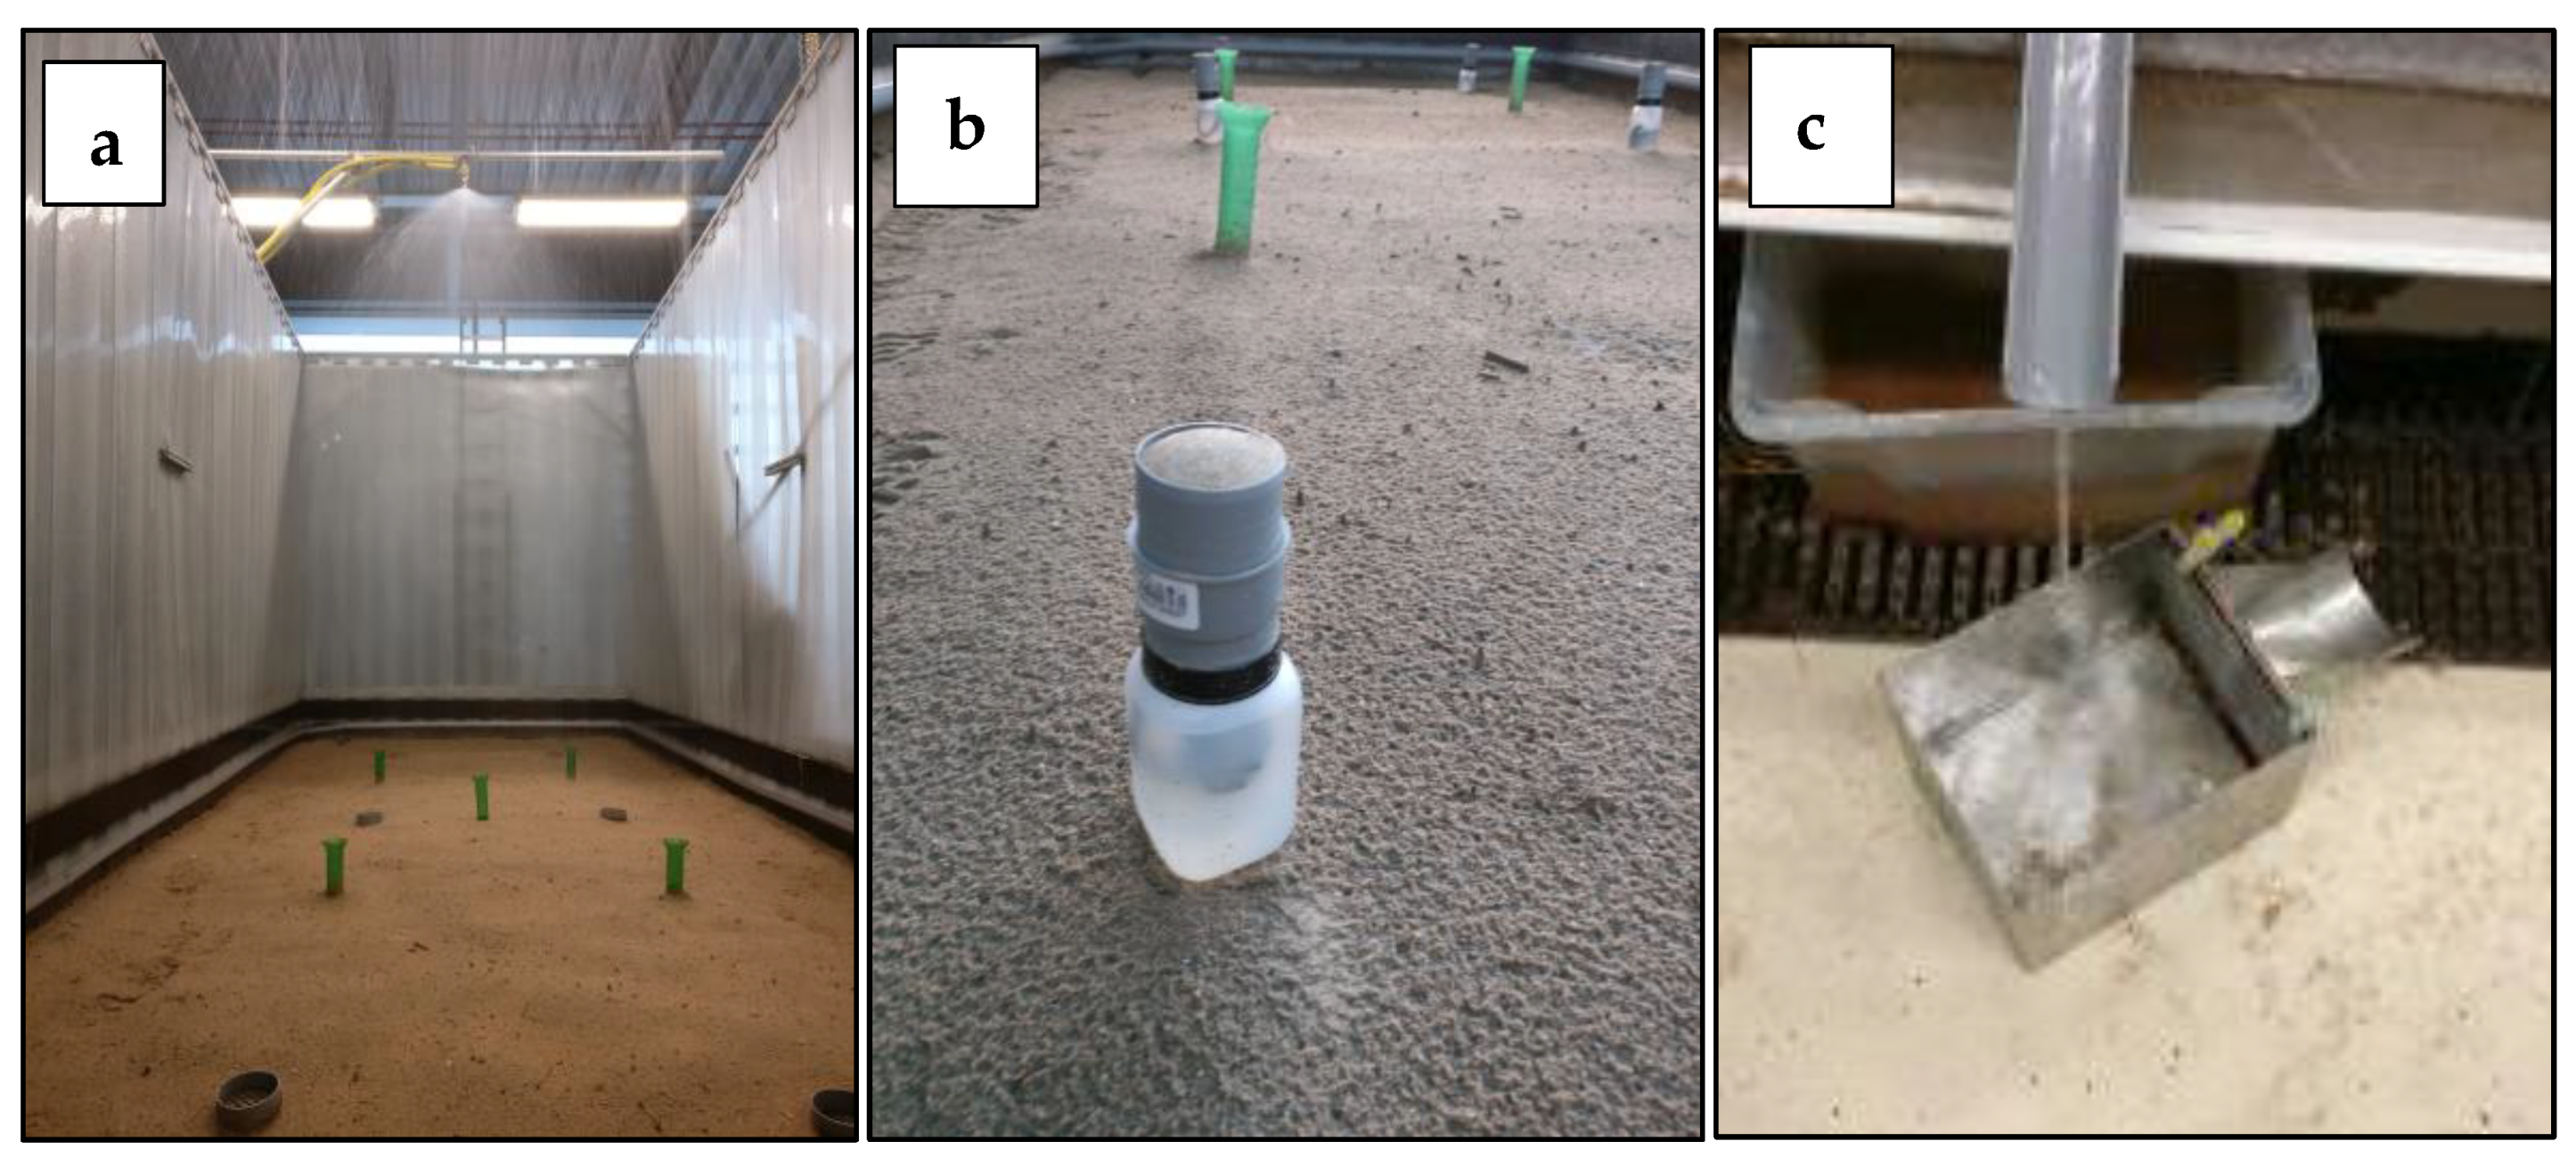
The rainfall simulator of Wageningen University and Research consists of a 6 m long and 2.5 m wide plot, with a 2.8 m high metal lateral frame (Figure 2). The rainfall is produced from two mobile central nozzles that are situated at 3.5 m height. The slope that can be adapted from 0 to 15.5° was fixed at 10° for this study. The bottom is freely drained and it is subdivided into six segments, which were covered by a permeable geotextile to allow infiltration. The plot was filled with air-dried sand 369 μm in diameter, which allows for a very constant infiltration (mini-disk infiltrometer tests done on 10 different positions showed an average value of K = 0.024 cm s−1 with a standard deviation of 0.0014) and can act as a homogenous soil source that can be splashed. The sides were covered with a plastic curtain, and a tube along the sides of the plot was installed to collect water that was dripping from the curtains.
Lassu et al. [46] extensively described the characteristics of this rainfall simulator, which is regulated by changing the pressure of the pump, the flow of the water, and the type of nozzles. In their study, Lassu et al. [46] selected two Lechler nozzles (nr. 460.788 and nr. 461.008) to produce low and high-intensity rainfall, respectively, and a pressure of 2 bars as the best conditions to work with the Wageningen simulator. Their results showed rainfall characteristics that were steady in time and reproducible. Moreover, they also found that the intensity of the rainfall slightly varies along the area, and the position of the nozzles, which is crucial for the spatial distribution of the rainfall, concentrating higher intensities under the nozzles, and lower intensities on both sides (Figure 3). The size and speed of the raindrops that were produced by the Wageningen rainfall simulator were measured using a disdrometer Thies Laser Precipitation Monitor to determine that intensities from 38 to 160 mm/h produce steadily kinetic energy values from 25.7 to 29 J m−2 mm−1. In the current study, we reproduced exactly the same conditions that in this above-mentioned research (pressure, position of the nozzles and slope), also measuring very similar intensities (60–160 mm/h with only one measurement done at 172 mm h−1), which allows for us to assume that the kinetic energy values of a hypothetical study area under extreme rainfall conditions. This will allow for obtaining the maximum potential of each studied device.
Additionally, it is important to remember that fixing a value of pressure, water flow, and specific nozzle, in this simulator, there will be one value of kinetic energy that is related to each value of intensity, because the drop size distribution (DSD) will be constant under such conditions. Drop size distribution represents the number of drops that are measured as a function of diameter in one sample [47]. This is different in the natural rain, where it is possible to obtain different kinetic energies from the same intensity due to the different DSD of rains that were more convective or stratiform [37,48].
The Wageningen rainfall simulator is very sensitive to small changes in the flow, so the intensity values in every specific experimental spot of the area were checked before and during every simulation. Additionally, a modification of the Christiansen Uniformity Coefficient (CUC) was used to assign a value of intensity to every point of the rainfall simulator area. This is a commonly used statistic for the evaluation of sprinkling systems, and a value of 80 is usually considered to be acceptable in sprinkling systems [49]. It can be calculated with Equation (1).
where CUC is the Christiansen’s Uniformity Coefficient (%), Xi is the depth (mm) or the mass of water precipitated in each collector (g), is the mean depth (mm) precipitated in the collectors, and n is the number of collecting container.
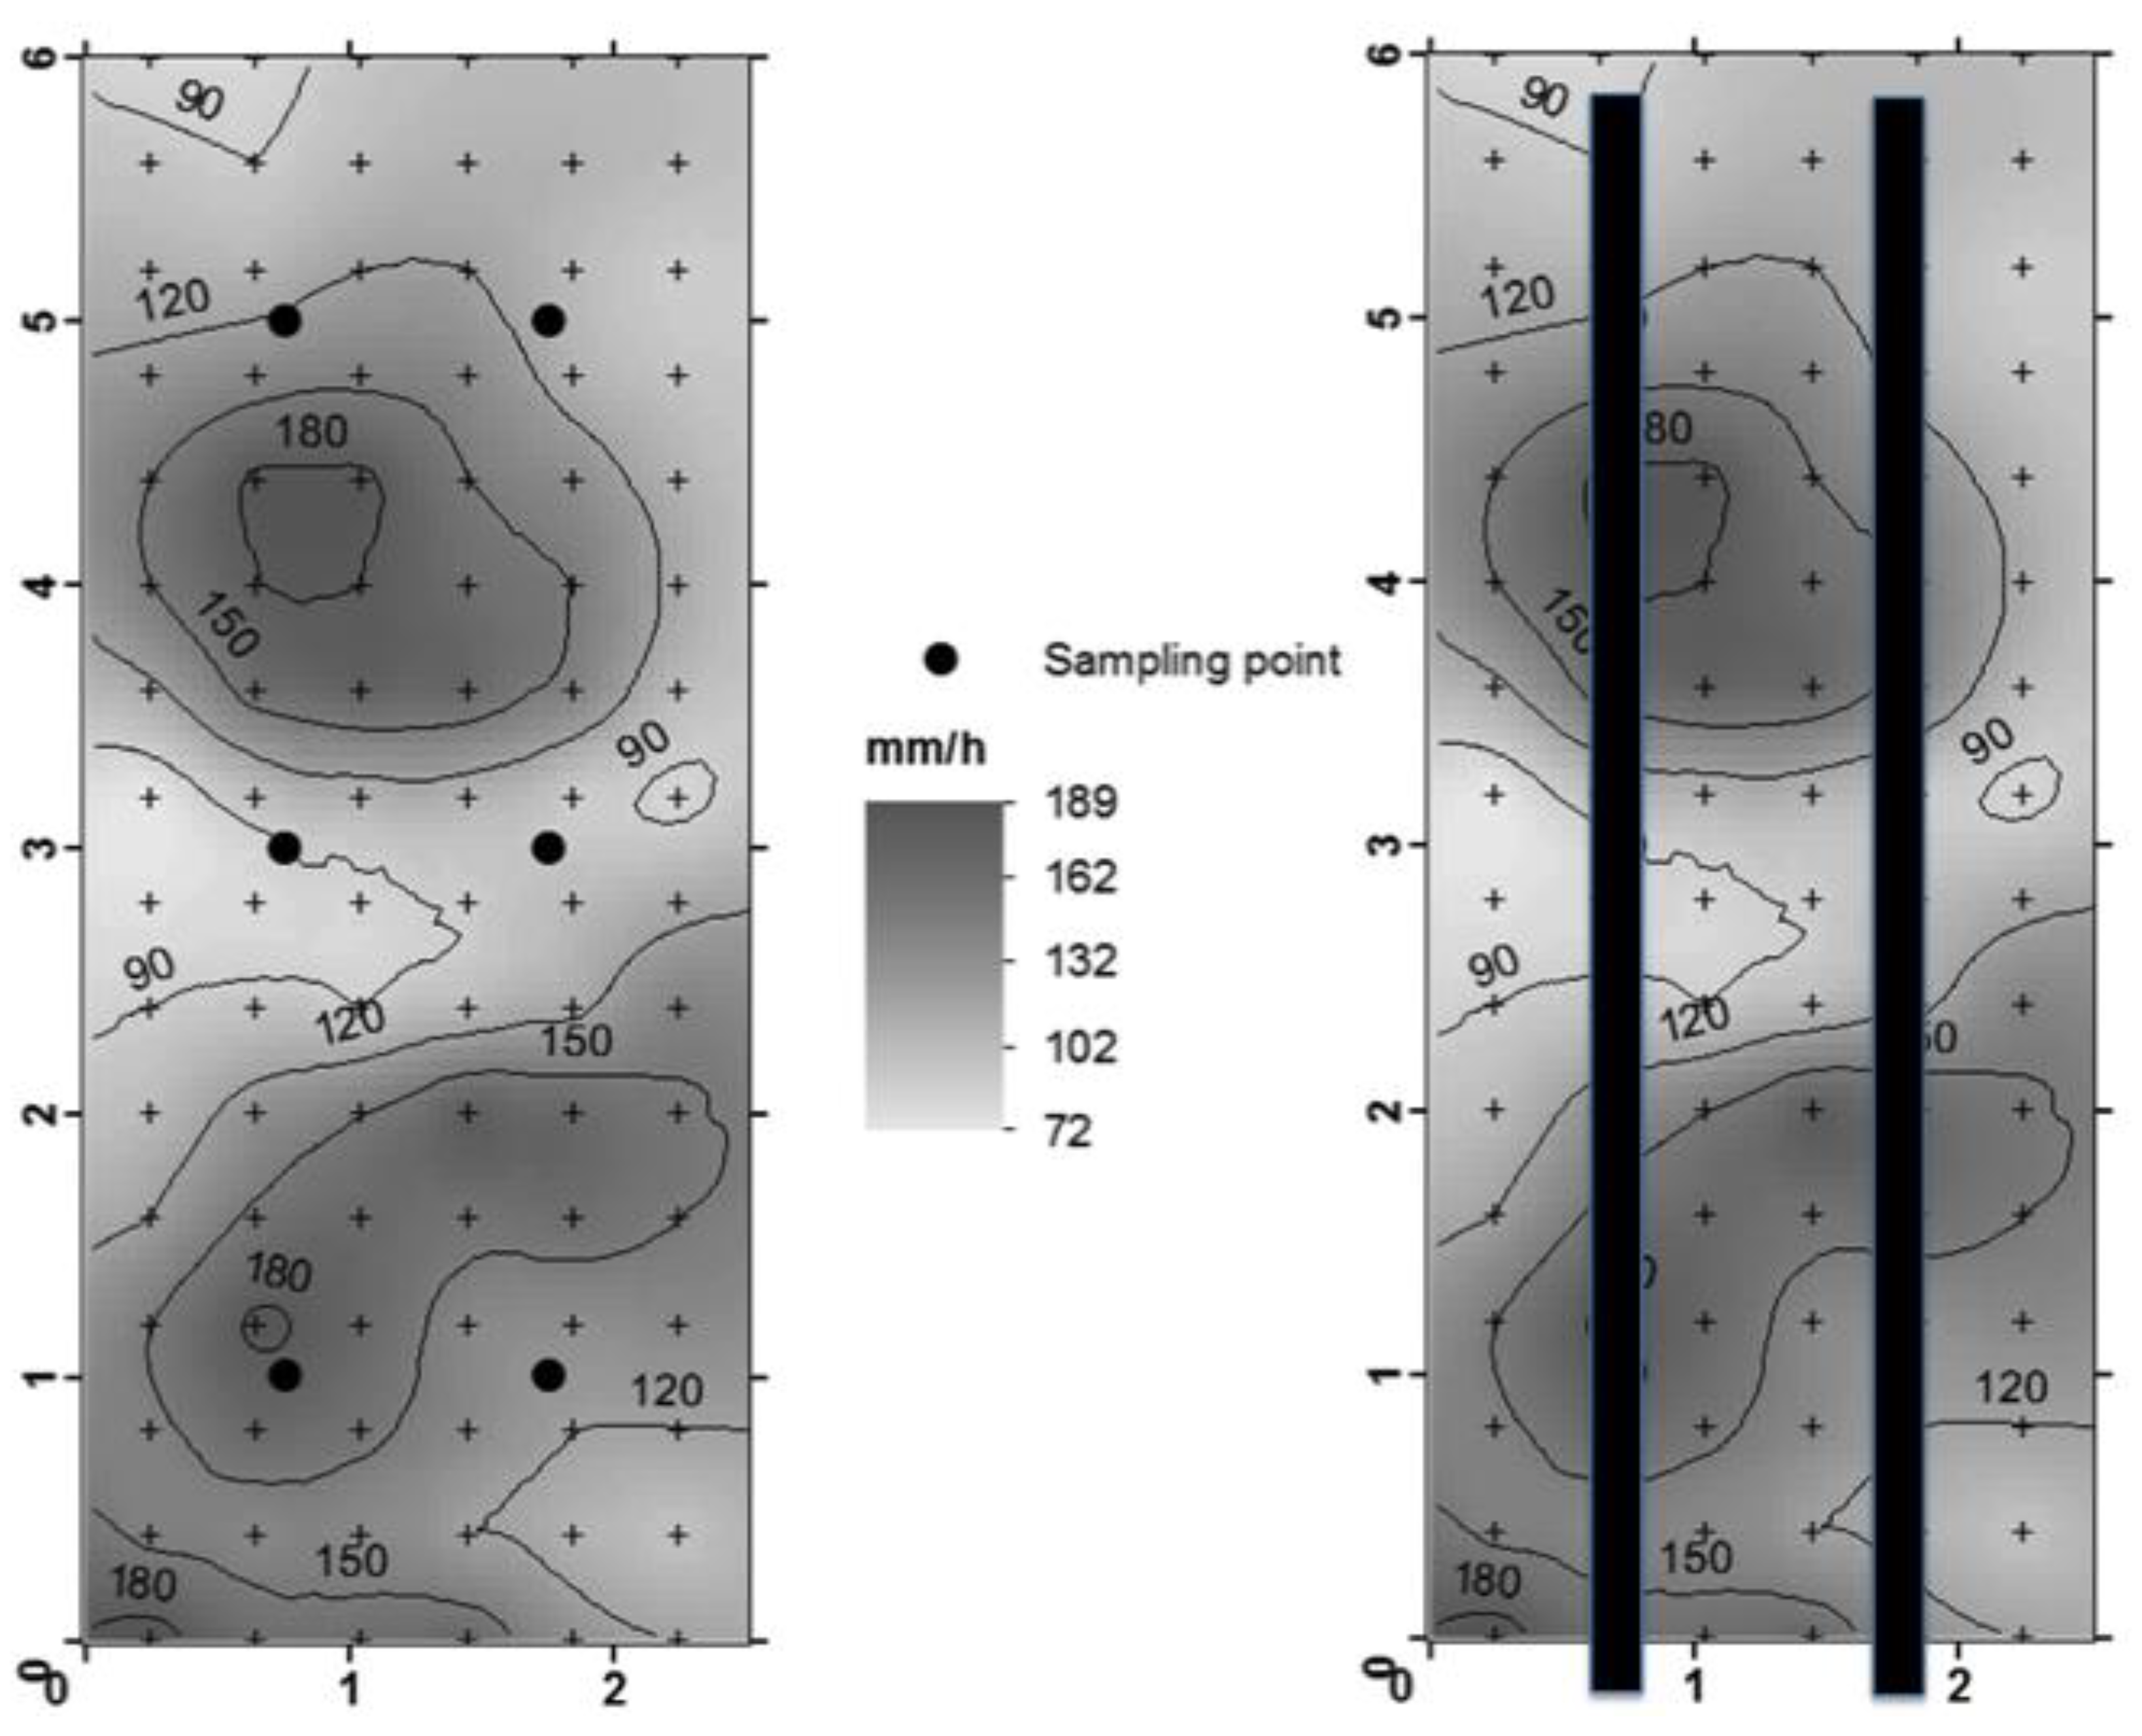
This method consists on recovering the rainfall of 10 min. with rain gauges being installed every 40 cm (96 containers along the area), obtaining the intensity in every point (Figure 3), and only in the experimental positions (places where the splash devices were settled), obtaining a mean value of uniformity of 78.9. This value was used as a reference to set the experimental spots in the experiments. However, in any case, the values of rainfall intensity in every experimental spot were measured prior using each splash device. The goal was to confirm the stability of the parameters of the simulated rainfall in these specific spots between different experiments with the rainfall simulator that is characterized by the same flux, pressure, position of the nozzles, and inclination. We measure a value directly related to the kinetic energy because the artificial drops produced by the rainfall simulator will show the same DSD and speed. The reason is that there will be one unique value of kinetic energy for each value of intensity if the rest of the parameters of the rainfall simulator stay constant (flux, pressure, the position of nozzles, and slope).
2.3. Experimental Design
The measurement of the intensity of the rain in every experimental spot before each splash-measurement was considered as one of the most important steps as the aim of this study is to compare splash devices performance. Assuring the same rainfall intensity value, no matter what the intensity value is, compared all of the used devices. Additionally, we rely on the hypothesis that a certain relationship exists between rainfall intensity and the amount of splash that is recovered by each splash erosion device; therefore, this relationship will be shown in the results that are obtained with different devices.
Accordingly, the first important step was to install a set of six splash devices of the same type in well-defined positions of the rainfall simulator area (Figure 3) and to assign a rainfall intensity value to each position. We set containers in the six positions of the devices, and measured the intensities among repetitions, previously, to assure the stability of the rainfall intensity values prior to conducting each rainfall simulation. In the case of the gutter device, because of its different design, the determination of the rain intensity was done by measuring all the squared area with the gauges while taking into account that this area was situated at the same positions of the other devices (Figure 3). The difference in the area has been taken into account and the gutter results have been independently analysed. After 10 min of simulated rain, the splashed soil was collected from each device to evaluate the differences among the measurements. The distance between devices was always larger than 1 m to avoid interferences between them following the recommendations of Geißler et al. [39].
2.4. Comparison of Measurements
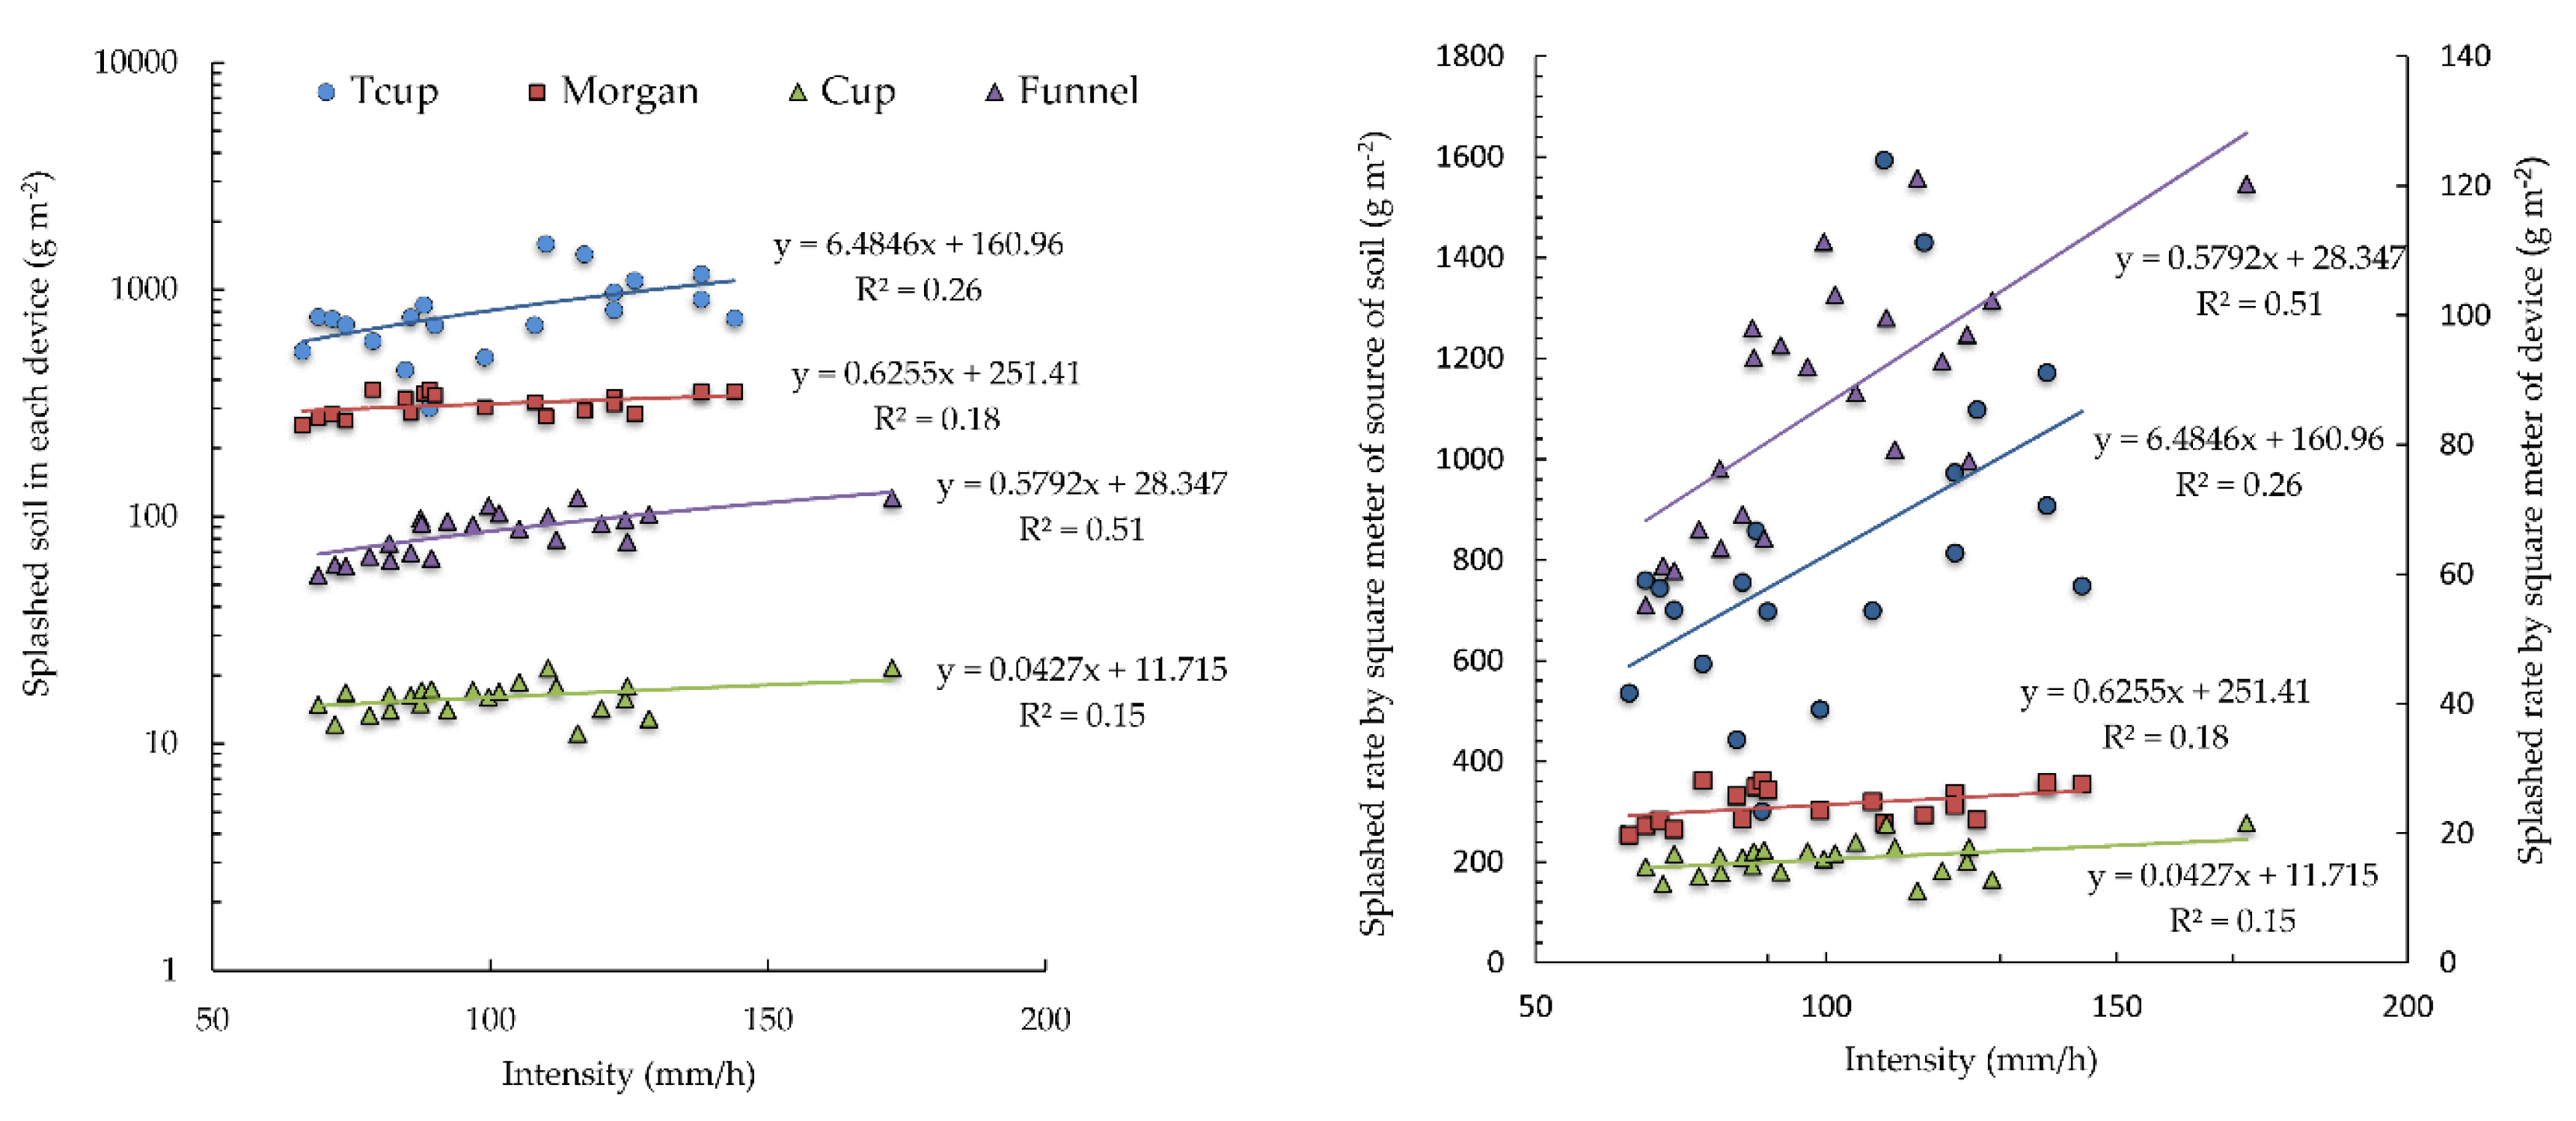
The experiments were repeated under controlled conditions, conducting at least 30 measurements with each device in order to compare the device measurements (Table 1), only varying the intensity of simulated rainfall values that were measured prior conducting each experiment in every spot. The measurements are organized in classes of 5 mm/h each, the average and deviation of splash erosion recovered in each interval of the intensity of rain can be also seen in Figure 4 (left graph).
The data that were recovered from the devices were analysed and compared based on their sensitivity and reproducibility, following the methodology that was proposed by Thomsen et al. [50]. The sensitivity is related to the response of the device to changes in the rainfall intensity. The reproducibility compares the results that were obtained with each device after several simulations using the same intensity. It is important to keep in mind that only the devices operating in a similar way can be directly compared. Accordingly, unbounded devices are compared first and bounded ones afterwards.
It is still possible to obtain the same units (g m−2) with both types of devices, being conscious of the difference in the performance of bounded and unbounded devices. Obviously, the same units do not represent the same physical process, but they allow for comparing the relation that they have with the changes in intensity.
The design of the bounded devices is generally divided into two parts: one inside, with a certain amount of soil susceptible of being eroded, and one outside, with a deposit to collect the splashed soil. This means that the soil that is collected in the outside area will come from the inner deposit, and absolutely all of the soil moved from the inside deposit to the outside deposit will be measured. Accordingly, the soil lost from the inner deposit (g), divided by the area of this deposit (less than 0.01 m2, depending on the device), represents the splash rate (g m−2).
In the unbounded devices, as it was explained in the introduction, the calculation of the splash rate is not possible. The soil source area is not precisely established (it is not possible to know the origin of the soil collected), and the devices will not collect a lot of mobilized splash sediment from this undefined area. However, to give the same units of bounded ones, the number of sediments collected in each unbounded device can be divided by its collection area. In both kinds of devices, an increase in the rain intensity should be logically related to an increase in the soil mobilized per area. However, it should be taken into account that the sample that was collected by an unbounded device will be much less than in the bounded one, which collects all of the mobilized soil.
In conclusion, the amount of splashed soil measured are very different, always being bigger in the bounded devices, but the relationship between splash and intensity of rain should be positive in both types, because both types of devices are measuring differently. These differences in absolute values should be not a problem for conducting statistical analysis, because both types of measurements are calculated while using the same units (g m−2). However, this issue should be considered during the interpretation of the results, and the comparison of bounded and unbounded devices. Additionally, even while taking into account the different capacity that those devices have in recovering splashed soil, we have the possibility to compare the data by calculating the standard score or typifying data, by extracting the mean score from each score and dividing the result by the standard deviation.
Additionally, to study the consistency of the response of the studied devices under different rainfall intensities, the splash rate that was obtained with each splash device was also divided by the rainfall intensity used in each experiment in g h m−2 mm−1 relating a splash rate per mm of rain. Table 2 shows the average obtained with all of the repetitions of the six types of devices used in the experiments.
The normal distribution of data was checked using the Shapiro–Wilk test. Parametric statistics and tests were used, as the null hypothesis was not rejected in most cases. Pearson’s correlation coefficients were used to analyse possible linear relations between devices as well as Spearman’s in the cases of non-parametrical distributions (Table 2). With these tests, we may confirm the linear relation between the compared data, although these analyses cannot measure the relationships in the data. To assess these relations, it is necessary a test that usually needs data that can be used as a reference of the real values, but, in this case, it is not known which data should be used as a reference device. Therefore, it was necessary to use the Bland–Altman plot test that is designed for a comparison between methods when it is not possible to know the reference base method. The Bland–Altman plot test defines the intervals of agreement within which 95% of the differences of a method fall as compared to another one. It does not confirm whether those limits are acceptable or not. Moreover, a regression analysis was conducted while using the rainfall intensity and each studied device as parameters. If the devices react with the intensity of the rain, some relation should be found, and if the devices correctly measured the splash erosion, some relation should be found with the results taken by several devices.
3. Results
3.1. Splashed Soil Measured with the Different Devices
The values presented in Table 2 correspond to the average of the total amount of splashed soil, measured with each device, divided by the surface of the device and the rain intensity previously collected to every experiment in each spot. It is possible to observe the variability among some of these results. Funnel, cup, gutter, and tower are unbounded devices and they show similar values, though the tower device collected less soil per area. The tower device has a larger surface divided into different height levels; some of them (the upper ones) collect very little soil, reducing the average. Out of the other three devices with a similar design, the cup collected much less splashed soil than the funnel. Regarding the bounded devices, the Tübingen cup accumulated much more splashed soil than the Morgan tray (Figure 4—right graph).
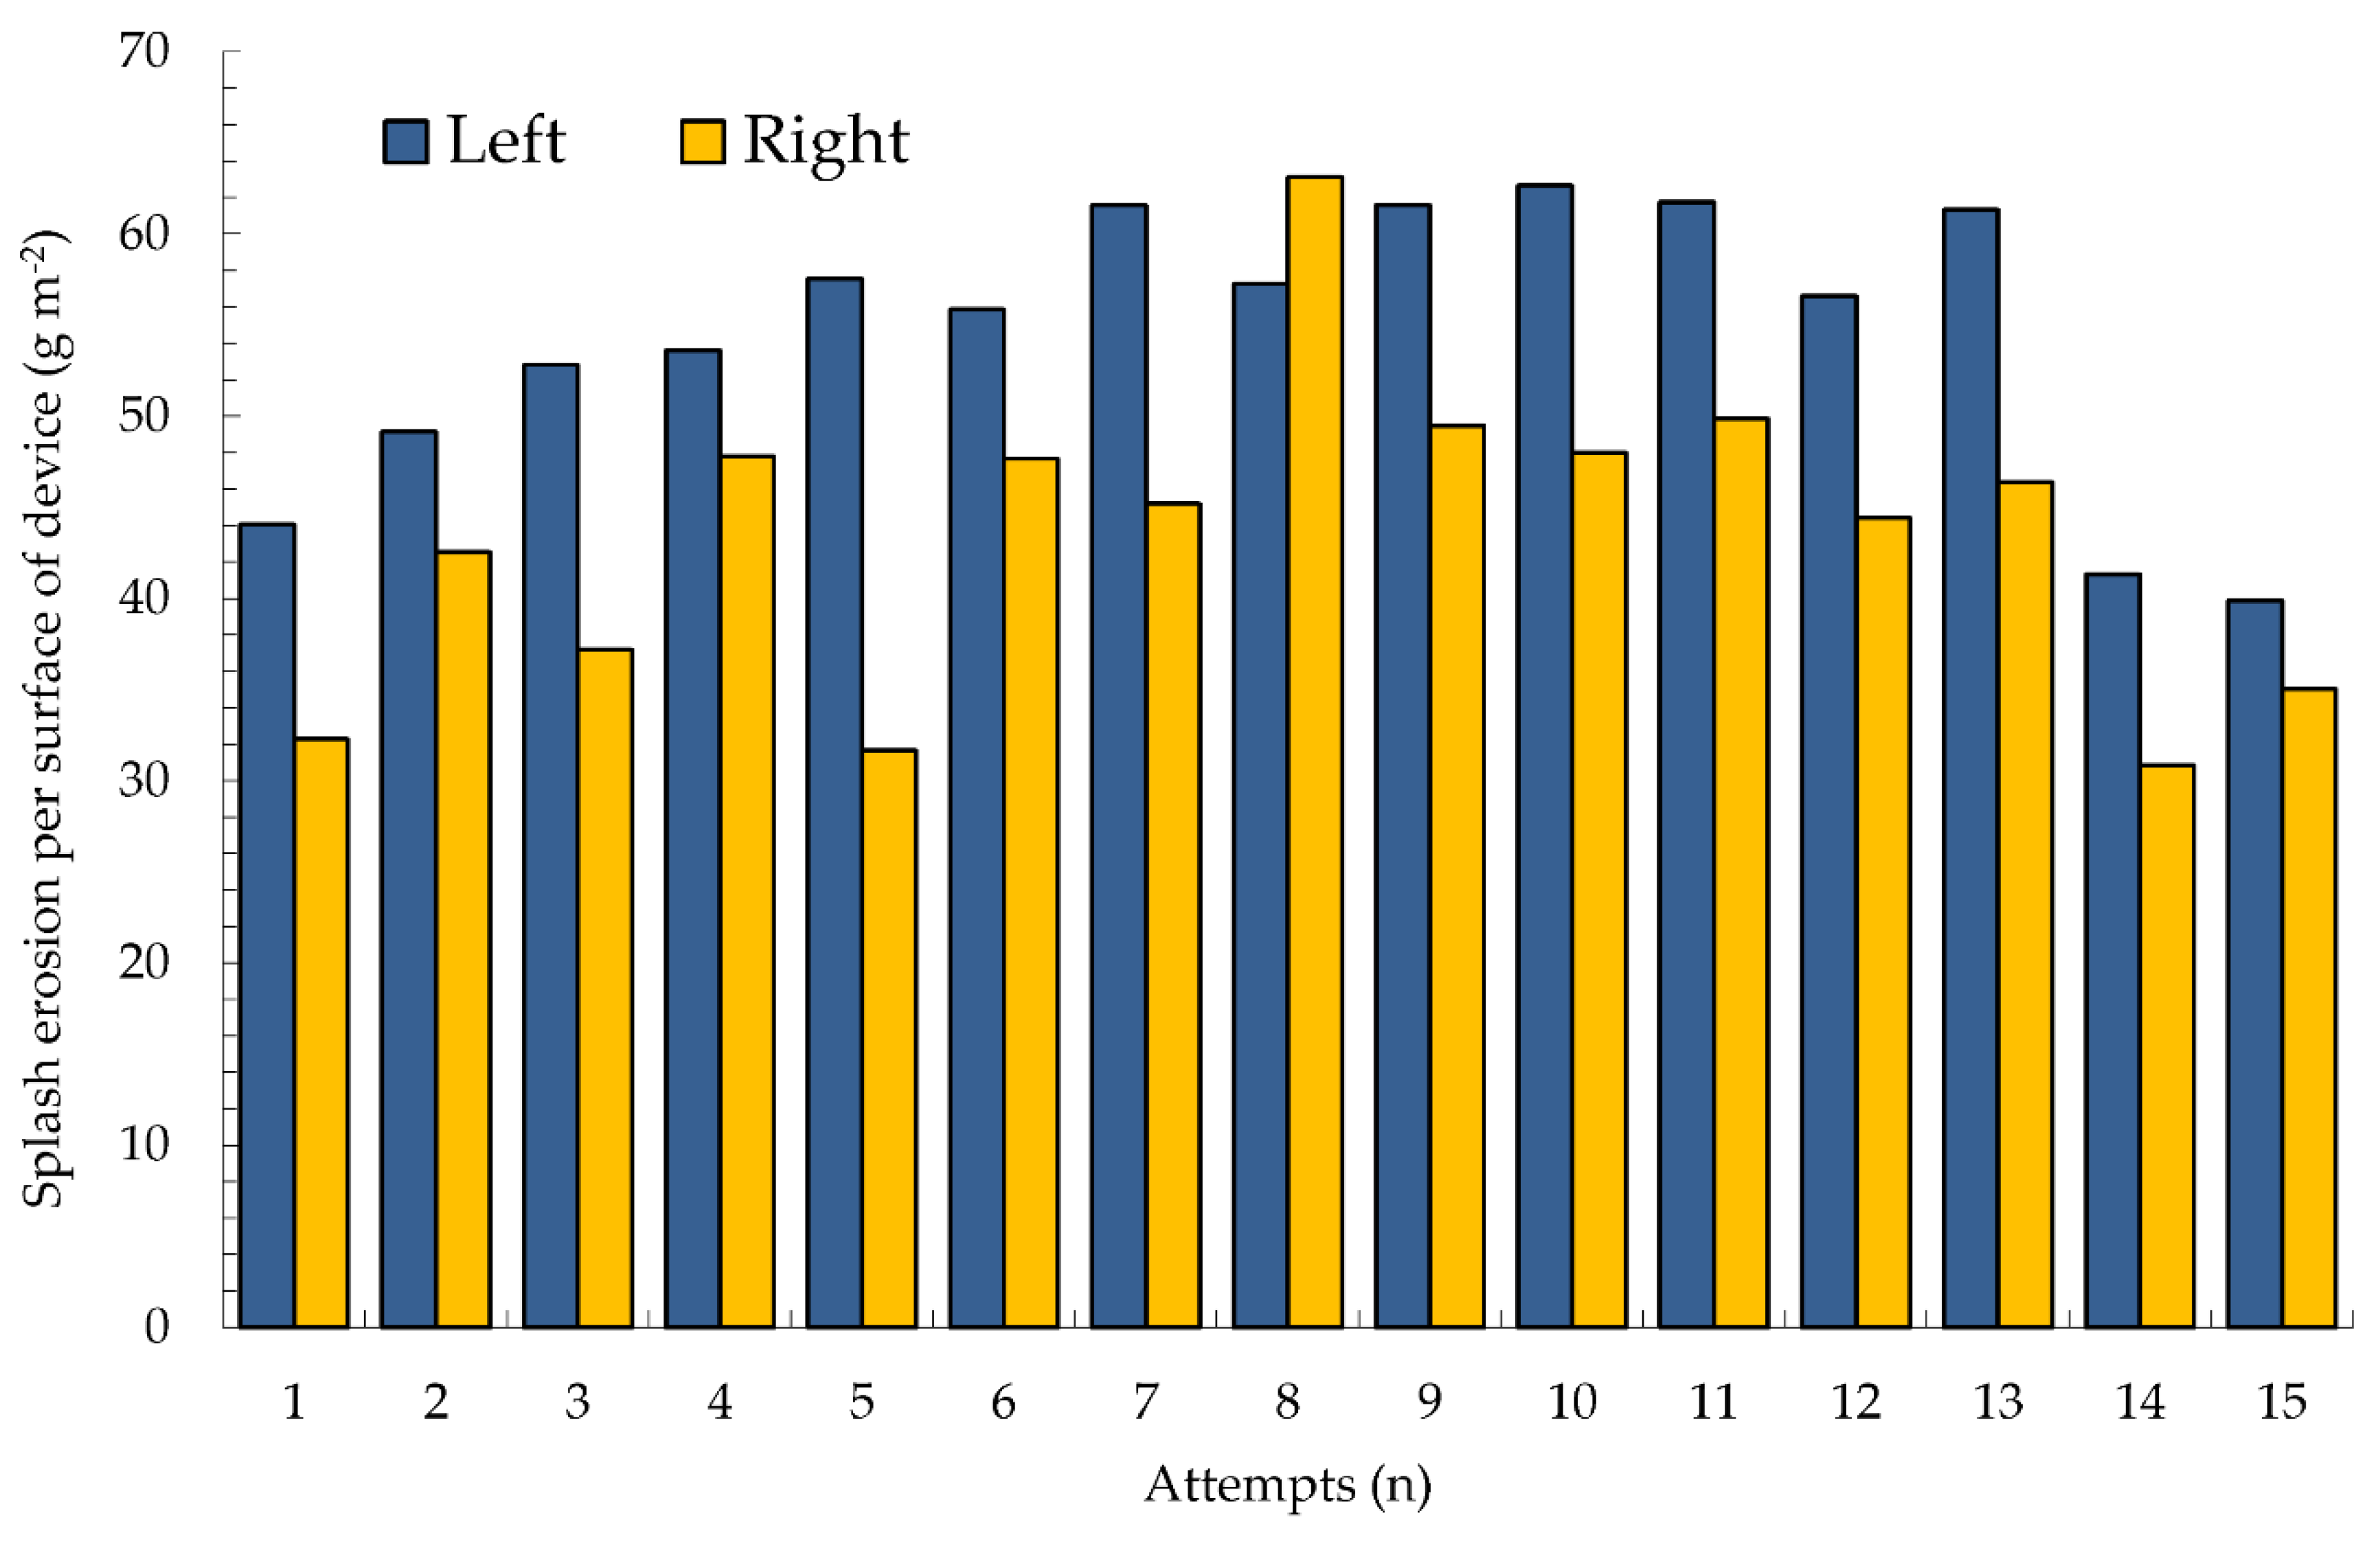
The gutter is separately analysed because of the difference in the total area covered by this device. These results show consistently more splash erosion in the gutter on the left side of the rainfall simulator plot, where the rainfall intensity was slightly higher. Accordingly, there was 10% less of splashed soil than on the left side on the right side of the plot (Figure 5).
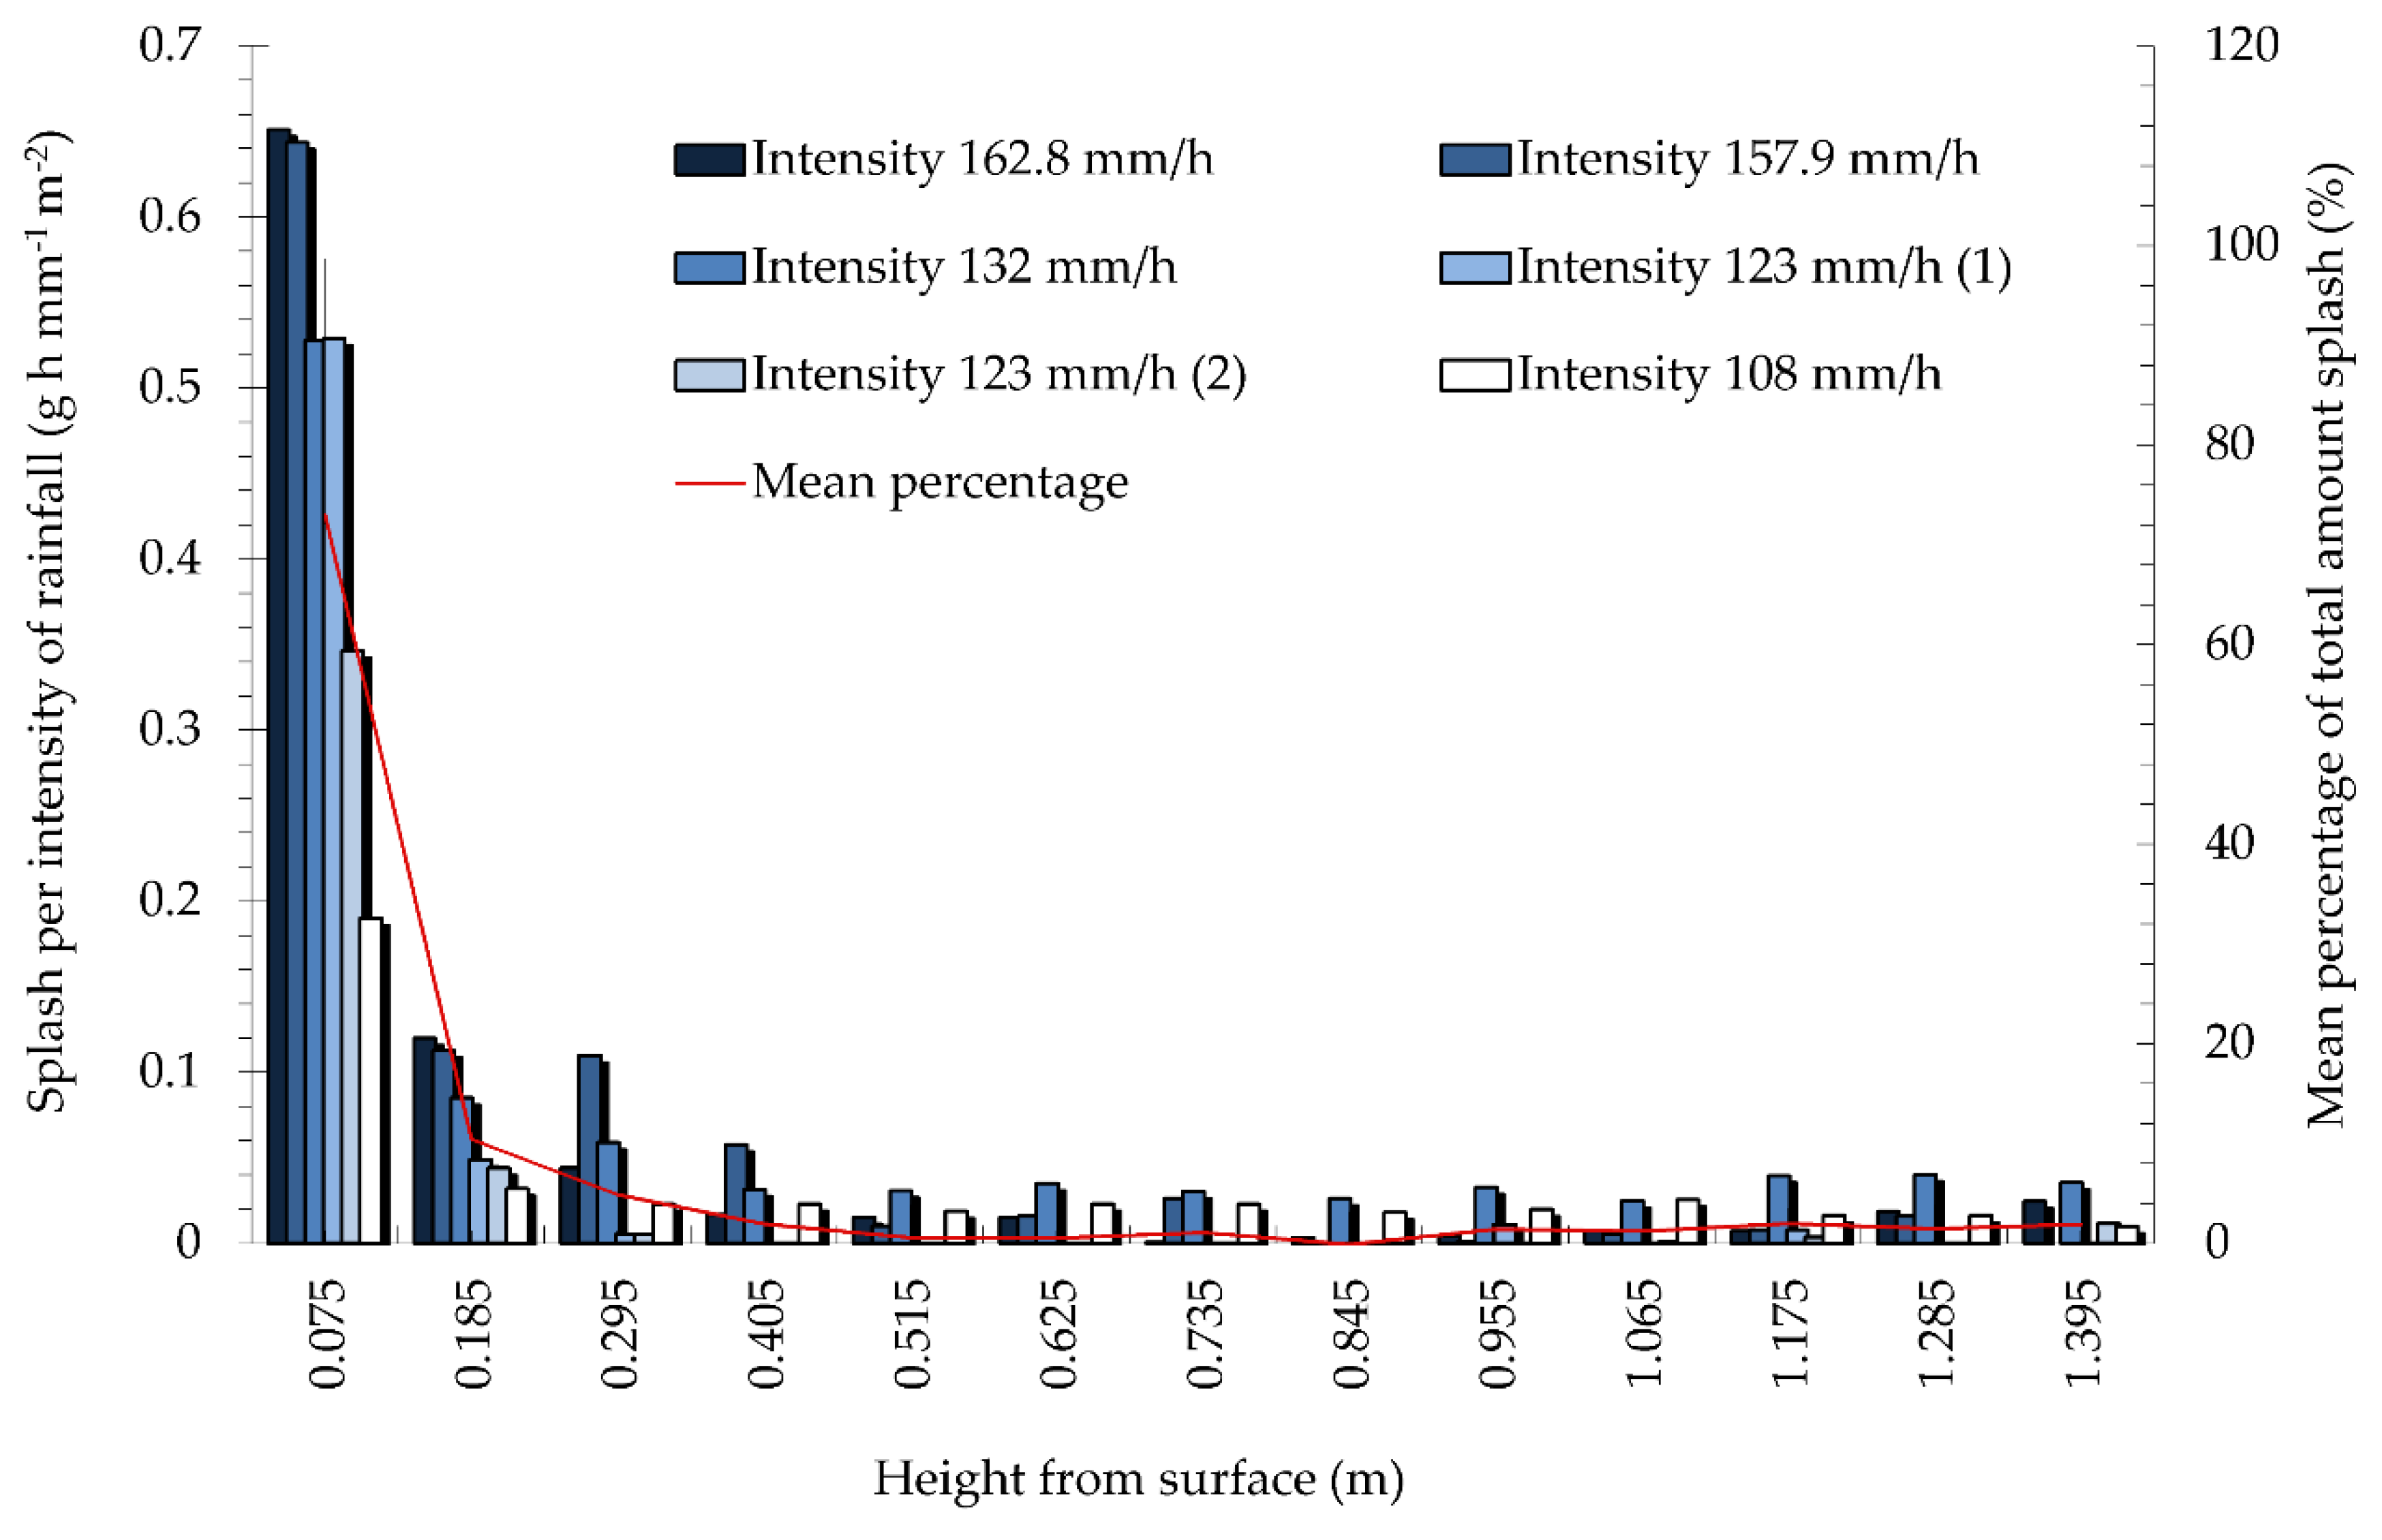
In Figure 6, the results that were obtained with the tower of funnels showed that, with rainfall intensities up to 150 mm h−1, more than 90% of the total splash erosion reached up to 0.405 m height. At higher elevations, the arrival of splashed soil is scarce or even negligible. If the distribution of collected splashed soil at each height is analysed, it is possible to observe that 73% of the total sediment was collected at a height of 0.075 m, 10% at 0.185 m, around 5% at 0.295 m, and only 1% or less at higher heights.
Table 2 also presents the standard deviation of the measurements of each device, data that may be used to calculate the standard deviation related to the average calculated for each device. Gutter presented the lowest value of (17.7%) and Tcup, the highest one (32.7%). The large percentage that was obtained for the splash tower (248.7%) responds to the intrinsic deviation of the measurements more than to the variation between experiments.
Correlation analyses were carried out in order to find the possible relations between device measurements and rain intensities (Table 3). The algorithm runs through all the possible combinations of independent variables (device measurements) to select the model with the best goodness of fit (highest correlation coefficient). Only the results from the Tcup, Morgan tray, and funnel showed significant correlations with the rain intensities, with the relations of the latter being significant at 99%. Similar relations can be observed when plotting the splashed soil measured with each device vs. the rainfall intensities (Figure 4). The highest regression coefficient was obtained for the funnel, followed by Tcup and Morgan tray (Table 3).
3.2. Relations between Splash Erosion Devices
While searching for relations between devices (Table 4), there was a significant correlation between cup and gutter, which was likely because both of the devices collect splashed soil from an unbounded area, without any protection against the loss of sample by raindrops. Tcup and funnel also showed a significant correlation that may respond to the capacity of both to react influenced by the rain intensity (Table 3). The similar response to the rain intensity on both of the devices can be observed in Figure 4. On the other hand, the gutter was significantly correlated with the cup, Tcup, Morgan tray, and the tower. The relation that was found between the Morgan tray and the tower is very difficult to explain.
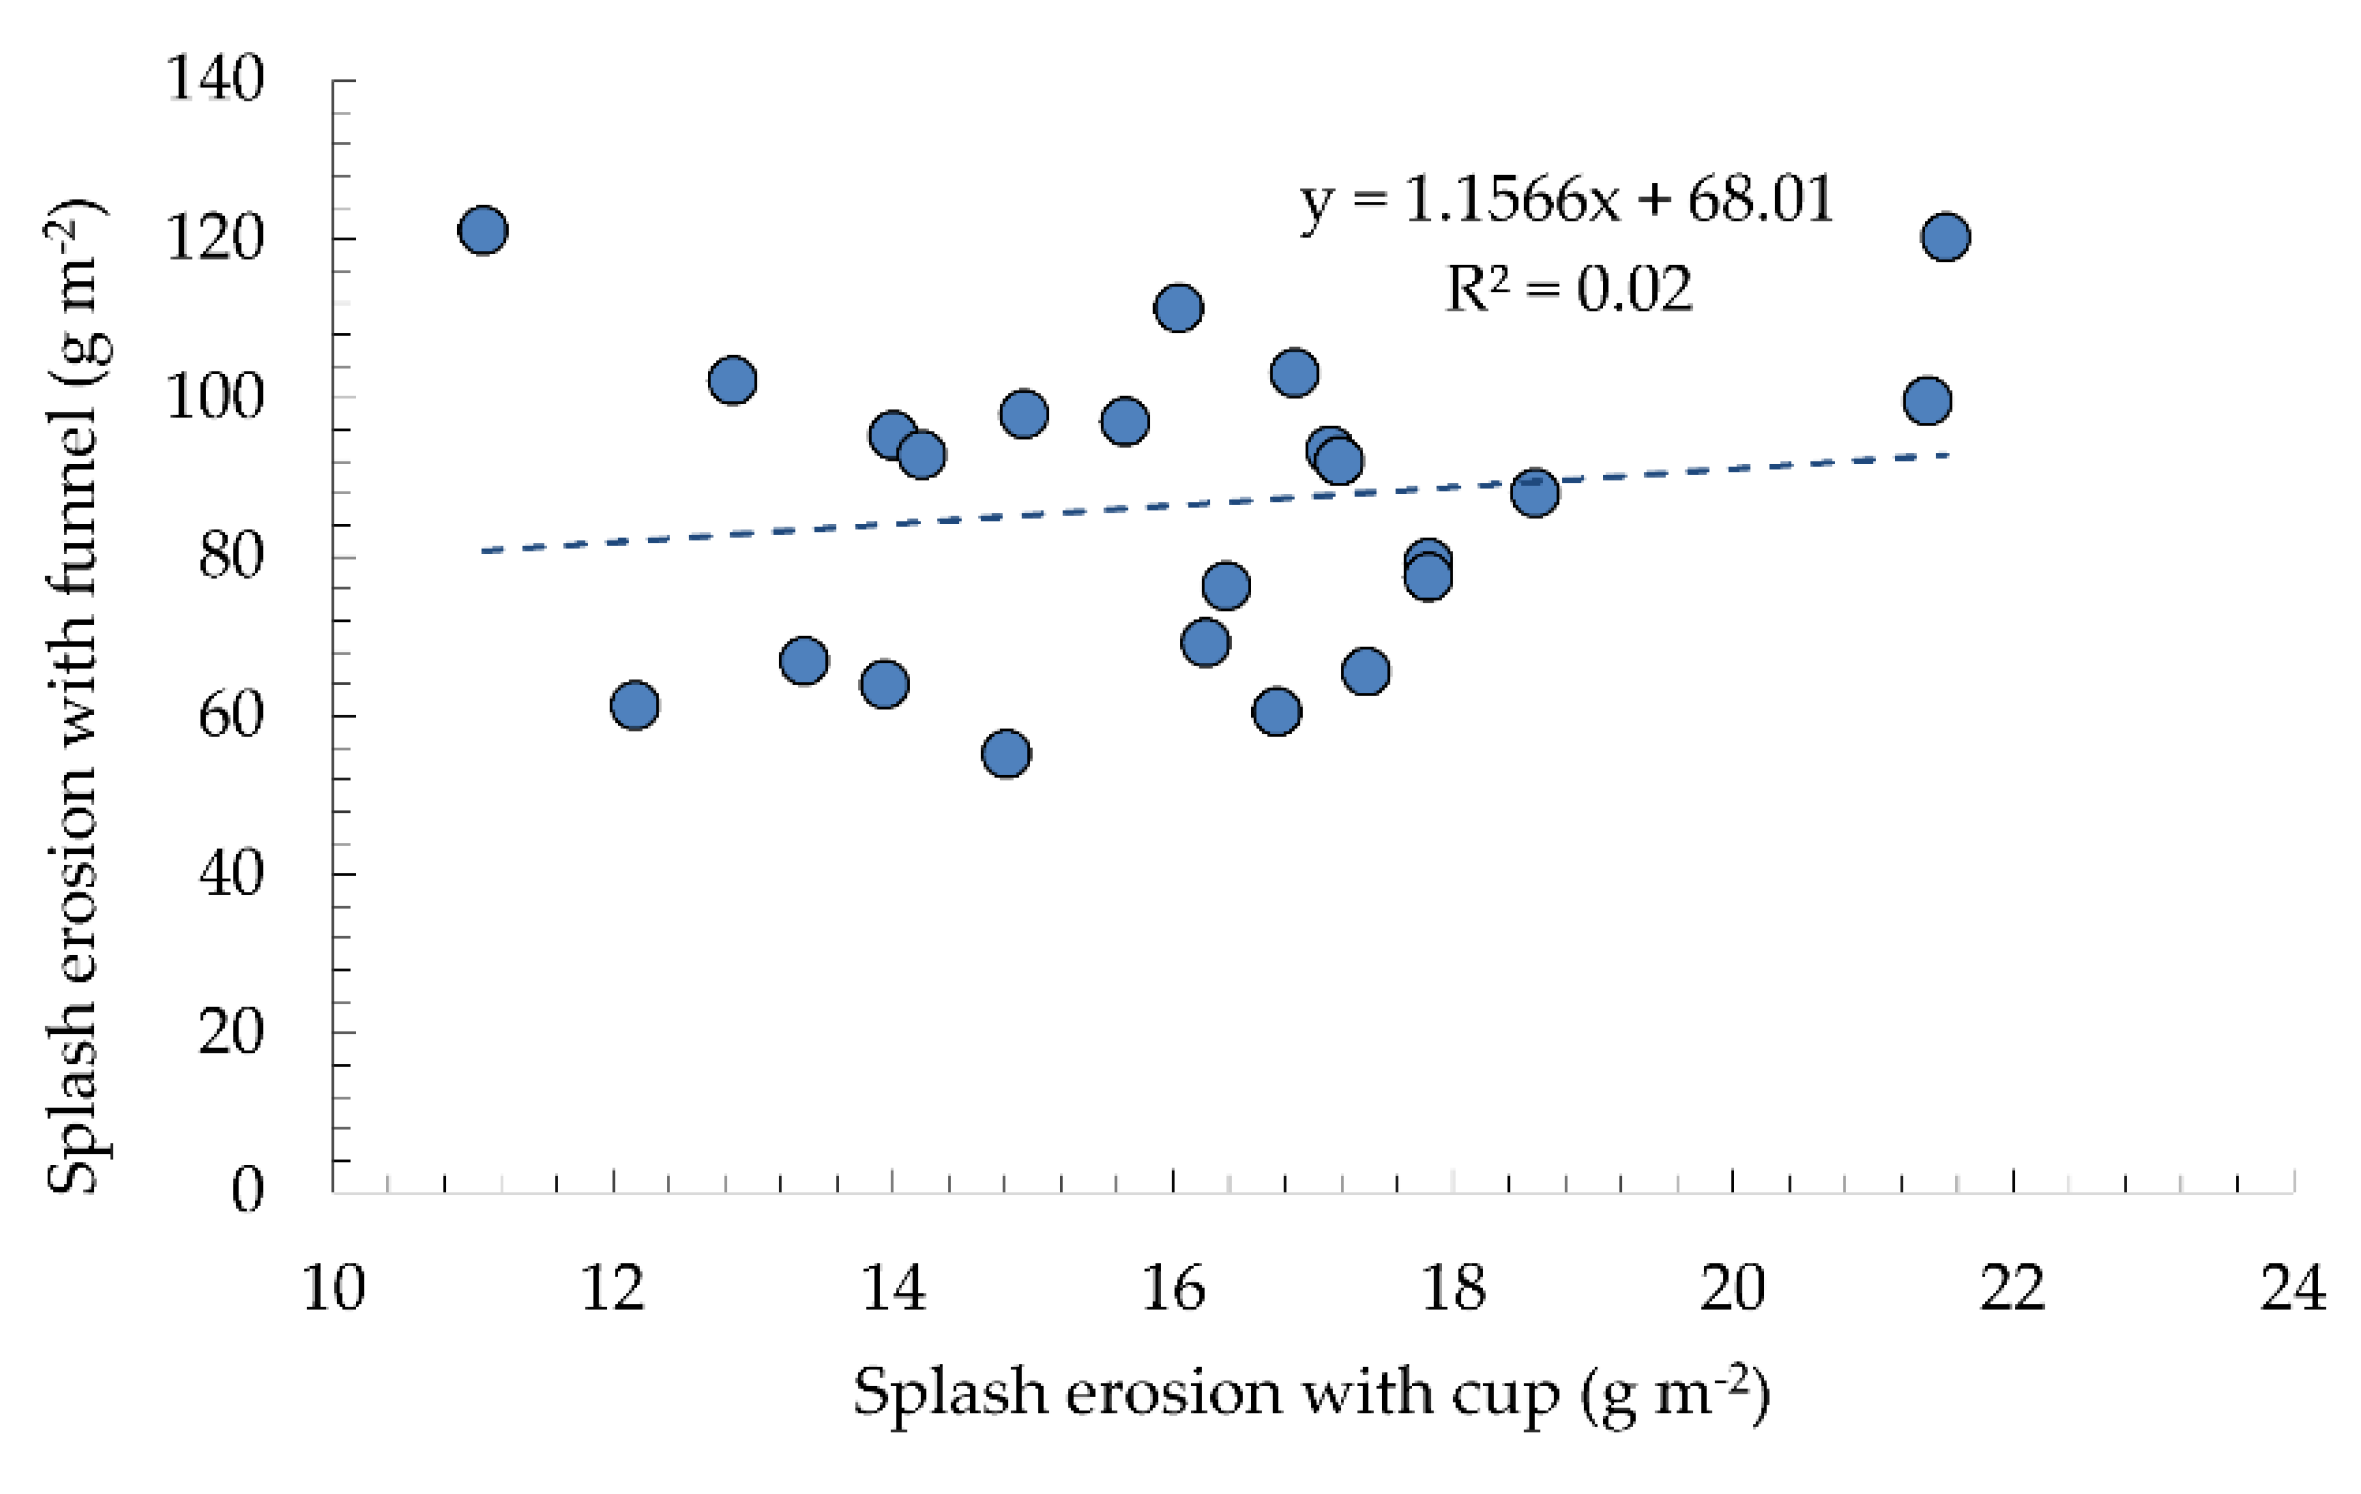
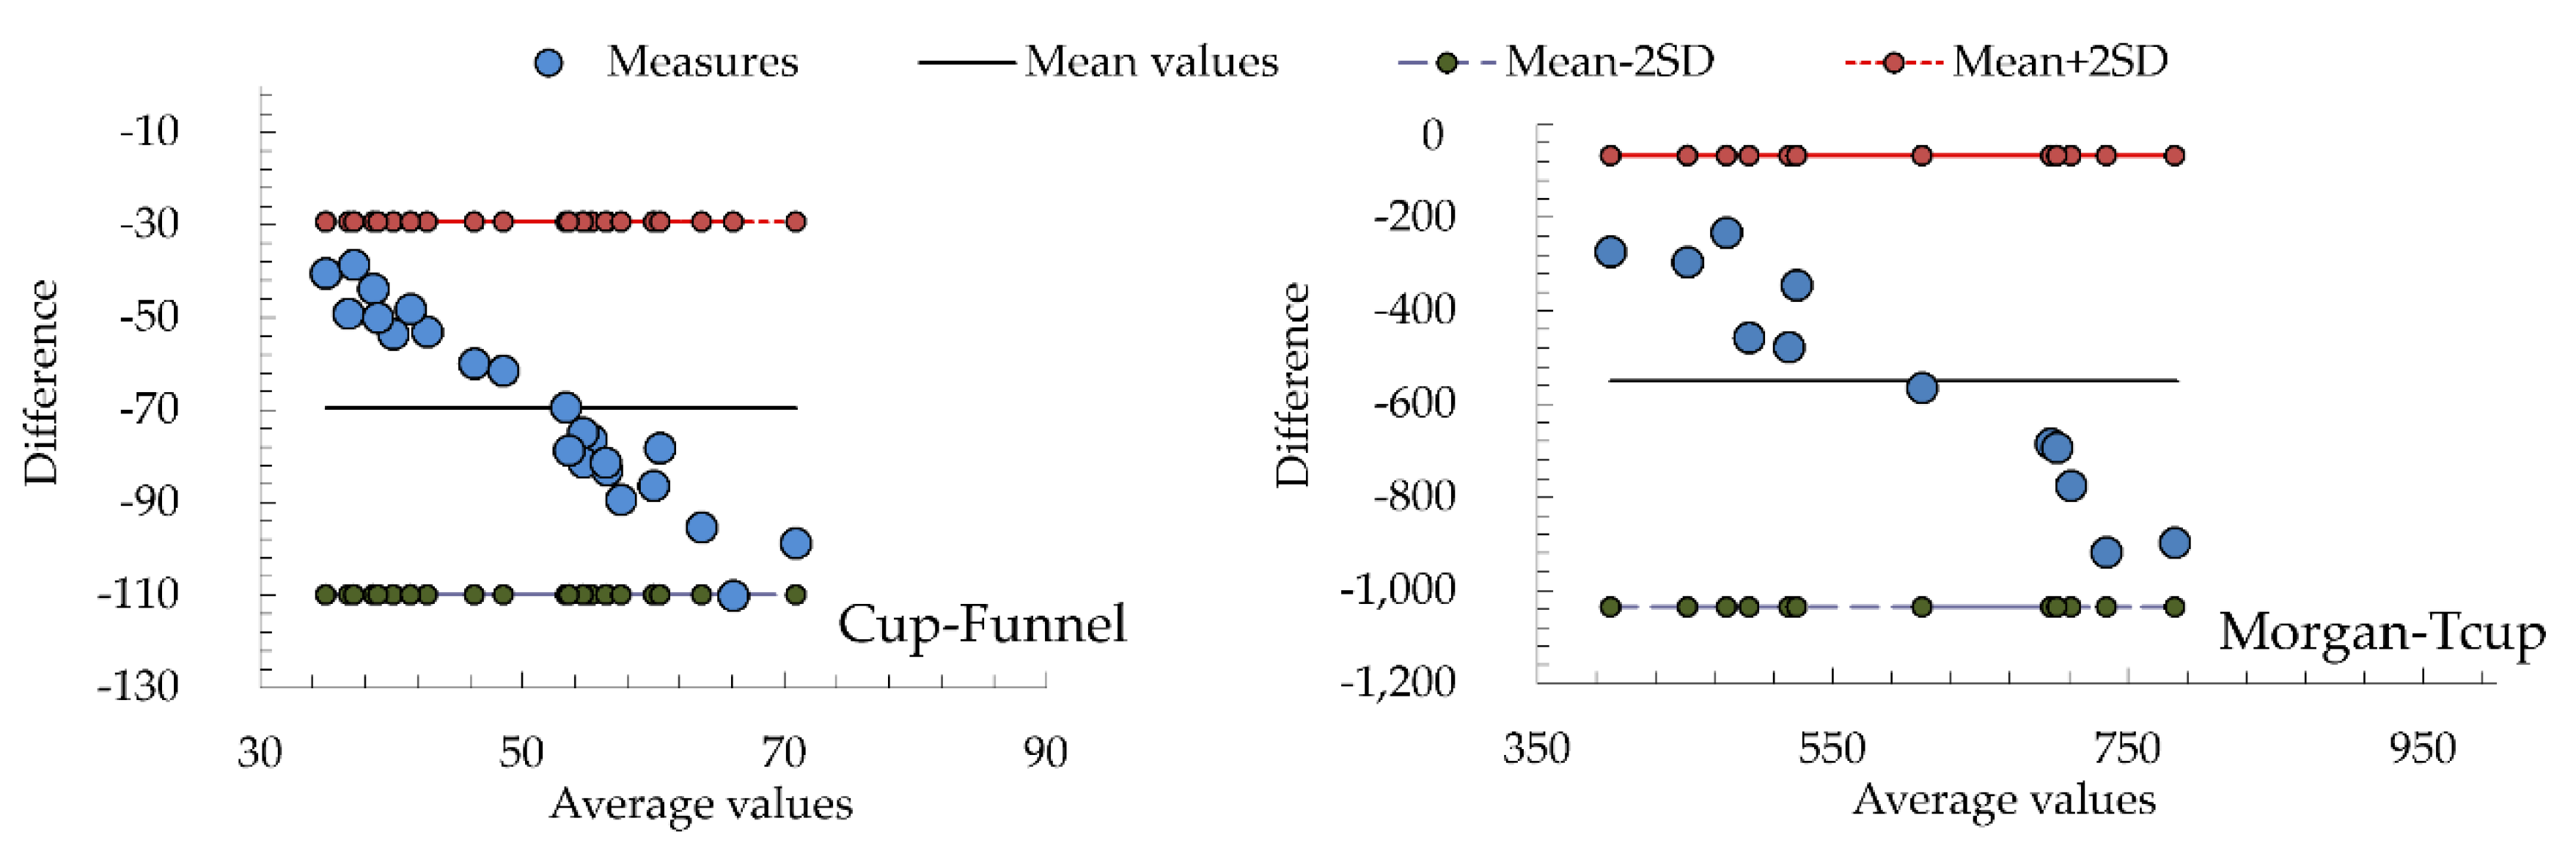
When devices with a similar source of soil, like cup and funnel, were compared and the results the were obtained with them were different (Table 2 and Figure 7), it is necessary to think which one represented the reality better and whether the different results can be explained by the different sizes of the different design of the devices. Figure 7 showed the relations between the measurements of both devices and a linear relationship with a very low coefficient of determination (R2) among them. This weak relation can also be observed in the Bland Altman plot, where the results showed an agreement interval that is extremely large (Figure 8—left), where a large bias between the two devices has been found, similarly to the result from the regression analysis (Figure 7).
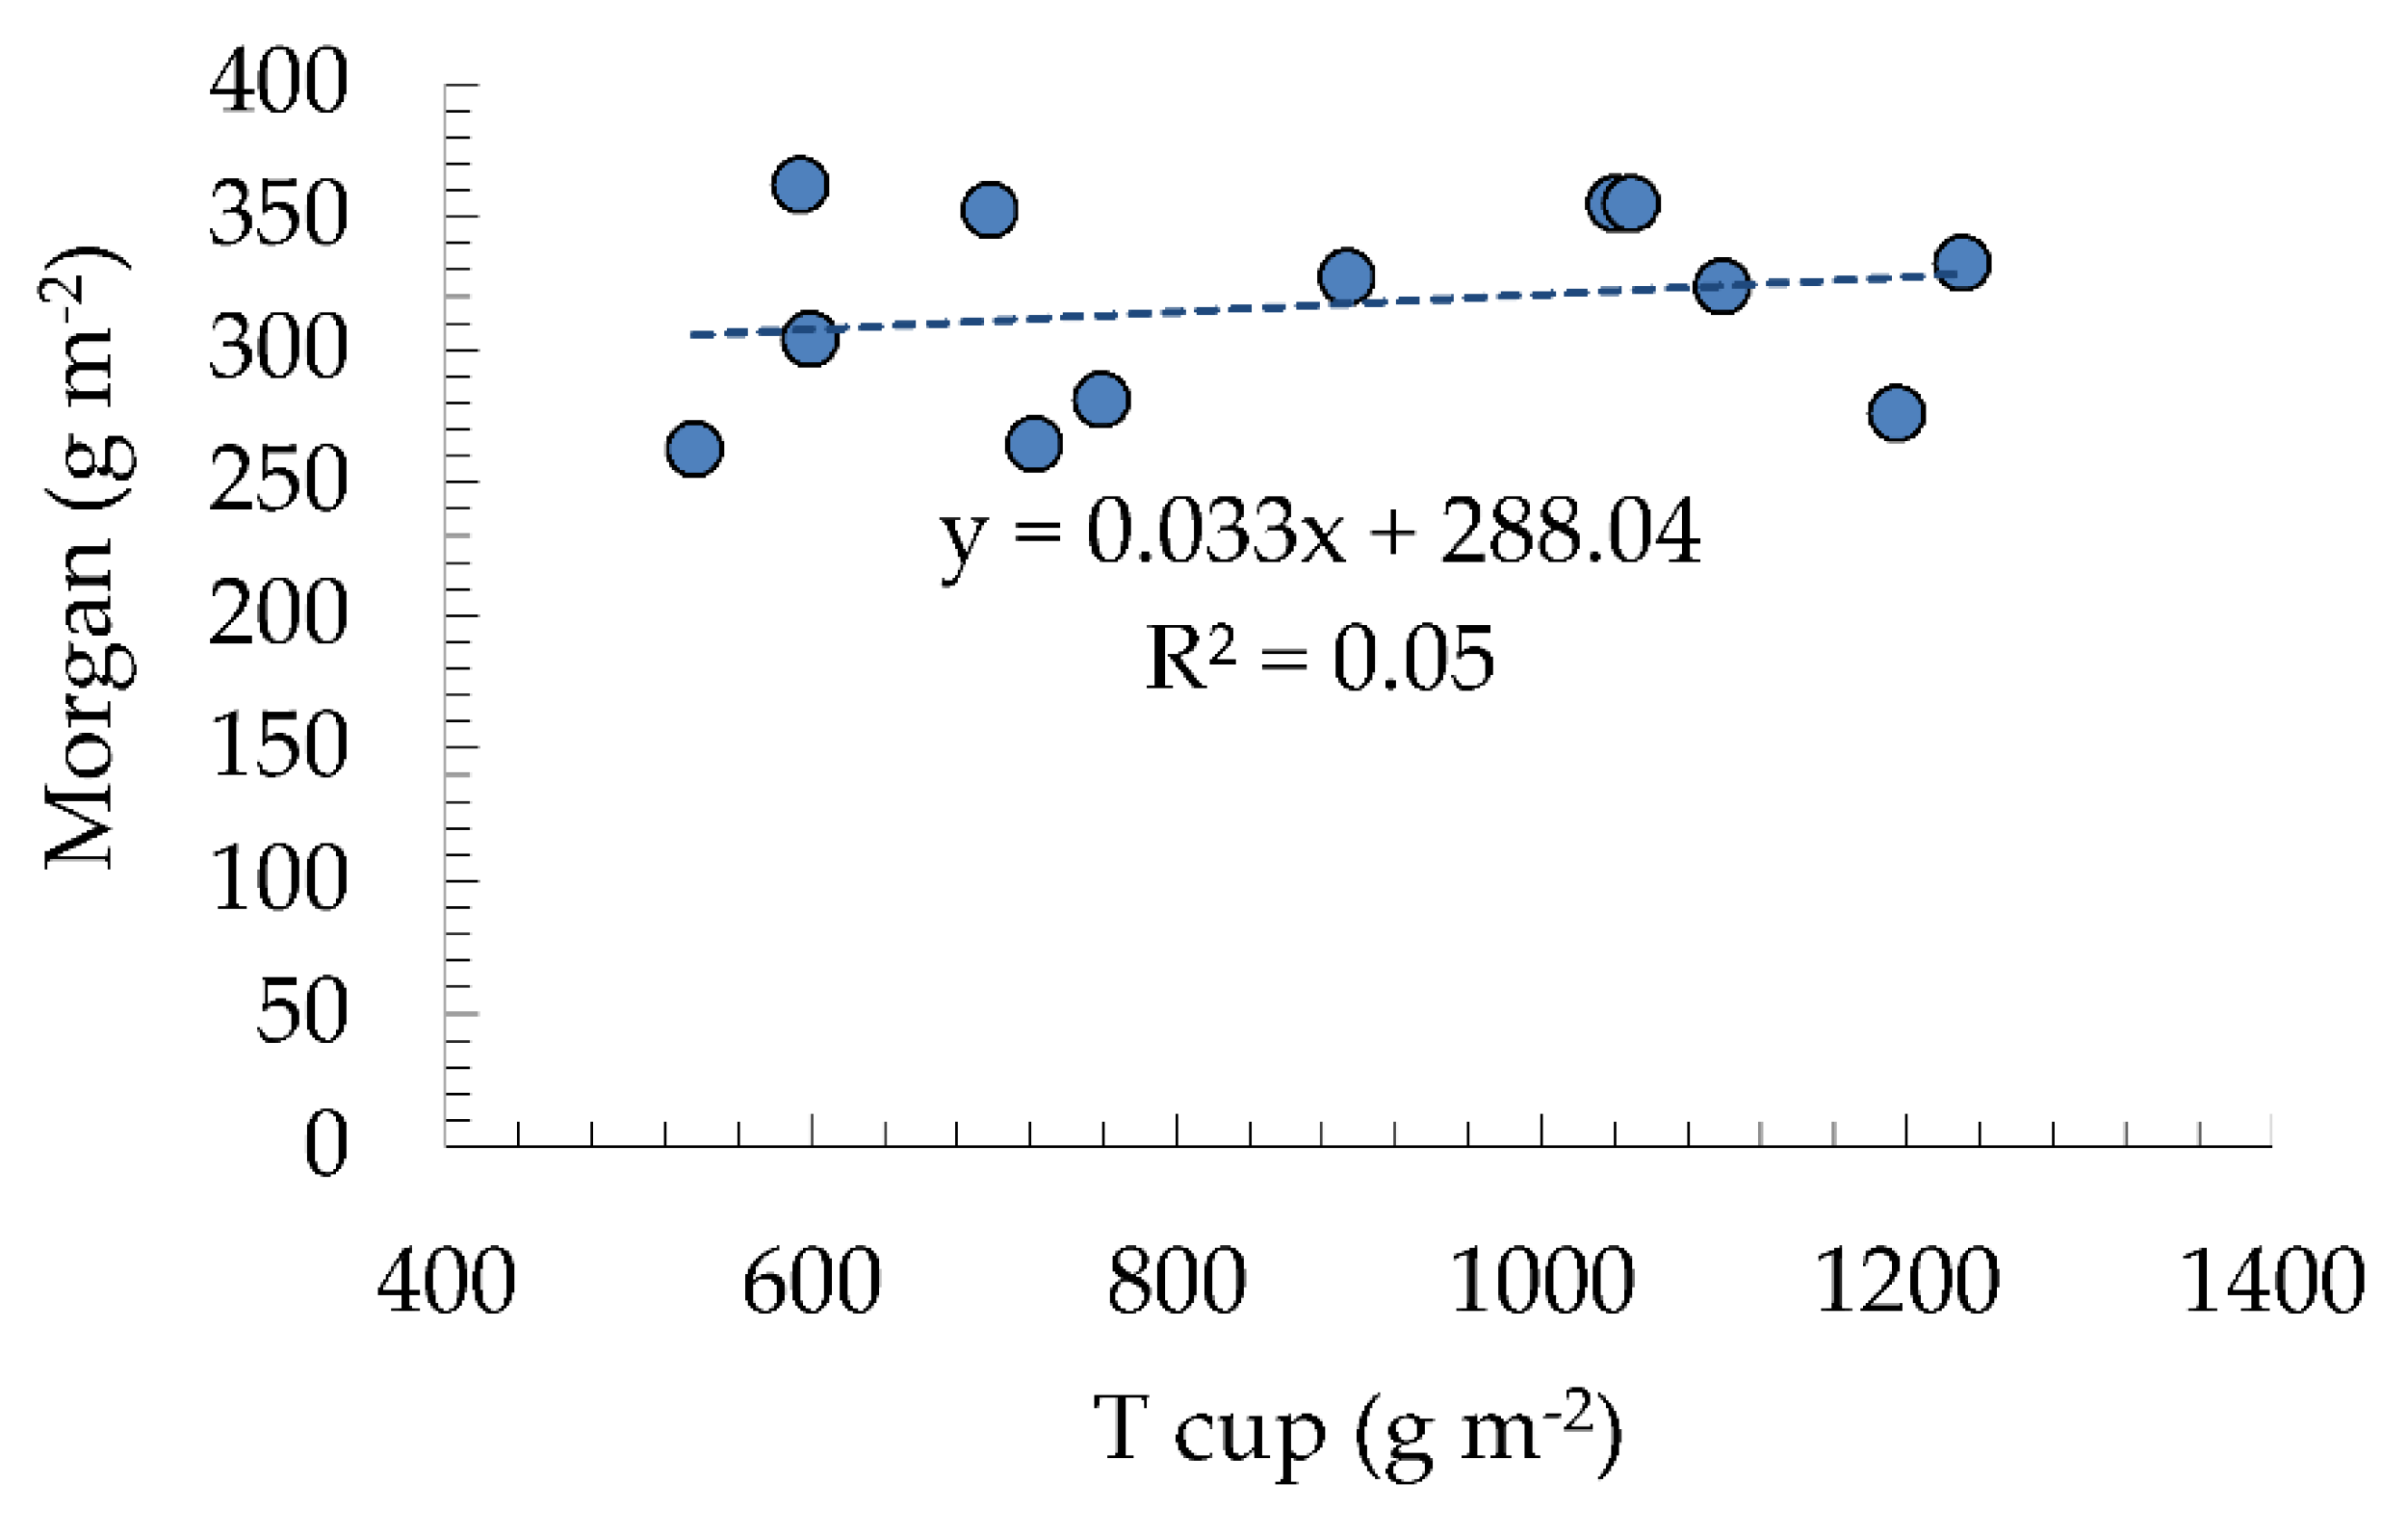
Similarly to the results with unbounded devices, when the analysis is done on the splash erosion that was collected from bounded areas, using both the Morgan tray and the Tcup, the splash erosion increases with rainfall intensity, but in the Morgan tray very smoothly (Figure 9). The different value given by the two different measuring devices is due to their different peculiarities, and, if the tendency is the same, this cannot be considered as a relevant result. However, in addition, there are other differences, for example, the accuracy of the data that were obtained with the Tcup is not very high. This result, together with the large disagreement interval detected by the Bland Altman method (Figure 8—right), points out the great differences between methods.
Linear regression analyses have been performed, with a confidence level of 95%, while looking for a model that is able to relate the splash results that were obtained with the different devices (Table 5). Significant relations with the rain intensity could only be established for the funnel, cup, Tcup, and Morgan tray, confirming the correlation results (Table 3 and Table 4). However, the regression coefficients were, in the best case, slightly higher than 0.5, which means that there is a low agreement between the results that were obtained with the different devices and between the devices and the rain intensity.
3.3. Complementary Information about the Splash Devices
The difficulty of installation in the field is one of the factors that can determine the selection of a splash device (Table 6). All of the devices selected for this study can be used in the field, with the only limitation of the gutter, which is not advisable to use in fieldwork, because its large area can easily be polluted by particles that are transported by air when installed. The weight and size are also classified into categories, where the funnel, cup, and Tcup are the best devices, because their smaller sizes simplify the installation. There is also very little disturbance in the soil surface with the selected devices, except the hole required by the funnel in the soil, and the removal of some vegetation from the surface for the Morgan and the gutter devices (the disturbances will be minimal in bare soils). All of the chosen devices were very cheap to build (Table 6), except the tower of funnels that was a little more expensive because it demands a structure to maintain the funnels in their position.
The easiness in retrieving the splashed soil and the probability of losing the sample during this process are also important factors. The funnel and the Tcup are the devices that better protect the sample as well as those of easiest use by one single researcher. Finally, the last characteristic that is useful to compare devices is the capacity for providing additional information. Thus, the tower of funnels can tell the height that a splashed particle can achieve, or the Morgan is able to differentiate between upslope and downslope splash erosion. In Table 6, all of these features are scored from 1 (lowest value) to 3 (highest value), which provides additional information regarding the performance of the different devices. According to this, the funnel and the cup are the best splash devices from a functionality point of view.
In any case, there is a lot of research done with the different splash devices, and a summary of the lack of standardization in the values and units reported in the published studies carried out until now can be observed in Table 7.
4. Discussion
4.1. The Rainfall Simulator and Laboratory Sensitivity
There are two potential causes of error in this comparative research—potential changes in the rainfall and errors with the sample collection. The rainfall simulator that was used in this study is a very stable instrument, with less than 5% variance between the average rainfall intensities among repetitions [46]. A great effort in getting similar intensities along the simulations with the different devices was done, but small differences between repetitions could happen (because of the simultaneous use of the rainfall simulator by other researchers). In any case, the intensity that was used on each device was always perfectly known.
Other sources of error can be the transport of the soil samples to the laboratory (to weigh them) where the loss of soil can occur. Additionally, the filter papers that are used for collecting the splashed soil can absorb some humidity from the air. Accordingly, after drying the filters in the oven, it is very important to keep them in a desiccator until they have an adequate temperature to operate with them. Filters were kept for 30 min. in the desiccator before weighing them, to ensure a stable weight of the samples in order to make the experiment reproducible.
4.2. Splash Devices Measurements: Lack of Standardization
It is surprising that it is not common for the comparison between device results to have been done so far. The reason may be based on the difficulty of designing a proper experiment that is able to compare data that are sensitive to soil samples, rainfall characteristics (simulated or real), duration of events, etc. in a way that supports the achievement of general conclusions.
Although, in the experiment, the main factors that are involved in the variability of measurements with splash devices were controlled (homogeneous soil (sand), reproducible rainfall and constant slope), the results obtained, presented a high variability (Table 2). This is in agreement with other studies [49,50], for example, devices like the cup used under the simulated rain or in field conditions with similar intensities (31.5 and 38 mm h−1, respectively) showed very different results (Table 7). These studies showed higher splash rates in funnels than in cups in spite of their similar design, similarly to our experiment.
4.2.1. Bounded vs. Unbounded Devices
One analysis was carried out comparing the devices working with an unbounded source of soil, and another one, with those performing with bounded areas. The bounded devices produced higher values of splash erosion than the unbounded ones. Devices like the Morgan and the Tcup may lose some sand by wash-off effect, because they are completely filled with sand and some grains of sand suspended in the water deposited on the top may fall from the device. This means that raindrops falling on the surface can pond and cause some particles to move with the surface flow instead of by splash transportation. On the contrary, devices like the cup and the funnel have a bound of 3 cm high to avoid the particles coming from processes different to splash erosion. In this case, only the splashed particles that are ejected higher than 3 cm will be able to enter into the device. Another effect that may appear is the rim effect or the lowering of the soil surface in relation to the solid rim of the cup, but this was not detected in this study.
4.2.2. Size of the Sampling Area and Design
In relation to unbounded devices, funnels, which have a similar design to cups, showed higher splash rates than cups, as was also reported in other studies [35,37]. The devices with a larger sampling area, like the gutter or collection through, seem to have high splash rates, but these values cannot be used for comparison, because the data about the intensity or total rainfall producing the splash are not described (only the flow is given). For the bounded devices, the data that were collected with Morgan or Tcup also showed large variability [39,40,56]. In this study, the Tübingen cup presented much more splashed soil than the Morgan tray. The reason for this difference could be related to the loss of sample from the Morgan device during its collection, bigger than the loss from the cup in Tcup. The loss of sample in both cases, together with the difference in sand-size (in Tcup sand is 212.50 μm, while in Morgan is 369 μm) increased the difference in the average of the loss sample between them. The analysis of these results confirms the difficulty in comparing data coming from different researches and/or devices. Data that were obtained from the tower of funnels showed that splashed soil above 0.5 m is negligible. However, we observed some particles to reach a height of 1.395 m.
The size of the device is an important factor to keep in mind when comparing the results in splash studies. On the one hand, and according to measurements of this research, devices with a larger size—like funnels (12 cm in diameter)—have shown higher splashed soil than smaller ones—cups (10 cm in diameter). These results are not in agreement with Poesen and Torri [42], who reported an inverse influence of device size in the reception of the splashed sample. Although, indeed, it is not a consequence of the size, but of the funnel design that avoids surface wash of the sample [37]. It was observed that many of the splashed particles that had already been splashed inside the cup were moved outside again after the impact of new raindrops. On the other hand, the Tcup with the smallest area (only 19.63 cm2) is the device that collects the highest quantity of splashed soil (Table 2), probably because its measurement depending on the lost soil is more exact. For this reason, and because the Tcup is more sensitive to very low intensities [39], it has been selected for splash experiments under plants. However, the largest device used here, the gutter, showed splash values from 30 up to 60 g m−2, which are between the values of splashed soil that were collected with cups and funnels. These quantities seem logic because the gutter can also be affected by surface wash processes, losing sample from re-splash of the soil deposited on the gutter. In any case, these values cannot be compared with those that were obtained with other devices because of gutter’s design (6 m long), which make very difficult to determine the rain intensity over the whole surface of the gutter (particularly in cases as ours, in which the rainfall intensity was different along the surface of the studied plot, Figure 3).
Other factors affecting the splash erosion measurements, like soil moisture [5], acidic components in the rain [57] structure and size of soil aggregates [6], or the presence of rock fragments [58] are not considered in this study, because both the composition and the conditions of soil (sand) were homogeneous along the experiments. However, the duration of simulated rainfall could also have some influence on the outcomes when comparing the results that were obtained with those of other authors. Mermut et al. [59] simulated rainfall during 120 min. and observed a decrease in the splash erosion after 50 min. In this study, some trials were done simulating the rain for 20 min., but significant differences with regard to 10 min were not found (data not shown). This result contradicts that of Katebikord et al. [60], who found that even five minutes of change between simulations might influence the erosion processes and the gathering of sediments from splash erosion. After the first drop, there is a change in the conditions in the place impacted by the drop, because a micro-pool appears [5], and the changes in the humidity also have very little effect when there is saturation.
4.3. Influence of Rainfall Intensity on Measured Splash Erosion
The splash measurements that were obtained with the studied devices showed different relations with rain intensities, being only Tcup, Morgan tray, and funnel results in those presenting significant correlations (Figure 4). It seems that the response of the funnel to changes in the rain intensity is higher than cup’s one, which is nearly unappreciable. Indeed, close observation of the cup showed that the amount of splashed soil is not changing after some time. This means that there is a threshold after which the cup always gives the same splash rate, regardless of the intensity, because it reaches a balance. The main reason for this balance is the removal of splashed particles deposited already on the filter paper when washed by new raindrops.
The funnel obtained the highest regression coefficient, followed by the Tcup and Morgan tray. These results indicate that both of the devices measuring splash erosion rates from a defined soil source represent the movement of soil particles that are produced by different rain intensities in a similar way, probably because they lost fewer sediments by surface wash. According to these results, the funnel is the best device that is able to measure the soil splashed at different rain intensities, because its lateral protection prevents surface wash of the sample reducing the loss of collected soil, as its low percentage of deviation from the mean confirms (Table 2).
4.4. Specific Problems and User Recommendations
Properties like weight and volume of the device are also very important when evaluating the possibility of using it in the field (Table 6). Some devices are small and easy to carry, while larger devices, like the Morgan or the gutter, need to be transported by car. Another important aspect to have in mind is the disturbance that is produced by the device over the experimental surface. In splash erosion research, measurements in highly sensitive areas, like burnt zones, agricultural terraces, or mines, are very common, and disturbances that are related to the measurement technique may produce inaccurate results. In general, the devices that were selected for this study do not generate negative impacts on the studied soil surface, although the funnel, gutter, and Morgan devices can have a higher impact than the others can.
The easiness in the sampling of the splashed soil collected, and the probability of losing the sample during this process, is another important factor in the comparison among the devices. It is indeed one of the most important features to take into account, because the success of the experiment depends on the feasibility of collecting the splashed soil, with the least personal and economic effort. In this aspect, the funnel and Tcup look at the best devices because one single researcher can do the sampling. The Morgan device is the most sensitive and difficult-to-handle apparatus.
For the future, the next mandatory step will be to carry out new attempting to assess device performance in the open or beneath crop or plant canopies in order to compare our results under real conditions when considering variable inclinations, different rainfall intensities (time-space), and roughness.
5. Conclusions and Future Recommendations
In this study, we compared six different devices that were designed to measure splash erosion. The analysis of the devices shows that the funnel and the cup are the best devices because of their functionality, which includes low-cost, easy installation, sampling, and the information that they provide. However, only the funnel shows a significant relation with the rain intensity. This can be related to the design of the funnel device that prevents the loss of sample by washing. For all of these reasons, the use of the funnel is highly recommended to estimate splash erosion. However, the use of the Tcup is advised to measure the kinetic energy of the rainfall, because it is a contrasting method, which can be used in isolated places as well as being very easy to transport and cost-effective. The Morgan tray and the tower of funnels present a more complex use and demand more work to collect the samples than the others do; however, the acquired data provide information about distance and potential erosivity power of the rain to move natural soil, which other methods do not provide.
The height that splash erosion is able to reach can be detected with the tower of funnels; however, this method does not properly measure the splashed soil and it should only be used as a complement of other devices, such as the funnel.
Another interesting conclusion is that the researcher should decide in advance whether the calculation of a splash rate is necessary for his or her research, selecting a bounded splash device if this is indeed needed. Unfortunately, in this study, it was not possible to establish a relation between the different splash devices, because of the high variability and low agreement of the results. For future research in splash erosion, the recommendation is to exclusively make comparisons with studies that use the same methodology, because the transformation of the results from one device to another is uncertain and the comparison is unclear.
Author Contributions
Conceptualization, M.F.-R., J.C., S.D.K.; methodology, M.F.-R., J.C., S.D.K.; validation, M.F.-R.; formal analysis, M.F.-R., J.C.; data curation, M.F.-R.; writing—original draft preparation, M.F.-R., J.C., S.D.K., J.R.-C.; writing—review and editing, M.F.-R., S.D.K., J.R.-C.; visualization, M.F.-R., J.R.-C.; supervision, S.D.K.
Funding
This research was funded by a José Castillejo Grant, a Program for Junior professors (CAS16/00385) of the Spanish Ministry of Education, Culture and Sports.
Acknowledgments
The authors want to thank Shmuel Assouline, for his help, advice and technical support, and Piet Peters for his help in the construction of the devices and Antonio Jordán for his advices.
Conflicts of Interest
The authors declare no conflict of interest.
References
- Moreno-de las Heras, M.; Nicolau, J.M.; Merino-Martín, L.; Wilcox, B.P. Plot-scale effects on runoff and erosion along a slope degradation gradient. Water Resour. Res. 2010, 46, W04503. [Google Scholar] [CrossRef]
- Nearing, M.A.; Yin, S.; Borrelli, P.; Polyakov, V.O. Rainfall erosivity: An historical review. CATENA 2017, 157, 357–362. [Google Scholar] [CrossRef]
- Fernández-Raga, M.; Palencia, C.; Keesstra, S.; Jordán, A.; Fraile, R.; Angulo-Martínez, M.; Cerdà, A. Splash erosion: A review with unanswered questions. Earth-Sci. Rev. 2017, 171, 463–477. [Google Scholar] [Green Version]
- Quansah, C. The Effect of Soil Type, Slope, Rain Intensity and Their Interactions on Splash Detachment and Transport. J. Soil Sci. 1981, 32, 215–224. [Google Scholar] [CrossRef]
- Ryżak, M.; Bieganowski, A.; Polakowski, C. Effect of Soil Moisture Content on the Splash Phenomenon Reproducibility. PLoS ONE 2015, 10, e0119269. [Google Scholar] [CrossRef] [PubMed]
- Fox, D.M.; Darboux, F.; Carrega, P. Effects of fire-induced water repellency on soil aggregate stability, splash erosion, and saturated hydraulic conductivity for different size fractions. Hydrol. Process. 2007, 21, 2377–2384. [Google Scholar] [CrossRef]
- Ghahramani, A.; Ishikawa, Y.; Gomi, T.; Shiraki, K.; Miyata, S. Effect of ground cover on splash and sheetwash erosion over a steep forested hillslope: A plot-scale study. CATENA 2011, 85, 34–47. [Google Scholar] [CrossRef]
- Römkens, M.J.M.; Helming, K.; Prasad, S.N. Soil erosion under different rainfall intensities, surface roughness, and soil water regimes. Catena 2002, 46, 103–123. [Google Scholar] [CrossRef]
- Liu, H.; Blagodatsky, S.; Giese, M.; Liu, F.; Xu, J.; Cadisch, G. Impact of herbicide application on soil erosion and induced carbon loss in a rubber plantation of Southwest China. CATENA 2016, 145, 180–192. [Google Scholar] [CrossRef]
- Marzen, M.; Iserloh, T.; Casper, M.C.; Ries, J.B. Quantification of particle detachment by rain splash and wind-driven rain splash. CATENA 2015, 127, 135–141. [Google Scholar] [CrossRef]
- Campo, J.; Gimeno-García, E.; Andreu Pérez, V.; González-Pelayo, Ó.; Rubio, J.L. Effects of experimental repeated fires in the soil aggregation and its temporal evolution. In Proceedings of the EGU General Assembly 2013, Vienna, Austria, 7–12 April 2013. [Google Scholar]
- Fukuyama, T.; Takenaka, C. Upward mobilization of 137Cs in surface soils of Chamaecyparis obtusa Sieb. et Zucc. (hinoki) plantation in Japan. Sci. Total Environ. 2004, 318, 187–195. [Google Scholar] [CrossRef]
- Remke, A.; Rodrigo-Comino, J.; Gyasi-Agyei, Y.; Cerdà, A.; Ries, J.B. Combining the Stock Unearthing Method and Structure-from-Motion Photogrammetry for a Gapless Estimation of Soil Mobilisation in Vineyards. ISPRS Int. J. Geo-Inf. 2018, 7, 461. [Google Scholar] [CrossRef]
- Di Stefano, C.; Ferro, V.; Palmeri, V.; Pampalone, V. Measuring rill erosion using structure from motion: A plot experiment. CATENA 2017, 156, 383–392. [Google Scholar] [CrossRef]
- Cerdà, A. Effects of rock fragment cover on soil infiltration, interrill runoff and erosion. Eur. J. Soil Sci. 2001, 52, 59–68. [Google Scholar] [CrossRef]
- Lesschen, J.P.; Cammeraat, L.H.; Nieman, T. Erosion and terrace failure due to agricultural land abandonment in a semi-arid environment. Earth Surf. Process. Landf. 2008, 33, 1574–1584. [Google Scholar] [CrossRef]
- Bergkamp, G.; Cerdà, A.; Imeson, A.C. Magnitude-frequency analysis of water redistribution along a climate gradient in Spain. CATENA 1999, 37, 129–146. [Google Scholar] [CrossRef]
- Baiamonte, G.; Minacapilli, M.; Novara, A.; Gristina, L. Time Scale Effects and Interactions of Rainfall Erosivity and Cover Management Factors on Vineyard Soil Loss Erosion in the Semi-Arid Area of Southern Sicily. Water 2019, 11, 978. [Google Scholar] [CrossRef]
- Biddoccu, M.; Opsi, F.; Cavallo, E. Relationship between runoff and soil losses with rainfall characteristics and long-term soil management practices in a hilly vineyard (Piedmont, NW Italy). Soil Sci. Plant Nutr. 2014, 60, 92–99. [Google Scholar] [CrossRef] [Green Version]
- Lavee, H.; Imeson, A.C.; Sarah, P. The impact of climate change on geomorphology and desertification along a mediterranean-arid transect. Land Degrad. Dev. 1998, 9, 407–422. [Google Scholar] [CrossRef]
- Sadeghi, S.H.; Kiani Harchegani, M.; Asadi, H. Variability of particle size distributions of upward/downward splashed materials in different rainfall intensities and slopes. Geoderma 2017, 290, 100–106. [Google Scholar] [CrossRef]
- Sanchez-Moreno, J.F.; Mannaerts, C.M.; Jetten, V.; Löffler-Mang, M. Rainfall kinetic energy–intensity and rainfall momentum–intensity relationships for Cape Verde. J. Hydrol. 2012, 454–455, 131–140. [Google Scholar] [CrossRef]
- Wang, L.; Shi, Z.H.; Wang, J.; Fang, N.F.; Wu, G.L.; Zhang, H.Y. Rainfall kinetic energy controlling erosion processes and sediment sorting on steep hillslopes: A case study of clay loam soil from the Loess Plateau, China. J. Hydrol. 2014, 512, 168–176. [Google Scholar] [CrossRef]
- Biddoccu, M.; Zecca, O.; Audisio, C.; Godone, F.; Barmaz, A.; Cavallo, E. Assessment of Long-Term Soil Erosion in a Mountain Vineyard, Aosta Valley (NW Italy). Land Degrad. Dev. 2018, 29, 617–629. [Google Scholar] [CrossRef]
- Vanwalleghem, T.; Amate, J.I.; de Molina, M.G.; Fernández, D.S.; Gómez, J.A. Quantifying the effect of historical soil management on soil erosion rates in Mediterranean olive orchards. Agric. Ecosyst. Environ. 2011, 142, 341–351. [Google Scholar] [CrossRef]
- Cerdà, A. Effect of climate on surface flow along a climatological gradient in Israel: A field rainfall simulation approach. J. Arid Environ. 1998, 38, 145–159. [Google Scholar] [CrossRef]
- Dunne, T.; Malmon, D.V.; Mudd, S.M. A rain splash transport equation assimilating field and laboratory measurements. J. Geophys. Res. F Earth Surf. 2010, 115. [Google Scholar] [CrossRef]
- Boix-Fayos, C.; Martínez-Mena, M.; Arnau-Rosalén, E.; Calvo-Cases, A.; Castillo, V.; Albaladejo, J. Measuring soil erosion by field plots: Understanding the sources of variation. Earth-Sci. Rev. 2006, 78, 267–285. [Google Scholar] [CrossRef]
- Stroosnijder, L. Measurement of erosion: Is it possible? Catena 2005, 64, 162–173. [Google Scholar] [CrossRef]
- Iserloh, T.; Fister, W.; Seeger, M.; Willger, H.; Ries, J.B. A small portable rainfall simulator for reproducible experiments on soil erosion. Soil Tillage Res. 2012, 124, 131–137. [Google Scholar] [CrossRef]
- Iserloh, T.; Ries, J.B.; Arnáez, J.; Boix-Fayos, C.; Butzen, V.; Cerdà, A.; Echeverría, M.T.; Fernández-Gálvez, J.; Fister, W.; Geißler, C.; et al. European small portable rainfall simulators: A comparison of rainfall characteristics. Catena 2013, 110, 100–112. [Google Scholar] [CrossRef] [Green Version]
- Gholami, L.; Sadeghi, S.H.; Homaee, M. Straw mulching effect on splash erosion, runoff, and sediment yield from eroded plots. Soil Sci. Soc. Am. J. 2013, 77, 268. [Google Scholar] [CrossRef]
- Rodrigo-Comino, J.; Senciales, J.M.; Sillero-Medina, J.A.; Gyasi-Agyei, Y.; Ruiz-Sinoga, J.D.; Ries, J.B. Analysis of Weather-Type-Induced Soil Erosion in Cultivated and Poorly Managed Abandoned Sloping Vineyards in the Axarquía Region (Málaga, Spain). AirSoil Water Res. 2019, 12, 1178622119839403. [Google Scholar] [CrossRef]
- Cerdà, A.; Ackermann, O.; Terol, E.; Rodrigo-Comino, J. Impact of Farmland Abandonment on Water Resources and Soil Conservation in Citrus Plantations in Eastern Spain. Water 2019, 11, 824. [Google Scholar] [CrossRef]
- Jordán, A.; Zavala, L.M.; Granged, A.J.P.; Gordillo-Rivero, Á.J.; García-Moreno, J.; Pereira, P.; Bárcenas-Moreno, G.; de Celis, R.; Jiménez-Compán, E.; Alanís, N. Wettability of ash conditions splash erosion and runoff rates in the post-fire. Sci. Total Environ. 2016, 572, 1261–1268. [Google Scholar] [CrossRef] [PubMed]
- Ma, Y.; Li, X.; Guo, L.; Lin, H. Hydropedology: Interactions between pedologic and hydrologic processes across spatiotemporal scales. Earth-Sci. Rev. 2017, 171, 181–195. [Google Scholar] [CrossRef]
- Fernández-Raga, M.; Fraile, R.; Keizer, J.J.; Varela Teijeiro, M.E.; Castro, A.; Palencia, C.; Calvo, A.I.; Koenders, J.; Da Costa Marques, R.L. The kinetic energy of rain measured with an optical disdrometer: An application to splash erosion. Atmos. Res. 2010, 96, 225–240. [Google Scholar] [CrossRef]
- Jomaa, S.; Barry, D.A.; Brovelli, A.; Heng, B.C.P.; Sander, G.C.; Parlange, J.-Y.; Rose, C.W. Rain splash soil erosion estimation in the presence of rock fragments. CATENA 2012, 92, 38–48. [Google Scholar] [CrossRef] [Green Version]
- Geißler, C.; Kühn, P.; Böhnke, M.; Bruelheide, H.; Shi, X.; Scholten, T. Splash erosion potential under tree canopies in subtropical SE China. CATENA 2012, 91, 85–93. [Google Scholar] [CrossRef]
- Beguería, S.; Angulo-Martínez, M.; Gaspar, L.; Navas, A. Detachment of soil organic carbon by rainfall splash: Experimental assessment on three agricultural soils of Spain. Geoderma 2015, 245–246, 21–30. [Google Scholar]
- Angulo-Martínez, M.; Beguería, S.; Navas, A.; Machín, J. Splash erosion under natural rainfall on three soil types in NE Spain. Geomorphology 2012, 175–176, 38–44. [Google Scholar]
- Poesen, J.; Torri, D. The effect of cup size on splash detachment and transport measurements. Part I. Field measurements. Geomorphic Process. Environ. Strong Seas. Contrasts 1988, 12, 113–126. [Google Scholar]
- Leguédois, S.; Planchon, O.; Legout, C.; Le Bissonnais, Y. Splash Projection Distance for Aggregated Soils. Soil Sci. Soc. Am. J. 2005, 69, 30–37. [Google Scholar] [CrossRef]
- Morgan, R.P.C. Field studies of rainsplash erosion. Earth Surf. Process. 1978, 3, 295–299. [Google Scholar] [CrossRef]
- Scholten, T.; Geißler, C.; Goc, J.; Kühn, P.; Wiegand, C. A new splash cup to measure the kinetic energy of rainfall. J. Plant Nutr. Soil Sci. 2011, 174, 596–601. [Google Scholar] [CrossRef]
- Lassu, T.; Seeger, M.; Peters, P.; Keesstra, S.D. The Wageningen rainfall simulator: Set-up and calibration of an indoor nozzle-type rainfall simulator for soil erosion studies. Land Degrad. Dev. 2015, 26, 604–612. [Google Scholar] [CrossRef]
- Jameson, A.R.; Kostinski, A.B. What is a Raindrop Size Distribution? Bull. Amer. Meteor. Soc. 2001, 82, 1169–1178. [Google Scholar] [CrossRef]
- Fernández-Raga, M.; Castro, A.; Palencia, C.; Calvo, A.I.; Fraile, R. Rain events on 22 October 2006 in León (Spain): Drop size spectra. Atmos. Res. 2009, 93, 619–635. [Google Scholar] [CrossRef]
- de Sousa Júnior, S.F.; Mendes, T.A.; de Siqueira, E.Q.; de Sousa Júnior, S.F.; Mendes, T.A.; de Siqueira, E.Q. Development and calibration of a rainfall simulator for hydrological studies. RBRH 2017, 22. [Google Scholar] [CrossRef] [Green Version]
- Thomsen, L.M.; Baartman, J.E.M.; Barneveld, R.J.; Starkloff, T.; Stolte, J. Soil surface roughness: Comparing old and new measuring methods and application in a soil erosion model. Soil 2015, 1, 399–410. [Google Scholar] [CrossRef]
- Valizadeh, S.; Hakimian, H. Evaluation of waste management options using rapid impact assessment matrix and Iranian Leopold matrix in Birjand, Iran. Int. J. Environ. Sci. Technol. 2018, 16, 3337–3354. [Google Scholar] [CrossRef]
- Jebelli, J.; Madramootoo, C.; Gebru, G.T. A Simplified Matrix Approach to Perform Environmental Impact Assessment of Small-scale Irrigation Schemes: An Application to Mekabo Scheme in Tigray, Ethiopia. Am. J. Environ. Eng. 2017, 7, 21–34. [Google Scholar]
- Zhou, H.; Peng, X.; Darboux, F. Effect of Rainfall Kinetic Energy on Crust Formation and Interrill Erosion of an Ultisol in Subtropical China. Vadose Zone J. 2013, 12. [Google Scholar] [CrossRef]
- Ma, B.; Yu, X.; Ma, F.; Li, Z.; Wu, F. Effects of Crop Canopies on Rain Splash Detachment. PLoS ONE 2014, 9, e99717. [Google Scholar] [CrossRef] [PubMed]
- Jomaa, S.; Barry, D.A.; Brovelli, A.; Sander, G.C.; Parlange, J.-Y.; Heng, B.C.P.; Tromp-van Meerveld, H.J. Effect of raindrop splash and transversal width on soil erosion: Laboratory flume experiments and analysis with the Hairsine–Rose model. J. Hydrol. 2010, 395, 117–132. [Google Scholar] [CrossRef]
- Liu, W.; Luo, Q.; Li, J.; Wang, P.; Lu, H.; Liu, W.; Li, H. The effects of conversion of tropical rainforest to rubber plantation on splash erosion in Xishuangbanna, SW China. Hydrol. Res. 2015, 46, 168–174. [Google Scholar] [CrossRef]
- Kavian, A.; Alipour, A.; Soleimani, K.; Gholami, L.; Smith, P.; Rodrigo-Comino, J. The increase of rainfall erosivity and initial soil erosion processes due to rainfall acidification. Hydrol. Process. 2019, 33, 261–270. [Google Scholar] [CrossRef]
- Poesen, J.W.; Torri, D.; Bunte, K. Effects of rock fragments on soil erosion by water at different spatial scales: A review. CATENA 1994, 23, 141–166. [Google Scholar] [CrossRef]
- Mermut, A.R.; Luk, S.H.; Römkens, M.J.M.; Poesen, J.W.A. Soil loss by splash and wash during rainfall from two loess soils. Geoderma 1997, 75, 203–214. [Google Scholar] [CrossRef]
- Katebikord, A.; Khaledi Darvishan, A.; Alavi, S.J. Changeability of soil erosion variables in small field plots from different rainfall durations with constant intensity. J. Afr. Earth Sci. 2017, 129, 751–758. [Google Scholar] [CrossRef]
Figure 1.
Splash devices used in this study: (a) cup, (b) funnel, (c) gutter, (d) tower of funnels, (e) Morgan tray, and (f) Tübingen cup (Tcup).
Figure 1.
Splash devices used in this study: (a) cup, (b) funnel, (c) gutter, (d) tower of funnels, (e) Morgan tray, and (f) Tübingen cup (Tcup).

Figure 2.
Rainfall simulator of Wageningen University and Research; (a) Rainfall simulator plot during one experiment; (b) splash cups; and, (c) sediment collector.
Figure 2.
Rainfall simulator of Wageningen University and Research; (a) Rainfall simulator plot during one experiment; (b) splash cups; and, (c) sediment collector.

Figure 3.
Schema of the plot used for rainfall simulation with the mean intensity distribution along the area, and the position of the splash devices individual on the left and gutter on the right. The symbol “+ “means the position of the gauges to measure the intensity of the rain.
Figure 3.
Schema of the plot used for rainfall simulation with the mean intensity distribution along the area, and the position of the splash devices individual on the left and gutter on the right. The symbol “+ “means the position of the gauges to measure the intensity of the rain.

Figure 4.
Comparison of the splashed soil recovered at different rainfall intensities using the funnel, cup, Morgan, and Tcup devices.
Figure 4.
Comparison of the splashed soil recovered at different rainfall intensities using the funnel, cup, Morgan, and Tcup devices.

Figure 5.
Splashed soil recovered in the gutter device (in relation to different mean intensities observed in the left and right side of the plot).
Figure 5.
Splashed soil recovered in the gutter device (in relation to different mean intensities observed in the left and right side of the plot).

Figure 6.
Splashed soil recovered with the tower of funnels using different rainfall intensities.

Figure 7.
Relationships between splash erosion measured with cup and funnel devices (only the mean values per each intensity are presented for both devices).
Figure 7.
Relationships between splash erosion measured with cup and funnel devices (only the mean values per each intensity are presented for both devices).

Figure 8.
Bland Altman plot to represent a comparison between the average and the difference of cup and funnel measurements (left part) and Morgan and Tcup ones (right part).
Figure 8.
Bland Altman plot to represent a comparison between the average and the difference of cup and funnel measurements (left part) and Morgan and Tcup ones (right part).

Figure 9.
Correlation of splash erosion recovered with Tcup and Morgan system.


Table 1.
Rainfall experiments conducted with bounded and unbounded splash devices, including the number and intervals of coincidence of rainfall intensities.
Table 1.
Rainfall experiments conducted with bounded and unbounded splash devices, including the number and intervals of coincidence of rainfall intensities.
| Types | Funnel | Cup | Tcup | Morgan | Total | ||||||
|---|---|---|---|---|---|---|---|---|---|---|---|
| n | P | I | P | I | P | I | P | I | P | I | |
| n | mm/h | n | mm/h | n | mm/h | n | mm/h | n | mm/h | ||
| Funnel | 48 | 48 | 60–176 | 23 | 69–172 | 15 | 69–173 | 20 | 69–142 | 15 | 69–116 |
| Cup | 48 | 23 | 69–173 | 48 | 69–173 | 15 | 69–173 | 19 | 69–142 | 15 | 69–116 |
| Tcup | 40 | 15 | 69–173 | 15 | 69–173 | 50 | 66–204 | 20 | 66–144 | 15 | 69–116 |
| Morgan | 42 | 20 | 69–142 | 19 | 69–142 | 20 | 66–144 | 42 | 69–144 | 15 | 69–116 |
n: number of repetitions; P: points; I: intensity. Note: Gutter has 15 measurements recording 121 mm/h and 15 measurements with 135.86 mm/h. Tower of funnels has six measurements with intensities from 108 to 162.8 mm/h (13 levels of height per measurement).
Table 2.
Splashed soil measured with different devices after 10 min of simulated rain with different intensities (60–150 mm h−1).
Table 2.
Splashed soil measured with different devices after 10 min of simulated rain with different intensities (60–150 mm h−1).
| Type | N | Average | S.D. | Maximum | Minimum | Normality Test (KS/SW) | ||
| (g h mm−1 m−2) | (g h mm−1 m−2) | (g h mm−1 m−2) | Statistic | P-value | P | |||
| Funnel | 48 | 0.84 | 0.17 | 1.12 | 0.5 | 0.97 | 0.28 | yes |
| Cup | 48 | 0.17 | 0.04 | 0.25 | 0.09 | 0.97 | 0.26 | yes |
| Gutter | 30 | 0.38 | 0.07 | 0.52 | 0.25 | 0.96 | 0.28 | yes |
| Tf | 78 | 0.05 | 0.14 | 0.65 | 0 | 0.36 | 0 | no |
| Tcup | 50 | 9.80 | 3.51 | 19.73 | 3.33 | 0.11 | 0.09 | yes |
| Morgan | 42 | 3.18 | 0.66 | 4.69 | 2.25 | 0.93 | 0.01 | no |
| Tf | N | Average | S.D. | Maximum | Minimum | Normality Test (KS/SW) | ||
| H (m) | (g h mm−1 m−2) | (g h mm−1 m−2) | (g h mm−1 m−2) | Statistic | P-value | P | ||
| 0.075 | 6 | 0.48 | 0.18 | 0.65 | 0.19 | 0.89 | 0.307 | yes |
| 0.185 | 6 | 0.07 | 0.03 | 0.12 | 0.03 | 0.89 | 0.316 | yes |
| 0.295 | 6 | 0.04 | 0.03 | 0.11 | 0.01 | 0.89 | 0.328 | yes |
| 0.405 | 6 | 0.02 | 0.02 | 0.06 | 0 | 0.92 | 0.476 | yes |
| 0.515 | 6 | 0.01 | 0.01 | 0.03 | 0 | 0.93 | 0.589 | yes |
| 0.625 | 6 | 0.01 | 0.01 | 0.03 | 0 | 0.92 | 0.504 | yes |
| 0.735 | 6 | 0.01 | 0.01 | 0.03 | 0 | 0.78 | 0.037 | no |
| 0.845 | 6 | 0.00 | 0.01 | 0.03 | 0 | 0.76 | 0.026 | no |
| 0.955 | 6 | 0.01 | 0.01 | 0.03 | 0 | 0.89 | 0.311 | yes |
| 1.065 | 6 | 0.01 | 0.01 | 0.02 | 0 | 0.81 | 0.068 | yes |
| 1.175 | 6 | 0.01 | 0.01 | 0.04 | 0.00 | 0.75 | 0.018 | no |
| 1.285 | 6 | 0.01 | 0.01 | 0.04 | 0 | 0.88 | 0.266 | yes |
| 1.395 | 6 | 0.01 | 0.01 | 0.04 | 0 | 0.90 | 0.392 | yes |
N: number of rainfall simulation experiments; S.D.: standard deviation; Tf: Tower of funnel; S: Kolmogorov Smirnov test (with correction of Lilliefors) performed for 50 or more samples; H: height; SW: Shapiro-Wilk test for less than 50 samples; P: Parametric.
Table 3.
Significant correlation coefficients between rainfall intensities and splash erosion measured with different devices.
Table 3.
Significant correlation coefficients between rainfall intensities and splash erosion measured with different devices.
| Device | Index | Correlation Coefficient | P-Value |
|---|---|---|---|
| Funnel | Pearson | 0.711 ** | <0.001 |
| Morgan | Spearman rho | 0.478 * | 0.033 |
| Tcup | Pearson | 0.509 * | 0.022 |
| Cup | Pearson | 0.039 | 0.065 |
(**) Significant at a 99% confidence level and (*) significant at 95% confidence level.
Table 4.
Significant correlations at the 95% confidence level between the splash erosion measurements obtained with different devices.
Table 4.
Significant correlations at the 95% confidence level between the splash erosion measurements obtained with different devices.
| Devices | Index | Correlation Coefficient | P-Value |
|---|---|---|---|
| Gutter/cup | Pearson | 0.484 * | 0.007 |
| Gutter/Tcup | Pearson | 0.444 | 0.014 |
| Gutter/tower | Pearson | −0.443 | 0.014 |
| Gutter/Morgan | Spearman rho | −0.383 | 0.037 |
| Tcup/funnel | Pearson | 0.547 | 0.012 |
| Morgan/tower | Spearman rho | 0.449 * | 0.003 |
* Significant at a 99% confidence level.
Table 5.
Linear regression equations relating to splash devices results and rainfall intensities. Factors proving such adjustment are also presented.
Table 5.
Linear regression equations relating to splash devices results and rainfall intensities. Factors proving such adjustment are also presented.
| Equation | R2 | Adjusted R2 | P-Value | D-W |
|---|---|---|---|---|
| Funnel = 5.931 + 0.015Tcup + 0.702Int | 0.591 | 0.543 | 0.001 | 2.298 |
| Funnel = 5.189 + 0.842Int | 0.540 | 0.514 | <0.001 | --- |
| Funnel = 0.022 + 0.811Int + 0.025Morg | 0.542 | 0.488 | 0.001 | --- |
| Funnel = 10.739 + 0.834Int + 0.028Morg − 0.869Cup | 0.553 | 0.469 | 0.004 | 1.864 |
| Funnel = 16.263 + 0.867Int − 0.854Cup | 0.551 | 0.498 | 0.001 | 1.308 |
| Funnel = −15.077 + 0.033Tcup + 0.229Morg | 0.495 | 0.436 | 0.003 | 2.103 |
| Tcup = 942.026+ 8.858Int − 3.21Morg | 0.359 | 0.284 | 1.704 | |
| Tcup = 35.001 + 9.245Funnel | 0.300 | 0.261 | 0.012 | 1.638 |
| Tcup = 160.957 + 6.485Int | 0.259 | 0.218 | 1.704 | |
| Morg = 243.293 + 0.739Int | 0.257 | 0.216 | 0.023 | 1.096 |
| Morg = 230.341 + 0.724Int + 0.919Cup | 0.260 | 0.173 | 0.077 | 1.096 |
Int: mean intensity; Morg: Morgan; Tcup: Tübingen cup; D-W: Durbin Watson residues distribution.
Table 6.
Complementary information about the splash devices scored from 1 (lowest value) to 3 (highest value).
(A)
| Comparison among Splash Devices | ||||||
|---|---|---|---|---|---|---|
| Evaluated Parameter | Funnel | Cup | Gutter | Tower of Funnels | Tcup | Morgan |
| Possibility of been used in the field | 3 | 3 | 2 | 3 | 3 | 3 |
| Installation weight | 3 | 3 | 1 | 1 | 2 | 2 |
| Installation size | 3 | 3 | 1 | 1 | 3 | 1 |
| Disturbance of soil surface during installation | 2 | 3 | 2 | 3 | 3 | 2 |
| Price | 3 | 3 | 2 | 1 | 2 | 2 |
| Difficulty on the collection of samples | 3 | 3 | 3 | 2 | 3 | 2 |
| Possibility of losing sample when collected | 3 | 2 | 2 | 3 | 3 | 2 |
| It collects information that no other device does | 1 | 1 | 1 | 3 | 1 | 2 |
| Total | 21 | 21 | 14 | 17 | 20 | 16 |
(B)
| Evaluated Parameter | Points | Rubric |
|---|---|---|
| Price | 1 | More than 20 euros per plot |
| 2 | Between 10–20 euros per plot | |
| 3 | Less than 10 euros | |
| Installation weigh | 1 | More than 1 kg |
| 2 | From 0.2 to 1 kg | |
| 3 | Less than 0.2 kg | |
| Installation size | 1 | Bigger than 200 cm3 |
| 2 | From 200–100 cm3 | |
| 3 | Less than 100 cm3 | |
| Disturbance of soil surface during installation | 1 | The installation produces some disturbance |
| 2 | The installation produces very little disturbance | |
| 3 | The installation hardly produces disturbance | |
| Difficulty on the collection of samples | 1 | It cannot be done by one person alone |
| 2 | It can be done by one person but with more time | |
| 3 | It can be done by one person fast. | |
| Possibility of losing sample when collecting | 1 | It is very likely to lose some sample during sampling |
| 2 | It is possible to lose some sample during sampling | |
| 3 | It is impossible to lose sample in the sampling | |
| Possibility of been used in the field | 1 | It is very difficult to install in the field (only rainfall simulations) |
| 2 | It is difficult to install in the field | |
| 3 | It is easy to install in the field | |
| It collects information that no other device does | 1 | It does not collect different information |
| 2 | It collects different information | |
| 3 | It does collect special information |
Table 7.
Summary of splash rates reported in the literature using different splash devices.
| Maximum Splash Detachment Rate | Minimum Splash Detachment Rate | ||||||||
|---|---|---|---|---|---|---|---|---|---|
| Ref. | Device | R-U | RI | CR | R-U | RI | CR | ||
| Zhou et al. [53] | cup | 0.78 | g min−1 | 38 mm h−1 | 27 mm | 0.1 | g min−1 | 38 mm h−1 | 10 mm |
| Ma et al. [54] | cup | 930.11 | g m−2 h−1 | 59.94 mm h−1 | n.a. | 41.43 | g m−2 h−1 | 31.52 mm h−1 | n.a. |
| Fernández-Raga et al. [37] | cup | 100 | g m−2 | n.a. | 131.7 mm | 2.3 | g m−2 | n.a. | 1.5 mm |
| Fernández-Raga [48] | funnel | 220 | g m−2 | n.a. | 131.7 mm | 6 | g m−2 | n.a. | 1.5 mm |
| Jordán et al. [35] | funnel | 21.74 | g | 360 mm h−1 | 60 mm | 1.29 | g | 360 mm h−1 | 60 mm |
| Jomaa et al. [38] | flume | 2000 | g m−2 | 80 l m−1 | n.a. | n.a. | n.a. | n.a. | |
| Jomaa et al. [55] | flume | 603 | g | 60 mm h−1 | n.a. | 301 | g | 60 mm h−1 | n.a. |
| GeiBler et al. [39] | Tcup | 77.42 | g m−2 | n.a. | 37 mm | 9.93 | g m−2 | n.a. | 21 mm |
| Liu et al. [56] | Tcup | 9000 | g m−2 | 7 mm/10 min−1 | 55 mm | 10 | g m−2 | 1 mm/10 min−1 | 5 mm |
| Beguería et al. [40] | Morgan | 2.77 | g | 92.9 mm h−1 | n.a. | 0.22 | g | 92.9 mm h−1 | n.a. |
| Beguería et al. [40] | Morgan | 5642.98 | g m−2 | 92.9 mm h−1 | n.a. | 448.9 | g m−2 | 92.9 mm h−1 | n.a. |
| Angulo-Martinez et al. [41] | Morgan | 6.06 | g | n.a. | 61.3 mm | 0.97 | g | n.a. | 8.2 mm |
| Angulo-Martinez et al. [41] | Morgan | 12,367.3 | g m−2 | n.a. | 61.3 mm | 1979.6 | g m−2 | n.a. | 8.2 mm |
Ref: reference; RI: rainfall intensity; n.a.: not available; CR: Cumulated rainfall; R-U: Rate and unit.
© 2019 by the authors. Licensee MDPI, Basel, Switzerland. This article is an open access article distributed under the terms and conditions of the Creative Commons Attribution (CC BY) license (http://creativecommons.org/licenses/by/4.0/).
Share and Cite
MDPI and ACS Style
Fernández-Raga, M.; Campo, J.; Rodrigo-Comino, J.; Keesstra, S.D. Comparative Analysis of Splash Erosion Devices for Rainfall Simulation Experiments: A Laboratory Study. Water 2019, 11, 1228. https://doi.org/10.3390/w11061228
AMA Style
Fernández-Raga M, Campo J, Rodrigo-Comino J, Keesstra SD. Comparative Analysis of Splash Erosion Devices for Rainfall Simulation Experiments: A Laboratory Study. Water. 2019; 11(6):1228. https://doi.org/10.3390/w11061228
Chicago/Turabian StyleFernández-Raga, María, Julián Campo, Jesús Rodrigo-Comino, and Saskia D. Keesstra. 2019. "Comparative Analysis of Splash Erosion Devices for Rainfall Simulation Experiments: A Laboratory Study" Water 11, no. 6: 1228. https://doi.org/10.3390/w11061228
Note that from the first issue of 2016, this journal uses article numbers instead of page numbers. See further details here.