Article

Towards Circular Water Neighborhoods: Simulation-Based Decision Support for Integrated Decentralized Urban Water Systems

by
Dimitrios Bouziotas
1,*,
Diederik van Duuren
2,3,
Henk-Jan van Alphen
1,
Jos Frijns
1,
Dionysios Nikolopoulos
4 and
Christos Makropoulos
1,4
1
KWR Watercycle Research Institute, Groningenhaven 7, 3433 PE Nieuwegein, The Netherlands
2
Waterleiding Maatschappij Limburg (WML), Limburglaan 25, 6229 GA Maastricht, The Netherlands
3
International Centre for Integrated assessment and Sustainable development (ICIS), Maastricht University, Kapoenstraat 2, 6211 KR Maastricht, The Netherlands
4
Department of Water Resources and Environmental Engineering, School of Civil Engineering, National Technical University of Athens (NTUA), Iroon Politechniou 5, 157 80 Zografou, Athens, Greece
*
Author to whom correspondence should be addressed.
Water 2019, 11(6), 1227; https://doi.org/10.3390/w11061227
Submission received: 14 May 2019 / Revised: 6 June 2019 / Accepted: 9 June 2019 / Published: 12 June 2019
(This article belongs to the Special Issue Centralized versus Decentralized Urban Water Systems)

Abstract

:
Centralized urban water management currently faces multiple challenges, both at the supply side and the demand side. These challenges underpin the need to progress to the decentralization of urban water, where multiple distributed technologies (water-aware appliances, rainwater harvesting, greywater recycling, sustainable urban drainage) are applied in an integrated fashion and as a supplement to centralized systems to design more resilient neighborhoods. However, the methods and tools to assess the performance of these distributed solutions and provide management support for integrated projects are still few and mostly untested in real, combined cases. This study presents a simulation-based framework for the quantitative performance assessment of decentralized systems at a neighborhood scale, where different technologies can be linked together to provide beneficial effects across multiple urban water cycle domains. This framework links an urban water cycle model, which provides a scenario-based simulation testbed for the response of the whole system, with key performance indicators that evaluate the performance of integrated decentralized solutions at a neighborhood scale. The demonstrated framework is applied to provide an ex ante evaluation of SUPERLOCAL, a newly developed area in Limburg, the Netherlands, designed as a circular, water-wise neighborhood where multiple decentralized technologies are combined.

1. Introduction

The conventional, centralized model of urban water management that delivers ‘big pipes in’ from multiple water sources to urban areas and drives ‘big pipes out’ to dispose urban wastewater has generated (and will likely continue to deliver) significant benefits to cities. Through this ‘hard path’ of water, cities worldwide enjoy reliable, constant clean water supply, improved health services, efficient disposal of their wastewater and simple operational and management structures. However, this path also faces multiple challenges and comes at a high cost of ecological degradation, social intrusion and capital intensity [1]. Challenges arise at the supply side, linked to aging—and progressively more susceptible to failures—large infrastructure, weak governance structures, limited investment opportunities for new infrastructure projects, but also a rapidly changing setting of water availability, driven by climate change and its impact on different water source types [2,3,4]. At the same time, the demand side also poses threats linked to rapid urbanization, demographic shifts and changing client behaviors that are often not met by adaptive policy changes [5,6,7].
Given this context, cities are becoming increasingly aware that there is a need to reconsider traditional water management models and substantially redesign the way freshwater resources are utilized [8]. A new, circular path of water is envisioned as an alternative to the conventional linear management model [1,9,10], which supplements large central infrastructure with an array of decentralized water options that are applied at different spatial scales within the city [11]. Water-aware appliances are envisioned to be used at a household level, in order to lessen demands at a household level, paired with neighborhood-scale decentralized measures, that aim to add local sources such as rainwater or groundwater to the distribution network, as well as recycle wastewater to cover part of the urban demands. This decentralized paradigm in water management aims at creating smart, water-aware units within the city, where multiple distributed technology options are integrated to provide a circular urban water management model that reduces-reuses-recycles, instead of the one that merely extracts, transports and disposes. The paradigm shift that is envisioned bears a close resemblance to broader socio-economic transitions that aim at reaching sustainability, such as the progression towards a model of circular economy [12,13].
This envisioned decentralization of urban water, however, will not come easily, as it brings a higher degree of system complexity and requires sectoral bodies, water utilities, communities and entrepreneurs to collaborate and co-design efficient implementation and uptake models [14,15]. Likewise, decision support systems that are designed based on the premise of central, externally provided water infrastructure now need to include the elaborate interplay between diverse decentralized technologies at multiple scales and across multiple urban water cycle domains, such as drinking water, wastewater and stormwater [16]. While numerous decision support frameworks of the metabolism type that target multiple urban water cycle streams exist, there are few applications in an integrated context that are able to include multiple decentralized options in a combined manner, let alone explore the underlying drivers of change such as future climates and social factors [17,18]. Studying the interplay between different technologies at different scales across multiple urban water cycle streams (drinking water, wastewater and stormwater), as well as finding a consistent way to translate this interplay into easily interpretable information for decision-making, remains a topic of ongoing research. The transition to new, circular urban water management models needs to be accompanied by holistic frameworks that are able to look into multiple water cycle domains, across many externalities (i.e., encompassing social, environmental, financial and technological factors) and can also quantify and visualize the advantages and disadvantages of decentralized systems in an efficient way.
Aiming to contribute to this body of research, this study presents a simulation-based framework suitable for the design and evaluation of integrated decentralized systems at a neighborhood scale. The framework is able to model distributed technologies, deployed at different spatial scales, such as household measures (e.g., water-saving appliances) as well as more upscaled interventions (e.g., neighborhood-scale rainwater harvesting designs) and provides quantitative insight into different aspects of the urban water cycle, related to all water streams (drinking water (DW), wastewater (WW) and rainwater-runoff (RW)). The quantitative insight is provided by linking together an urban water cycle model, which provides a scenario-based simulation testbed for the response of the whole system, with key performance indicators that evaluate the performance of combined solutions at neighborhood scale with regards to water quantity and can be easily communicated to stakeholders and decision-makers. The framework is applied for an ex ante evaluation of SUPERLOCAL, a circular water neighborhood that is designed in the area of Limburg, in the Netherlands, in order to draw conclusions on the performance of different integrated system designs that combine rainwater harvesting (RWH) with greywater recycling (GWR), among other circular water interventions.

2. Materials and Methods

2.1. A Simulation-Based Approach Towards (Re-)designing Circular Water Neighborhoods

Evidently, introducing decentralized options at the city is not a trivial management task. Decentralized options can be introduced in a combined manner at multiple spatial scales [19], for instance when designing a new blue-green large recreational area [20] or at smaller spatial units, such as the neighborhood or household level. Regardless of scale, the introduction of multiple decentralized technologies in an integrated fashion leads to effects on multiple urban water cycle domains that are commonly not evaluated or managed together. There is reduction in the clean, freshwater requested from central, DW services. Local freshwater sources, such as rainwater, are captured and used locally, while the introduction of a RWH scheme has an effect on stormwater retention that leads to an altered (slower and lower) runoff response at the outlet. Part of the generated WW in the neighborhood is treated locally and reused, thus reducing the quantity of WW propagated downstream, e.g., to centralized sewer services. These multi-domain effects need to be part of an integrated performance assessment to allow for a multi-faceted evaluation of the system of interest to all stakeholders. Moreover, such an integrated framework needs ideally to reach beyond the urban water cycle and explore external driving factors, such as climate change, behavioral client shifts, demographic changes, capital and operational costs etc., in order to account for the strong uncertainties seen in urban water management [21]. Research questions therefore arise, asking for integrated frameworks able to assess the performance and impact of a combined decentralized system that: (a) takes into account the aforementioned effects on multiple urban water cycle domains, (b) that can be expanded to account for multiple dimensions (e.g., social, technological, environmental and financial), which can be then considered drivers of change in the system.
In light of these questions, the contribution of this study is towards the development of a quantitative assessment framework, able to support decisions by evaluating the performance of the combined decentralized system in a way that can be easily interpreted by stakeholders. The demonstrated assessment framework links an urban water cycle model able to run predefined scenarios—which is the way to gain quantitative insights on the whole system performance—with a set of Key Performance Indicators (KPIs) that transform raw model output to scalar quantities that can be easily communicated to stakeholder groups. To apply this framework, the spatial unit of a neighborhood has been chosen, as it combines a wider array of applicable technologies and economy of scale over the household level [22], as well as a relatively small extent that allows replicability in multiple sites within a city or a set of similar cities. Within this context, the re-design of neighborhoods to include integrated decentralized systems can be defined as transitioning towards circular water neighborhoods, as an analogue to the transition towards circular cities [23].
The framework relies on urban water cycle model simulation [24] as a technique to mimic the response of the whole system ex ante and utilizes the Urban Water Optioneering Tool (UWOT) as a simulation testbed. UWOT is an urban water cycle model following the metabolism modelling type, able to simulate the complete urban water cycle by modelling individual water uses and technologies/options for managing them, starting from the household level and aggregating to a neighborhood or whole city scale [25,26]. UWOT simulates both urban water flows, i.e., potable water, wastewater and runoff, as well as their integration in terms of harvesting, reuse and recycling at different scales (from the household and neighborhood up to the city scale). UWOT has been developed and tested in previous urban water cycle modeling applications that include neighborhood-scale blue-green area design [20], whole city cycle modeling [26] and analyses of distributed neighborhood options under scenarios of urban growth [27], so it is in principle readily able to simulate integrated systems. This ability is demonstrated in a combined neighborhood-scale decentralized system in this study, building from experience in previous applications that have concentrated on one specific type of interventions [20], neighborhood-scale cases that feature either RWH or GWR but not a combined system [27] and a study of a simplified combined RWH and GWR system at a single household [28].
To model urban water flows, UWOT follows the so-called ‘signal language’: a signal-based systems analysis approach that starts from individual components (i.e., in-house appliances, units that use water and generate wastewater or runoff), and proceeds to the generation, transmission, aggregation and transformation of water demand signals that start from the household level and propagate towards the source of water demands, i.e., the central drinking water network [29]. UWOT then proceeds to match these demands with supply from different source types [26] and logs time steps when failure occurs, i.e., the demand cannot be met by provided supply. This demand-oriented conceptualization, seen in the right panel of Figure 1, places household and neighborhood demands as the starting point of every study and enables UWOT to simulate the whole urban water system tracing water demands from tap to source [26], as opposed to water supply flowing from source to tap (left panel of Figure 1).

2.2. The Case Study: The Circular Water Neighborhood of SUPERLOCAL

The case study to demonstrate the framework is the project of SUPERLOCAL, a joint venture of four local partners with distinct roles in the urban water cycle (Table 1), aiming at closing the water loop in the newly developed area of Parkstad Limburg in the Netherlands (Figure 2). This project comprises the redesign of an urban district, where one large flat becomes renovated and several housing units are planned to be built on the terrain of three older, demolished flats. In order to shift from the traditional, linear urban water management model to a circular, water-wise alternative, the four local partners have collaborated to install, operate and monitor a set of decentralized technologies that include:
  • Installing water-saving household devices that have a reduced water footprint and lead to lower demands at a tap (household) level. A portfolio of technologies such as vacuum toilets, water-saving showers and recirculation showers are planned to be installed in different household types (Table 2).
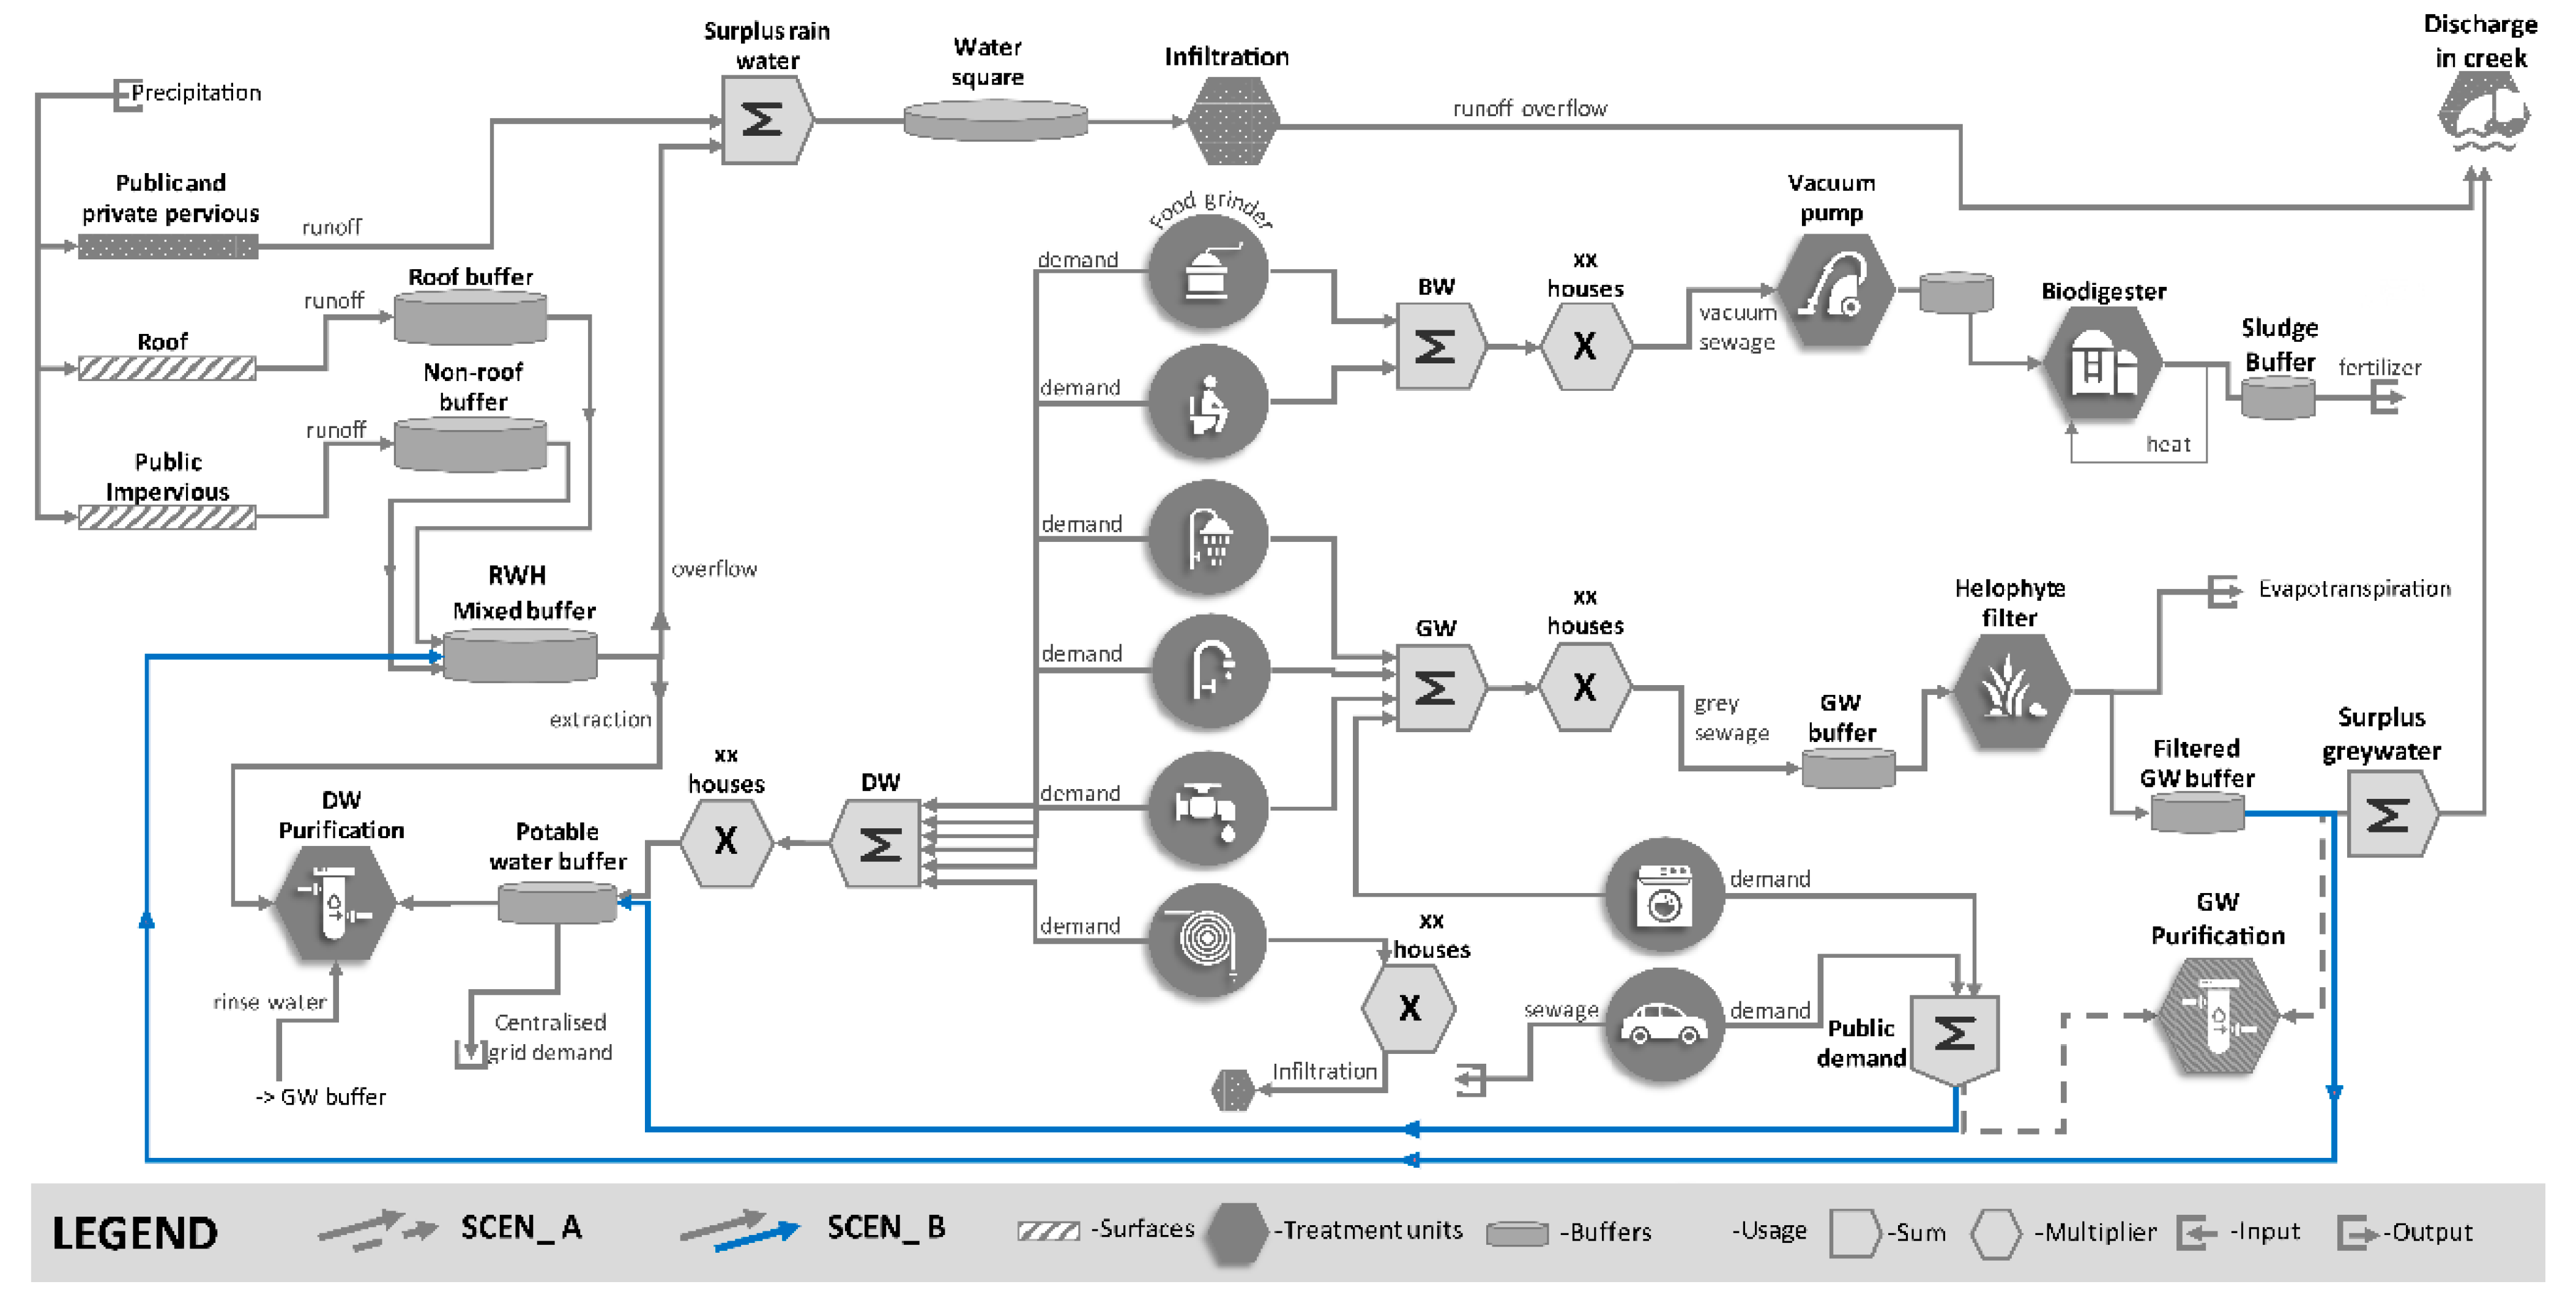
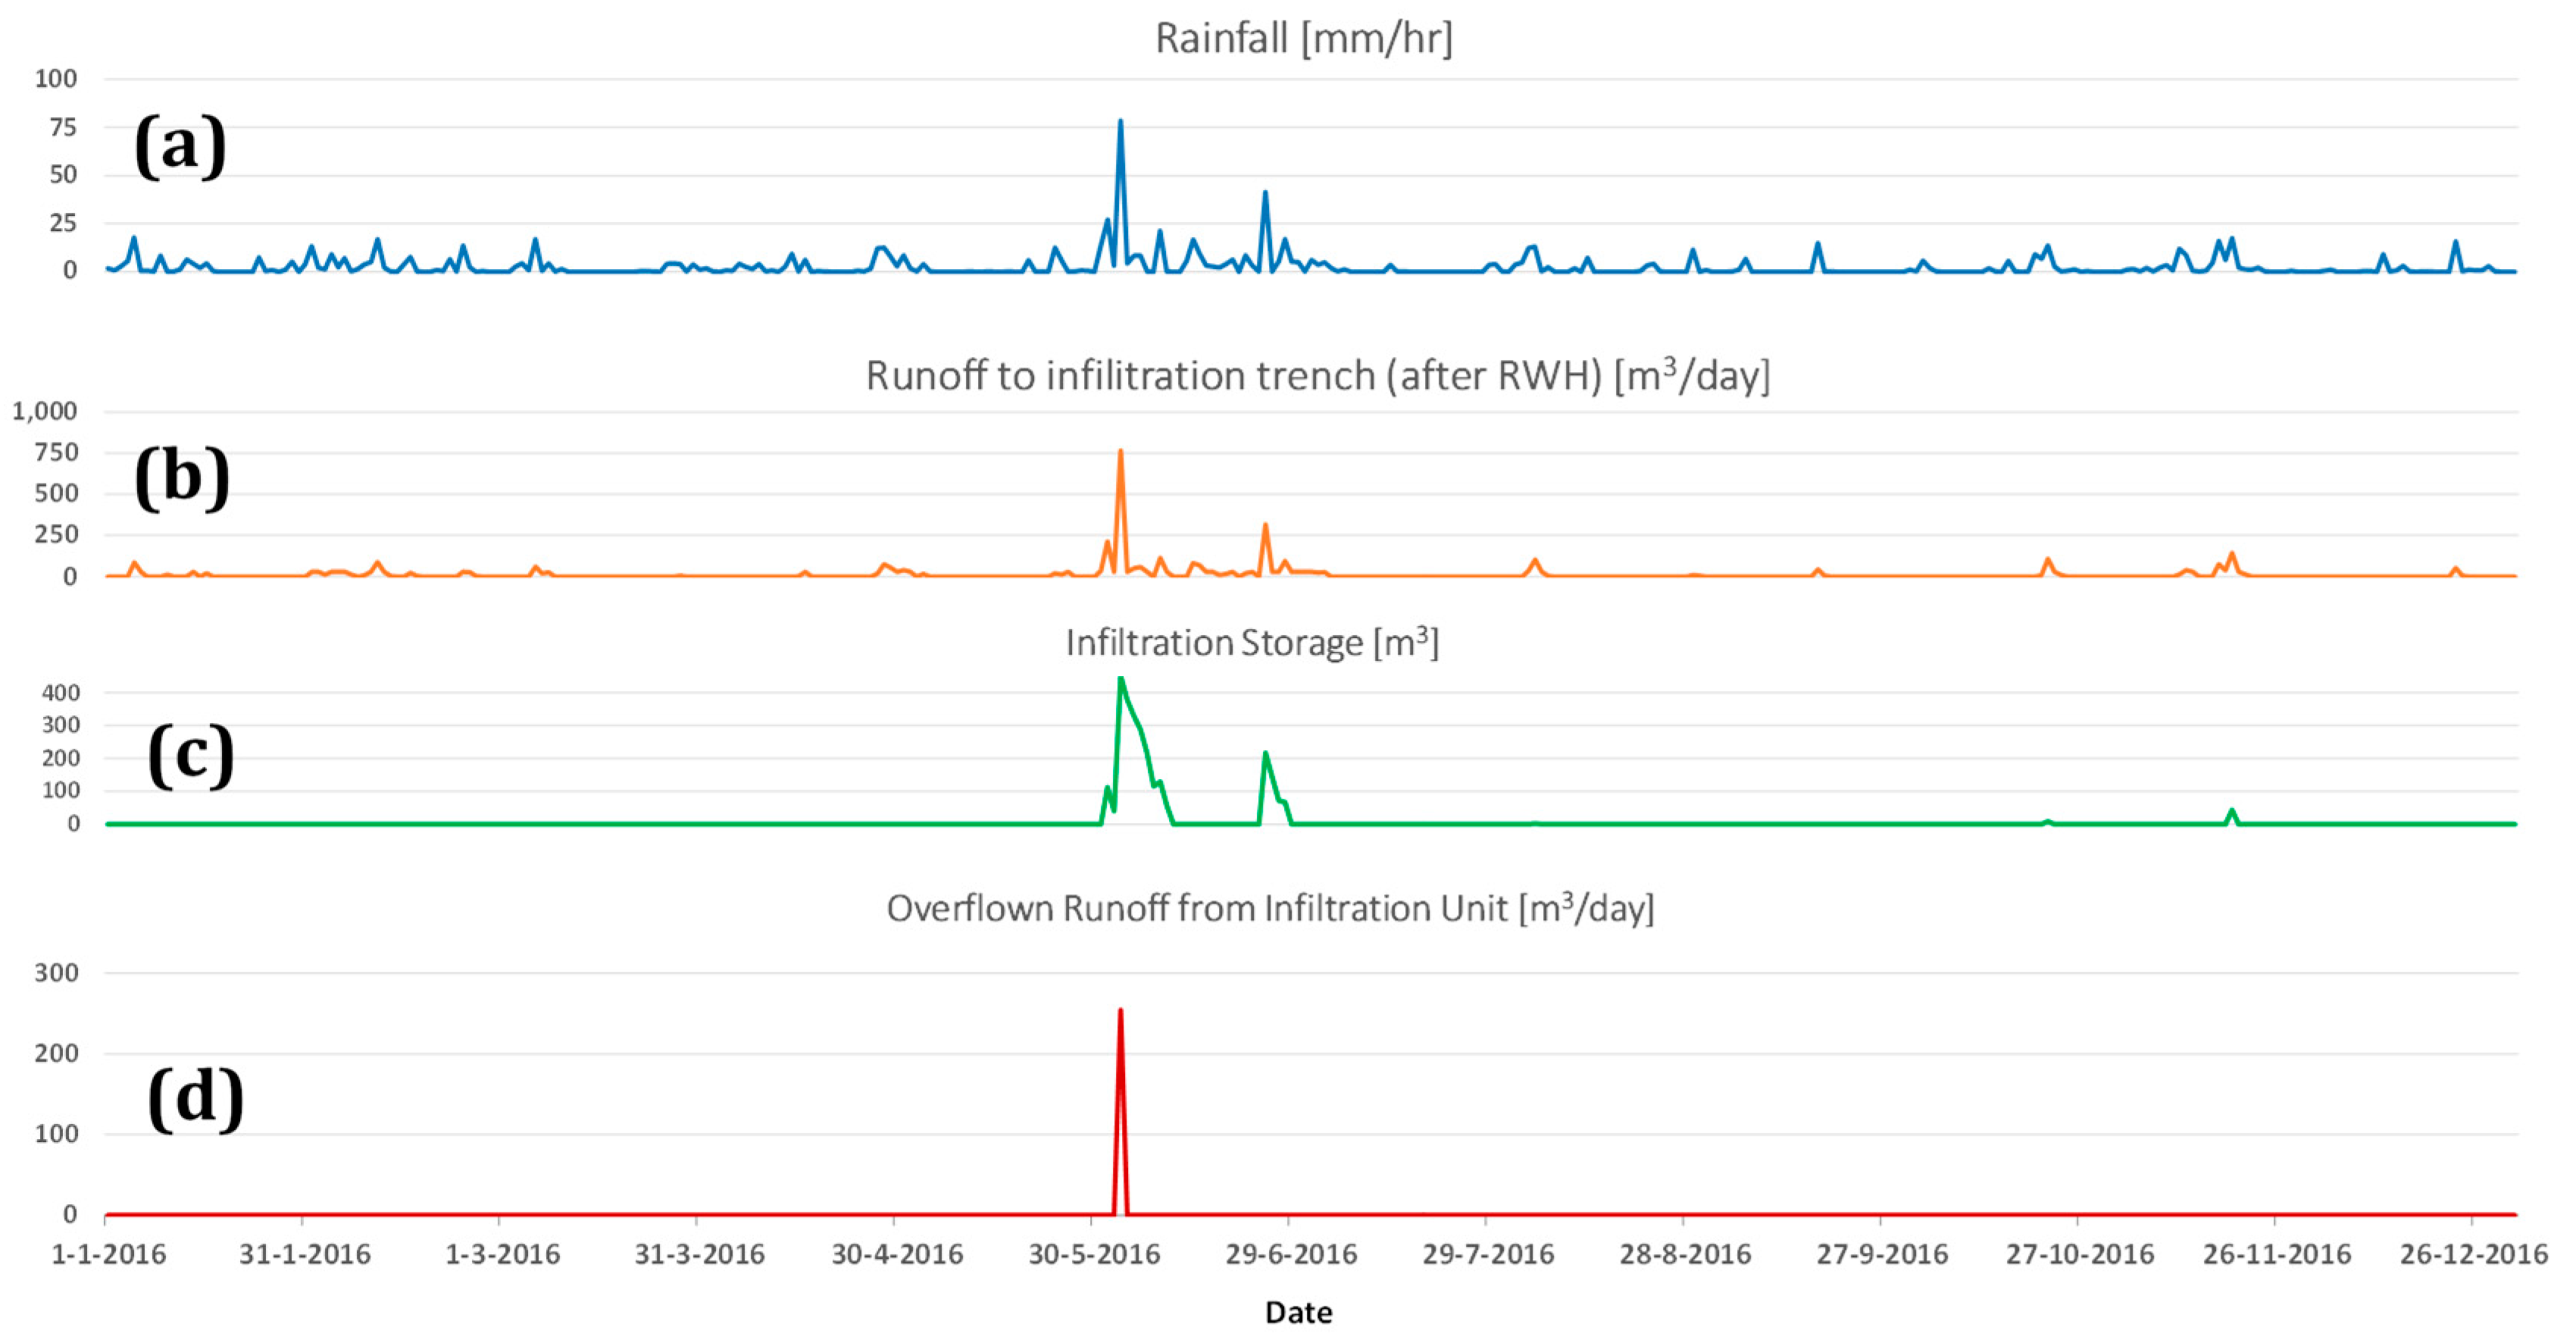
  • A rainwater harvesting (RWH) scheme at the neighborhood scale that collects water from household roofs and public (impervious) areas, purifies it and uses it to cover drinking water (DW) needs. Excess rainwater that is not captured is directed to a ‘water square’, a large infiltration basin designed to absorb rainwater through percolation. This measure constitutes a sustainable urban drainage system (SUDS) [30,31], aiming at capturing rainwater locally and not allowing it to reach the outlet of the neighborhood.
  • A greywater recycling (GWR) scheme at the neighborhood scale that collects wastewater (WW) from selected uses such as the shower and handbasin, purifies it through a nature-based helophyte filter and redirects it in the urban water cycle, for instance to be used in certain common uses such as a shared laundry unit and car wash facility.
  • A secondary (black water BW) sewage system processing water from vacuum toilets and food grinders in order to purify and reclaim resources and energy in a digester. This is an implementation of the ‘new sanitation’ concept, using the idea of separation of waste water at the source [32]. The inclusion of different sewage treatment options per (GW/BW) stream introduces a dual, parallel system that results in a higher GW quality and thus potential of reuse, as well as higher potential for energy and resource recovery in the BW stream rich in organic material. This concept requires the use of vacuum toilets (against other water-aware solutions), in order to maximize nutrient concentration in the BW stream and enable recovery.
These interventions are combined together in a set of proposed, integrated designs, in order to provide high-quality residential services that at the same time aim lead to: (a) less water use, which is the consequence of using appliances with a lower water footprint (i.e., water consumed per use) at a household level, (b) a slower runoff response, modified by the capacity of the system to store and absorb water and (c) an efficient water use policy at the local scale, where water remains locally for a longer time and is reused. This localization is based on employing neighborhood-scale harvesting, recycling and energy & material recovery technologies.
As part of the proposed designs, two options are being considered as potential operational systems for SUPERLOCAL. In the first design option, greywater is treated locally and is then used to cover specific shared water demands, such as a common laundry and car wash facility, while rainwater is captured and treated locally to cover the rest of the DW demands. This is the most likely case to be implemented in SUPERLOCAL, with two distinct local treatment systems (RWH and GWR) targeting different water uses. The second option that is considered extends GW reusability by considering treated GW as having the same quality characteristics as rainwater following a natural filtering step, thus being able to be mixed together with RW in a shared buffer and thus target all domestic water uses. This option combines the two local treatment systems and is a more integrated experimental alternative that will be considered only if the treated GW quality of the project pilot is found to be high enough. Both design options are complemented with the same use of water-saving appliances on a household scale, with the exact mixture of appliances being dependent on the household type (Table 2).

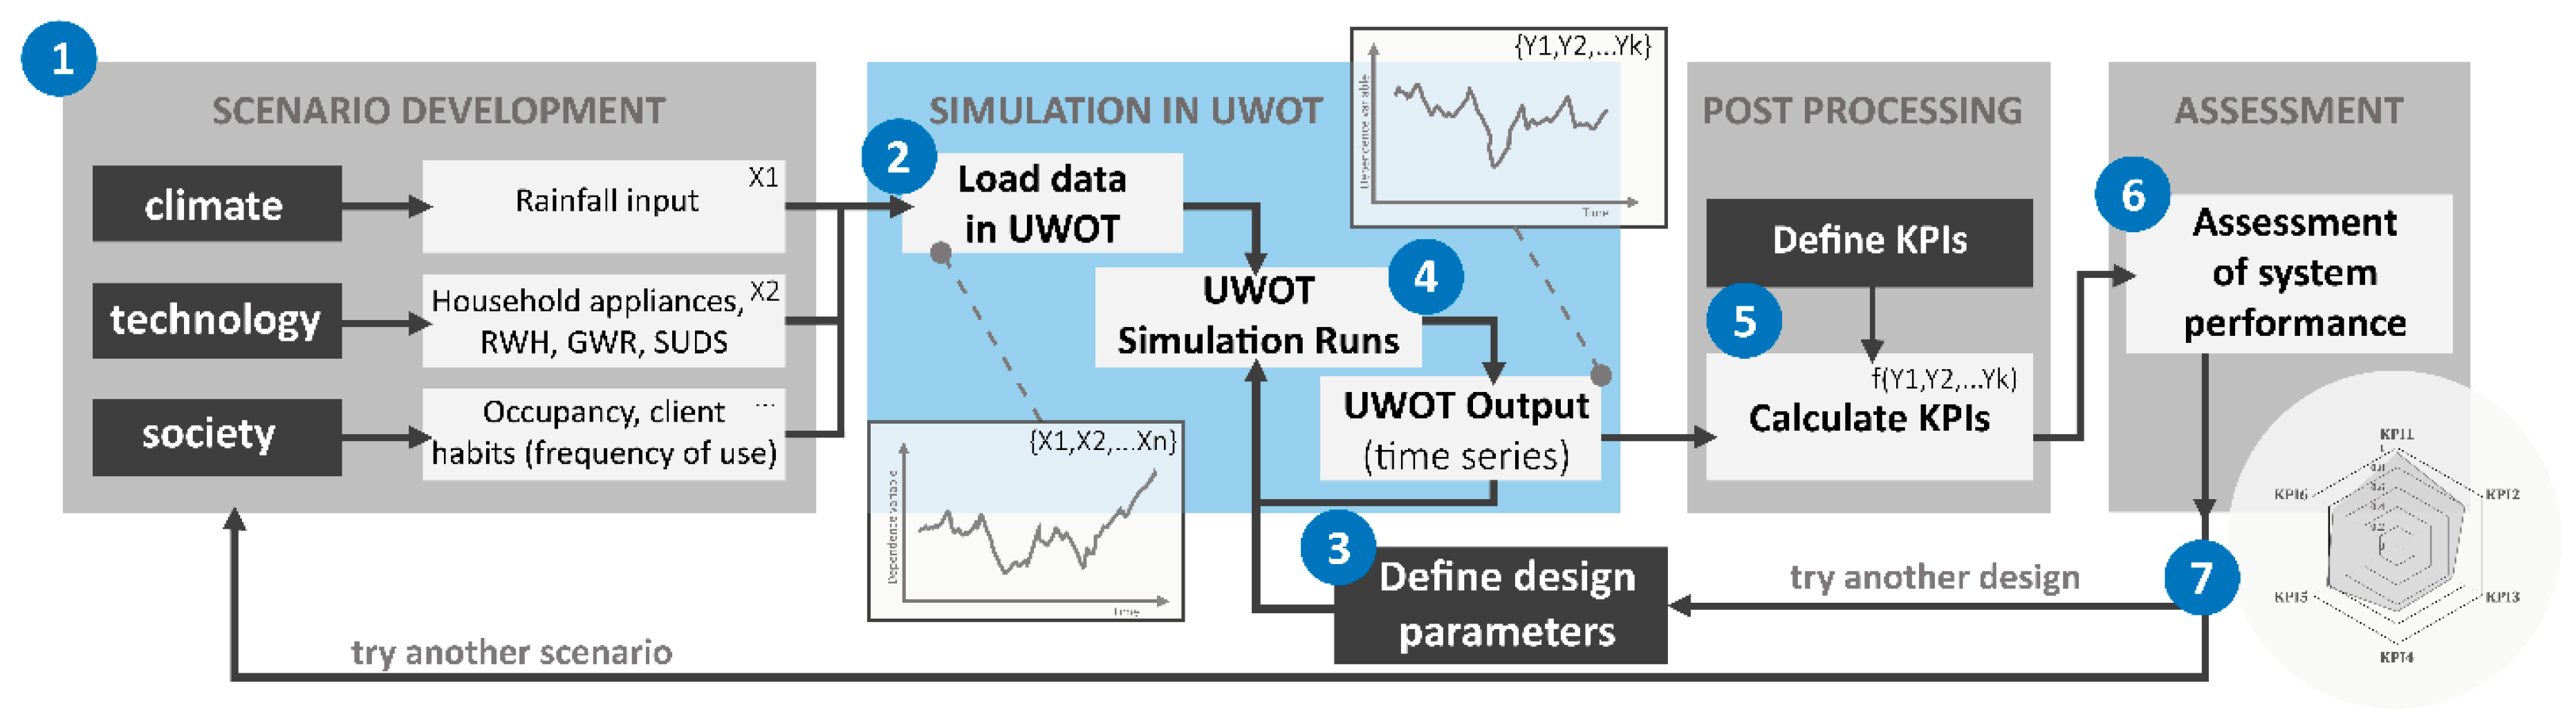
2.3. Formulating the Performance Assessment Chain for Decentralized Urban Water Systems

Using a simulation testbed such as UWOT provides a detailed picture of the whole system response—in terms of requested DW, produced WW and simulated runoff—for a given design option that encompasses all selected technologies on a household and neighborhood scale. This design option could be considered a scenario in the neighborhood, encompassing assumptions on the mixture, usage and design attributes of technologies, but also implicitly including assumptions on climate (through the use of rainfall data to generate runoff) and client behavior (by assuming a set occupancy and frequency of use). Likewise, a neighborhood that features the same spatial and occupancy characteristics but no water-saving or decentralized measures, i.e., a unit of linear water management that requests DW from the central networks and quickly disposes WW and runoff to corresponding central services, could be considered another scenario able to be modeled with UWOT. It becomes thus evident that UWOT is able to model different ‘realms’ in the form of scenarios that represent management choices, climate characteristics and social behaviors through its required inputs and component topology (i.e., house types, RWH and/or GWR treatment unit). A basis for a simulation-based assessment framework could then start with the following conceptualization: “One could assess the performance of a decentralized system by comparing the ‘decentralized’ scenario with the current reality, i.e., baseline scenario, that reflects linear management and relies on centralized networks.”
This conceptualization, however, has a caveat: performance assessment is directly dependent on the output of the model, which generates a wealth of data on daily time steps. There needs to be a higher level of abstraction from (complex) data produced by the model to the (lean) data needed to evaluate performance and reach decisions. This abstraction can be reached by introducing a number of key performance indicators (KPIs), which represent characteristic performance metrics of the system.
The use of KPIs to convey information is considered important, as they can be viewed as a crucial link between assessment frameworks and the decision-making process, since they distil the—often complex—information of assessment methodologies such as modeling-based frameworks in simple quantities, able to be interpreted efficiently and quickly by non-experts such as management units and stakeholders [33]. Identifying efficient KPIs for each decision-making domain is no trivial task and is the subject of extensive research in multiple fields [34,35], including urban water [36,37,38,39]. The non-trivial nature of forming KPIs comes from the interaction of multiple factors that affect design, such as: (a) the project aim and stakeholder target groups, (b) the assessment framework and model capabilities, as the KPIs need to be derived from the data output generated by the model, (c) the needs of decision-makers, as the KPIs need to include multiple system aspects that affect decision-making, be understandable and, to the greatest possible extent, co-designed with the interested end-users. With regards to this consideration, the simulation-based assessment framework conceptualization can be rephrased as follows: “One may assess the performance of a decentralized system by comparing the ‘decentralized’ scenario with the baseline scenario (current reality) that reflects linear management and relies on centralized technologies via a number of Key Performance Indicators.”
Accounting for the aforementioned remarks, the simulation-based assessment framework developed in this study is seen in Figure 3, which depicts it in a form of an assessment chain, i.e., a sequence of steps that link scenario development (i.e., the formulation or alternative modeling ‘realities’), model simulation and end-user performance evaluation assisted by the formulation of suitable KPIs. The framework comprises the following steps, also mapped in Figure 3:
  • Define the scenario (i.e., modeling reality) by deciding on climate, technological and social dimensions that affect model inputs.
  • Convert this modeling reality to model input that comes in the form of n scalars or time-series X i that define the n-dimensional input space X :
    X = { X 1 , X 2 , , X n }
    In the case of UWOT and as aforementioned, assumptions on climate affect the rainfall time-series needed to calculate runoff, while assumptions on technology affect the choice of interventions at a neighborhood scale (household appliances, RWH, GWR).
  • Define the design attributes of the given scenario. These attributes reflect design and operational characteristics for a given technological reality, such as the treatment capacity and buffer storage of a RWH/GWR design option, and come in the form of an m-dimensional model parameter space μ with m parameters μ i :
    μ = { μ 1 , μ 2 , , μ m }
  • Perform model simulation using the input space X and parameter space μ , in order to extract the system response in the form of time-series Y i in the k-dimensional output space Y :
    Y = { Y 1 , Y 2 , , Y k }
    In the case of UWOT, the output space includes water cycle streams that come as time-series of demands (i.e., requested DW), produced WW, simulated runoff etc.
  • Reduce the complexity of output data by transforming model outputs to KPIs. This step can be also viewed as a statistical transformation process f ( Y ) of the output time-series Y to scalars that represent system performance. Since KPIs aim to compare baseline with decentralized system performance, they can be considered a statistical transformation process f ( Y a ,     Y b ) across the output vectors Y a and Y b of two scenarios (a) and (b), where (a) is typically the baseline scenario and (b) is the decentralized scenario.
  • Use the calculated KPIs to evaluate the performance of the system.
  • In case the performance is not deemed adequate, two feedback options are possible—to return back to step (3) and try another design attribute (in order to increase the efficiency of the defined proposed decentralized system), or change the mixture of interventions altogether and try another scenario, thus going back to step (1).

2.4. Definition of KPIs for Decentralized Urban Water Systems

Evidently, the fifth step in the assessment chain is based the definition of suitable KPIs which, as aforementioned, have to take into account the decision-maker needs as well as modeling limitations. Following communication with the project partners for SUPERLOCAL, five quantitative KPIs are defined in this study that relate to all major urban water cycle streams (DW, WW and runoff). The KPIs are formed from the comparison of the centralized, business-as-usual scenario against the decentralized scenario and are normalized to a common orientation in [0,1], indicating 0 for poor performance (i.e., no improvement) and 1 for ideal performance and perfect improvement compared to the centralized system. This normalization allows them to be dimensionless, directly comparable and able to be visualized together in the form of radar charts [40]. The five KPIs developed for decentralized systems as part of this study are:
  • The achieved reduction in household consumption RHC (or otherwise % household demand reduction):
    RHC   =   | D d e c e n t r a l h D c e n t r a l h | D c e n t r a l h
    with D h denoting household DW demands averaged over time. This is DW KPI that can be viewed as a tap-level water demand management metric, describing the reduction in water requested at the household level before any upscaled measures such as RWH and GWR operate. The reduction at this household scale is caused by water-saving appliances, which reduce the water usage per appliance d.
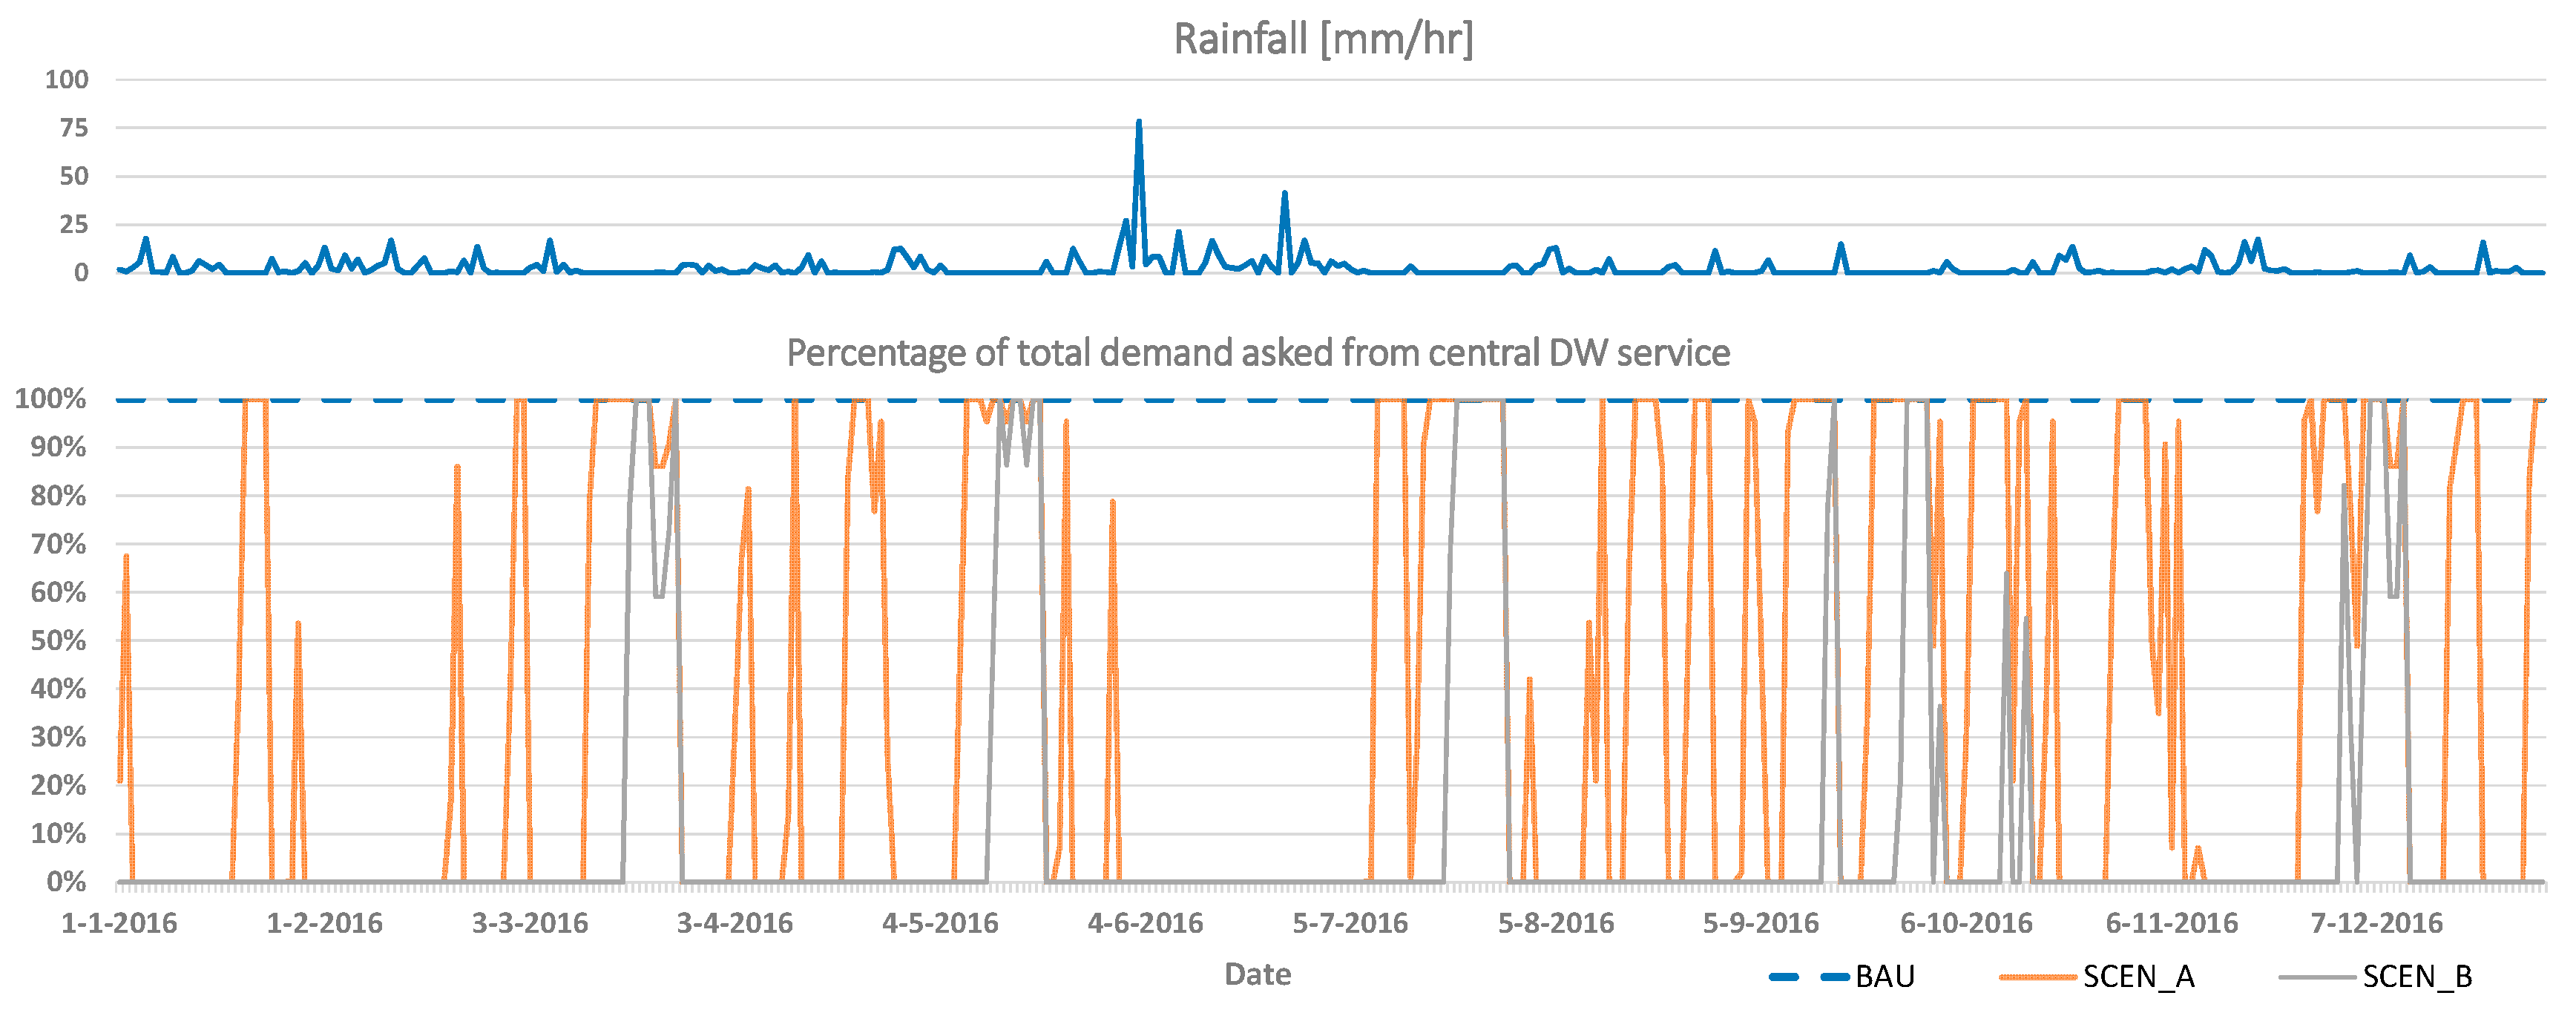
  • The achieved reduction in clean DW (RDW) requested from the external, central service (or otherwise % reduction in the demand requested from central water utility):
    RDW = | D d e c e n t r a l n D c e n t r a l n | D c e n t r a l n
    with D n denoting neighborhood DW demands averaged over time. This is a DW KPI that can be viewed as a more representative measure of the system autonomy, dependent on all decentralized technologies in place. Speaking the ‘signal language’ of UWOT, it represents the demand signal that cannot be covered by local (harvested or reused) DW supply and has to be met by the central utility through the connection to the mains.
  • The achieved reduction in WW (RWW) that leaves the system (or otherwise % reduction of WW pushed to outlet):
    RWW = | Q d e c e n t r a l W W Q c e n t r a l W W | Q c e n t r a l W W
    with Q W W denoting the volume of wastewater that leaves the neighborhood averaged over time. This is a WW KPI that constitutes another measure of neighborhood autonomy, now regarding the produced WW that cannot be stored or treated locally and is propagated externally (e.g., through the centralized sewer network).
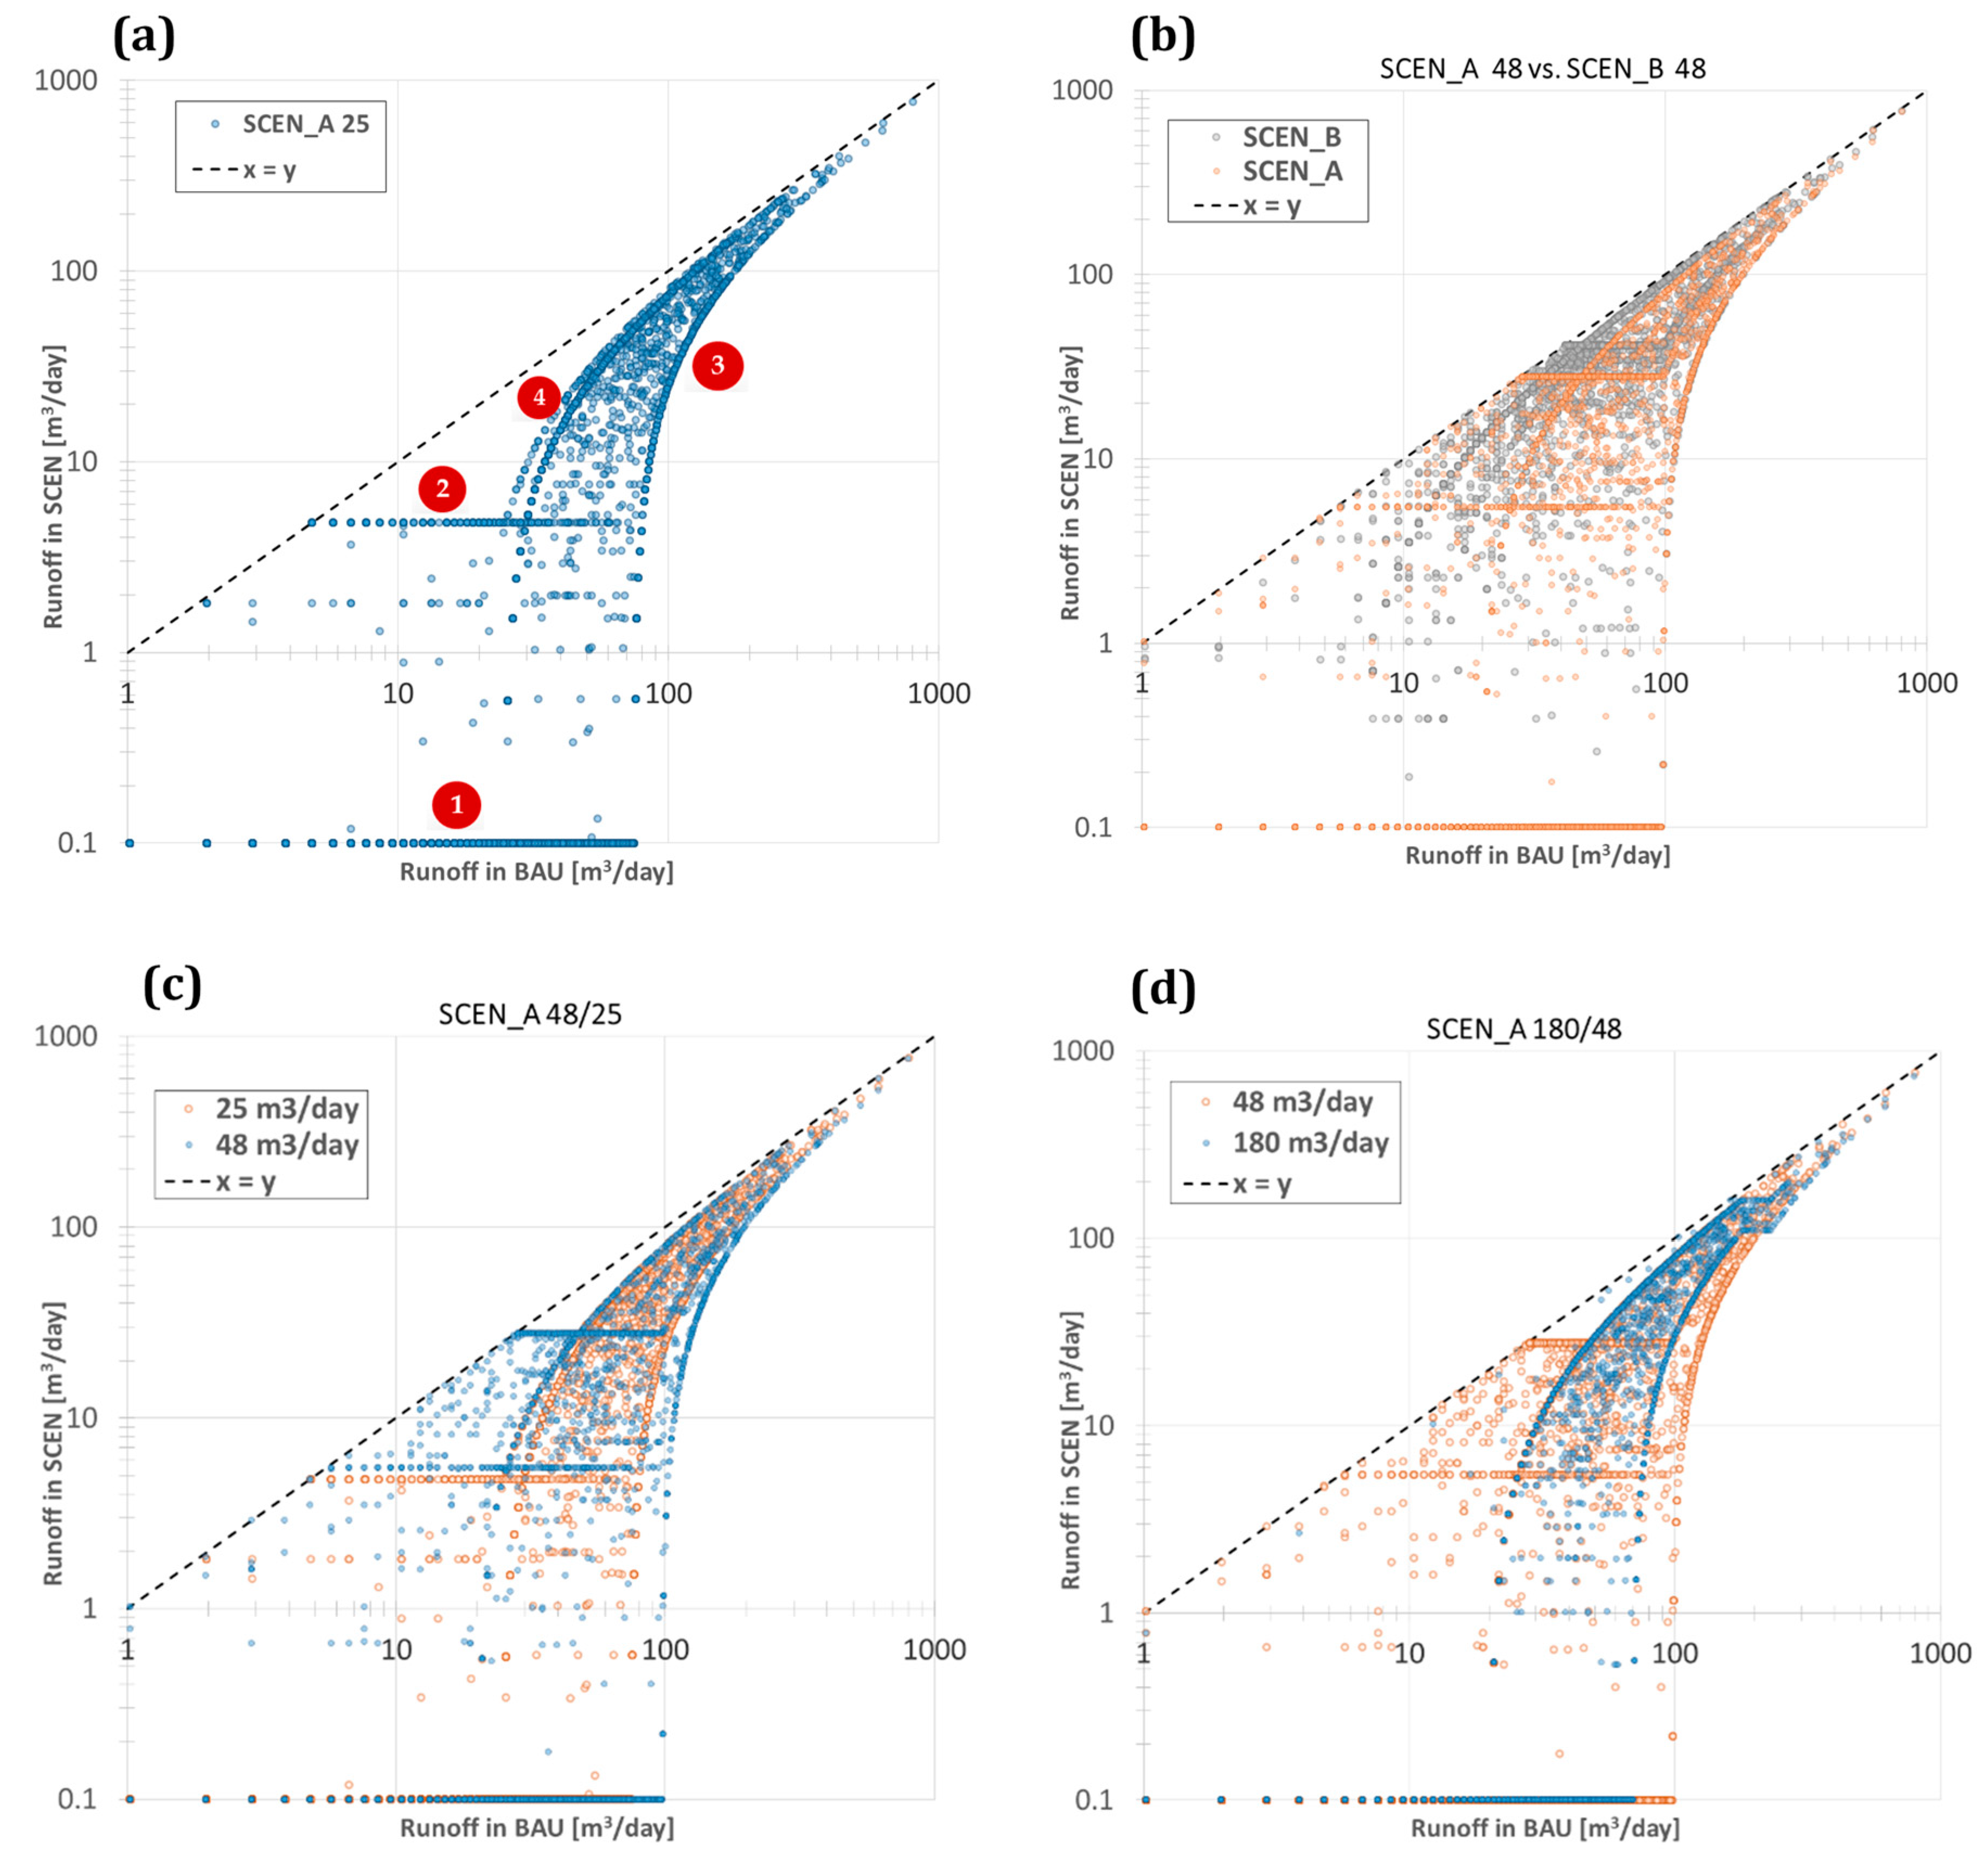
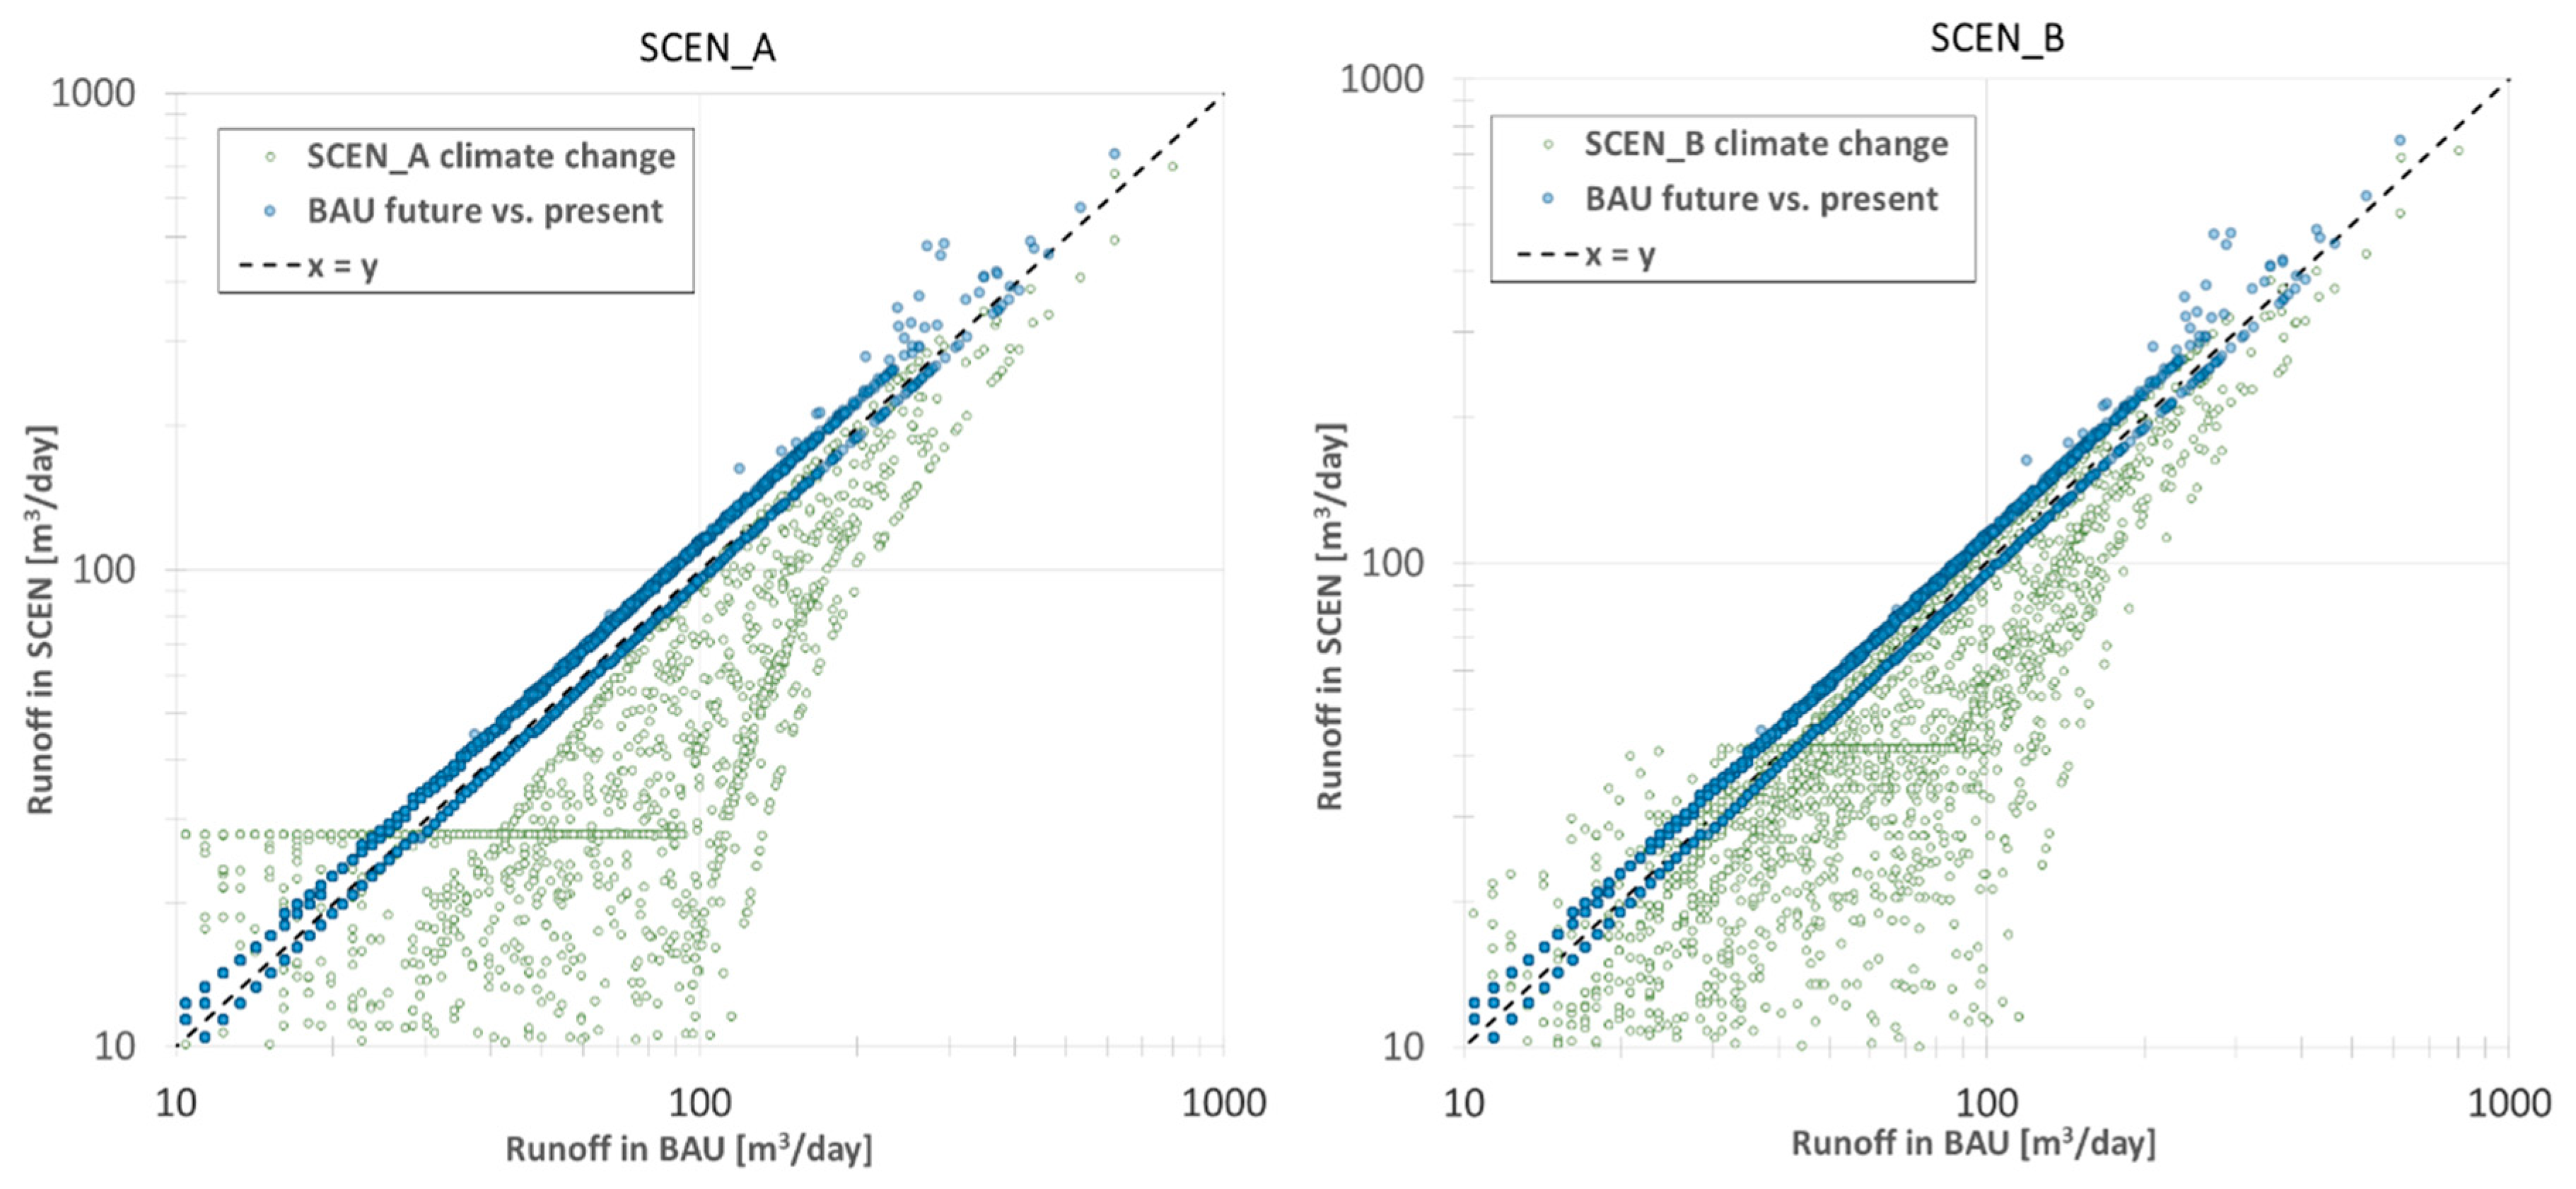
  • The achieved runoff reduction RAR (or otherwise % reduction of runoff):
    RAR = | Q d e c e n t r a l r u n o f f Q c e n t r a l r u n o f f | Q c e n t r a l r u n o f f
    where Q r u n o f f is the volume of runoff leaving the neighborhood, averaged annually or over the entire simulation time. This is a KPI related to runoff that measures the efficiency of the decentralized system to retain water in the long term.
  • The achieved flood event reduction RER (or otherwise average % reduction of peak event runoff):
    RER = E ( | Q d e c e n t r a l e v e n t   r u n o f f Q c e n t r a l e v e n t   r u n o f f | Q c e n t r a l e v e n t   r u n o f f )
    which is the mean value of the runoff reduction observed at the event level, with Q e v e n t   r u n o f f denoting the peak runoff observed during a simulated flood event. This is a runoff-related KPI that is measured at a smaller timescale (i.e., on a per-event basis) and depicts the efficiency of the decentralized system in mitigating floods.
  • The reliability of decentralized system design REL, which is defined in a simulation-based framework as the % of time steps that the system operated well. Reliability is a probabilistic concept with strong links to simulation modeling [41,42,43] generally defined as:
    REL = 1 P ( Y f ) = 1 n Y f n t o t a l
    with P ( Y f ) being the probability of either system failure or inefficiency. It is computed as the relative frequency of time steps with failure or inefficiency n Y f / n t o t a l and with Y f being a logical condition targeting the output space Y that is used to distinguish failed or inefficient time states from normal operational conditions during simulation. In this study, the focus is on the operational inefficiency for storage treatment systems, i.e., measured as the count of time steps during simulation when the storage capacity of these systems is full, the treatment capacity is inadequate and the incoming untreated water overflows from the treatment unit.
The defined KPIs are summarized in Table 3. Unlike the first five KPIs that focus on volume reduction (Equations (4) to (8)), the reliability of decentralized system design (Equation (9)) is a measure describing how reliable different elements of a specific design option are. It thus helps evaluate whether the selected design attributes of the integrated decentralized system, i.e., the storage volume of a buffer, treatment capacity of a unit etc., are well-selected and suitable to the hydrological regime of the area, i.e., the simulated runoff. It thus provides guidance to potential changes in the design (the feedback loop back to step (3) described in Figure 3) and can be applied in elements of the integrated system that feature a storage and/or treatment unit, such as the RWH, GWR or SUDS unit in SUPERLOCAL.

3. Analysis and Results

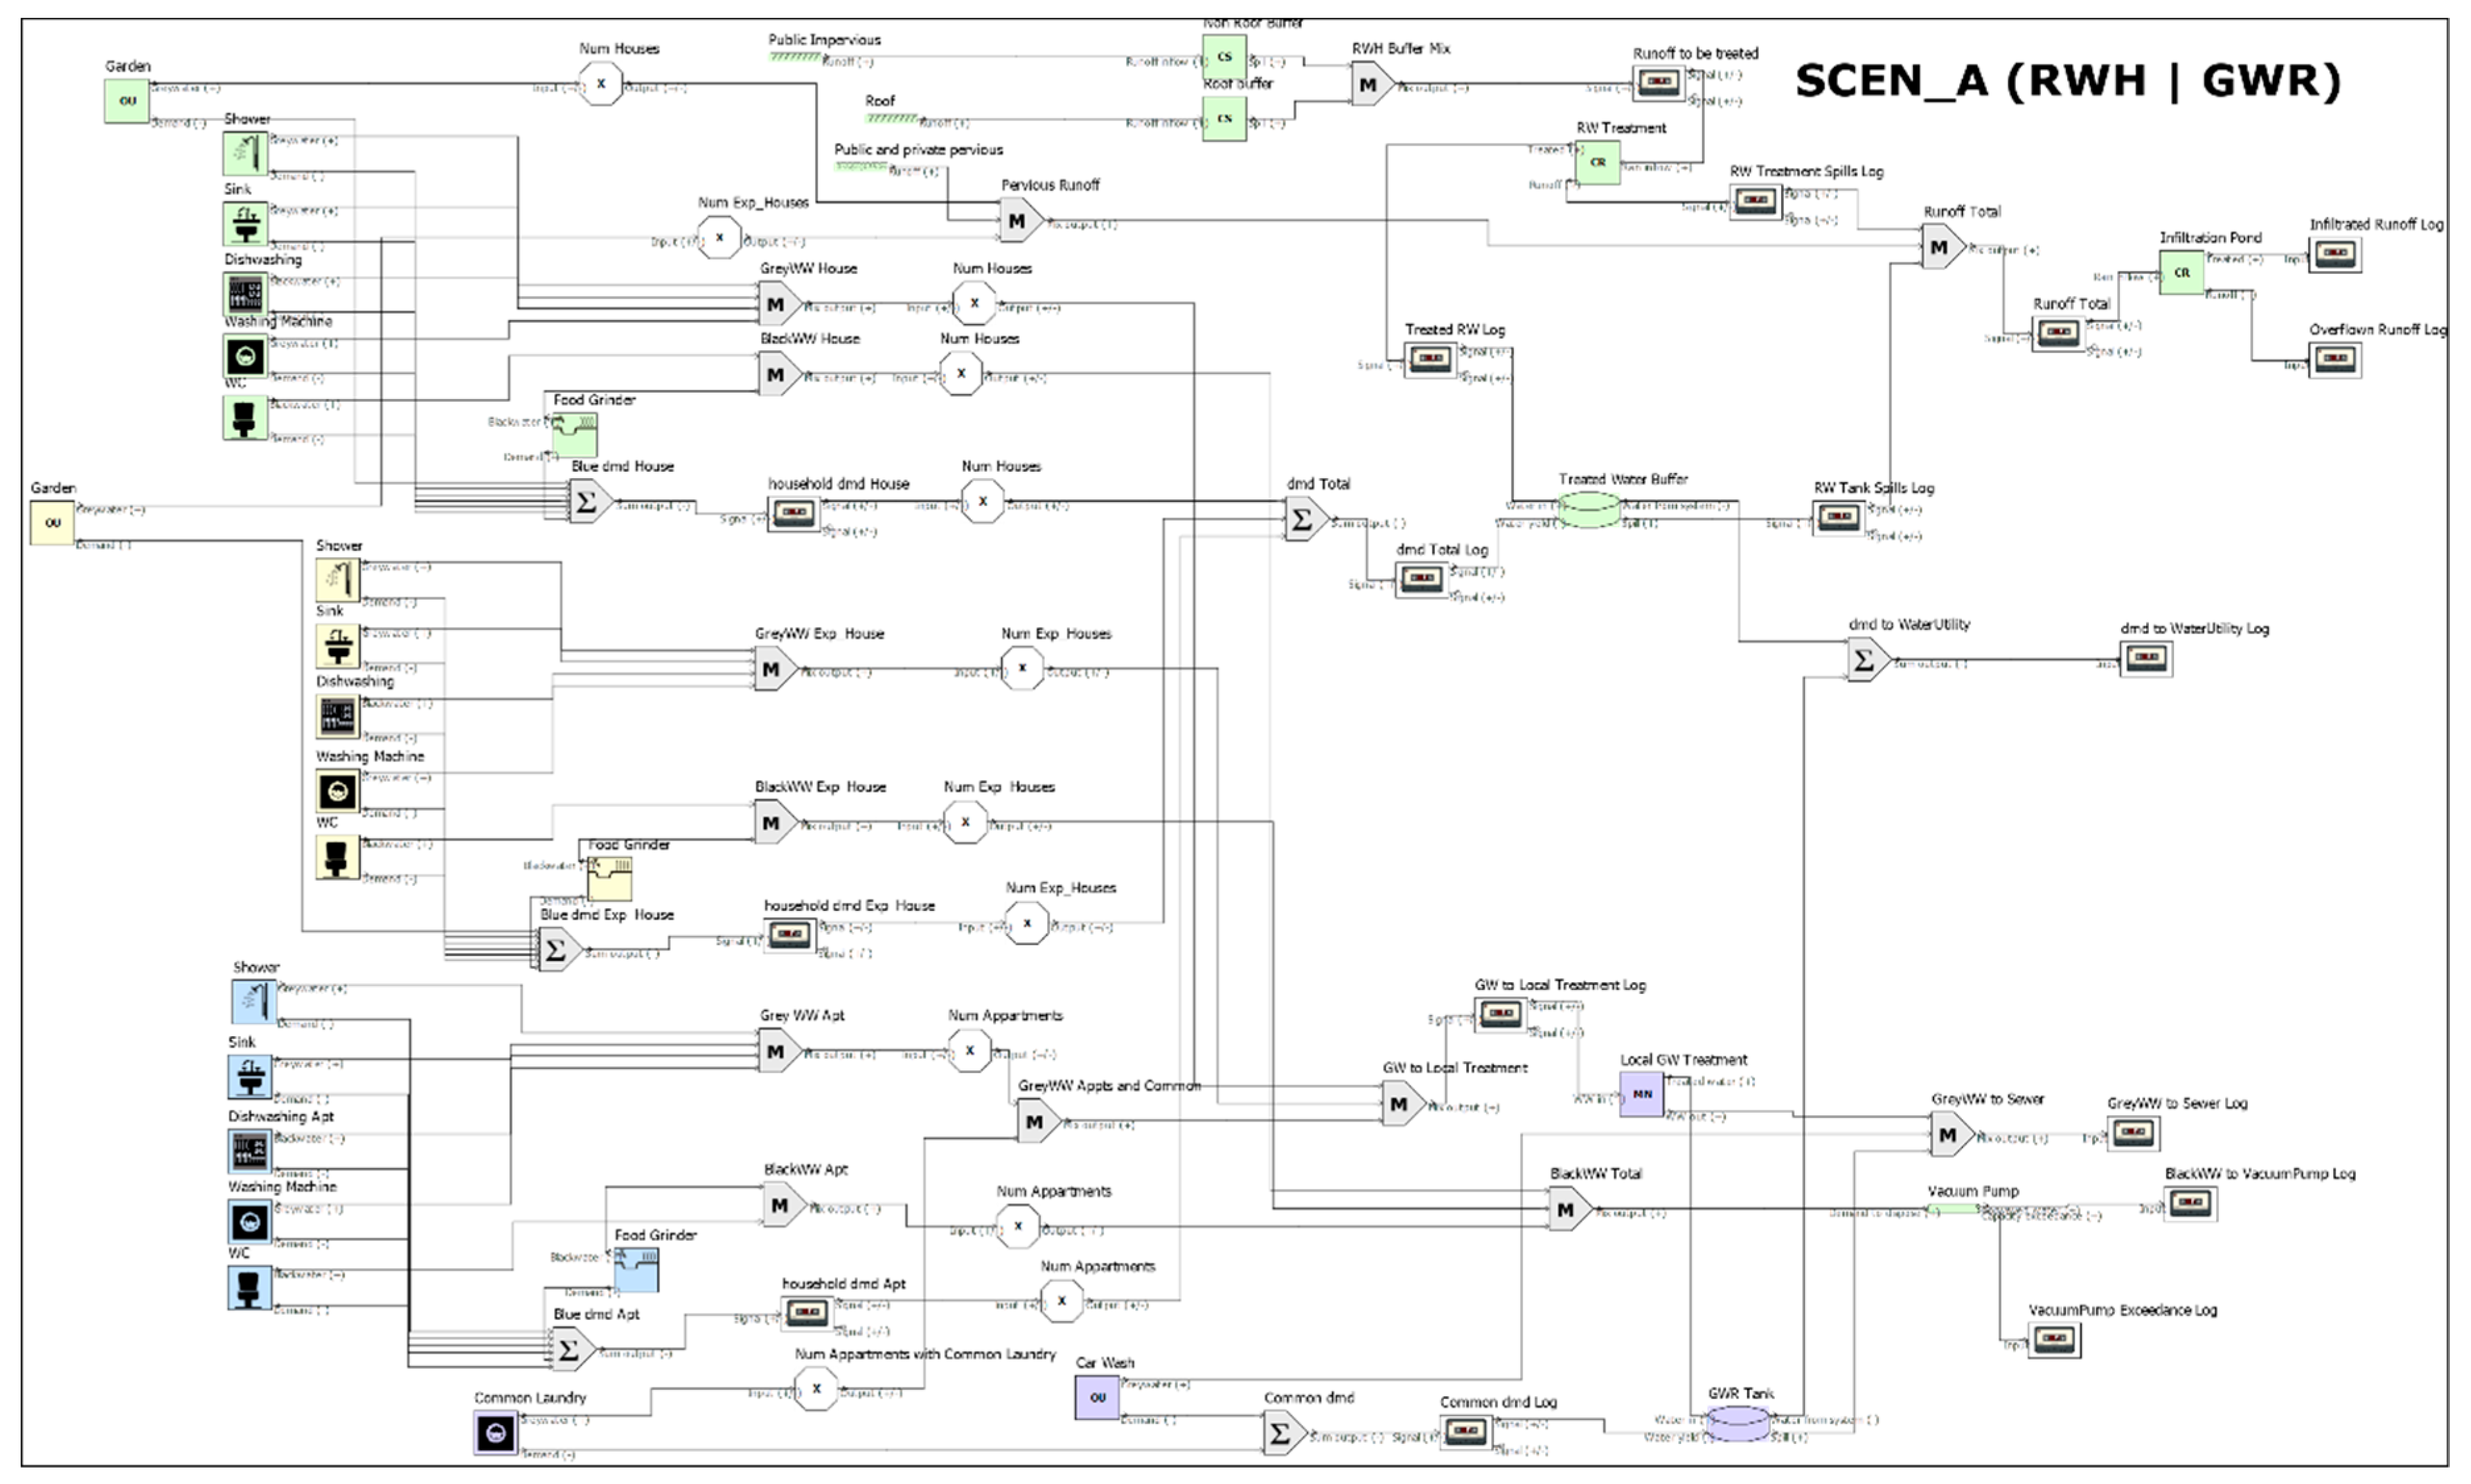
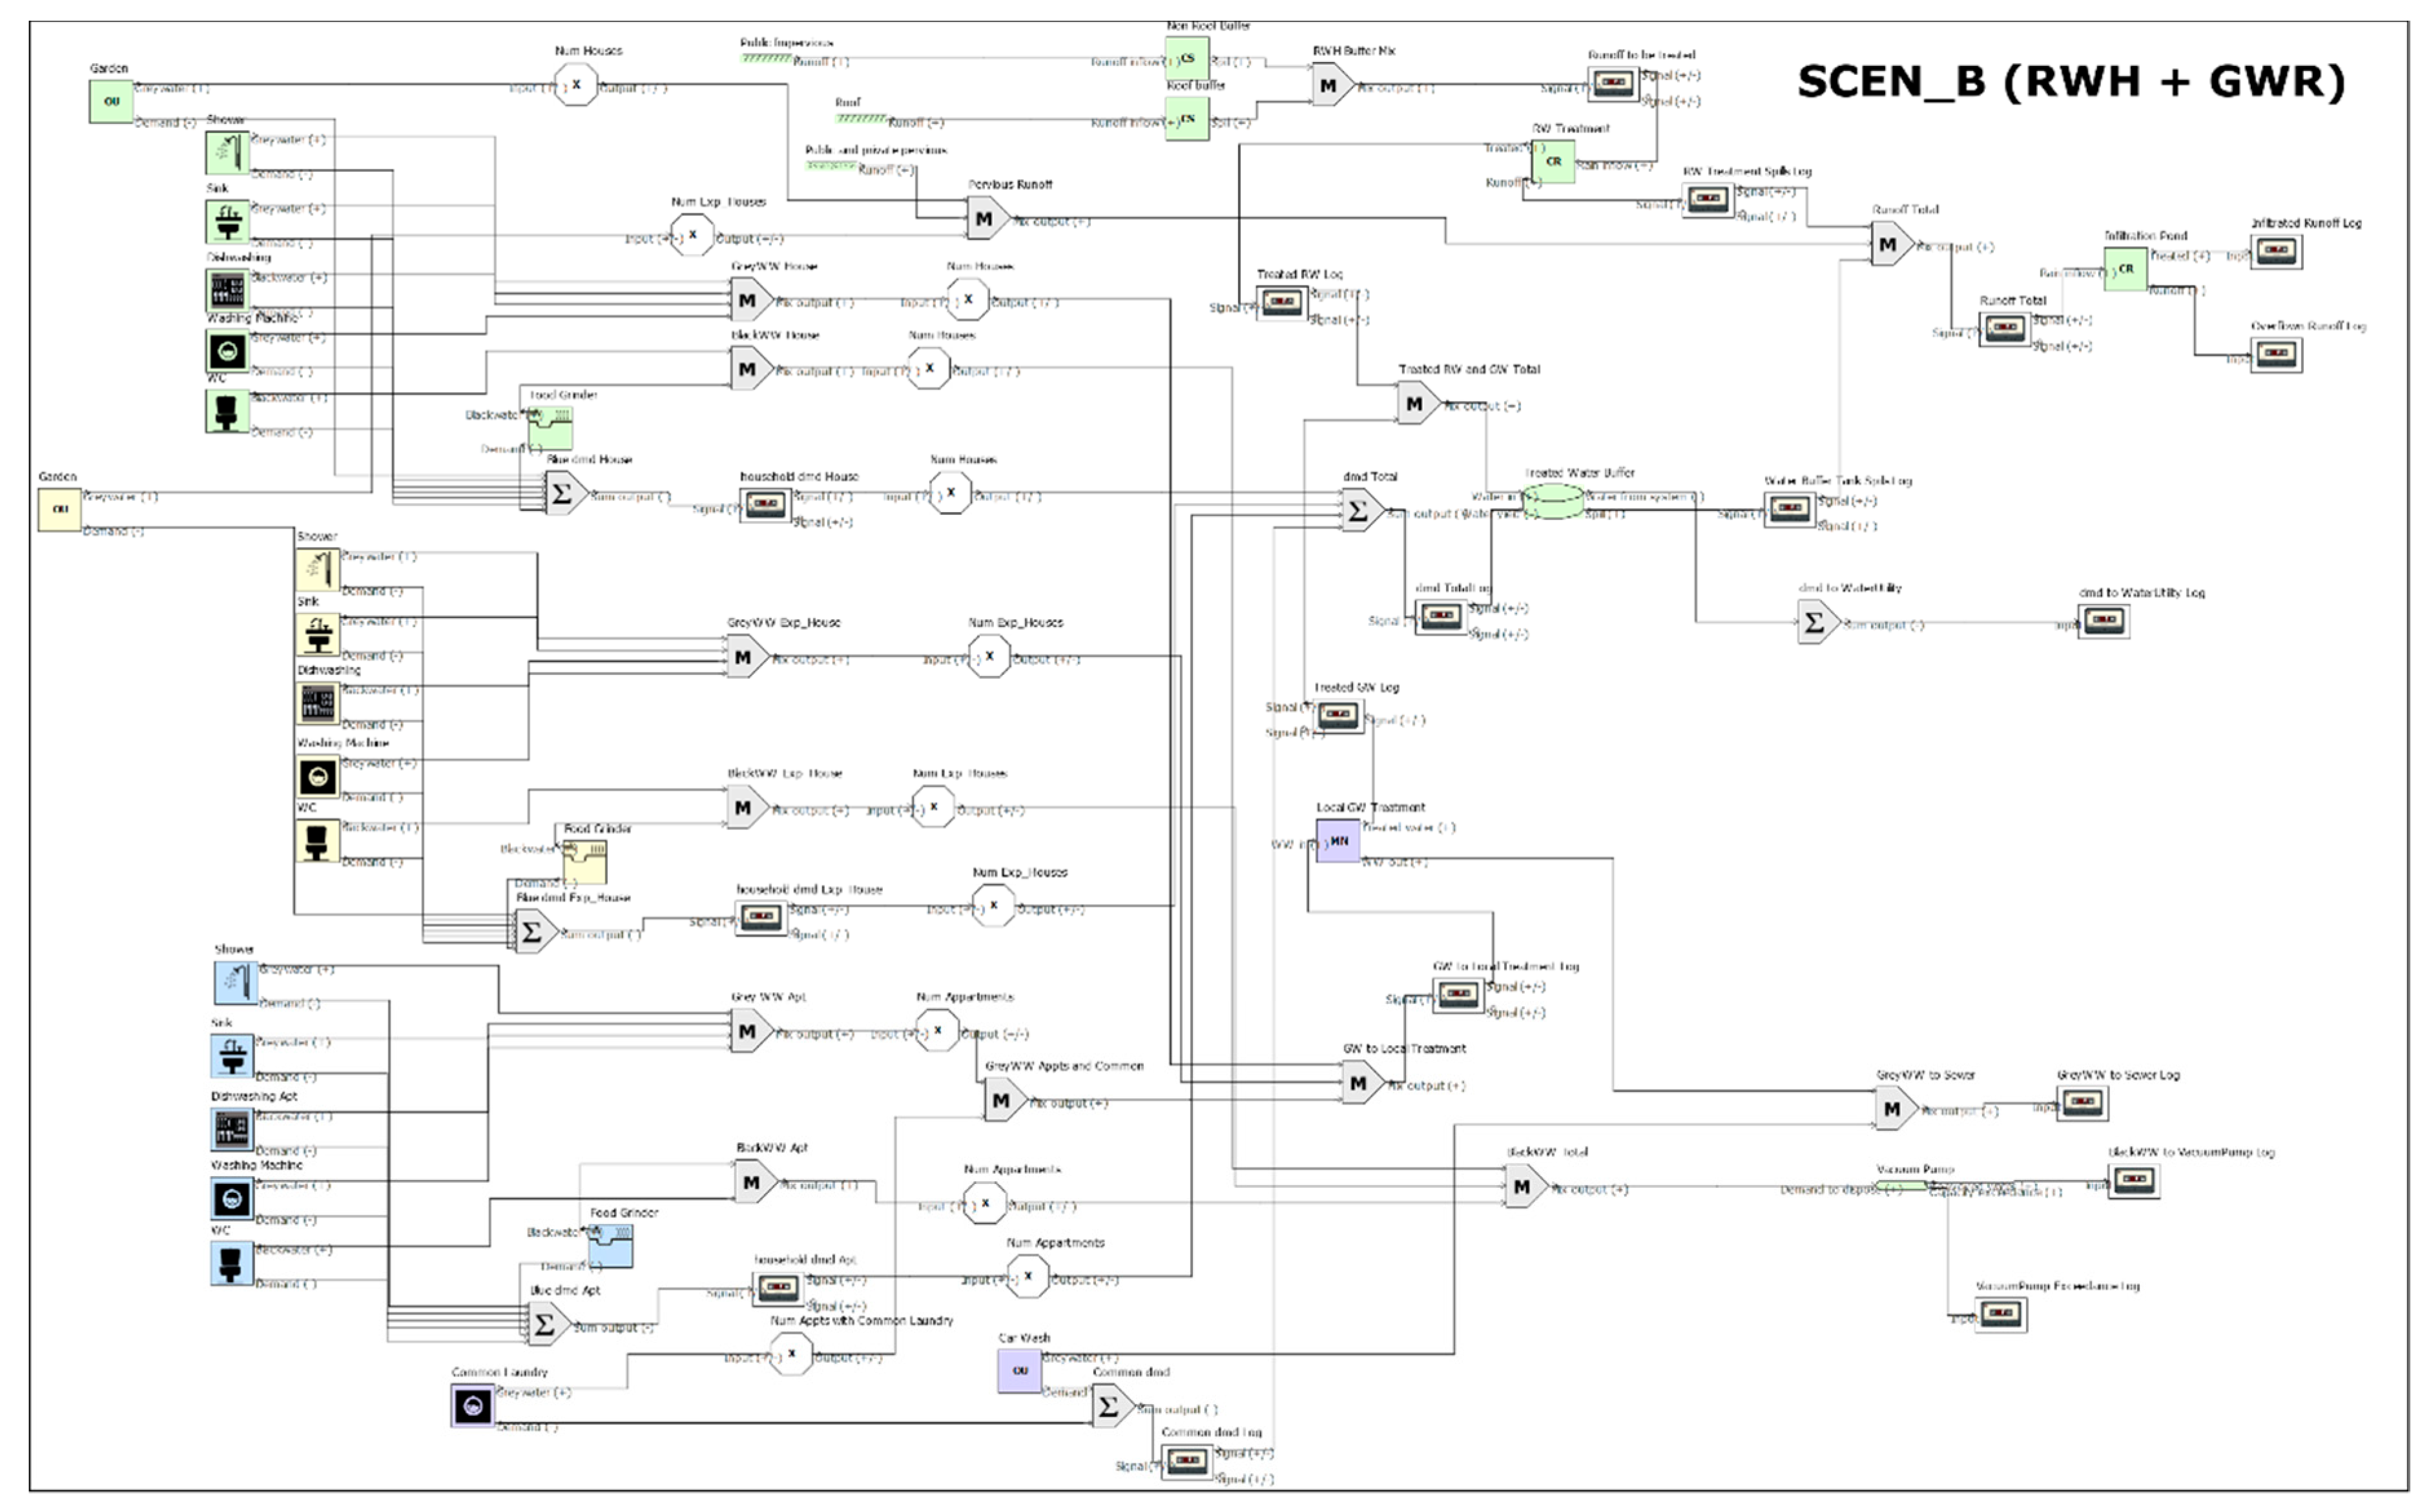
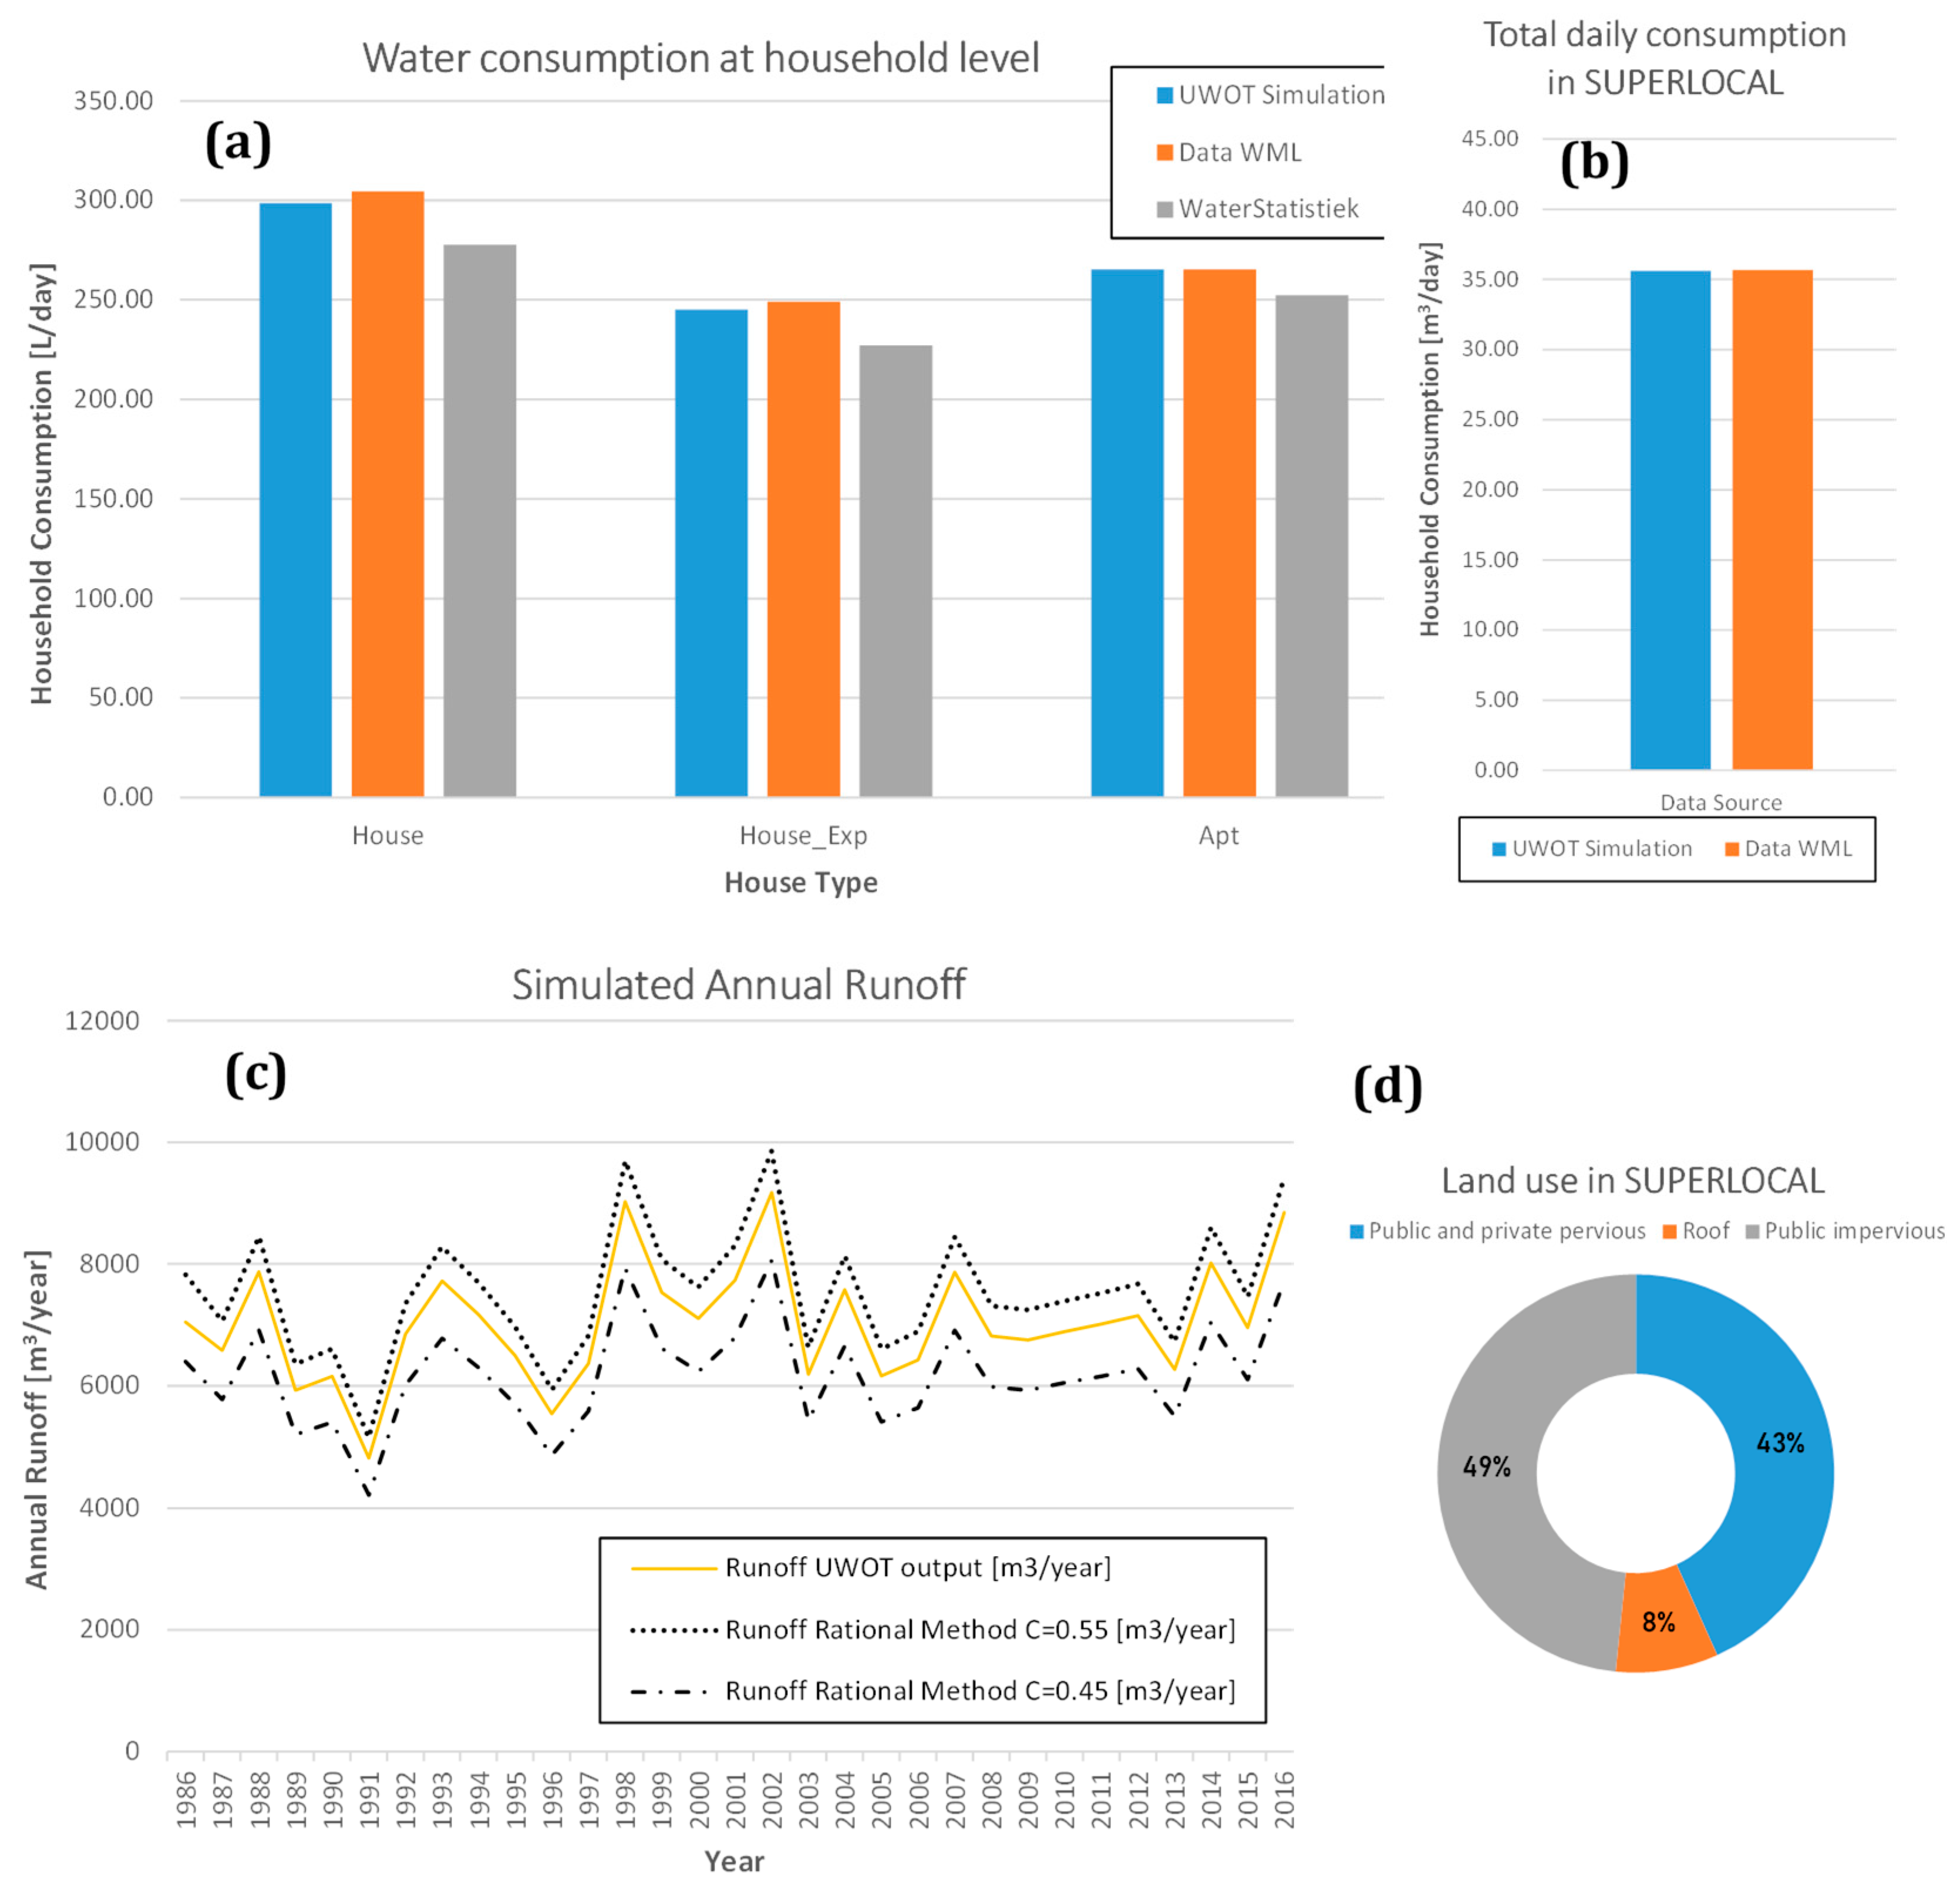
3.1. Bringing SUPERLOCAL to the UWOT Modeling Domain

In order to model a case at a neighborhood scale at its native daily simulation time step, UWOT requires data on the ‘tap’ side, as well as information on the design attributes of either option. Required data on the ‘tap’ side include the house types of the neighborhood, water usage d (e.g., in L/use/day) of the appliances installed in each household and the occupancy occt of each household. This dataset is provided by the project venture and can be seen in Appendix A, as a supplement to Table 2. UWOT then models the demand requests for clean water at an appliance level as Q d e m ,   t = d × f t × o c c t , where ft is the daily frequency of use of each appliance. Appliance demands can then be aggregated, through corresponding multipliers, to the neighborhood scale based on the number of households for each type. Frequency data is also provided by the venture partners based on past observations, seen in Appendix A. UWOT further requires core design attributes of RWH and GWR systems, such as the average daily treatment capacity (e.g., in m3/day) and design storage for each buffer unit (e.g., in m3). These attributes are seen in Table 4. Finally, UWOT includes a rainfall-runoff module to simulate generated stormwater based on point rainfall data [20], as well as information on the soil infiltration capacity of pervious areas. Daily rainfall time-series from a gauge in proximity to SUPERLOCAL are provided (KNMI precipitation station Roermond), covering a range of 31 years (1986–2016) and comprising a total of 11,324 time steps, along with properties of pervious and impervious areas seen in Table 4.
A second step needed is to conceptualize the entire array of technologies seen in the integrated decentralized system of SUPERLOCAL in the ‘signal language’ used by UWOT, which consists of demand and wastewater/runoff signals. This conceptualization can be seen in Figure 4, which summarizes the main components seen in SUPERLOCAL, including the household appliances, RWH treatment unit, GWR unit and SUDS. UWOT is able to include all of the aforementioned technologies; however, its architecture focuses on water flows and is unable to capture nutrient transport and recovery; given this limitation (which is further discussed in Section 4), the recovery properties of the BW stream seen in Figure 4 are not simulated, with the results focusing on treated water quantities for all streams instead.

3.2. Application of the framework in SUPERLOCAL

The developed performance assessment framework along with the six identified KPIs is applied in the case of SUPERLOCAL, with the aim of evaluating the two design options of the combined RWH and GWR system. Following the first step of the methodology, three alternative scenarios are modeled in UWOT:
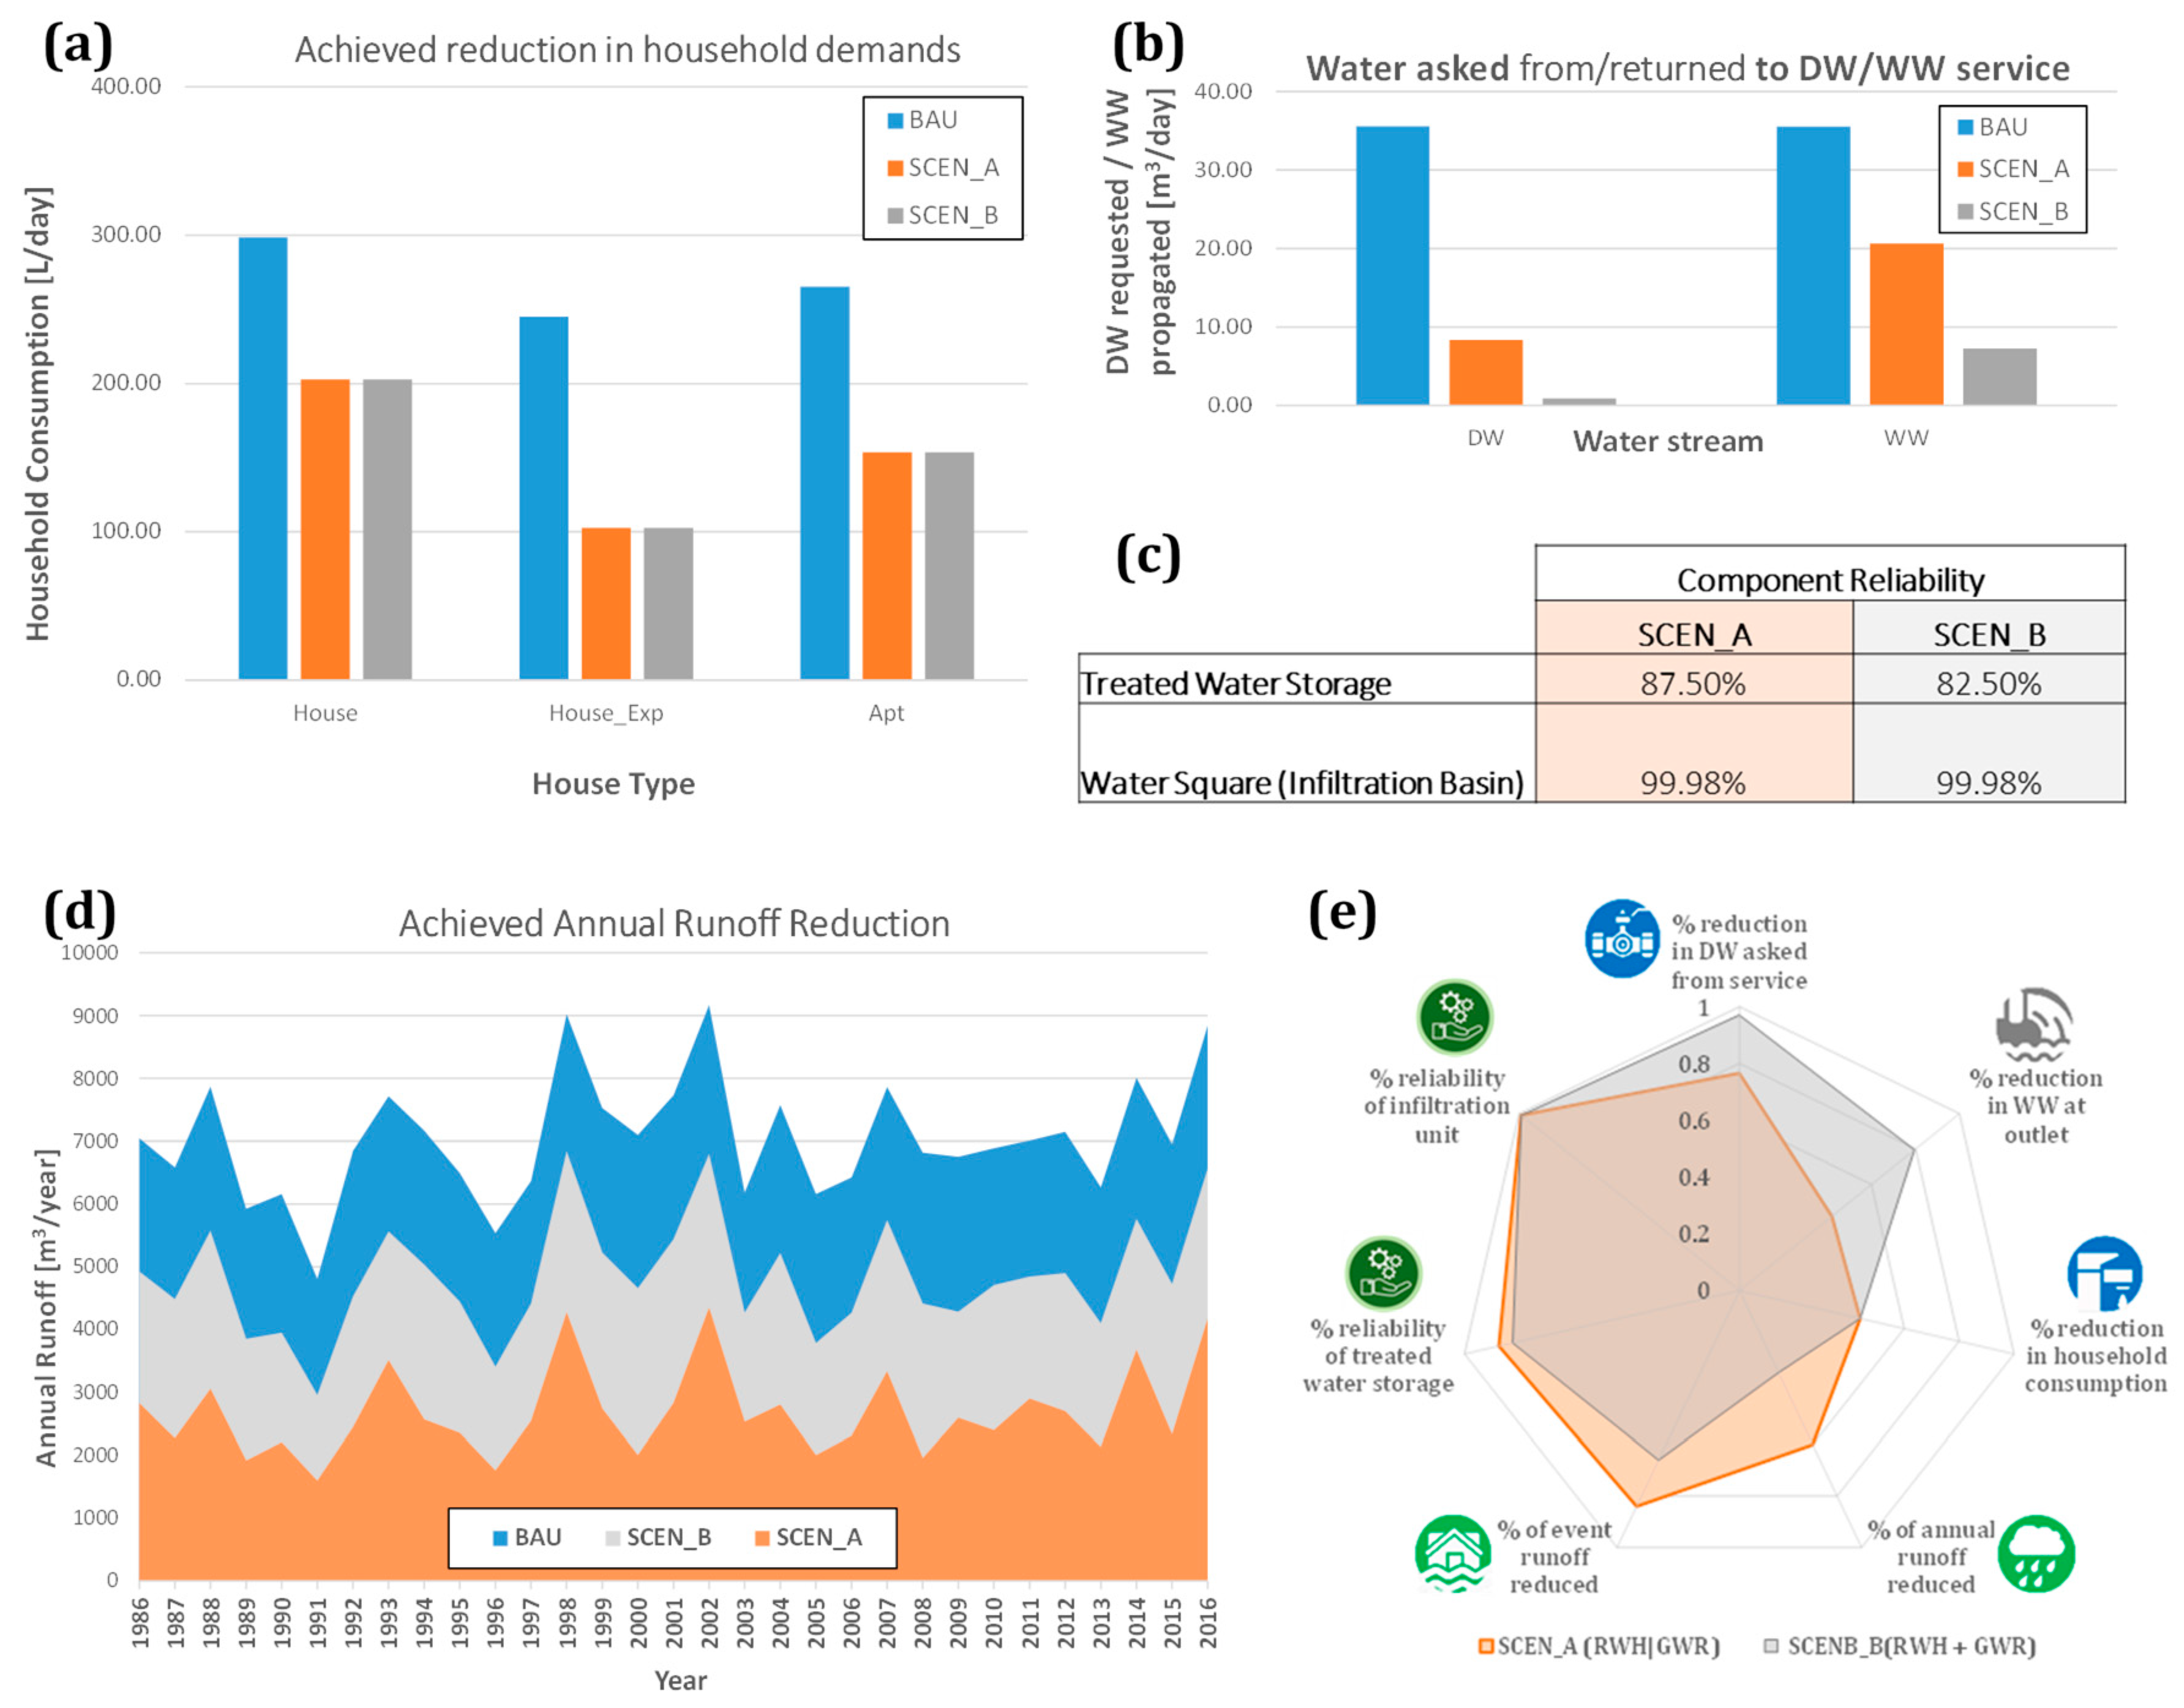
  • The first baseline scenario corresponds to neighborhood equivalent to SUPERLOCAL (i.e., having the same household types, occupancy and spatial characteristics) that however features no decentralized technologies. This reality reflects a neighborhood that follows the centralized model of linear water management, where runoff and WW are propagated downstream (to the outlet and central stormwater or wastewater services), DW is requested from the central mains and conventional appliances are used in all house types. This reality serves as the baseline for comparison and has the abbreviation of business-as-usual (BAU).
  • The second scenario is a neighborhood that features distinct recycling systems (RWH and GWR) that target different water uses. Treated RW covers all domestic uses, while treated GW covers common facilities, including a laundry and car wash. This decentralized reality has the abbreviation SCEN_A or “RWH|GWR”, to underline the distinct role of RWH and GWR.
  • The third scenario is a neighborhood where GWR usability is extended; in that case, treated GW acts as light RW and is directed to the same buffer unit as RW, in order to create a common pool that targets all water uses. This reality has the abbreviation SCEN_B or “RWH + GWR”, to underline the combined role of RWH and GWR.
All aforementioned scenarios are modeled with the present climate (i.e., historical rainfall data captured by the gauge) and with the social dimension defined by WML, following local client behavior [44]. The UWOT model for scenario SCEN_A (RWH|GWR) can be seen in the upper panel of Figure 5, while the UWOT model for SCEN_B (RWH + GWR) can be seen in the lower panel of Figure 5. Based on the results of the model runs, the six defined KPIs are calculated for SCEN_A and SCEN_B; in the case of reliability, the KPI is applied on two design elements that are of interest to SUPERLOCAL partners: the treated water storage unit that holds harvested (and reclaimed, in SCEN_B) water and returns it back to households, as well as the “water square”, i.e., the infiltration basin that receives runoff from pervious areas as well as overflow from RWH.

3.3. Model Validation

Prior to demonstrating the results of the comparative performance assessment, it is important to validate modeling results against real data. This is possible for the scenario of BAU in SUPERLOCAL, as it represents the conventional reality that can be checked against data from actual households and neighborhoods. On the demand side, UWOT output from the BAU simulation can be compared—in terms of simulated daily aggregate household or neighborhood demands—to the real demands seen in Dutch drinking water networks, which are obtained from the high-resolution data provided by WML (see Appendix A), as well as a third external data source describing national average per capita water consumption [45] that is not used to build the model. The results, seen in Figure 6 for the household (panel (a)) as well as the whole neighborhood scale (panel (b)), show a deviation between UWOT BAU demand outputs and WML data that is in all cases less than 2%. This indicates that the translation of high-resolution data from the DW utility to the UWOT topologies has been performed well. Moreover, the deviation between UWOT model outputs and external data [45] falls in the range of 5–8%. This deviation is deemed reasonable, considering that the external source describes a national average instead of regional specifics, so provincial deviations apply.
With regards to runoff, validation against real data is not possible as the area of SUPERLOCAL does not have a runoff gauge. However, insight on the expected runoff of the area can be obtained by comparing the UWOT BAU results with the results of another widely used rainfall-runoff conceptual model, such as the rational method [46], which links outlet runoff (discharge) Q with point (station) rainfall intensity i through the formula Q = C × i × A , where A is the catchment area and C is the so-called runoff coefficient, the single calibration parameter of the model. Depending on the time scale the rational method is used, C is typically referred to in literature either as event-based or annual runoff coefficient [47,48], which leads to an estimation of Q as the peak discharge (in m3/s) of an event or (mean) annual discharge (e.g., in m3/year), respectively, as a fraction of the total water received through precipitation i × A . Due to the wide application of the rational method for preliminary studies in catchments, value ranges of C for catchments with different spatial and soil properties exist, making this method easily applicable for rough estimations of runoff in case of ungauged catchments. To obtain a general, event-independent overview of the runoff response, the annual time scale has been applied for UWOT validation. The results show that runoff produced by UWOT (which is on average 7032 m3/year) falls within the results obtained with the rational method for a range of C = 0.45–0.55 (panel (c) of Figure 6). This range is deemed reasonable compared to values in engineering literature [49], given that the area of SUPERLOCAL features low density residential use and an almost equal mixture of pervious and impervious areas, as seen in panel (d) of Figure 6.

3.4. Performance Assessment of SUPERLOCAL Decentralized Design Options

The results of the framework application in SUPERLOCAL are summarized in Figure 7 in the form of a dashboard focusing on results at a KPI level for the two design options (SCEN_A and SCEN_B), readily understandable by non-expert groups. Regarding the reduction in household consumption, seen in panel (a) of Figure 7, a reduction of demands in the range of 32–58% is achievable for the neighborhood of SUPERLOCAL, depending on the mixture of water-saving appliances (and thus the household type), with the experimental housing units that focus on more intensive water-aware appliances having the strongest effect. The effect is the same in the two design options (SCEN_A vs. SCEN_B), as the mixture of appliances per household type does not change. The effect of each design option is, however, different when one looks at the water asked from—and returned to—the central DW/WW utility (panel (b) of Figure 7). The average daily central DW demand of SUPERLOCAL, estimated at 35.6 m3/day in the BAU scenario, can be reduced to 8.4 m3/day for SCEN_A (RWH|GWR, distinct) and even reduced further to less than 1 m3/day for SCEN_B (RWH + GWR, combined). The reduction in the first case is by approx. 76.5%, while the reduction in the second case reaches 97.5%, achieving near complete autonomy from Drinking Water services with a combined RWH/GWR system that recycles most water uses. Likewise, significant reduction are possible for the WW that propagates to the outlet: the generated WW that is estimated at 35.52 m3/day for the BAU case gets reduced to 20.62 m3/day (a reduction of approx. 42%) for SCEN_A and further reduced to 7.25 m3/day for SCEN_B, with a reduction of 79.6%. As expected, SCEN_B makes more efficient use of treated GW by expanding its reusability and this has an impact on both reliance on central (external) DW, as well as propagation of WW to the outlet.
This performance of these design options is reversed when one looks at the achieved % of runoff reduction at an annual scale (panel (d) of Figure 7). SCEN_B now achieves a moderate annual average runoff reduction of 32%, while SCEN_A performs significantly better and reaches a reduction of 60%. The reduction rate is affected by the dryness of each year; for instance, SCEN_A achieves a rate of 66.1–69.6% in the five driest years, while runoff reduction rate falls within the range of 52.6–54.7% for the five wettest years. Likewise, SCEN_B has a rate of 35.0–38.6% for the five driest years and 24.2–28.1% for the five wettest years. The achieved % of event-based runoff reduction reveals a similar picture: SCEN_A reduces peak runoff during rainfall events significantly by 84% on average, against a moderate average reduction of 66% achieved by SCEN_B. These results are reasonable, as in the case of the combined design option (SCEN_B, RWH + GWR) treated GW and treated RW compete to cover the same demand needs and use a limited treated water storage space, thus leaving less available storage for upcoming runoff events. Similar findings can be seen when one looks at the reliability of both systems in terms of treated storage buffer (panel (c) of Figure 7); SCEN_B combines both local treatment units at a cost of reliability on available treated water storage, which falls from 87.5% to 82.5%. Both reliability levels are reasonable and in the range of high values for RWH schemes [50]. The reliability of the infiltration basin (“water square”) is found to be very high in both scenarios (>99%), with its design capacity being exceeded only in three out of the 11,324 total simulation time steps. This finding is in line with the design requirements in SUPERLOCAL, which aim at capturing all rainwater locally, rather than use infiltration to reduce flows from frequent events only.
The aforementioned KPIs can be pooled together in a form of a radar plot (panel (e) of Figure 7) that captures all dimensions of the improvements in urban water cycle services towards circularity that are achievable with these two design options. What is evident in this figure is the tradeoff between autonomy (i.e., water asked from and pushed to centralized networks) and flood-proofing; SCEN_B combines RWH and GWR together and leads to a more autonomous decentralized system, but at a cost of flood retaining capacity, which is higher in case RWH and GWR are distinct.

3.5. Downscaling KPIs to Fit the Needs of Decision Support

The results seen in Figure 7 provide a lean-data snapshot at the level of abstraction needed to communicate information for different circular neighborhood designs to non-expert groups. However, the use of simulation at a daily scale gives the developed framework flexibility and allows stakeholders to dig deeper in the response and efficiency of decentralized water systems. KPIs can be downscaled to a specific year, season, month or even at the native daily scale via their corresponding output time series Υ i Y to provide more detailed insight in the interplay between different urban water streams, as well as the dependence of decentralized systems on inherently uncertain local sources such as rainwater.
For instance, a more in-depth look in system reliability can be obtained by looking at how different elements within the system respond and when they reach failure states. Figure 8 shows the results from the last year of simulation in SCEN_A, where one can see the system response in runoff that surpasses RWH (panel (b)), in runoff stored in the infiltration basin (panel (c)), as well as runoff that escapes both of these retention schemes and manages to overflow at the outlet (panel (d) of Figure 8). Infiltration capacity of the unit is exceeded twice, with both events occurring from heavy precipitation events occurring on May and June 2016. In the second case, the storage of 400 m3 is enough to absorb this capacity exceedance; in the first case, the storage limit is surpassed, leading to a single overflow event that is marked as an inefficiency of the infiltration system Y f . Likewise, other KPIs can be downscaled to a daily scale to observe system response in detail. Having for example autonomy in mind, Figure 9 shows the percentage of total DW demand asked from the central DW service over time for the last year of simulation, with a value of zero indicating that the system covered all of its demand locally during that day. Both topologies achieve autonomy from the central services which is in principle dependent on the rainfall that the area receives, seen in the upper panel of Figure 9. The dependence on wet and dry spells is evident, with SCEN_A showing higher sensitivity, while SCEN_B showing better autonomy and robustness, as rainwater is supplemented with another steady source of water (treated GW).
Insights can be also obtained for the runoff reduction KPI by downscaling results to an event scale, i.e., to the peak runoff observed during a precipitation event [47]. Since UWOT is forced by the same time series in all topologies, a reduction in runoff peaks is observed for the same events over time among these different realities; runoff peaks can be then compared between the conventional (BAU) topology that has no active RWH interventions and the SUPERLOCAL scenarios (SCEN_A and SCEN_B). This has been implicitly done when the KPI of event-based runoff reduction was introduced, but this provided a single (average) quantity at a finer scale, instead of richer information on event-based reduction. To demonstrate a more detailed approach, runoff time-series generated by UWOT are analysed on an event scale and plotted in a comparative scatter plot (panel (a) of Figure 10), where daily runoff of the current reality (BAU neighborhood) is plotted against daily runoff of an alternative reality which has one of the SUPERLOCAL design options (SCEN_A and SCEN_B). The results are plotted in a double logarithmic scale in order to capture the runoff value range including rare events and plotted against line x = y which represents the case where runoff from a SUPERLOCAL reality Q S C E N is equal to runoff in BAU Q B A U , there is no change in the peak runoff response of the catchment). The results of a comparative analysis between a SUPERLOCAL reality and BAU come in the form of a cloud of data points ( Q B A U , Q S C E N ) ; the further they lie from x = y , the more efficient RWH was for that particular event.
The results of Figure 10 offer high-resolution insight on the interaction between design details of the combined RWH and GWR system and the hydrological regime. In every case, the cloud of data points follows a bell-shaped figure that asymptotically leads to x = y for very large runoff volumes (very rare events). Lower runoff volumes are considerably reduced and, for many events, absorbed up to the maximum possible reduction by the SUPERLOCAL system, as indicated by the set of lowest points in area (see numbered area (1) of panel (a)). A plateau of points indicating an upper threshold in reduction is also evident (numbered area (2) of panel (a)); upon closer inspection, this equals to y = Q S C E N = k D , where k is the treatment capacity of the RWH unit and D is the daily flux of abstracted water demands from the treated storage unit, equal to 20.3 m3/day in SUPERLOCAL. These points reflect events happening at a time where water can be treated but cannot be stored in the system—i.e., there is no storage in the potable water buffer left. In that case, part of the treated water covers the daily demands for that day and the rest overflows from the RWH unit. Besides these flat plateaus, an asymptotic envelope of maximum distance from the curve can be seen in area (3) of panel (a) in Figure 10; this corresponds to points of maximum efficiency for the RWH system, i.e., where storage tanks are empty and able to absorb the maximum amount of runoff. A mirrored envelope also exists closer to line x = y (numbered area (4) in panel (a)) that can be perceived as the analogue of minimum efficiency for the decentralized RWH system. A comparison of SCEN_A (RWH|GWR, distinct) and SCEN_B (RWH + GWR, combined), seen in panel (b) of Figure 10, offers high-resolution results that are in line with Figure 7: SCEN_A offers a more consistent picture of runoff reduction, with a maximum efficiency curve further from x = y and a lower spread of points between the maximum and minimum efficiency curves.

4. Discussion

The previous section has shown key results from the application of the developed framework in the combined RWH and GWR system of SUPERLOCAL. Arguably, the focus was on comparing scenarios of ‘technological realities’ with different design options against the linear, centralized system (BAU); the present climate conditions that drive rainfall remain unchanged (i.e., historical rainfall data were used as-is), while the assumptions on client behavior (occupancy patterns and frequency of use) were the same for each run. However, the developed framework is broader and allows the formulation of different scenarios where climate and society also changes (Figure 3). This will impact the performance of the decentralized system, thus leading to a different result picture at both coarse and fine level. A common question regarding change, for instance, is whether integrated decentralized technologies such as SUPERLOCAL have the capacity to future-proof neighborhoods against flooding. To demonstrate this through the simulation-based framework, let us hypothesize a possible future that has higher rainfall, based on a relevant KNMI report on climate adaptation [51]. To study the effect of these future rainfall patterns to the SUPERLOCAL integrated system, we can formulate three future scenarios, with and without decentralized technologies (BAU, SCEN_A and SCEN_B) where the climate has changed and plot runoff reduction results at an event scale. The results, plotted in Figure 11 against the corresponding present BAU scenario (excluding small runoff events in [0.1,10] for clarity) reveal that while the future holds multiple more intense runoff for BAU (i.e., points above the x = y line), this increased runoff intensity is mitigated when integrated decentralized systems are used: both solutions (SCEN_A and SCEN_B) lead to a picture of reduced runoff, with SCEN_A giving a more consistent picture that, despite the worsening hydrological regime, leads to lower runoff values than the present BAU response (Figure 11). Similar results can be obtained in case of less rainfall (a drier future), but also in case social behavior scenarios need to be taken into account as well.
Besides (re-)forming scenarios, decision-makers can return back to step (3) of Figure 3 to refine the design of their chosen decentralized system and see the difference in the results. Design attributes such as the treatment capacity and storage of RWH or GWR units can be changed, with these changes being reflected on the coarse or fine scale of the results. To demonstrate this, a number of different treatment options (25 m3/day, 180 m3/day) are simulated for SCEN_A along with the default design of 48 m3/day, with the runoff reduction of each corresponding design being plotted at an event scale (see panels [c] and [d] of Figure 10). Evidently, higher treatment options lead to a more potent event-based runoff response with higher operational plateaus (numbered area (2) of panel (a)) and less spread, even though the very large treatment option (180 m3/day) has reduced maximum efficiency, as it is perhaps disproportionally large compared to the (constant) storage volume of 50 m3. The ability to recalculate KPIs f ( Y ) for an array of different parameters μ i μ points to an optimization problem, with f ( Y ) being the objective function and μ being the control variable space. It would be thus interesting for future research to expand the ability of the framework to (re-)design attributes for a given reality and expand the rationale to a combined simulation-optimization framework [52,53,54] by automating the return to step (3) of Figure 3, in order to address the optimal design of decentralized systems.
In spite of the flexibility, the demonstrated framework doesn’t come without limitations. As seen in studies with metabolism models [39,55], KPIs rely on the model used and are thus bound to its limitations. For instance, the inclusion of water quality indicators is more challenging in UWOT, as water quality modeling functions are limited and need external data on the treatment units. This also applies for other concepts important to circular water, such as energy consumption and nutrient reclamation; the latter is also of particular value to SUPERLOCAL, as seen with the local BW stream treatment (Figure 4) and could thus form the focal point of future research and model improvements. Moreover, the financial dimension (i.e., capital and operational costs) is not included as a scenario dimension in Figure 3, but can be considered in future iterations of the model. These limitations spark ideas for future research towards an integrated framework that will explore more externalities, but also include the interplay between water and energy or water and nutrients. Another point of consideration is that the current application cannot give probabilistic results with high confidence, as it is based on a relatively small dataset of rainfall (31 years); this can be methodologically improved by running UWOT with an ensemble of synthetic rainfall events, generated with the use of a suitable stochastic model [56]. One has to also consider that the results seen in Figure 7 are based on an idealized picture of a given decentralized system design—operational aspects such as maintenance frequency, downtime, accidents, variable sub-daily treatment rates etc. are not considered. However, some of these aspects can be modeled by altering the UWOT topologies [57], provided that data exist to supplement the added structural complexity. In case they are not modeled, the results can be considered as an idealized ‘upper limit’ of efficiency and autonomy that can be achieved for a proposed decentralized system architecture. Finally, the demonstrated framework is limited to the neighborhood scale in order to be applied to SUPERLOCAL, but can be also applied to larger scales, for instance to large blue-green area design [20], or even to a whole city level [21], possibly with changes to the KPIs to fit the scope of the application.

5. Conclusions

A framework for the ex ante evaluation of integrated decentralized systems at a neighborhood scale, based on the simulation testbed of an urban water cycle model, has been demonstrated in this study. The framework is applicable to integrated neighborhood projects that include an array of distributed options, including water-saving appliances, household or neighborhood-scale RWH and/or GWR as well as sustainable drainage options (SUDS), while being able to simulate the whole system response and convey performance information at both coarse (KPI) and fine scale. The use of this framework aims at providing quantitative insight on multiple urban water cycle domains which can be used to support decisions on circular water options in neighborhoods. The framework is applied in the case of SUPERLOCAL, a circular neighborhood designed in Limburg, in order to assess and compare the performance of two different design options: an integrated decentralized system featuring distinct RWH and GWR units (SCEN_A), as well as a system that features the same design attributes but combines these systems together to target the same household water demands (SCEN_B). 31 years of daily rainfall data are used to generate results at both high abstraction level (Figure 7) as well as in more detail (Figure 10), depending on decision-making needs. The results of the application show that SUPERLOCAL has the potential of being a smart, autonomous water neighborhood solution, achieving a reduction of 32.1–58.2% in household water demand, depending on the appliance technologies used at each household type. Moreover, it will lessen the dependence to drinking water provided by centralized services to at most ¼ of the water requested in a conventional neighborhood. A significant reduction in annual runoff can be expected as well, amounting to approx. 60% for the split RWH/GWR system (SCEN_A) and 32% for the combined RWH/GWR scheme (SCEN_B), compared to the case without any RWH scheme (BAU).
The results fall in line with the findings of other studies of RWH and GWR systems; for instance, other studies report an efficiency of residential RWH systems in the range of 5.6–55.0% in terms of water savings [58,59,60,61], depending on regional climate and harvesting scale, with lower values in drier climates and smaller rooftop areas and higher values (33.8–52.5%) in humid climates [59]; the latter are similar to the climate type of SUPERLOCAL. Studies on combined RWH-GWR systems report an efficiency on potable water savings in the range of 36.7–42.0% [62], with systems relying only on GWR being more efficient. Likewise, the reliability levels estimated in this study are on par with past literature [50].
As a general remark, the results indicate a tradeoff between system autonomy (i.e., water asked from and pushed to centralized networks) and rainwater retention/runoff reduction that is evident when the two solutions (SCEN_A and SCEN_B) are compared (panel (e) of Figure 7). Split systems with distinct RW/GW streams, such as the one seen in SCEN_A, are efficient in flood-proofing neighborhoods and keeping runoff locally but are less efficient at providing a constant stream of reused water to fit local needs; they have been also found more sensitive, in terms of their water reuse efficiency, to dry spells. Combined systems, such as the one seen in SCEN_B, are more consistent in their water reuse and thus autonomy from central networks, but offer less available storage for high-intensity events and reduced climate-proofing capability. To reach the efficiency in runoff reduction of SCEN_A, a neighborhood focusing on SCEN_B needs to invest in largest storage for treated water, which comes at a higher cost.
Beyond the application in SUPERLOCAL, it is argued that this framework is readily applicable for the strategic evaluation of circular neighborhood designs with different architectures and at different scales and climates. Building on the expertise of past studies, the framework can be upscaled for the strategic evaluation of circular city designs as well, in order to be part of a resilience assessment toolbox for cities, as envisioned in Nikolopoulos et al. [21] and Makropoulos et al. [57]. This type of study is envisaged to provide, along with supplementary tools on the strategic, tactical and operational scale, a solid base for the design and strategic evaluation of integrated decentralized systems as parts of a broader circular water management strategy, thus enabling the transition towards a circular and more sustainable future for urban water.

Author Contributions

Conceptualization, D.B. and D.v.D.; Data curation, D.B. and D.v.D., Formal analysis, D.B., D.v.D. and C.M., Funding acquisition, H.-J.v.A. and J.F., Investigation: D.B., D.v.D., H.-J.v.A., J.F., D.N. and C.M., Methodology: D.B., Project administration: H.-J.v.A. and J.F., Software: D.B. and D.N., Supervision: C.M., Validation: D.B. and D.v.D., Visualization: D.v.D. and D.B., Writing—original draft: D.B., Writing—review & editing: D.v.D., J.F., C.M.

Funding

This paper was based on research financed by the joint research programme BTO-WiCE that KWR carries out for the Dutch drinking water companies and De Watergroep, Flanders, and by the EC LIFE project Local Water Adapt with project reference LIFE17 CCA/NL/000043.

Conflicts of Interest

The authors declare no conflict of interest.

Disclaimer

This paper is an ex ante preliminary assessment of the SUPERLOCAL water system, where simplifications have been made for research purposes due to available model options. Data and dimensions used for the case study of SUPERLOCAL are preliminary design parameters that are being considered which might differ in the actual site implementation. Hence, no claims can be made from this study on the actual function of the system when it is set into place.

Appendix A

Table A1. Water usage and per capita consumption on SUPERLOCAL appliances.
TechnologyDrinking Water UsageDischarge
Water Usage d (L/use/day)Frequency of Use ft (uses/day)Per Capita Demand Request (L/person/day)GW Water 11 01227 i002BW Water 11 01227 i001Soil (Pervious Areas) Water 11 01227 i003
Bathroom
Conventional shower8.78.170.5100%0%0%
Watersaving shower6.98.155.9100%0%0%
Recirculation shower2.58.120.3100%0%0%
Sink22.55.0100%0%0%
Toilet
Toilet6636.0100%0%0%
Vacuum toilet (silent and standard)166.00%100%0%
Kitchen
Food grinder30.331.00%100%0%
Cooking11.41.4100%0%0%
Dishwashing by hand9.10.43.6100%0%0%
Dishwasher17.40.35.2100%0%0%
Household equipment
Washing machine (in house)52.90.2915.3100%0%0%
Washing machine (common launderette)500.2512.5100%0%0%
Car wash1 m3/day for the whole neighborhoodSewerSewerSewer
Garden
Outdoor tap500.150%0%100%

References

  1. Gleick, P.H. Water management: Soft water paths. Nature 2002, 418, 373. [Google Scholar] [CrossRef] [PubMed]
  2. Muller, M. Adapting to climate change: Water management for urban resilience. Environ. Urban. 2007, 19, 99–113. [Google Scholar] [CrossRef]
  3. Baird, G.M. A game plan for aging water infrastructure. J.-Am. Water Works Assoc. 2010, 102, 74–82. [Google Scholar] [CrossRef]
  4. Moe, C.L.; Rheingans, R.D. Global challenges in water, sanitation and health. J. Water Health 2006, 4, 41–57. [Google Scholar] [CrossRef] [PubMed]
  5. McDonald, R.I.; Green, P.; Balk, D.; Fekete, B.M.; Revenga, C.; Todd, M.; Montgomery, M. Urban growth, climate change, and freshwater availability. Proc. Natl. Acad. Sci. USA 2011, 108, 6312–6317. [Google Scholar] [CrossRef] [PubMed] [Green Version]
  6. McDonald, R.I.; Weber, K.; Padowski, J.; Flörke, M.; Schneider, C.; Green, P.A.; Gleeson, T.; Eckman, S.; Lehner, B.; Balk, D. Water on an urban planet: Urbanization and the reach of urban water infrastructure. Glob. Environ. Chang. 2014, 27, 96–105. [Google Scholar] [CrossRef] [Green Version]
  7. Iglesias, E.; Blanco, M. New directions in water resources management: The role of water pricing policies. Water Resour. Res. 2008, 44. [Google Scholar] [CrossRef] [Green Version]
  8. Koop, S.H.A.; van Leeuwen, C.J. The challenges of water, waste and climate change in cities. Environ. Dev. Sustain. 2017, 19, 385–418. [Google Scholar] [CrossRef]
  9. Daigger, G.T.; Crawford, G.V. Enhancing water system security and sustainability by incorporating centralized and decentralized water reclamation and reuse into urban water management systems. J. Environ. Eng. Manag. 2007, 17, 1. [Google Scholar]
  10. Newman, P. Sustainable urban water systems in rich and poor cities-steps towards a new approach. Water Sci. Technol. 2001, 43, 93–99. [Google Scholar] [CrossRef]
  11. Makropoulos, C.K.; Butler, D. Distributed Water Infrastructure for Sustainable Communities. Water Resour. Manag. 2010, 24, 2795–2816. [Google Scholar] [CrossRef]
  12. Geissdoerfer, M.; Savaget, P.; Bocken, N.M.P.; Hultink, E.J. The Circular Economy—A new sustainability paradigm? J. Clean. Prod. 2017, 143, 757–768. [Google Scholar] [CrossRef]
  13. EU Commission. Closing the Loop—An EU Action Plan for the Circular Economy; EU Commission: Brussels, Belgium, 2015. [Google Scholar]
  14. Hering, J.G.; Waite, T.D.; Luthy, R.G.; Drewes, J.E.; Sedlak, D.L. A Changing Framework for Urban Water Systems. Environ. Sci. Technol. 2013, 47, 10721–10726. [Google Scholar] [CrossRef] [PubMed]
  15. Wilderer, P.A.; Schreff, D. Decentralized and centralized wastewater management: A challenge for technology developers. Water Sci. Technol. 2000, 41, 1–8. [Google Scholar] [CrossRef]
  16. Makropoulos, C.K.; Natsis, K.; Liu, S.; Mittas, K.; Butler, D. Decision support for sustainable option selection in integrated urban water management. Environ. Model. Softw. 2008, 23, 1448–1460. [Google Scholar] [CrossRef]
  17. Peña-Guzmán, C.A.; Melgarejo, J.; Prats, D.; Torres, A.; Martínez, S. Urban water cycle simulation/management models: A review. Water 2017, 9, 285. [Google Scholar] [CrossRef]
  18. House-Peters, L.A.; Chang, H. Urban water demand modeling: Review of concepts, methods, and organizing principles. Water Resour. Res. 2011, 47. [Google Scholar] [CrossRef] [Green Version]
  19. Bacchin, T.K.; Ashley, R.; Sijmons, D.; Zevenbergen, C.; Van Timmeren, A. Green-blue multifunctional infrastructure: An urban landscape system design new approach. In Proceedings of the 13th International Conference on Urban Drainage, Sarawak, Malaysia, 7–12 September 2014; pp. 7–12. [Google Scholar]
  20. Rozos, E.; Makropoulos, C.; Maksimović, Č. Rethinking urban areas: An example of an integrated blue-green approach. Water Sci. Technol. Water Supply 2013, 13, 1534. [Google Scholar] [CrossRef]
  21. Nikolopoulos, D.; van Alphen, H.-J.; Vries, D.; Palmen, L.; Koop, S.; van Thienen, P.; Medema, G.; Makropoulos, C. Tackling the “New Normal”: A Resilience Assessment Method Applied to Real-World Urban Water Systems. Water 2019, 11, 330. [Google Scholar] [CrossRef]
  22. Corella-Barud, V.; Mena, K.D.; Gibbs, S.G.; Gurian, P.L.; Barud, A. Evaluation of neighborhood treatment systems for potable water supply. Int. J. Environ. Health Res. 2009, 19, 49–58. [Google Scholar] [CrossRef]
  23. Petit-Boix, A.; Leipold, S. Circular economy in cities: Reviewing how environmental research aligns with local practices. J. Clean. Prod. 2018, 195, 1270–1281. [Google Scholar] [CrossRef]
  24. Sokolowski, J.A.; Banks, C.M. Principles of Modeling and Simulation; John Wiley & Sons, Inc.: Hoboken, NJ, USA, 2009; ISBN 9780470403563. [Google Scholar]
  25. Makropoulos, C. Thinking platforms for smarter urban water systems: Fusing technical and socio-economic models and tools. Geol. Soc. Lond. Spec. Publ. 2017, 408, 201–219. [Google Scholar] [CrossRef]
  26. Rozos, E.; Makropoulos, C. Source to tap urban water cycle modelling. Environ. Model. Softw. 2013, 41, 139–150. [Google Scholar] [CrossRef] [Green Version]
  27. Bouziotas, D.; Rozos, V.; Makropoulos, C. Water and the City: Exploring links between urban growth and water demand management. J. Hydroinform. 2015, 17, 176–192. [Google Scholar] [CrossRef]
  28. Rozos, E.; Makropoulos, C.; Butler, D. Design Robustness of Local Water-Recycling Schemes. J. Water Resour. Plan. Manag. 2010, 136, 531–538. [Google Scholar] [CrossRef] [Green Version]
  29. Rozos, E.; Makropoulos, C. Assessing the combined benefits of water recycling technologies by modelling the total urban water cycle. Urban Water J. 2012, 9, 37–41. [Google Scholar] [CrossRef]
  30. Fletcher, T.D.; Shuster, W.; Hunt, W.F.; Ashley, R.; Butler, D.; Arthur, S.; Trowsdale, S.; Barraud, S.; Semadeni-Davies, A.; Bertrand-Krajewski, J.-L. SUDS, LID, BMPs, WSUD and more—The evolution and application of terminology surrounding urban drainage. Urban Water J. 2015, 12, 525–542. [Google Scholar] [CrossRef]
  31. Charlesworth, S.M.; Harker, E.; Rickard, S. A review of sustainable drainage systems (SuDS): A soft option for hard drainage questions? Geography 2003, 88, 99–107. [Google Scholar]
  32. Hegger, D.L.T.; Van Vliet, J.; Van Vliet, B.J.M. Niche Management and its Contribution to Regime Change: The Case of Innovation in Sanitation. Technol. Anal. Strateg. Manag. 2007, 19, 729–746. [Google Scholar] [CrossRef]
  33. Parmenter, D. Key Performance Indicators: Developing, Implementing, and Using Winning KPIs; John Wiley & Sons: Hoboken, NJ, USA, 2015; ISBN 1118925106. [Google Scholar]
  34. Chae, B. Developing key performance indicators for supply chain: An industry perspective. Supply Chain Manag. Int. J. 2009, 14, 422–428. [Google Scholar] [CrossRef]
  35. Del-Rey-Chamorro, F.M.; Roy, R.; van Wegen, B.; Steele, A. A framework to create key performance indicators for knowledge management solutions. J. Knowl. Manag. 2003, 7, 46–62. [Google Scholar] [CrossRef]
  36. Alegre, H.; Baptista, J.M.; Cabrera, E., Jr.; Cubillo, F.; Duarte, P.; Hirner, W.; Merkel, W.; Parena, R. Performance Indicators for Water Supply Services; IWA Publishing: London, UK, 2016; ISBN 1780406320. [Google Scholar]
  37. Lambert, A.O.; Brown, T.G.; Takizawa, M.; Weimer, D. A review of performance indicators for real losses from water supply systems. J. Water Supply Res. Technol. 1999, 48, 227–237. [Google Scholar] [CrossRef]
  38. Feingold, D.; Koop, S.; van Leeuwen, K. The City Blueprint Approach: Urban Water Management and Governance in Cities in the U.S. Environ. Manag. 2018, 61, 9–23. [Google Scholar] [CrossRef] [PubMed]
  39. Renouf, M.A.; Serrao-Neumann, S.; Kenway, S.J.; Morgan, E.A.; Low Choy, D. Urban water metabolism indicators derived from a water mass balance—Bridging the gap between visions and performance assessment of urban water resource management. Water Res. 2017, 122, 669–677. [Google Scholar] [CrossRef] [PubMed]
  40. Saary, M.J. Radar plots: A useful way for presenting multivariate health care data. J. Clin. Epidemiol. 2008, 61, 311–317. [Google Scholar] [CrossRef] [PubMed]
  41. Koutsoyiannis, D. Reliability Concepts in Reservoir Design. In Water Encyclopedia; John Wiley & Sons, Inc.: Hoboken, NJ, USA, 2005. [Google Scholar]
  42. Hashimoto, T.; Stedinger, J.R.; Loucks, D.P. Reliability, resiliency, and vulnerability criteria for water resource system performance evaluation. Water Resour. Res. 1982, 18, 14–20. [Google Scholar] [CrossRef] [Green Version]
  43. Wagner, J.M.; Shamir, U.; Marks, D.H. Water distribution reliability: Simulation methods. J. Water Resour. Plan. Manag. 1988, 114, 276–294. [Google Scholar] [CrossRef]
  44. Van Alphen, H.-J.; van Duuren, D.; Koop, S. Decentrale Watersystemen: Potentie, Impact en Gevolgen Voor Drinkwaterbedrijven; BTO Speerpuntonderzoek: Nieuwegein, The Netherlands, 2018. [Google Scholar]
  45. VEWIN. Dutch Drinking Water Statistics 2017: From Source to Tap; VEWIN: Brussels, Belgium, 2017. [Google Scholar]
  46. Beven, K. Rainfall-Runoff Modelling; John Wiley & Sons Ltd.: Chichester, UK, 2012; ISBN 9781119951001. [Google Scholar]
  47. Blume, T.; Zehe, E.; Bronstert, A. Rainfall—Runoff response, event-based runoff coefficients and hydrograph separation. Hydrol. Sci. J. 2007, 52, 843–862. [Google Scholar] [CrossRef]
  48. Savenije, H.H.G. The runoff coefficient as the key to moisture recycling. J. Hydrol. 1996, 176, 219–225. [Google Scholar] [CrossRef]
  49. Thompson, D. The Rational Method. 2006. Available online: http://drdbthompson.net/writings/rational.pdf (accessed on 11 April 2019).
  50. Ndomba, P.M.; Wambura, F.J. Reliability of rainwater harvesting systems in suburbs. A case study of Changanyikeni in Dar es Salaam, Tanzania. Nile Basin Water Sci. Eng. 2010, 3, 72–85. [Google Scholar]
  51. Klein Tank, A.; Beersma, J.; Bessembinder, J.; van den Hurk, B.; Lenderink, G. KNMI ’14: Climate Scenarios for the Netherlands—A Guide for Professionals in Climate Adaption; KNMI: De Bilt, The Netherlands, 2014. [Google Scholar]
  52. Koutsoyiannis, D.; Economou, A. Evaluation of the parameterization-simulation-optimization approach for the control of reservoir systems. Water Resour. Res. 2003, 39. [Google Scholar] [CrossRef] [Green Version]
  53. Rani, D.; Moreira, M.M. Simulation-optimization modeling: A survey and potential application in reservoir systems operation. Water Resour. Manag. 2010, 24, 1107–1138. [Google Scholar] [CrossRef]
  54. Belaineh, G.; Peralta, R.C.; Hughes, T.C. Simulation/optimization modeling for water resources management. J. Water Resour. Plan. Manag. 1999, 125, 154–161. [Google Scholar] [CrossRef]
  55. Venkatesh, G.; Brattebø, H.; Sægrov, S.; Behzadian, K.; Kapelan, Z. Metabolism-modelling approaches to long-term sustainability assessment of urban water services. Urban Water J. 2017, 14, 11–22. [Google Scholar] [CrossRef]
  56. Tsoukalas, I.; Makropoulos, C.; Koutsoyiannis, D. Simulation of Stochastic Processes Exhibiting Any-Range Dependence and Arbitrary Marginal Distributions. Water Resour. Res. 2018, 54, 9484–9513. [Google Scholar] [CrossRef]
  57. Makropoulos, C.; Nikolopoulos, D.; Palmen, L.; Kools, S.; Segrave, A.; Vries, D.; Koop, S.; van Alphen, H.J.; Vonk, E.; van Thienen, P.; et al. A resilience assessment method for urban water systems. Urban Water J. 2018, 15, 316–328. [Google Scholar] [CrossRef]
  58. Abdulla, F.A.; Al-Shareef, A.W. Roof rainwater harvesting systems for household water supply in Jordan. Desalination 2009, 243, 195–207. [Google Scholar] [CrossRef]
  59. Rashidi Mehrabadi, M.H.; Saghafian, B.; Fashi, F.H. Assessment of residential rainwater harvesting efficiency for meeting non-potable water demands in three climate conditions. Resour. Conserv. Recycl. 2013, 73, 86–93. [Google Scholar] [CrossRef]
  60. Muthukumaran, S.; Baskaran, K.; Sexton, N. Quantification of potable water savings by residential water conservation and reuse—A case study. Resour. Conserv. Recycl. 2011, 55, 945–952. [Google Scholar] [CrossRef]
  61. Li, Z.; Boyle, F.; Reynolds, A. Rainwater harvesting and greywater treatment systems for domestic application in Ireland. Desalination 2010, 260, 1–8. [Google Scholar] [CrossRef] [Green Version]
  62. Ghisi, E.; Ferreira, D.F. Potential for potable water savings by using rainwater and greywater in a multi-storey residential building in southern Brazil. Build. Environ. 2007, 42, 2512–2522. [Google Scholar] [CrossRef]
Figure 1. The flows seen in real water systems (left) as well as in the UWOT demand-driven conceptualization (right).
Water 11 01227 g001
Figure 2. Overview of the case study and household types of SUPERLOCAL.
Water 11 01227 g002
Figure 3. The developed simulation-based framework in the form of an assessment chain.
Water 11 01227 g003
Figure 4. The urban water cycle map of SUPERLOCAL in the signal language of UWOT.
Water 11 01227 g004
Figure 5. UWOT topologies for the two design options SCEN_A and SCEN_B.
Water 11 01227 g005aWater 11 01227 g005b
Figure 6. UWOT model validation results.
Water 11 01227 g006
Figure 7. Results of the framework for SUPERLOCAL.
Water 11 01227 g007
Figure 8. Response of the infiltration unit of SCEN_A during simulation.
Water 11 01227 g008
Figure 9. Time-series of the decentralized system DW autonomy for both design options.
Water 11 01227 g009
Figure 10. Event-based runoff reduction for different SUPERLOCAL design options and attributes.
Water 11 01227 g010
Figure 11. Event-based runoff reduction for a future reality and for both design options.
Water 11 01227 g011
Table 1. Main actors and responsibilities involved in the case study.
OrganizationConventional ResponsibilitiesDecentralized Responsibilities (SUPERLOCAL)
Municipality (Kerkrade)Rainwater management (incl. capturing, transport and discharge), sewage network (in cities)Rainwater management (incl. capturing, transport and storage), public area development in regards rainwater harvesting, water square and infiltration services
Operations: Vacuum station, sewage system (black and grey), and rainwater buffers
Drinking water company (WML)Water extraction, production and distributionWater extraction, production and distribution on a local scale
Operations: connection between rainwater buffers and drinking water production (optimization)
Social housing corporation (HEEMwonen)Installation of household technologies and inhouse pipingInstallation of household technologies, inhouse piping and a second (vacuum) sewage system
Operations: Common launderette, food grinders and car wash
Waste water company (WBL)Sewage transport between municipalities and WWTP, and waste water treatmentHelophyte filter and buffers, and BW digestor
Operations: pruning of helophyte filter, and residues transport
Table 2. The case study and household types of SUPERLOCAL.
UnitHousesExperimental HousesApartmentsTotal
Abbreviation (Figure 2)(a)(b)(c)
Number of dwellings133113129
Persons/dwelling (persons)2.2 (29)1.8 (5)2.0 (226)260
Type of toilet (n) Water 11 01227 i001Silent vacuum (13)Standard vacuum (3)Silent vacuum (113)129
Type of shower (n) Water 11 01227 i002Water saving (13)Recirculation (3)Water saving (113)129
Type washing machine (n) Water 11 01227 i002Regular (13)Regular (3)50% regular (56); 50% use shared launderette (5)77
Food grinder (n) Water 11 01227 i001Water saving (13)Water saving (3)Large shared water saving on each level (9)25
Tap(s) (n) Water 11 01227 i002Regular (39)Regular (6)Regular (226)271
Outdoor tap (n) Water 11 01227 i003Regular (13)Regular (3)- (0)16
Waste streams: Water 11 01227 i001 = BW sewage, Water 11 01227 i002 = GW sewage, Water 11 01227 i003 = In soil
Table 3. The KPIs defined as part of the framework.
KPIUnitDescriptionStream
Water 11 01227 i0041Achieved reduction in household consumption (RHC)% of demand reducedTap-level WDM metric, reduction in water requested from households before RWH/GWR take placeDW—demands
Water 11 01227 i0052Reduction in (clean) water requested from central service (RDW)% of reduction of demand requested from central serviceMeasure of system autonomy, dependent on al techs in place (appliances, RWH, GWR)DW—demands
Water 11 01227 i0063Reduction in WW that leaves the system (RWW)% of WW reducedMeasure of system autonomy or (vice versa) dependence on central services (sewer network)Generated WW
Water 11 01227 i0074Achieved runoff reduction (RAR)% of runoff reduced (annual)Measure of the SUPERLOCAL ability to hold waterRunoff
Water 11 01227 i0085Achieved flood event reduction (RER)% of event-based runoff reduced Measure of the SUPERLOCAL ability to mitigate flood peaksRunoff
Water 11 01227 i0096System design reliability (REL)% of time steps that the system operated wellHow reliable different parts of the system are against inefficiency (storage full, overflow)Runoff
Table 4. Design attributes of SUPERLOCAL.
Overview Water 11 01227 i010
SurfacesArea (m2)Other Relevant Quantities
Public and private pervious8000Soil infiltration rate estimated at 0.10–0.15 m/day in all pervious areas
Roof1543
Public impervious (a)8942
BuffersStorage (m3)Other Relevant Quantities
RWH buffers (b)300Roof- 60 m3, non-roof- 190 m3, and mixed buffer 50 m3
Potable water (DW) buffer50
Water square450Area 1000 m2, depth of 0.45 m, infiltration capacity 0.10–0.15 m/day
GW buffer27
Filtered GW buffer20
BW buffer40
PurificationTreatment Cap (m3/day)Other Relevant Quantities
DW purification (c)30 (mean)/180 (max)
Helophyte filter (vertical) (d)14.4Surface area of 400 m2 or smaller when aeration is added
Vacuum pump2.2
GW purification7.2 (mean)/15 (max)

