A New Flash Flood Warning Scheme Based on Hydrodynamic Modelling

1
State Key Laboratory of Water Resources and Hydropower Engineering Science, Wuhan University, Wuhan 430072, China
2
Changjiang River Scientific Research Institute, Wuhan 430010, China
*
Authors to whom correspondence should be addressed.
Water 2019, 11(6), 1221; https://doi.org/10.3390/w11061221
Submission received: 29 April 2019
/
Revised: 6 June 2019
/
Accepted: 10 June 2019
/
Published: 11 June 2019
(This article belongs to the Special Issue Future Challenges in Flood Defence Design and Management)
Abstract
:Flash flooding is one of the most severe natural hazards and commonly occurs in mountainous and hilly areas. Due to the rapid onset of flash floods, early warnings are critical for disaster mitigation and adaptation. In this paper, a flash flood warning scheme is proposed based on hydrodynamic modelling and critical rainfall. Hydrodynamic modelling considers different rainfall and initial soil moisture conditions. The critical rainfall is calculated from the critical hazard, which is based on the flood flow depth and velocity. After the critical rainfall is calculated for each cell in the catchment, a critical rainfall database is built for flash flood warning. Finally, a case study is presented to show the operating procedure of the new flash flood warning scheme.
1. Introduction
Flash floods are one of the most severe natural hazards worldwide. Due to the impact of climate change, the frequency and severity of flash flood hazards increase [1,2]. Furthermore, anthropogenic activity increases in the mountain and hill areas, which adds the risk of humans being exposed to flash floods. Thus, identifying effective measures that reduce the hazard damage triggered by flash floods is important. Flood warning systems are commonly recognized as vital risk mitigation measures [3]. One of the key problems of flash flood warning schemes is how to judge when and whether to send alarms to the targeted people, especially in catchments without hydrometric stations at the cross section of the outlet. Threshold analysis can be used as one of the emerging approaches in flash flood forecasting [4]. Two types of thresholds are usually used. The first threshold is the critical rainfall related to discharge or stage at certain cross sections of the catchment [5,6,7]. The second threshold is the critical rainfall directly related to the depth and/or velocity of the considered cell [8,9], and this threshold better considers the physical background of the hydrodynamics of flash floods.
Bracken et al. (2008) [10] and Norbiato et al. (2008) [11] correlated the rainfall input with the runoff thresholds and identified the critical rainfall conditions necessary to produce flooding in their study areas. Martina et al. (2006) [12] and Golian et al. (2010) [4] showed that flood warnings can be produced by identifying the rainfall conditions necessary to generate flooding. The authors defined the thresholds as the cumulative volume of rainfall for a given soil moisture condition during a storm that could generate critical discharge. Amadio et al. (2003) [13] and Martina et al. (2006) [12] proposed flash flood warning systems based on comparisons between critical thresholds and real-time monitoring rainfall or precipitation forecasts. Amadio et al. (2003) [13] also investigated the reliability of a flood warning system based on rainfall thresholds using historical data.
Because rainfall thresholds are non-trivial, the generation and run-off processes of flash floods, which provide the basis of the definition of thresholds, are also important. Models for flash floods can be categorized into three kinds: data-driven models, lumped hydrological models, and distributed hydrological models [14]. Data-driven models use statistical relationships derived from precipitation and river flow data to generate flow forecasts. These models are widely used in flood forecasting due to their simplicity. However, these models require long-term data records for training or calibration; thus, these models are inappropriate for flash flood forecasting because flash floods usually occur in small catchments in which gauged data are rare or unavailable. Lumped hydrological models are primarily used for flood forecasting with the hypothesis that the parameters are invariant in space [15]. In general, the usefulness of lumped hydrological models for flash floods is limited by their coarse resolution, their need for long-term historical data for calibration, and their poor performance in catchments with few gauges [14]. Distributed models are gaining popularity among hydrologists, who use them to simulate the non-linear response of a catchment to rainfall events [16,17,18,19,20]. The basic physical principles include the conservation of mass and momentum for shallow water flows. With different approximations to the shallow flow equations, the distributed models are divided into kinematic wave [21,22], diffusion wave [23,24], adaptive kinematic-dynamic [25], and full hydrodynamic models [8,26,27,28,29,30]. Comparative studies have shown how difficult it is for kinematic and diffusion wave models to accurately resolve flash floods [28,31]. Although some simplified models have been confirmed by the agreement between modelling results and observations, complete confirmation is logically precluded by the fallacy of affirming the consequences and by incomplete access to natural phenomena [32]. Consequently, it is critical to develop flash flood models incorporating as much physical mechanism as possible, which seems to be the most viable way of improving the reliability of numerical modelling [8,30,33].
Full hydrodynamic models can provide detailed hydrodynamic information (e.g., depth and velocity) for each cell and can accurately model the rainfall-runoff process. Therefore, it is the best choice for calculating critical rainfall. Only a few studies have proposed critical rainfall based on full hydrodynamic models [8]. In this previous work, the critical rainfall was related only to depth, which neglects the fact that the combination of low depth and high velocity can also put people in danger in mountainous areas. Therefore, it is necessary to include velocity in the definition of rainfall thresholds.
In the present paper, we present a new warning scheme based on hydrodynamic modelling results and a new method for calculating the critical rainfall related to the critical hazard index from flood flow depth and velocity. A case study of the Lengkou catchment is provided to demonstrate the operational flowchart of the new warning scheme.
2. Hydrodynamic Model
The full 2D hydrodynamic model proposed in Huang et al. (2015) [33] was employed in the present work. This model was built upon the 2D shallow water hydrodynamic model and incorporated rainfall and infiltration. Manning’s roughness coefficient is used to calculate the bed stresses. The original Green–Ampt infiltration equation [34] is used to calculate the infiltration rate. In this model, the saturated hydraulic conductivity and Green–Ampt capillary head , which was mainly determined by the soil type, are assumed to be uniform and constant when field data are not available. The saturated volumetric water content is usually equal to the soil porosity. The initial volumetric water content may vary spatially. However, it is difficult to obtain information about the spatial distribution of the initial water content for real flash floods. Following Martina et al. (2006) [12], the three values of the initial volumetric water content () that were adopted were 1/3, 2/3 and 1.0, which corresponded to dry, moderate wet, and wet soil conditions, respectively.
The governing equations were solved using the Godunov-type finite volume method in conjunction with the Harten-Lax-van Leer-contact (HLLC) approximate Riemann solver [35]. Details of the numerical scheme can be referenced in [33]. The hydrodynamic model has a 2nd order accuracy in space and a 1st order accuracy in time. The model was validated by several laboratory experiments [36,37] and realistic flash flood events in small catchments (i.e., two flash flood events in the Lengkou catchment) [33]. It was concluded that the present model had the capacity to reproduce flash floods, which meets the objective of calculating the thresholds to be used in flash flood warning systems.
3. Materials and Methods
3.1. Hazard Index
The critical rainfall was adopted as the warning index. The critical rainfall was calculated from the hazard index based on the hydrodynamic modelling results. The hazard index is the basis of the critical rainfall and the decision of whether to send a warning alarm. In previous research (Cao et al. 2010) [8], the critical depth was adopted as a hazard index, i.e., 0.3 m and 1.0 m, which corresponded to “preparing evacuation” (PE) and “immediate evacuation” (IE), respectively. However, it should be noted that the bed slope is relatively large in the mountain and hill areas, which means that even a low flood depth can expose people to high flood risks. Methods for evaluating flood hazard risks to people can be referenced in Xia et al. (2011) [38]. The widely used method proposed by the Defra and Environment Agency [9] was modified in the current study to quantify the flood hazard rating. The Defra and Environment Agency [9] used depth, velocity, and debris presence as indexes to quantify the flood hazard rating, as shown in the following equation: , where is the hazard index, is the water depth, m, is the velocity, m/s, and is the debris factor (=0, 1, 2, depending on the possibility that debris will lead to a significantly greater hazard). The value for the parameter is divided into four ranges, i.e., HR < 0.75, 0.75 < HR < 1.25, 1.25 < HR < 2.0, and HR > 2.0, and the rating of the flood hazard is divided into four levels: very low hazard (caution), danger for some groups (including children, elderly and sick), danger for most groups (including the general public), and danger for all groups (including the emergency services). Considering that debris is usually found in flash floods, the default value of the debris factor is 1.0. Thus, the resulting empirical relationship is adopted in the present study for simplicity. For flash flood warnings, only the last two levels of flood risk are considered. In the present work, two critical hazard indexes are adopted, i.e., equals 0.5 and 1.0 (which are 1.5 and 2.0, respectively, in the Defra and Environment Agency [9]), which correspond to the “preparing evacuation” (PE) and “immediate evacuation” (IE) warning levels, respectively.
3.2. Building Database of Critical Threshold Rainfalls
Rainfall intensity and duration have been extensively recognized as factors that play an important role in flood-generation mechanisms [10,39,40]. Meanwhile, the initial soil moisture conditions represent critical inputs for the infiltration process; thus, these conditions impact rainfall runoff modelling [41]. Therefore, these conditions should be considered in the scenarios. A uniform rainfall intensity was used during the rainfall processes and spatially for the catchment.
3.2.1. Modelling Scenarios
The National Weather Service (NWS) has defined a flash flood as a flood that occurs within 6 h [42] or within minutes to multiple hours of the causative event [43]. In the present work, three rainfall durations were considered, i.e., 1 h, 3 h, and 6 h. According to Department of Water Resources of Shanxi Province(DWRSP) (2010) [44], the peak rainfalls for 1 h and 6 h were 38 mm and 75 mm, respectively. To ensure that all the rainfall conditions were included in the database, the maximum rainfalls were chosen to be 80 mm, 100 mm and 170 mm for 1 h, 3 h, and 6 h, respectively. To build the database of critical rainfall, the number of scenarios that consider rainfall intensity should be as high as possible. Because uniform rainfall intensity in time and space is assumed, the rainfall intensity is determined by the total rainfall. Therefore, the minimum total rainfall for all rainfall durations was set to 10 mm, and the maximum total rainfall was different under scenarios with different rainfall durations. Considering that overland flows require a certain amount of time to converge into lower lands and rivers and to reach their maximum hazard index values, the simulation time should be extended. Specifically, the rainfall scenarios were designed as follows: the simulation time is 3 h, and the total rainfall increment is 10 mm, which results in 8 scenarios for the 1-h rainfall duration condition (Table 1). If the simulation time is 6 h and the rainfall increment is 15 mm, then there are 7 scenarios for the 3-h rainfall duration condition. If the simulation time is 12 h and the rainfall increment is 20 mm, then there are 9 scenarios for the 6-h rainfall duration condition. Meanwhile, three kinds of initial soil saturation conditions should be considered for each rainfall condition. Overall, 72 scenarios were modelled to build the critical rainfall database (Table 1).
3.2.2. Calculation of Critical Rainfall
First, we extracted the hydraulic data (i.e., depth and velocity) for every cell from the database to calculate its hazard index, , for all scenarios.
Second, we compared the critical hazard index (i.e., 0.5 and 1.0) and the maximum hazard indexes in each rainfall duration scenario: . The rainfalls are and in relation to and , respectively.
Third, the critical rainfall was obtained through linear interpolation from and .
The critical rainfall database was built through the calculation of critical rainfalls for all combinations of rainfall durations and initial soil saturation conditions. For each cell, there were up to 18 critical rainfalls considered for different rainfall durations, initial soil saturation levels, and warning rating levels.
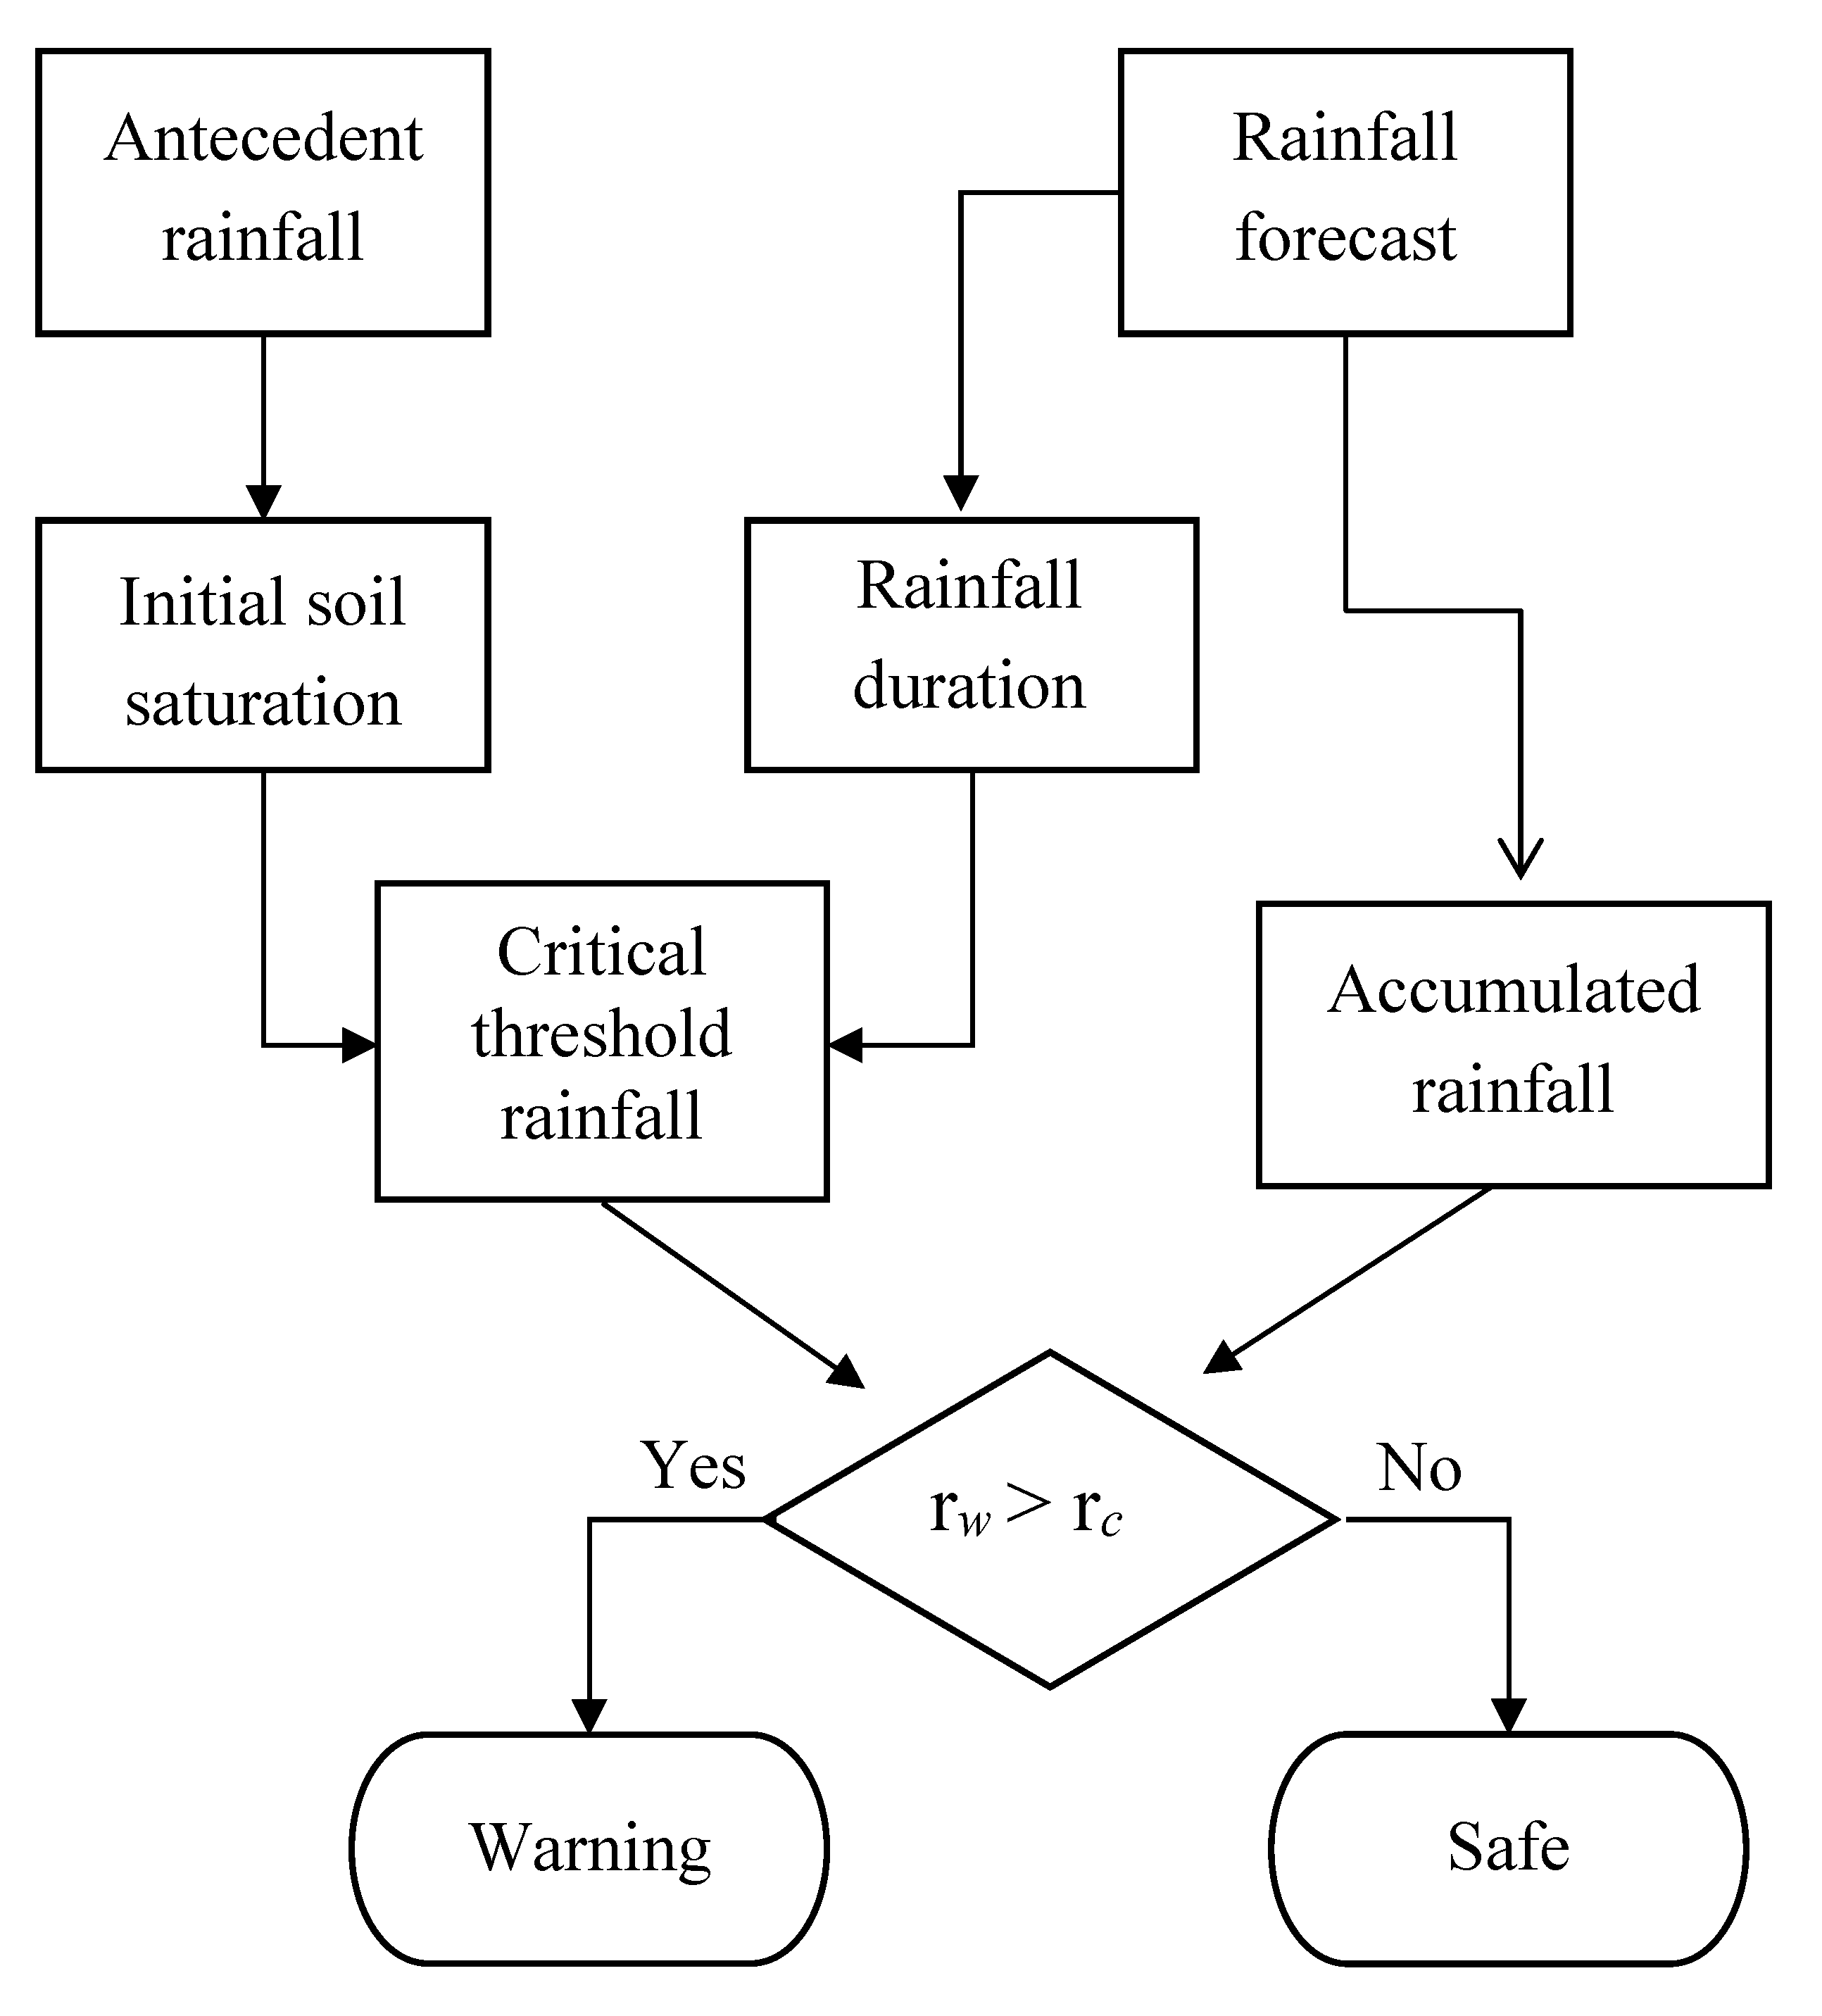
3.3. Flood Warning Operation Flow
The procedure for flood warning is listed as follows (see Figure 1):
- (1)
- Determine the rainfall duration time according to the rainfall forecast.
- (2)
- Determine the antecedent soil moisture type according to the 5-day accumulated rainfall (Table 2).
- (3)
- Based on the rainfall duration and antecedent soil type determination, determine the corresponding critical rainfall from the database.
- (4)
- Calculate the accumulated rainfall at the decision moment, . Calculate the accumulated rainfall at the warning moment, . The calculation time steps for both and are 15 min for a 1-h rainfall duration, while they are 30 min for both 3-h and 6-h rainfall durations.
- (5)
- Compare the rainfall at the warning time, , and the critical rainfall, ; if > , send the warning information to the target community.
3.4. Comparison with Existing Systems and Limitations
In the traditional flash flood warning system, the flash flood guidance method is widely used in Europe and the USA. The flash flood guidance is the rainfall of a given duration, assuming uniformity in space and time in a specific catchment, that is necessary to cause flooding at the outlet of the considered catchment at a certain frequency. The relationship between rainfall and discharge at the outlet is the key information used in this type of method. If there is a long record of rainfall, antecedent soil moisture, and outlet discharge, the flash flood guidance method is sufficiently robust. However, the following limitations of flash flood guidance have been concluded by Hapuarachchi et al. (2011) [14]: (a) by providing a lumped value for a given catchment, the flash flood risks for critical areas inside a catchment are missed; (b) the threshold of runoff varies at different river cross sections, which makes the determination of threshold runoff using 1–2 year flood frequency unrealistic; and (c) the flash flood method does not consider the impact of topographical characteristics on the overland flow. Compared to the flash flood guidance method, the early warning scheme presented in this research has none of these limitations. First, the critical rainfall varies in space, which considers the spatial rainfall distribution in the operational process. Second, the warning operation directly compares the accumulated rainfall and the critical rainfall, and there is no need to determine the threshold of runoff, avoiding the difficulties caused by the variations at different cross sections. Third, the overland flow and runoff are calculated using a full hydrodynamic model, which can consider the influence of rainfall intensity, bed topography, soil moisture, and infiltration.
Although the present warning scheme is efficient and robust, there are still some limitations. First, the resolution of the digital elevation model (DEM) is coarse due to the availability of the DEM, which may decrease the accuracy of depth and velocity. However, it should be noted that the workflow of the early warning system will not be changed. Second, uniform rainfall is assumed in time and space following flash flood guidance in the modelling scenarios, and this assumption may differ from the actual conditions of realistic rainfall events.
4. Case Study
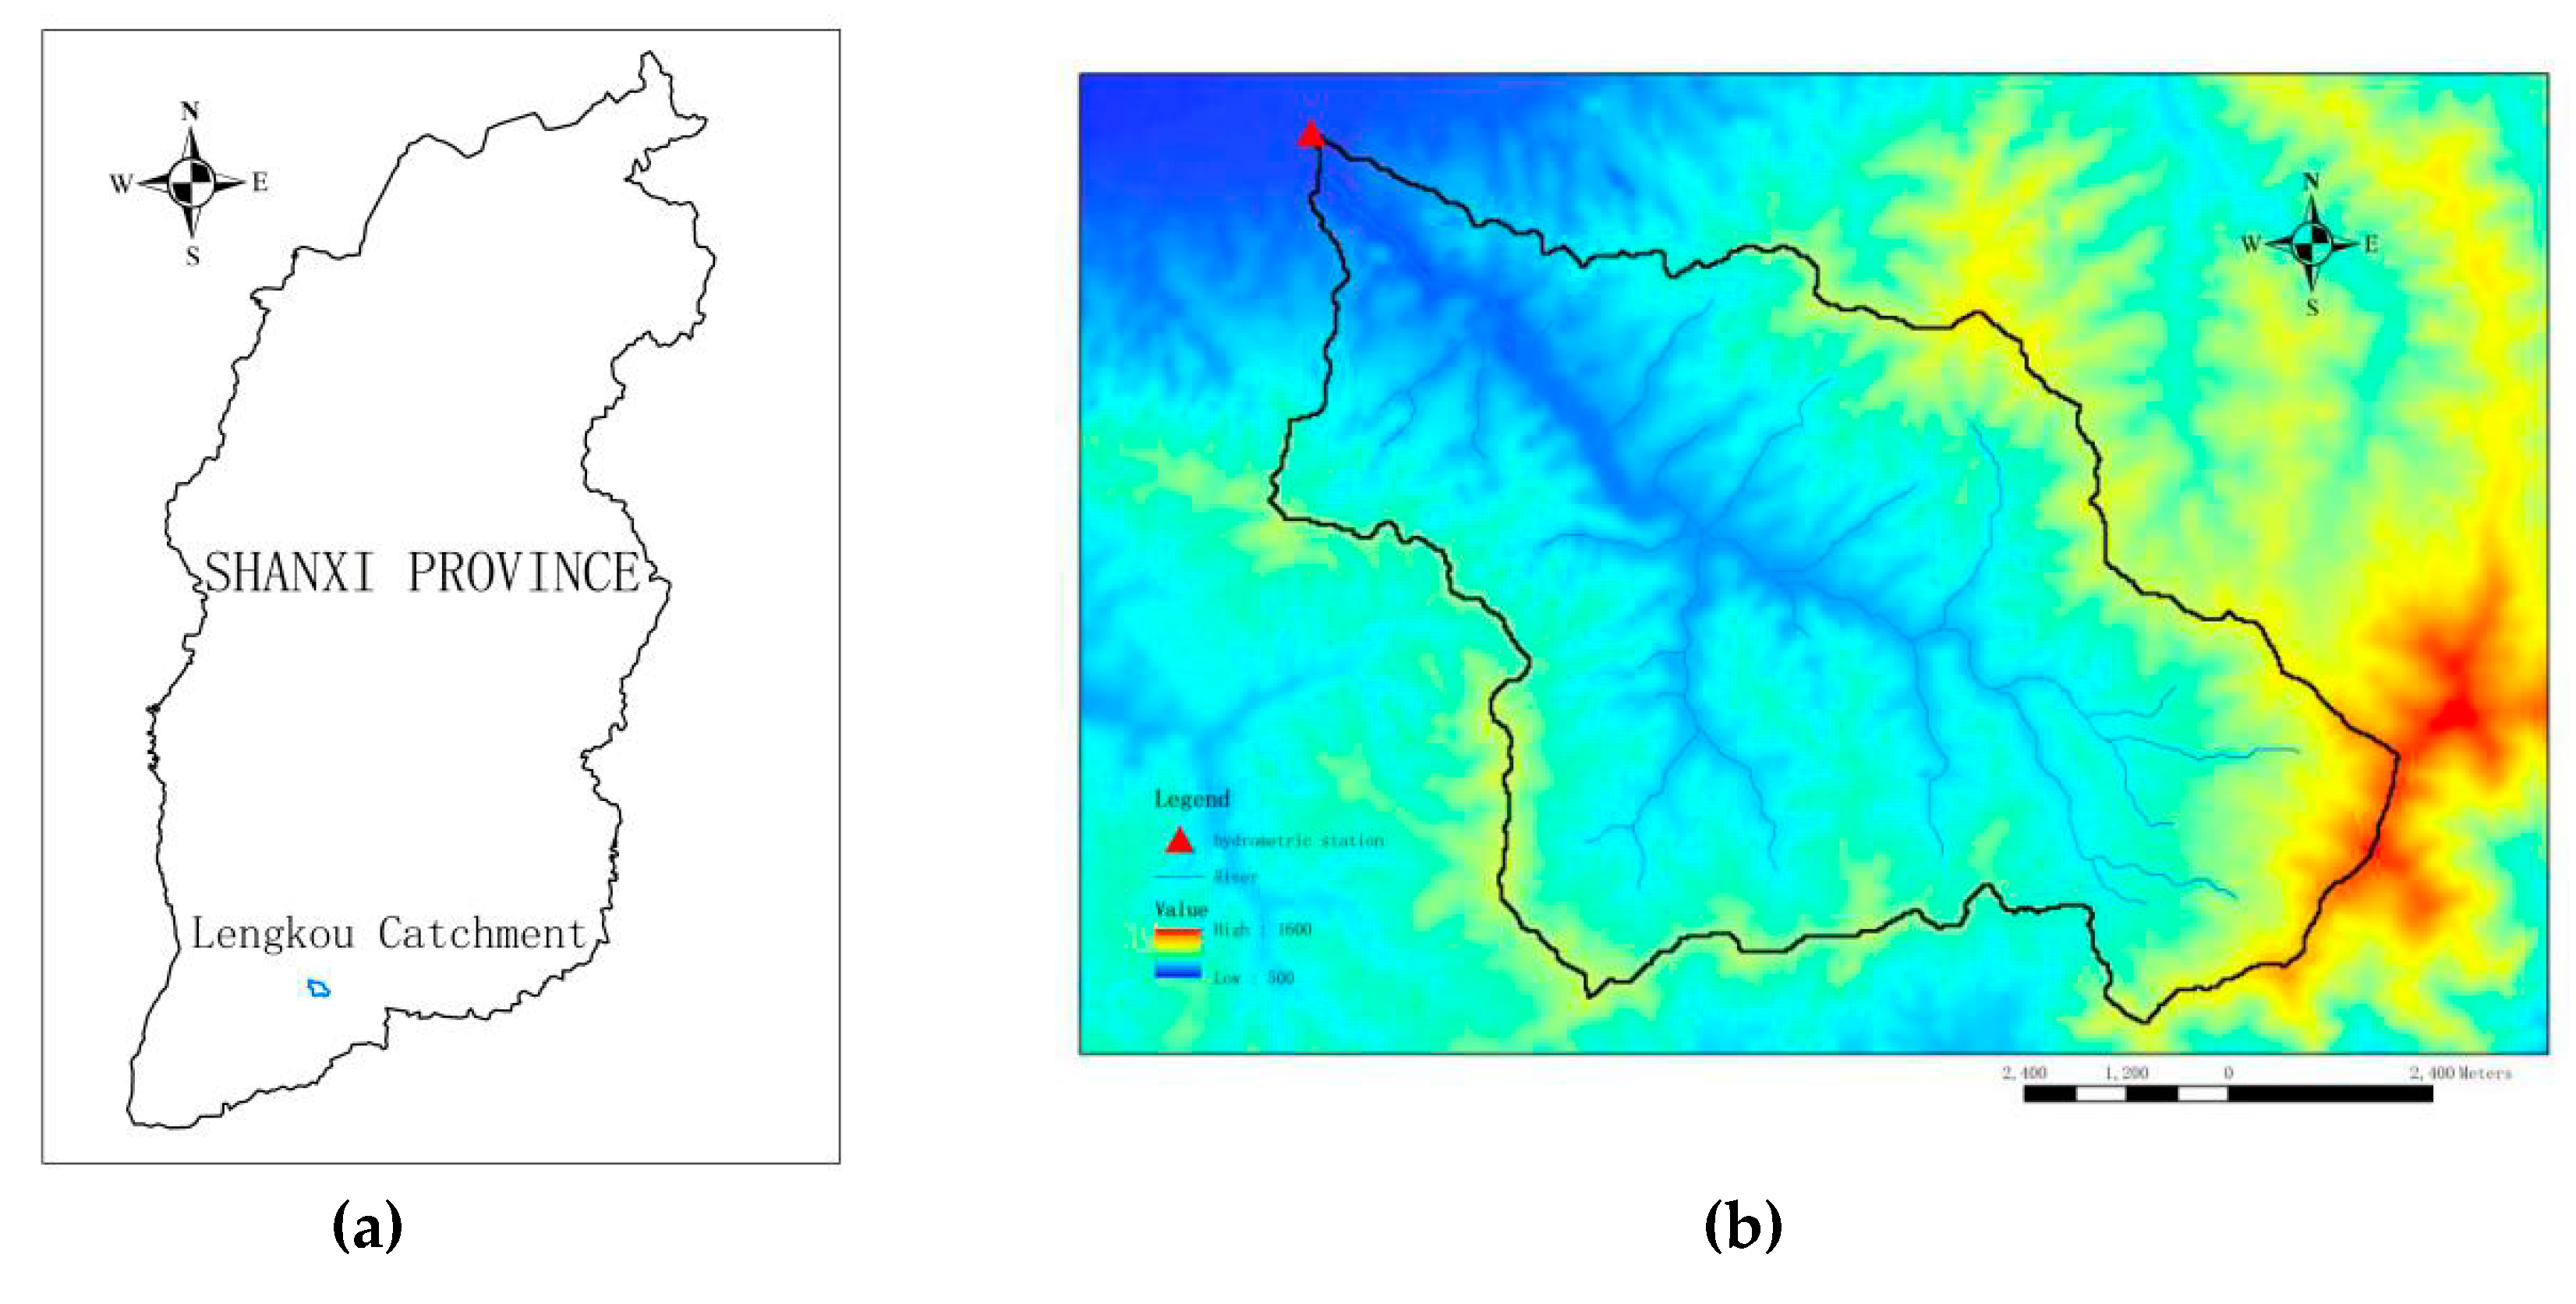
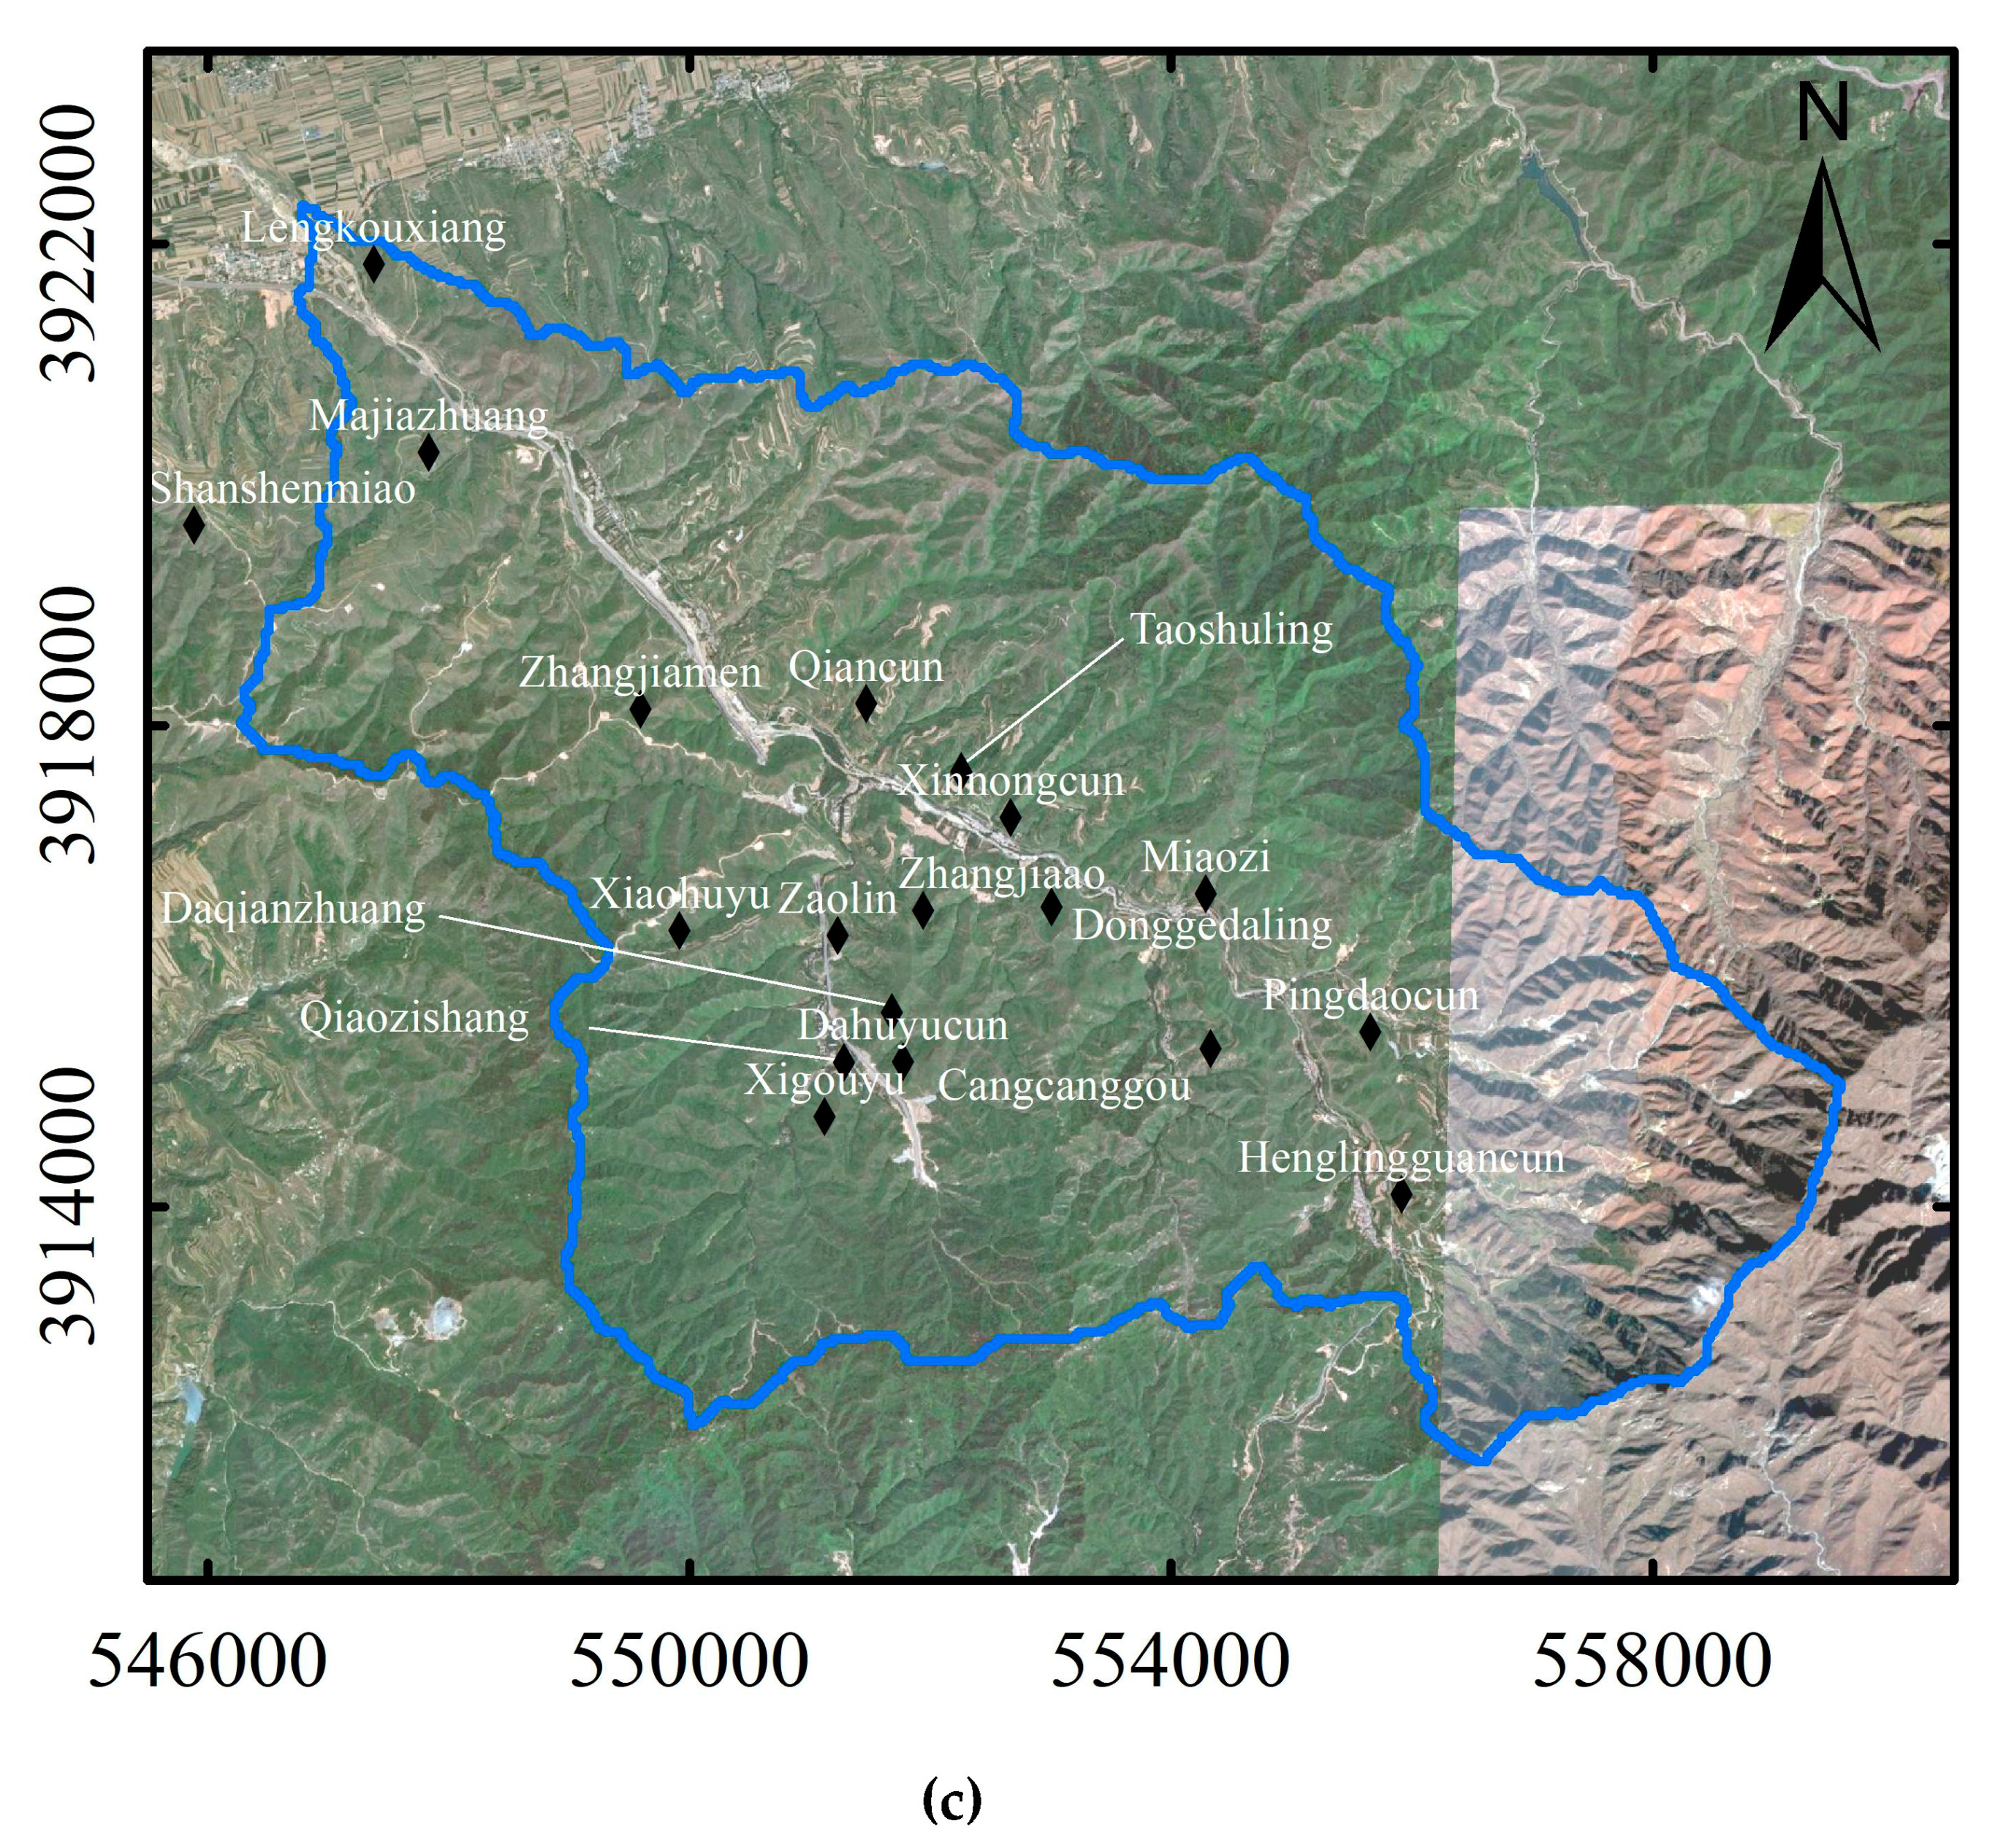
4.1. Introduction of Lengkou Catchment
The Lengkou catchment (35°21′~35°26′ N; 110°31′~110°39′ E) is in Yuncheng, Shanxi, China (Figure 2). The catchment is in a semi-humid area, and most of its soil consists of loess (DWRSP 2010). The area of the catchment is approximately 76 km2, the main channel upstream of the outlet cross section (Lengkouxiang) is 17 km long, and the average longitudinal bed slope of the main channel is 1/400. There are three types of land cover in the Lengkou catchment: bust wood (14.1 km2), forest (61.4 km2), and loess (0.5 km2), and these values correspond to Manning roughness values of 0.075, 0.12, and 0.05 m1/3/s, respectively. The resolution of the DEM adopted for hydrodynamic modelling was 30 m × 30 m.
4.2. Results
In this section, the impacts of the critical hazard index, rainfall duration and antecedent rainfall on critical rainfall are demonstrated in the Lengkou catchment.
Based on the hydrodynamic modelling results, the critical rainfall was obtained for each cell with different combinations of rainfall duration and initial soil condition.
4.2.1. Impact of Critical Hazard Index
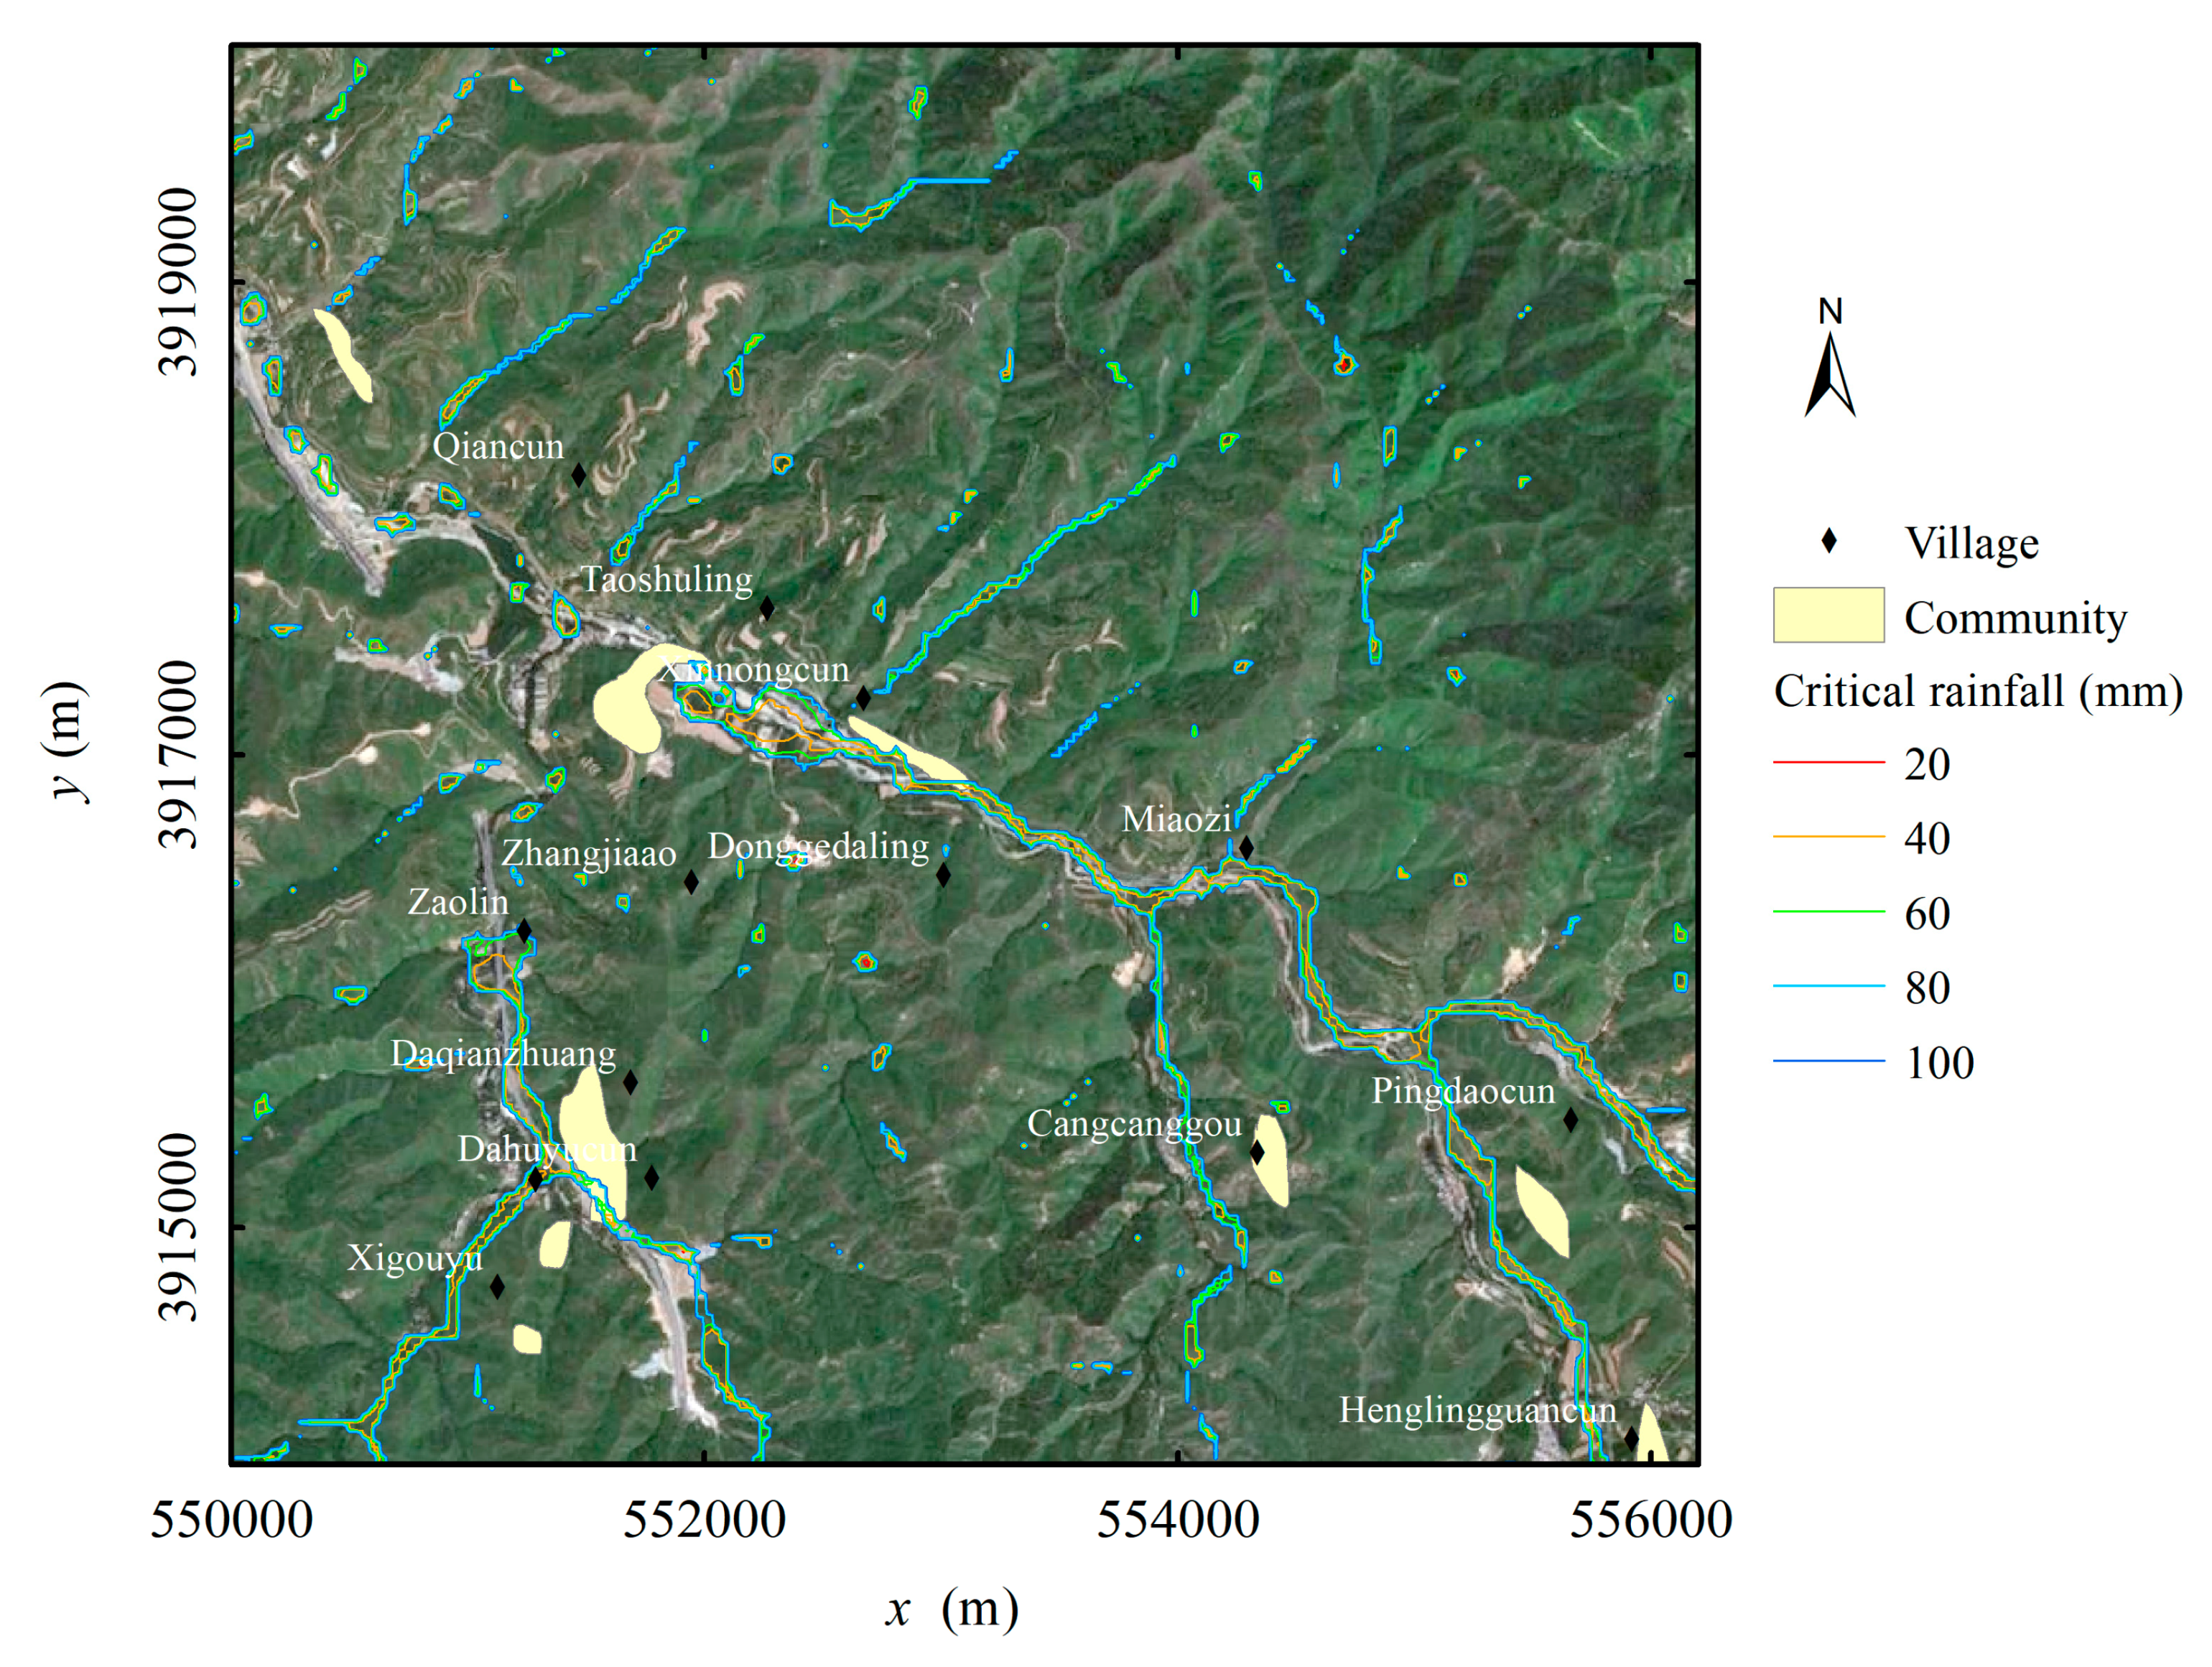
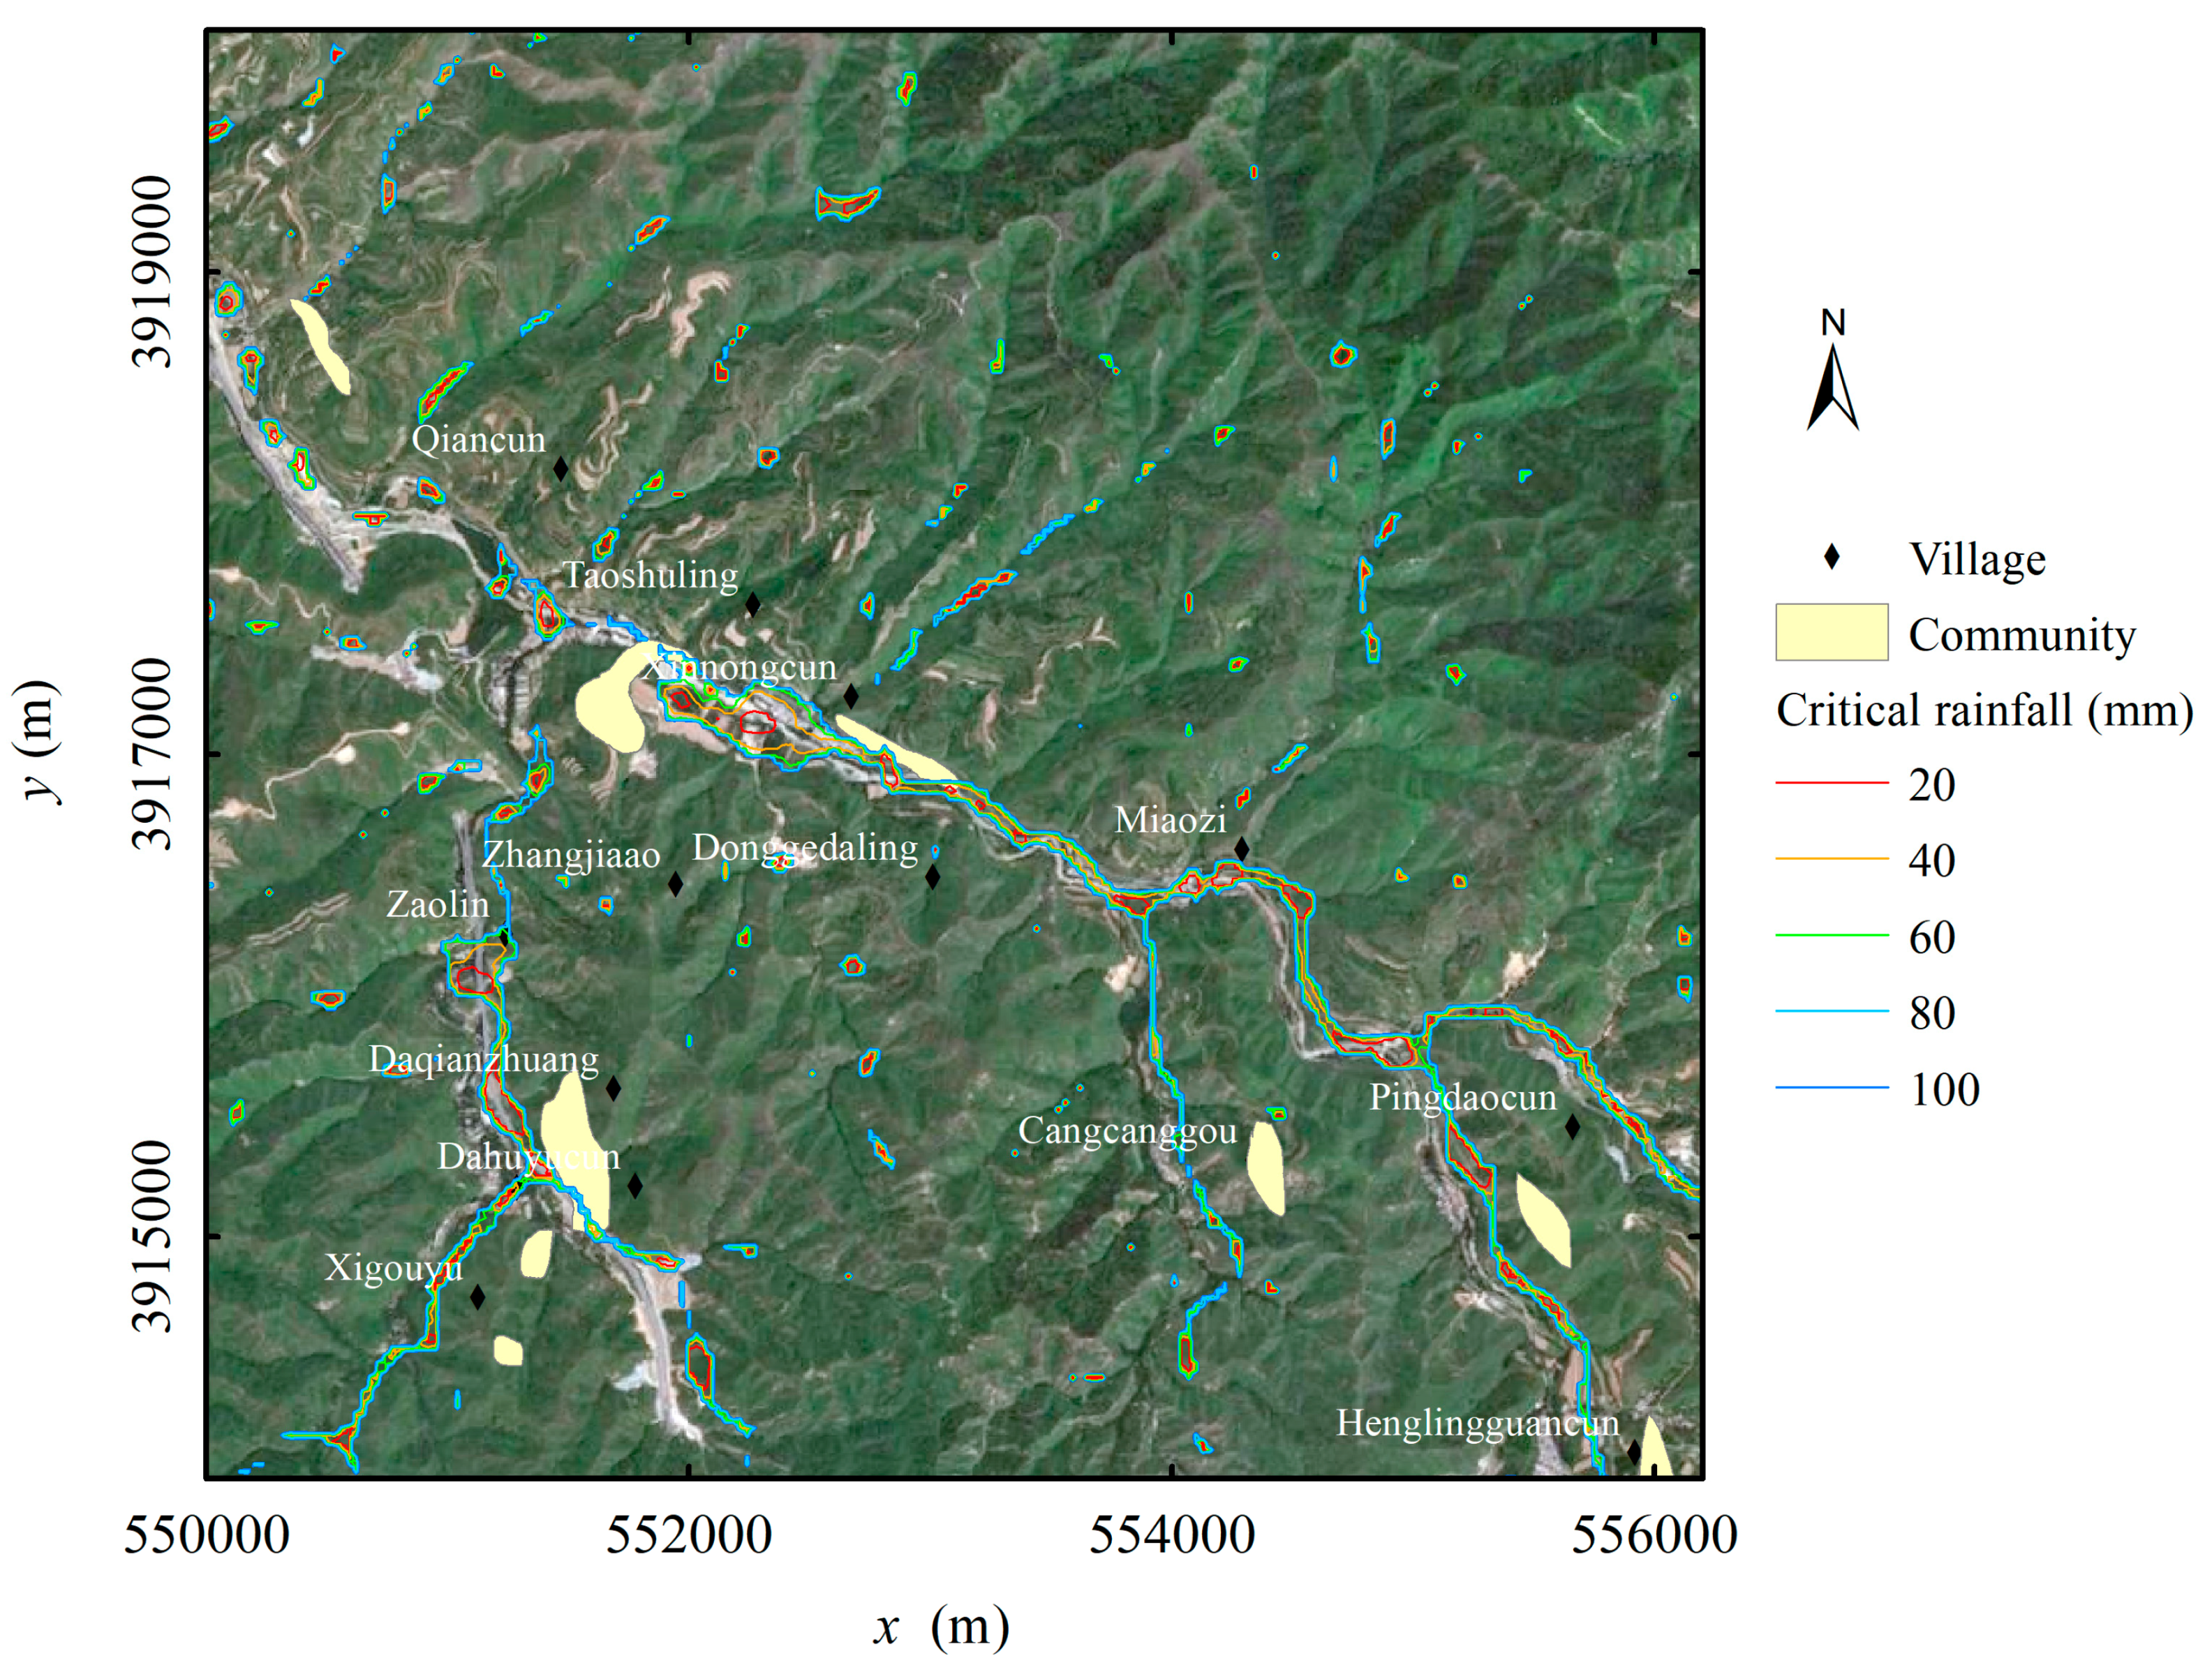
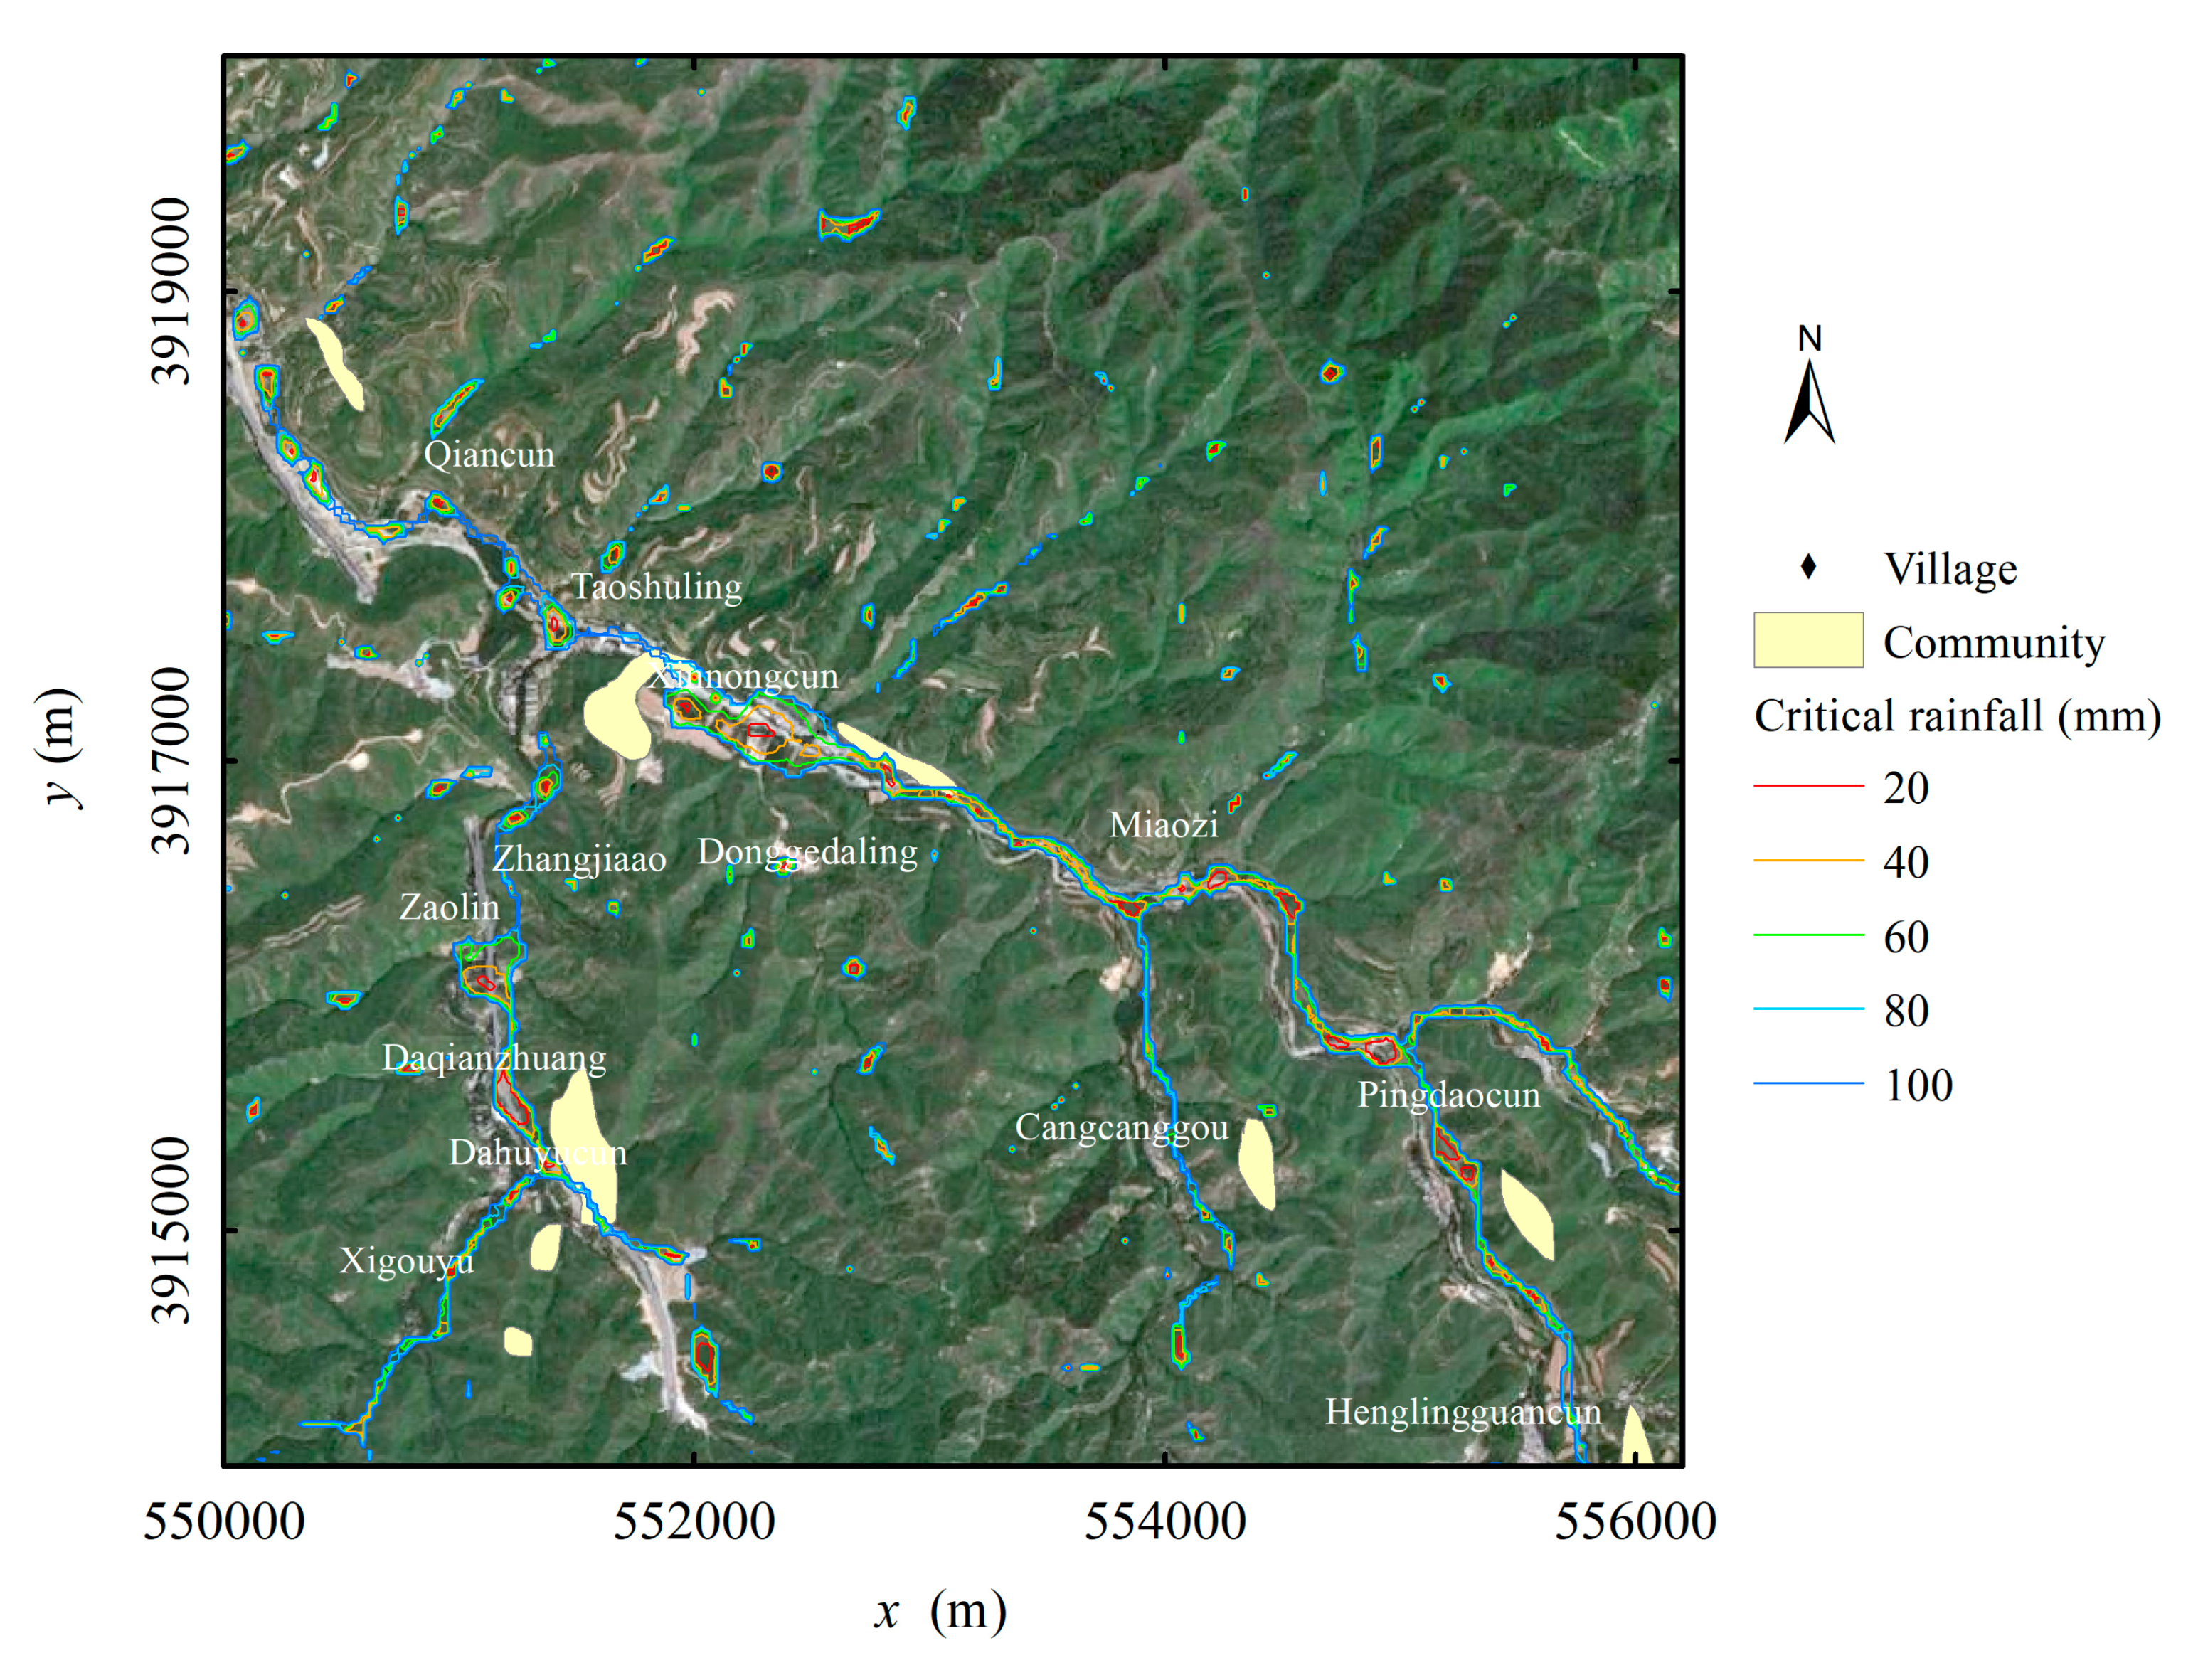
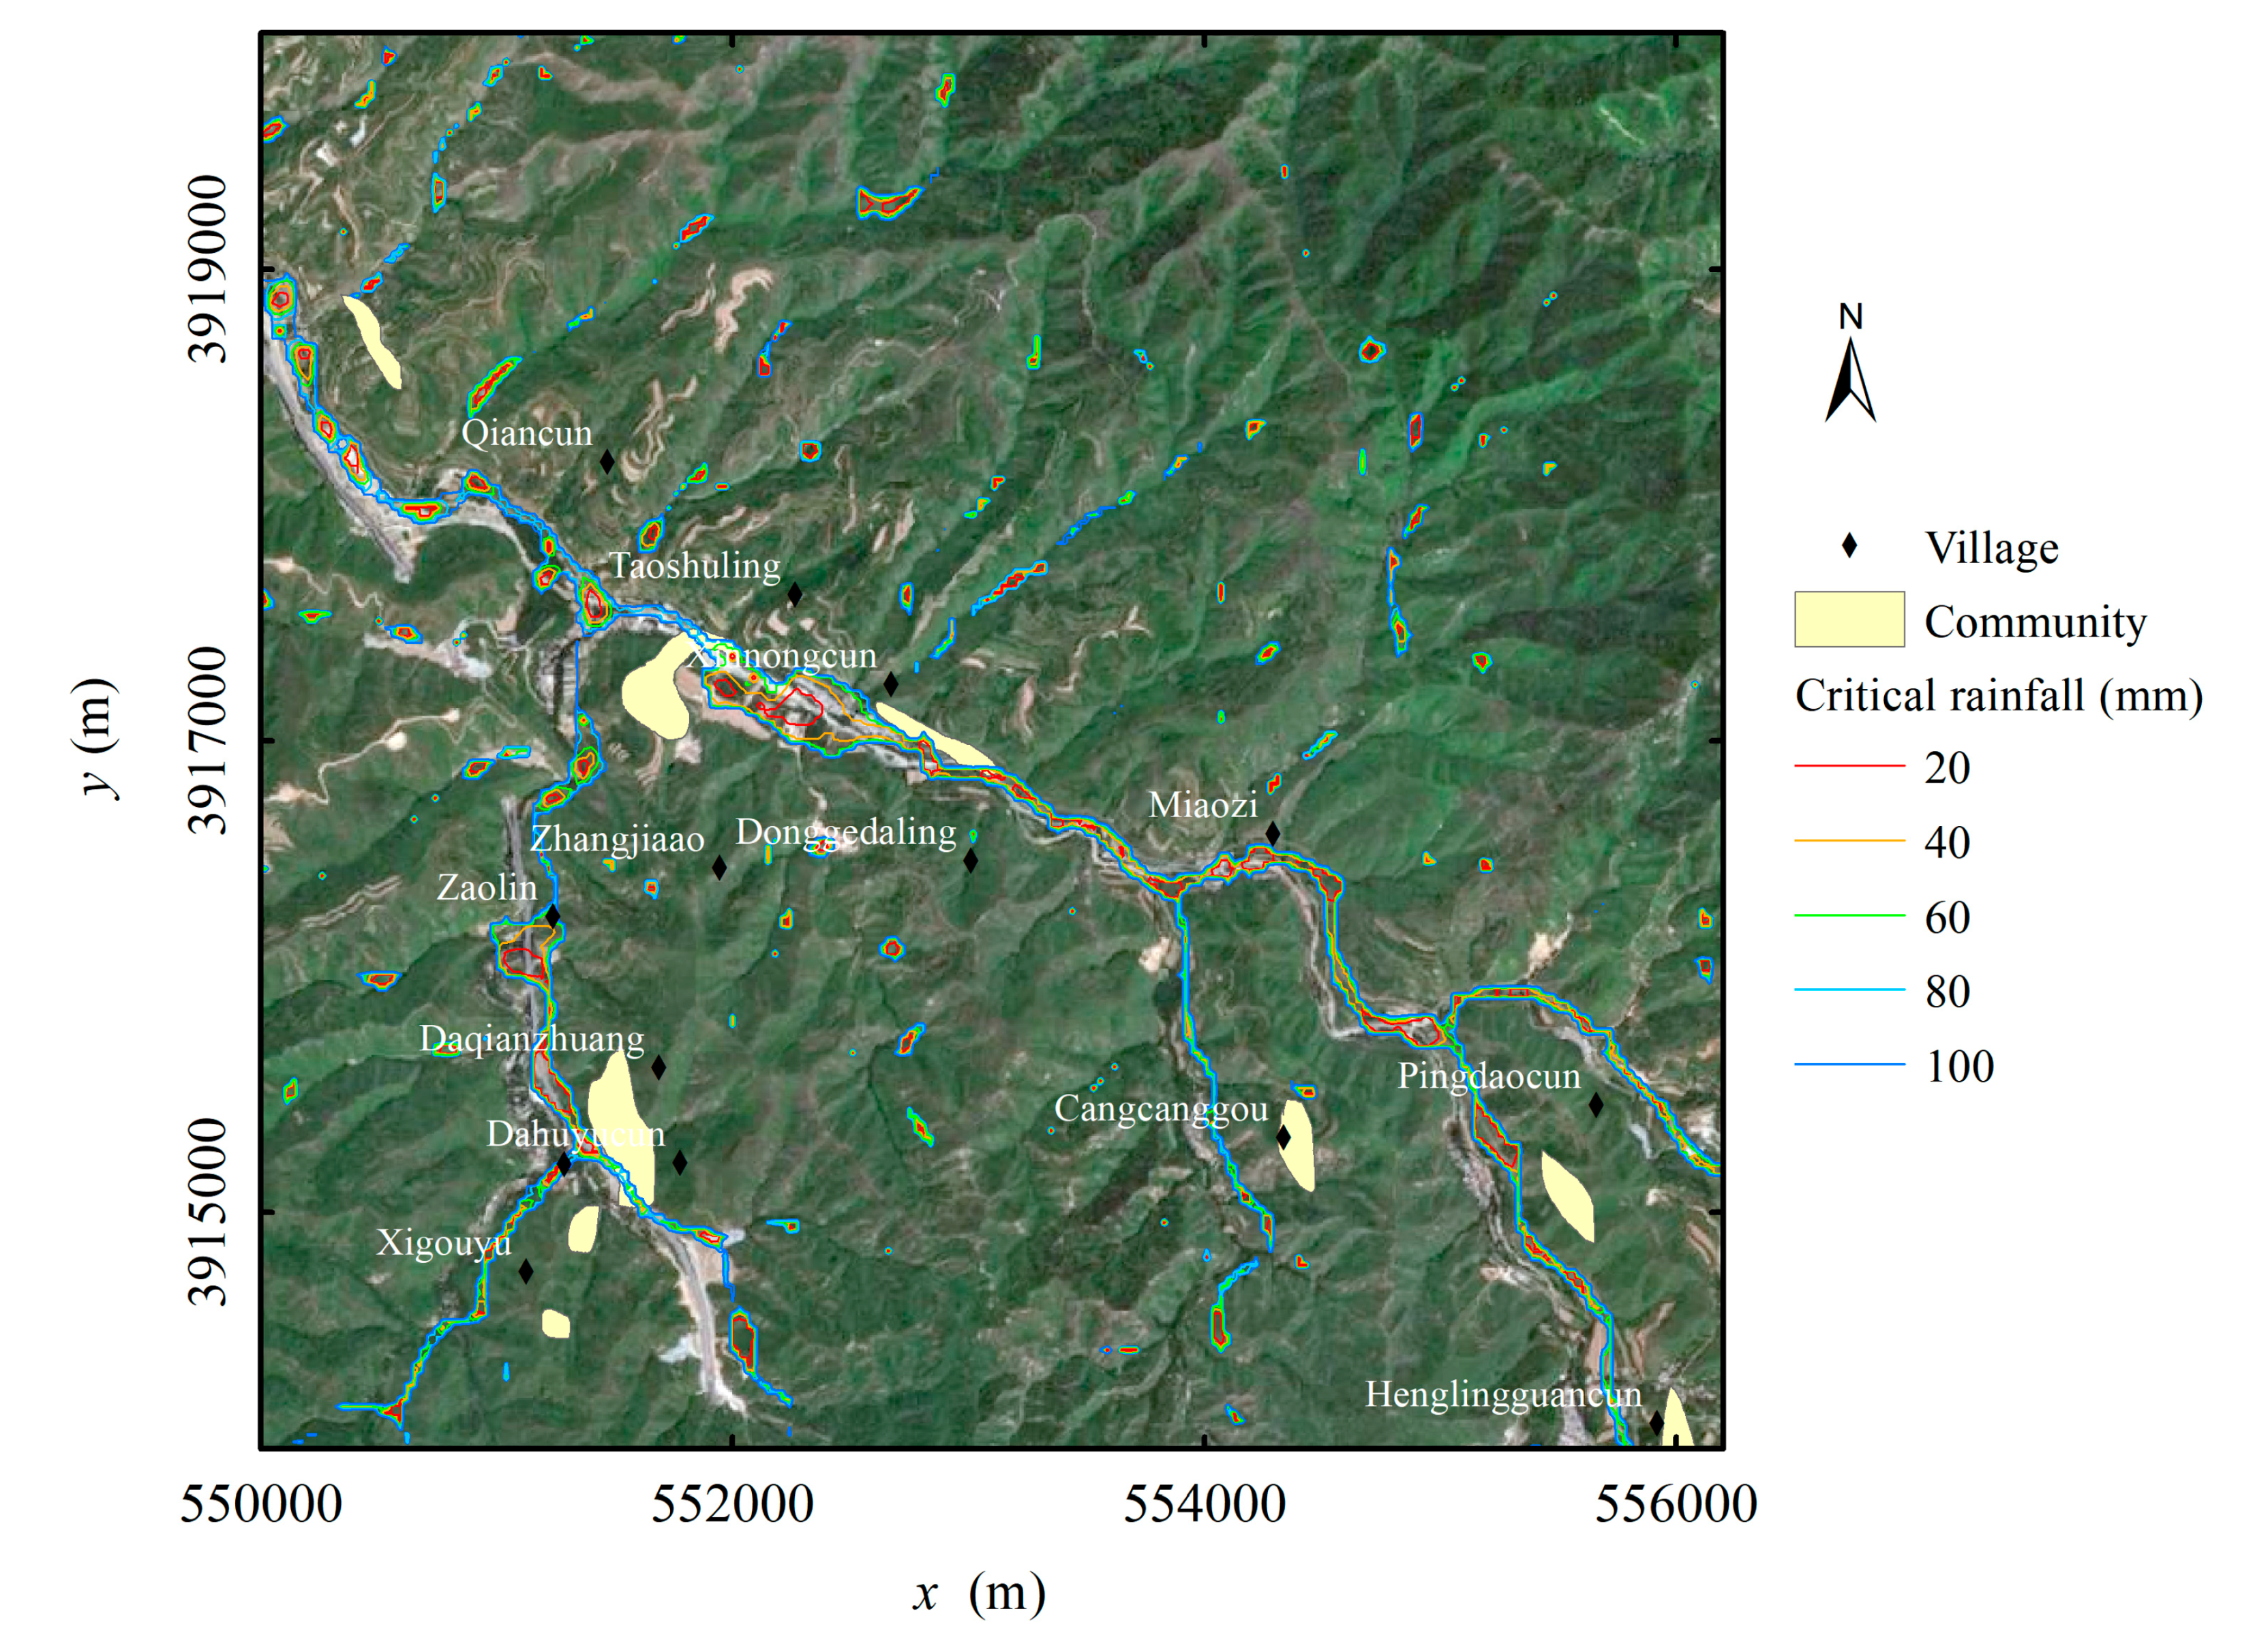
Using 1-h rainfall duration as an example, the distributions of critical rainfall for both PE and IE are shown for the initial dry soil conditions in Figure 3 and Figure 4, respectively. Figure 3 shows the critical rainfall distribution for PE. The critical rainfall for PE was greater than 100 mm in most domains of the catchment. The domain whose critical rainfall was less than 80 mm is mainly located along the valley. In some communities, the critical rainfall was less than 40 mm, e.g., Xinnongcun, Taoshuling, Cangcanggou, Daqianzhuang, Xigouyu, and Zuolin, which implies that these domains suffer high risks of flash flooding. Figure 4 shows the critical rainfall distribution for IE. The critical rainfall was also larger than 100 mm. The domains with low critical rainfall were similar to those for PE. However, the critical rainfall was greater than that for PE, e.g., the critical rainfall along the valley upstream of Xinnongcun was 60 mm for PE, while it was 80 mm for IE.
4.2.2. Impact of Rainfall Duration
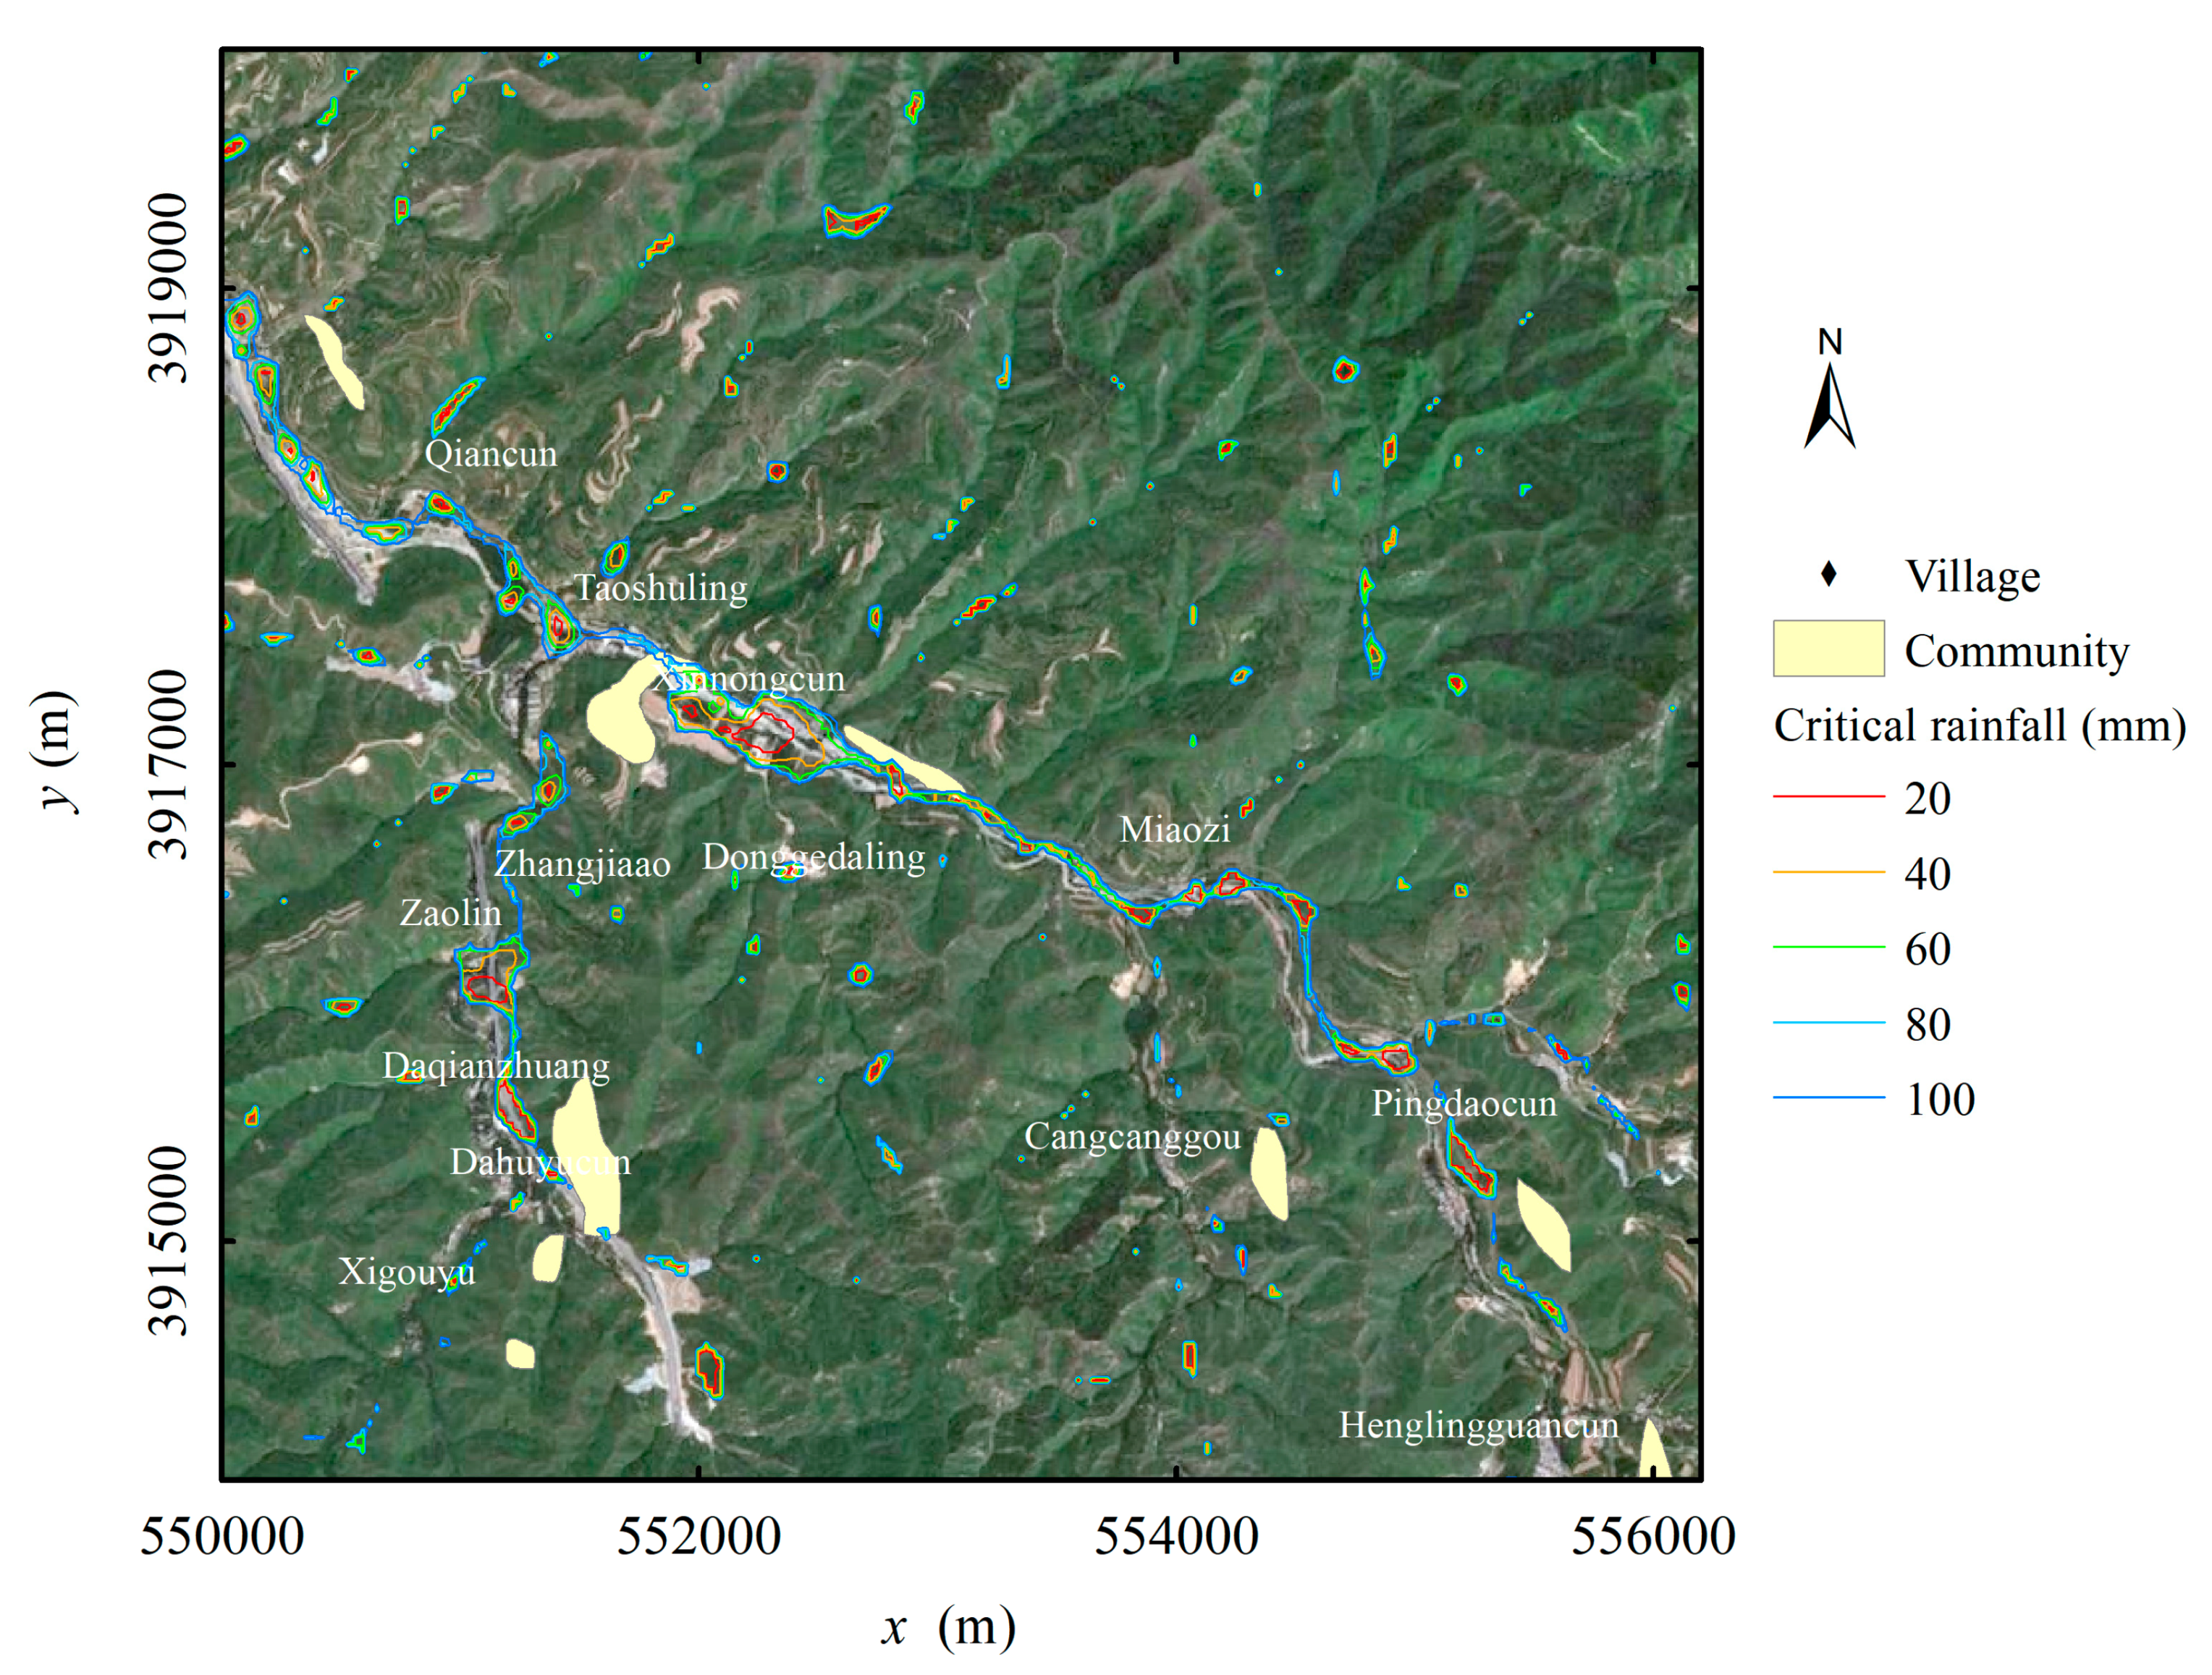
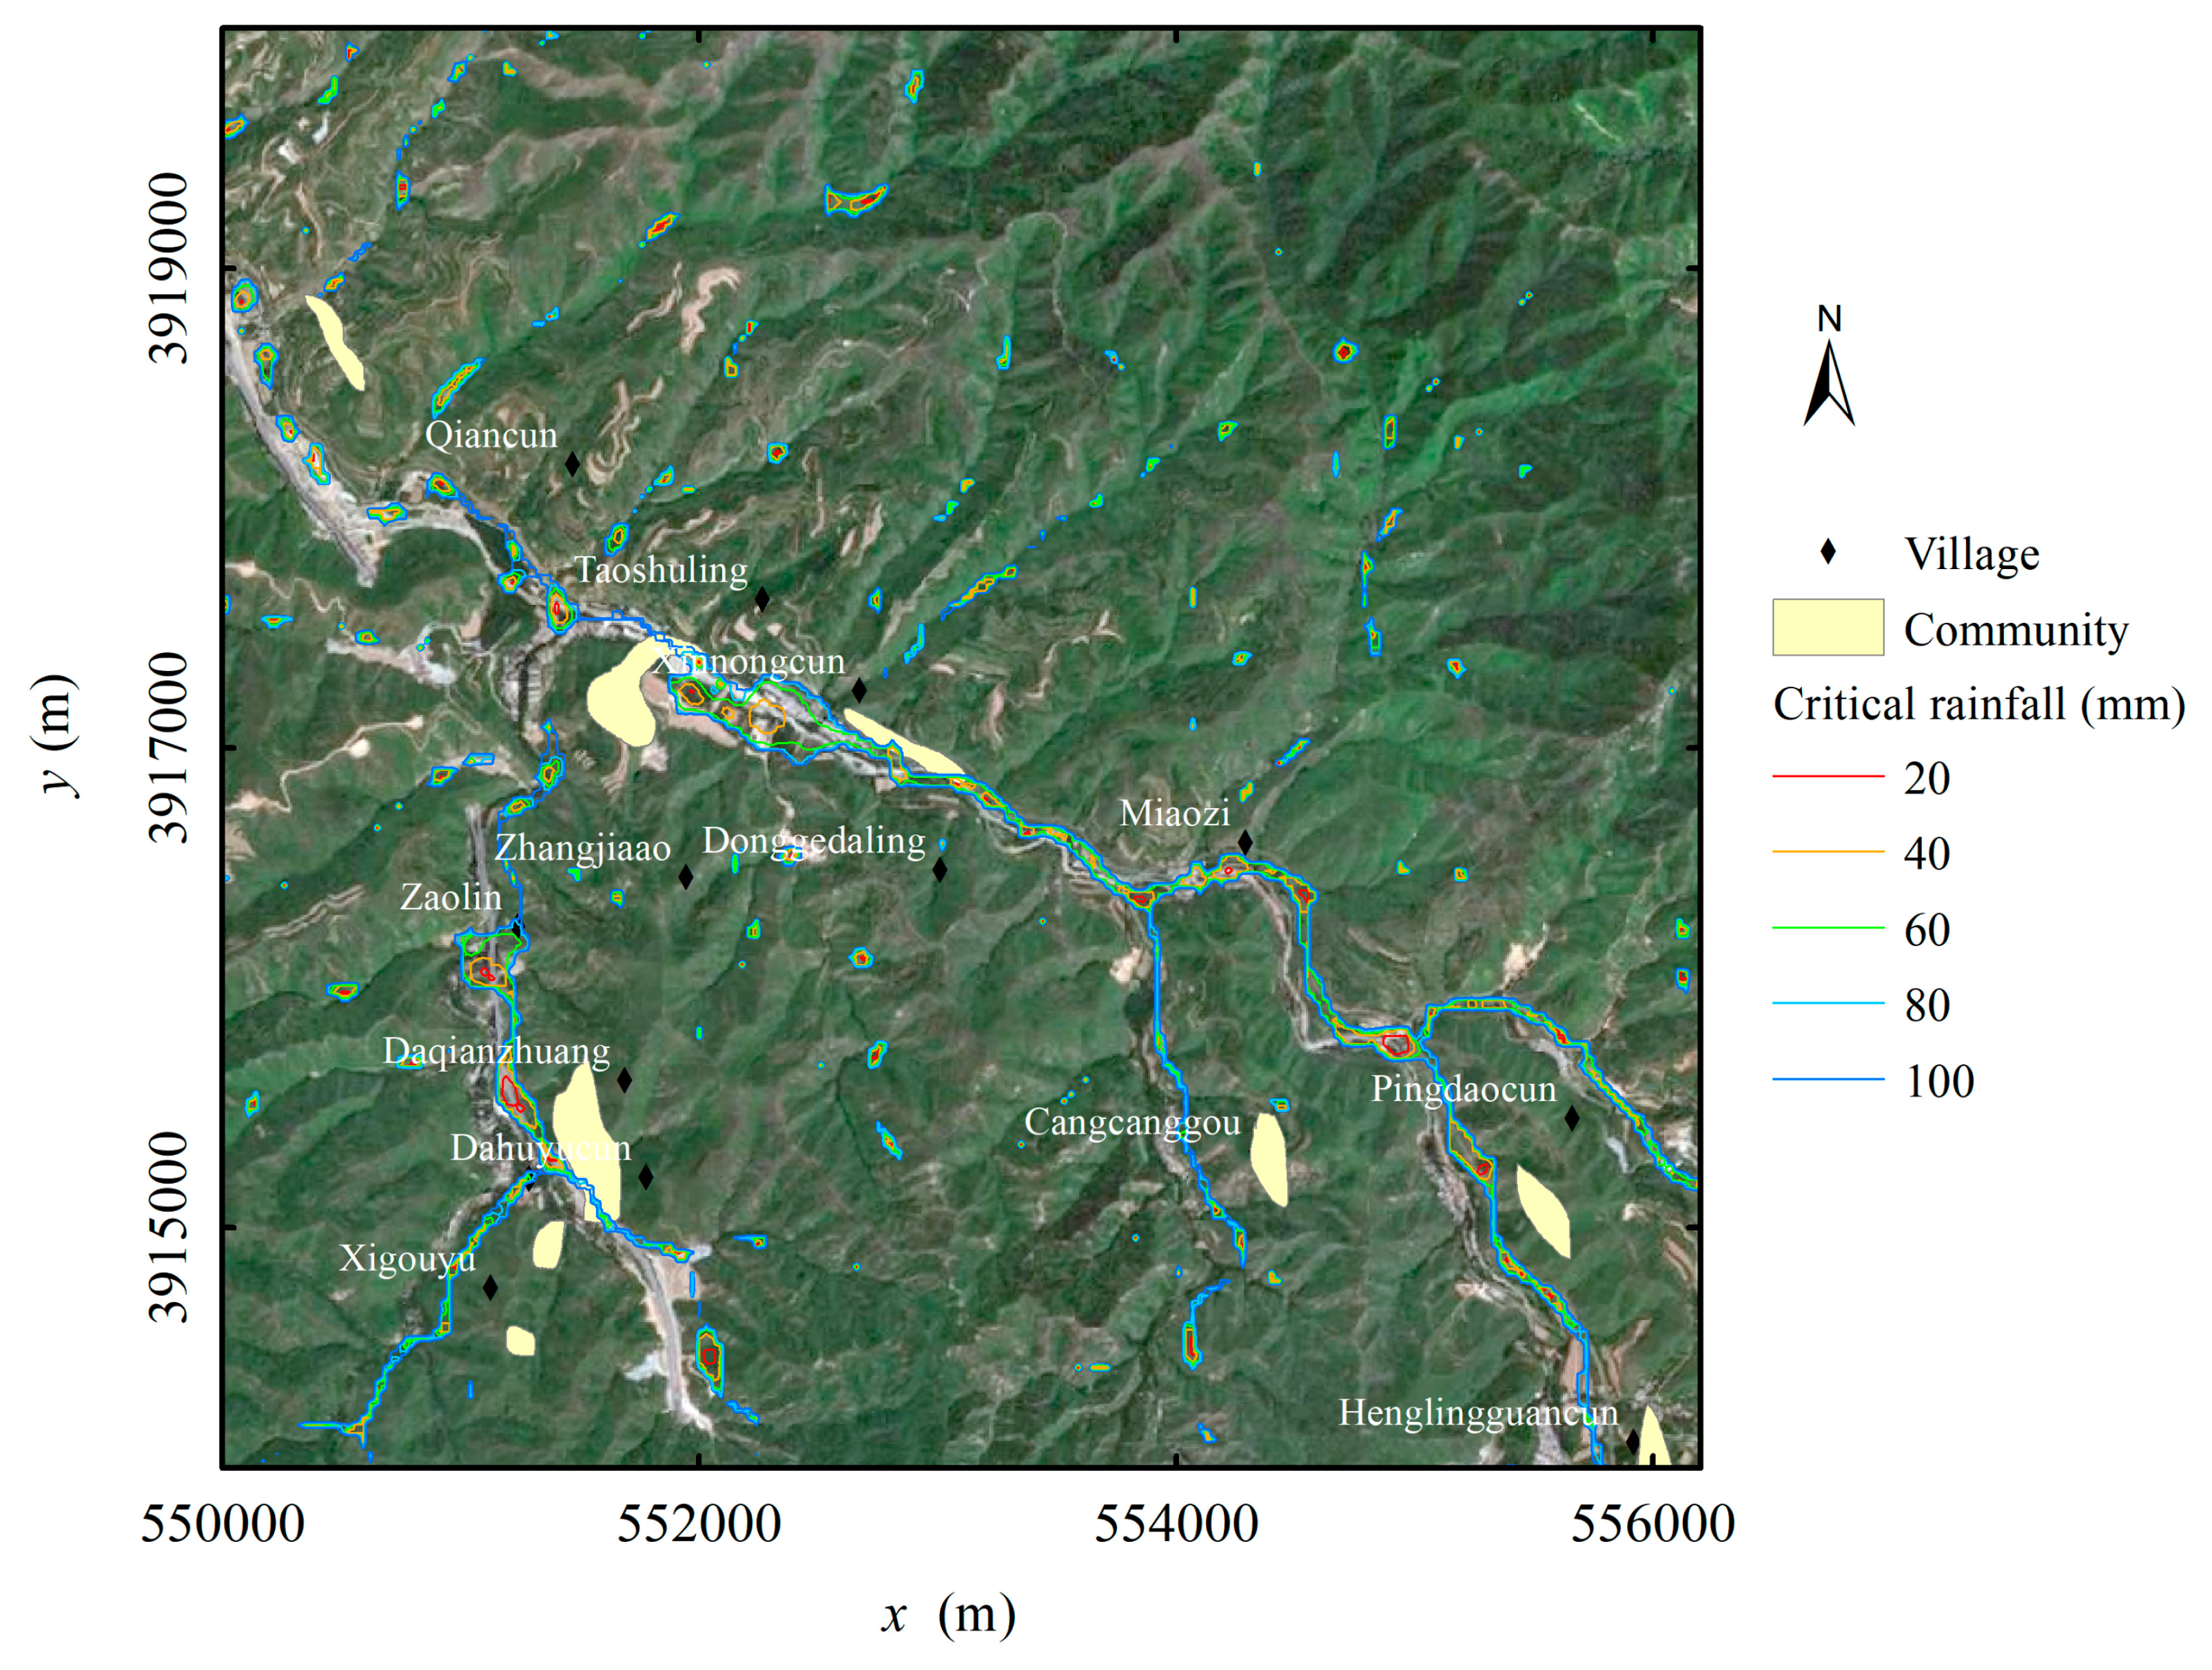
Because the rainfall duration can affect the infiltration and runoff processes, the critical rainfalls may be different for different rainfall durations. We can use the critical rainfall for IE under initial wet soil conditions as an example to illustrate the impact of rainfall duration on the critical rainfall. Figure 5 shows the critical rainfall distribution for IE in the 1-h rainfall duration. The critical rainfall of most domains along the valley is less than 80 mm. The runoff converges in the valley and forms a flash flood that is limited to the area upstream of Taoshulin. The scattered local low critical rainfall values in the valley downstream of Taoshulin are mainly due to local rainfall. A comparison of the critical rainfalls between the 3-h rainfall duration and 6-h rainfall duration shows that the critical rainfall along the valley is smaller than that for a longer rainfall duration because the contribution of overland flow converges when the critical rainfall is larger (Figure 6 and Figure 7).
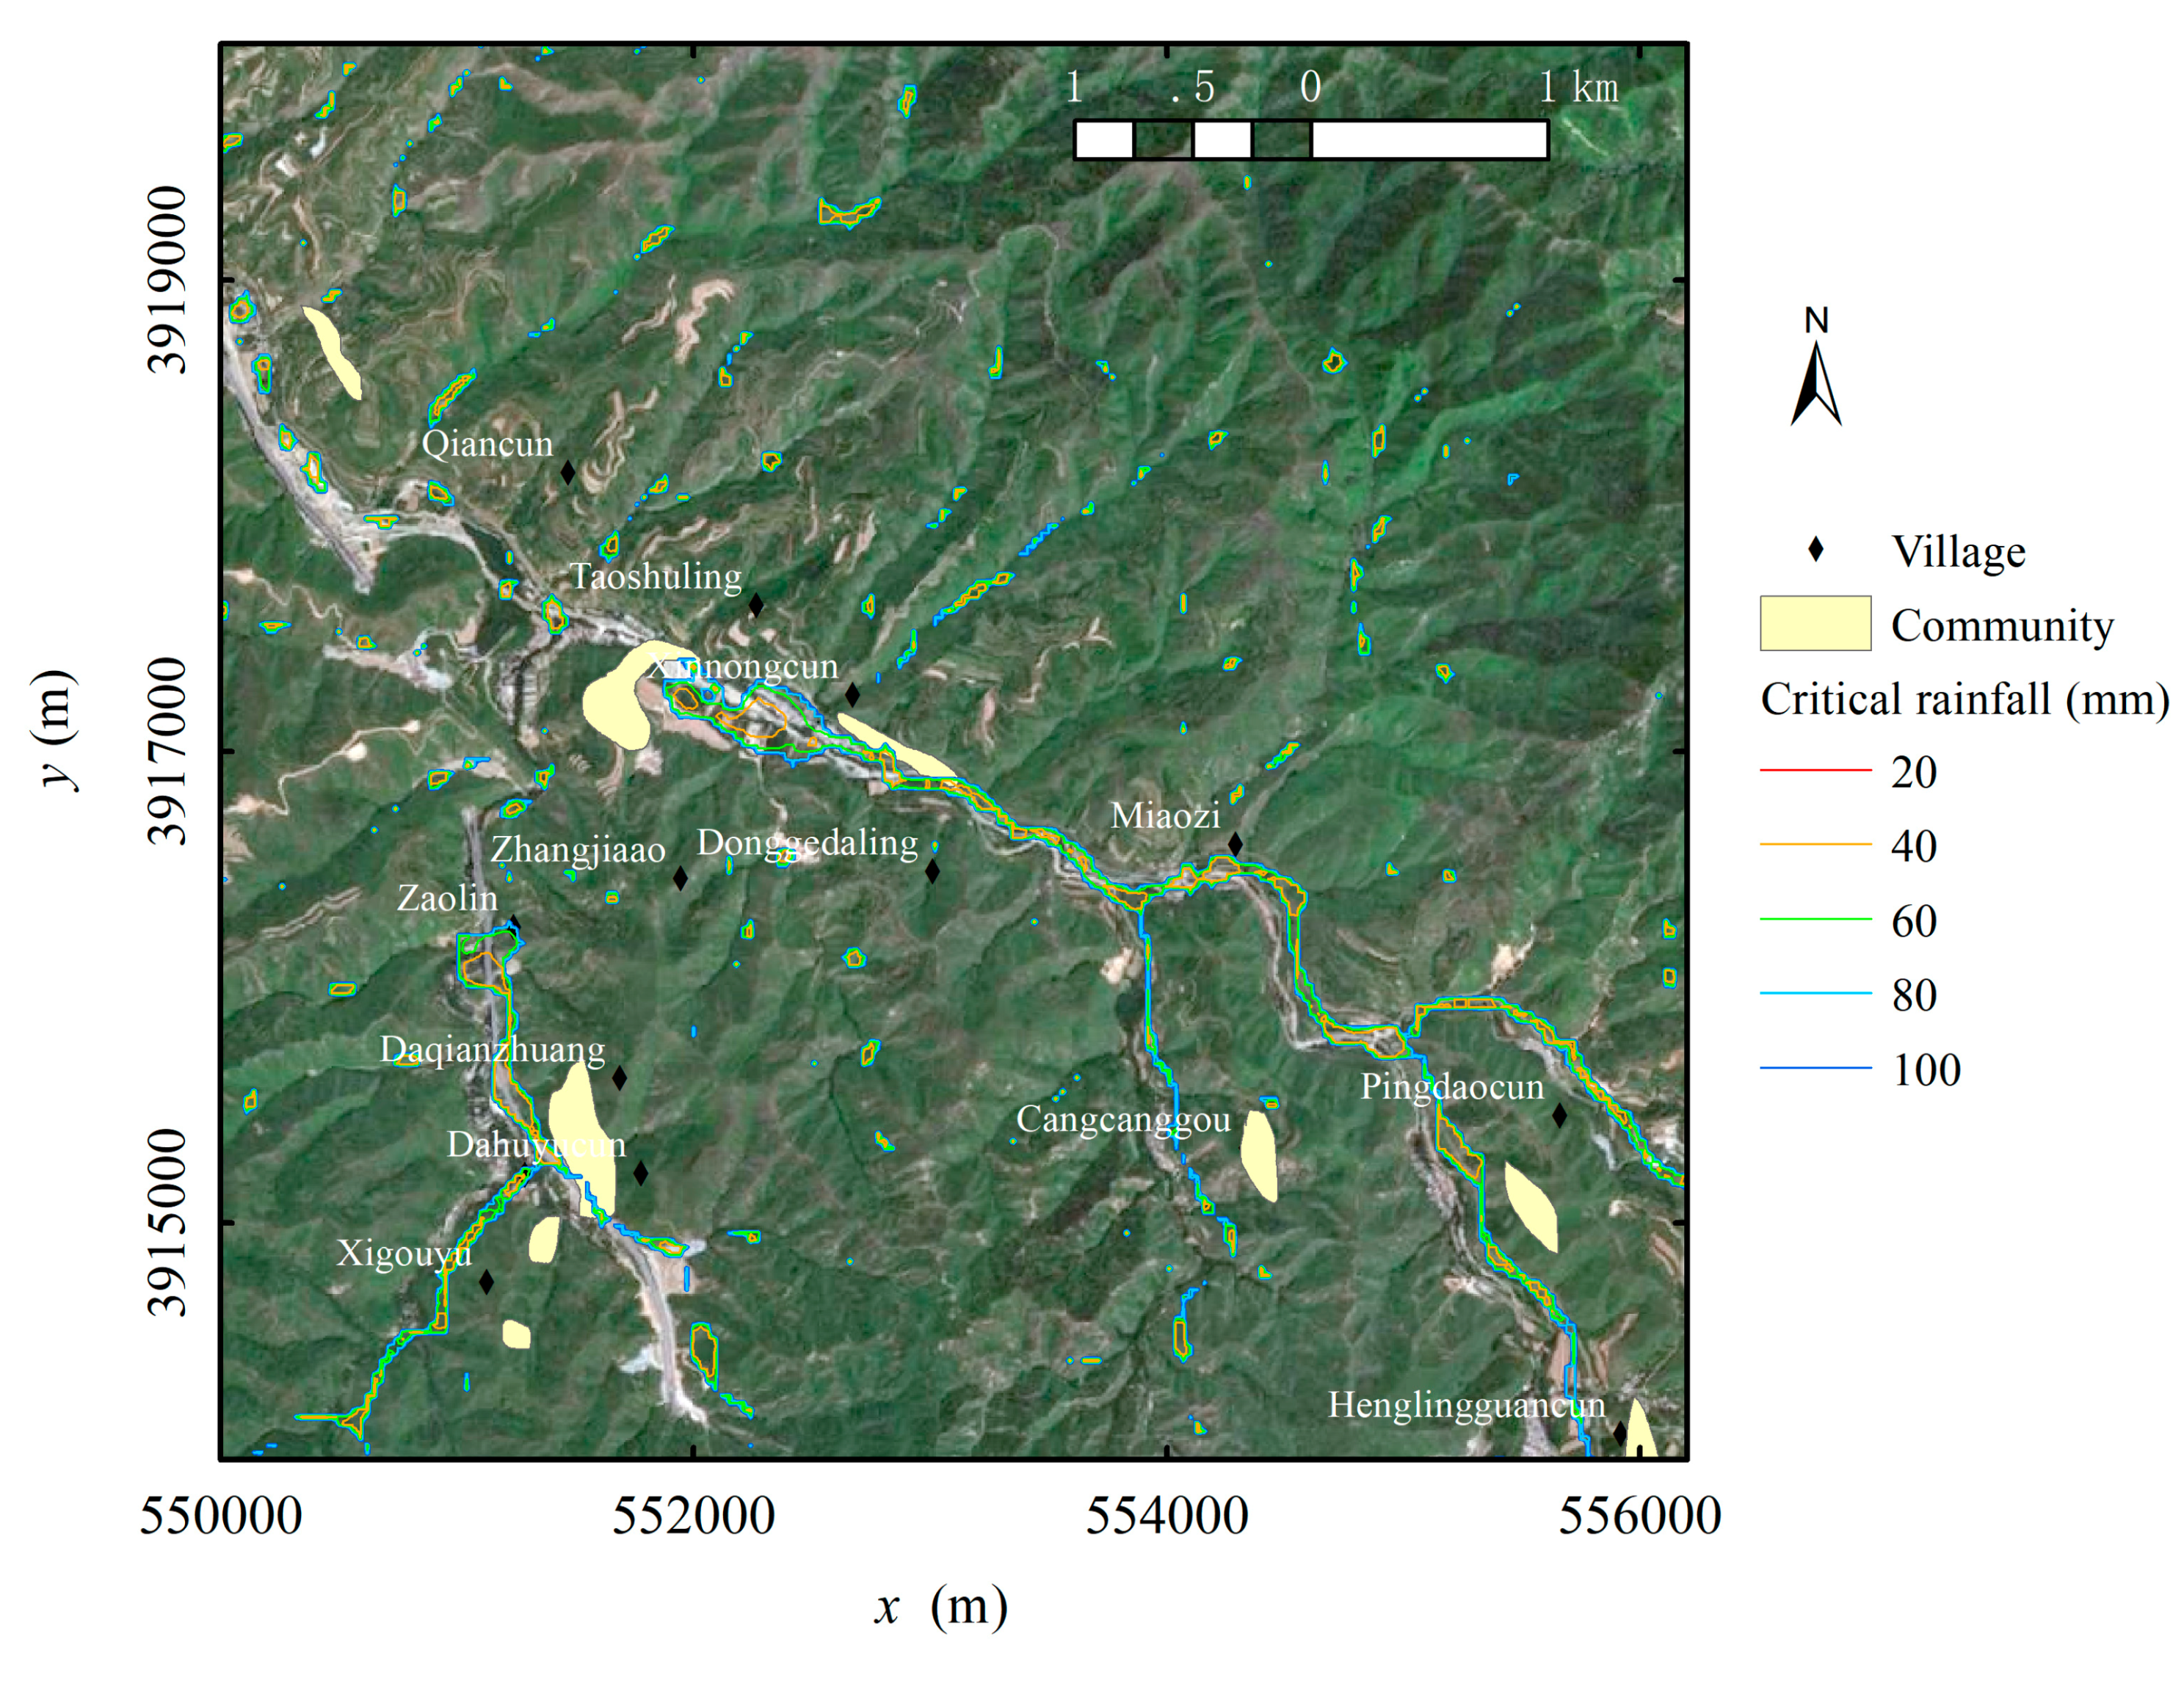
4.2.3. Impact of Antecedent Rainfall
For example, for the 3-h rainfall duration, the critical rainfall distributions for PE are shown under the initial dry, medium wet, and wet soil conditions in Figure 8, Figure 9 and Figure 10, respectively. The figures show that the critical rainfall is lower in relation to lower initial moisture, i.e., the critical rainfall for any cell ranges as follows: initial dry > medium wet > wet. For example, the critical rainfalls of the domain near Xingnongcun are 40 mm, 20 mm, and less than 20 mm for the initial dry, medium wet, and wet soil conditions, respectively.
4.3. Example of Flood Warning Operation
If a flash flood lasts for 3 h, its 5-day accumulated rainfall is 30 mm, and the forecasting rainfall process is presented in Table 3:
- (1)
- According to the rainfall forecast (Table 3), the rainfall duration can be determined to be 3 h.
- (2)
- As the flood season of the Lengkou catchment occurs in the growing season and the antecedent rainfall is 30 mm, the initial soil saturation is classified as dry (Table 2).
- (3)
- Choose the critical rainfall for the catchment in relation to a 3-h rainfall duration and initial dry soil conditions from the critical rainfall database.
- (4)
- Compute the accumulative rainfall at the warning moment, such as the last row of Table 3.
- (5)
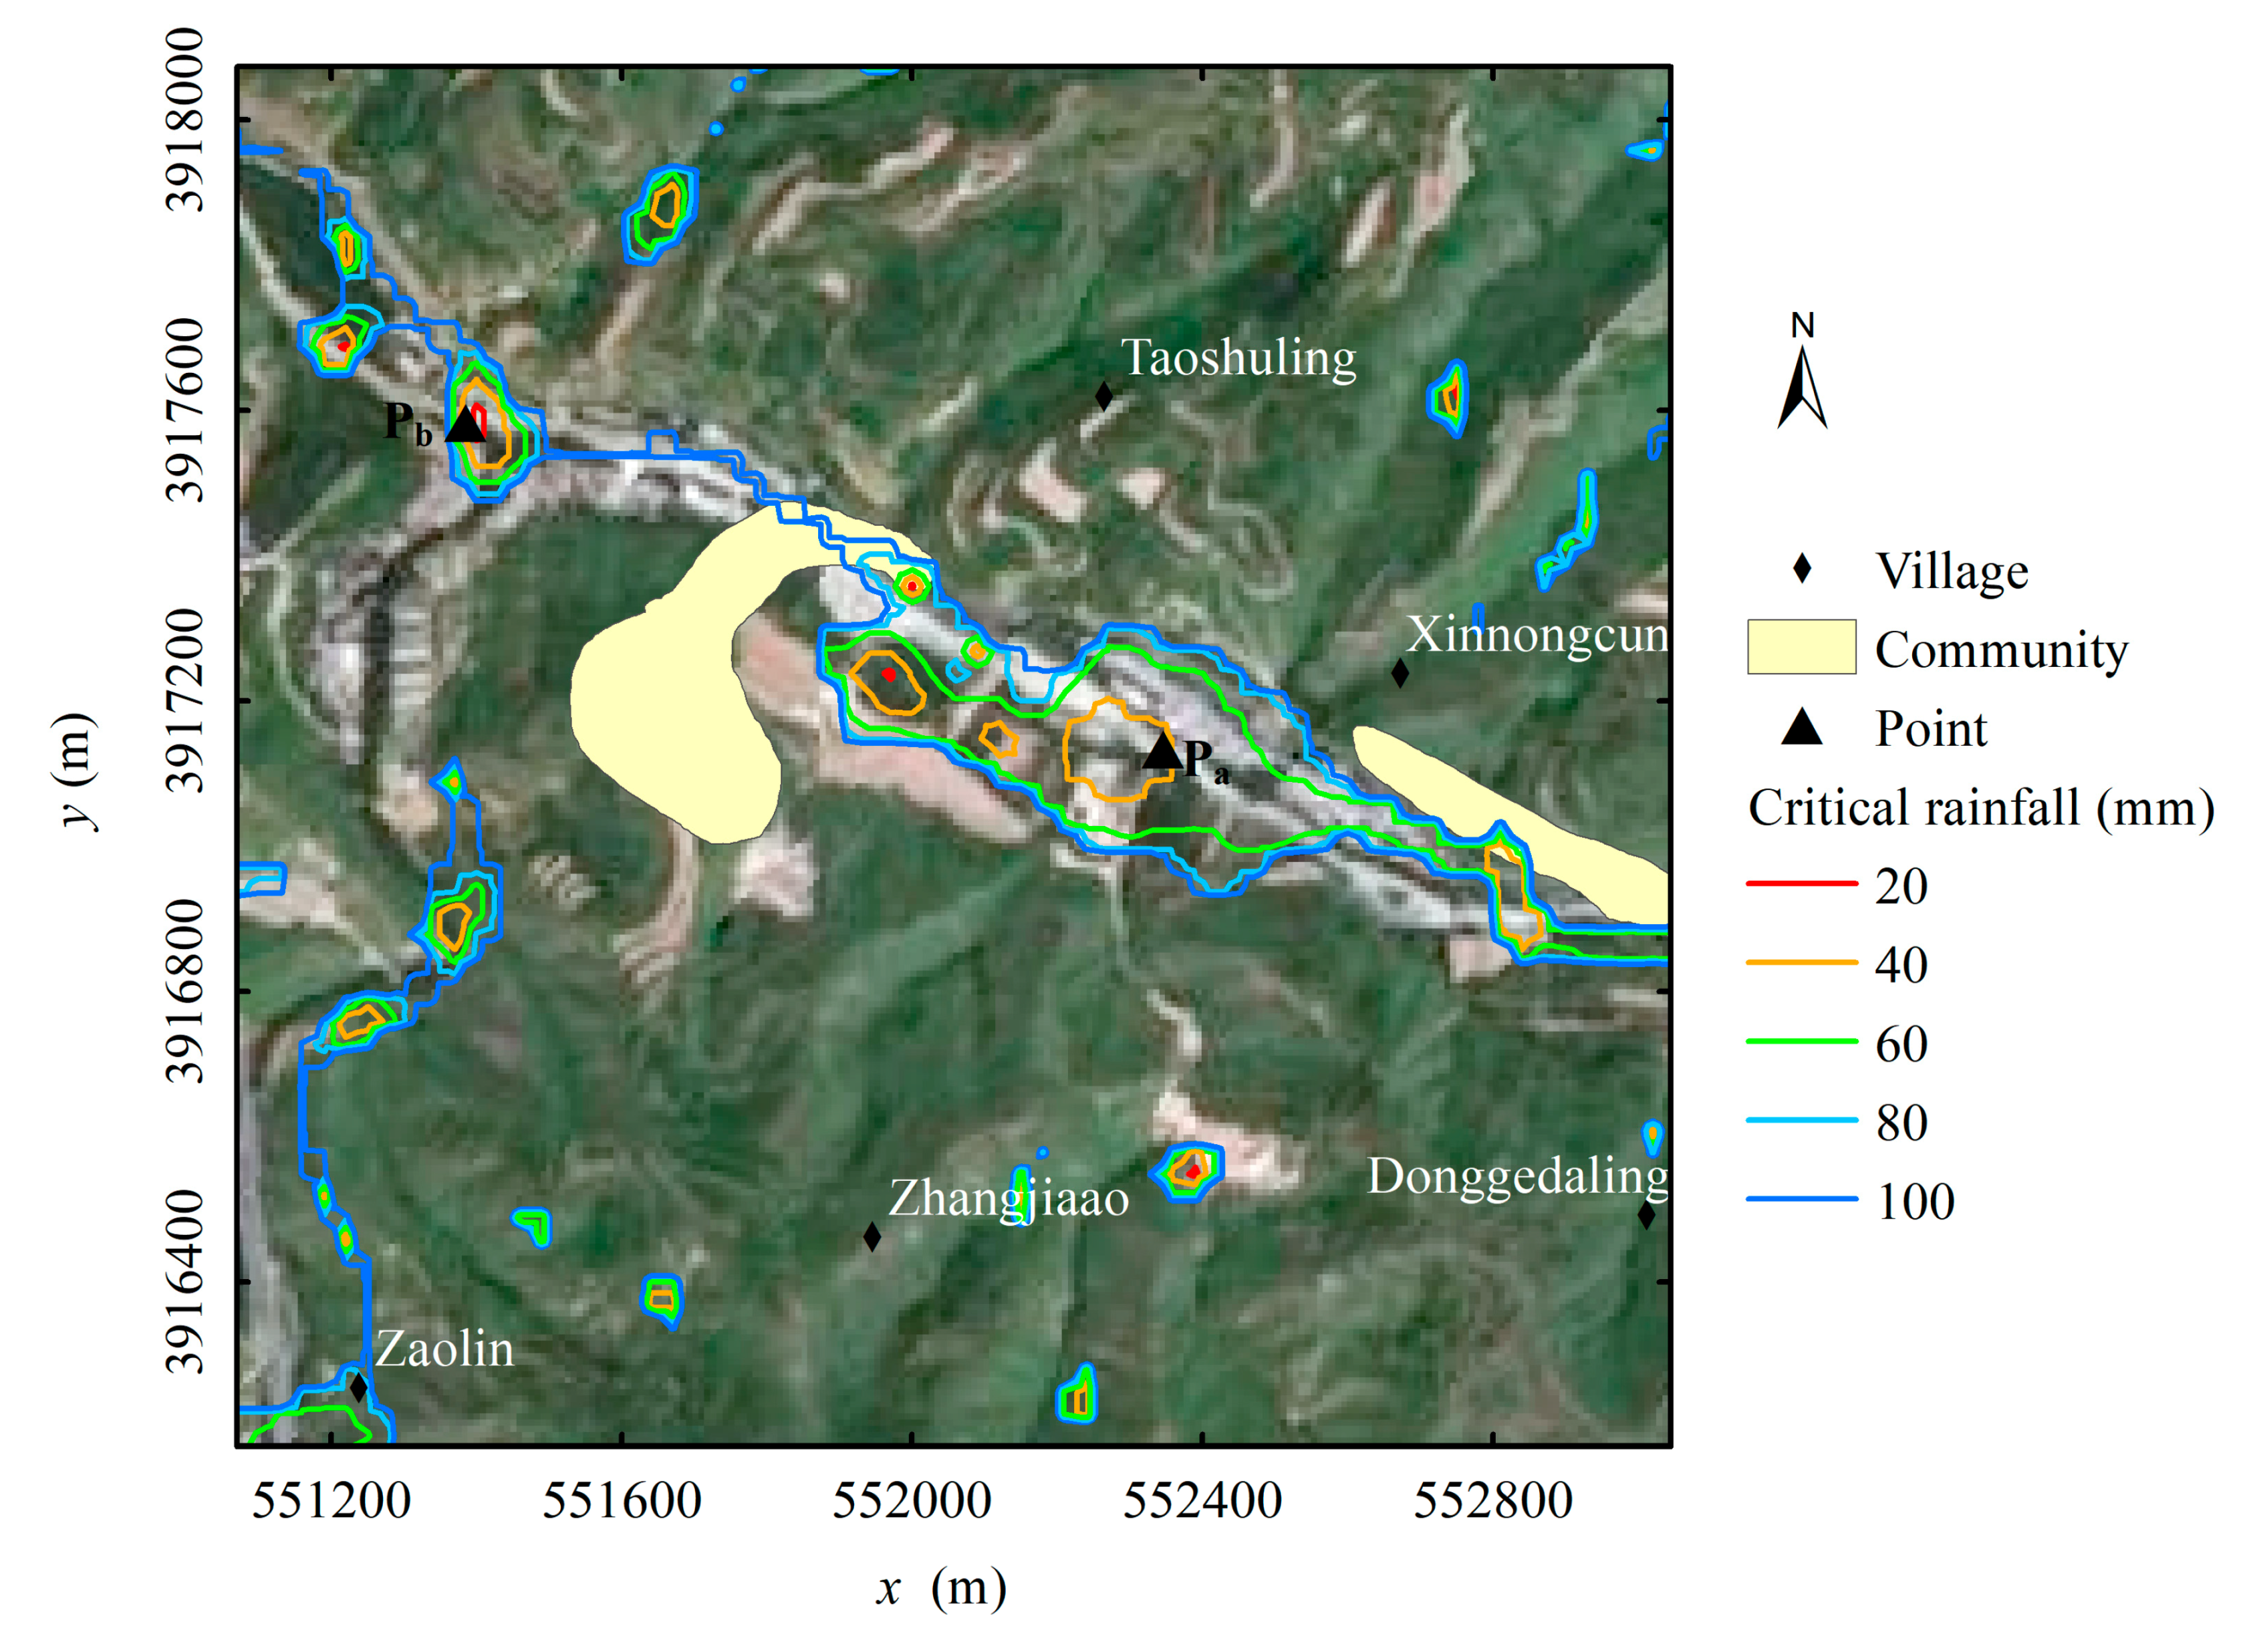
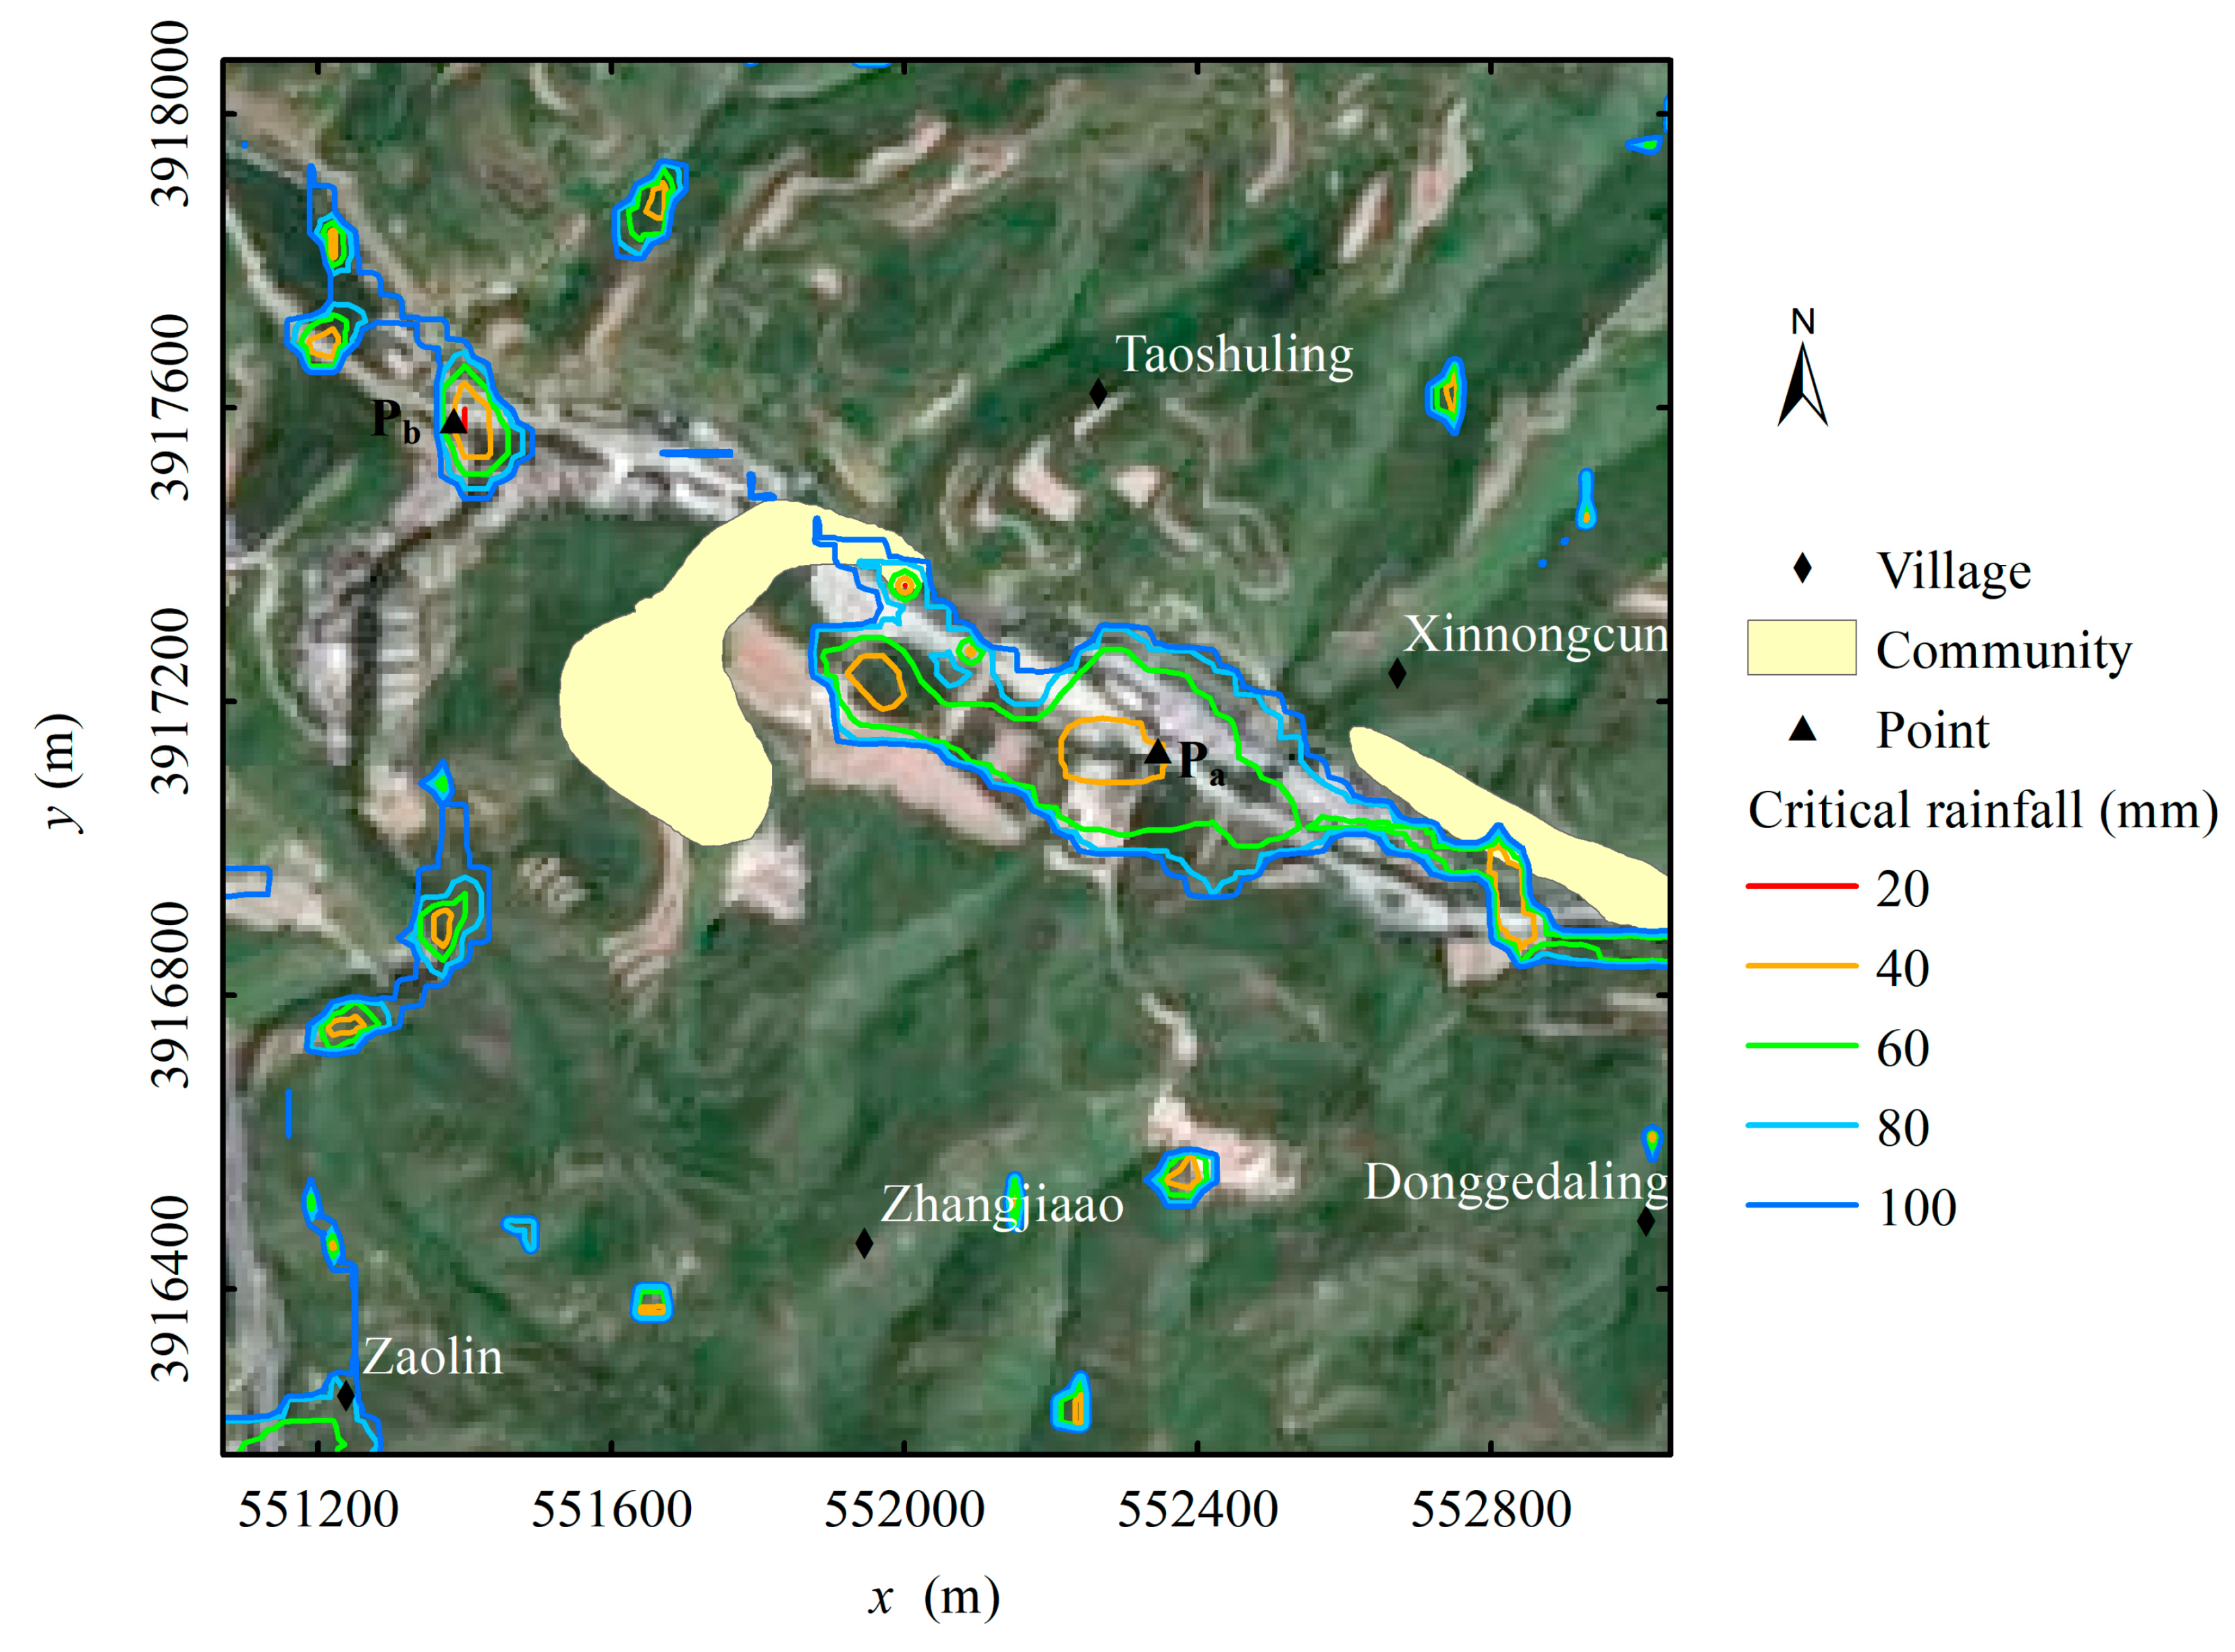
- Taking location Pa as an example, the critical rainfalls are 35 mm and 40 mm for PE and IE, respectively. At decision time = 1.0 h, the cumulative rainfall is 25 mm, and the rainfall forecasted for the next 30 min is 15 mm. Therefore, the cumulative rainfall at the warning time is 40 mm. If the rainfall intensity is assumed to be uniform during the next 30 min (i.e., from t = 1.0 to 1.5 h), the cumulative rainfall will reach 35 mm at t = 1.17 h (as shown in Figure 11). Thus, a PE warning will be sent to the people at Pa. The cumulative rainfall will reach 40 mm at = 1.5 h (as shown in Figure 12). Therefore, an IE warning should be sent to people at both locations Pa and Pb.
5. Conclusions
A new flash flood warning scheme was proposed based on the critical rainfall at any cell of a catchment calculated from hydrodynamic modelling results and a hazard index. In contrast to existing warning systems, there is no need to monitor discharge/water level at certain cross sections in the catchment to judge whether and when to trigger an alarm. Moreover, the velocity was considered in addition to the hazard index calculation, and this approach is more reasonable than using only the water depth. The impacts of rainfall duration, initial water soil content, and hazard index on critical rainfall were also demonstrated. The operational flowchart of the warning scheme was demonstrated using a flash flood event case study of the Lengkou catchment. To make the present system more predictable, the basic information (e.g., high resolution DEM) of a catchment should be collected to build a more precise database on critical rainfall. Furthermore, real-time hydrodynamic modelling of rainfall-runoff processes and the subsequent hazard calculations is possible as the development of computer technology and resources progress, especially for small, ungauged catchments.
Author Contributions
Conceptualization & Methodology, W.H. and Z.C.; Software, W.H.; Validation, W.H.; Writing-Original Draft Preparation, W.H. and Y.N.; Writing-Review & Editing, W.D. and W.Y.; Visualization, M.H.; Supervision, Z.C. and W.D.; Funding Acquisition, Z.C., W.H. and W.D.
Funding
This study was funded by the National Key Research and Development Program of China (Nos. 2018YFC1508002 and 2018YFC1508601) and the Natural Science Foundation of China (Grants Nos. 11502032 and 11432015).
Acknowledgments
The authors are indebted to Shanxi Provincial Department of Water Resources and Shanxi Hydrological Resources Survey Bureau for their support during the work.
Conflicts of Interest
The authors declare no conflict of interest.
References
- Kleinen, T.; Petschel-Held, G. Integrated assessment of changes in flooding probabilities due to climate change. Clim. Chang. 2007, 81, 283–312. [Google Scholar] [CrossRef]
- Beniston, M.; Stoffel, M.; Hill, M. Impacts of climatic change on water and natural hazards in the Alps: Can current water governance cope with future challenges? Examples from the European “ACQWA” project. Environ. Sci. Policy 2011, 14, 734–743. [Google Scholar] [CrossRef]
- Liu, C.J.; Guo, L.; Ye, L.; Zhang, S.F.; Zhao, Y.Z.; Song, T.Y. A review of advances in China’s flash flood early-warning system. Nat. Hazards 2018, 92, 619–634. [Google Scholar] [CrossRef]
- Golian, S.; Saghafian, B.; Maknoon, R. Derivation of Probabilistic Thresholds of Spatially Distributed Rainfall for Flood Forecasting. Water Resour. Manag. 2010, 24, 3547–3559. [Google Scholar] [CrossRef]
- Martina, M.L.V.; Todini, E.; Libralon, A. Hydrological Modelling and the Water Cycle; Sorooshian, S., Hsu, K.-L., Coppola, E., Tomassetti, B., Verdecchia, M., Visconti, G., Eds.; Springer: Berlin/Heidelberg, Germany, 2008; pp. 203–227. [Google Scholar]
- Montesarchio, V.; Lombardo, F.; Napolitano, F. Rainfall thresholds and flood warning: An operative case study. Nat. Hazards Earth Syst. Sci. 2009, 9, 135–144. [Google Scholar] [CrossRef]
- Ma, M.H.; Zhang, J.N.; Su, H.D.; Wang, D.C.; Wang, Z.L. Update of Early Warning Indicators of Flash Floods: A Case Study of Hunjiang District, Northeastern China. Water 2019, 11, 314. [Google Scholar] [CrossRef]
- Cao, Z.; Wang, X.; Zhang, S.; Pender, G. Hydrodynamic modelling in support of flash flood warning. Proc. ICE Water Manag. 2010, 163, 327–340. [Google Scholar] [CrossRef]
- Defra and Environment Agency (DEA). Flood and Coastal Defence R&D Programme, R&D Outputs: Flood Risks to People. (Phase 2 Project Record, FD2321/PR); DEA: London, UK, 2006.
- Bracken, L.J.; Cox, N.J.; Shannon, J. The relationship between rainfall inputs and flood generation in south-east Spain. Hydrol. Process. 2008, 22, 683–696. [Google Scholar] [CrossRef]
- Norbiato, D.; Borga, M.; Degli Esposti, S.; Gaume, E.; Anquetin, S. Flash flood warning based on rainfall thresholds and soil moisture conditions: An assessment for gauged and ungauged basins. J. Hydrol. 2008, 362, 274–290. [Google Scholar] [CrossRef]
- Martina, M.L.V.; Todini, E.; Libralon, A. A Bayesian decision approach to rainfall thresholds based flood warning. Hydrol. Earth Syst. Sci. 2006, 10, 413–426. [Google Scholar] [CrossRef] [Green Version]
- Amadio, P.; Mancini, M.; Menduni, G.; Rabuffetti, D.; Ravazzani, G. A real time flood forecasting system based on rainfall thresholds working on the Arno watershed: Definition and reliability analysis. In Proceedings of the 5th EGS Plinius Conference, Corsica, France, 1–3 October 2003. [Google Scholar]
- Hapuarachchi, H.A.P.; Wang, Q.J.; Pagano, T.C. A review of advances in flash flood forecasting. Hydrol. Process. 2011, 25, 2771–2784. [Google Scholar] [CrossRef]
- Carpenter, T.; Sperfslage, J.; Georgakakos, K.; Sweeney, T.; Fread, D. National threshold runoff estimation utilizing GIS in support of operational flash flood warning systems. J. Hydrol. 1999, 224, 21–44. [Google Scholar] [CrossRef]
- Hunter, N.M.; Bates, P.D.; Horritt, M.S.; Wilson, M.D. Simple spatially-distributed models for predicting flood inundation: A review. Geomorphology 2007, 90, 208–225. [Google Scholar] [CrossRef]
- Reed, S.; Schaake, J.; Zhang, Z. A distributed hydrologic model and threshold frequency-based method for flash flood forecasting at ungauged locations. J. Hydrol. 2007, 337, 402–420. [Google Scholar] [CrossRef]
- Javelle, P.; Fouchier, C.; Arnaud, P.; Lavabre, J. Flash flood warning at ungauged locations using radar rainfall and antecedent soil moisture estimations. J. Hydrol. 2010, 394, 267–274. [Google Scholar] [CrossRef]
- Cools, J.; Vanderkimpen, P.; El Afandi, G.; Abdelkhalek, A.; Fockedey, S.; El Sammany, M.; Abdallah, G.; El Bihery, M.; Bauwens, W.; Huygens, M. An early warning system for flash floods in hyper-arid Egypt. Nat. Hazards Earth Syst. Sci. 2012, 12, 443–457. [Google Scholar] [CrossRef]
- Biondi, D.; De Luca, D.L. Performance assessment of a Bayesian Forecasting System (BFS) for real-time flood forecasting. J. Hydrol. 2013, 479, 51–63. [Google Scholar] [CrossRef]
- Woolhiser, D.A.; Liggett, J.A. Unsteady, one-dimensional flow over a plane--the rising hydrograph. Water Resour. Res. 1967, 3, 753–771. [Google Scholar] [CrossRef]
- Liu, Q.Q.; Singh, V.P. Effect of microtopography, slope length and gradient, and vegetative cover on overland flow through simulation. J. Hydrol. Eng. 2004, 9, 375–382. [Google Scholar] [CrossRef]
- Ogden, F.L.; Julien, P.Y. Runoff sensitivity to temporal and spatial rainfall variability at runoff plane and small basin scales. Water Resour. Res. 1993, 29, 2589–2597. [Google Scholar] [CrossRef]
- Philipp, A.; Grundmann, J. Integrated modeling system for flash flood routing in ephemeral rivers under the influence of groundwater recharge dams. J. Hydraul. Eng. 2013, 139, 1234–1246. [Google Scholar] [CrossRef]
- Warnock, A.; Kim, J.; Ivanov, V.; Katopodes, N.D. Self-Adaptive Kinematic-Dynamic Model for Overland Flow. J. Hydraul. Eng. 2014, 140, 169–181. [Google Scholar] [CrossRef]
- Cea, L.; Garrido, M.; Puertas, J.; Suarez, J. Overland flow computations in urban and industrial catchments from direct precipitation data using a two-dimensional shallow water model. Water Sci. Technol. 2010, 62, 1998–2008. [Google Scholar] [CrossRef] [PubMed]
- Kim, J.; Warnock, A.; Ivanov, V.Y.; Katopodes, N.D. Coupled modeling of hydrologic and hydrodynamic processes including overland and channel flow. Adv. Water Resour. 2012, 37, 104–126. [Google Scholar] [CrossRef]
- Rousseau, M.; Cerdan, O.; Delestre, O.; Dupros, F.; James, F.; Cordier, S. Overland Flow Modelling with the Shallow Water Equation using a Well Balanced Numerical Scheme: Adding Efficiency or just More Complexity? 2012. Available online: https://hal.archives-ouvertes.fr/hal-00664535/ (accessed on 12 May 2019).
- Berardi, L.; Laucelli, D.; Simeone, V.; Giustolisi, O. Simulating floods in ephemeral streams in Southern Italy by full-2D hydraulic models. Int. J. River Basin Manag. 2013, 11, 1–17. [Google Scholar] [CrossRef]
- Costabile, P.; Costanzo, C.; Macchione, F. A storm event watershed model for surface runoff based on 2D fully dynamic wave equations. Hydrol. Process. 2013, 27, 554–569. [Google Scholar] [CrossRef]
- Pan, J.J.; Cao, Z.X.; Wang, X.K.; Cao, S.Y. Comparative study of simplified and full hydrodynamic models for flash floods. J. Sichuan Univ. (Eng. Sci. Ed.) 2012, 44, 1–6. (In Chinese) [Google Scholar]
- Oreskes, N.; Shrader-Frechette, K.; Belitz, K. Verification, validation, and confirmation of numerical models in the earth sciences. Science 1994, 263, 641–646. [Google Scholar] [CrossRef]
- Huang, W.; Cao, Z.X.; Qi, W.J.; Pender, G.; Zhao, K. Full 2D hydrodynamic modelling of rainfall-induced flash floods. J. Mt. Sci. 2015, 12, 1203–1218. [Google Scholar] [CrossRef]
- Green, W.H.; Ampt, G. Studies on soil physics, part 1: The flow of air and water through soils. J. Agric. Sci. 1911, 4, 1–24. [Google Scholar]
- Toro, E. Shock-Capturing Methods for Free-Surface Shallow Flows; John Wiley: London, UK, 2001. [Google Scholar]
- Iwagaki, Y. Fundamental Studies on the Runoff by Characteristics; Bulletins—Disaster Prevention Research Institute, Kyoto University: Kyoto, Japan, 1955; Volume 10, pp. 1–25. [Google Scholar]
- De Lima, J.L.M.P. Model KININF for overland flow on pervious surfaces. In Overland Flow: Hydraulics and Erosion Mechanics; Parson, T., Abrahams, A., Eds.; UCL Press: London, UK, 1992; pp. 69–88. [Google Scholar]
- Xia, J.; Falconer, R.A.; Lin, B.; Tan, G. Numerical assessment of flood hazard risk to people and vehicles in flash floods. Environ. Model. Softw. 2011, 26, 987–998. [Google Scholar] [CrossRef]
- Fowler, A.M.; Hennessy, K.J. Potential impacts of global warming on the frequency and magnitude of heavy precipitation. Nat. Hazards 1995, 11, 283–303. [Google Scholar] [CrossRef]
- Cannon, S.H.; Gartner, J.E.; Wilson, R.C.; Bowers, J.C.; Laber, J.L. Storm rainfall conditions for floods and debris flows from recently burned areas in southwestern Colorado and southern California. Geomorphology 2008, 96, 250–269. [Google Scholar] [CrossRef]
- Zhai, X.; Guo, L.; Liu, R.; Zhang, Y. Rainfall threshold determination for flash flood warning in mountainous catchments with consideration of antecedent soil moisture and rainfall pattern. Nat. Hazards 2018, 94, 605–625. [Google Scholar] [CrossRef]
- NWS Manual 10-950. 2002. Available online: http://www.nws.noaa.gov/directives/010/pd01009050a.pdf (accessed on 12 May 2019).
- NWS Manual 10-950. 2017. Available online: https://www.nws.noaa.gov/directives/sym/pd01009050curr.pdf (accessed on 12 May 2019).
- DWRSP (Department of Water Resources of Shanxi Province). Handbook of Hydrological Calculation of Shanxi Province; Yellow River Conservancy Press: Zhengzhou, China, 2010. (In Chinese) [Google Scholar]
- SCS. National Engineering Handbook, Section 4: Hydrology; US Government Printing Office: Washington, DC, USA, 1972.
Figure 1.
Sketch of flood warning operation procedure.

Figure 2.
Graph of the Lengkou catchment. (a) Location in Shanxi Province, (b) digital elevation model (DEM), and (c) topography with villages.
Figure 2.
Graph of the Lengkou catchment. (a) Location in Shanxi Province, (b) digital elevation model (DEM), and (c) topography with villages.


Figure 3.
Distribution of critical rainfall of “Preparing Evacuation” (PE) for the case of initial dry soil condition (for the 1-h rainfall duration).
Figure 3.
Distribution of critical rainfall of “Preparing Evacuation” (PE) for the case of initial dry soil condition (for the 1-h rainfall duration).

Figure 4.
Distribution of critical rainfall of “immediate evacuation” (IE) for the case of initial dry soil condition (for the 1-h rainfall duration).
Figure 4.
Distribution of critical rainfall of “immediate evacuation” (IE) for the case of initial dry soil condition (for the 1-h rainfall duration).

Figure 5.
Critical rainfall distribution for “immediate evacuation” (IE) under initial wet soil conditions (for the 1-h rainfall duration).
Figure 5.
Critical rainfall distribution for “immediate evacuation” (IE) under initial wet soil conditions (for the 1-h rainfall duration).

Figure 6.
Critical rainfall distribution for “immediate evacuation” (IE) under initial wet soil conditions (for the 3-h rainfall duration).
Figure 6.
Critical rainfall distribution for “immediate evacuation” (IE) under initial wet soil conditions (for the 3-h rainfall duration).

Figure 7.
Critical rainfall distribution for “immediate evacuation” (IE) under initial wet soil conditions (for the 6-h rainfall duration).
Figure 7.
Critical rainfall distribution for “immediate evacuation” (IE) under initial wet soil conditions (for the 6-h rainfall duration).

Figure 8.
Critical rainfall distribution for “preparing evacuation” (PE) under initial dry soil conditions (for the 3-h rainfall duration).
Figure 8.
Critical rainfall distribution for “preparing evacuation” (PE) under initial dry soil conditions (for the 3-h rainfall duration).

Figure 9.
Critical rainfall distribution for “preparing evacuation” (PE) under initial medium wet soil conditions (for the 3-h rainfall duration).
Figure 9.
Critical rainfall distribution for “preparing evacuation” (PE) under initial medium wet soil conditions (for the 3-h rainfall duration).

Figure 10.
Critical rainfall distribution for “preparing evacuation” (PE) under initial wet soil conditions (for the 3-h rainfall duration).
Figure 10.
Critical rainfall distribution for “preparing evacuation” (PE) under initial wet soil conditions (for the 3-h rainfall duration).

Figure 11.
Critical rainfall distribution for “preparing evacuation” (PE) under initial dry soil conditions (zoomed in from Figure 8).
Figure 11.
Critical rainfall distribution for “preparing evacuation” (PE) under initial dry soil conditions (zoomed in from Figure 8).

Figure 12.
Critical rainfall distribution for “immediate evacuation” (IE) under initial dry soil conditions (for the 3-h rainfall duration).
Figure 12.
Critical rainfall distribution for “immediate evacuation” (IE) under initial dry soil conditions (for the 3-h rainfall duration).


Table 1.
Summary of hydrodynamic modelling scenarios.
| Rainfall Duration (h) | Total Rainfall (mm) | Modelling Duration (h) | Number of Scenarios | Notes |
|---|---|---|---|---|
| 1 | 10, 20, 30, 40, 50, 60, 70, 80 | 3 | 8 | Initial soil moistures are dry, medium, and saturated. |
| 3 | 10, 25, 40, 55, 70, 85, 100 | 6 | 7 | |
| 6 | 10, 30, 50, 70, 90, 110, 130, 150, 170 | 12 | 9 |
Table 2.
Antecedent soil moisture classes according to the 5-day accumulated rainfall [45].
Table 2.
Antecedent soil moisture classes according to the 5-day accumulated rainfall [45].
| Antecedent Moisture Classes (AMC) | Total 5-day Antecedent Accumulated Rainfall (mm) | Ratio | |
|---|---|---|---|
| Dormant Season | Growing Season | ||
| Dry | <12.7 | <35.5 | 1.0/3.0 |
| Medium | 12.7~28.0 | 35.5~53.3 | 2.0/3.0 |
| Saturated | >28 | >53.3 | 1.0 |
Table 3.
Information about the rainfall process.
| Time | |||||||
|---|---|---|---|---|---|---|---|
| (h) | 0 | 0.5 | 1.0 | 1.5 | 2.0 | 2.5 | 3.0 |
| (h) | 0.5 | 1.0 | 1.5 | 2.0 | 2.5 | 3.0 | 3.5 |
| ) | 10 | 10 | 15 | 10 | 15 | 5 | 0 |
| ) | 0 | 15 | 10 | 10 | 15 | 8 | 2 |
| (mm) | 0 | 15 | 25 | 35 | 50 | 58 | 60 |
| Cumulative rainfall at warning time: | 10 | 25 | 40 | 45 | 65 | 63 | 60 |
© 2019 by the authors. Licensee MDPI, Basel, Switzerland. This article is an open access article distributed under the terms and conditions of the Creative Commons Attribution (CC BY) license (http://creativecommons.org/licenses/by/4.0/).
Share and Cite
MDPI and ACS Style
Huang, W.; Cao, Z.; Huang, M.; Duan, W.; Ni, Y.; Yang, W. A New Flash Flood Warning Scheme Based on Hydrodynamic Modelling. Water 2019, 11, 1221. https://doi.org/10.3390/w11061221
AMA Style
Huang W, Cao Z, Huang M, Duan W, Ni Y, Yang W. A New Flash Flood Warning Scheme Based on Hydrodynamic Modelling. Water. 2019; 11(6):1221. https://doi.org/10.3390/w11061221
Chicago/Turabian StyleHuang, Wei, Zhixian Cao, Minghai Huang, Wengang Duan, Yufang Ni, and Wenjun Yang. 2019. "A New Flash Flood Warning Scheme Based on Hydrodynamic Modelling" Water 11, no. 6: 1221. https://doi.org/10.3390/w11061221
Note that from the first issue of 2016, this journal uses article numbers instead of page numbers. See further details here.