Groundwater Recharge Decrease Replacing Pasture by Eucalyptus Plantation
by
 , , and
Tiago Souza Mattos
1,2 ,
,
Paulo Tarso Sanches de Oliveira
1,2,
Murilo Cesar Lucas
1,3,* and
Edson Wendland
1 1
Department of Hydraulics and Sanitary Engineering, University of São Paulo, São Carlos, SP 13566-590, Brazil
2
Faculty of Engineering, Architecture and Urbanism and Geography, Federal University of Mato Grosso do Sul, Campo Grande, MS 79070-900, Brazil
3
Department of Civil Engineering, Federal University of Technology–Paraná, Pato Branco, PR 85502-970, Brazil
*
Author to whom correspondence should be addressed.
Water 2019, 11(6), 1213; https://doi.org/10.3390/w11061213
Submission received: 15 May 2019
/
Revised: 2 June 2019
/
Accepted: 4 June 2019
/
Published: 10 June 2019
(This article belongs to the Special Issue Hydrological Impacts of Climate Change and Land Use/Land Cover Change)
Abstract
:An important unsolved question in hydrology science is the consequence of the Eucalyptus afforestation on groundwater recharge. Here, we assessed recharge estimates before and after converting pasture cover to Eucalyptus plantation. Groundwater levels, recharge, rainfall (P) and actual evapotranspiration (ET) were evaluated from 2004 through 2016 over an outcrop area of the Guarani Aquifer System (GAS) in the southeastern Brazil. Recharge was estimated using the water-table fluctuation method. We observed a decrease of 100 mm/year in groundwater levels after land use changed from pasture to Eucalyptus. The average recharge decreased from 407 mm/year (27% of mean P) to 194 mm/year (13% of mean P) after land use change over the study area. We found a recharge decrease of 19% in 2012 and 58% in 2013 under similar annual rainfall in comparison with the long-term mean recharge (from 2004 to 2016). Our results indicated that the high values of ET observed in Eucalyptus plantation decreases water availability for recharge. Therefore, our findings are important to agencies for decision-making in water resources regarding the management of land cover and land use.
1. Introduction
The impact of land cover and land use changes (LCLUC) on groundwater recharge has been a hot topic in hydrologic science over the past decade [1,2,3,4] due to human dependence on groundwater as a primary water source [5]. Recharge rates have been used to estimate sustainable groundwater abstraction [6] and, consequently, to avoid groundwater depletion. Since recharge estimating is a difficult task, the use of several methods is recommended [7], such as water table fluctuation [8], chloride mass balance [4,9] and water budget [10]. In this context, understanding the effect of LCLUC on recharge is paramount [10,11] to ensure a positive balance between groundwater availability and increasing demands in the near future.
The increase in planted tree forest areas has been one of the most significant global land use changes. The Earth area covered by forest plantations increased from 167.5 to 277.9 million hectares (mha) between 1990 and 2015 [12]. Brazil, Argentina, and Chile comprise the largest areas of forest plantations in South America [13]. Currently, Brazil has about 7.8 million hectares of planted forests, mainly Eucalyptus (5.7 mha) and Pinus (1.6 mha) [14].
Previous studies assessed the impacts of planted tree forests, mainly Eucalyptus and Pinus on hydrological processes, such as groundwater recharge. For example, Eucalyptus plantations have significantly decreased recharge rates [15,16,17,18] and also river discharge [19,20,21]. Vegetation rooting depth is the major factor that causes recharge variation in terms of LCLUC [22]. Deep-rooted tree vegetation reduced recharge rates in comparison with shallow-rooted vegetation (grasses and crops) in the Brazilian woodland savanna (Cerrado) [23].
Recently, recharge estimated at sparse grassland in Australian sites (49–56% of annual rainfall) have shown values greater than that of pine planted forests (31–49% of annual rainfall) [17]. The conversion of forests (woodland, Eucalyptus plantation and bushland) to other land uses (perennial and annual crops) resulted in an increased recharge [22]. Studies demonstrated that a 7-year average recharge was less significant for Eucalyptus forests (135 mm/year) than grassland areas (401 mm/year) in southeastern Brazil [24]. In the past, studies showed that recharge increased by two orders of magnitude after clearing Eucalyptus forests and replacing them by crop plantations and pasture in Australia [25].
On the other hand, some studies have reported that forest plantations increase recharge by the improvement water infiltration into the soil and increased soil moisture, and deep drainage [26,27]. In addition, similar annual recharge rates were noted for pasture and Eucalyptus plantation [28]. Moreover, it is becoming more frequently observed in data and/or the theoretical suggestions that Eucalyptus water use depends on climatic conditions, soil types and plantations density [28,29].
Despite the previous scientific studies, there is still a gap regarding the actual effect of replacing pasture to planted Eucalyptus forest on recharge rates using data measured at the field scale. To date, no general conclusion can be made about the hydrological impacts of Eucalyptus [30]. Thus, the objective of this study is to quantify the changes on recharge rates after the land use change from pasture to the Eucalyptus forest.
2. Materials and Methods
2.1. Study Area
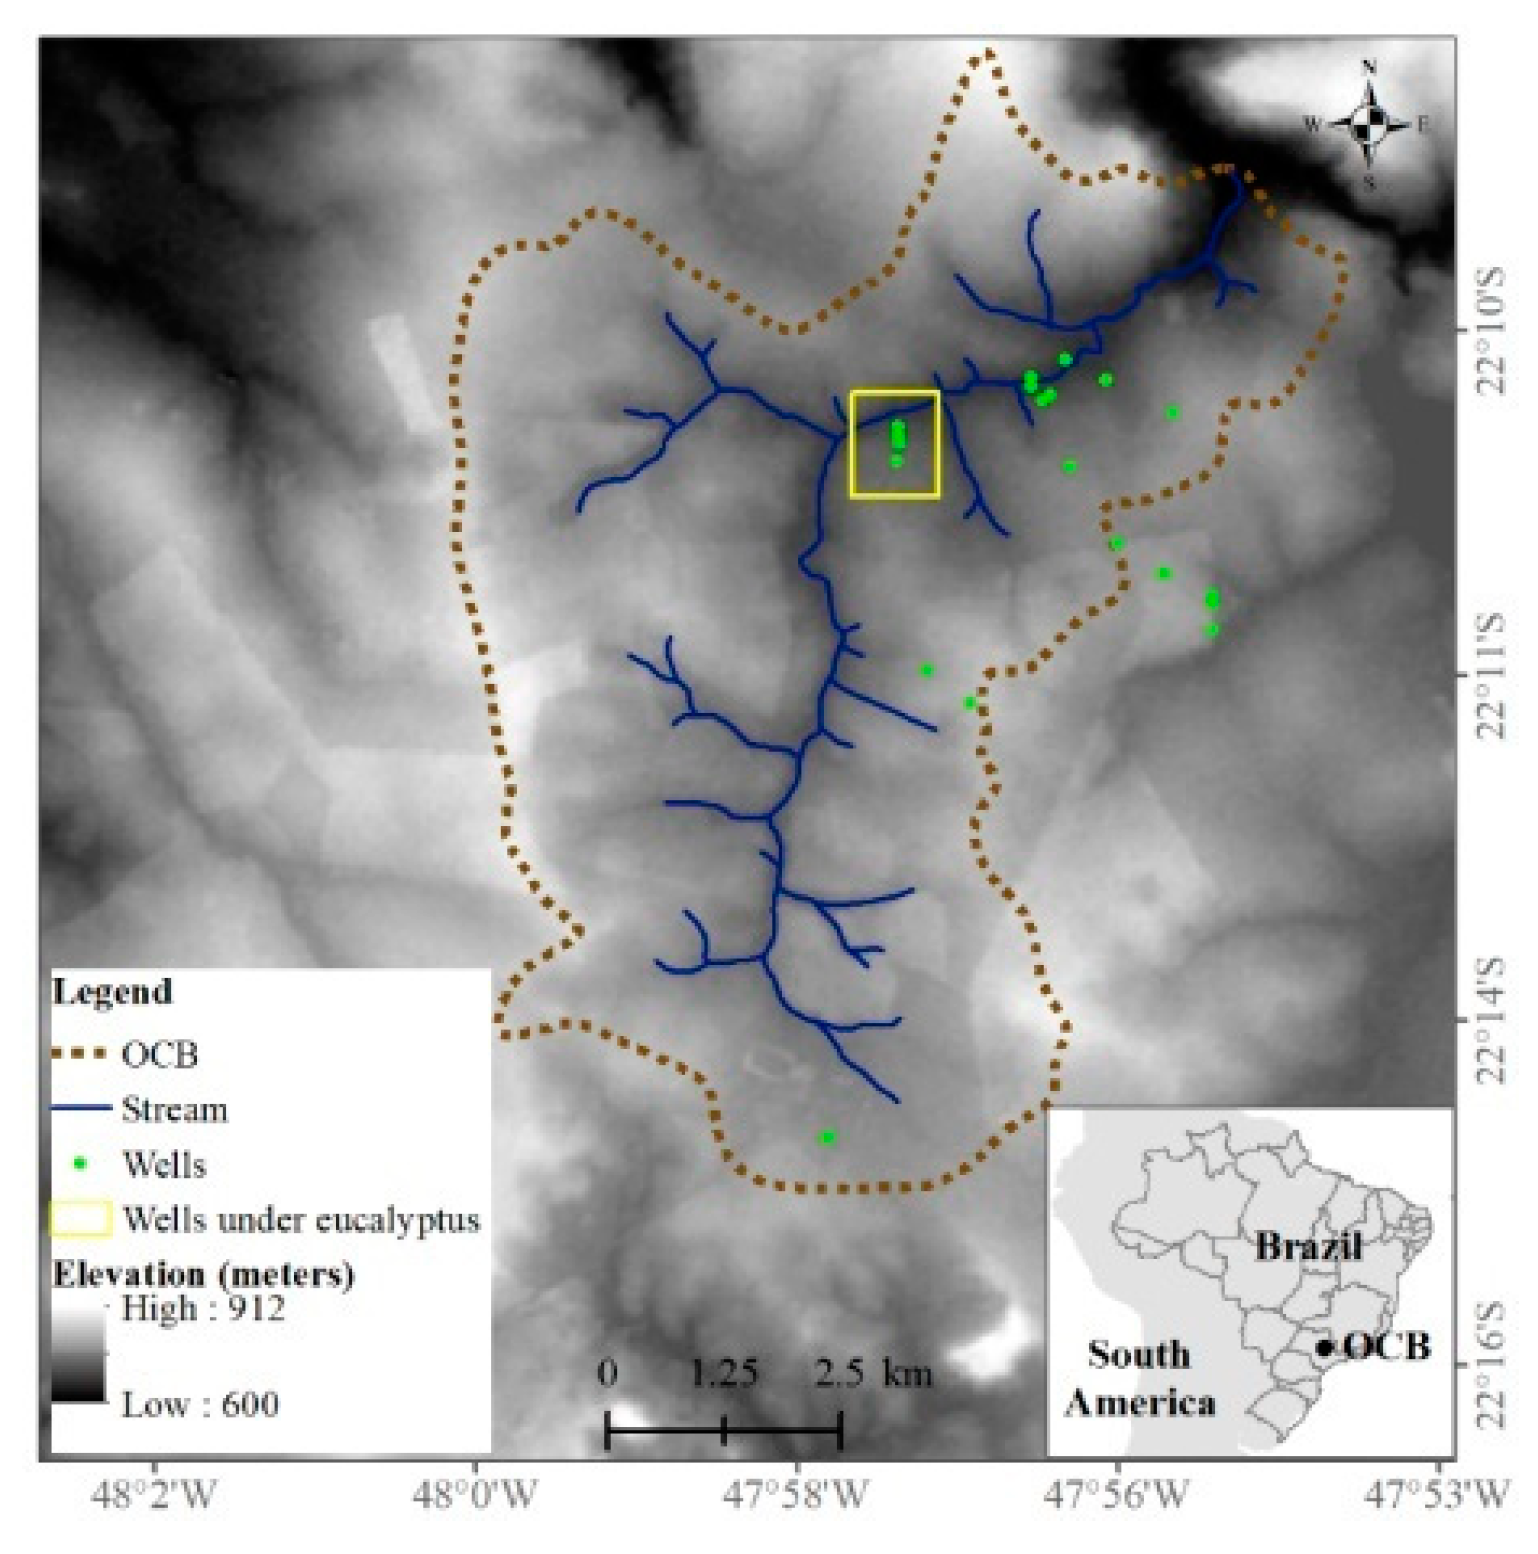
The study area is the Onça Creek Basin (OCB), which is located in the municipality of Brotas, São Paulo State, Brazil, between the meridians 47°55’ and 48°00’ west longitude and the parallels 22°10’ and 22°15’ south latitude. The OCB has an approximate area of 6500 ha (65 km2) and is located in the Cerrado Biome. The area is currently occupied by Eucalyptus (36%), citrus (23%), sugarcane (10%), riparian zone (10%), pasture (6%) and bare soil (8%). The altitude varies from 642 to 844 m above mean sea level (Figure 1).
The mean ± standard deviation of annual rainfall (between 1980 and 2016 years) is 1504 ± 247 mm considering the hydrological year (from September to August). The minimum and maximum monthly rainfall amounts occur in winter (28 mm in July) and summer (291 mm in January). The mean of the daily air temperature is 20.6 ± 3.1 °C. According to the Köppen climate classification, the climate in OCB is CWA humid subtropical, with a dry winter and hot and rainy summer [31].
The OCB is located in an outcrop area of the Guarani Aquifer System (GAS), which is located as an unconfined aquifer and consists of sandstone layers of the Botucatu and Pirambóia Formations [32]. The site under investigation (Figure 1) has been monitored since 2004 to evaluate recharge [33], the land use change [34], the land use change effect on recharge [23], the contribution of groundwater flow to stream discharge [35], the streamflow prediction [36], and the impacts of climate change on groundwater availability [37]. The predominant land use in the study site was pastured until 2011. This land coverage changed to clones of hybrid Eucalyptus plantation (Eucalyptus grandis × Eucalyptus urophylla), also known as Eucalyptus Urograndis. The average density of the plantation is 1334 trees per hectare, with an average spacing of 2.5 × 2.5 m between trees.
The soil (sandy texture) is classified as Aortic Quartz Arenite Neosol (RQo) according to the Brazilian Soil Classification System. The hydraulic conductivity obtained using slug tests varies between 7.0 × 10⁻⁶ and 4.6 × 10⁻⁵ m/s. In this region, topographic and sandy soil characteristics allow fast rainfall infiltration into the soil and low overland flow [38]. More details about geology, hydrogeology and groundwater levels of the OCB is presented in [24,33].
2.2. Data Acquisition
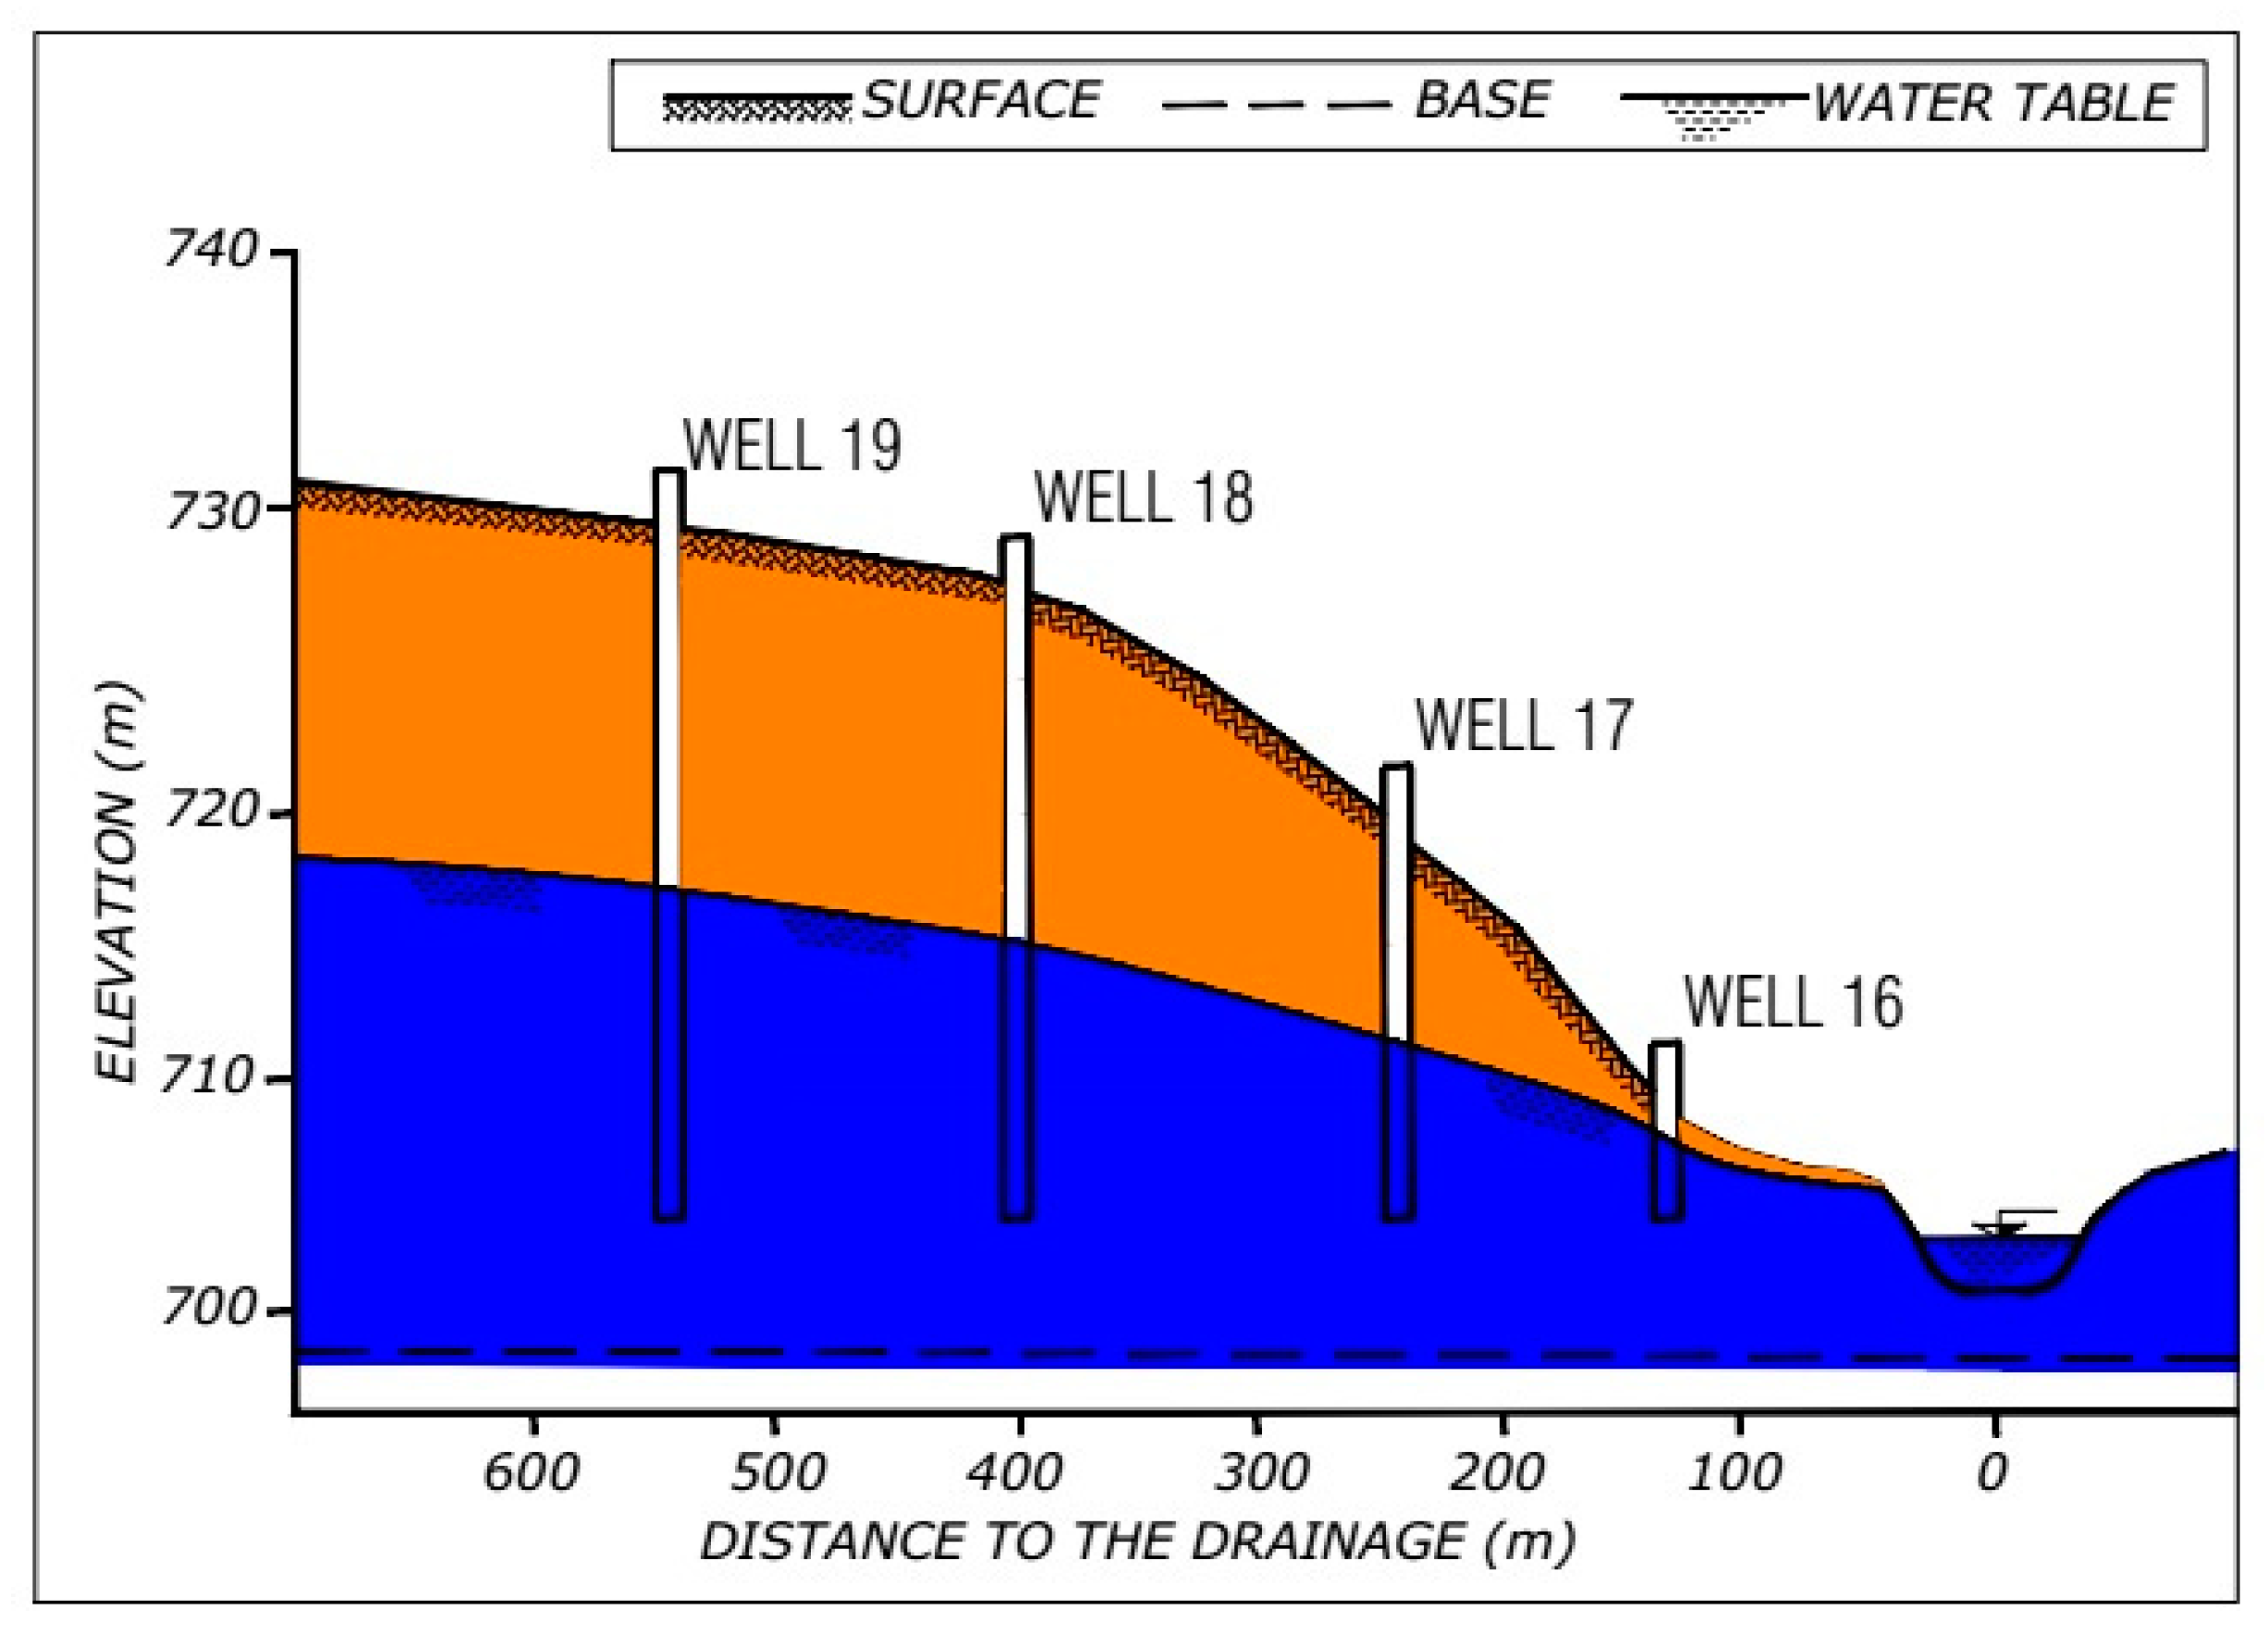
To assess the impact of land use change on recharge, four monitoring wells (P16, P17, P18 and P19) were installed parallel to a streamline, transverse direction to the main stream (Figure 2). The monitoring wells were constructed of polyvinyl chloride pipes (PVC) with a diameter of 100 mm and filter varying from 4 to 10 m in depth from the bottom. The groundwater levels in the monitoring wells were measured every 15 days using an electric water level meter (Solinst, model 102) during 2004 to 2016. The measured values were linearly interpolated over time in order to obtain a daily time series.
Rainfall and meteorological data (temperature, radiation, pressure, humidity and wind speed) were recorded at the Center for Water Resources and Applied Ecology (CWRAE) at the University of São Paulo (USP), which is located 3 km far from the study site.
Considering that recharge varies according to rainfall amount, we classified the hydrological years as dry and rainy. We used the Standardized Precipitation Index, SPI (-), which is a drought index used to quantify long-term rainfall deficit reflecting the impact of drought on water resources availability [39]. We used 12 months of accumulated period to the calculation of SPI.
2.3. Rainfall and Groundwater Trend Analysis
We evaluated if the variation of mean groundwater levels was statistically significant between the periods coved by pasture (from 2004 to 2010) and Eucalyptus plantation (from 2011 to 2016). This approach was divided into three steps following [40]: (i) Calculation of the mean annual groundwater levels, (mm), for each monitoring well; (ii) calculation of the historical mean groundwater levels (for 12-years period), (mm), for each monitoring well; (iii) calculation of the difference between mean annual and mean historical groundwater levels for each monitoring well. Then, groundwater levels were normalized, Norm (-), using annual rainfall, P (mm), to minimize the effect of climatic on groundwater levels fluctuation. The normalization approach is given by:
2.4. Groundwater Recharge Estimating
The water-table fluctuation (WTF) method was used to estimate annual recharge rates. The WTF method is based on the hypothesis that any single rise in groundwater levels (unconfined aquifers) are entirely assigned to recharge water arriving at the water-table [8]. Thus, considering a small enough time interval (hours or few days) for this premise to be valid, the recharge is expressed as [39]:
where (mm) is the recharge between an interval of time, (days), (-) is the specific yield of the aquifer, and (mm) is the difference between the peak of the rising curve and the lowest point of the previous recession curve extrapolated to the time of the peak. To reduce the extrapolation subjectivity of the recession curve, we followed the method presented by [41] and it was applied by [24].
It is important to mention that groundwater levels were corrected using atmospheric pressure data and that there was no pumping wells inside the study area. values were determined in laboratory using undisturbed soil samples [33]. Following [33], a 10% value was used for monitoring wells P19 and P18, 14% for well P17 and 15% for well P16. Despite its intrinsic time-dependence, values correspond to the period before Eucalyptus afforestation, which implies a simplified hypothesis of steady-stead condition.
The inherent error of the WTF method is mainly associated to the uncertainty on [42]. Thus, we estimated recharge uncertainty as follows [43,44]:
where (mm) is the recharge uncertainty, (-) is the standard deviation of all specific yield values measured in the OCB and is the mean specific yield of the aquifer. The standard deviation of is subject to limitations because it does not account for the uncertainty inherent in the individual measurements of . The mean ± standard deviation of all values in the OCB were 11.96 ± 2.91%, respectively [44].
2.5. Evapotranspiration
We computed annual evapotranspiration rates in order to associate recharge rates with the water requirements for pasture and Eucalyptus plantations. The daily actual evapotranspiration, ET (mm/d), was calculated from the daily reference potential evapotranspiration, ETo (mm/d), and then it was accumulated in the annual scale. ET was estimated as shown by Equation (4):
where Kc (-) is a coefficient for the crop. To estimate ET in the pasture period, a mean Kc value of 0.60 was used [45]. For the period covered by Eucalyptus plantation, we adopted Kc = 0.70 in the first year and Kc = 0.82 in the following years [46]. The former authors estimated the Kc for Eucalyptus grandis and hybrid Eucalyptus (Eucalyptus grandis × Eucalyptus urophylla), considering two crop growing stages: The initial growth phase (until the first 18 months) (Kc = 0.70) and the middle growth phase (after 18 months) (Kc = 0.82).
The ETo was computed using a modified version of the Penman–Monteith equation proposed by the Food and Agriculture Organization of the United Nations (FAO) [45]:
where Rn (MJ/m2/d) is the net solar radiation at the crop surface, G (MJ/m2d) is the soil heat flux density, T (°C) is the mean daily air temperature at a 2 m height, u2 (m/s) is the wind speed at a 2 m height, ea (kPa) is the actual vapor pressure, Δv (kPa/°C) is the slope of the vapor pressure curve. It should be highlighted that in this study actual ET was computed as a function of ETo and Kc, that is, we did not take into account the soil water availability and therefore our ET estimating values may be overestimated.
2.6. Statistical Analysis of Groundwater Levels
The effect of land use change from pasture to Eucalyptus on the mean annual groundwater levels was addressed using the hypothesis t-test for paired data. To apply the paired t-test, an equivalent number of samples from the two treatments is necessary. Thus, we used a period of five years of mean groundwater levels for both pasture and Eucalyptus. That is, the mean groundwater levels of the four monitoring wells.
To identify increasing or decreasing trends in the groundwater levels before and after land use change, the Mann–Kendall test [47,48] was applied at a significant level of 5%. In addition, we used the non-parametric Sen’s Slope Estimator to determine the magnitude of the groundwater levels trend [49].
3. Results
The results were analyzed according to hydrological years (from September to August). To facilitate hydrological years are simply named by the year it ends, for example, 2004–2005 is mentioned as 2005. Recharge rates were calculated as a fraction of the rainfall amount.
3.1. Rainfall and Groundwater Trend Analysis
Four atypical years were verified during the study period (Figure 3). In the driest years (2006 and 2014), we observed 20% and 24% decreases in the annual rainfall compared with the long-term mean rainfall (1504 mm). In contrast, 2011 and 2016 were the wettest years with an increase in the annual rainfall of 24% and 32%, respectively.
A decreasing trend in the annual rainfall occurred (Figure 3). After 2011 (wet year), there was a decrease in rainfall to the lowest observed value, shown by the steeped slope of accumulated deviation relative to the long-term mean rainfall. Opposite behavior was observed in the accumulated deviation after 2014 due to an increase in rainfall amount in 2016. Moreover, 2014 was classified as a severely dry year (SPI = −1.64) and 2016 as a very wet year (SPI = 1.92).
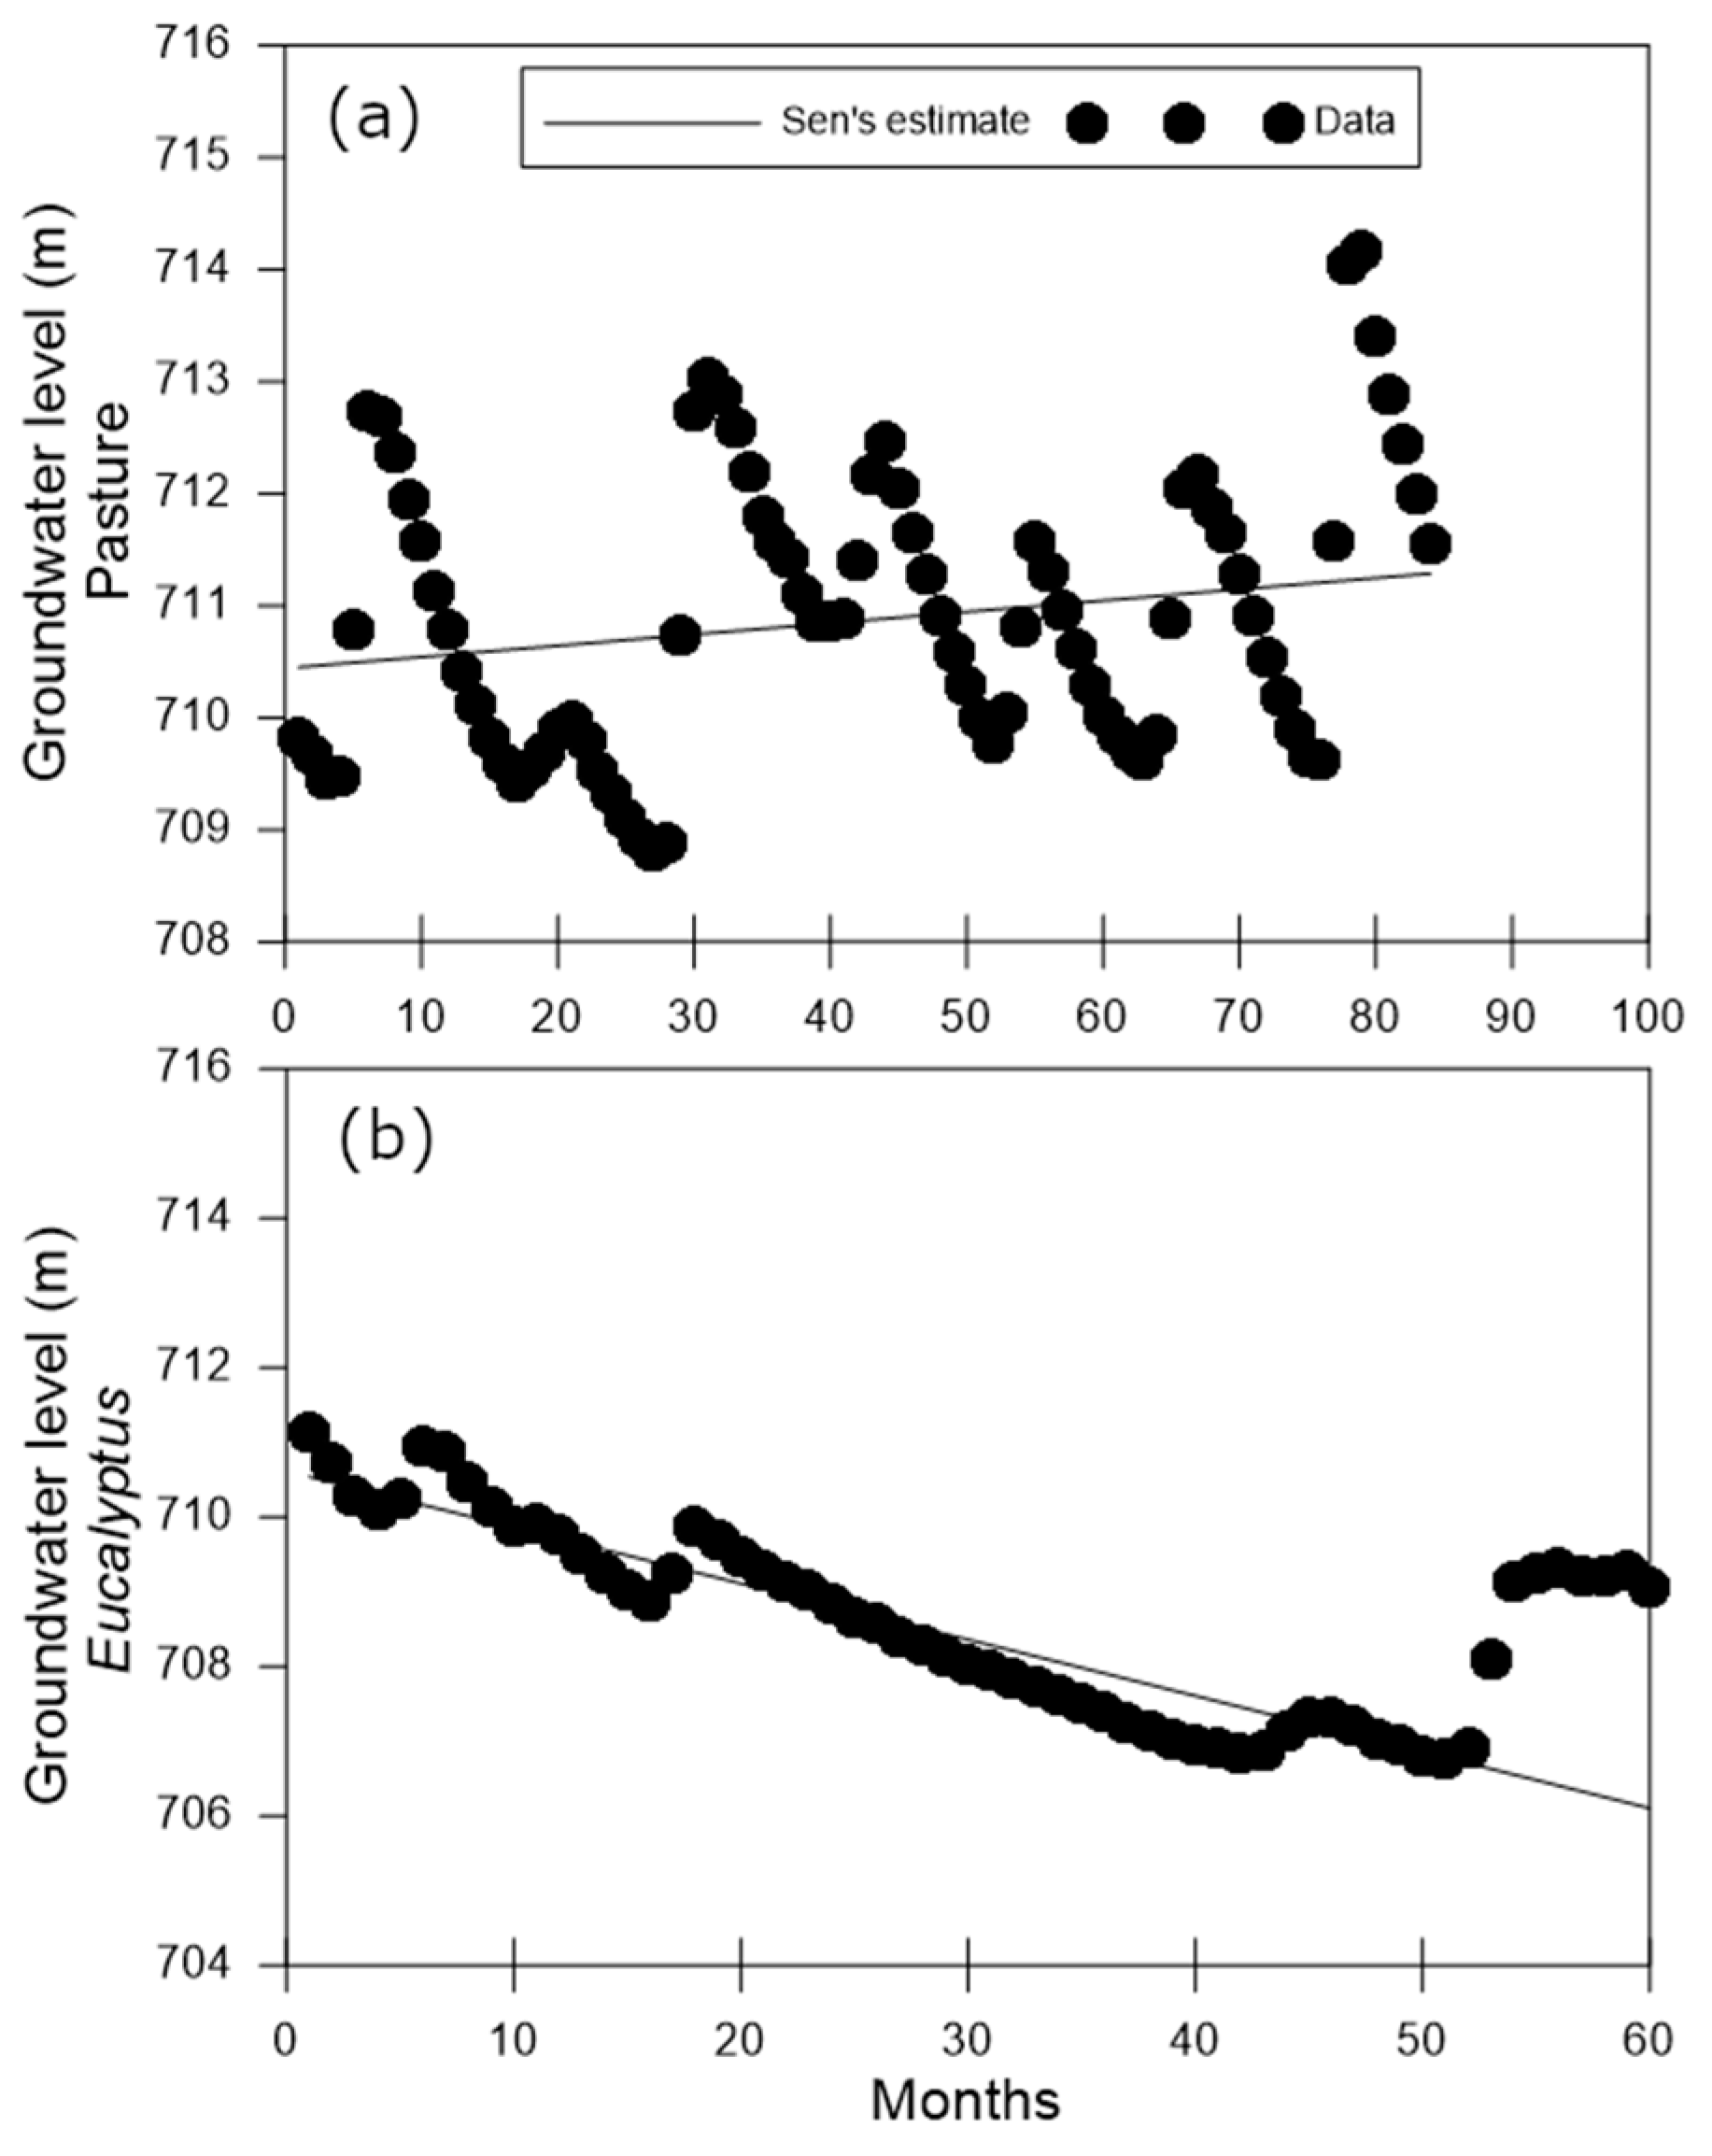
We used the modified Mann–Kendall test to analyze trends in the mean annual of groundwater levels during the pasture and Eucalyptus periods. Positive trend in groundwater levels (at the 5% significance level) was noted during the pasture period, indicating a slight increase (0.010 m) in the groundwater level over the 2005 and 2011 years (Figure 4). After Eucalyptus afforestation (from 2012 to 2016), a significant decreasing trend (at the 5% significance level) was observed with a marked decrease (−0.075 m) in groundwater levels (Figure 4).
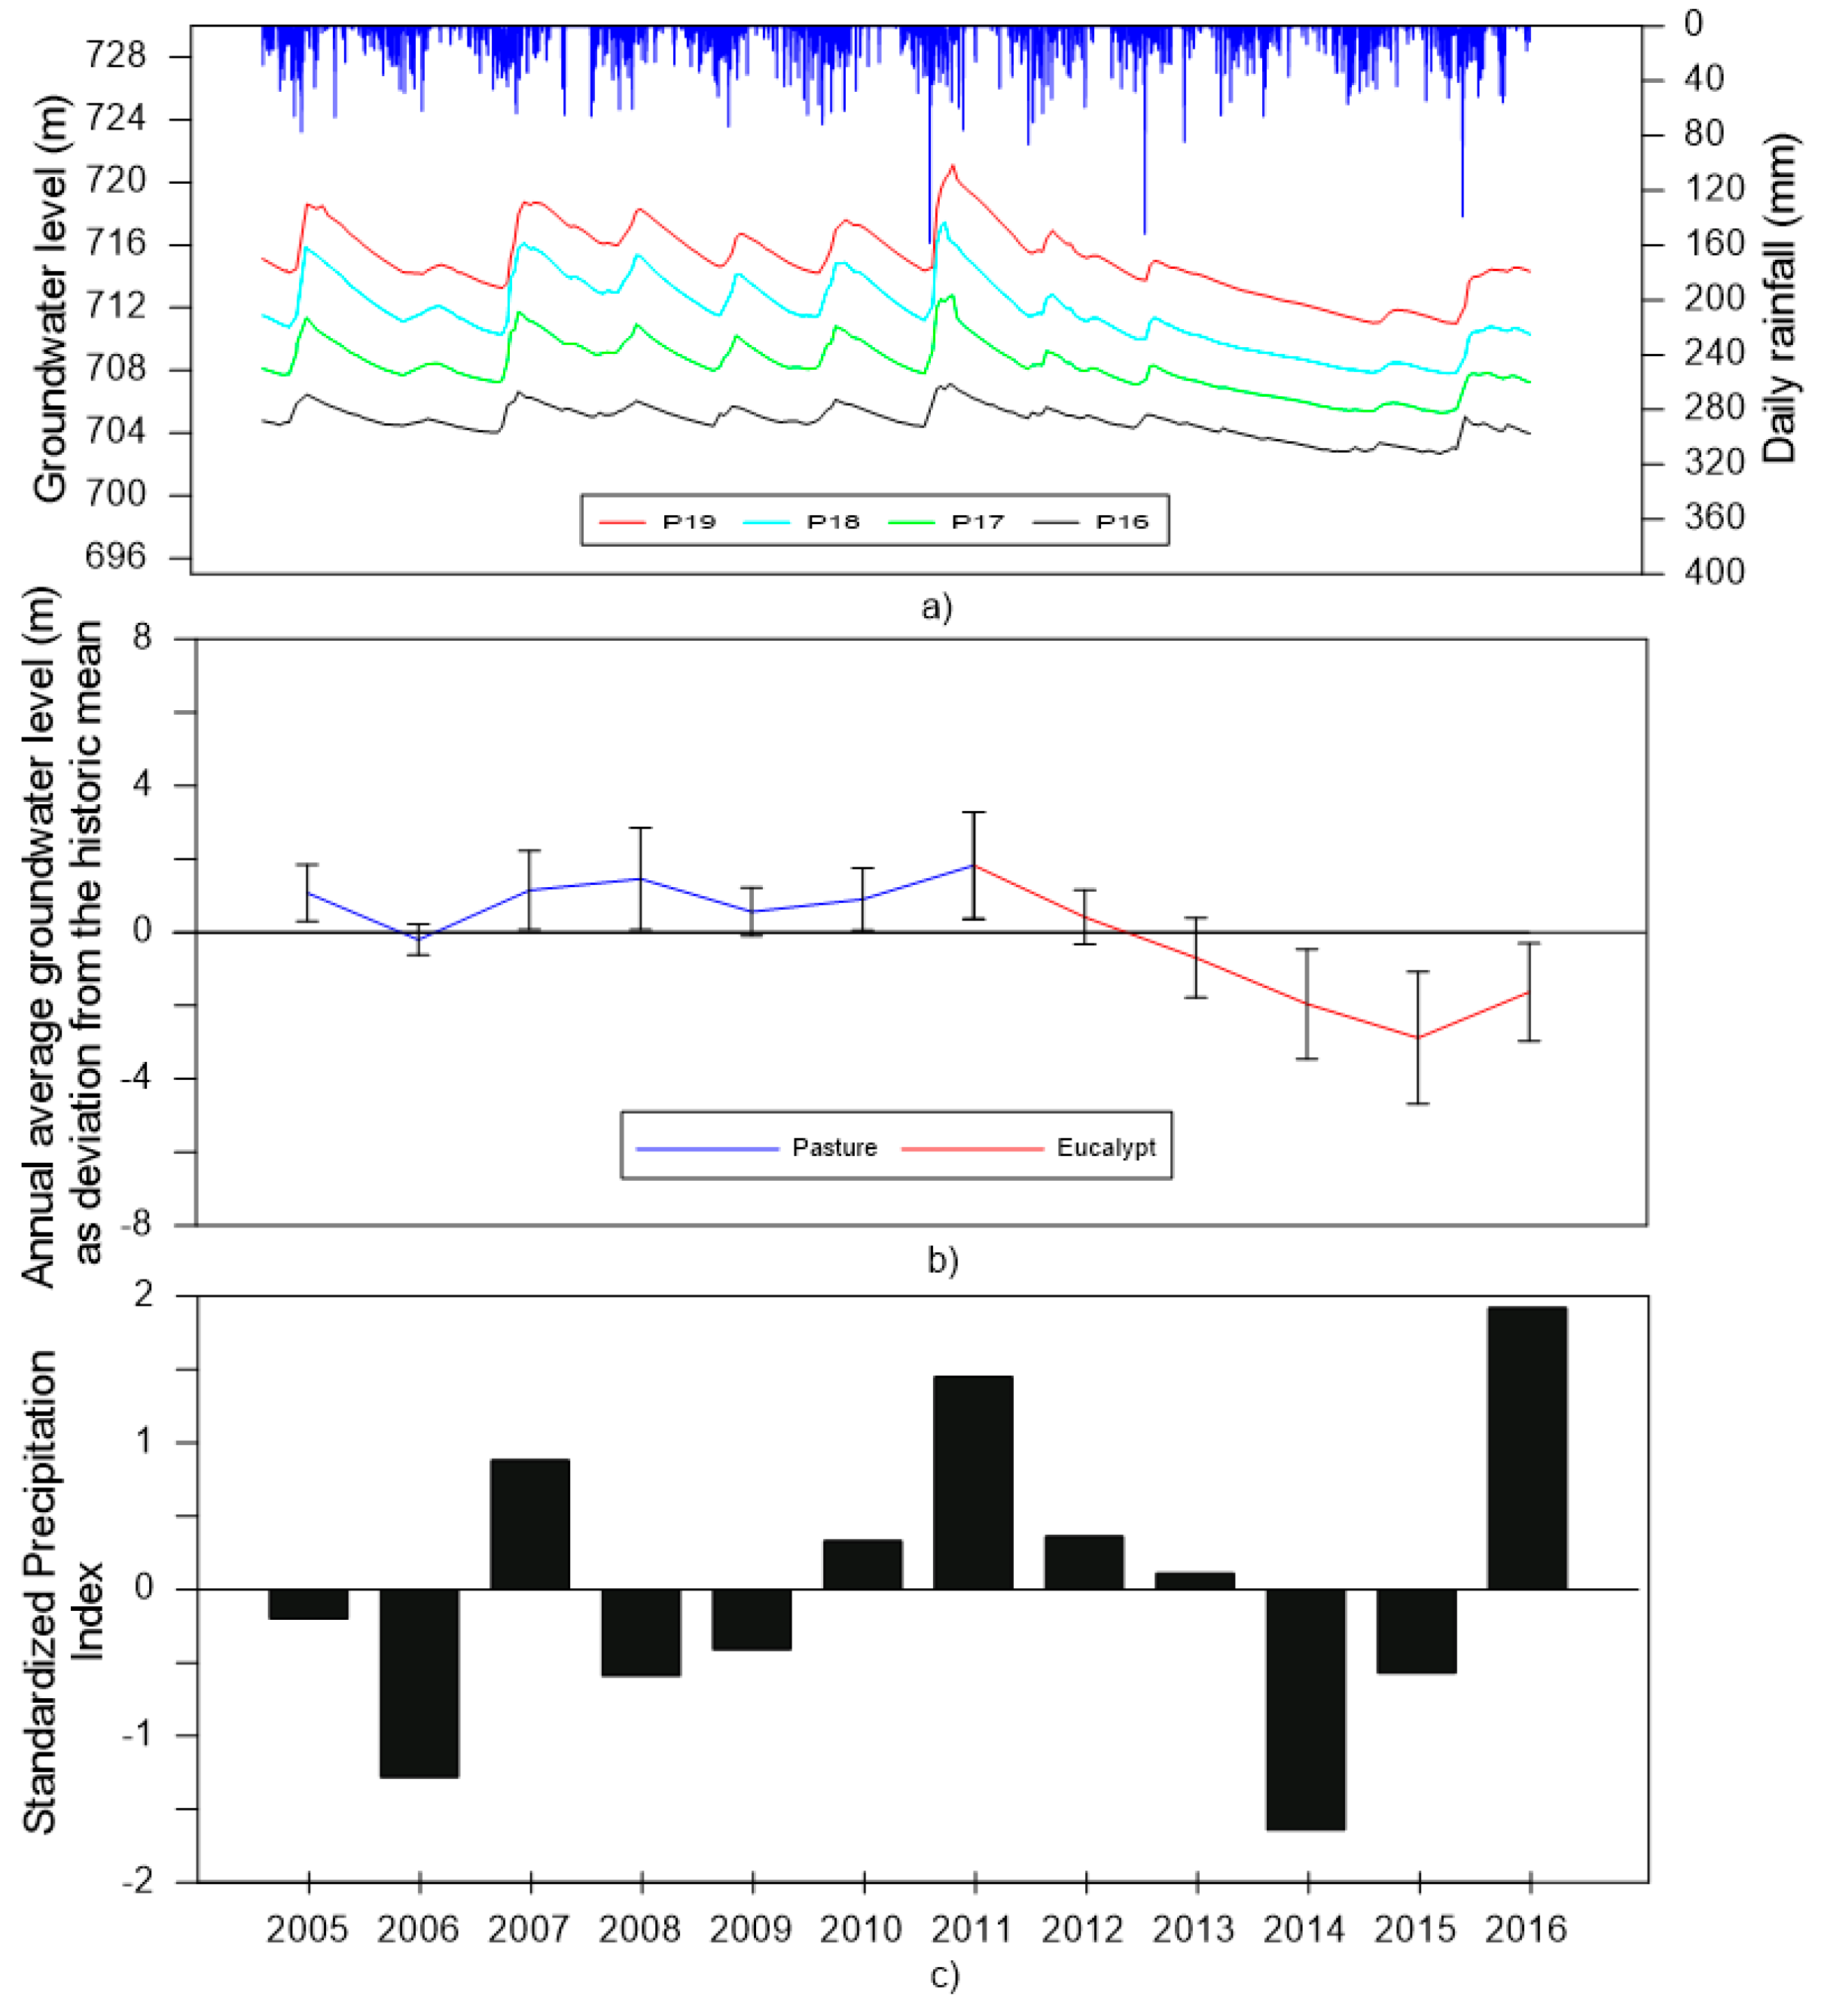
The groundwater levels measured in the monitoring wells from the hydrological year 2005 to 2016 are shown in Figure 5. The monitoring well data have a well-defined annual cycle with the maximum water table at the end of the rainy period and a single peak throughout the year during the 2005–2011 period (Figure 5). After changing the land use from pasture to Eucalyptus, a significant reduction of annual peaks in groundwater levels was observed. The decrease in groundwater levels peak was pronounced during the 2012 and 2013 year, to which annual rainfall was close to the long-term mean (1504 mm). Additionally, 2012 (SPI = 0.36) and 2013 (SPI = 0.11) were classified as regular years in terms of the rainfall amount (Figure 5c).
During the pasture period a negative deviation in mean groundwater level occurred only in the 2006 year because of the low rainfall amount (Figure 5b). The 2006 year was the second driest (SPI = −1.28) of the monitoring period. On the other hand, 2008 and 2011 presented the largest positive deviations in groundwater levels due to high rainfall amounts and consequently groundwater recharge (Figure 5b). After 2011, even though the 2012 and 2013 annual rainfalls were close to the long-term mean (1504 mm), a decrease in the groundwater levels was observed. Consequently, it resulted in negative deviations between the mean annual groundwater level and the long-term mean of groundwater level (Figure 5b). In 2016, groundwater levels rose due to the high rainfall amount (1862 mm).
The result of the hypothesis t-test of the mean annual groundwater levels between the periods with pasture and Eucalyptus showed a significant difference (p-value < 0.05) at a 5% significant level.
3.2. Groundwater Recharge
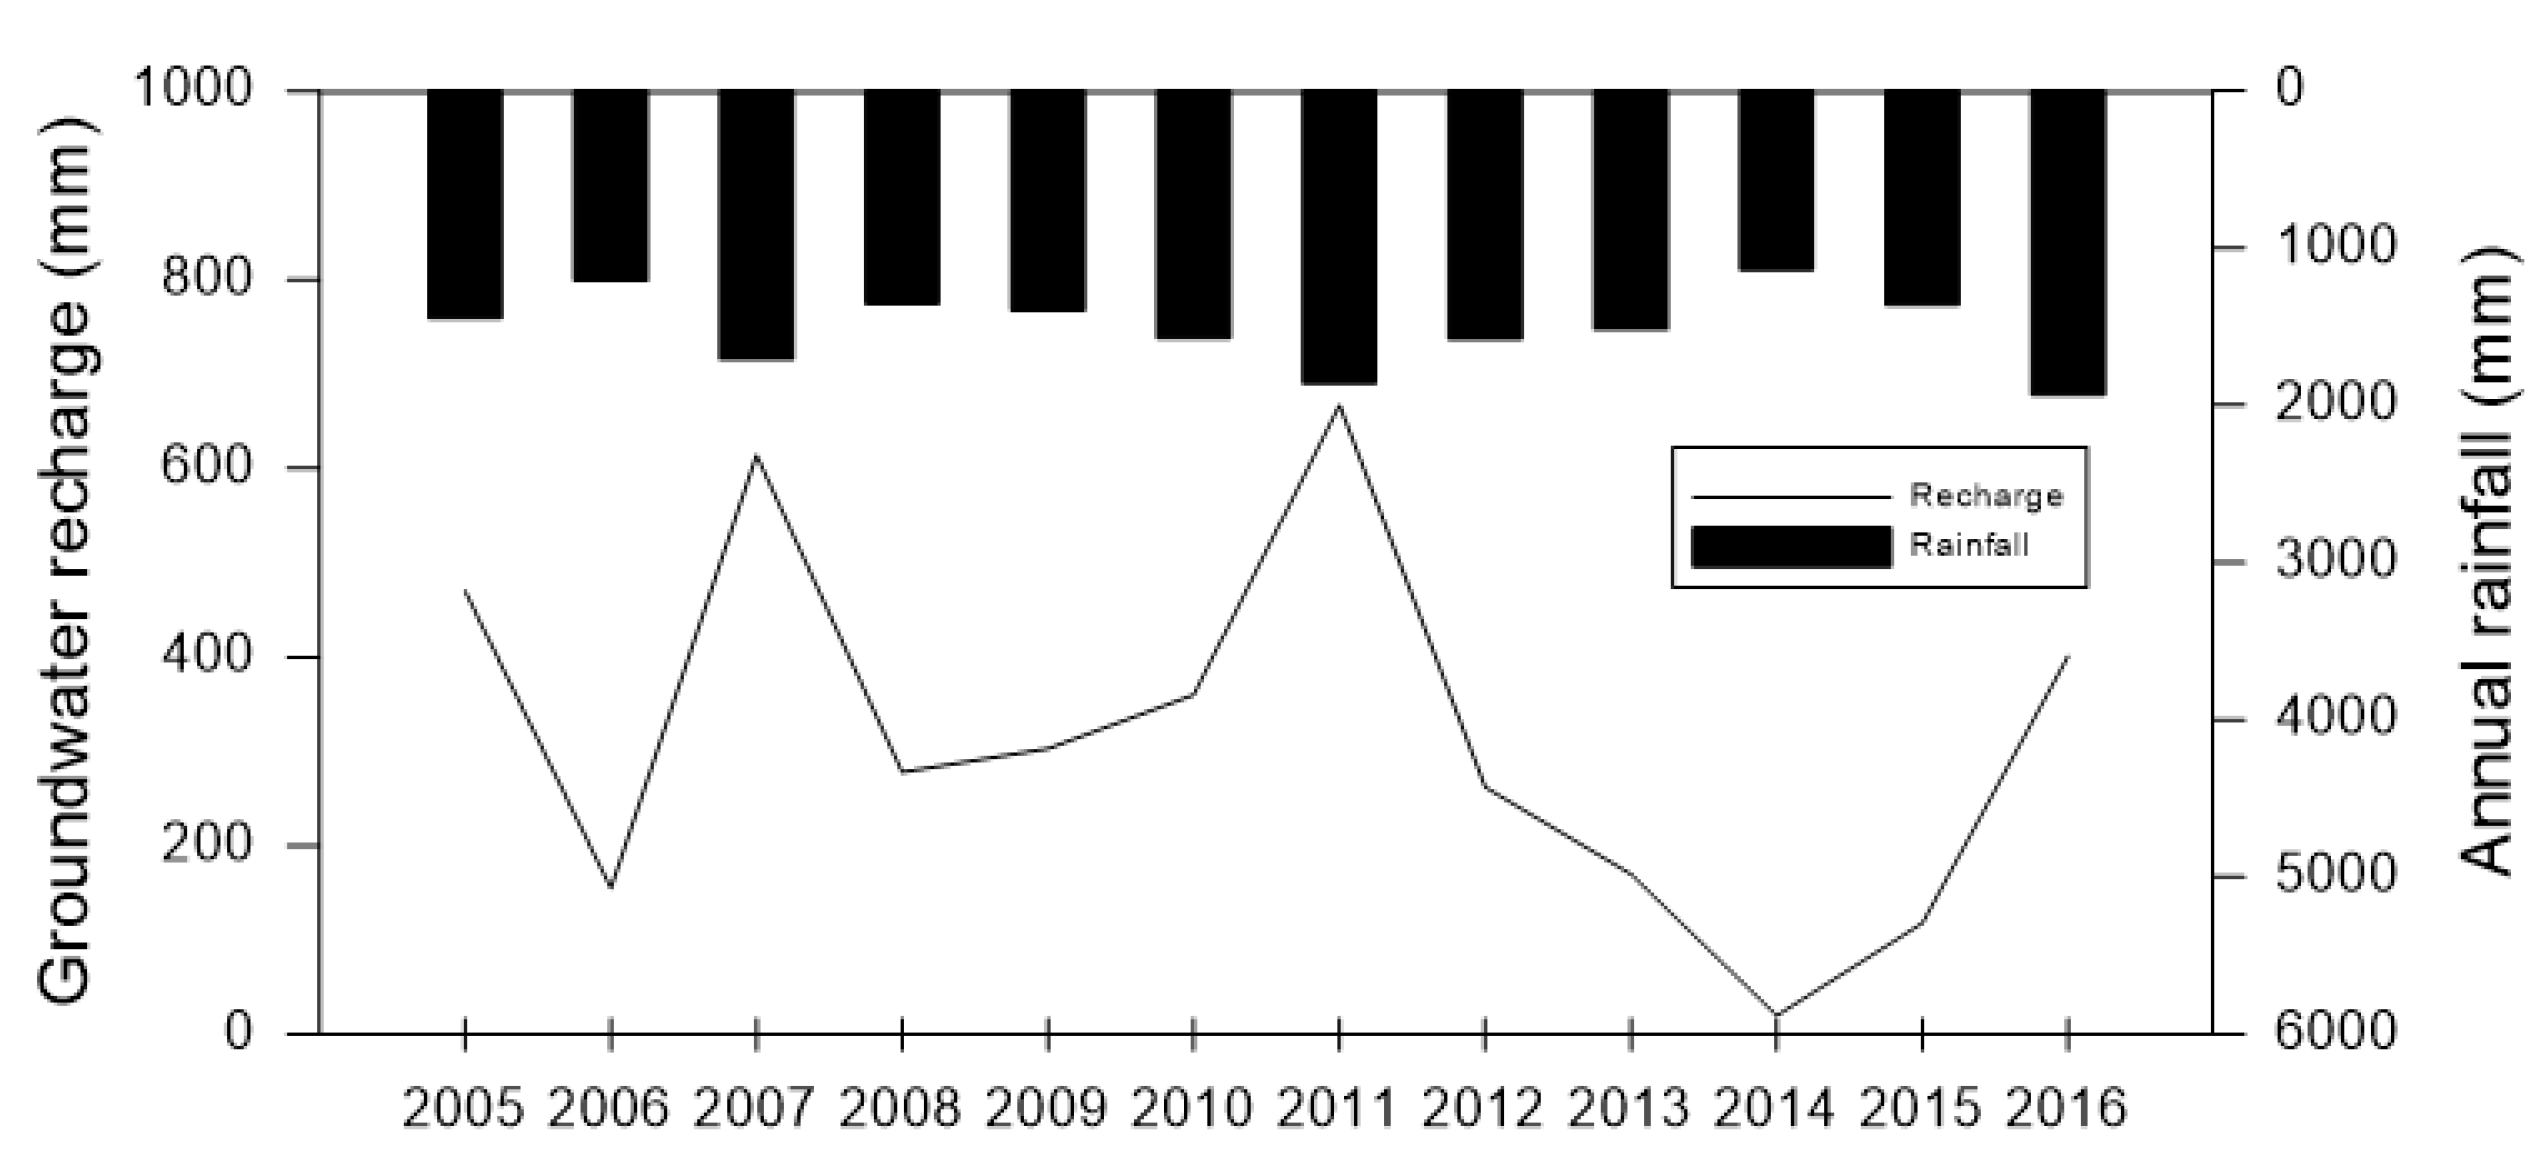
Figure 6 shows the annual groundwater recharge estimated using the WTF method. The mean ± standard deviation of the recharge was close to 318 ± 77 mm over the 12-year study period. The uncertainty corresponds to a value of 24% of the mean annual recharge, which is consistent with previous studies [23,24,50]. Before the Eucalyptus afforestation, the highest recharge value (667 mm) was estimated in 2011 (Figure 6), corresponding to about 36% of the annual rainfall (1862 mm). The lowest recharge value (155 mm) (Figure 6), equivalent to almost 13% of the annual rainfall (1209 mm), was observed in 2006 when the lowest rainfall during the pasture period was recorded.
After the land use change, groundwater recharge significantly decreased. In the first year with Eucalyptus (2012), the recharge was estimated as 262 mm, about 17% of the annual rainfall (1578 mm). During the Eucalyptus development stage, the recharge decreased to approximately 170 mm in 2013, corresponding to about 11% of the annual rainfall (1517 mm). In 2014, the mean recharge was estimated to be only 20 mm because of the very low rainfall (SPI = −1.64) in the period. Remarkably, two years later (2016), the highest rainfall (1991 mm) was recorded resulting in an increase in recharge to about 400 mm (20% of annual rainfall).
3.3. Evapotranspiration
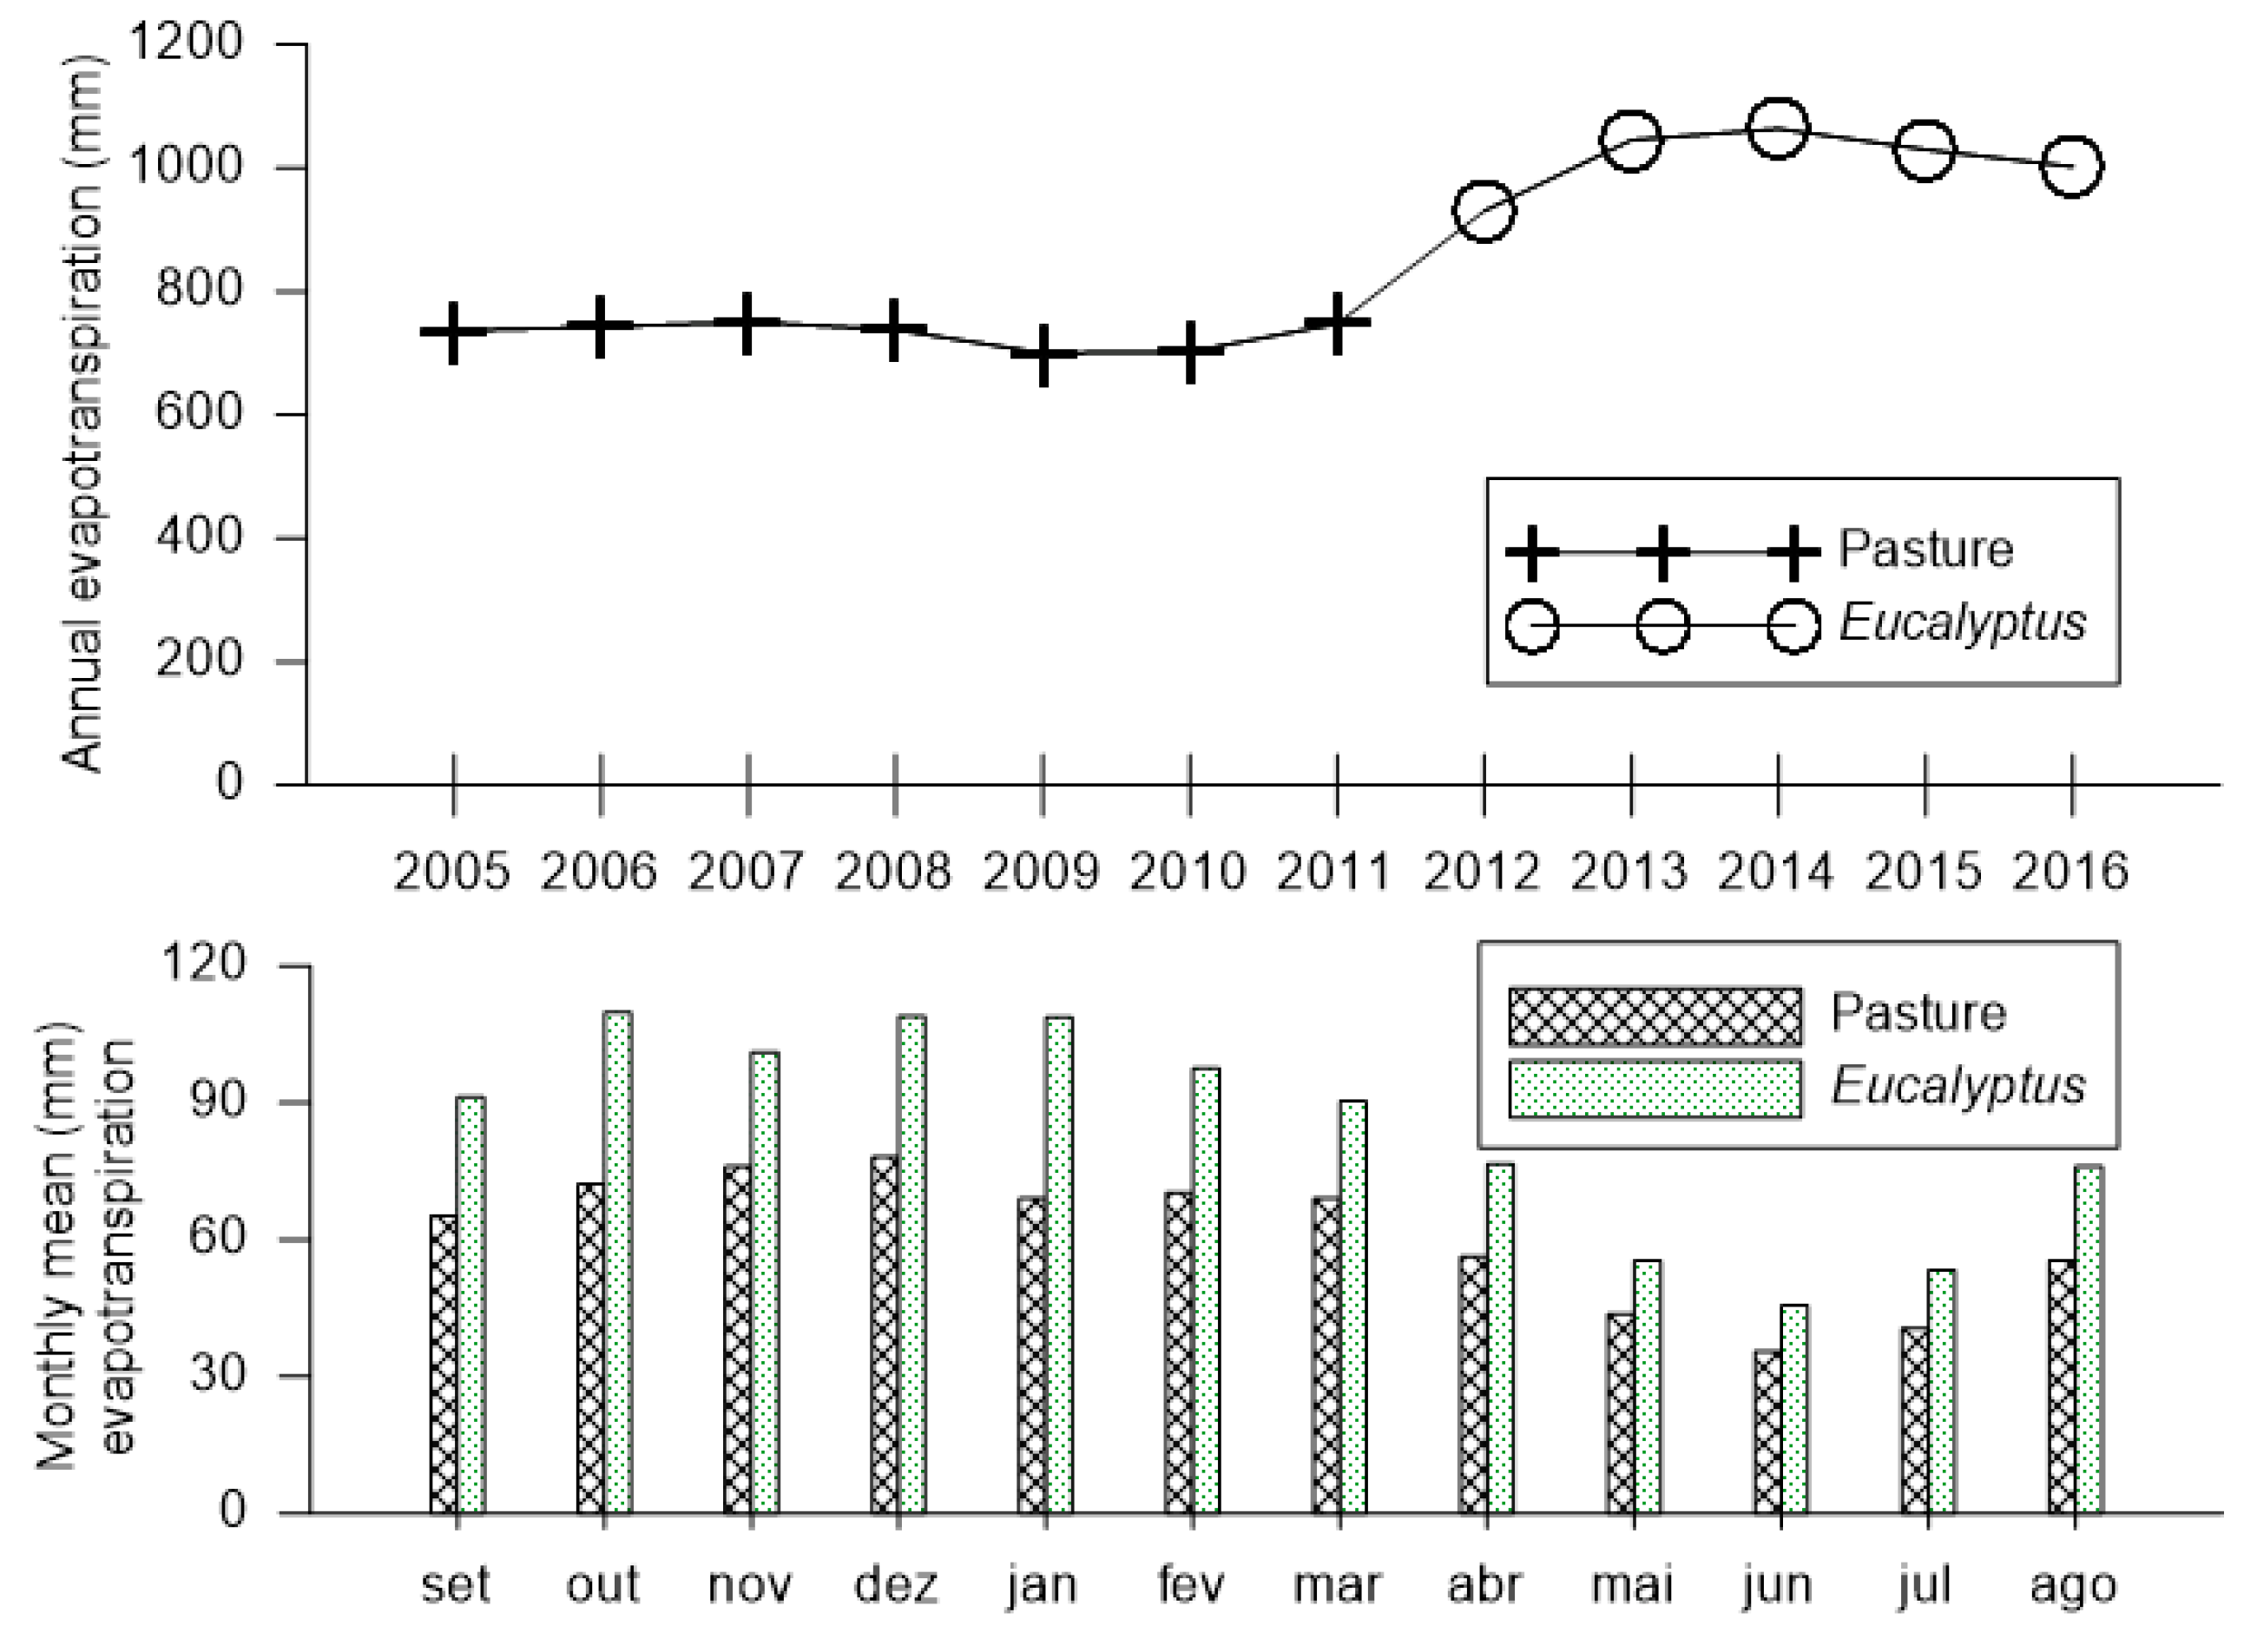
Although the seasonal patterns of ET are similar for both land covers, estimated ET was higher during the Eucalyptus plantation period and lower for the pasture period (Figure 7). We also found that the largest differences in the mean monthly ET occurred during the rainy season (from September to March). However, differences between mean monthly ET values were smaller during the dry season (from April to August) (Figure 7).
The estimated mean annual ET was 731 mm (48% of the mean annual rainfall) for pasture area from 2005 to 2011. The mean annual ET raised to 1014 mm (about 67% of the mean annual rainfall) during the five years (2012 to 2016) covered by Eucalyptus plantation. The difference between Eucalyptus and pasture ET values ranged from approximately 150 mm/year, in the first year under Eucalyptus to over 300 mm/year in the following year. The difference in estimate ET rates between the land covers depends on the crop coefficient values and atmospheric conditions reflected in ETo values.
4. Discussion
The groundwater levels observed in the monitoring wells decreased significantly after the land use change in 2012 (Figure 5a). Groundwater levels decreased even in the hydrological years (2012 and 2013) with the annual rainfall close to the long-term mean. The mean groundwater level decreased about 2.0 m in April 2012 in comparison with April 2005, which also had an annual rainfall close to the long-term mean. In 2013, the mean groundwater level decreased 3.0 m in comparison with April 2005. This result corroborates with the reported by [16], who found a groundwater level decrease of more than 4.0 m between two adjacent pastures and five-year old Eucalyptus globulus plantation catchments.
Due to the decrease in the mean groundwater levels, water level deviations compared to the long-term mean, became increasingly larger (Figure 5b). Additionally, the decrease in the mean groundwater levels resulted in a lower horizontal hydraulic gradient. In April 2005, the mean hydraulic gradient between monitoring wells 18 and 17 reached 0.044 m/m. While in April 2012, the observed mean hydraulic gradient was 0.033 m/m, a reduction of about 25% compared to 2005. In April 2013, the hydraulic gradient was estimated as 0.029 m/m indicating a reduction of almost 34% compared to April 2005. The lower horizontal hydraulic gradient directly leads to less local base flow contribution to the streamflow [35]. This behavior is driven by the decrease in groundwater recharge (Figure 6) that occurred after the land use change.
Recharge decreased almost 44% in 2012 and more than 60% in 2013 compared to earlier years of similar rainfall (2005 and 2012 or 2013). Recharge was close to zero in 2014, due to both a high ET and low rainfall. This was an atypical hydrological year in which the lowest rainfall amount (1137 mm) was recorded during a long drought period in the State of São Paulo [52]. Despite the highest rainfall amount in 2016, the recharge (401 mm/year) under Eucalyptus plantation was lower than the estimated for pasture in 2007 (614 mm/year) or in 2005 (470 mm/year), which had significantly lower annual rainfall. Thus, our results indicate that the ET increase after land use change (Figure 7) was a key process in the recharge decrease. In general, ET tends to increase as Eucalyptus grows, but it may also vary with water availability and with the leaf area index [53]. The mean annual ET (1014 mm) during the Eucalyptus period was similar to those reported in previous reports, for example 1092 mm [53], 1150 mm [54], 1186 mm [55] and 1061 mm [46].
Estimated ET increased from 930 mm in the first year (2012) to about 1063 mm in the third year (2014), decreasing slowly to 1030 mm in the following year (2015) (Figure 7). This tenuous increase in ET throughout Eucalyptus growth could be addressed with water availability, which was significantly reduced in 2014 and also the Kc value used in the mid-season stage.
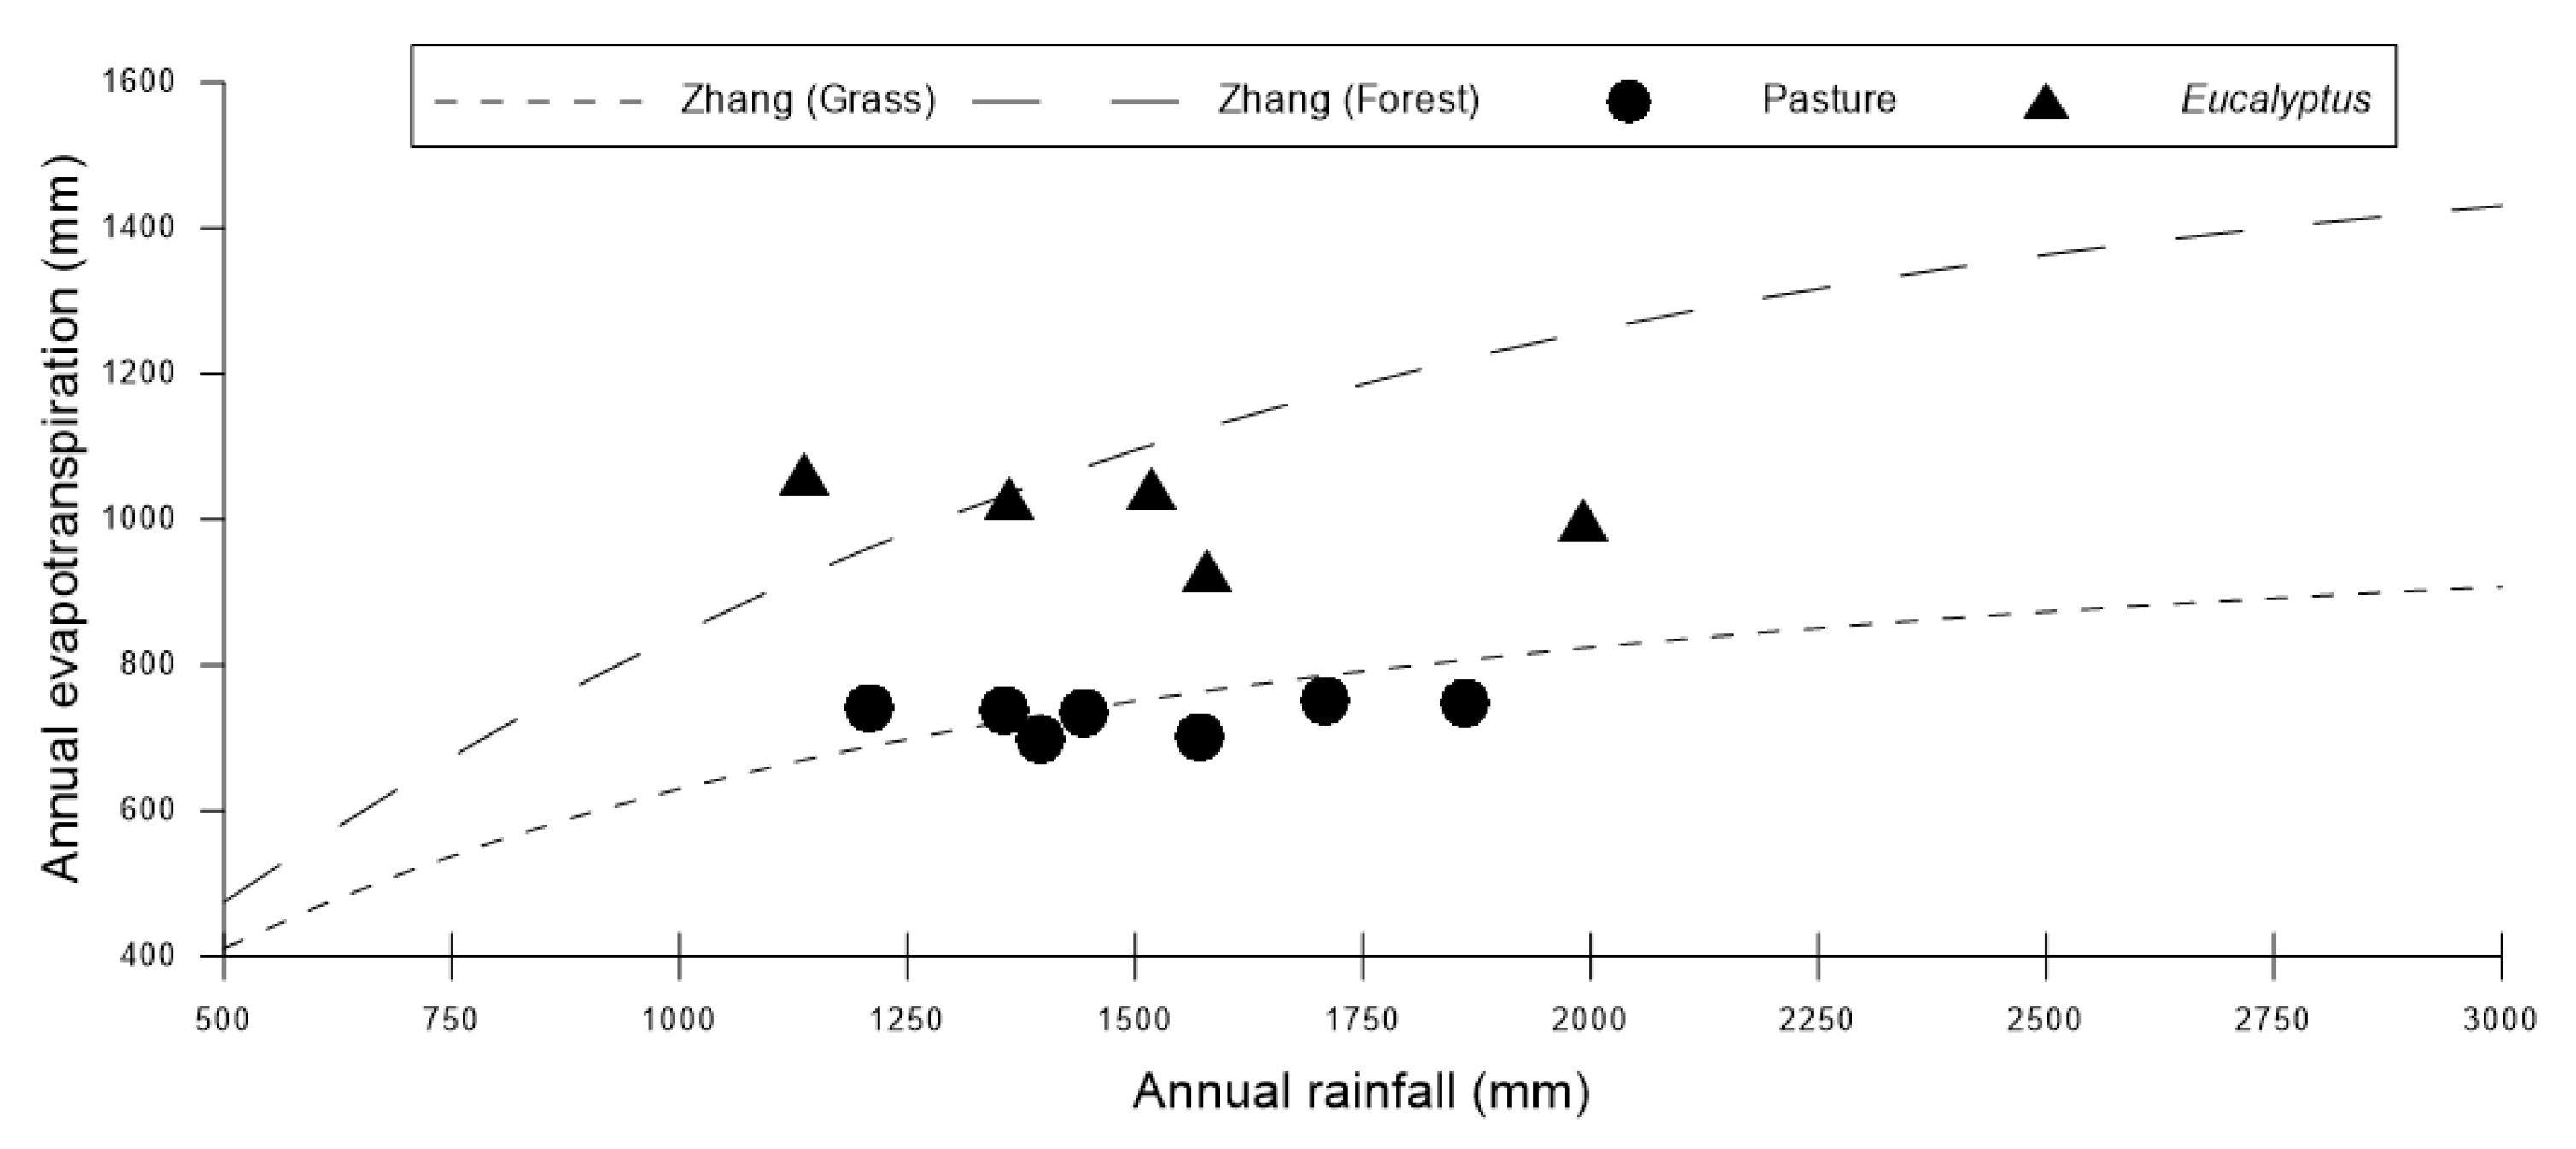
According to [46], the mean value of the crop coefficient is in the expected range for Eucalyptus plantation in the initial stage (Kc = 0.70). However, because, the mean value of the crop coefficient (Kc = 0.82) can be underestimated in the mid-season stage, ET estimated for mid-season stage can also be underestimated. This is an explanation to the poor agreement with the results shown by [51] for Eucalyptus in 2016. Nevertheless, overall, there is an acceptable agreement for both crops (Figure 8).
Other studies have reported that forest plantations may increase groundwater recharge by improving infiltration [56]. Many agricultural areas have damaged and exposed soils, leading to the reduction of soil water infiltration and water holding capacity [57]. In some cases, due to higher root density, macrofaunal activity and content of soil organic matter, tree plantations may improve the porosity and the soils capacity of water transport, improving water infiltration and deep drainage [26,58].
Our study suggests that in sandy soils with high infiltration rates, such as the Guarani Aquifer System (GAS) outcrop area, evapotranspiration plays a key role in the groundwater recharge rates. The type of land use existing prior to the afforestation is decisive in the assessment of recharge amounts. Thus, if the prior use were a native forest or another type of forest plantation, the impact on recharge would probably not be significant [53,59].
5. Conclusions
The main conclusions of this study are as follows:
- Although annual rainfall variability strongly influenced the recharge rates, a comparison of periods with pasture and Eucalyptus coverage showed that land use changes affect groundwater availability. Eucalyptus plantation affected seasonal and annual hydrology of the study area by increasing evapotranspiration rates and, consequently, leading to a decrease in recharge and groundwater levels;
- Although the 2005 and 2012 (or 2013) years present annual rainfall similar to the long-term mean rainfall, the recharge reduced almost 44% in 2012 and more than 60% in 2013, leading to a groundwater level decrease of about 2.0 m and 3.0 m, respectively. Therefore, annual recharge estimates were lower in the Eucalyptus plantation period than in the pasture period, even with the increase in the annual rainfall amount.
- The high evapotranspiration by Eucalyptus forests tend to provide a decrease in groundwater recharge and groundwater levels, even in sandy soils with a high infiltration rate, such as in the GAS outcrop area.
Local studies are needed to define the best conditions for planting forest species, like Eucalyptus, to reduce impacts on groundwater resources.
Author Contributions
Conceptualization, T.S.M. and E.W.; Methodology, T.S.M., P.T.S.d.O., M.C.L.; Formal analysis, T.S.M., E.W., P.T.S.d.O., M.C.L.; Investigation, T.S.M., P.T.S.d.O., M.C.L.; Writing—original draft preparation, T.S.M.; Writing—review and editing, E.W., P.T.S.d.O., M.C.L.; Supervision, E.W.; Project administration, E.W.; Funding acquisition, E.W. and P.T.S.d.O.
Funding
This research was funded by the Ministry of Science, Technology, Innovation and Communication – MCTIC and National Council for Scientific and Technological Development (CNPq) (grant numbers 441289/2017-7 and 306830/2017-5) and FAPESP (São Paulo Research Foundation) (grant number 15/03806-1). We would also like to thank the Coordination for the Improvement of Higher Education Personnel – Brazil (CAPES) – Finance Code 001 and CAPES PrInt.
Conflicts of Interest
The authors declare no conflict of interest. The funders had no role in the design of the study; in the collection, analyses, or interpretation of data; in the writing of the manuscript, or in the decision to publish the results.
References
- Salemi, L.F.; Groppo, J.D.; Trevisan, R.; de Moraes, J.M.; de Barros Ferraz, S.F.; Villani, J.P.; Duarte-Neto, P.J.; Martinelli, L.A. Land-use change in the Atlantic rainforest region: Consequences for the hydrology of small catchments. J. Hydrol. 2013, 499, 100–109. [Google Scholar] [CrossRef]
- Kim, J.H.; Jackson, R.B. A Global Analysis of Groundwater Recharge for Vegetation, Climate, and Soils. Vadose Zone J. 2012, 11. [Google Scholar] [CrossRef] [Green Version]
- Scanlon, B.R.; Keese, K.E.; Flint, A.L.; Flint, L.E.; Gaye, C.B.; Edmunds, W.M.; Simmers, I. Global synthesis of groundwater recharge in semiarid and arid regions. Hydrol. Process. 2006, 20, 3335–3370. [Google Scholar] [CrossRef]
- Scanlon, B.R.; Reedy, R.C.; Stonestrom, D.A.; Prudic, D.E.; Dennehy, K.F. Impact of land use and land cover change on groundwater recharge and quality in the southwestern US. Glob. Chang. Biol. 2005, 11, 1577–1593. [Google Scholar] [CrossRef]
- Famiglietti, J.S. The global groundwater crisis. Nat. Clim. Chang. 2014, 4, 945–948. [Google Scholar] [CrossRef]
- De Vries, J.J.; Simmers, I. Groundwater recharge: An overview of processes and challenges. Hydrogeol. J. 2002, 10, 5–17. [Google Scholar] [CrossRef]
- Delin, G.N.; Healy, R.W.; Lorenz, D.L.; Nimmo, J.R. Comparison of local- to regional-scale estimates of ground-water recharge in Minnesota, USA. J. Hydrol. 2007, 334, 231–249. [Google Scholar] [CrossRef] [Green Version]
- Healy, R.W.; Cook, P.G. Using groundwater levels to estimate recharge. Hydrogeol. J. 2002, 10, 91–109. [Google Scholar] [CrossRef]
- Huang, T.; Pang, Z.; Edmunds, W.M. Soil profile evolution following land-use change: Implications for groundwater quantity and quality. Hydrol. Process. 2013, 27, 1238–1252. [Google Scholar] [CrossRef]
- Healy, R.W.; Scanlon, B.R. Estimating Groundwater Recharge; Cambridge University Press: Cambridge, UK, 2010; ISBN 9780511780745. [Google Scholar]
- Döll, P.; Fiedler, K. Global-scale modeling of groundwater recharge. Hydrol. Earth Syst. Sci. 2008, 12, 863–885. [Google Scholar] [CrossRef] [Green Version]
- Payn, T.; Carnus, J.-M.; Freer-Smith, P.; Kimberley, M.; Kollert, W.; Liu, S.; Orazio, C.; Rodriguez, L.; Silva, L.N.; Wingfield, M.J. Changes in planted forests and future global implications. For. Ecol. Manag. 2015, 352, 57–67. [Google Scholar] [CrossRef] [Green Version]
- Onyekwelu, J.C.; Stimm, B.; Evans, J. Review Plantation Forestry. In Silviculture in the Tropics; Springer: Berlin/Heidelberg, Germany, 2011; pp. 399–454. [Google Scholar]
- IBA—Indústria Brasileira de Árvores Report IBA Sao Paulo: Brazilian Tree Industry. Available online: https://www.iba.org/publicacoes/relatorios (accessed on 31 May 2019).
- Adane, Z.A.; Gates, J.B. Determining the impacts of experimental forest plantation on groundwater recharge in the Nebraska Sand Hills (USA) using chloride and sulfate. Hydrogeol. J. 2015, 23, 81–94. [Google Scholar] [CrossRef]
- Adelana, S.M.; Dresel, P.E.; Hekmeijer, P.; Zydor, H.; Webb, J.A.; Reynolds, M.; Ryan, M. A comparison of streamflow, salt and water balances in adjacent farmland and forest catchments in south-western Victoria, Australia. Hydrol. Process. 2015, 29, 1630–1643. [Google Scholar] [CrossRef]
- Fan, J.; Oestergaard, K.T.; Guyot, A.; Lockington, D.A. Estimating groundwater recharge and evapotranspiration from water table fluctuations under three vegetation covers in a coastal sandy aquifer of subtropical Australia. J. Hydrol. 2014, 519, 1120–1129. [Google Scholar] [CrossRef] [Green Version]
- Van Dijk, A.I.J.M.; Hairsine, P.B.; Arancibia, J.P.; Dowling, T.I. Reforestation, water availability and stream salinity: A multi-scale analysis in the Murray-Darling Basin, Australia. For. Ecol. Manag. 2007, 251, 94–109. [Google Scholar] [CrossRef]
- Webb, A.A.; Kathuria, A. Response of streamflow to afforestation and thinning at Red Hill, Murray Darling Basin, Australia. J. Hydrol. 2012, 412–413, 133–140. [Google Scholar] [CrossRef]
- Stednick, J.D. Monitoring the effects of timber harvest on annual water yield. J. Hydrol. 1996, 176, 79–95. [Google Scholar] [CrossRef]
- Bosch, J.M.; Hewlett, J.D. A review of catchment experiments to determine the effect of vegetation changes on water yield and evapotranspiration. J. Hydrol. 1982, 55, 3–23. [Google Scholar] [CrossRef]
- Owuor, S.O.; Butterbach-Bahl, K.; Guzha, A.C.; Rufino, M.C.; Pelster, D.E.; Díaz-Pinés, E.; Breuer, L. Groundwater recharge rates and surface runoff response to land use and land cover changes in semi-arid environments. Ecol. Process. 2016, 5, 16. [Google Scholar] [CrossRef] [Green Version]
- Oliveira, P.T.S.; Leite, M.B.; Mattos, T.; Nearing, M.A.; Scott, R.L.; Oliveira Xavier, R.; Silva Matos, D.M.; Wendland, E. Groundwater recharge decrease with increased vegetation density in the Brazilian cerrado. Ecohydrology 2017, 10, e1759. [Google Scholar] [CrossRef]
- Lucas, M.; Wendland, E. Recharge estimates for various land uses in the Guarani Aquifer System outcrop area. Hydrol. Sci. J. 2016, 61, 1253–1262. [Google Scholar] [CrossRef]
- Allison, G.B.; Cook, P.G.; Barnett, S.R.; Walker, G.R.; Jolly, I.D.; Hughes, M.W. Land clearance and river salinisation in the western Murray Basin, Australia. J. Hydrol. 1990, 119, 1–20. [Google Scholar] [CrossRef]
- Reichert, J.M.; Rodrigues, M.F.; Peláez, J.J.Z.; Lanza, R.; Minella, J.P.G.; Arnold, J.G.; Cavalcante, R.B.L. Water balance in paired watersheds with eucalyptus and degraded grassland in Pampa biome. Agric. For. Meteorol. 2017, 237–238, 282–295. [Google Scholar] [CrossRef]
- Lima, W.P.; Zakia, M.J.B.; Libardi, P.L.; Souza Filho, A.P. Comparative evapotranspiration of eucalyptus, pine and natural cerrado vegetation measure by the soil water balance method. IPEF Int. 1990, 1, 5–11. [Google Scholar]
- Silveira, L.; Gamazo, P.; Alonso, J.; Martínez, L. Effects of afforestation on groundwater recharge and water budgets in the western region of Uruguay. Hydrol. Process. 2016, 30, 3596–3608. [Google Scholar] [CrossRef]
- Lima, W.P.; Laprovitera, R.; Ferraz, S.F.B.; Rodrigues, C.B.; Silva, M.M. Forest Plantations and Water Consumption: A Strategy for Hydrosolidarity. Int. J. For. Res. 2012, 2012, 1–8. [Google Scholar] [CrossRef]
- Ouyang, L.; Zhao, P.; Zhou, G.; Zhu, L.; Huang, Y.; Zhao, X.; Ni, G. Stand-scale transpiration of a Eucalyptus urophylla × Eucalyptus grandis plantation and its potential hydrological implication. Ecohydrology 2018, 11, e1938. [Google Scholar] [CrossRef]
- Alvares, C.A.; Stape, J.L.; Sentelhas, P.C.; de Moraes Gonçalves, J.L.; Sparovek, G. Köppen’s climate classification map for Brazil. Meteorol. Z. 2013, 22, 711–728. [Google Scholar] [CrossRef]
- Araújo, L.M.; França, A.B.; Potter, P.E. Hydrogeology of the Mercosul aquifer system in the Paraná and Chaco-Paraná Basins, South America, and comparison with the Navajo-Nugget aquifer system, USA. Hydrogeol. J. 1999, 7, 317–336. [Google Scholar] [CrossRef]
- Wendland, E.; Gomes, L.H.; Troeger, U.; Wendland, E.; Gomes, L.H.; Troeger, U. Recharge contribution to the Guarani Aquifer System estimated from the water balance method in a representative watershed. An. Acad. Bras. Cienc. 2015, 87, 595–609. [Google Scholar] [CrossRef] [Green Version]
- Manzione, R.L.; Wendland, E.; Tanikawa, D.H. Stochastic simulation of time-series models combined with geostatistics to predict water-table scenarios in a Guarani Aquifer System outcrop area, Brazil. Hydrogeol. J. 2012, 20, 1239–1249. [Google Scholar] [CrossRef]
- Machado, A.R.; Wendland, E.; Krause, P. Hydrologic Simulation for Water Balance Improvement in an Outcrop Area of the Guarani Aquifer System. Environ. Process. 2016, 3, 19–38. [Google Scholar] [CrossRef]
- Meira Neto, A.A.; Oliveira, P.T.S.; Rodrigues, D.B.B.; Wendland, E. Improving Streamflow Prediction Using Uncertainty Analysis and Bayesian Model Averaging. J. Hydrol. Eng. 2018, 23, 05018004. [Google Scholar] [CrossRef]
- Melo, D.C.D.; Marin, I.S.P.; Wendland, E. Water budget comparison of global climate models and experimental data in Onça Creek basin, Brazil. Proc. Int. Assoc. Hydrol. Sci. 2014, 364, 70–75. [Google Scholar] [CrossRef]
- Oliveira, P.T.S.; Wendland, E.; Nearing, M.A.; Scott, R.L.; Rosolem, R.; da Rocha, H.R. The water balance components of undisturbed tropical woodlands in the Brazilian cerrado. Hydrol. Earth Syst. Sci. 2015, 19, 2899–2910. [Google Scholar] [CrossRef] [Green Version]
- Hunt, E.D.; Svoboda, M.; Wardlow, B.; Hubbard, K.; Hayes, M.; Arkebauer, T. Monitoring the effects of rapid onset of drought on non-irrigated maize with agronomic data and climate-based drought indices. Agric. For. Meteorol. 2014, 191, 1–11. [Google Scholar] [CrossRef]
- Zhou, G.Y.; Morris, J.D.; Yan, J.H.; Yu, Z.Y.; Peng, S.L. Hydrological impacts of reafforestation with eucalypts and indigenous species: A case study in southern China. For. Ecol. Manag. 2002, 167, 209–222. [Google Scholar] [CrossRef]
- Wendland, E.; Barreto, C.; Gomes, L.H. Water balance in the Guarani Aquifer outcrop zone based on hydrogeologic monitoring. J. Hydrol. 2007, 342, 261–269. [Google Scholar] [CrossRef]
- Coes, A.L.; Spruill, T.B.; Thomasson, M.J. Multiple-method estimation of recharge rates at diverse locations in the North Carolina Coastal Plain, USA. Hydrogeol. J. 2007, 15, 773–788. [Google Scholar] [CrossRef]
- Delottier, H.; Pryet, A.; Lemieux, J.M.; Dupuy, A. Estimating groundwater recharge uncertainty from joint application of an aquifer test and the water-table fluctuation method. Hydrogeol. J. 2018, 26, 2495–2505. [Google Scholar] [CrossRef]
- Lucas, M.; Oliveira, P.T.S.; Melo, D.C.D.; Wendland, E. Evaluation of remotely sensed data for estimating recharge to an outcrop zone of the Guarani Aquifer System (South America). Hydrogeol. J. 2015, 23, 961–969. [Google Scholar] [CrossRef]
- Allen, R. Using the FAO-56 dual crop coefficient method over an irrigated region as part of an evapotranspiration intercomparison study. J. Hydrol. 2000, 229, 27–41. [Google Scholar] [CrossRef]
- Alves, M.E.B.; Mantovani, E.C.; Sediyama, G.C.; Neves, J.C.L. Estimate of the crop coefficient for Eucalyptus cultivated under irrigation during initial growth. Cerne 2013, 19, 247–253. [Google Scholar] [CrossRef] [Green Version]
- Mann, H.B. Nonparametric Tests Against Trend. Econometrica 1945, 13, 245–259. [Google Scholar] [CrossRef]
- Kendall, M.G. Rank Correlation Methods, 4th ed.; Griffin: London, UK, 1975; ISBN 9780852641996. [Google Scholar]
- Sen, P.K. Estimates of the Regression Coefficient Based on Kendall’s Tau. J. Am. Stat. Assoc. 1968, 63, 1379–1389. [Google Scholar] [CrossRef]
- Maréchal, J.C.; Dewandel, B.; Ahmed, S.; Galeazzi, L.; Zaidi, F.K. Combined estimation of specific yield and natural recharge in a semi-arid groundwater basin with irrigated agriculture. J. Hydrol. 2006, 329, 281–293. [Google Scholar] [CrossRef] [Green Version]
- Zhang, L.; Dawes, W.R.; Walker, G.R. Response of mean annual evapotranspiration to vegetation changes at catchment scale. Water Resour. Res. 2001, 37, 701–708. [Google Scholar] [CrossRef]
- Melo, D.d.C.D.; Scanlon, B.R.; Zhang, Z.; Wendland, E.; Yin, L. Reservoir storage and hydrologic responses to droughts in the Paraná River basin, south-eastern Brazil. Hydrol. Earth Syst. Sci. 2016, 20, 4673–4688. [Google Scholar] [CrossRef]
- Almeida, A.C.; Soares, J.V.; Landsberg, J.J.; Rezende, G.D. Growth and water balance of Eucalyptus grandis hybrid plantations in Brazil during a rotation for pulp production. For. Ecol. Manag. 2007, 251, 10–21. [Google Scholar] [CrossRef]
- Nosetto, M.D.; Jobbagy, E.G.; Paruelo, J.M. Land-use change and water losses: The case of grassland afforestation across a soil textural gradient in central Argentina. Glob. Chang. Biol. 2005, 11, 1101–1117. [Google Scholar] [CrossRef]
- Vital, A.R.; Lima, W. de P.; Camargo, F.R.A. Efeitos do corte raso de plantação de Eucalyptus sobre o balanço hídrico, a qualidade da água e as perdas de solo e de nutrientes em uma microbacia no Vale do Paraíba, SP. Sci. For. 1999, 5, 6–16. [Google Scholar]
- Van Dijk, A.I.J.M. Planted forests and water in perspective. For. Ecol. Manag. 2007, 251, 1–9. [Google Scholar] [CrossRef]
- Bruijnzeel, L.A. Hydrological functions of tropical forests: Not seeing the soil for the trees? Agric. Ecosyst. Environ. 2004, 104, 185–228. [Google Scholar] [CrossRef]
- Aranda, I.; Forner, A.; Cuesta, B.; Valladares, F. Species-specific water use by forest tree species: From the tree to the stand. Agric. Water Manag. 2012, 114, 67–77. [Google Scholar] [CrossRef] [Green Version]
- Hardie, M.; Mendham, D.; Corkrey, R.; Hardiyanto, E.; Maydra, A.; Siregar, S.; Marolop, R.; Wibowo, A. Effects of Eucalypt and Acacia plantations on soil water in Sumatra. New For. 2018, 49, 87–104. [Google Scholar] [CrossRef]
Figure 1.
Study area location (Onça Creek Basin) with water-table monitoring network.

Figure 2.
Schematic profile of the monitoring wells in the study area.

Figure 3.
Annual rainfall from 1980 to 2016 for the Center for Water Resources and Environmental Studies (CRHEA) station.
Figure 3.
Annual rainfall from 1980 to 2016 for the Center for Water Resources and Environmental Studies (CRHEA) station.

Figure 4.
Monthly trend analysis of mean groundwater levels measured in the monitoring wells to (a) pasture and (b) Eucalyptus periods.
Figure 4.
Monthly trend analysis of mean groundwater levels measured in the monitoring wells to (a) pasture and (b) Eucalyptus periods.

Figure 5.
(a) Groundwater level measured in the monitoring wells every 15 days from 2005 to 2016; (b) annual average water table as deviation from the historic mean; (c) Standard Precipitation Index (SPI) from 2005 to 2016. The error bar represents the amplitude of water level variation for each year.

Figure 6.
Annual groundwater recharge estimates by the water-table fluctuation (WTF) method.

Figure 7.
Annual and monthly evapotranspiration in the study area.

Figure 8.
Annual evapotranspiration estimated for Eucalyptus plantation and pasture compared to the relationships presented by [51].
Figure 8.
Annual evapotranspiration estimated for Eucalyptus plantation and pasture compared to the relationships presented by [51].

© 2019 by the authors. Licensee MDPI, Basel, Switzerland. This article is an open access article distributed under the terms and conditions of the Creative Commons Attribution (CC BY) license (http://creativecommons.org/licenses/by/4.0/).
Share and Cite
MDPI and ACS Style
Mattos, T.S.; Oliveira, P.T.S.d.; Lucas, M.C.; Wendland, E. Groundwater Recharge Decrease Replacing Pasture by Eucalyptus Plantation. Water 2019, 11, 1213. https://doi.org/10.3390/w11061213
AMA Style
Mattos TS, Oliveira PTSd, Lucas MC, Wendland E. Groundwater Recharge Decrease Replacing Pasture by Eucalyptus Plantation. Water. 2019; 11(6):1213. https://doi.org/10.3390/w11061213
Chicago/Turabian StyleMattos, Tiago Souza, Paulo Tarso Sanches de Oliveira, Murilo Cesar Lucas, and Edson Wendland. 2019. "Groundwater Recharge Decrease Replacing Pasture by Eucalyptus Plantation" Water 11, no. 6: 1213. https://doi.org/10.3390/w11061213
Note that from the first issue of 2016, this journal uses article numbers instead of page numbers. See further details here.