Typhoon Soudelor (2015) Induced Offshore Movement of Sand Dunes and Geomorphological Change: Fujian Coast, China
by
Haidong Li
1, 
Yunhai Li
1,2,*,
Binxin Zheng
1,
Guicai Zhong
1,
Hannv Zhang
1,
Hengbo Wang
1 and
Lei Qiao
3 1
Laboratory for Ocean & Coast Geology, Third Institute of Oceanography, Ministry of Natural Resources, Xiamen 361005, China
2
Laboratory for Marine Geology, Qingdao National Laboratory for Marine Science and Technology, Qingdao 266061, China
3
Department of Earth Science, Utah Valley University, Orem, UT 84058, USA
*
Author to whom correspondence should be addressed.
Water 2019, 11(6), 1191; https://doi.org/10.3390/w11061191
Submission received: 19 March 2019
/
Revised: 31 May 2019
/
Accepted: 3 June 2019
/
Published: 7 June 2019
(This article belongs to the Special Issue Observation and Numerical Modeling of Sediment Transport in Coastal Areas)
Abstract
:Typhoons play a significant role in the marine sedimentary dynamic process and thus could significantly change the submarine geomorphology in their influence area. In this study, a high-resolution sub-bottom profiler and a side-scan sonar were used to detect the submarine geomorphology of the southeast coastal area of Nanri Island in the Taiwan Strait before and after Typhoon Soudelor—three times in 2015. The results show that the typhoon induced seaward movement of the sand dunes up to several tens of meters, resulting in significant changes in both the shape of the sand dunes and the scale of the exposed bedrocks. The typhoon also changed the submarine geomorphology, including the smoothing of anchor traces of fishing boats and the formation of relatively small sand dunes (groups). A comparison of the results of different surveys shows that the submarine geomorphology that was changed by Typhoon Soudelor could not recover within a short period of time. The wind field simulations of the typhoon process showed that the storm wave caused by the strong wind stress of the typhoon was a key dynamic factor for changing the submarine geomorphology.
1. Introduction
Typhoons are one of the strongest air–sea interaction processes on the synoptic scale and can greatly change physical, chemical, biological, ecological, and sedimentary dynamic environments within a short period of time [1,2,3,4,5,6,7]. In an offshore area, the strong cyclonic wind stress of a typhoon can directly stir up submarine sediments, which induces transport and redistribution of the sediments, thus affecting the marine sedimentary dynamic process [2,8,9,10,11]. In fine-grained deposit regions, the cyclonic wind stress leads to re-suspension of large quantities of submarine sediments. As a result, the re-suspended sediments are carried by typhoon-induced currents and spread out over surrounding areas—this process is called sediment redistribution [10,12,13]. In coarse-grained sediment regions, the strong dynamic force of a typhoon can cause the movement of coarse-grained sediments, resulting in the formation and movement of submarine sand dunes as well as intensified erosion and accumulation, which finally lead to changes in the submarine geomorphology [2,14,15].
Although typhoons strongly affect the marine sedimentary dynamic process and submarine geomorphology, there have been very few studies on these fields based on in situ observations so far, due to limitations in predicting typhoon paths, lack of in situ observations because of adverse weather conditions during typhoons, and also human activities (such as fishery and aquaculture) in coastal areas that strongly restrict fixed-point mooring observations [4]. In addition, the typhoon process factors, including seasonality, path, intensity, and moving speed, vary significantly from one typhoon to another, affecting the sedimentary dynamic process and submarine geomorphology. Unfortunately, comparison studies of typhoons of different types are extremely scarce. All these limitations result in the current incomplete and imperfect system used to study the effects of typhoons on the sedimentary dynamic process and the associated submarine geomorphologic evolution. The current method mainly entails comparing the differences in the sediment properties (including sediment grain size, geochemistry, and paleomicrobes) and the submarine geomorphology before and after typhoons, to reflect the effects of typhoons on the sediment dynamic process and geomorphology, to assess their degrees of influence, and to discuss associated mechanisms by taking into account the marine dynamic environment [2,4,16,17].
The Taiwan Strait lies between the East China Sea and South China Sea and acts as a channel for substance and energy exchange between the two [18]. In addition, on the east side of the Taiwan Strait is Taiwan Island, and on its west side is mainland China, so the Taiwan Strait receives large quantities of terrestrial substances from both sides [19,20]. Affected by monsoons, marine currents, and geological processes, the sediment dynamic processes in the Taiwan Strait are quite complex and diverse. On the east side of the strait, strong erosion occurs on Taiwan Island and the rivers flowing into the sea are short-ranged rivers that have “pulsating”-type fluxes. The amount of transported sediment under extreme events (mainly summer typhoons) can cause an increase in sediment flow into the sea by 10- to 100-fold [21,22]. On the west side of the strait, the flux and transport of sediment into the sea are characterized by “summer storage and winter transport”—in summer, sediments are mainly deposited near the river mouth; in winter, under the influence of strong winter monsoons, sediments are re-suspended and carried by marine currents and spread out towards the south to form offshore mud sediment wedges [23,24,25]. Due to the “narrow tube effect” in the strait, the marine dynamics (including tidal currents) are relatively strong, and in turn, submarine sediments are continuously dug up and washed by the strong marine dynamic forces. As a result, fine-grained sediments are carried away and deposited in sea areas that have relatively weak hydrodynamic environments (mainly in the strait center and offshore of the strait), which forms mud sediment deposition regions, whereas the coarse-grained sediments are preserved and form sand sediments [18]. Moreover, the Taiwan Strait, which is located in the West Pacific Ocean, is in a typhoon-affected marine area; according to perennial averaged statistical data, three to four typhoons pass across or significantly affect the Taiwan Strait every year [19]. Thus, the Taiwan Strait is a natural laboratory for studying the effects of typhoons on sediment dynamics and geomorphological evolution processes.
Along the west coast of the Taiwan Strait, a number of rivers carry large quantities of sediments into the sea. The sediments are transported and deposited in offshore areas by the costal currents and form mud sediment systems [24,25]. The offshore areas to the north and east of Pingtan Island belong to the inner continental shelf mud sediment deposition region of the East China Sea, which extends along North-South (N-S) strikes for approximately 800 km. In the offshore sea areas that have small river fluxes into the sea, sand sediments exist, and the relatively closed spaces and strong tidal dynamics (in water less than 50 m deep) form sand dunes of different scales under the force of tidal currents. Southeast Nanri Island is a typical sand dune distribution region, and the sand dunes in this sea area strike Northeast-Southwest (NE-SW) with dune heights up to 4–5 m and wavelengths of approximately 50–100 m (Figure 1c). These sand dunes are formed mainly because: (1) the local rivers flowing into the sea from the surrounding areas contain quite low fluxes of sediments; (2) the transport of the sediments is obstructed by Pingtan Island and Nanri Island on the north side; and (3) fairly strong tidal currents exist in this sea area.
Typhoon Soudelor formed on the northwest Pacific Ocean on 30 July 2015. After its formation, it first started to move towards the west with rapid enhancement in strength. It then moved gradually toward the northwest on 2 August 2015 and became a super typhoon on 3 August 2015 (wind speed: 65 m/s), with a relatively stable moving direction and speed. In the early morning of 8 August 2015, Soudelor landed at Hualian, Taiwan (the maximum wind speed: 48 m/s), and then it passed across the Taiwan Strait at 22:00 on the same day (the maximum wind speed: 38 m/s). Later, Soudelor re-landed at Putian, Fujian, and gradually weakened while moving onto the inland. The weakened Soudelor was reduced to a tropical depression on 9 August 2015, and entered the Yellow Sea on 11 August 2015 (Figure 1a).
In the southeast offshore shallow-water areas (water depth less than 50 m) of Nanri Island on the northwest side of the Taiwan Strait, there are relatively large-scaled sand dunes with NE–SW strikes and large quantities of bedrock outcrops with complex and diverse geomorphologies. On 8 August 2015, Typhoon Soudelor went through this region. Three surveys were conducted, using a high-resolution sub-bottom profiler and a side-scan sonar to study the Soudelor enhanced offshore movement of sand dunes and submarine topographical variation. These observations can greatly advance our understanding and assessment of the effects of the typhoon dynamic process on submarine geomorphology.
2. Materials and Methods
To study the distribution and movement of sand dunes in the surrounding sea areas of Nanri Island, we conducted three joint detections along the southeast side of Nanri Island, using a high-resolution sub-bottom profiler (EdgeTech 3100 P Chirp Sonar Sub-bottom Profiler, Edge Tech. Inc., West Wareham, MA, USA: frequency range: 2–12 kHz/20 ms; dune-speed width: 20°; acoustic velocity: 1500 m/s; maximum vertical resolution: 8 cm; and maximum penetrating depth of the clay substrate: 90 m) and a digital side-scan sonar (KLEIN 3000 side-scan sonar, Klein Associates Inc., Great Neck, NY, USA: frequency: 100 kHz/500 kHz, double-channel synchronous operation, independent control; unilateral range: 150 m at 100 kHz, 600 m at 500 kHz; horizontal beam width: 1° at 100 kHz, 0.2° at 500 kHz; vertical beam width: 40°; and default angle down: −15°) using a modified fishing boat. During the surveys, the side-scan sonar was hung on the starboard side of the modified fishing boat with the DGPS (Differential Global Positioning System) probe located directly above its towfish. The sub-bottom profiler was towed behind the boat on the starboard side, with a trailing distance of about 3 m and a trailing distance of about 15 m from the towfish to the DGPS antenna. Under normal sailing conditions, the towing cables of the side-scan sonar and the sub-bottom profiler were in a tight state. In order to reduce the position deviation of repeated measurements, three surveys were carried out in the same modified fishing boat, with the same instruments and the same installation method.
The first survey was conducted from 5 August 2015 to 8 September 2015, and the sub-bottom profile and side-scan sonar measurements were taken along two measurement lines (S: 11.18 km; L: 10.21 km) when the sea was quiet. On 8 August 2015, Typhoon Soudelor (wind speed: 38 m/s; force 10 wind circle radius: 60–150 km; and the nearest distance of the typhoon center to the study area: 20–30 km) went near the study area (Figure 1b). After the typhoon’s effects complete dissipated, on 19 August 2015, we re-conducted the detections along the two measurement lines, using exactly the same methods. On 23 September 2015, the third survey was conducted in the study area to determine the extent to which the typhoon-induced geomorphological change recovered (Figure 1e). In the comparative study, we used the morphology and distribution of the submarine bedrocks as references to minimize the positioning errors, in addition to accurate navigation (Trimble AgGPS AgGPS 332 DGPS, Trimble Inc., Sunnyvale, CA, USA: horizontal positioning accuracy: <1 m; and position update rate: 5 Hz). During the third survey, the sub-bottom profiler failed after the acquisition of the S section, so we could not measure the L section. Subsequently, we conducted a full survey of the study area using a digital side-scan sonar and collected 32 surface sediment samples using a grab sampler. We analyzed the grain sizes of the collected surface sediments using the sieve method and a laser diffraction particle size analyzer.
A multibeam echosounder (SeaBat7125, Reson Inc., Slangerup, Denmark: working frequency: 200 kHz, beam number: 512, beam width: 1° × 2°, scan width: 140°, scan frequency: 50 Hz, depth resolution: 6 mm) was used to obtain detailed geomorphological data in the sand dunes area on 25–27 July 2017 (Figure 1c-1).
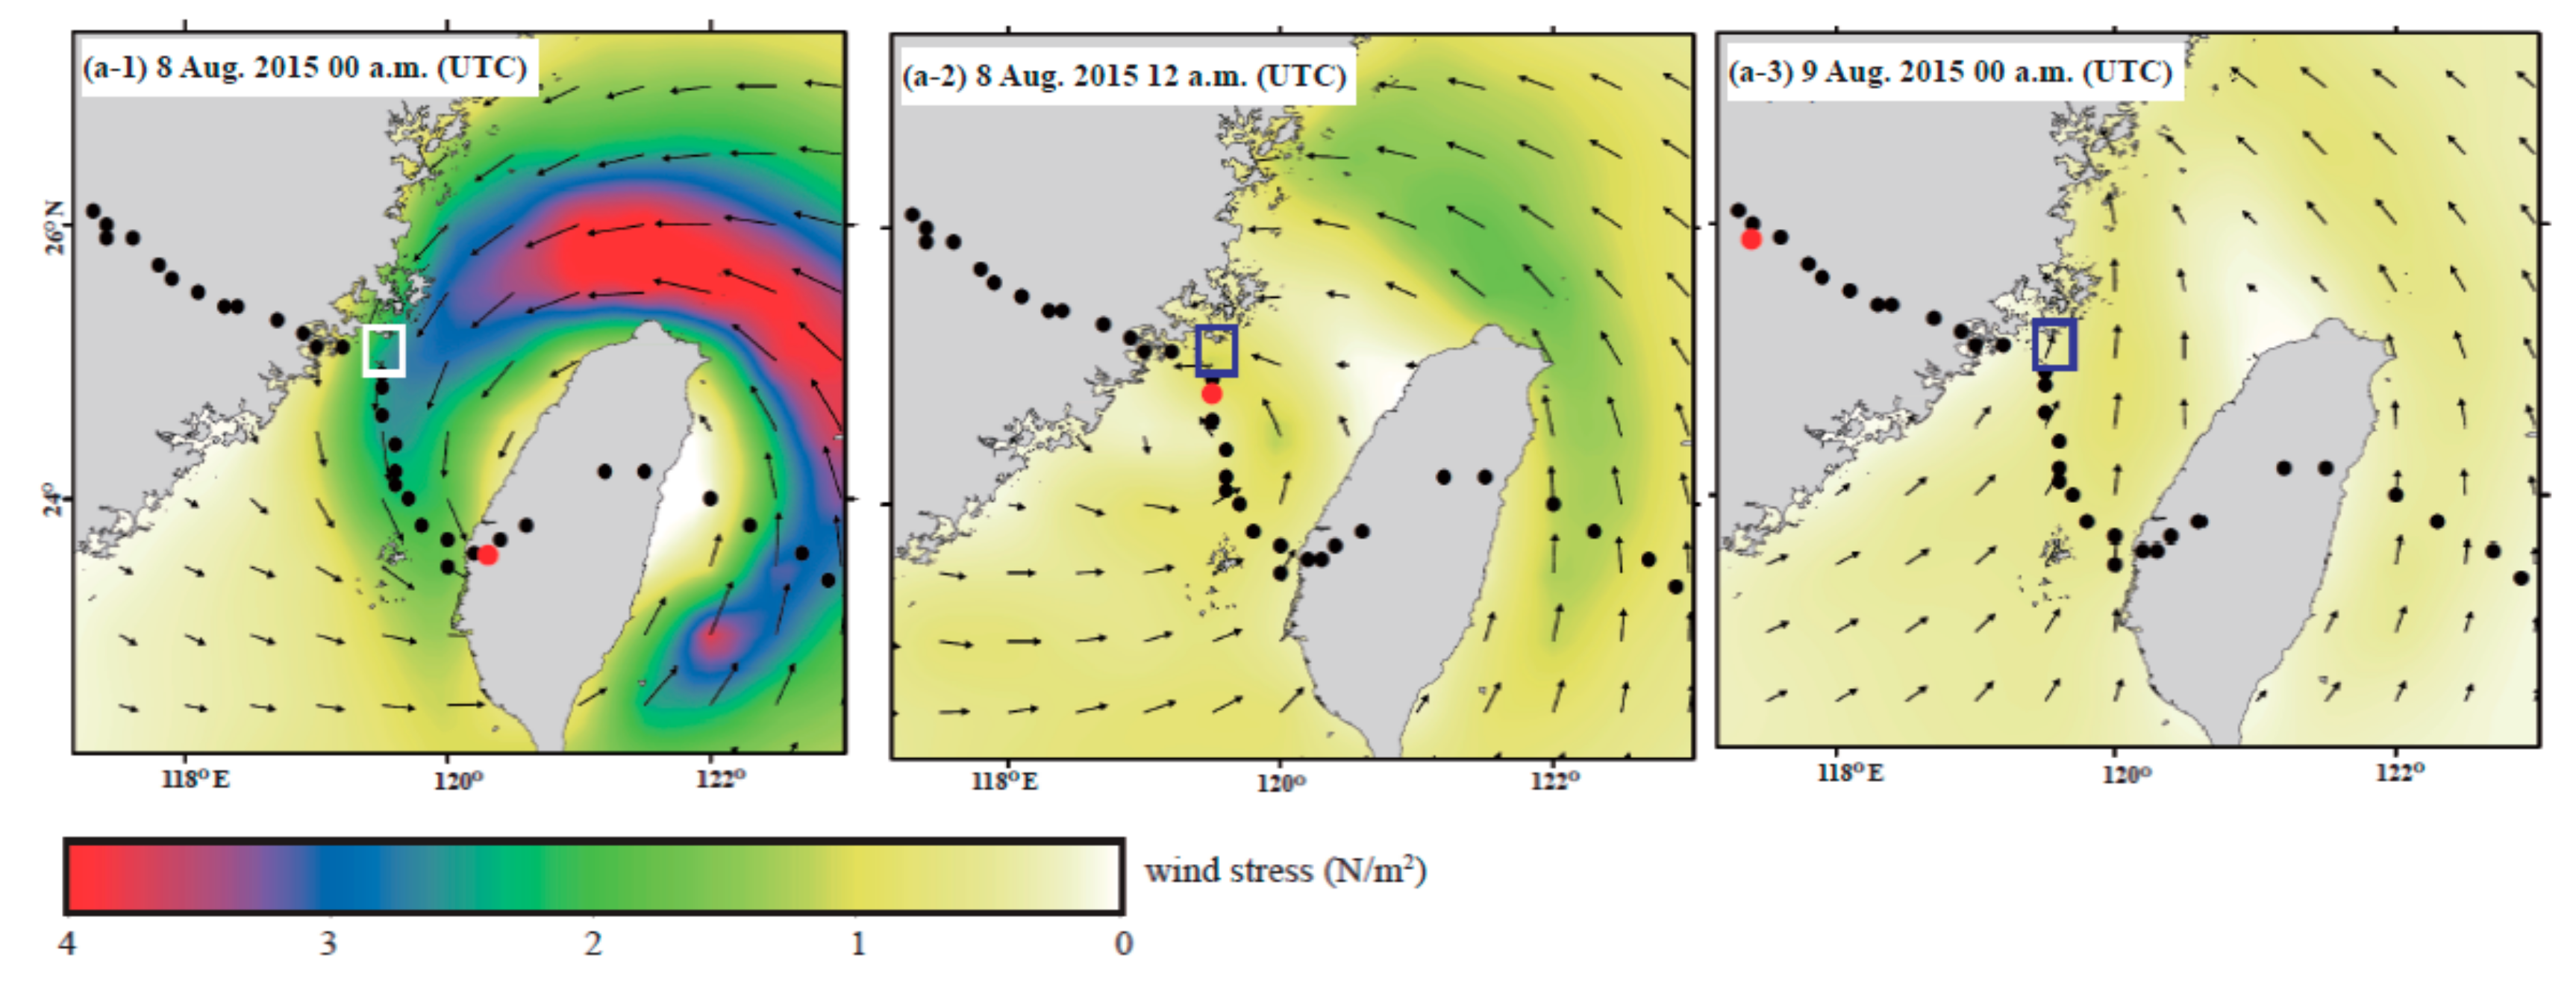
The wind field data for the Taiwan Strait during Typhoon Soudelor were obtained from the NOAA (National Oceanic and Atmospheric Administration) wind field database (NCDC-Eclipse THREDDS Data Server at http://www.ncdc.noaa.gov/thredds) with a resolution of approximately 0.25° × 0.25° per pixel. The wind stress was calculated based on the downloaded primary wind field data, according to previous studies. The distributions of wind stress in the Taiwan Strait on 8 August 2015 00 a.m., 8 August 2015 12 a.m., and 9 August 2015 00 a.m., were drawn using Surfer (version 11.6).
3. Results
The side-scan sonar results show large-scale en echelon-lined sand dune groups, which are mainly distributed in the central and northwest parts of the study area with NE–SW strikes (Figure 1c,d). The length of the sand dunes varies but usually is approximately 500–2000 m, with the distance between sand dunes being approximately 200–1000 m. Some of the submarine bedrocks are directly exposed to the seabed, especially near the offshore areas of Nanri Island. With increasing water depth, the exposed area of bedrocks gradually decreases (Figure 1c,d).
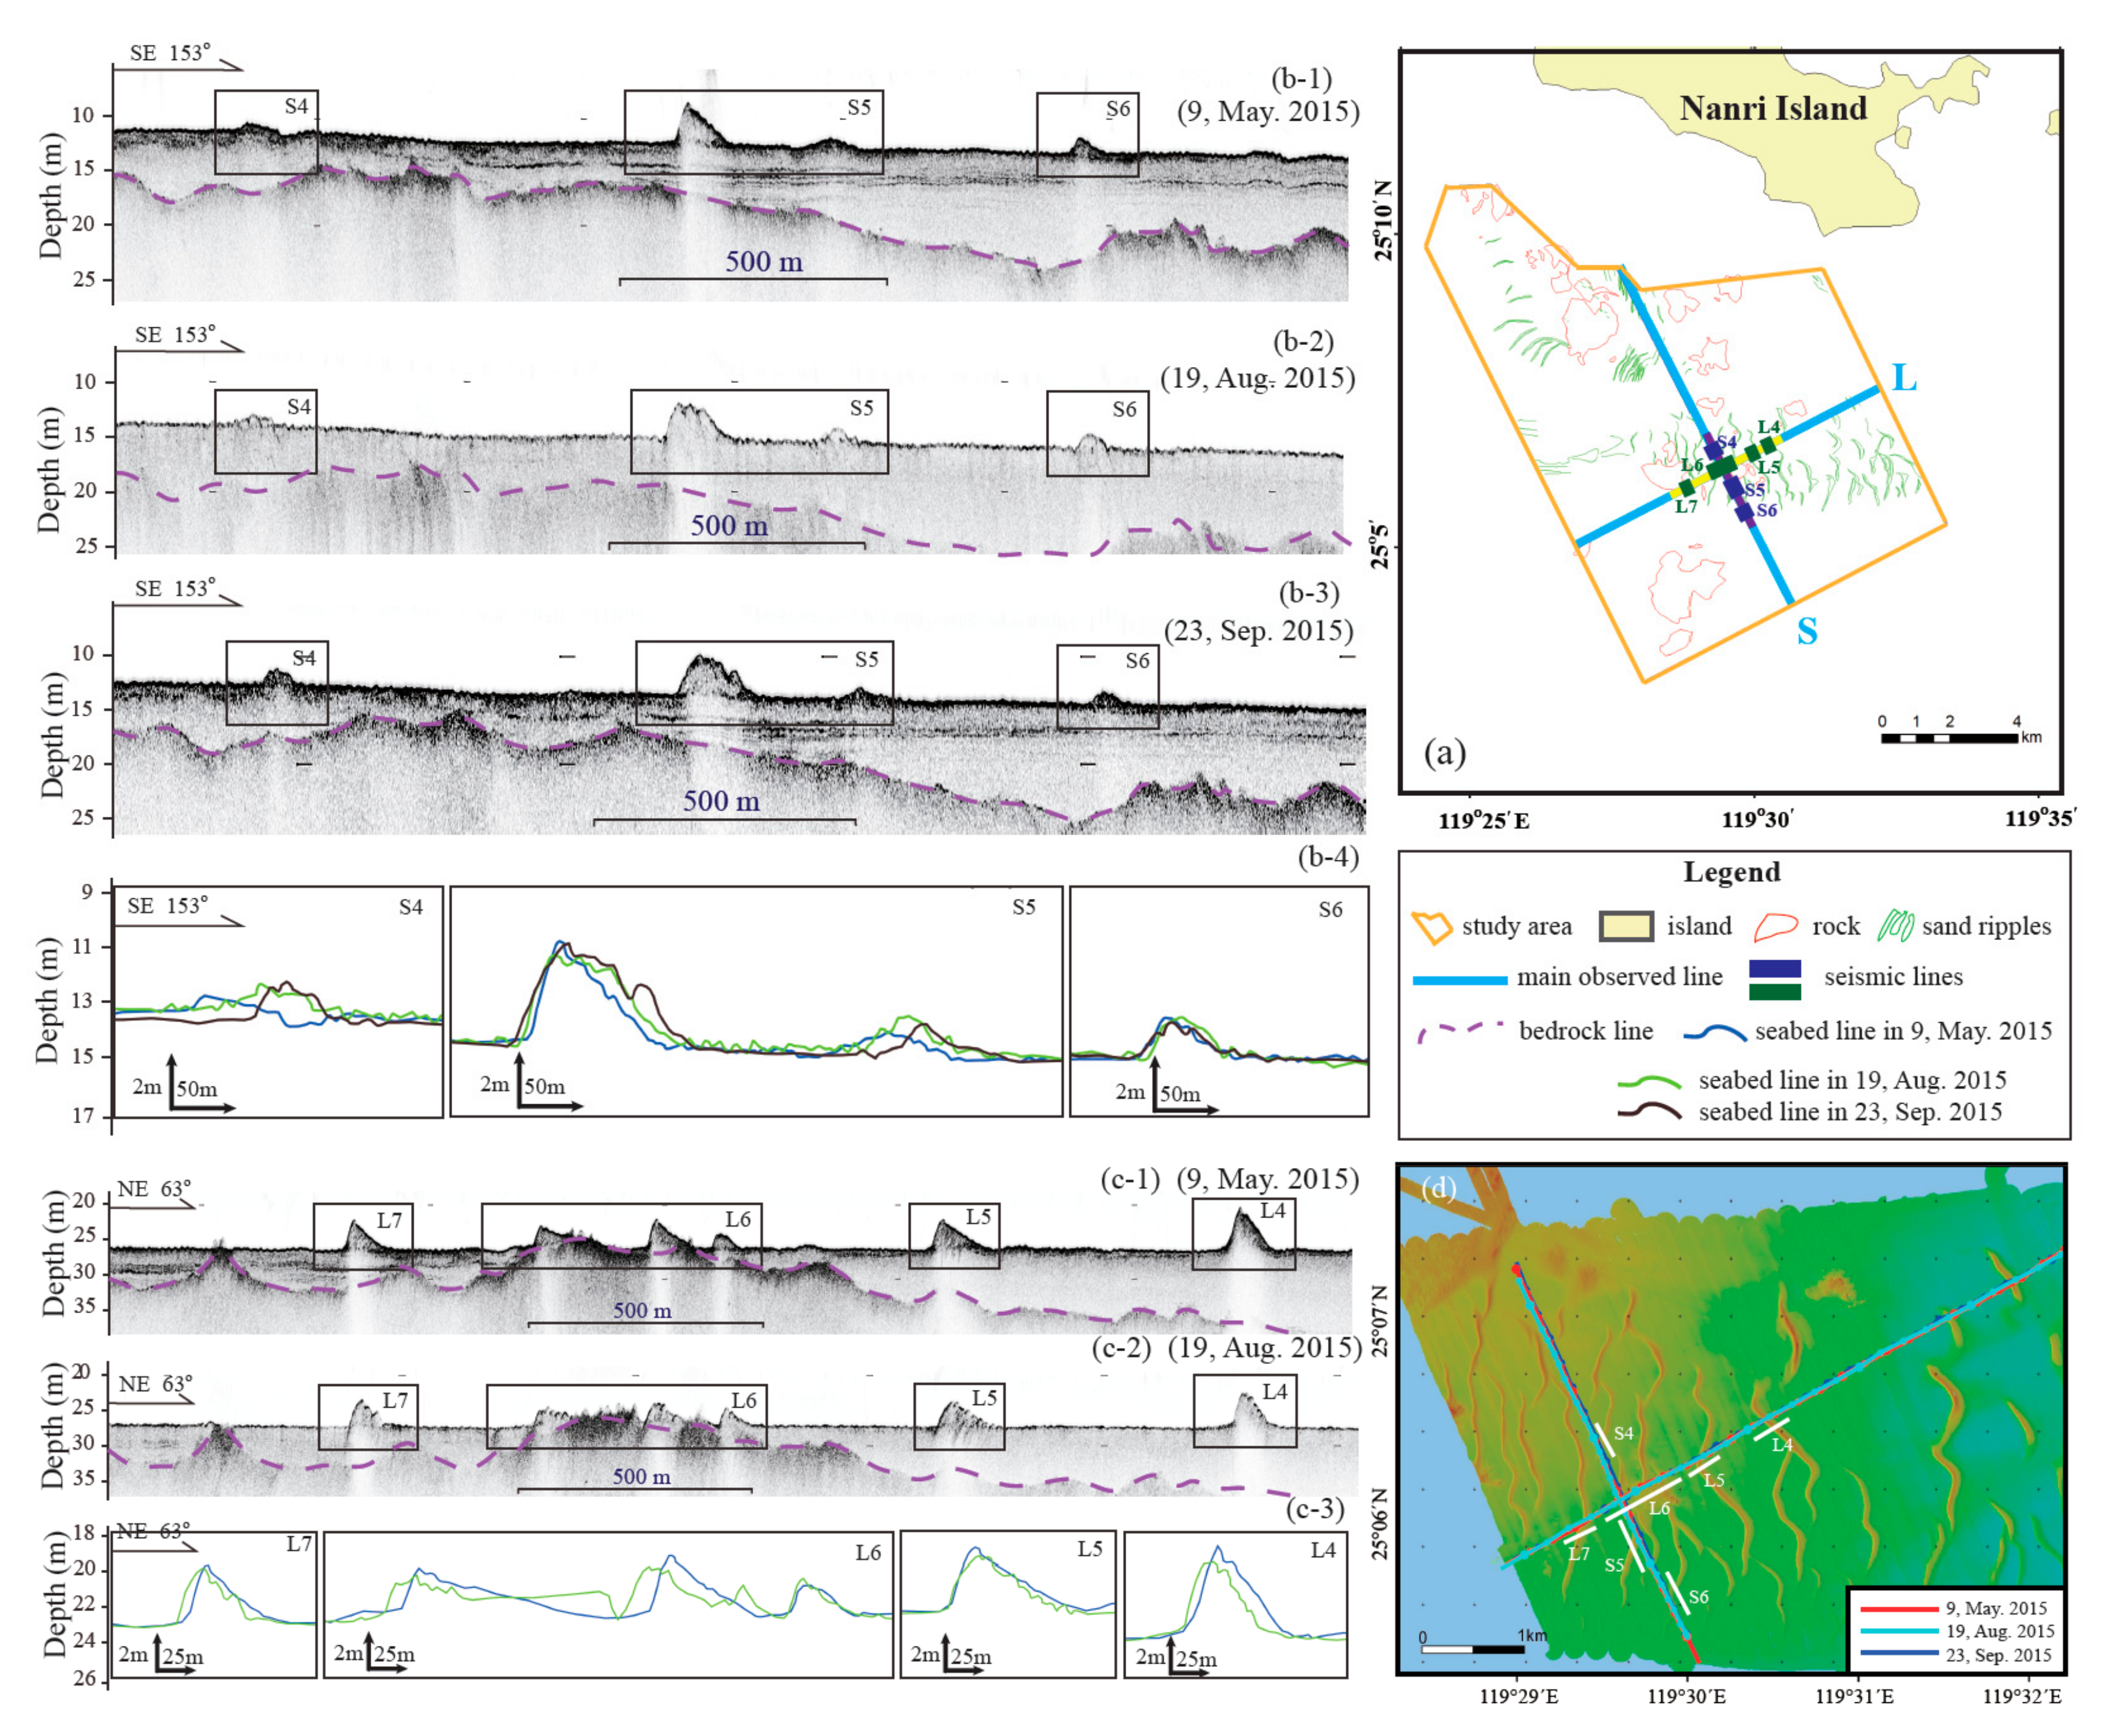
The detection results by the sub-bottom profiler show that the sand dune groups are mainly distributed above the bedrocks as a thin sediment layer (Figure 2). The sediment layer is generally less than 20 m in depth, without clear stratigraphic sequences. Part of the marine bedrocks is directly exposed to the seabed. The submarine sand dunes are usually less than 4 m in height, with a wavelength of approximately 50–100 m and a distance between the sand dunes of approximately 200–1000 m, which is characterized by an asymmetric morphology (Figure 2).
The analysis of the surface sediment grain sizes shows that sediments around the sand dune groups are quite coarse and mainly composed of sand and gravel (Figure 1d). With increasing water depth, the grain size of the sediments gradually becomes finer sandy silt (Figure 1d). In between the sand dune troughs and the sand dune groups, sediments are even finer, and clay silt appears in part of the deep-water area (Figure 1d). The relatively coarse-grained sand/gravel and the relatively fine-grained clay silt are well sorted, with the grain size distribution showing a single peak (Figure 1d). On the other hand, the distribution of the sand silt is relatively worse, with the grain size distribution showing double peaks (Figure 1d), which signifies that the coarse-grained sand/gravel is transported as bed load, while the fine-grained sand silt and clay are transported as suspension load.
High-resolution sub-bottom profiler lines go across the sand dunes. The central measurement line S, which was nearly perpendicular to the shoreline, passed across three sand dunes (groups S4, S5, and S6), which show asymmetric morphologies that are quite steep along the NW (shallow water) direction but relatively flatter along the SE (deep-water) direction (Figure 2b). The central measurement line L, which was nearly parallel to the shoreline, passed across four sand dunes (groups L4, L5, L6, and L7), which also show asymmetric morphologies that are steeper on the west side and flatter on the east side (Figure 2c).
Regarding the detection results at different times (three times for the measurement line S and two times for the measurement line L), the geomorphology and location of the sand dunes show significant variations (by using the morphology and distribution of the submarine bedrocks as references), while the measuring lines of different times basically coincide, with mostly less than 10 m apart (Figure 2d). Ten days after the typhoon, the height of the sand dunes was reduced compared with the height before the typhoon, with slightly increased sand dune wavelength (Figure 2b-4,c-3). A more significant difference is that on the stoss side of the sand dunes, relatively small-scaled secondary sand dune groups (S5 and L6) were newly formed (Figure 2b-4,c-3). They were distributed with an irregular zigzag pattern, with a height of approximately 0.5 m. In the S section, whole sand dunes moved towards the SE direction, with a movement distance ranging from several (S5-1 and S6) to several tens of meters (S4 and S5-2) (Figure 2c). In the L section, whole sand dunes also moved towards the SE direction by several meters (L4–L7) (Figure 2b). Approximately one and a half months after the typhoon, the morphology and location of the submarine sand dunes in the study area showed no significant variations, but the sand dune wavelength decreased compared with the wavelength right after the typhoon (Figure 2b-4,c-3).
According to the results given above, we can summarize that after a strong dynamic typhoon process, whole submarine sand dunes move towards the deep-water region, i.e., the southwest direction of the study area, by up to several tens of meters perpendicular to the shoreline by several meters parallel to the shoreline. Furthermore, the sand dune morphology was also significantly changed, such that the sand dunes became relatively lower and longer, with relatively small-scaled zigzag-shaped sand dune groups forming on the stoss side of the sand dunes (Figure 2b-4,c-3).
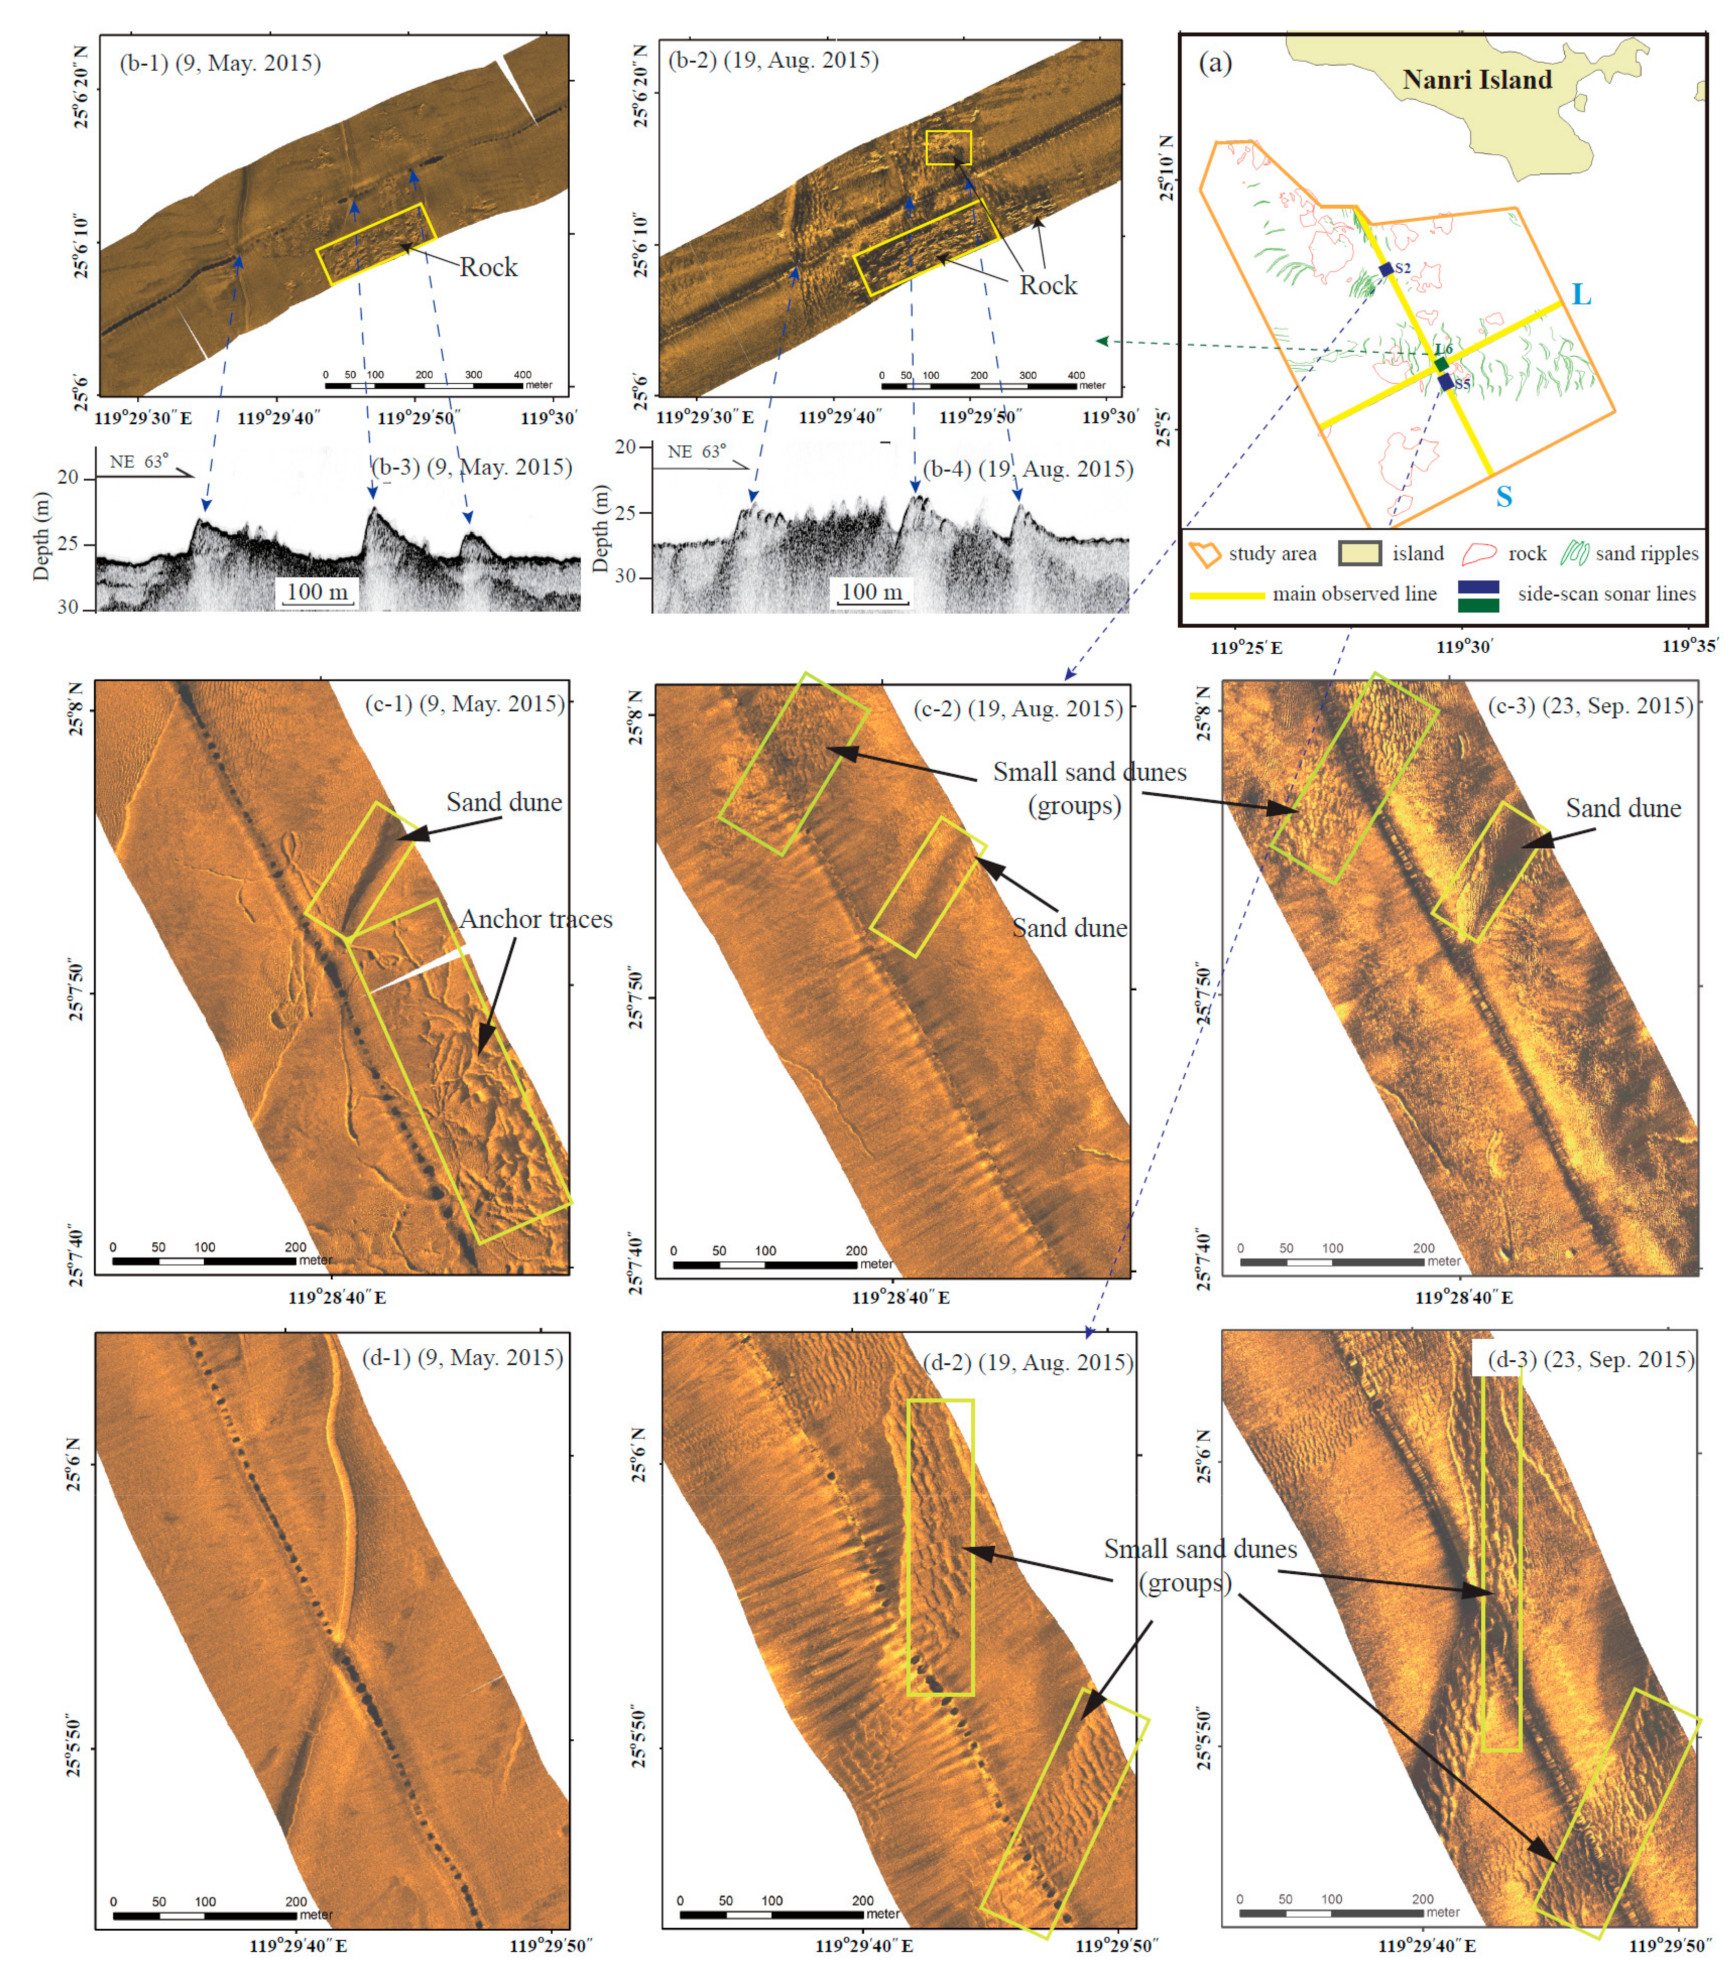
The typhoon process significantly influenced the submarine geomorphology in the study area (Figure 3). Prior to the typhoon, the sand dunes (groups) and the submarine geomorphology and distribution of the exposed bedrocks can be clearly seen in the side-scan sonar images, which are consistent with the detection results from the sub-bottom profiler (Figure 3). The side-scan sonar images show that ten days after the typhoon, the submarine sand dunes (groups) and the exposed area of bedrocks were clearly enlarged and that numerous secondary sand dunes (groups) appeared on the stoss side of the sand dunes, which is also reflected in the sub-bottom profiles (Figure 3). One and a half months after the typhoon, the images of the submarine sand dunes (including secondary sand dune groups) were similar to those collected ten days after the typhoon (Figure 3). In the submarine sand flat region, the seabed was relatively smooth and flat prior to the typhoon. The side-scan sonar images reveal visible small-scaled sand dunes and anchor traces from fishing boats (Figure 3c). In comparison, ten days after the typhoon landing, the anchor traces of fishing boats on the seabed were erased and smoothed; small-scaled submarine sand dunes prior to the typhoon were further developed and echelon-lined sand dune groups formed and still clearly existed one and a half months after the typhoon (Figure 3).
4. Discussion and Conclusions
Accurate repeated observation is the key to guaranteeing comparative study of geomorphological evolution. Slight line inconsistencies between the two surveys may result in obvious differences in geomorphological profiles, especially in the 2D Chirp profiles, which might bring significant errors to our study results. In this case, we used the geomorphology and distribution of the submarine bedrocks as references to minimize the errors, in addition to high-resolution accurate navigation. The locations and morphology of the bedrocks varied relatively less than that of the sand dunes in different surveys, which also shows the true migration of the sand dunes caused by Typhoon Soudelor. In our study, although the migration velocity of the sand dunes and slight geomorphological changes could not be accurately calculated due to the absence of multibeam bathymetry data, we can still find that Typhoon Soudelor had a significant impact on submarine geomorphology and sand dune migration, according to the sub-bottom profiler and side-scan sonar data (Figure 2 and Figure 3).
A comparison of the results given by the high-resolution sub-bottom profiler and the side-scan sonar illustrates that Typhoon Soudelor greatly affected the distribution of sand dunes (groups), and submarine geomorphology in the study area (Figure 2 and Figure 3). After the typhoon, the submarine sand dunes (groups) moved in the direction of the deep water by several tens of meters (Figure 2). The sand dune geometry was changed such that: (1) the sand dune height was reduced; (2) secondary sand dune groups formed on the stoss side of the sand dunes; and (3) sand dunes and exposed bedrocks were distributed over larger areas (Figure 2). In addition, the submarine geomorphology was also significantly changed, including smoothed fishing boat anchor traces and the formation of small-scale secondary sand dune groups (Figure 3). All these geomorphological changes remained during the post-typhoon observation period (one and a half months).
The submarine sediments were mainly composed of coarse-grained sand/gravel in the study area (Figure 1d), and the transport method of these sediments mainly included a bed load movement. As a result, moving these grains requires a relatively high starting flowing speed, which results in great difficulties in transporting these grains. Influenced by monsoons and ocean circulations, the offshore marine dynamic environment of the Taiwan Strait is relatively weak in the summer and becomes stronger in the winter, thus forming a sediment dynamic pattern of “summer storage and winter transport” near the shores of the Taiwan Strait [24,26]. Under normal marine conditions in the summer, the hydrodynamic force in the study area is relatively weak, so the submarine sand dunes cannot be moved on a large scale. In an extreme dynamic typhoon process, the strong cyclonic wind stress overturns the original flow structure and forms short-term typhoon-induced currents. Meanwhile, the typhoon-induced storm waves by strong cyclonic winds can directly stir the submarine sediments, inducing re-suspension and re-transport of unconsolidated submarine sediments [8,12,13]. This strong dynamic process changes the water body (dynamic) structure and affects the suspension, transport, and distribution of sediments, thus resulting in changes in the marine sedimentation process and submarine geomorphology (i.e., movement of sand dunes and geomorphological changes). In sea areas with sufficient substance supplies (i.e., river mouths and bays), the strong dynamic process can form deposit strata caused by a typhoon event [2,4,17].
The wind stress calculation result shows that during the active period of Typhoon Soudelor, a typical cyclonic wind stress field formed in the Taiwan Strait, and the maximum wind stress reached 3–4 N/m2, which is one order of magnitude higher than the wind stress a quiet summer sea conditions (Figure 4). The strong wind stress can induce transport of submarine sediments, which in turn causes the movement of submarine sand dunes. According to classic marine sediment dynamic theory, a strong dynamic force can erode the stoss side of a sand dune [2]. The small dunes were oblique and not parallel to the large dunes and the large dunes migrated towards the NW, while the small dunes migrated to the SW after the typhoon process (Figure 2 and Figure 3), which suggests that the small dunes were formed by the typhoon related currents that re-transported the sand of the large dunes and formed these superimposed small dunes and migration in the direction of the wind (Figure 4). In regions with exposed submarine bedrocks, the strong dynamic force can erode the sediments surrounding the bedrocks (including coarse-grained sand/gravel), enlarging the exposed area of the submarine bedrocks (Figure 3b). Meanwhile, typhoons can cause movement of the submarine sediments and thus smooth the anchor traces of fishing boats on the seabed (Figure 3c). One and a half months after the typhoon, the submarine geomorphology showed significant differences compared to the geomorphology prior to the typhoon, but it was similar to the geomorphology ten days after the typhoon (Figure 2 and Figure 3). This indicates that the dynamic environment under normal summer sea conditions does not significantly change the submarine geomorphology, while the marine conditions during extreme typhoon events can greatly change the submarine geomorphology within short periods of time. Thus, the effect of a typhoon event on submarine geomorphology cannot be easily erased within a short period of time under normal summer marine dynamic conditions.
A strong typhoon dynamic force can result in the redistribution of submarine sediments and affect the sedimentary processes in marine areas, thus inducing significant alteration of the submarine geomorphology [14,15,27]. Large-scale changes of the submarine geomorphology (including rapid erosion and accumulation and wide range transport of sand dunes) and a sharp increase in the sediment transport flux, in fact, threaten the stability of marine geological environments. In river mouths, bays, and submarine canyons with abundant sediments supplies, submarine instabilities by typhoons can enhance sediment particles fluxes (including gravity flows) and cause damage for marine navigation (e.g., sudden sedimentation in the navigation channel) [28] and damage submarine infrastructures (submarine cables and pipelines) [29]. Thus, it is of great importance to investigate the effects of typhoons on submarine geomorphology, to facilitate the study of the marine sediment dynamic process under the influence of extreme events and the associated mechanisms. High-resolution modern marine geophysical detection techniques provide a new effective method to study the effect of typhoons on the modern marine sediment dynamic process [2,4].
In summary, this study used the high-resolution Chirp sonar sub-bottom profiler and side-scan sonar to determine the Typhoon Soudelor-induced offshore movement of sand dunes and submarine geomorphological changes. Our results showed that the typhoon process can significantly change submarine geomorphology along the typhoon path within a short period of time, and that such changes cannot quickly recover (within one and a half months). Wind field simulations showed that the strong cyclonic wind stress accompanying a typhoon is a key dynamic force for reshaping the submarine geomorphology. Conducting multidisciplinary fixed-point mooring observations, including marine sediment dynamics, is an important method to further study the effect of the typhoon process on submarine geomorphology, and subsequent recovery. Mooring observations allow researchers to investigate the associated mechanisms, assess the degree of influence and potential geological hazards, and conduct research on the effects of factors, including seasonality, path, intensity, and moving speeds. The usage of a multibeam echosounder system has unique advantages in the accurate study of sand dune movement and geomorphological changes. The studies of the evolution of sand dunes and its influencing factors would integrate the applications of a multibeam echosounder system, sub-bottom profiler, side-scan sonar, and mooring hydrodynamic observations system. In the in situ measurements, accurate navigation observations using the same instruments with the same installation method is the key to the comparative study of geomorphological evolution. In-depth studies in the future would also focus on the impact of extreme typhoon events and human activities (e.g., bottom trawling and sand excavation) on geomorphological changes and sand dune movement.
Author Contributions
H.L. and Y.L. designed the study and wrote the manuscript. H.L., G.Z., H.Z., and H.W. performed the experiments, contributed to the data analysis and prepared some figures. B.Z. helped to deal with the remote sensing data and explain the dynamic of wind on the sand dunes movement. L.Q. contributed to the interpretation and revised the manuscript.
Funding
This work was supported by the National Science Foundation of China (41676028), the National Programme on Global Change and Air-Sea Interaction (GASI-GEOGE-03), and the Scientific Research Foundation of the Third Institute of Oceanography, MNR (TIO2013026, TIO2014016).
Acknowledgments
This manuscript benefited from comments by editor and three anonymous reviewers.
Conflicts of Interest
The authors declare no conflict of interest.
References
- Bianchi, T.S.; Grace, B.L.; Carman, K.R.; Maulana, I. Amino acid cycling in the mississippi river plume and effects from the passage of hurricanes Isadore and Lili. J. Mar. Syst. 2014, 136, 10–21. [Google Scholar] [CrossRef]
- Goff, J.A.; Allison, M.A.; Gulick, S.P.S. Offshore transport of sediment during cyclonic storms: Hurricane Ike (2008), Texas Gulf Coast, USA. Geology 2010, 38, 351–354. [Google Scholar] [CrossRef]
- Li, Y.; Li, D.; Fang, J.; Yin, X.; Li, H.; Hu, W.; Chen, J. Impact of typhoon morakot on suspended matter size distributions on the east China sea inner shelf. Cont. Shelf Res. 2015, 101, 47–58. [Google Scholar] [CrossRef]
- Li, Y.; Li, H.; Qiao, L.; Xu, Y.; Yin, X.; He, J. Storm deposition layer on the fujian coast generated by typhoon saola (2012). Sci. Rep. 2015, 5, 14904. [Google Scholar] [CrossRef] [PubMed]
- Lin, I.-I.; Liu, W.T.; Wu, C.-C.; Chiang, J.C.H.; Sui, C.-H. Satellite observations of modulation of surface winds by typhoon-induced upper ocean cooling. Geophys. Res. Lett. 2003, 30, 1131. [Google Scholar] [CrossRef]
- Meyers, P.C.; Shay, L.K.; Brewster, J.K.; Jaimes, B. Observed ocean thermal response to hurricanes Gustav and Ike. J. Geophys. Res. 2016, 121, 162–179. [Google Scholar] [CrossRef]
- Wu, X.; Wang, H.; Bi, N.; Song, Z.; Zang, Z.; Kineke, G.C. Bio-physical changes in the coastal ocean triggered by typhoon: A case of typhoon meari in summer 2011. Estuar. Coast. Shelf Sci. 2016, 183, 413–421. [Google Scholar] [CrossRef]
- Dalyander, P.S.; Butman, B. Characteristics of storms driving wave-induced seafloor mobility on the US east coast continental shelf. Cont. Shelf Res. 2015, 104, 1–14. [Google Scholar] [CrossRef]
- Li, Y.; Wang, A.; Qiao, L.; Fang, J.; Chen, J. The impact of typhoon morakot on the modern sedimentary environment of the mud deposition center off the Zhejiang-Fujian coast, China. Cont. Shelf Res. 2012, 37, 92–100. [Google Scholar] [CrossRef]
- Palinkas, C.M.; Halka, J.P.; Li, M.; Sanford, L.P.; Cheng, P. Sediment deposition from tropical storms in the upper chesapeake bay: Field observations and model simulations. Cont. Shelf Res. 2014, 86, 6–16. [Google Scholar] [CrossRef]
- Ross, C.B.; Gardner, W.D.; Richardson, M.J.; Asper, V.L. Currents and sediment transport in the mississippi canyon and effects of hurricane georges. Cont. Shelf Res. 2009, 29, 1384–1396. [Google Scholar] [CrossRef]
- Ralston, D.K.; Warner, J.C.; Geyer, W.R.; Wall, G.R. Sediment transport due to extreme events: The hudson river estuary after tropical storms Irene and Lee. Geophys. Res. Lett. 2013, 40, 5451–5455. [Google Scholar] [CrossRef]
- Wren, P.A.; Leonard, L.A. Sediment transport on the mid-continental shelf in Onslow Bay, North Carolina during hurricane Isabel. Estuar. Coast. Shelf Sci. 2005, 63, 43–56. [Google Scholar] [CrossRef]
- Armaroli, C.; Grottoli, E.; Harley, M.D.; Ciavola, P. Beach morphodynamics and types of foredune erosion generated by storms along the Emilia-Romagna coastline, Italy. Geomorphology 2013, 199, 22–35. [Google Scholar] [CrossRef]
- Goff, J.A.; Allison, M.A.; Gulick, S.P.S.; Reece, R.; Davis, M.; Duncan, D.; Saustrup, S. Shoreface ravinement evolution tracked by repeat geophysical surveys following hurricane Ike, Bolivar Peninsula, Texas, 2008–2013. Geophysics 2015, 80, WB1–WB10. [Google Scholar] [CrossRef]
- Allison, M.A.; Dellapenna, T.M.; Goni, M.A.; Sheremet, A. Impact of hurricanes Katrina and Lili on the inner shelf of the mississippi-atchafalaya delta. Coast. Sediments 2007, 7, 882–887. [Google Scholar]
- Milliman, J.D.; Kao, S.-J. Hyperpycnal discharge of fluvial sediment to the ocean: Impact of super-typhoon herb (1996) on Taiwanese rivers. J. Geol. 2005, 113, 503–516. [Google Scholar] [CrossRef]
- Horng, C.-S.; Huh, C.-A. Magnetic properties as tracers for source-to-sink dispersal of sediments: A case study in the Taiwan Strait. Earth Planet. Sci. Lett. 2011, 309, 141–152. [Google Scholar] [CrossRef]
- Li, Y.; Xu, X.; Yin, X.; Fang, J.; Hu, W.; Chen, J. Remote-sensing observations of Typhoon Soulik (2013) forced upwelling and sediment transport enhancement in the northern Taiwan Strait. Int. J. Remote Sens. 2015, 36, 2201–2218. [Google Scholar] [CrossRef]
- Xu, K.; Milliman, J.D.; Li, A.; Liu, J.P.; Kao, S.-J.; Wan, S. Yangtze- and Taiwan-derived sediments on the inner shelf of east China sea. Cont. Shelf Res. 2009, 29, 2240–2256. [Google Scholar] [CrossRef]
- Dadson, S.J.; Hovius, N.; Chen, H.; Dade, W.B.; Hsieh, M.-L.; Willett, S.D.; Hu, J.-C.; Horng, M.-J.; Chen, M.-C.; Stark, C.P.; et al. Links between erosion, runoff variability and seismicity in the Taiwan orogen. Nature 2003, 426, 648–651. [Google Scholar] [CrossRef] [PubMed]
- Liu, J.T.; Kao, S.J.; Huh, C.A.; Hung, C.C. Gravity flows associated with flood events and carbon burial: Taiwan as instructional source area. Annu. Rev. Mar. Sci. 2013, 5, 47–68. [Google Scholar] [CrossRef] [PubMed]
- Liu, J.P.; Li, A.C.; Xu, K.H.; Velozzi, D.M.; Yang, Z.S.; Milliman, J.D.; DeMaster, D.J. Sedimentary features of the Yangtze River-derived along-shelf clinoform deposit in the east China sea. Cont. Shelf Res. 2006, 26, 2141–2156. [Google Scholar] [CrossRef]
- Liu, J.P.; Xu, K.H.; Li, A.C.; Milliman, J.D.; Velozzi, D.M.; Xiao, S.B.; Yang, Z.S. Flux and fate of Yangtze River sediment delivered to the east China sea. Geomorphology 2007, 85, 208–224. [Google Scholar] [CrossRef]
- Xu, K.; Li, A.; Liu, J.P.; Milliman, J.D.; Yang, Z.; Liu, C.-S.; Kao, S.-J.; Wan, S.; Xu, F. Provenance, structure, and formation of the mud wedge along inner continental shelf of the east China sea: A synthesis of the Yangtze dispersal system. Mar. Geol. 2012, 291, 176–191. [Google Scholar] [CrossRef]
- Jan, S.; Wang, J.; Chern, C.-S.; Chao, S.-Y. Seasonal variation of the circulation in the Taiwan Strait. J. Mar. Syst. 2002, 35, 249–268. [Google Scholar] [CrossRef]
- Goff, J.A.; Flood, R.D.; Austin, J.J.A.; Schwab, W.C.; Christensen, B.; Browne, C.M.; Denny, J.F.; Baldwin, W.E. The impact of Hurricane Sandy on the shoreface and inner shelf of Fire Island, New York: Large bedform migration but limited erosion. Cont. Shelf Res. 2015, 98, 13–25. [Google Scholar] [CrossRef] [Green Version]
- Maa, J.P.-Y.; Tsai, C.-H.; Juang, W.-J.; Tseng, H.-M. A preliminary study on Typhoon Tim induced resonance at Hualien Harbor, Taiwan. Ocean Dyn. 2010, 61, 411–423. [Google Scholar] [CrossRef]
- Pope, E.L.; Talling, P.J.; Carter, L.; Clare, M.A.; Hunt, J.E. Damaging sediment density flows triggered by tropical cyclones. Earth Planet. Sci. Lett. 2017, 458, 161–169. [Google Scholar] [CrossRef] [Green Version]
Figure 1.
(a) The path of Typhoon Soudelor in 2015 (http://agora.ex.nii.ac.jp/digital-typhoon/); (b) study location in the Taiwan Strait; (c) submarine geomorphology of the study area observed using side-scan sonar and multibeam echosounder (c-1) and the observation lines with markers for L4–L7 and S5–S6, the seismic profiles in Figure 2 and with markers for S2, S5, and L6, the side-scan sonar profiles in Figure 3; (d) grain size distributions of the surface sediments for (d-1) sand/gravel, (d-2) sandy silt, and (d-3) clay silt; (e) the observation times of the three surveys and Typhoon Soudelor. Notice that the multibeam echosounder data was obtained in 2017. This figure was drawn using Surfer (version 11.6) (Golden Software LLC., Golden, CO, USA).

Figure 2.
(a) Seismic profile locations and seismic profiles of S4, S5, and S6, observed on (b-1) 9 May 2015; (b-2) 19 August 2015; (b-3) 23 September 2015; and (b-4) the interpretation profiles for the three surveys; the seismic profiles of L7, L6, L5, and L4, observed on (c-1) 9 May 2015; (c-2) 19 August 2015, and (c-3) the interpretation profiles for the two surveys and (d) the GPS track lines collected during three surveys.

Figure 3.
(a) Side-scan sonar profiles locations and the sonar images of L6, observed on (b-1) 9 May 2015; (b-2) 19 August 2015, and the corresponding seismic profiles (b-3,b-4); the sonar images of S2, observed on (c-1) 9 May 2015; (c-2) 19 August 2015; and (c-3) 23 September 2015; and the sonar images of S5, observed on (d-1) 5 September 2015; (d-2) 19 August 2015; and (d-3) 23 September 2015.

Figure 4.
Distributions of wind stress in the Taiwan Strait on (a-1) 8 August 2015 00 a.m.; (a-2) 8 August 2015 12 a.m.; and (a-3) 9 August 2015 00 a.m. The black dotted line in the figures shows the track of Typhoon Soudelor, and the red dot shows the location of the typhoon center at a given time.

© 2019 by the authors. Licensee MDPI, Basel, Switzerland. This article is an open access article distributed under the terms and conditions of the Creative Commons Attribution (CC BY) license (http://creativecommons.org/licenses/by/4.0/).
Share and Cite
MDPI and ACS Style
Li, H.; Li, Y.; Zheng, B.; Zhong, G.; Zhang, H.; Wang, H.; Qiao, L. Typhoon Soudelor (2015) Induced Offshore Movement of Sand Dunes and Geomorphological Change: Fujian Coast, China. Water 2019, 11, 1191. https://doi.org/10.3390/w11061191
AMA Style
Li H, Li Y, Zheng B, Zhong G, Zhang H, Wang H, Qiao L. Typhoon Soudelor (2015) Induced Offshore Movement of Sand Dunes and Geomorphological Change: Fujian Coast, China. Water. 2019; 11(6):1191. https://doi.org/10.3390/w11061191
Chicago/Turabian StyleLi, Haidong, Yunhai Li, Binxin Zheng, Guicai Zhong, Hannv Zhang, Hengbo Wang, and Lei Qiao. 2019. "Typhoon Soudelor (2015) Induced Offshore Movement of Sand Dunes and Geomorphological Change: Fujian Coast, China" Water 11, no. 6: 1191. https://doi.org/10.3390/w11061191
Note that from the first issue of 2016, this journal uses article numbers instead of page numbers. See further details here.