A Mixed Integer Linear Programming Method for Optimizing Layout of Irrigated Pumping Well in Oasis


1
College of Hydropower & Information Engineering, Huazhong University of Science & Technology, Wuhan 430074, China
2
State Key Laboratory of Desert and Oasis Ecology, Xinjiang Institute of Ecology and Geography, Chinese Academy of Sciences, Urumqi 830011, China
3
Cele National Station of Observation & Research for Desert-Grassland Ecosystem, Xinjiang Institute of Ecology and Geography, Chinese Academy of Sciences, Urumqi 830011, China
4
University of Chinese Academy of Sciences, Beijing 100049, China
*
Authors to whom correspondence should be addressed.
Water 2019, 11(6), 1185; https://doi.org/10.3390/w11061185
Submission received: 8 May 2019
/
Revised: 29 May 2019
/
Accepted: 5 June 2019
/
Published: 6 June 2019
(This article belongs to the Section Hydrology)
Abstract
:Optimization of irrigation well layout plays a vital role in the rational utilization of groundwater and to balance the water–energy nexus, especially in arid irrigation districts. This study proposes the mixed integer linear programming model (MILP) for well layout optimization with minimum well irrigation costs. This model efficiently establishes a link between irrigation area and wells to express the constraints of ensuring that irrigation area can be covered with optimal wells by using grid points to represent the irrigation area. It also uses the special ordered sets (SOS) modeling tool to decompose the mixed integer nonlinear programming into a mixed integer linear programming by assigning SOS-constrained weights to discrete points of a nonlinear function. This method was used in Cele Oasis of the Tarim Basin of the Xinjiang Province, an arid region in northwestern China. Since the original well layout was already established, different economic criteria like implicit cost and explicit cost were considered and two optimization results were yielded. The results showed that (1) the implicit cost optimization (ICO) and explicit cost optimization (ECO) reduced total costs by 7.64% and 3.56% compared with the condition of without optimization; and (2) the ICO and ECO reduced the optimal number of wells by 52.89% and 10.74% compared with the existing number of wells. Based on the analysis of the results, it is suggested that the manager should close uneconomical wells after determining the economic criteria. This method for well layout optimization can assist managers to make more rational plans for irrigation systems to exploit groundwater more efficiently, economically, and in a more environmentally friendly manner.
1. Introduction
Globally, agriculture is the largest user of freshwater resources. About 70% of freshwater consumption in the arid region is occupied for agricultural irrigation [1]. The challenges of water resource shortage have been posed as the increase of world population expecting demand of 50% more food and 30% more water by 2030 [2]. It is important to investigate the best agricultural water management policy for the arid region [3], as well as the usage of several advanced technologies (such as improving estimation of cropland evapotranspiration [4], detecting the trend of precipitation variations [5], and applying satellite data [6]). As the rainfall is highly variable and seasonal in arid environments [5], the very high evapotranspiration in field leads to groundwater dependence [4,7,8,9]. Groundwater is one of the most important water uses sources, especially in arid region of China.
Globally, irrigation groundwater uses account for 43% of the total consumptive irrigation water uses. For intensive agriculture, groundwater offers reliable and flexible access to water resources that irrigation canals can hardly match [10]. With increased extraction of groundwater, the relative richness of the resources decline and production costs rise as hydraulic heads drop and pumping lifts increase [8]. It is represented as a risk for farmers’ cost and field infrastructure for too many groundwater pumping wells and unreasonable well layout in agricultural region [11]. The optimization of pumping well layout will lead to the optimal exploitation of groundwater, which is necessary for sustainable groundwater use in irrigation districts [1,12,13]. Well layout optimization research is conducted to understand the physical processes related to pumping wells and to optimize the large-scale layout of wells by considering other factors and using various optimization methods.
In general, well layout studies can be generally classified into mechanism study that related to well flow, applied studies that depend on the research purpose, and optimization methods. As described by Gorelick and Zheng [8] in their review of groundwater management, mathematical programming techniques are among the earliest and most commonly used for optimal groundwater management. In most cases, they establish a single-objective function or multiobjective function as an optimal goal, subject to a series of constraints on variables to describe the state of the system and to limit some decision variables such as pumping drawdown, pumping flow, and irrigation radius [14,15]. If in the review of well spatial layout optimization, the binary variable should be involved, available methods are narrowed down to mixed integer linear, nonlinear, and quadratic programming (MILP/MINLP/MIQP) [16,17]. In recent years, there has been a class of heuristic algorithms proposed with the advantage of low requirement for problem formulation and applied in groundwater management such as the ant colony algorithm, the firefly algorithm, the simulated annealing algorithm, and genetic algorithms [18,19,20,21]. The key disadvantage of using these algorithms is that they are only able to obtain unstable suboptimal solutions and the computational requirement may be excessive and cost prohibitive [22], hence, if the related function and constraints can be formulated in a suitable way, the mathematical programming is still an efficient and effective choice for well layout optimization.
The geomorphology of the basin in arid/semiarid area is composed by the oasis and desert, which have multiple ecosystem services [23]. Desert oasis forms a unique intrazonal landscape with a stable water supply and supports flourishing vegetation and human settlements in arid or hyper-arid regions. However, the oasis ecosystem is commonly vulnerable with low precipitation and high evaporation that makes water resources become more precious [24,25], it is critical to keep both fertile land and living spaces in oasis for population within the desert environment. The water scarcity in oasis is challenged by human activities, including cropland expansion, ecological water diversion, and groundwater overexploitation [26]. The Cele Oasis is a hyper-arid zone in northwest China that receives very little rainfall. As the cropland expands rapidly in oasis in China [27], it is interesting to explore the best groundwater management practices in Cele Oasis. This, in result, may also inspire better water management in similar regions.
The presented study deals with the well layout optimization problem with a mixed integer linear programming model which minimizes the irrigation cost. We demonstrate that this model is uniquely formulated to optimally determine the layout of irrigation wells based on existing wells and to distribute the pumping flow of reserved wells, which is a very useful way to balance the water–energy nexus in a district. An approach is also proposed that establishes a link between the irrigation area and the well as a MILP type, which can accurately express the constraints of ensuring that an irrigation area can be irrigated using the reserved wells. In addition, a special ordered sets (SOS) modeling tool is introduced to decompose the original mixed integer nonlinear programming into a mixed integer linear programming that is used to express the complex nonlinear relationship between well flow and pumping consumption.
In the subsequent chapter, the methods and study site are introduced in Section 2, with following section gives the different model calculation results and also optimal well spatial layout. Further, we give several conclusions to help managers to achieve better groundwater management sustainability in practice.
2. Materials and Methods
In this part, the main methodology of how to optimize the well layout and water allocation is specifically presented, it mainly includes three steps: (1) problem formulation, initially establish model and express the objective function and all constraints in mathematical form; (2) model reformation, reformulate the model as the MILP type by proposing rational assumption, employing modeling tool, and involving binary variable; and (3) model solution, employ a large-scale mathematical programming optimizer to solve the model.
2.1. Problem Formulation
2.1.1. The Form of the Objective Function
With the decline of the water table, the unit power consumption increases exponentially, for the sustainable and economic development of an irrigation district, the subject of the implicit irrigation cost is getting more attention, which includes well’s maintenance and management expenses, depreciation cost, and pumping cost. The pumping cost has a strong relationship with energy consumption, water quantity, and the water table; hence, the optimization results are not only more acceptable to stakeholders but also friendly to environment in a district. The objective function is mathematically expressed as:
where is the number of reserved wells, is the serial number of existing wells; is a well’s maintenance and management expense for one year (CNY); is a well’s depreciation cost for one year (CNY); the average depreciation method requires less data and the variety of depreciation within the well planation period is not much, hence, it is chosen for the depreciation cost calculation and , where is the average well construction cost (CNY) and is the years of use of a well planation(a); is a well’s pumping cost for one year (CNY).
The well pumping cost can be mathematically expressed as:
where is the unit electricity price ; is the average pumping days for one year ; is the power consumption for one day ; m and n are the fitting parameters of power consumption and total drawdown of a well [28]; is a well’s depth before discharge (m); and is a well’s drawdown during the pumping time (m).
The expression for the pump drawdown is:
where is the well pumping flow ; is the pumping time ; is the distance from the discharging well ; is the transmissivity ; is the hydraulic conductivity ; is the saturated thickness of the aquifer ; and is storativity (dimensionless quantity). Equation (5) is the Cooper and Jacob approximation equation [29] which is derived from the Theis equation [30], and the following inequality should be satisfied:
where u is:
It should be noted that the application of Equations (2), (5) and (6) require some assumptions: (1) the pumping days in Equation (2) are assumed to be a constant value; (2) in the application of Equation (5), it is assumed that the wells are pumping at constant flow rates from a confined infinite aquifer, and the wells are pumping continuously with a constant pumping rate on all of the pumping days; (3) Equation (6) assumes that the hydraulic conductivity and saturated thickness of the aquifer are constant values in the study area.
2.1.2. The Form of Constraints
In this model, seven constraints are considered that can mainly express the constraints about well drawdown, well irrigation radius, well irrigable range, well flow distribution, and well influence radius. The constraints are specifically presented as following:
- Well drawdown during pumping is no more than the allowed maximum drawdown:where is the allowed maximum drawdown of groundwater.
- The well irrigation radius is no more than the maximum irrigation radius:where is the optimal irrigation radius of the well and is the maximum irrigation radius of the well .
- The irrigable area of optimal wells must cover the irrigation area:where is the irrigable area of the reserved i-th well ; and is the irrigation area in the district .
- Well flow distribution for the reserved well can be expressed as:where is the pumping flow rate required for the complete irrigation of a hectare area ; is the irrigation area that can only be irrigated by one well ; and is the optimal distributed irrigation area in an area that can be irrigated by more than one well .
- The well influence radius is determined by the groundwater exploitable modulus method:where is the influence radius of groundwater (m) and is the exploitable modulus in the district .
- The well influence radius cannot exceed the well irrigation radius:
- The distance between any two reserved wells is greater than the sum of the influence radius of the two wells:where is the distance between and (m); and are the influence radius of and , respectively (m).
The model of well layout optimization uses the objective function (1) and subjects to the constraints (9)–(15).
2.2. Solution Methods
After the presentation of the problem, the most important and difficult task is to find an efficient way to solve the problem. First, the model must be changed to meet the format requirements for mixed integer linear programming (MILP). Second, the model needs to be expressed using programming language and solved using the mathematical solver. In this section, the specific approach of the solution procedure is presented.
2.2.1. Model Reformulation
Add Equations (2)–(6) to Equation (1), the binary variable is introduced to expand to . Then the objective function can be reformulated as:
where is the total number of existing wells; is the binary variable that signifies whether to keep the well, 1-yes, 0-no. Due to the assumptions above, the objective function has a complex nonlinear relationship with . Therefore, to decompose it, the constraints of two special ordered sets (SOS) are involved, and the nonlinear relationship can be expressed using the piecewise linear method in an efficient way:
where SOS2 is a type of SOS constraint. This means that at most two variables in the specified ordered list are allowed to take a non-zero value, and those non-zero variables must be contiguous in the list. n is the number of linear segments, is the weight coefficient, and and are the linear segmentation point values.
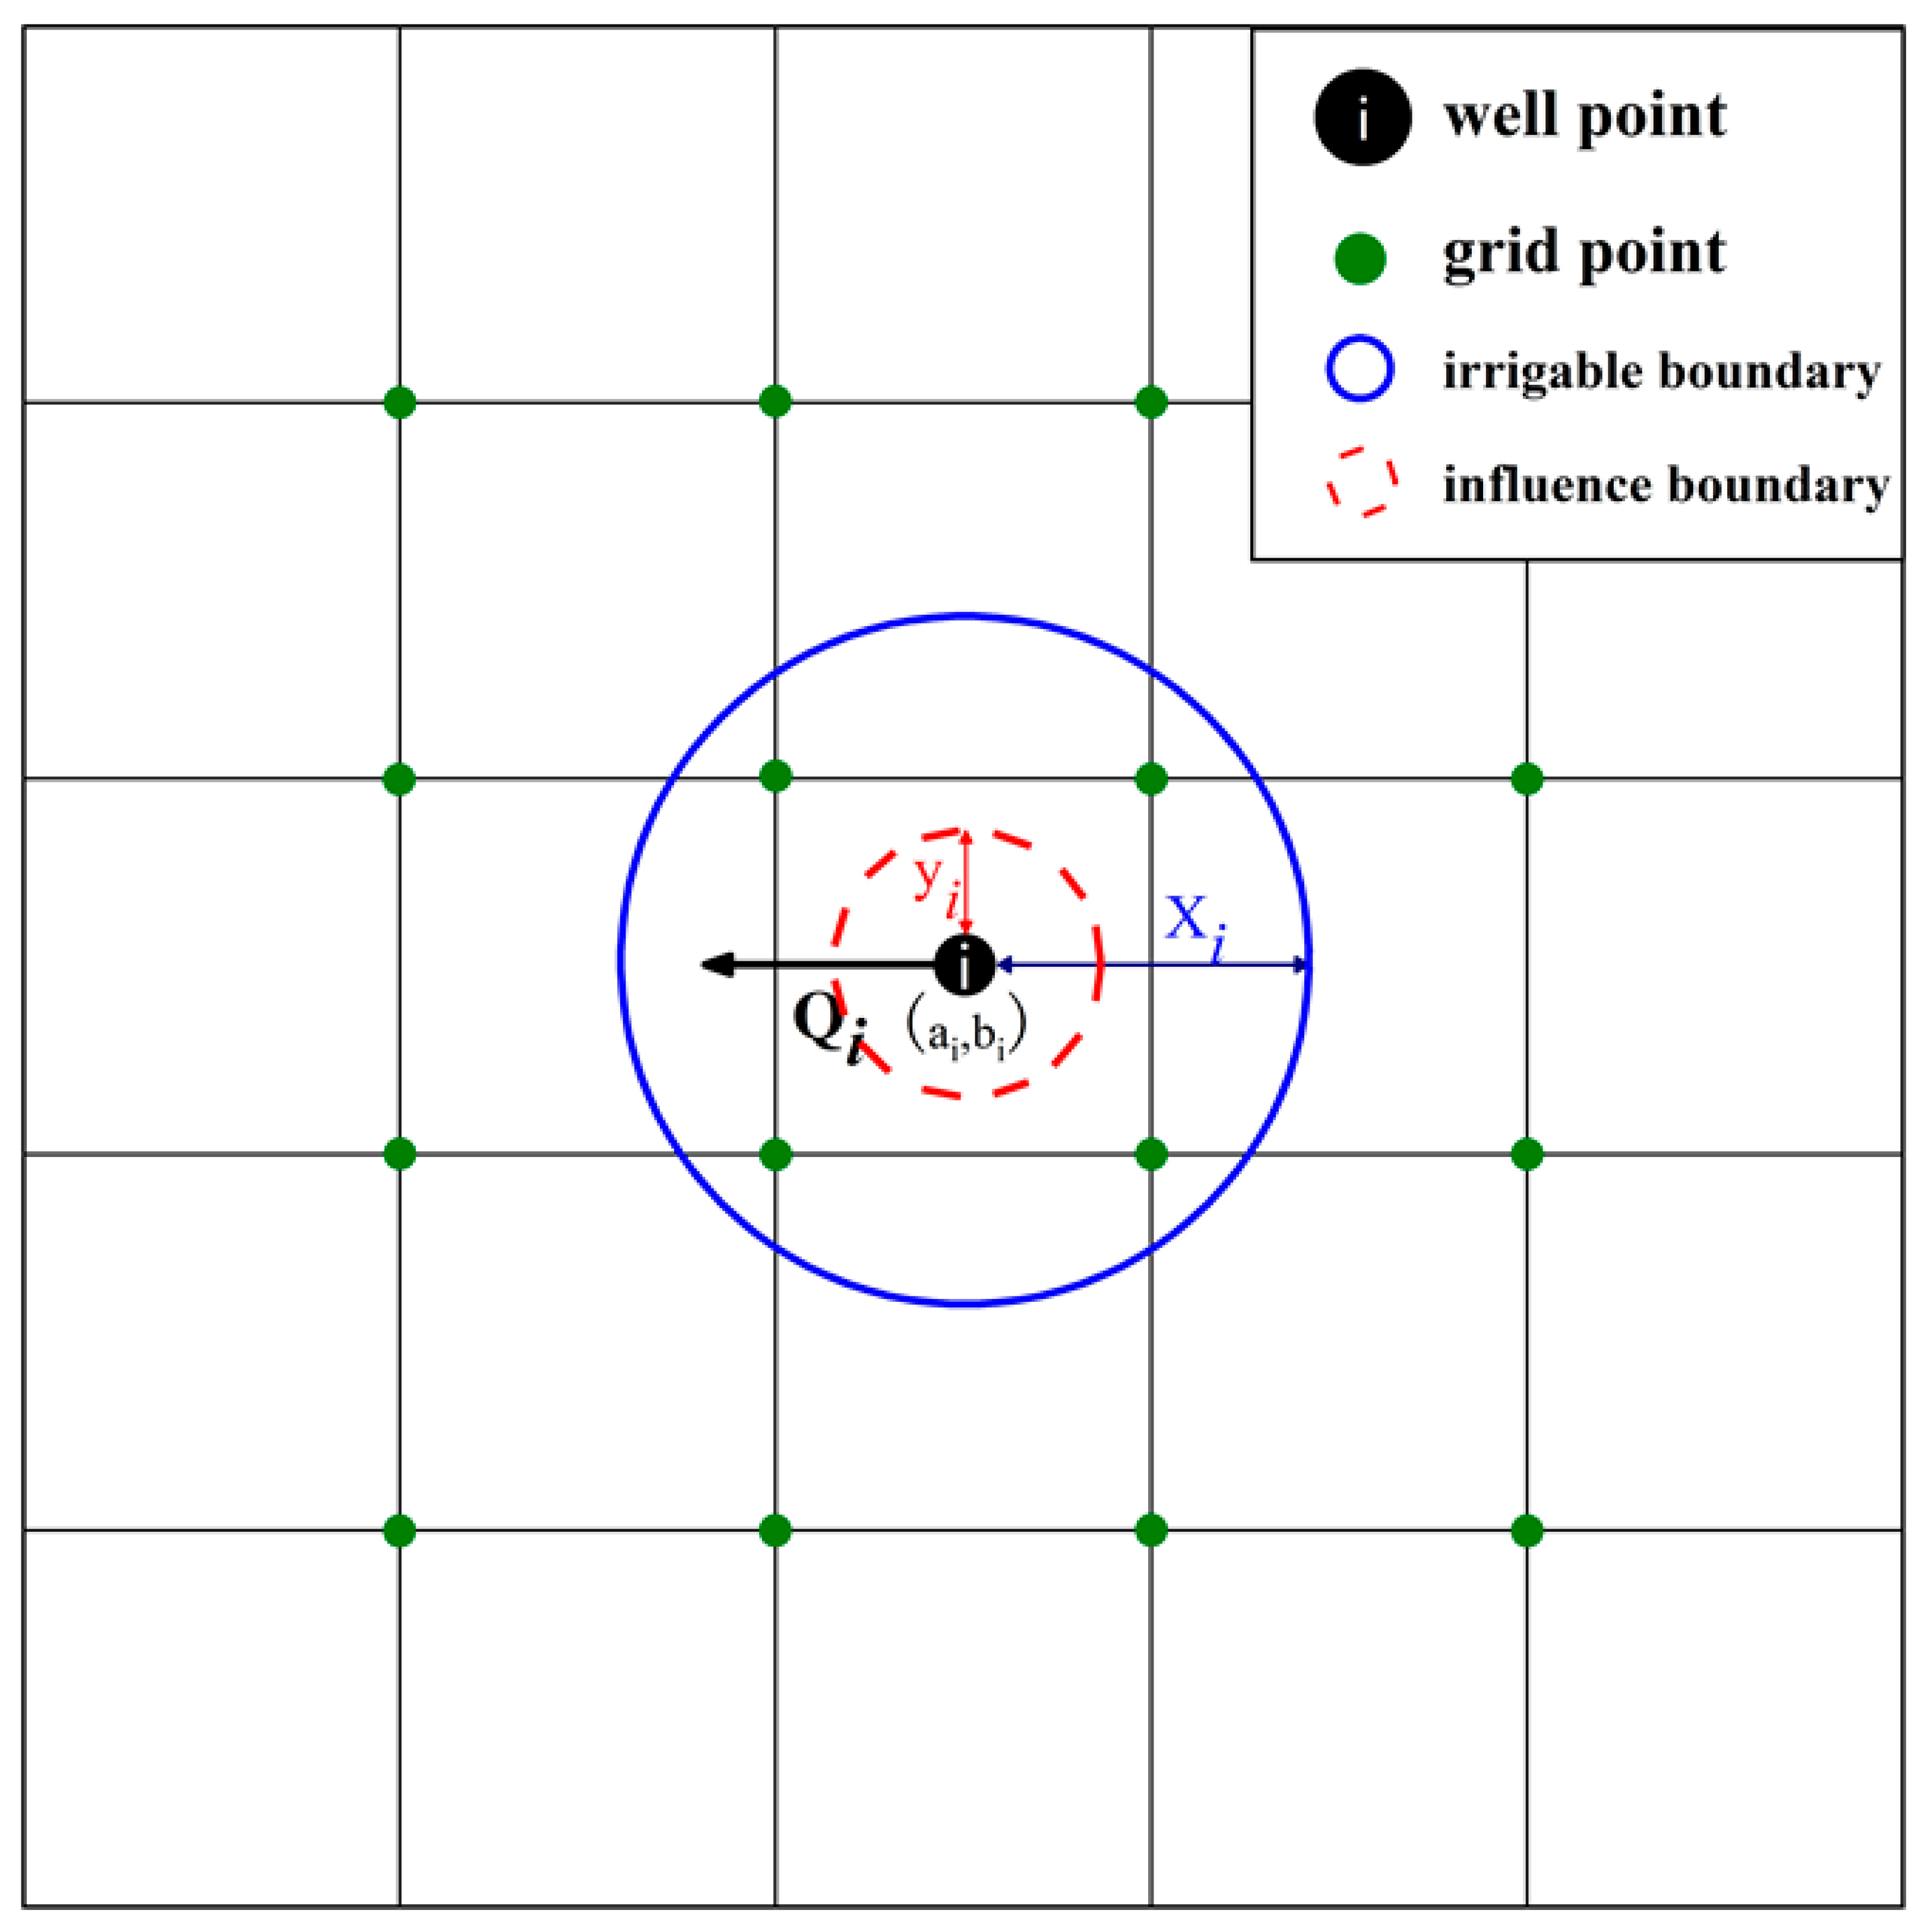
Note that constraint (11) does not meet the modeling requirements. Hence, a method is proposed to solve it that replaces the irrigation area with equally spaced grid points. As shown in Figure 1, the relationship between an irrigation area and a well reexpressed as well and grid points, note that the blue circle represents the irrigable boundary of i-th well and the red circle represents the influence boundary of i-th well. The constraint is then reformulated as follows:
where represents whether or not to use to irrigate the area of , 1-true, 0-false; and are the horizontal coordinates of a well and a grid; and and are the vertical coordinates of a well and a grid, respectively. Equation (13) can then be reformulated as:
where is the irrigation area represented by grid points.
Now, the problem of well layout optimization is formulated using a nonlinear objective (16) subject to linear constraints (9), (10), (13)–(15), and (17)–(24). It is never an easy task, if not impossible, to work out a competitive approach to solve this nonlinear programming problem.
2.2.2. Model Solving Method
In this study, the solution procedure has two steps. First, this model is expressed using C++ language: the purpose of programming not only expresses the model accurately but also eliminates some meaningless constraints to reduce the operational intensity of the computers. For example, in the expression of Equation (16), each well is only compared with wells nearby using C++ programming. Second, the model is solved using the Gurobi Optimizer [31] through C++ API (application programming interface). Gurobi Optimizer is a new generation of a large-scale mathematical programming optimizer developed by Gurobi of the United States. It has a faster optimization speed and better precision in the third-party optimizer evaluation conducted using the Decision Tree for Optimization Software, as well as it has a free academic license for researchers which is widely acceptable.
2.3. Study Area
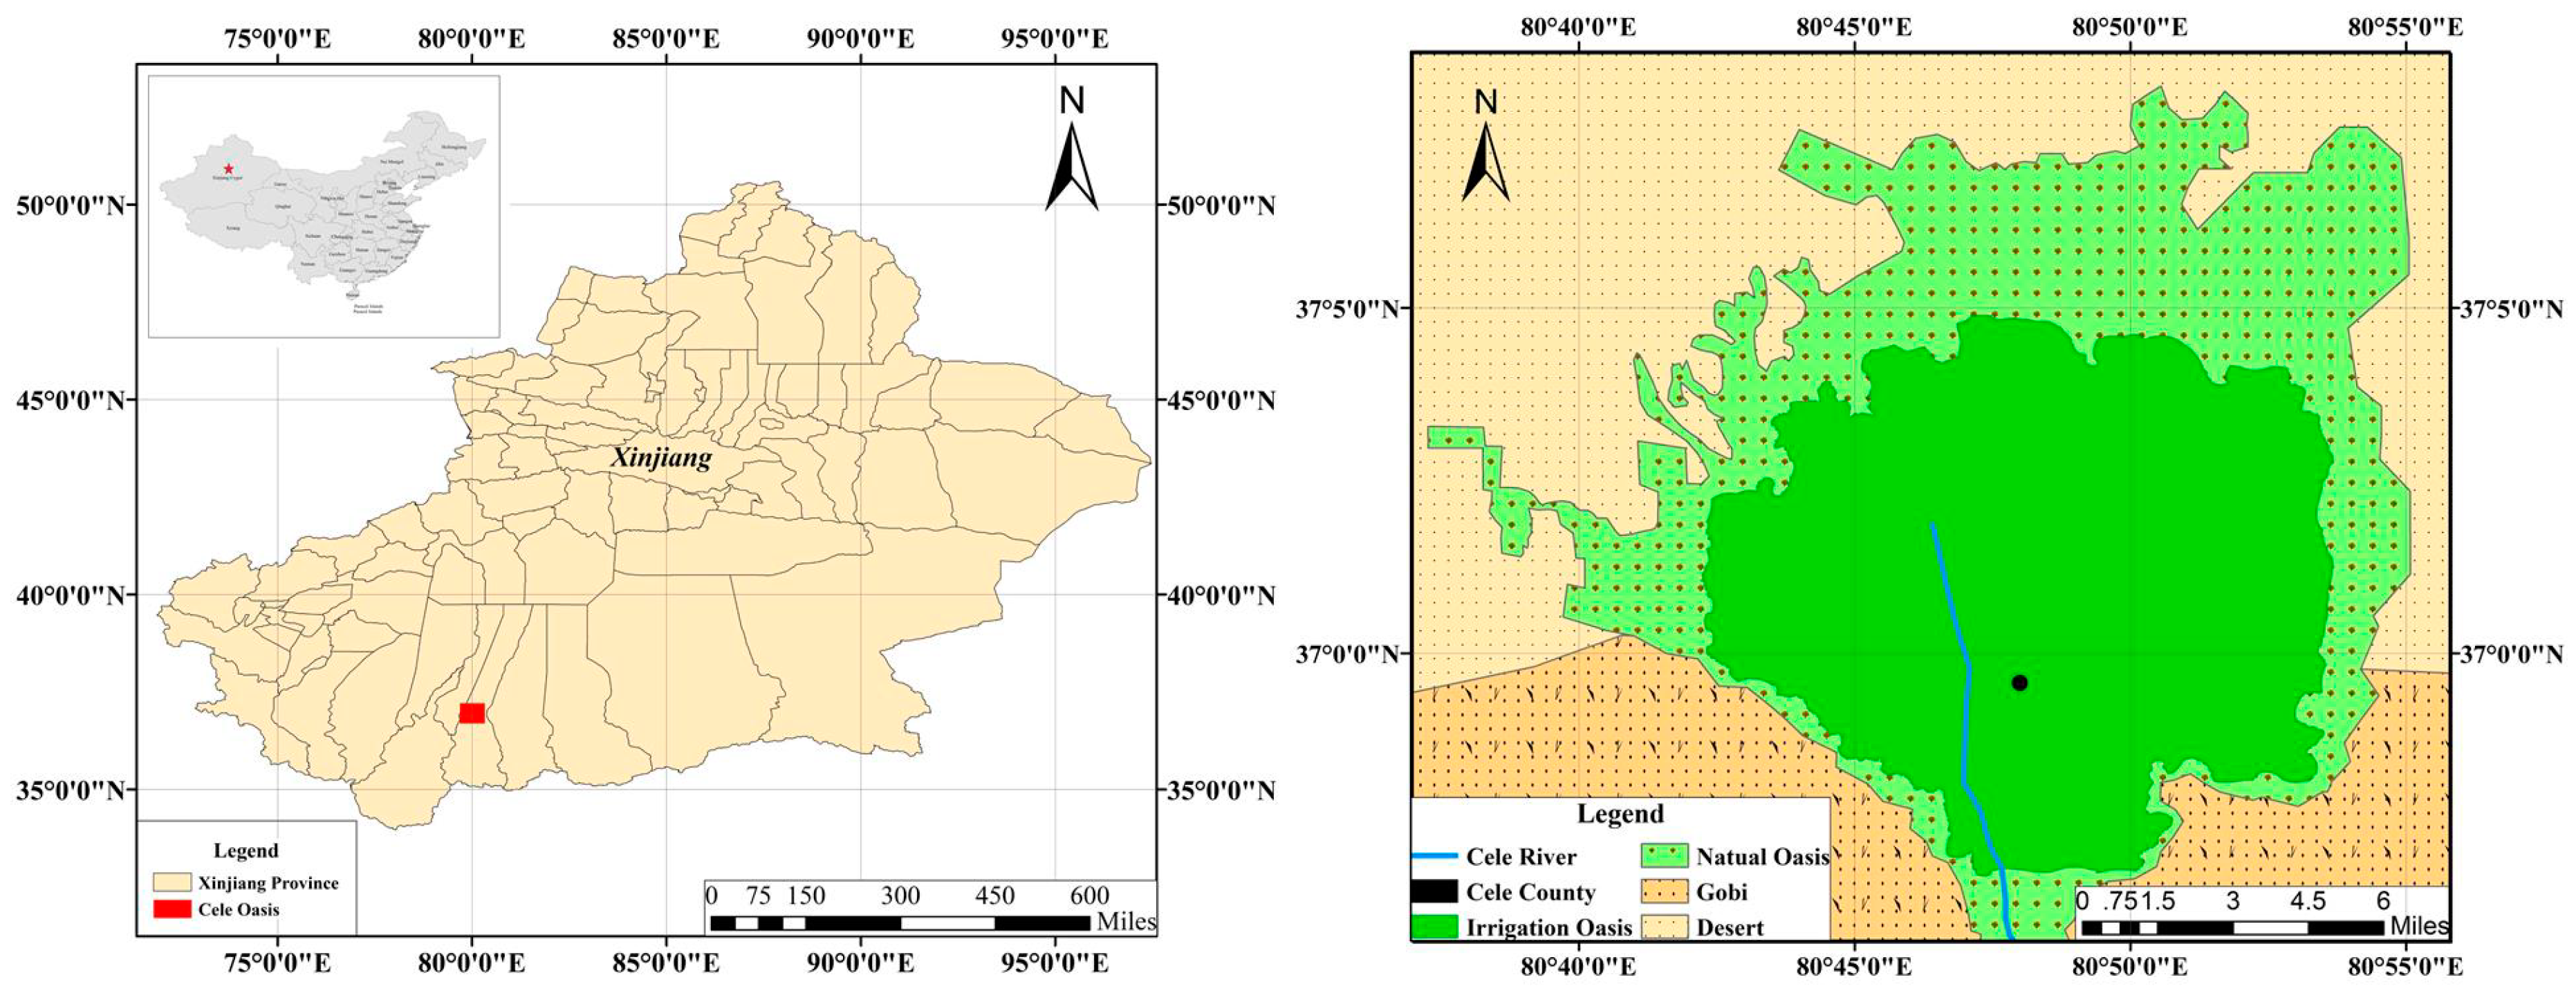
The Cele Oasis area is located along the southern rim of Xinjiang Province (Figure 2) in northwest China (36°54′ N–37°09′ N, 80°37′ E–80°59′ E). From the topography, the Cele Oasis area is located in the lower reaches of the Cele River catchment, and it covers nearly 274.63 km2, of which the irrigation area is nearly 255.5 km2. In comparison with most other river catchments, the Cele Oasis area is a typical inland river catchment, situated between mountainous areas and among desert plains in an arid region. It is characterized by extremely low precipitation (39 mm/year), strong evaporation (2700 mm/year), and highly vulnerable ecosystems [32]. The Cele Oasis is primarily supplied with water from the Cele River, which originates from the Kunlun Mountains, flows through the Cele Oasis area, and finally discharges into the extremely arid Taklimakan Desert [33].
Agriculture is the primary industry in the area and accounts for 44.1% of the economy in Cele County. The agriculture industry in the Cele Oasis area plays a vital role in food production and resident welfare. Aside from the other water uses that account for approximately 2.3% of the total water consumption, the other 97.7% is used for agriculture irrigation. Approximately 82.1% of the agricultural irrigation water is diverted from the Cele River, with the remaining 17.9% extracted from oasis area groundwater [34]. If the area has a 70% annual groundwater recharge, then the average annual allowable groundwater exploitation amount would be approximately . The present groundwater exploitation amount in the Cele Oasis irrigation area is , which means it has more potential for groundwater utilization In recent years, to improve the standard of living for the local people, the Xinjiang government in China announced measures to develop the economy, which included encouraging investors to accelerate industrial development and the expansion of the oasis area to develop agriculture. To a certain extent, economic development will definitely lead to an increase in water demand. However, groundwater offers reliable and flexible access to water, and groundwater irrigation has always been considered better than irrigation canals. In this situation, a rational and well thought out layout optimization to utilize groundwater is extremely important.
Figure 3 shows the layout of the existing wells in the Cele Oasis, and it is worth noting that the settlement of the grid point distances is 500 m. Figure 3b shows the contour of the groundwater levels in the Cele Oasis. The groundwater levels significantly decrease from the northeast to the southwest, and the difference is nearly 70 meters.
2.4. Data
Table 1 shows the crop types and water demand in the Cele Oasis Jujube and walnut are the two main crops, and they account for 82.4% of the total irrigation area according to the Cele Agriculture Bureau. In addition to the crops listed in the table, there are several crops, such as apple, apricot, and peach, that account for 7.8% of the total irrigation area. It is worth noting that the total amount of groundwater extraction is 17.9% of the total water demand for crops in the irrigation area, which was also stated above.
Table 2 shows the related parameters of the Cele Oasis that were collected primarily from the Cele Irrigation Station. In this table, Fj (hm2) equals 25, which means that the distance of the grid points is 500 meters. The related parameter was then put into Equation (8), and the results illustrated that Equation (5) was suitable for the Cele Oasis. The groundwater exploitable modulus was equal to the average annual allowable groundwater exploitation amount divided by the irrigation area.
3. Results and Discussions
In the previous literature, optimization of well layout may well link with the usage years of pumping wells. However, a well’s implicit cost contains the well’s depreciation cost, which is important economic criteria as the well is a tangible property for stakeholders in a district. Currently, the data of construction time of the existing irrigation wells in the Cele Oasis is incomplete, as well as the inclusion of depreciation cost has a significant influence on optimization of well number which is a little expensive for keeping one more well. Hence, the optimization goal of pursuing the lowest direct irrigation cost without considering the previous investment is also comparatively meaningful to a certain extent. In this study, we obtained two results by setting two different objective functions: implicit cost with depreciation cost and explicit cost without depreciation cost.
3.1. Model Optimization Results with Different Objective
Table 3 shows the results of implicit cost optimization (ICO) and explicit cost optimization (ECO) compared with the condition of without optimization. These results were calculated using the assumptions that each well had the same pumping flow and the same preconditions as ICO and ECO. The total costs of irrigation of ICO and ECO were 2,822,498 CNY and 2,130,534 CNY, respectively, and the electricity costs were 2,366,498 CNY and 2,022,534 CNY, respectively. Therefore, compared with the existing conditions, the ICO and ECO reduced the implicit cost of irrigation by 7.64% and the explicit cost of irrigation by 3.56%. The average optimal well flow of ICO and ECO were 179 m3/h and 95 m3/h, respectively, which are higher than the existing condition, and they are both under the well pumping capacity limitation, which illustrates that distributions are both feasible for the Cele Oasis. In comparison with the number of existing wells, the optimal well number of ICO is 134, a reduction of 52.89%, and the optimal well number of ECO is 216, a reduction of 10.74%. The results of two optimizations obviously illustrate that depreciation cost causes a huge difference in optimal wells number due to its weight in the objective function.
3.2. Optimal Well Spatial Layouts
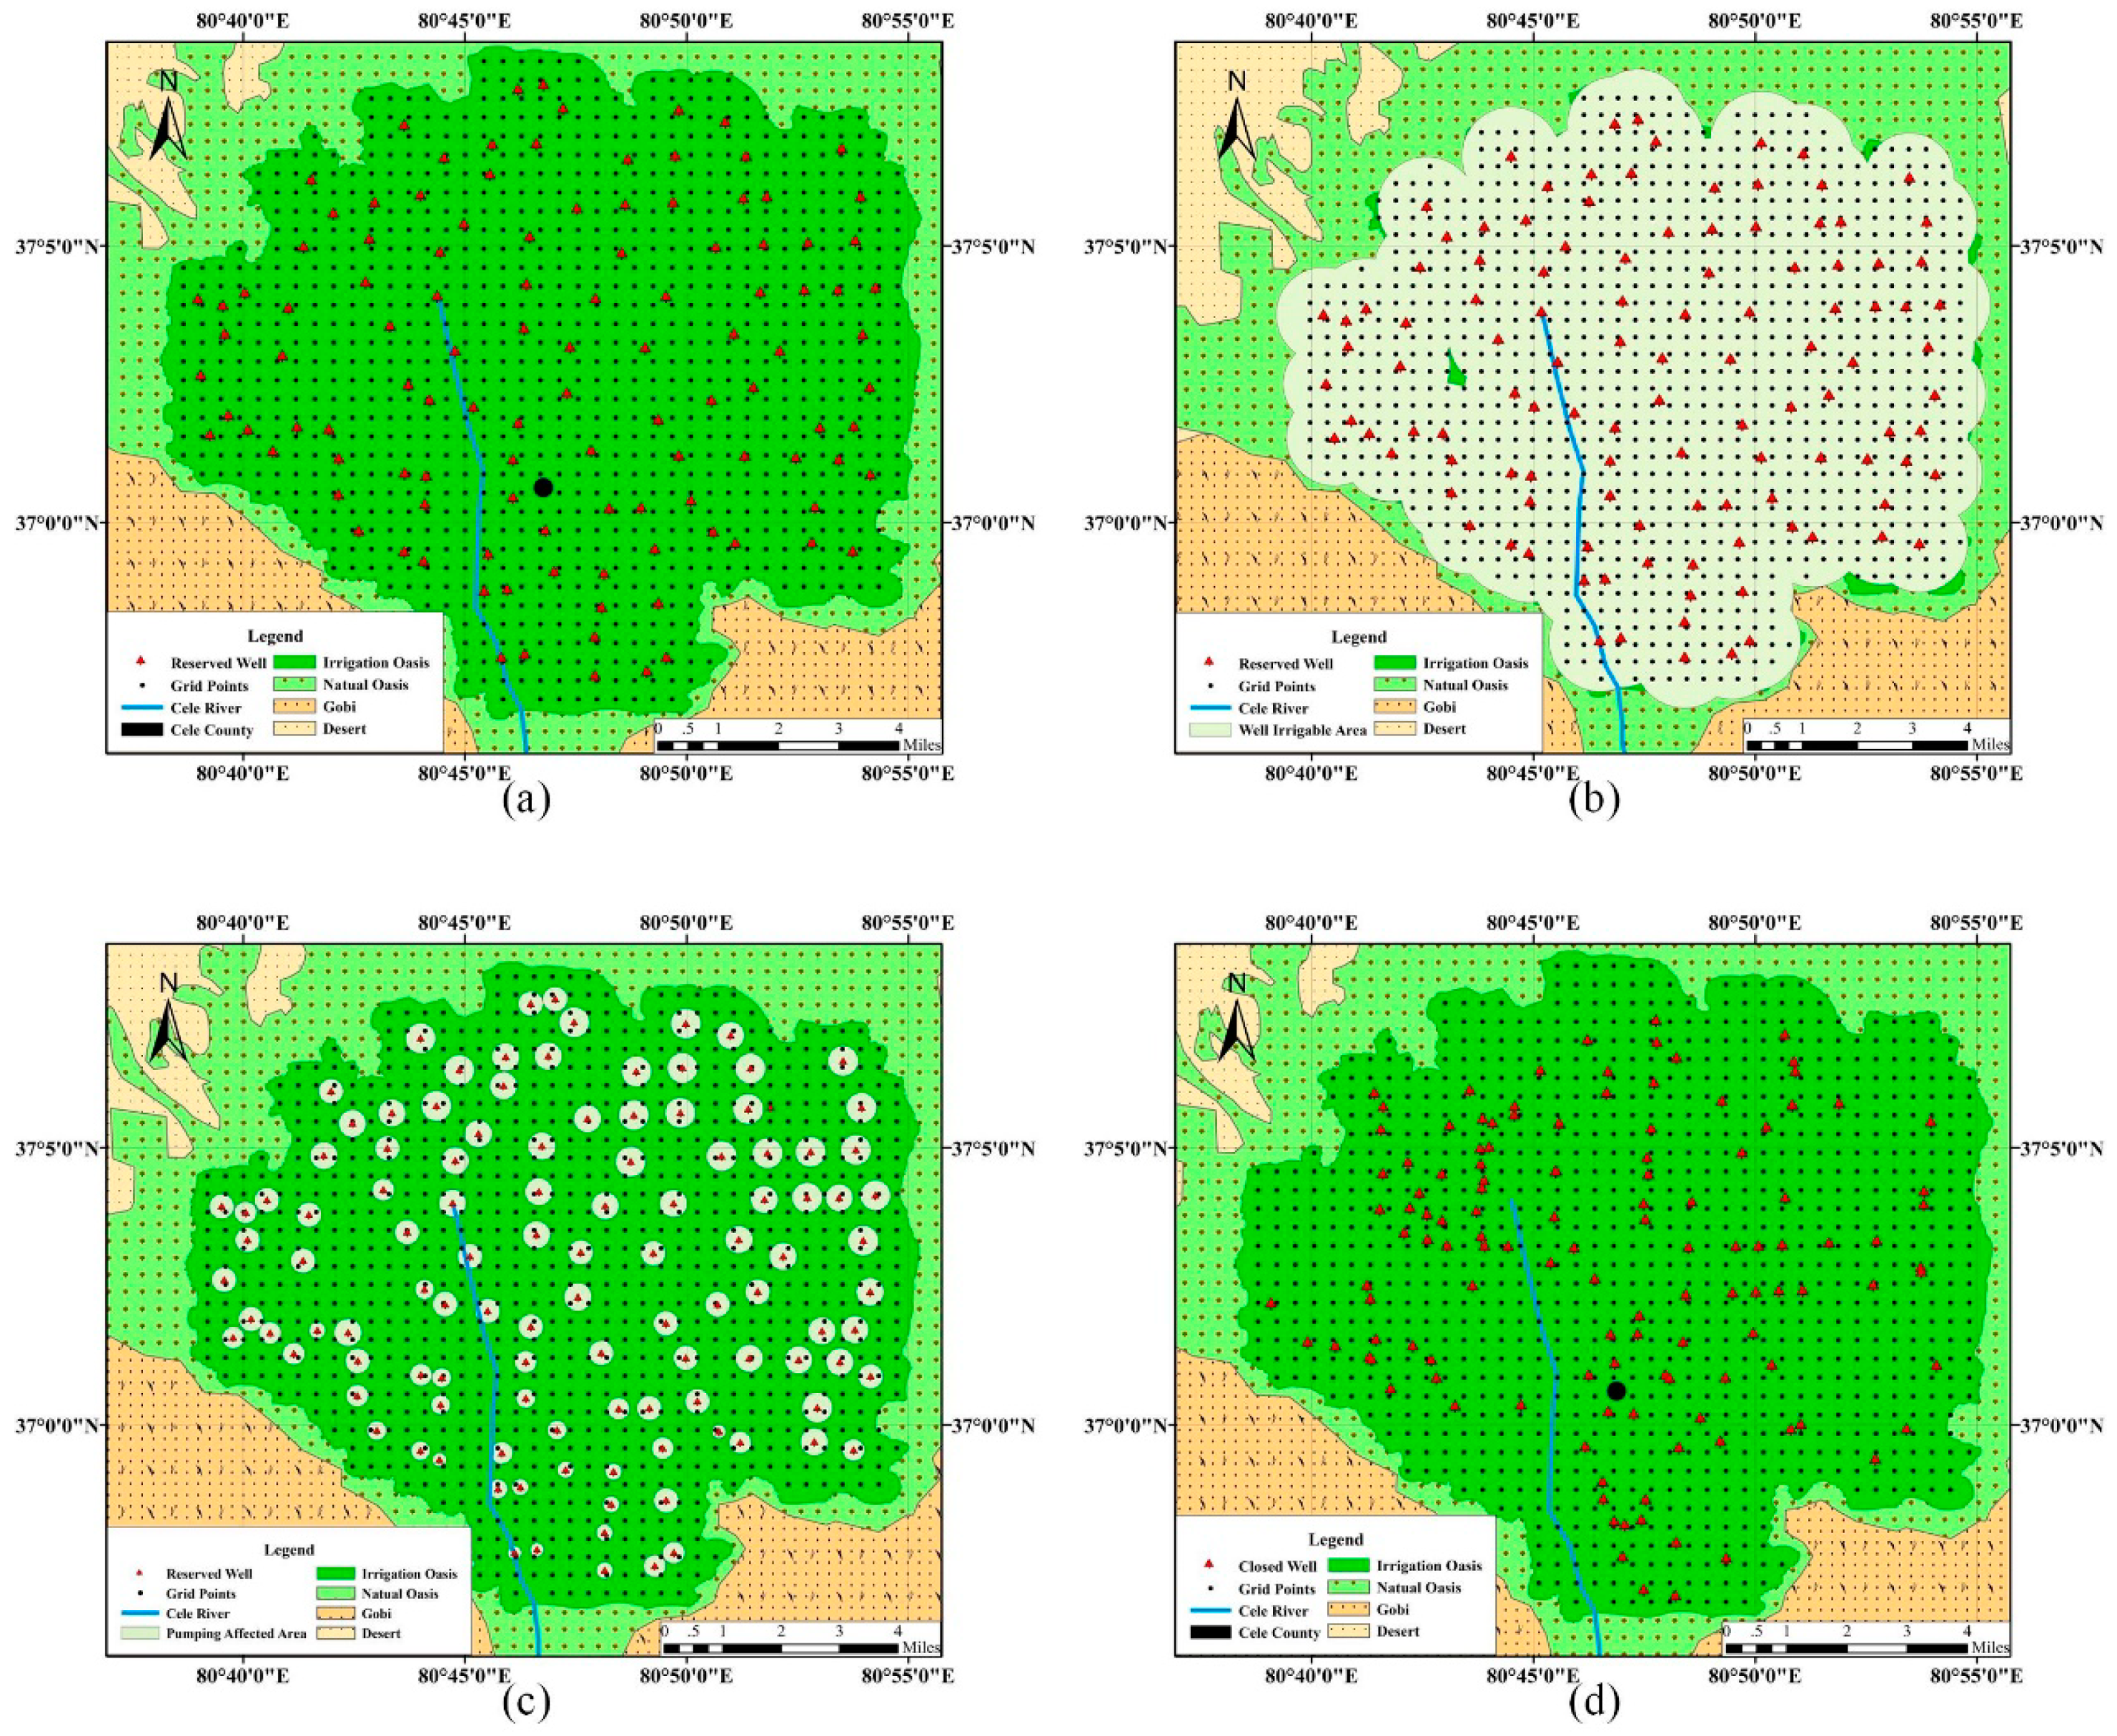
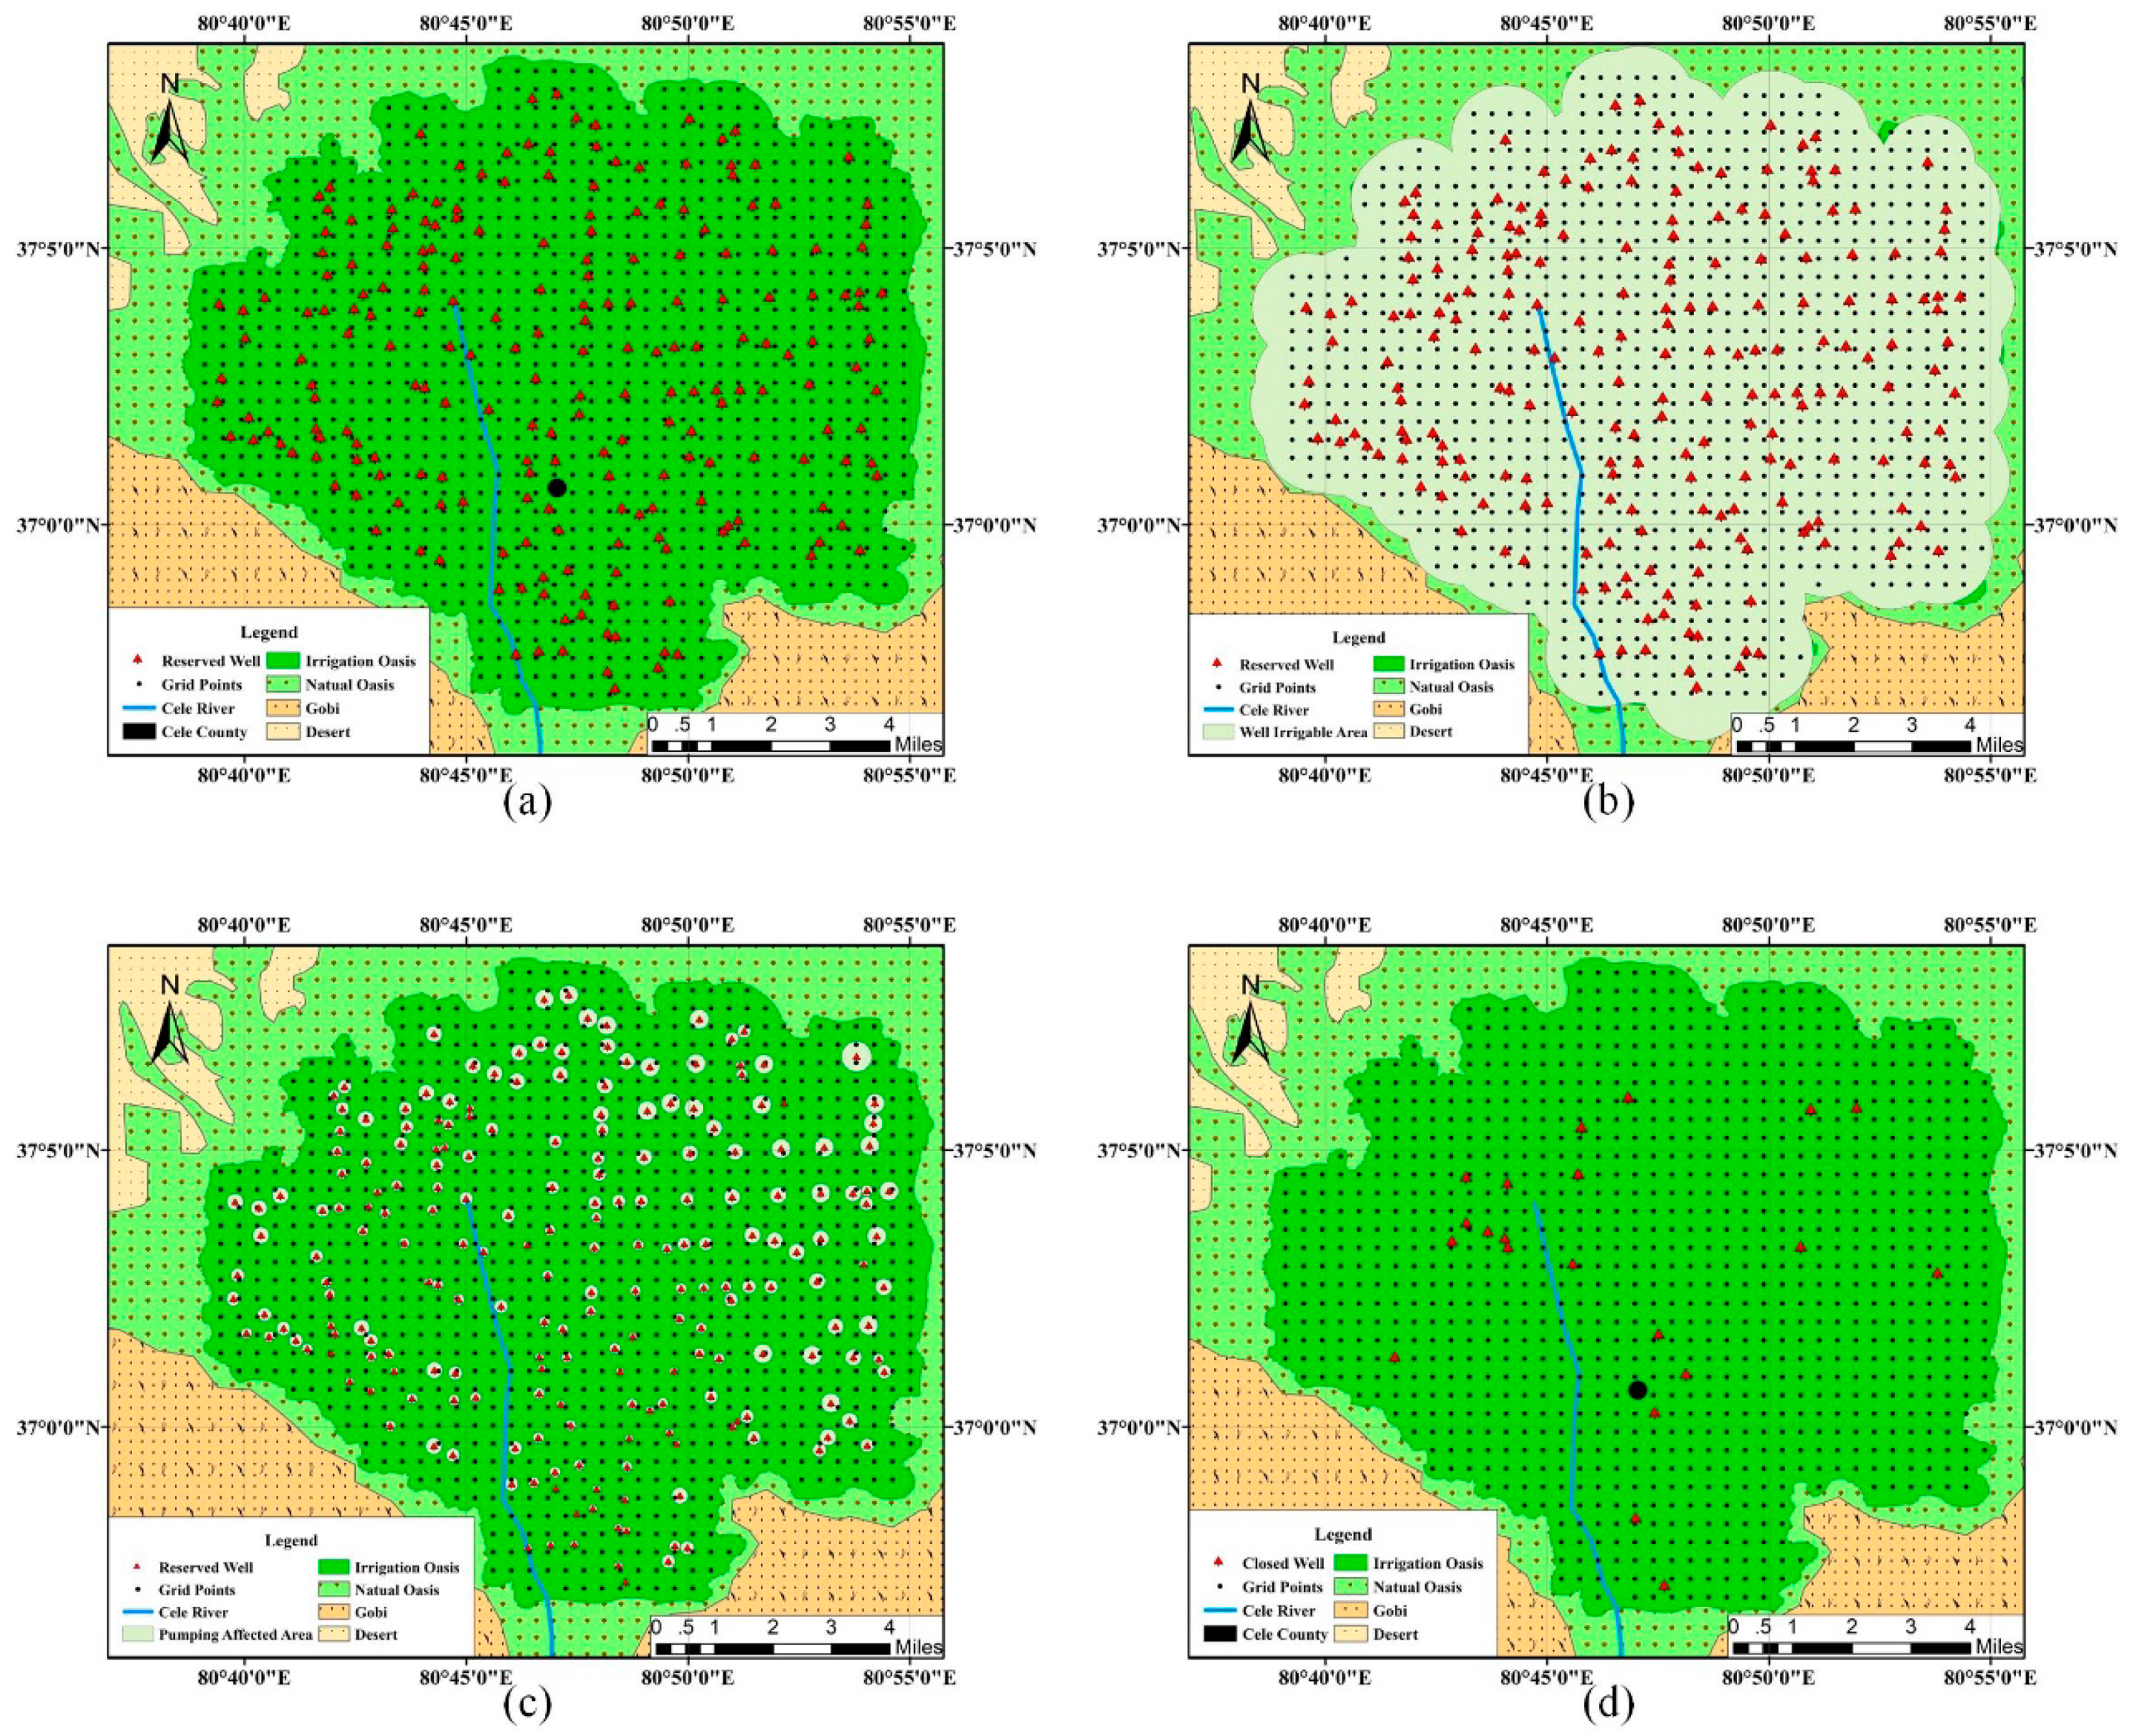
Figure 4 shows the result of optimal well spatial layout of ICO in Cele Oasis: (1) Figure 4a shows the 114 optimal wells spatial layout, (2) Figure 4b shows the optimal wells irrigable areas, (3) Figure 4c shows optimal wells influence areas, (4) Figure 4d shows the 128 uneconomical wells layout which were suggested to be closed. Figure 5 shows the result of optimal well spatial layout of ECO in Cele Oasis: (1) Figure 5a shows the 216 optimal wells spatial layout, (2) Figure 5b shows the optimal wells irrigable areas, (3) Figure 5c shows optimal wells influence areas, (4) Figure 5d shows the 26 uneconomical wells layout which were suggested to be closed. As shown in Figure 4a and Figure 5a, the depreciation cost has significant influence on wells spatial layout. As shown in Figure 4b and Figure 5b, each grid point was within the irrigation range of the optimal wells, and only a small area was not irrigated. This result was due to the settlement of precision of grid points and can be offset by reducing the distance between grid points appropriately. As shown in Figure 4c and Figure 5c, each optimal well maintains a suitable distance according to the amount of pumping flow to meet the constraints that each pumping activity does not interfere with each other, compare these two figures, the two optimization results have the same trend that the wells influence radius in southwestern is shorter than northeastern due to the water table distribution in Cele Oasis. In general, Figure 4 and Figure 5 show the spatial optimal well layout of ICO and ECO, the rational layout and related figure illustrate that constraints of well irrigation radius and influence radius do work for the well layout optimization and the optimization results are both feasible in spatial layout.
3.3. Influences of Different Objective
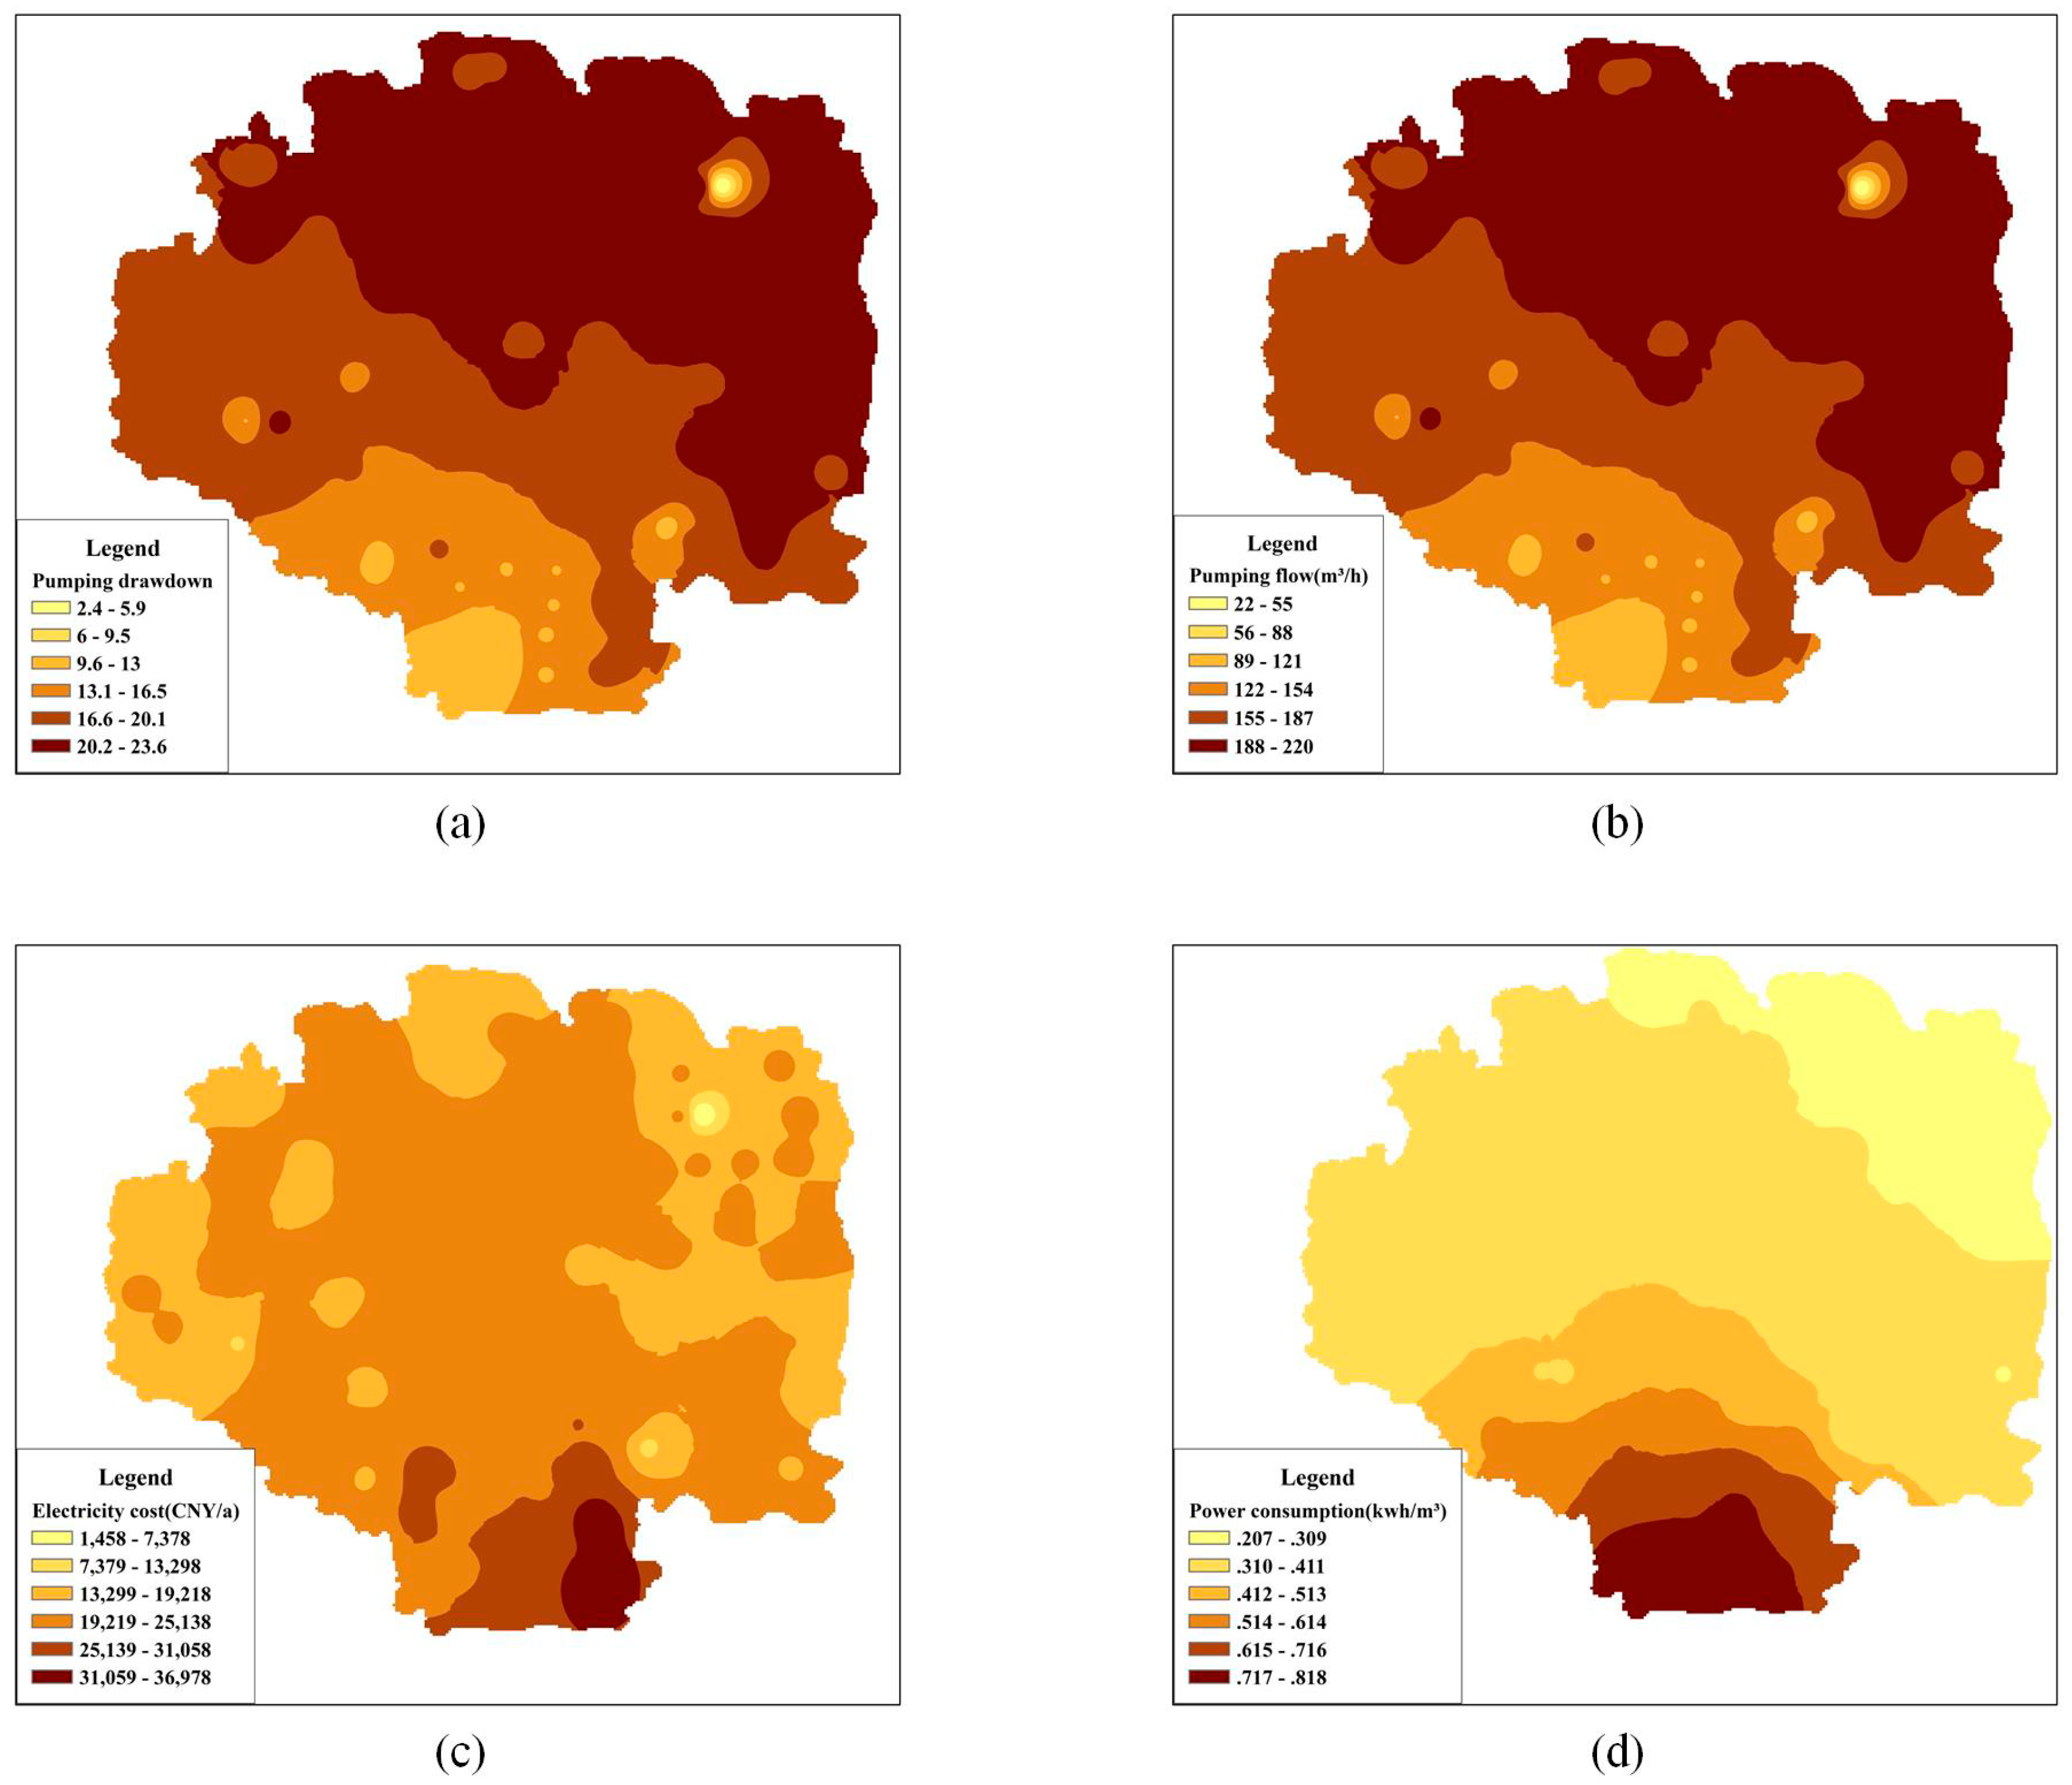
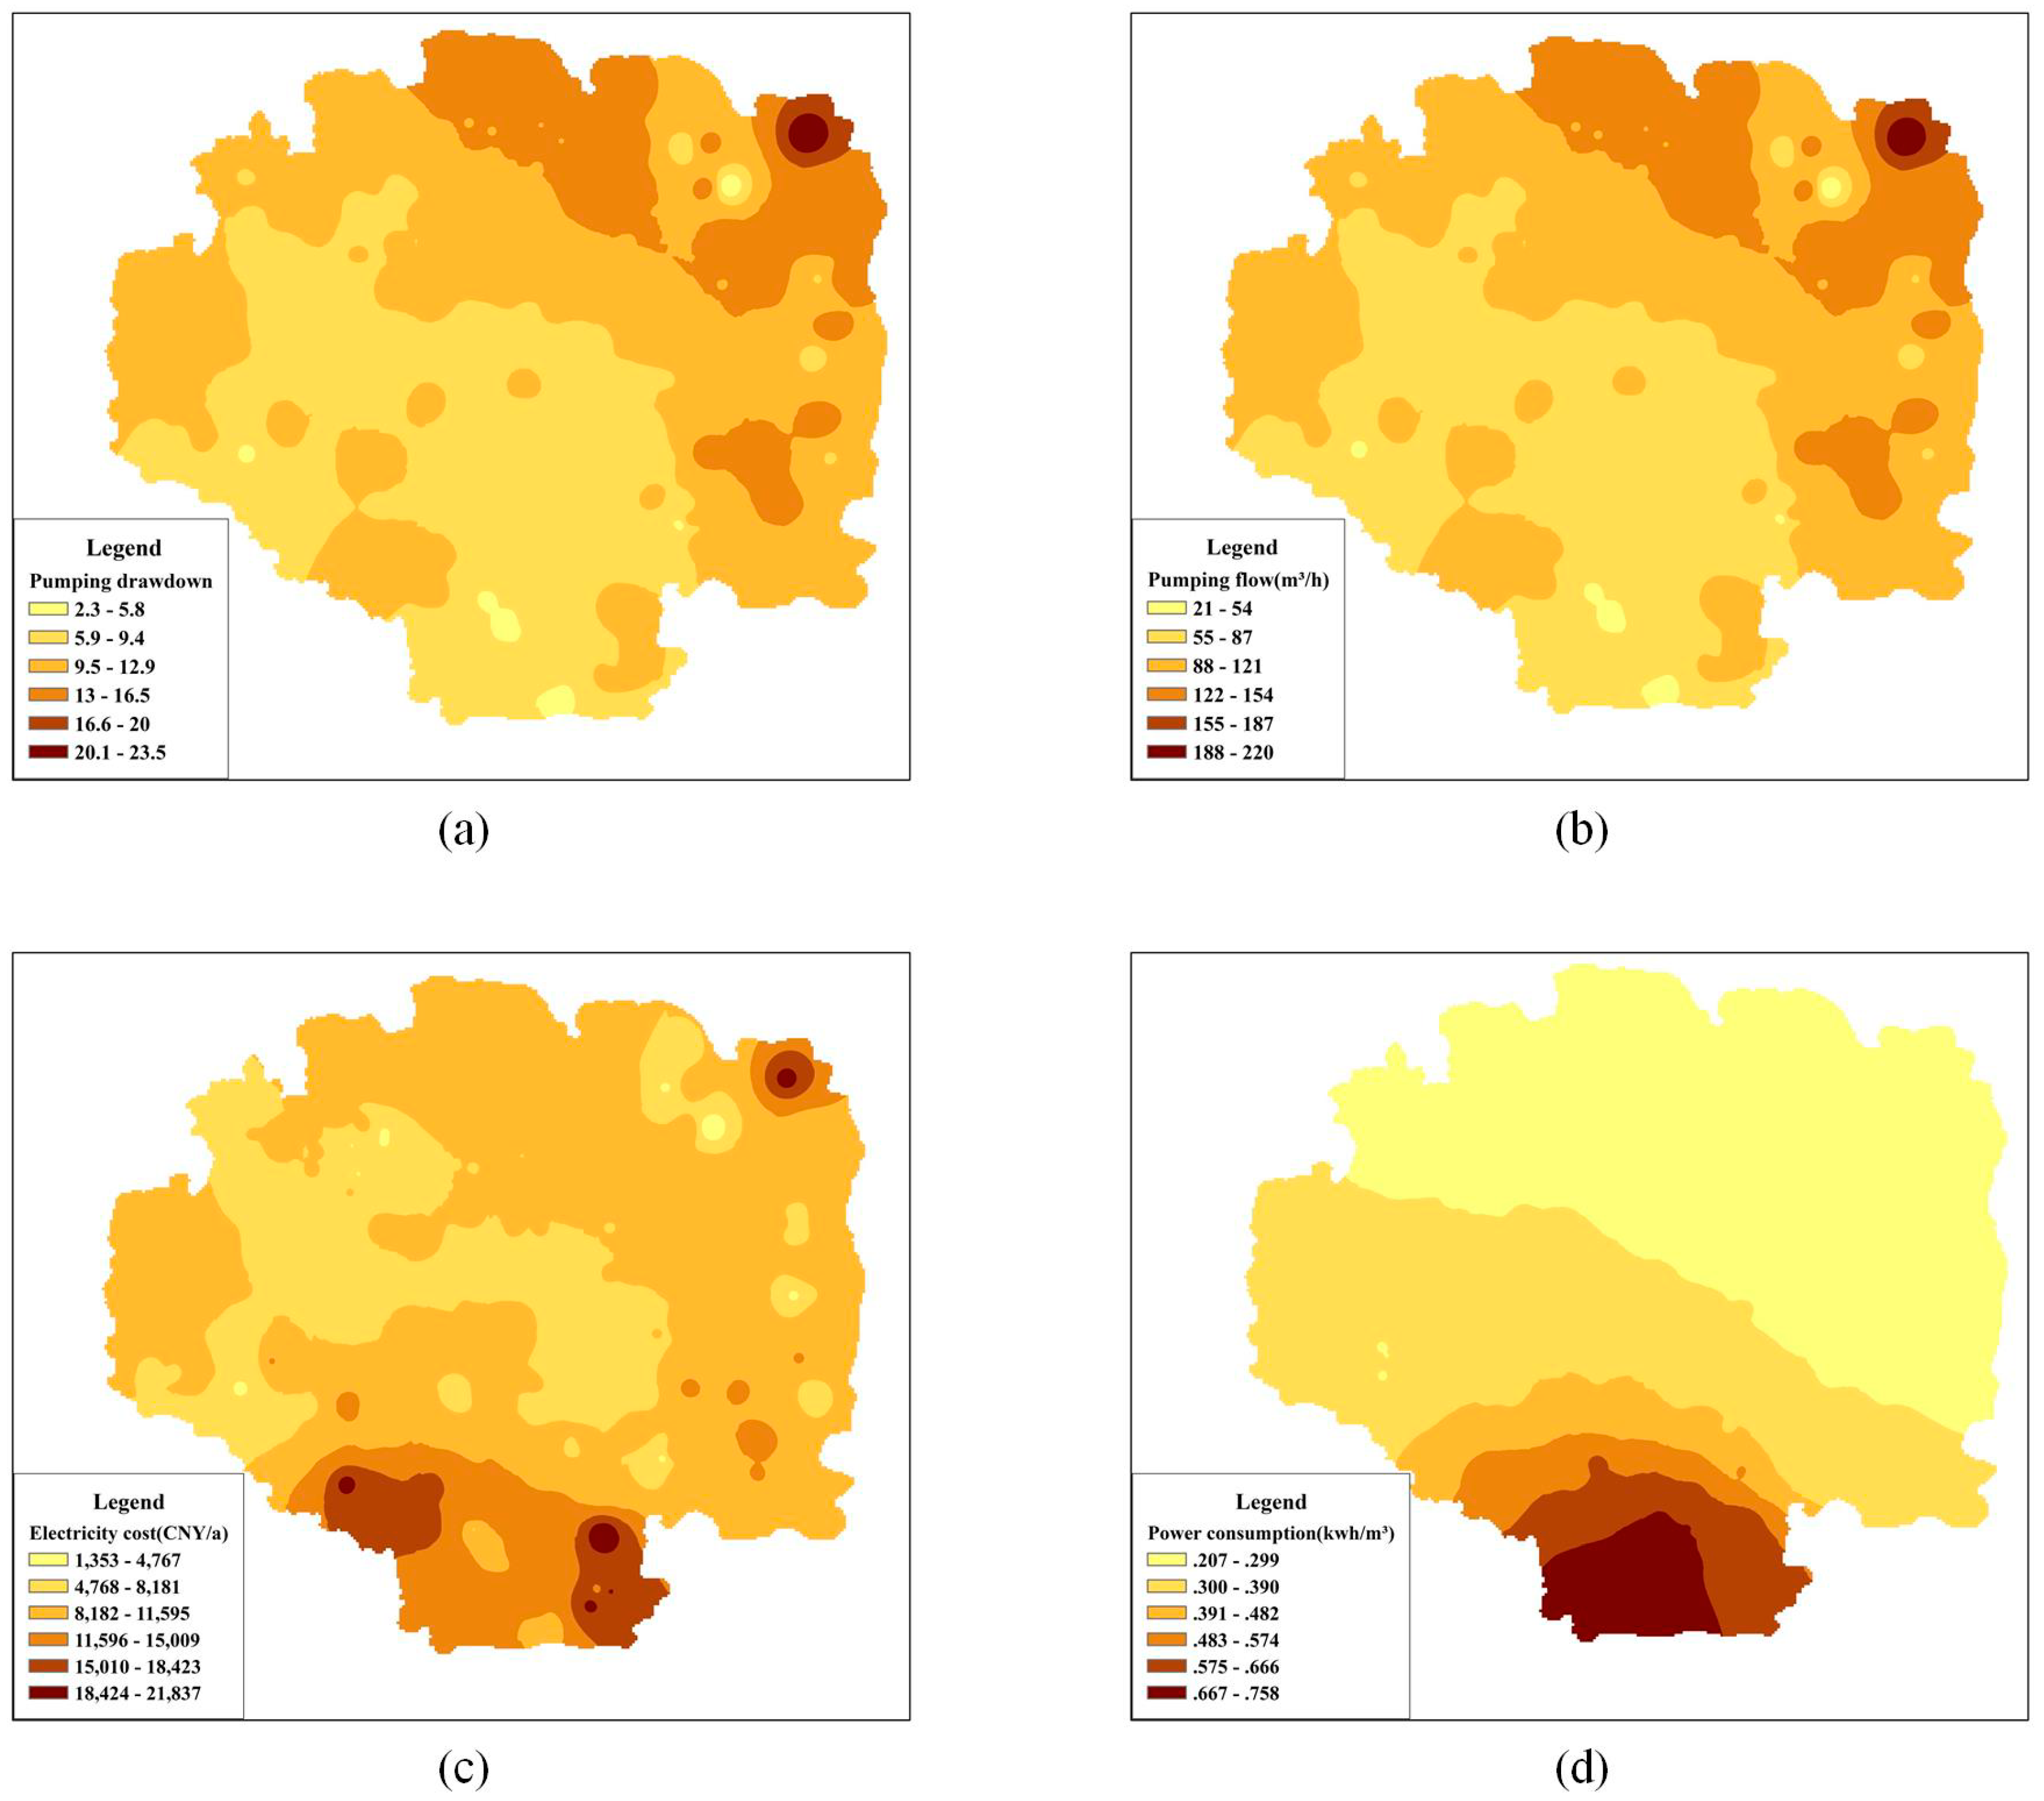
Figure 6 shows the related parameter distribution of ICO in Cele Oasis: (1) Figure 6a shows the pumping drawdown distribution, (2) Figure 6b shows the rated pumping flow distribution, (3) Figure 6c shows the single well electricity cost distribution, (4) Figure 6d shows the unit power consumption (kW·h/m3) distribution. Figure 7 shows the related parameter distribution of ECO in Cele Oasis: (1) Figure 7a shows the pumping drawdown distribution, (2) Figure 7b shows the rated pumping flow distribution, (3) Figure 7c shows the single well electricity cost distribution, (4) Figure 7d shows the unit power consumption (kW·h/m3) distribution. As shown in Figure 6a and Figure 7a, the trend is opposite from the water table distribution in Cele Oasis, which illustrates that the optimal results based on the minimum irrigation cost also have a role in curbing the groundwater decline. The average well drawdown of ICO is obviously higher than that of ECO due to the reduction of pumping wells. Figure 6b and Figure 7b have the same trend as the drawdown distribution. As shown in Figure 6c and Figure 7c, the single well electricity cost is primarily influenced by the groundwater depth and pumping flow. Moreover, the distribution is smoother, and the costly area of well electricity cost is smaller than the deepest area of the water table. As shown in Figure 6d and Figure 7d, the unit power consumption (kW·h/m3) distribution is primarily affected by groundwater depth and drawdown. Due to the higher average drawdown of ICO, the unit power consumption of ICO is also higher than that of the same area of ECO, and the groundwater depth is obviously the primary indicator of this.
In general, the results of the optimizations illustrate that groundwater depth usually plays a significant role in well layout based on the distribution of the groundwater depths and the consideration of the role of groundwater in the irrigation area. The overall plan for the Cele Oasis consists of the following suggestions: (1) well layout and pumping flow distribution suggestion, both results aiming at different economic criteria were rationally optimized in terms of the reserved well number, well layout and the irrigation costs are more scientific, which provide rational reference proposal that help managers in the Water Resources Bureau of Cele County comprehensively determine the well layout plan more scientifically; (2) surface water distribution suggestion, the Water Resources Bureau of Cele County could distribute more surface water to the southwestern area due to the trends found of unit electricity consumption and average electricity cost of the wells. (3) crop type distribution suggestion, the Agricultural Bureau of Cele County could distribute more high economic value crops and crops that require high irrigation assurance rates to the less unit electricity consumption and average electricity cost areas to take advantage of the assurance of high groundwater supply. For existing crops in Cele district, Jujube has higher economic value and requires higher irrigation assurance rates to ensure higher yields that is more suitable to utilize groundwater to irrigate, other than this, walnut and cotton have higher drought resistance that is suitable to be distributed to use more surface water.
4. Conclusions
Optimization of irrigation well layout plays a vital role in the rational use of groundwater and in balancing the water–energy nexus, especially in arid irrigation districts. In this study, a method focused on optimizing the layout of irrigation wells was developed by using a mathematical programming technique called mixed integer linear programming (MILP). The model with the lowest irrigation cost not only obtained the optimal layout of the well positions, but it also distributed the pumping flows optimally.
The Cele Oasis, an arid region in northwestern China, was chosen as the study area, and two optimization results were obtained aiming at different economic criteria as implicit cost and explicit cost. The model optimization results showed that both ICO and ECO are feasible and rational in the Cele Oasis. ICO and ECO not only reduced the total cost by 7.64% and 3.56%, respectively, but they also reduced the existing well numbers by 52.89% and 10.74%, respectively, compared with no optimization under the condition of meeting equal irrigation needs. Through the analysis of optimal wells spatial layout, the related assumption and simplification do work for the expression of constraints intuitively, the depreciation cost has a significant influence on the optimal wells spatial layout that reduces the number of optimal wells evidently. Through the comparison of well related parameters, although the water table in Cele Oasis has primarily influence on the pumping cost, the trend can be mitigated by rational wells layout optimization and optimal pumping flow distribution. Furthermore, three recommendations on well layout and pumping flow distribution, surface water distribution, and crop type distribution were submitted to the Water Resources Bureau of Cele County and the Agricultural Bureau of Cele County.
In general, this research provides a novel method to optimize the well layout and well flow distribution with the goal of minimizing irrigation costs, which can obtain well layout and rated pumping flow distribution optimally, efficiently, and effectively. Furthermore, this method can provide valuable information for district managers and new ideas for solving similar problems in other areas.
Author Contributions
Conceptualization, J.W. and H.S.; methodology, T.M. and J.W.; software, T.M.; formal analysis, T.M.; investigation, Y.L. and J.X.; data curation, D.G.; writing—original draft preparation, T.M.; visualization, T.M.
Funding
This work was supported by the National Key Research and Development Program of China (2016YFC0401910), the National Natural Science Foundation of China (51879110, U1603343, 91547208, 41601595), the National Natural Science Foundation of China (U1603343), Hubei Natural Science Foundation (2017CFB724), Hubei Provincial Water Resources Key Scientific Research Project (HBSLKY201803), Xinjiang Uygur Autonomous Region (Shanghai cooperation organization science and technology partnership project) (2017E01029) and Fundamental Research Funds for the Central Universities (HUST 2016YXZD048, 2017KFYXJJ200).
Acknowledgments
We are grateful for the assistances of figure preparation by Xianneng Zha and Guoqing Cai in Huazhong University of Science and Technology. At the end, Teng Ma wants to pay his gratitude and thanks to Zewei Wang for unconditional support and encouragement: “Two years of Long Distance love was as tough as my first paper, but we all strive to insist and have reason to believe everything will be better.”.
Conflicts of Interest
The authors declare no conflict of interest.
References
- Liu, X.; Wang, S.; Huo, Z.; Li, F.; Hao, X. Optimizing layout of pumping well in irrigation district for groundwater sustainable use in northwest China. Hydrol. Process. 2015, 29, 4188–4198. [Google Scholar] [CrossRef]
- Yang, Y.C.E.; Ringler, C.; Brown, C.; Mondal, M.A.H. Modeling the Agricultural Water–Energy–Food Nexus in the Indus River Basin, Pakistan. J. Water Resour. Plan. Manag. 2016, 142, 04016062. [Google Scholar] [CrossRef]
- Yan, D.; Jia, Z.; Xue, J.; Sun, H.; Gui, D.; Liu, Y.; Zeng, X. Inter-Regional Coordination to Improve Equality in the Agricultural Virtual Water Trade. Sustainability 2018, 10, 4561. [Google Scholar] [CrossRef]
- Sun, H.; Yang, Y.; Wu, R.; Gui, D.; Xue, J.; Liu, Y.; Yan, D. Improving Estimation of Cropland Evapotranspiration by the Bayesian Model Averaging Method with Surface Energy Balance Models. Atmosphere 2019, 10, 188. [Google Scholar] [CrossRef]
- Liu, Y.; Chen, S.; Sun, H.; Gui, D.; Xue, J.; Lei, J.; Zeng, X.; Lv, G. Does the long-term precipitation variations and dry-wet conditions exist in the arid areas? A case study from China. Quat. Int. 2019. [Google Scholar] [CrossRef]
- Zhang, Y.; Sun, A.; Sun, H.; Gui, D.; Xue, J.; Liao, W.; Yan, D.; Zhao, N.; Zeng, X. Error adjustment of TMPA satellite precipitation estimates and assessment of their hydrological utility in the middle and upper Yangtze River Basin, China. Atmos. Res. 2019, 216, 52–64. [Google Scholar] [CrossRef]
- Alley, W.M.; Healy, R.W.; LaBaugh, J.W.; Reilly, T.E. Flow and Storage in Groundwater Systems. Science 2002, 296, 1985–1990. [Google Scholar] [CrossRef] [Green Version]
- Gorelick, S.M.; Zheng, C. Global change and the groundwater management challenge. Water Resour. Res. 2015, 51, 3031–3051. [Google Scholar] [CrossRef]
- Taylor, R.G.; Scanlon, B.; Döll, P.; Rodell, M.; van Beek, R.; Wada, Y.; Longuevergne, L.; Leblanc, M.; Famiglietti, J.S.; Edmunds, M.; et al. Ground water and climate change. Nat. Clim. Chang. 2012, 3, 322. [Google Scholar] [CrossRef]
- Siebert, S.; Burke, J.; Faures, J.M.; Frenken, K.; Hoogeveen, J.; Döll, P.; Portmann, F.T. Groundwater use for irrigation—A global inventory. Hydrol. Earth Syst. Sci. 2010, 14, 1863–1880. [Google Scholar] [CrossRef]
- Xia, J.; Wu, X.; Zhan, C.; Qiao, Y.; Hong, S.; Yang, P.; Zou, L. Evaluating the Dynamics of Groundwater Depletion for an Arid Land in the Tarim Basin, China. Water 2019, 11, 186. [Google Scholar] [CrossRef]
- Tromboni, F.; Bortolini, L.; Antonio Morabito, J. Integrated hydrologic–economic decision support system for groundwater use confronting climate change uncertainties in the Tunuyán River basin, Argentina. Environ. Dev. Sustain. 2014, 16, 1317–1336. [Google Scholar] [CrossRef]
- Gaur, S.; Dave, A.; Gupta, A.; Ohri, A.; Graillot, D.; Dwivedi, S.B. Application of Artificial Neural Networks for Identifying Optimal Groundwater Pumping and Piping Network Layout. Water Resour. Manag. 2018, 32, 5067–5079. [Google Scholar] [CrossRef]
- Aguado, E.; Remson, I. Groundwater Hydraulics in Aquifer Management. J. Hydraul. Div. 1974, 100, 103–118. [Google Scholar]
- Maddock Iii, T. Algebraic technological function from a simulation model. Water Resour. Res. 1972, 8, 129–134. [Google Scholar] [CrossRef]
- Rosenwald, G.W.; Green, D.W. A Method for Determining the Optimum Location of Wells in a Reservoir Using Mixed-Integer Programming. SPE-3981-PA 1974, 14, 44–54. [Google Scholar] [CrossRef]
- McKinney, D.C.; Lin, M.-D. Approximate Mixed-Integer Nonlinear Programming Methods for Optimal Aquifer Remediation Design. Water Resour. Res. 1995, 31, 731–740. [Google Scholar] [CrossRef]
- Bayer, P.; Duran, E.; Baumann, R.; Finkel, M. Optimized groundwater drawdown in a subsiding urban mining area. J. Hydrol. 2009, 365, 95–104. [Google Scholar] [CrossRef]
- Bayer, P.; Finkel, M. Evolutionary algorithms for the optimization of advective control of contaminated aquifer zones. Water Resour. Res. 2004, 40. [Google Scholar] [CrossRef] [Green Version]
- Moharram, S.H.; Gad, M.I.; Saafan, T.A.; Allah, S.K. Optimal Groundwater Management Using Genetic Algorithm in El-Farafra Oasis, Western Desert, Egypt. Water Resour. Manag. 2012, 26, 927–948. [Google Scholar] [CrossRef]
- Shourian, M.; Davoudi, S.M.J. Optimum Pumping Well Placement and Capacity Design for a Groundwater Lowering System in Urban Areas with the Minimum Cost Objective. Water Resour. Manag. 2017, 31, 4207–4225. [Google Scholar] [CrossRef]
- Yeh, W.W.-G. Review: Optimization methods for groundwater modeling and management. Hydrogeol. J. 2015, 23, 1051–1065. [Google Scholar] [CrossRef]
- Ling, H.; Yan, J.; Xu, H.; Guo, B.; Zhang, Q. Estimates of shifts in ecosystem service values due to changes in key factors in the Manas River basin, northwest China. Sci. Total Environ. 2019, 659, 177–187. [Google Scholar] [CrossRef] [PubMed]
- Ainiwaer, M.; Ding, J.; Wang, J.; Nasierding, N. Spatiotemporal Dynamics of Water Table Depth Associated with Changing Agricultural Land Use in an Arid Zone Oasis. Water 2019, 11, 673. [Google Scholar] [CrossRef]
- Li, Q.; Yang, T.; Qi, Z.; Li, L. Spatiotemporal Variation of Snowfall to Precipitation Ratio and Its Implication on Water Resources by a Regional Climate Model over Xinjiang, China. Water 2018, 10, 1463. [Google Scholar] [CrossRef]
- Li, X.; Cheng, G.; Ge, Y.; Li, H.; Han, F.; Hu, X.; Tian, W.; Tian, Y.; Pan, X.; Nian, Y.; et al. Hydrological Cycle in the Heihe River Basin and Its Implication for Water Resource Management in Endorheic Basins. J. Geophys. Res. Atmos. 2018, 123, 890–914. [Google Scholar] [CrossRef]
- Liu, Y.; Xue, J.; Gui, D.; Lei, J.; Sun, H.; Lv, G.; Zhang, Z. Agricultural Oasis Expansion and Its Impact on Oasis Landscape Patterns in the Southern Margin of Tarim Basin, Northwest China. Sustainability 2018, 10, 1957. [Google Scholar] [CrossRef]
- Wang, Q.; Zhang, Y.; Zhao, Y.; Jian, S.; Zhu, Y.; Wang, L.; Zhai, J. Study on the change of irrigation water utilization and energy consumption in well irrigation areas of Hebei Province. South-to-North Water Transf. Water Sci. Technol. 2018, 16, 154–159. [Google Scholar]
- Cooper, H.H. A generalized graphical method for evaluating formation constants and summarizing well-field history. Eos Trans. Am. Geophys. Union 1946, 27, 526–534. [Google Scholar] [CrossRef]
- Theis, C.V. The relation between the lowering of the Piezometric surface and the rate and duration of discharge of a well using ground-water storage. Eos Trans. Am. Geophys. Union 1935, 16, 519–524. [Google Scholar] [CrossRef]
- Gurobi Optimizer Reference Manual. 2018. Available online: http://www.gurobi.com/ (accessed on 6 June 2019).
- Bruelheide, H.; Jandt, U.; Gries, D.; Thomas, F.; Foetzki, A.; Buerkert, A.; Gang, W.; Ximing, Z.; Runge, M. Vegetation changes in a river oasis on the southern rim of the Taklamakan Desert in China between 1956 and 2000. Phytocoenologia 2003, 33, 801–818. [Google Scholar] [CrossRef]
- Xue, J.; Gui, D.; Lei, J.; Sun, H.; Zeng, F.; Mao, D.; Zhang, Z.; Jin, Q.; Liu, Y. Oasis microclimate effects under different weather events in arid or hyper arid regions: A case analysis in southern Taklimakan desert and implication for maintaining oasis sustainability. Theor. Appl. Climatol. 2018. [Google Scholar] [CrossRef]
- Xue, J.; Gui, D.; Lei, J.; Zeng, F.; Mao, D.; Zhang, Z. Model development of a participatory Bayesian network for coupling ecosystem services into integrated water resources management. J. Hydrol. 2017, 554, 50–65. [Google Scholar] [CrossRef]
Figure 1.
Schematic diagram of a well location and grid point.

Figure 2.
Location of the Cele Oasis.

Figure 3.
Layout of existing wells and groundwater depths in the Cele Oasis as (a) well layout in the Cele Oasis; (b) groundwater depth contours in the Cele Oasis.
Figure 3.
Layout of existing wells and groundwater depths in the Cele Oasis as (a) well layout in the Cele Oasis; (b) groundwater depth contours in the Cele Oasis.

Figure 4.
Well layouts of implicit cost optimization (ICO) in the Cele Oasis: (a) well optimization layout, (b) well optimization irrigation radius layout, (c) well optimization influence radius layout, and (d) recommended closed well layout.
Figure 4.
Well layouts of implicit cost optimization (ICO) in the Cele Oasis: (a) well optimization layout, (b) well optimization irrigation radius layout, (c) well optimization influence radius layout, and (d) recommended closed well layout.

Figure 5.
Well layout of explicit cost optimization (ECO) in the Cele Oasis: (a) well optimization layout, (b) well optimization irrigation radius layout, (c) well optimization influence radius layout, and (d) recommended closed well layout.
Figure 5.
Well layout of explicit cost optimization (ECO) in the Cele Oasis: (a) well optimization layout, (b) well optimization irrigation radius layout, (c) well optimization influence radius layout, and (d) recommended closed well layout.

Figure 6.
Well related parameter comparisons of ICO in the Cele Oasis: (a) the pumping drawdown distribution, (b) the well pumping flow distribution, (c) the electricity cost (CNY/a) distribution, and (d) the unit power consumption (kW·h/m3) distribution.
Figure 6.
Well related parameter comparisons of ICO in the Cele Oasis: (a) the pumping drawdown distribution, (b) the well pumping flow distribution, (c) the electricity cost (CNY/a) distribution, and (d) the unit power consumption (kW·h/m3) distribution.

Figure 7.
Well related parameter comparisons of ECO in the Cele Oasis as (a) the pumping drawdown distribution, (b) the well pumping flow distribution, (c) the electricity cost (CNY/a) distribution, (d) the unit power consumption (kW·h/m3) distribution.
Figure 7.
Well related parameter comparisons of ECO in the Cele Oasis as (a) the pumping drawdown distribution, (b) the well pumping flow distribution, (c) the electricity cost (CNY/a) distribution, (d) the unit power consumption (kW·h/m3) distribution.


Table 1.
Crop irrigation area and water demand.
| Crop | Irrigation Area (hm2) | Proportion of Total Area (%) | Net Irrigation Water Demand during Irrigation Period (m3/hm2) |
|---|---|---|---|
| Jujube | 15177 | 59.4 | 7695 |
| Walnut | 5877 | 23 | 5190 |
| Pomegranate | 1456 | 5.7 | 6000 |
| Cotton | 1048 | 4.1 | 4995 |
| Other crop | 1993 | 7.8 | 5250 |
| Total | 25,550 | 100 | 6721 |
Table 2.
Related parameters of the Cele Oasis.
| Parameter | Value | Parameter | Value |
|---|---|---|---|
| Wim (CNY) | 500 | t (h) | 15 |
| Ww (CNY) | 60,000 | r (m) | 0.3 |
| ny | 15 | T (m2/day) | 866 |
| Wid (CNY) | 4000 | K (m/day) | 45 |
| p (CNY/kw-h) | 0.2 | Da (m) | 19.7 |
| D (days) | 100 | S | 0.005 |
| m | 0.1831 | ε (m3/(km2·a)) | 361,722 |
| n | 0.02 | q0 (m3/(h·hm2)) | 0.8 |
| Xmax (m) | 1500 | Fj (hm2) | 25 |
| Qmax (m3/h) | 230 | FA (hm2) | 25,550 |
Table 3.
Results of the optimization models.
| Implicit Cost Optimization | Implicit Cost without Optimization | Explicit Cost Optimization | Explicit Cost without Optimization | |
|---|---|---|---|---|
| Total Cost of Irrigation (CNY) | 2,822,498 | 3,056,122 | 2,130,534 | 2,209,122 |
| Electricity Cost (CNY) | 2,366,498 | 2,088,122 | 2,022,534 | 2,088,122 |
| Total Cost Difference (%) | 7.64% | - | 3.56% | - |
| Average Well Flow (m3/h) | 179 | 84 | 95 | 84 |
| Existed well number | 242 | 242 | 242 | 242 |
| Optimized well number | 114 | - | 216 | - |
| Well Number Difference (%) | 52.89% | - | 10.74% | - |
Notes: Implicit cost and explicit cost without optimization are defined by the assumption that each well undertakes same work under the corresponding objective; total cost of irrigation (CNY) is objective value of the corresponding optimization plan; average well flow (m3/h) is average value of reserved well pumping flow.
© 2019 by the authors. Licensee MDPI, Basel, Switzerland. This article is an open access article distributed under the terms and conditions of the Creative Commons Attribution (CC BY) license (http://creativecommons.org/licenses/by/4.0/).
Share and Cite
MDPI and ACS Style
Ma, T.; Wang, J.; Liu, Y.; Sun, H.; Gui, D.; Xue, J. A Mixed Integer Linear Programming Method for Optimizing Layout of Irrigated Pumping Well in Oasis. Water 2019, 11, 1185. https://doi.org/10.3390/w11061185
AMA Style
Ma T, Wang J, Liu Y, Sun H, Gui D, Xue J. A Mixed Integer Linear Programming Method for Optimizing Layout of Irrigated Pumping Well in Oasis. Water. 2019; 11(6):1185. https://doi.org/10.3390/w11061185
Chicago/Turabian StyleMa, Teng, Jinwen Wang, Yi Liu, Huaiwei Sun, Dongwei Gui, and Jie Xue. 2019. "A Mixed Integer Linear Programming Method for Optimizing Layout of Irrigated Pumping Well in Oasis" Water 11, no. 6: 1185. https://doi.org/10.3390/w11061185
Note that from the first issue of 2016, this journal uses article numbers instead of page numbers. See further details here.