Driving Factors and Dynamics of Phytoplankton Community and Functional Groups in an Estuary Reservoir in the Yangtze River, China


College of Environmental Science and Engineering, Tongji University, Shanghai 200092, China
*
Author to whom correspondence should be addressed.
Water 2019, 11(6), 1184; https://doi.org/10.3390/w11061184
Submission received: 14 May 2019
/
Revised: 30 May 2019
/
Accepted: 5 June 2019
/
Published: 6 June 2019
(This article belongs to the Special Issue An Ecological Status Assessment: Phytoplankton Communities in Water Bodies)
Abstract
:Qingcaosha Reservoir, an estuary reservoir on the Yangtze River and a drinking water source, is facing phytoplankton blooms and the factors driving changes in phytoplankton composition and distribution have not been well understood so far. To facilitate the understanding of this problem, we collected surface water samples from January to December 2014 monthly at 12 sampling sites. A total of 205 taxa classified into eight major taxonomic groups were identified. Cyclotella meneghiniana, Melosira varians, Melosira granulata, Cryptomonas ovata and Chlorella vulgaris were the species dominating at least one season. The long stratification period and high nutrient concentration resulted in high chlorophyll a concentration (36.1 ± 18.5 μg L−1) in the midstream and downstream during summer, and mass phytoplankton growth and sedimentation process led to nutrients decrease. In the reservoir, neither P or N limitation was observed in the study period. We observed that water temperature, nutrient concentrations and light availability (Zeu/Zmix) are critical in selecting functional groups. These results highlight that the functional groups characterized the water body well and showed a good ecological status based on the assemblage index (Q average = 4.0). This work also highlights that mixing regime, water temperature and light availability were the driving factors that determine phytoplankton dynamics.

1. Introduction
Estuarine embedded reservoirs, serving as essential drinking water sources for adjacent cities, are sensitive to estuary and coastal environmental changes [1,2,3]. Due to eutrophication and their unique geographical locations, nutrients from land and rivers, salt water invading the estuary [3] and other changes in other variables may influence phytoplankton succession in the reservoir and lead to algae blooms, as eutrophication is a natural process occurring in aquatic systems and eutrophic reservoirs are frequently being dominated by cyanobacteria for considerable periods of time [4]. The acceleration of this process can cause serious threats to water quality and habitat, drinking water supplies, food webs and all aspects of freshwater ecosystems [5]. Many of these phytoplankton blooms are toxic and have the capability of producing several potent neurotoxins and hepatotoxins, which threaten drinking water quality and safety [6]. Therefore, it is very important to understand the characteristics of the phytoplankton community structure and driving factors that control phytoplankton constituents and seasonal variations in reservoirs in the trophic status. Besides, an emphasis on phytoplankton functional group dynamics provides new insights into phytoplankton species adaptation strategies to environmental changes and assessment of the reservoir’s ecological status [7].
In estuary reservoir ecosystems, the phytoplankton community plays important role in nutrient recycling and organic substance degradation [8,9]. Studies have indicated that light and nutrient availability, temperature, conductivity, water stability and retention time are regarded as important chemical and physical factors influencing phytoplankton structure and composition in reservoir ecosystems [10,11,12,13]. Ciric et al. [14] in their study found that thermal stratification and physical mixing processes, and reduction versus oxidation processes were the two main factors that explain variability in phytoplankton in a temperate reservoir. Water column stability and water renewal rate were regarded as factors controlling phytoplankton tropical high-mountain drinking-water reservoirs [15]. In a meso-eutrophic reservoir in subtropical southern Brazil, the mixing regime was the main determining factor governing the seasonal dynamics of the phytoplankton community [16]. In mesotrophic reservoirs, nutrients and hydrodynamic processes play a key role in controlling seasonal phytoplankton successions [17] and determining water quality and ecological status in the reservoir [18,19]. These reservoirs were all inland reservoirs and the driving factors of phytoplankton community successions differ in different kinds of freshwater ecosystems. However, for estuarine reservoirs, the factors that drive changes in phytoplankton community composition and distribution have not been well understood. We still lack knowledge to explain how phytoplankton communities change spatially and temporally, and how this process is influenced by environmental factors in estuarine reservoirs.
Following Reynolds’ [20] work on separating phytoplankton into several functional groups, which may dominate or co-dominate in a given environment, according to species adaptation strategies, the constituent species have similar adaptive traits, and physiological, morphological and ecological attributes. Padisák et al. [21] complemented the previous theory, expanding the functional groups to 38 assemblages according to species’ sensitivities and tolerances by using alphanumeric codes. The functional groups theory can be highlighted with two ideas: (1) a species belonging to a functionally well-adapted group can tolerate the limiting environment of factor deficiency more successfully than a less adapted species; (2) a light, P, or C or N constrained habitat is more likely to be populated by species with the appropriate adaptation properties [20]. Although phytoplankton functional groups have been described for lakes, this approach has also been applied to certain types of reservoirs in various regions [12,16,22,23,24]. This has proved to be a useful method of evaluating ecological status in reservoir ecosystems.
Qingcaosha Reservoir, a newly built artificial reservoir located in the Yangtze River estuary, serves as a drinking water source that provides Shanghai with more than 7 million cubic metres of water daily [25]. Because of excessive nutrient loading and its shallowness with a long hydraulic retention time (approximately 25 days) the reservoir still faces the threat of eutrophication issues, such as cyanobacterial blooms. Previously, results of a two year study indicated that the reservoir is reaching the mesotrophic–eutrophic boundary, where further nutrient enrichment could cause water quality degradation [26]. A microbial community study showed high cyanobacteria biomasses occurred during summer seasons [27]. However, little work has been done to demonstrate phytoplankton community dynamics and the governing factors driving algal successions inside Qingcaosha Reservoir. Though the trophic state has been well understood by researchers, the ecological status of this water body has rarely been recognized using practical methods. As far we know our study is the first to use a phytoplankton functional groups approach to reveal the ecological status dynamics in this reservoir. We hope this research may provide significant insight into understanding phytoplankton species succession processes and selection dynamics in estuary reservoir.
In light of previous studies on this reservoir that elucidated prokaryotic and eukaryotic microbe dynamics [8] and the variation of phytoplankton and environmental factors by using PCR-DGGE technology [27], we hypothesized that there are specific patterns in the composition and functioning of phytoplankton communities, and that nutrient concentrations, mixing regime and hydraulic conditions are the main factors that control phytoplankton dynamics in this reservoir. To approve our hypothesis, in this study we (1) characterized the physical and chemical conditions in the river and reservoir, and analyzed phytoplankton community traits and dominant species in different seasons; (2) used the functional groups approach and the assemblage index to evaluate the reservoir’s ecological status; (3) identified the driving forces causing variations in phytoplankton community and functional groups dynamic. This work will be helpful in aiding reservoir management by providing scientific information.
2. Materials and Methods
2.1. Study Area and Sampling
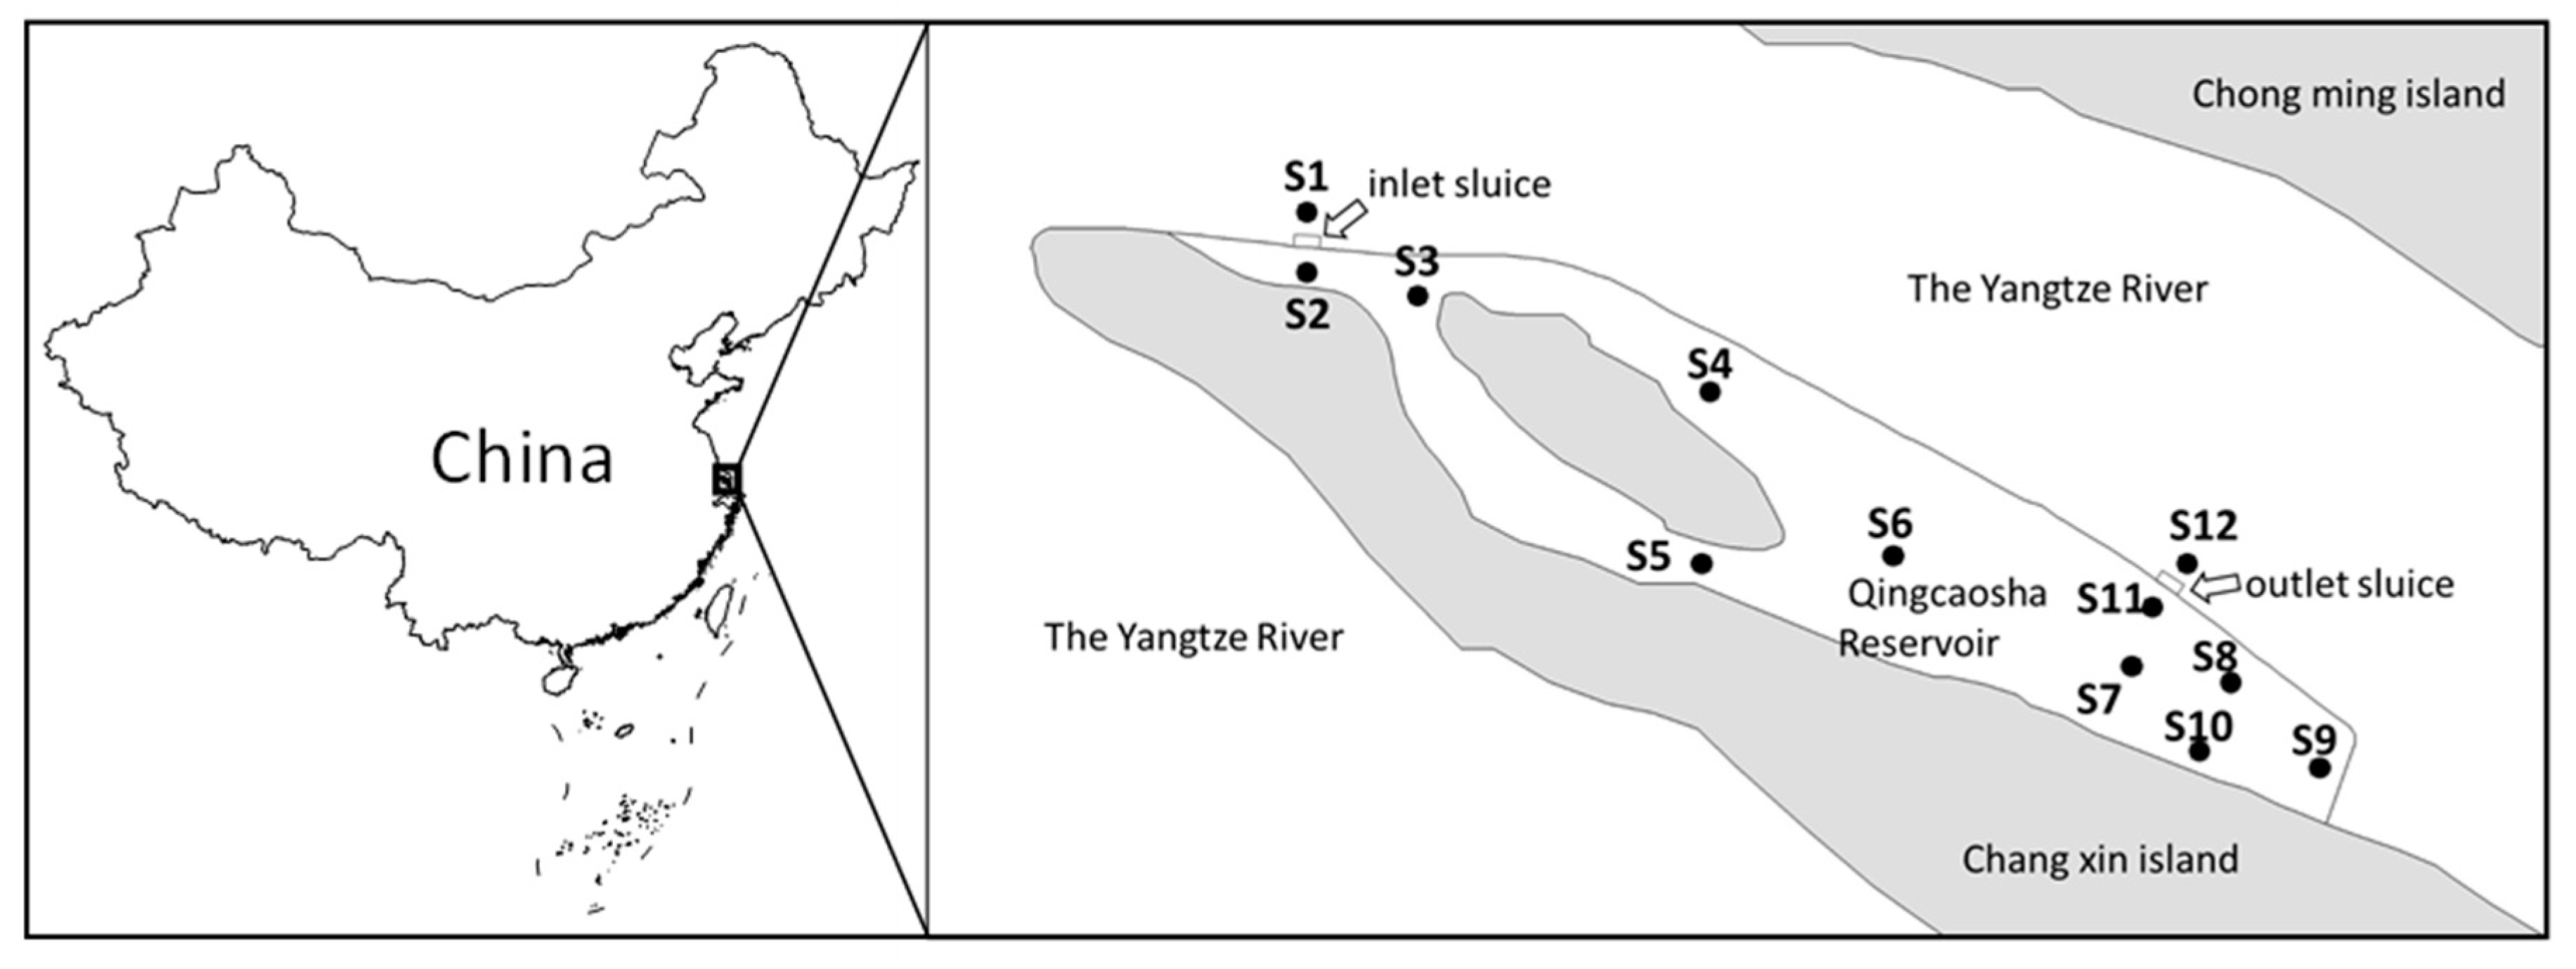
Qingcaosha Reservoir is in the middle of the Yangtze River estuary and adjacent to a small island (31°27′ N; 121°38′ E), built in 2009 and operational in 2010 with a depth range from 2.5 m to 13.5 m, a designed hydraulic retention time of 25 days and an approximation area of 66.27 km2 [28,29]. The reservoir supplies 10 million inhabitants in Shanghai city with 7 million m3 drinking water per day. Since the river receives strong inputs from upstream cities and agriculture, the inflow from the river may cause the reservoir become eutrophic. The local subtropical monsoon climate has an annual mean temperature of 17.1 °C and an annual mean total precipitation of 1159 mm, with a warm humid summer average temperature of 28.6 °C in July and a dry winter average temperature of 4.8 °C in January. Daily wind speed and temperature during our study period are shown in Figure S1.
We set up 12 sampling sites in our research period (Figure 1) with S1 located outside the inlet sluice and S12 outside the outlet sluice in Yangtze River estuary. S2 and S3 were set near the inlet sluice representing the upstream section of the reservoir, S4 to S6 were in the middle of the reservoir, S7 to S11 were set in the downstream section of the reservoir. All sampling sites were determined by using global positioning system (GPS).
Water samples were collected from January 2014 to December 2014 at monthly intervals at every sampling site. The sampling was always taken from 9 am to 1 pm by using a designed boat. Water temperature (WT), pH, oxygen concentration (DO) and conductivity (EC) were measured three times (HQ40d, HACH, Loveland, CO, USA) on site at a depth of 0.5 m under the water surface. Secchi depth (SD) was measured using standard Secchi disk at each sampling site. Water samples were collected for nutrient determination and all field samples were preserved in 1 L plastic bottles kept in a mobile ice box, and analyzed in the laboratory within 24 h.
For the phytoplankton community, we collected another 1 L surface water sample and fixed the sample with neutral Lugol’s solution. All samples were transported to our laboratory then kept in a refrigerator at 4 °C and analyzed as soon as possible.
2.2. Sample Analyses
Physical and chemical parameters were measured after sample collection for the whole duration of this study. Parameters for nutrients were analyzed, such as total nitrogen (TN), ammonium (NH4+), nitrate (NO3−), total phosphorus (TP), and soluble reactive phosphorus (PO43−). TN and TP were analyzed using unfiltered water samples, other nutrient indices such as total dissolved phosphorus (TDP) and dissolved organic carbon (DOC) were analyzed using samples filtered through 0.45 μm glass microfiber filters (GF/C, Whatman, Maidstone, UK). The variables shown above were measured using UV-VIS spectrophotometer (UV-2450) Shimadzu (Kyoto, Japan) according to the standard methods for the determination of water and waste water [30]. DOC samples were treated by catalytic oxidation at high temperature and measured using a Shimadzu analyzer (TOC V-CPN) with NDIR detector. Suspended solids (SS), normalized by volume, was measured as the additional dry weight after filtration and drying at 105 °C for more than four hours. Phyto-PAM (pulse amplitude modulated fluorometer), coupled to Win-Control software (Heinz Walz GmbH, Effeltrich, Germany), was used in our study, calibrated by standard profiles and all samples were measured at a setting of Measure Frequency of 32.
Phytoplankton species identification was carried out using a CX-21 microscope (Olympus, Tokyo, Japan) counted at 400× magnification, the units (cells, colonies or filaments) were noted in random fields, and 1000× magnification was used for species identification. After 48 h to allow phytoplankton to deposit, samples were concentrated to 30 mL by using a syphonage method and stored at 4 °C. Then, each sample was added into a 0.1 mL counting chamber (20 × 20 mm), and phytoplankton species were identified and counted according to Hu et al. [31]. The phyla examined in our research were Bacillariophyta, Chlorophyta, Cyanophyta, Euglenophyta, Cryptophyta, Chrysophyta, Pyrrophyta and Xanthophyta. The phytoplankton data in December was not obtained.
2.3. Data Analysis
In our study, spring was defined as March, April and May, summer was defined as June, July and August, autumn was defined as September, October and November, and winter was defined as December, January and February. The euphotic zone (Zeu) was calculated as 2.7 times the Secchi depth [32]. The mixing zone (Zmix) was estimated from the temperature profiles, using method [33,34] which defined the mixing depth as the depth at which the temperature difference from the surface did not exceed 1 degree. The ratio between the euphotic and mixing depths (Zeu/Zmix) was used as a measure of light availability [35]. Trophic state index (TSI) values were calculated based on the method described in the study of Liu et al. [26]. For main nutrient seasonal variation in each section, sampling sites were taken for replicates as follows: S1 and S12 for estuary, S2 and S3 for upstream, S4 to S6 for midstream, S7 to S11 for downstream.
The algal biovolume was determined using formulae for geometric shapes [36], and the fresh weight was expressed as a mass, where 1 mm3 L−1 = 1 mg L−1 [37]. The species contributing >5% to the total biomass were combined into functional groups, using the criteria of Reynolds et al. [20] and Padisák et al. [21]. The assemblage index (Q index) used in this study was described in Padisák et al. [38], which defines different reference conditions for different habitat types instead of having only one “pristine condition” for all lake types. The factor F of each functional group was determined according to type one due to the similarity of typology and previous study [39] conducted in reservoir at midstream of Yangtze river was taken as alternative reference. Five levels of classification for the Q index were considered as follows: 0–1: very poor; 1–2: tolerable; 2–3: medium; 3–4: good; and 4–5: excellent.
We used principal components analysis (PCA) to analyze chemical and physical changes on spatial and temporal levels. For the ordination analysis, we transformed the abiotic and biological data by logx + 1 [7]. Water temperature (WT), dissolved oxygen (DO), conductivity (EC), pH, Zeu, nitrate (NO3−), ammonium (NH4+), PO43−(SRP), total nitrate (TN), total phosphorous (TP), and Chl a were included. Variance analysis (one-way ANOVA) was used to compare means. Non-parametric correlation (Spearman) analyses were used to test relationships among the environmental variables and Bonferroni’s method was used for multiple comparison correction. Statistical analysis was performed using the SPSS 22.0 statistical package software (IBM, Armonk, NY, USA) and the level of significance used was P < 0.05 for all tests.
3. Results
3.1. Variability of Physical and Chemical Factors Inside and Outside the Reservoir
WT is a significant environmental index in the water column, influencing the phytoplankton community directly. During our research period, the mean value of WT was 16.3 °C, with the highest 25.8 °C in summer and lowest 6.8 °C in winter (Table 1). The mean pH varied between 7.3 and 8.3. Considering that the reservoir located in the Yangtze River estuary and salt water may flow into this reservoir during high tides, EC was affected by saline water in the dry season, with mean values of 473 μS cm−1 and 363 μS cm−1 in spring and winter, and 166 μS cm−1 and 182 μS cm−1 in summer and autumn, respectively. EC increased to its highest level in spring, reaching 838 μS cm−1 in April (Table. 1), the seasonal variation was obvious, however we did not find significant spatial differences among these four sections of the reservoir (ANOVA, P > 0.05). Besides, salinity intrusion (approximately 15 days) was observed at the estuary in February with EC value reached 5430 μS cm−1, which resulted in closure of the inlet sluice during salinity intrusion.
Other determinants also showed a similar trend. Mean DO concentration in the epilimnion varied from 8.2 mg L−1 (summer) to 11.4 mg L−1 (winter), strongly related to WT (Table 1). Nutrients were also seasonally variable, driven by the raw water entering the reservoir. The nutrients levels in the reservoir were greatly influenced by the water quality in the Yangtze River. Total phosphorous (TP) and total nitrogen (TN) were high during entire research period, similar patterns applying to dissolved nutrients. TP inside the reservoir was much lower than in the Yangtze River and TP decreased sharply throughout the stratification period from spring to summer in the estuary and upstream (Figure 2a). In summer, TP reached its lowest value in the whole area of the reservoir, a remarkable decrease in July was observed (Figure 2a). Decrease of TP in summer may resulted from large amount of precipitation from June to September (Figure S2). TN showed a seasonal pattern where its concentration decreased from the beginning of spring to the end of autumn then increased again in winter. The NH4+ declined greatly from the end of winter to the beginning of summer, showing a similar trend to TP, TN, NO3−; and then rises in winter (Figure 2). Differences were observed between the estuary and the whole reservoir for TN, TP, PO43− and NO3−, whereas no significant differences were found between the midstream and downstream (P > 0.05). The TSI value fluctuated between 54.26 and 57.57 during the study period, indicating that the reservoir was a light-eutrophic system.
Both TP and TN reached their lowest concentrations 0.11 mg L−1 and 1.54 mg L−1 in autumn, respectively (Table 1). Total dissolved phosphorous comprised 33%–55% of the TP, of which 48%–74% was PO43− during whole research period. NO3− constitutes of 70%–100% of the TN, indicating that dissolved inorganic nitrogen was a large fraction of TN. The TN/TP ratio remained high in winter and then decreased to its lowest value in summer, reaching 9.37 (Figure S3). It can be seen from Figure 2 that nutrient levels were much lower in the reservoir than in the raw water. The nutrients were positively correlated with SS and negatively correlated with Chl a (Table 2).
The Chl a concentration increased from spring to summer, reaching two peaks in July and September, with the lowest value of 2.14 μg L−1 measured outside the reservoir in march and the highest value of 70.00 μg L−1 measured in the middle part of the reservoir in July (Figure 2f). The average Chl a concentration in the estuary, upstream, midstream and downstream section of the reservoir were 4.41, 10.18, 28.58 and 24.32 μg L−1, respectively. There were significant spatial differences between upstream and downstream (P < 0.05), while Chl a variation showed similar seasonal pattern in the midstream and downstream (P > 0.05). High Chl a concentration (36.1 ± 18.5 μg L−1) in the midstream and downstream was observed during summer. The midstream value was the highest followed by the downstream values in summer and autumn (Figure 2f). Dissolved organic carbon (DOC) generally varied from 2.06 mg L−1 to 5.13 mg L−1. DOC concentrations were much higher in autumn and winter than in spring and summer, especially in January when the mean value reached the peak of 10.83 mg L−1 (Figure S3). The DOC concentration inside Qingcaosha Reservoir was much higher than in Yangtze River in spring and autumn, but not in winter and summer.
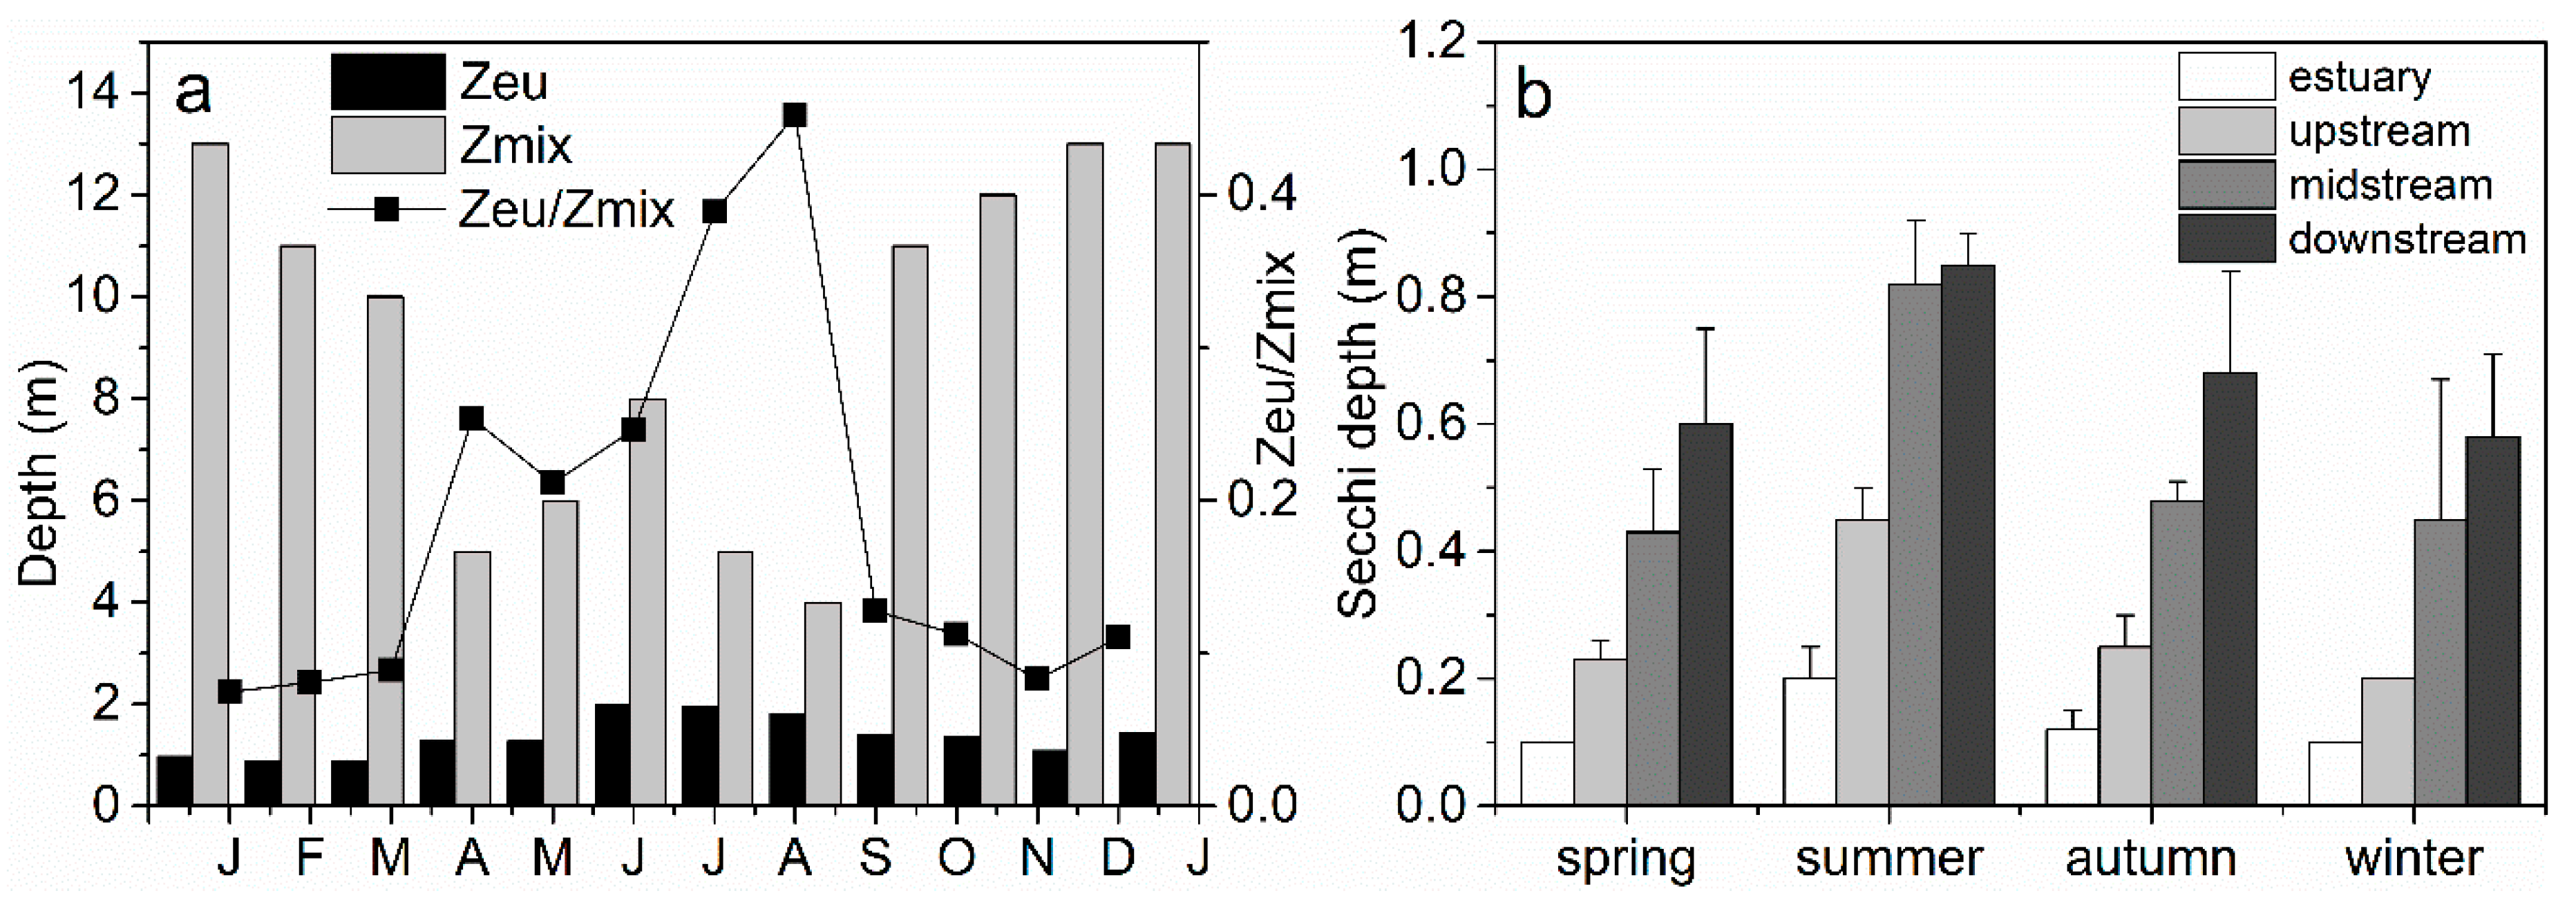
Two periods describing water mixing regime were recognized according to Zmix changes: summer stratification and winter mixing. The Zeu/Zmix ratio explained the availability of light in the water column as important indicator that determines phytoplankton selection. The euphotic zone (Zeu) values were low all year round, ranged from 0.89 m to 1.97 m with the highest value in summer and lowest value in winter (Figure 3a). The entire water column was almost mixed during September and December with 11 to 13 m mixing zones, whereas the water column was stratified from April to August. In the study period, light reached only 8–45% of the mixing zone, the availability of light increased from spring to early summer in the mixing zone, reaching 45% in August and decreasing to 8% by the beginning of autumn (Figure 3b). The SD increased from the estuary to the downstream of the reservoir in all season and reached the highest value of 0.20, 0.45, 0.82 and 0.85 m for the estuary, upstream, midstream and downstream of the reservoir in summer, respectively (Figure 3b). These results indicated that light condition in the water column changed significantly after the water flow into the reservoir (P < 0.05).
Chl a concentration was negatively correlated with nutrients (TN, TP, PO43−, NO3− and SS) and positively correlated with Zeu (Table 2). In the midstream, Chl a concentration was negatively correlated with TN, NO3−, EC and DO, and positively correlated with WT and Zeu. In the downstream, Chl a concentration was negatively correlated with TN, NO3− and EC, and positively correlated with Zeu and WT (Table 3).
The Zeu was significantly correlated with most of the environmental factors, such as Chl a, EC, WT, SS and nutrients (Table 2), after multiple comparison correction. In four parts of the studied area (Table 3), Zeu was negatively correlated with EC and positively correlated with WT. Specifically, the Zeu was negatively correlated with NO3− and positively correlated with Chl a in the midstream and downstream.
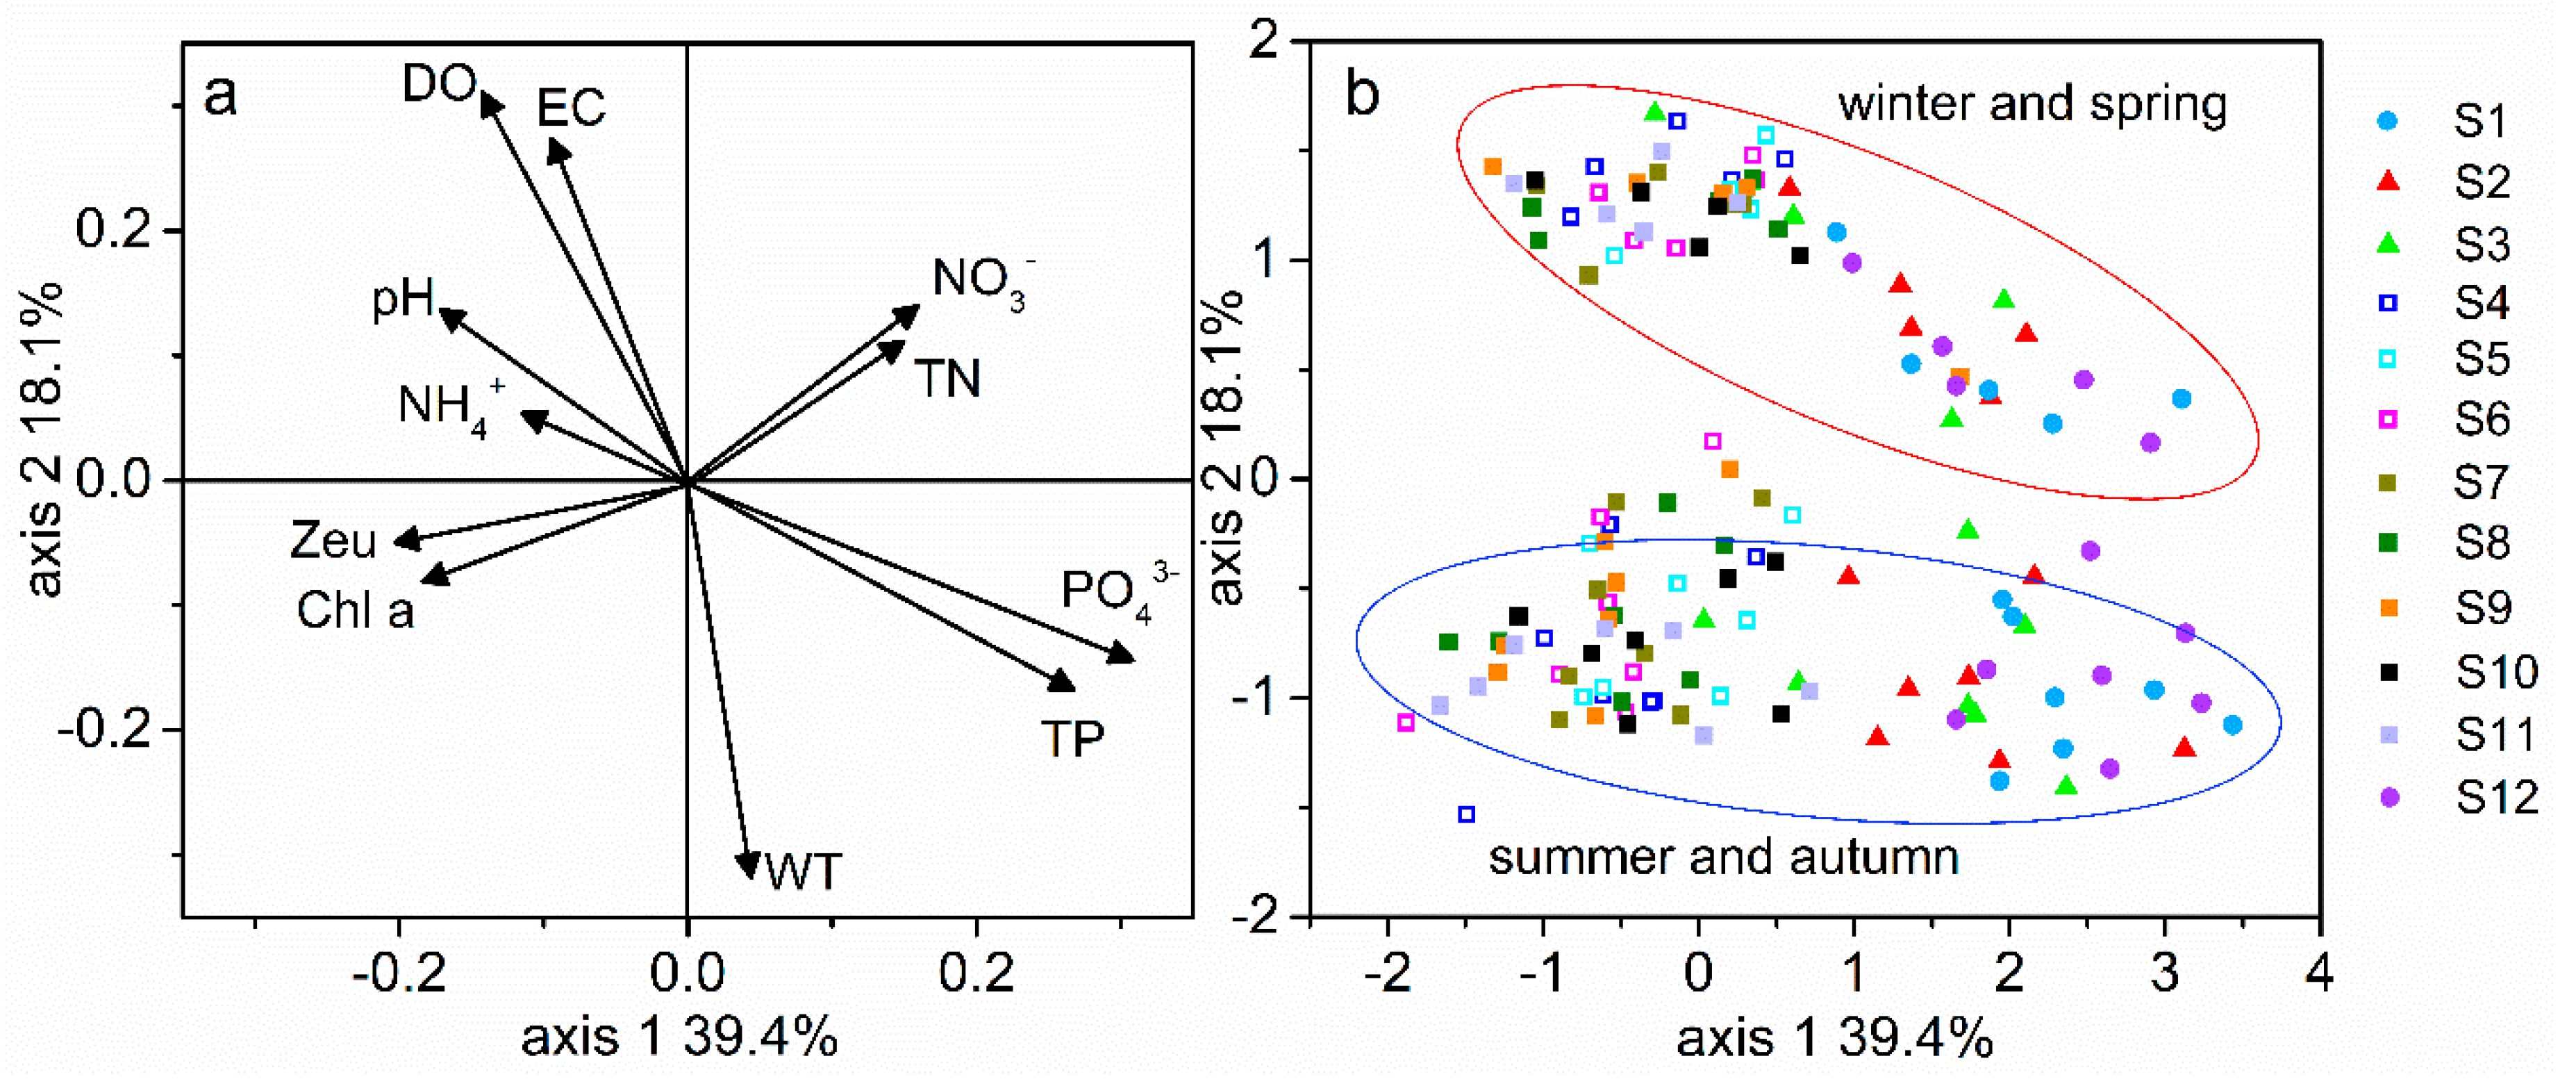
Principal components analysis (PCA) was performed to reveal variance of abiotic and biotic variables in the reservoir. The results explained 67.1% of data variability on the first three axes (axis 1 = 39.4%; axis 2 = 18.1%; axis 3 = 9.6%), representing three principal components, and variables loading plot was shown in Figure 4a. For axis 1 ordination, the most important variables were TP (0.66), TN (0.65), NO3− (0.71), PO43− (0.82), Chl a (−0.68), Zeu (−0.69). For axis 2 ordination, the most important variables were WT (0.89), DO (0.78) and EC (0.73). For axis 3 were NH4+ (0.87) for its ordination. The PCA results illustrated that the first principal components reflected water quality change, while the second principal component explained the seasonal gradient in the reservoir. Axis 1 explained 39.4% of total variance and helped to separate samples according to their abiotic and biotic condition, and negative value in axis 1 represents higher Zeu and Chl a and lower nutrients. Samples belonging to the same area showed a certain separation in axis 1, higher positive values of axis 1 were observed for samples (S1 and S12) in the estuary (Figure 4b). Moreover, as shown in Figure 4b, samples mainly clustered according to seasonal plots, samples collected in winter and summer had positive value and samples collected in summer and autumn had negative value in axis 2.
Focusing on biotic parameter, relationships with other parameters were discerned in the loading plot, Chl a showed a positive correlation with Zeu and negative correlations with nutrients (Figure 4a). These results were in line with results showed in Table 2, indicating that light availability and related variables, such as Zeu, Zmix and water column stability could be more important than nutrient availability for driving phytoplankton dynamics.
3.2. Phytoplankton Community Structure and Species Composition
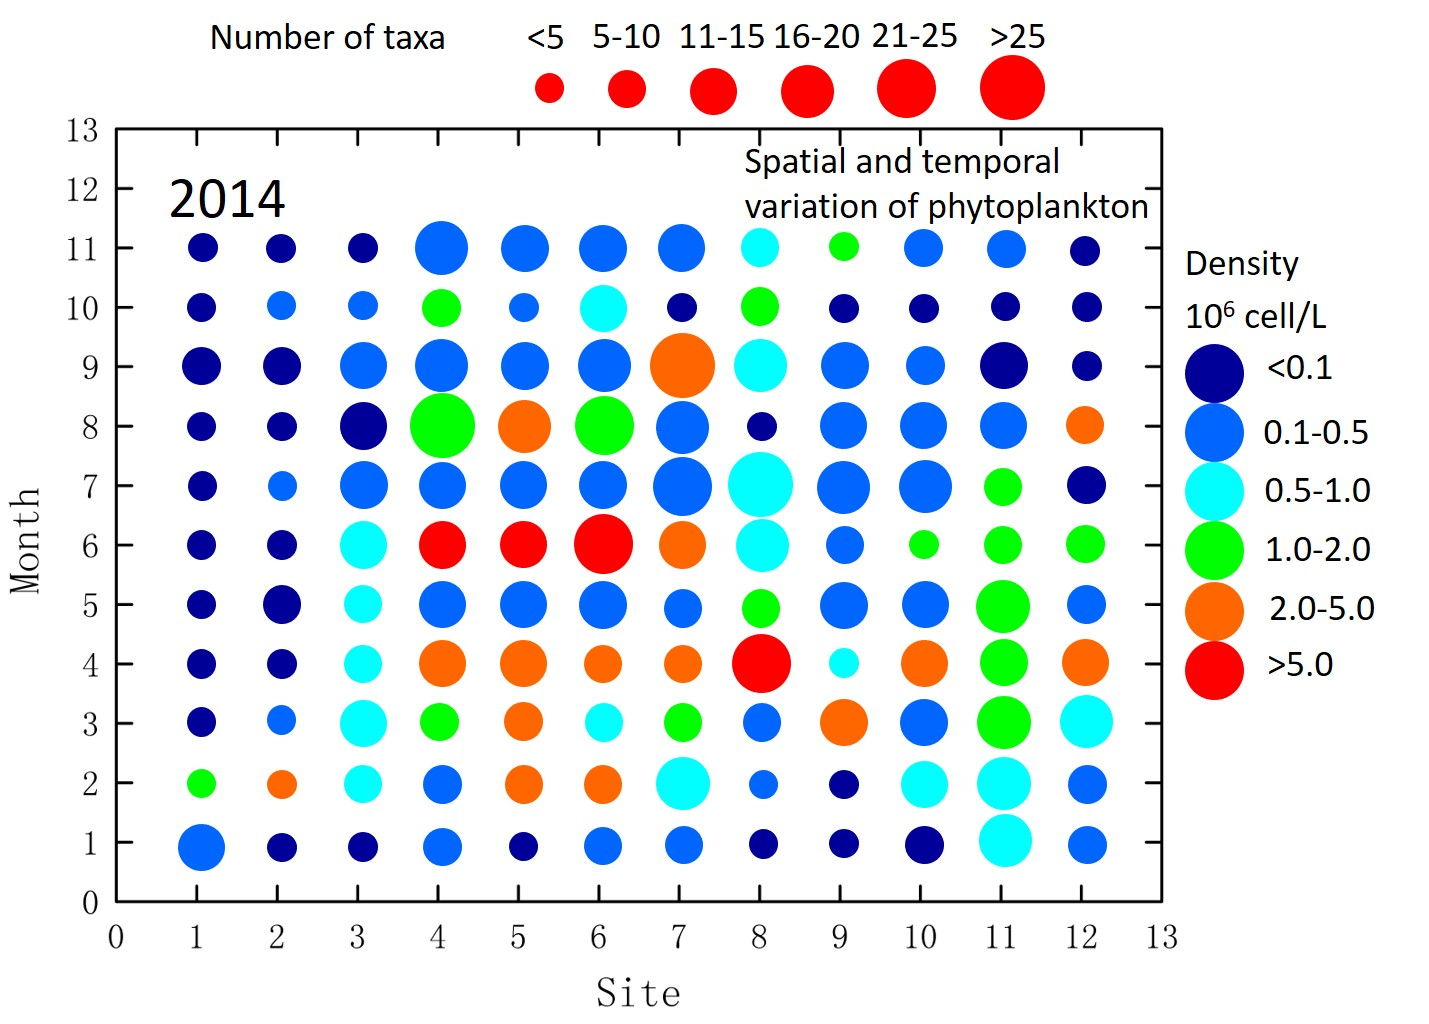
The total of 205 taxa identified were members of eight major taxonomic categories, belonging to 88 genera with 82 taxa of Chlorophyta, 71 taxa of Bacillariophyta, 39 taxa of Cyanophyta, two taxa of Euglenophyta, three taxa of Pyrrophyta, Four taxa of Cryptophyta, three taxa of Chrysophyta, and one taxon of Xanthophyta. The Chlorophyta, Bacillariophyta and Cyanophyta compromised the major phytoplankton components with percentages of 40.0%, 34.6% and 19.0%, respectively.
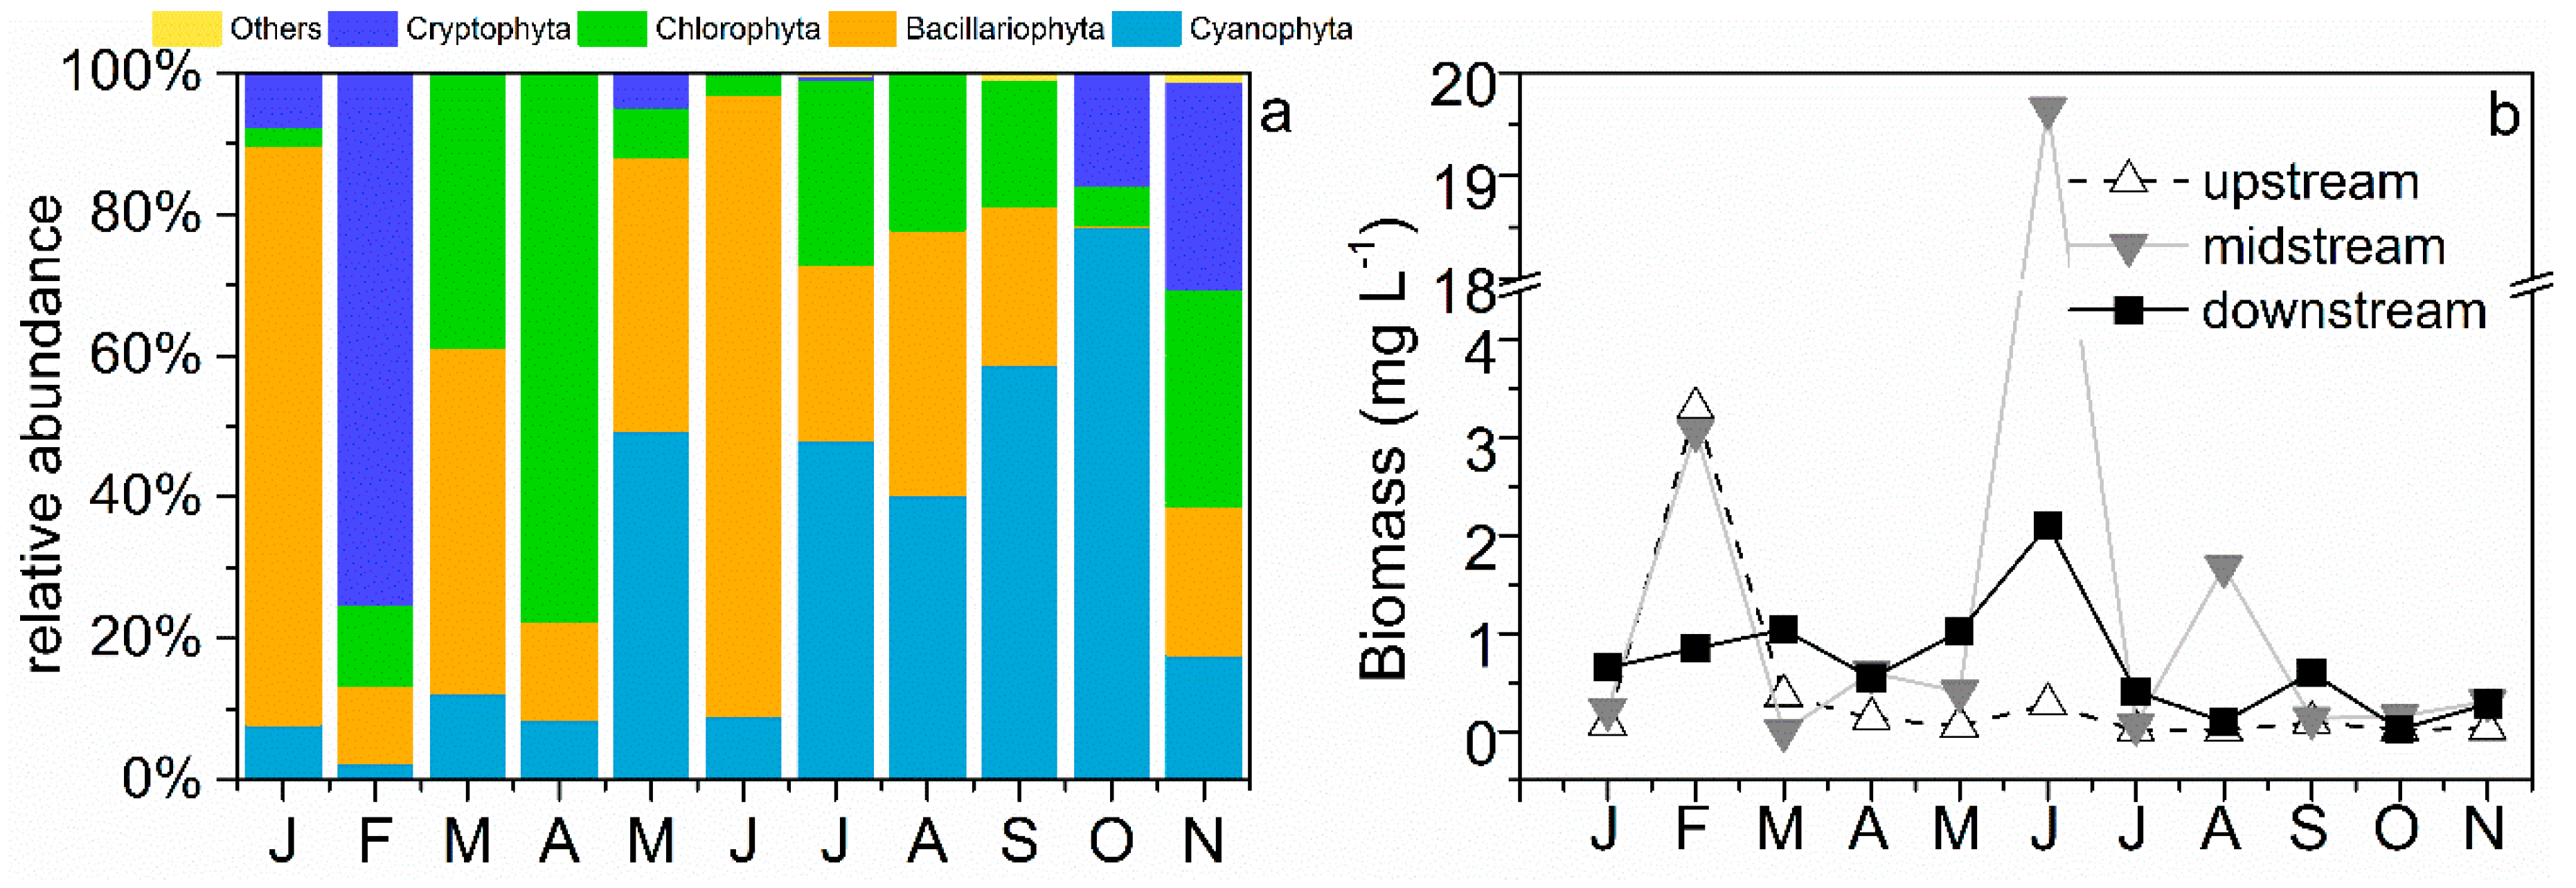
The Chlorophyta and the Bacillariophyta prevailed in spring, then Bacillariophyta dominated the whole reservoir in early summer, with Chlorophyta decreasing and Cyanophyta increasing during the summer. Most of the Chlorophyta and Cyanophyta declined in autumn and reached the lowest value in winter (Figure 5). During our research period, Cyclotella meneghiniana, Melosira granulata, Cryptomonas ovata, Melosira varians and Chlorella vulgaris were the most abundant species, with occurrence frequencies of 56.64%, 47.79%, 42.48%, 39.82% and 34.51%, respectively.
Phytoplankton in the Qingcaosha Reservoir had one or more species dominant in different seasons. We identified four dominant species in the reservoir according to relative abundance value, they were diatoms M. granulata (16.0%), Melosira granulata var. angustissima (20.3%), M. varians (4.8%) and the Cryptophyte C. ovata (10.6%). Spearman correlation analysis between taxonomic groups and environmental variables revealed that Cyanophyta was negatively correlated with TN, PO43−, NO3−, EC, DO and TDP, positively correlated with Chl a, WT, and Zeu (Table S1). Chlorophyta was negatively correlated with TN, PO43− and TDP, positively correlated with NO3−, Chl a, WT, pH and Zeu. Bacillariophyta was negatively correlated with PO43− and positively correlated with Zeu (Table S1).
The total phytoplankton biomass pattern was apparent in different seasons and in different parts of the reservoir. During early summer, phytoplankton biomass showed a maximum of 19.65 mg L−1 in the mid-reservoir, 9.3 times higher than the maximum value (2.10 mg L−1) in the downstream part of the reservoir, another two peaks occurred in February (3.07 mg L−1) and August (1.68 mg L−1). In the upstream part of the reservoir biomass remained low throughout the year, with the highest value in February (3.30 mg L−1) (Figure 5).
3.3. Functional Group Dynamic
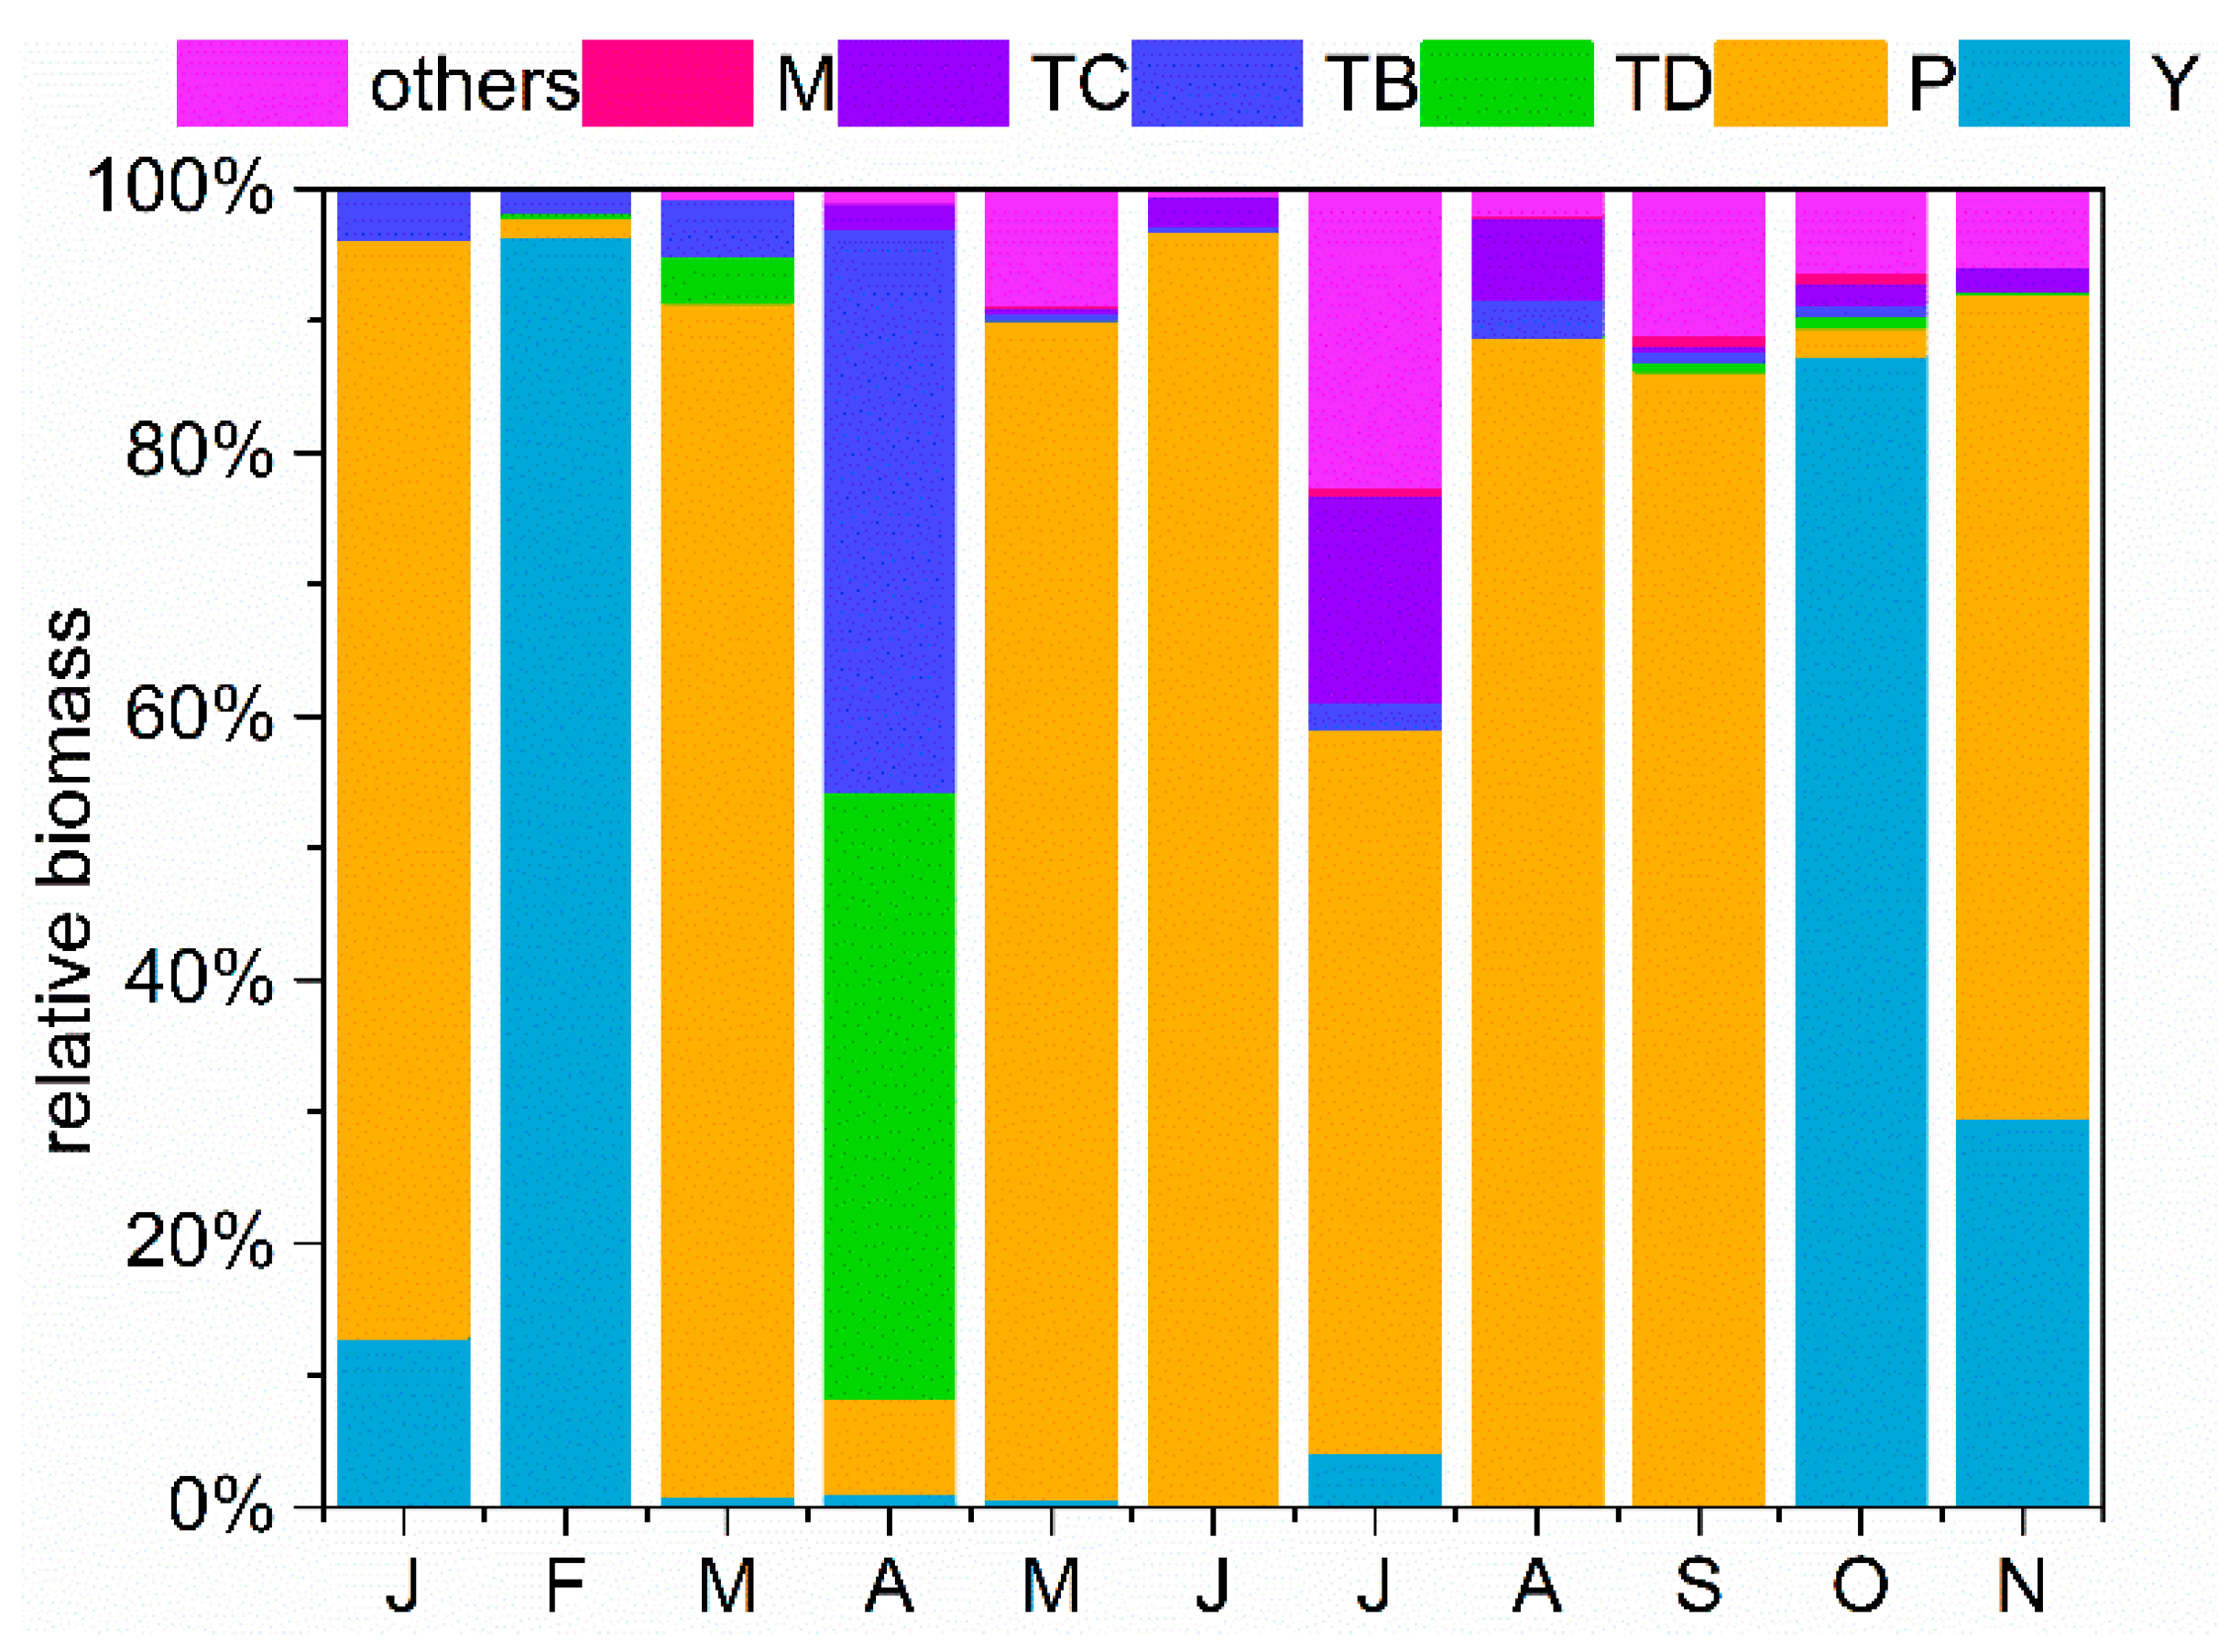
From the 205 identified algal species, we classified 18 functional groups (Table 4) with one or more species contributing to their composition. Bacillariophyta, Chlorophyta and Cyanophyta were the dominant taxonomic groups, dominating at least once during the research time, and P, TD, TB, Y, M, Tc and C were the crucial functional groups in the reservoir. During periods of stratification of the reservoir water, mainly in late spring and summer, functional group P (M. granulata and M. granulata var. angustissima), TD (Ulothrix spp.), TB (M. varians) and M (Microcystis spp.) dominated.
Phytoplankton biomass increased along with strong stratification and high temperature in summer and P dominated in this period. Functional group Y (C. ovata and C. erosa) supplanted group P at the middle autumn and dominated during the mixing period at the end of autumn and winter, especially in February (Figure 6). The dominance of group C was observed during the winter mixing period and in early spring. Seasonal variation in relative biomass of functional groups also reflected the seasonal trends of taxonomic groups (Figure S4).
3.4. Q Index
The assemblage index (Q index) was applied using the phytoplankton functional groups method. The factor F weights for each functional group determined by water traits are shown in Table 4. The water quality varied with season, changing the ecological status of the reservoir from upstream to downstream. The highest Q index (4.9) occurred in spring, the lowest index (2.1) in the mixing period in February and the index maintained a good or excellent ecological status from March to September (3.4–4.9) (Figure 7).
4. Discussion
4.1. Effects of Nutrient and Light Availability on Phytoplankton Growth
Seasonal and spatial changes of environmental variables play an important role in determining physical and chemical conditions, which affect phytoplankton dynamics in this estuary reservoir. Previous study showed that the reservoir was less eutrophic during the construction period in 2009 with highest TSI value of 51 and changed to a mesotrophic state TSI during the trial operation period in 2010 [26,40]. It seems that the eutrophic state became better established during the full operation period in 2014.
In the study, significant decrease of TP both in the estuary and the reservoir in July may be due to dilution effect resulted from large amount of precipitation in wet season (Figure S2). The reduction of PO43− and NO3− indicated that phytoplankton absorption also plays a role. Our results agree with previous study [27], and Huang et al. mentioned the decrease of TN and TP in the reservoir were mainly due to biological activity in their study. However, significant correlation between nutrients and SS (Table 2) indicated that sedimentation processes and mobilization of particulate matters may also play an important role. Mobilization of upstream sediment attached to SS may transport more nutrients into the reservoir. Furthermore, TN/TP ratio was used to address nutrients limitation of algae growth, where N is limiting when TN:TP < 9 and P is limiting when TN:TP > 22 [41]. The ratio is controversial in determining nutrient limitation due to the hypothesis that ratios are a consequence of uptake and not drivers of changes in phytoplankton composition [42]. The current results (9 < TN/TP < 26) confirmed that there were no obvious nutrient limitation tendencies for phytoplankton growth in the reservoir (Figure S3). However, a previous study suggested that the reservoir is P limited [26]. Compared to that study, TP in the current study was much higher. These results highlight the high concentration of nutrients in the reservoir and nutrient was not the limiting resource for phytoplankton growth during the study period.
Other environmental variation revealed by PCA, such as light availability and seasonal gradient, were more important for phytoplankton growth in the reservoir. Light availability described by the Zeu/Zmix ratio in the reservoir was very low, but relatively good when compared to the estuary. Although nutrients level was much lower in the downstream than the upstream, phytoplankton abundance and Chl a were much higher, indicating that light was a limiting resource in the reservoir. These results were in accordance with observation in similar aquatic ecosystems [12,18,22], that is, light availability played an important role in seasonal phytoplankton succession. The seasonal change and particulate matters in the water column may strongly influenced Zeu value, and consequently determined light availability for phytoplankton functional groups. This provided useful insights into importance of thermal stratification and SS sedimentation on light availability in drinking water reservoir system. Our findings are in line with other studies [7,18,43] that light availability acting as limiting factor for functional groups, selecting groups, such as group M (Microcystis spp.) adapted to high light intensity during summer stratification, and selecting groups, such as group C (Cyclotella spp.) and Y (Cryptomonas spp.) adapted to low light intensity during winter mixing. These results highlight the nutrient and light availability, and their balance, can modify community composition and structure in pelagic communities [44].
The reservoir had highly complex and uneven environmental changes due to the input of fresh water and salt water during dry season, reservoir specific morphology and long water residence time. Previous studies [11,12,45] demonstrated that WT was a driving factor determining phytoplankton composition and distribution in freshwater reservoir. In the current study, WT had a strong influence on phytoplankton abundance succession, especially for Cyanophyta and Chlorophyta. Cyanophyta prefer higher temperature, due to their higher optimum growth temperatures. Previous study demonstrated that WT was significant drivers of seasonal shift in phytoplankton community in drinking water reservoir [11,46,47]. Furthermore, WT significantly affects thermal stratification, which greatly influence phytoplankton communities [48]. Bacillariophyta and Chlorophyta dominated the dry season (November and April) when the water column was mixed, C. meneghiniana, M. granulata, and Chlorella vulgaris were the dominant species. The results were consistent with other studies [14,18,44] on fresh water aquatic ecosystem, that is, mixing regime, low light availability and low temperature were contributed to phytoplankton dynamic during dry season (October to February). In addition, C. ovata belonging to Cryptophyta was the most abundant species in February, standing within other studies [18,20] that C. ovata could adapt to high inorganic turbidity. Moreover, dominance of C. meneghiniana indicated that specific habitant condition selected species that can adapt to high salinity water, and Wang et al. [49] also found that C. meneghiniana was positively related to salinity. During wet season, mainly between May and October in this region, relative abundance of Cyanophyta significantly increased, accounted for 40% of the total abundance, Microcystis and Chroococcus were the most abundant genus. The results are in line with those of fresh water ecosystems [50,51,52], that is, Cyanophyta abundance increased with WT and Zeu in nutrient enrichment system. Strong stratification during wet season was observed, and species like M. granulata belonging to Bacillariophyta prevailed this period along with Cyanophyta. These results highlighted the seasonal gradient on phytoplankton succession in the reservoir.
In Qingcaosha Reservoir, hydrological conditions were very different from Yangtze River estuary, since water column became stable with long retention time of 15–35 days, the flow rate slowed, suspended particles started the sedimentation process and a long stratification period occurred, consequently it became a relative lentic system with improved underwater light conditions. The results confirmed that hydrological changes in the reservoir led to phytoplankton community construction, and shaped a relatively good underwater light condition for algae growth compared to the estuary. Even though hydrological conditions changed for the better, the surface water still formed a mixing layer and obvious water-column segregation occurred during the stratification period, especially in summer.
4.2. Response of Phytoplankton Communities and Functional Groups to Environmental Driving Force
In the study, a mixing period occurred in winter and autumn in the reservoir and, importantly, light availability seems to play an essential role in governing phytoplankton groups. When the environment is constrained by environmental factors, such as light and P limitation, it is more likely to be dominated by species with the appropriate adaptations to be able to function. It is believed that functional groups that can tolerate low light density prevail in this mixing period, for instance group Y is well adapted to live in lentic ecosystems with low light availability when grazing pressure is low [20,21]. Medeiros et al. [53] also found that group Y favoured waters with high inorganic turbidity during a drought period in a semi-arid region. The current results are in line with studies [8,18,24,54] that were conducted in Chinese lakes and reservoirs. It seems that group Y dominance can account for drought seasons, low light and high turbidity in the reservoir. The dominance of group Y also explained high biomass observed in January (Figure 5b).
The functional group C (C. meneghiniana and A. formosa) co-dominated with group Y was significantly correlated with a decrease in dissolved nutrients. This is related to the rapid growth rates coupled to the efficiency of diatoms in competing for nutrients, especially phosphorus. The growth of these diatoms has been reported for temperate monomictic lakes, associated with pre-stratification spring conditions [55]. This group favoured eutrophic small sized waterbodies with species such as C. meneghiniana sensitive to stratification. Wang et al. [49] reported that this group C could adapted to high salinity, which may better explain the environmental traits in the dry season with high salinity. Other factors such as dissolved nutrients may regulate the growth of this group. It seems that this group C also well adapted to mixing and low light availability, depending upon turbulence for suspension. Thus, group C is relatively sensitive to the depth of mixing and the seasonal onset of near-surface density stratification [20].
The functional group P started to dominate when thermal stratification began in spring. The group, characterized by Melosira spp. in our study, usually occurred in a continuous or semi-continuous mixed layer 2–3 m in thickness. This association can be represented in shallow lakes where the mean depth is of this order or greater, as well as in the epilimnia of stratified lakes when the mixing criterion is satisfied [21]. Group P explained environment conditions well in the reservoir with high N and P concentrations, a continuous mixed layer and strong stratification. Similar with some eutrophic lakes, groups M (sensitive to water-column stability and low light, characterized by Microcystis spp.) and F (S. ampla, Selenastrum spp. and W. linearis) co-dominated the phytoplankton community during the entire summer and reached a high phytoplankton biomass associated with stratification driving forces, like high temperature, high water-column stability and high nutrient concentrations.
Our study suggested that hydraulic conditions were important in determining phytoplankton assemblages. The functional groups TB and TD (Ulothrix spp. and M. varians) dominated in turbulent areas, especially in the upstream and midstream where water stability was not as strong as in the downstream area, with high nutrient availability in the epilimnion contributing to the dominance of these two functional groups, which show sensitivity to low nutrient levels. Considering that TB and TD were suggested only for rivers they could also be helpful in artificial standing water [21]. It is believed that part of the reservoir still has the flow traits of the Yangtze River, especially in the upstream and midstream areas, and the occurrence of these two groups could be useful evidence for our hypotheses.
Typical patterns of phytoplankton succession were found in temperate eutrophic lakes, such as the PEG Model [56], a model believed that the key factor controlling phytoplankton dynamics of community and succession in lakes and reservoirs is thermal stratification and developed for phytoplankton seasonal succession study in a comparative way. In current study results suggested two biomass peaks (Figure 2f) when denoted as total Chl a: one peak in summer, with taxa belonging to F and M, and another peak during autumn with colonial taxa, belonging to such functional groups as Y and P. Our results of phytoplankton succession pattern were similar with other studies [18,22,57] conducted in Chinese reservoir but different from the PEG model, in which phytoplankton biomass reached two peaks in spring and summer, respectively.
The assemblage index primarily was established for evaluating the ecological condition of different kinds of lakes in the European Water Framework Directive (WFD), but due to its extensive versatile application, the Q index was used to assess this trophic estuarine reservoir. The Q index could be useful in studying the ecological status in such a system located in an estuary where hydrological conditions have changed greatly. In the current study, the estuary reservoir had 2.5–13.5 m water depth and area of 66.27 km2, which was similar to type one from the reference conditions provided by Padisák et al. [21]. Besides, previous study [39] carried out in reservoir at midstream of Yangtze river gave us more confidence to choose type one as the reference condition. The Q index was low in February and October, since the dominance of group Y. Although occurrence of harmful groups (Tc and M) were observed during summer, the Q index was high due to low relative biomass of these groups. Consequently, the reservoir showed a good to excellent ecological condition for most of the year. However, good ecological status does not mean good quality for drinking water source, and risk of cyanobacterial blooms still exist. Moreover, the Q index is sensitive to species occurrence [7], its usefulness for water quality assessment need more confirmation.
Although there were limitations related to our research, this reservoir was a new reservoir, not like other reservoirs such as the Three Gorges reservoir and the Sau Reservoir [7,18,58]. It is believed that phytoplankton succession patterns and physiochemical processes investigated here are liable to occur in ecosystems that receive turbid and high nutrient-level water from a river estuary, and the knowledge here is valuable for other coastal reservoirs.
5. Conclusions
Changes in hydrological conditions provide opportunities for growth of phytoplankton species and shaping communities that, in turn, reduced the nutrient levels and create diverse phytoplankton assemblages in this estuary reservoir. The study demonstrated that nutrients were sufficient in the reservoir, and no obvious nutrients limitation was observed. Sedimentation process, strengthened by hydrological change, and biological activity were the two main factors accounting for nutrients reduction. Our phytoplankton analysis revealed a significant increase in phytoplankton biomass along with significant decrease in nutrient concentration at the midstream and downstream of the reservoir. Mixing regime, water temperature and light availability were the driving factors controlling phytoplankton community dynamics and selecting predominant groups. The responses of functional groups to driving forces confirmed that limiting environment select well-adapted groups with appropriate adaptation properties, consequently showed a typical pattern of phytoplankton succession in estuary reservoir. The phytoplankton functional group assemblage index analysis revealed in this study indicates that the reservoir showed good ecological conditions during most of the study period. The study confirmed the potential use of the functional groups scheme for phytoplankton, and provided valuable and complementary information on algal strategies, adaptations and tolerances to characterize and understand phytoplankton dynamics in estuary reservoirs.
Supplementary Materials
The following are available online at https://www.mdpi.com/2073-4441/11/6/1184/s1, Figure S1: Daily temperature and wind speed variation in Qingcaosha reservoir during our study; Figure S2: Monthly Precipitation in Qingcaosha reservoir during our study period; Figure S3. Box charts for seasonal variation of TN/TP ratio and DOC concentration in the reservoir; Figure S4. Seasonal variation of relative biomass for taxonomic groups in the reservoir; Table S1: Significant Spearman correlations between the abundance of three taxonomic groups and 13 environmental variables in the reservoir (n = 110); Table S2: List of the phytoplankton species identified during our study period.
Author Contributions
C.Y. analyzed the data and wrote the paper. J.N. mainly performed the phytoplankton analysis and analyzed the data. J.L. done the conceptualization work and edited the manuscript. All authors have read and approved the final manuscript.
Funding
This research was funded by “the State Key Laboratory of Pollution Control and Resource Reuse of Tongji University, grant number PCRRIC16005”, “China Major Science and Technology Program for Water Pollution Control and Treatment, grant number 2017ZX07205”, “Joint Innovative and Technological Research Projects from the Ministry of Science and Technology of the People’s Republic of China, grant number 2016YFE0115800” and “Shanghai Institute of Pollution Control and Ecological Security”.
Acknowledgments
We thank Qingwan Gong for water sample collection and analysis.
Conflicts of Interest
The authors declare no conflict of interest.
References
- Jeong, Y.H.; Yang, J.S.; Park, K. Changes in Water Quality After the Construction of an Estuary Dam in the Geum River Estuary Dam System, Korea. J. Coast. Res. 2014, 30, 1278–1286. [Google Scholar] [CrossRef]
- Te, S.H.; Gin, K.Y.H. The dynamics of cyanobacteria and microcystin production in a tropical reservoir of Singapore. Harmful Algae 2011, 10, 319–329. [Google Scholar] [CrossRef]
- Chen, W.; Chen, K.; Kuang, C.; Zhu, D.Z.; He, L.; Mao, X.; Liang, H.; Song, H. Influence of sea level rise on saline water intrusion in the Yangtze River Estuary, China. Appl. Ocean. Res. 2016, 54, 12–25. [Google Scholar] [CrossRef]
- Vieira, J.M.D.S.; Azevedo, M.T.D.P.; de Oliveira Azevedo, S.M.F.; Honda, R.Y.; Corrêa, B. Toxic cyanobacteria and microcystin concentrations in a public water supply reservoir in the Brazilian Amazonia region. Toxicon 2005, 45, 901–909. [Google Scholar] [CrossRef]
- Duan, H.; Ma, R.; Xu, X.; Kong, F.; Zhang, S.; Kong, W.; Hao, J.; Shang, L. Two-Decade Reconstruction of Algal Blooms in China’s Lake Taihu. Environ. Sci. Technol. 2009, 43, 3522–3528. [Google Scholar] [CrossRef] [PubMed]
- Yen, H.K.; Lin, T.F.; Tseng, I.C. Detection and quantification of major toxigenic Microcystis genotypes in Moo-Tan reservoir and associated water treatment plant. J. Environ. Monit. 2012, 14, 687–696. [Google Scholar] [CrossRef]
- Becker, V.; Caputo, L.; Ordóñez, J.; Marcé, R.; Armengol, J.; Crossetti, L.O.; Huszar, V.L. Driving factors of the phytoplankton functional groups in a deep Mediterranean reservoir. Water Res. 2010, 44, 3345–3354. [Google Scholar] [CrossRef]
- Sun, Z.; Li, G.; Wang, C.; Jing, Y.; Zhu, Y.; Zhang, S.; Liu, Y. Community dynamics of prokaryotic and eukaryotic microbes in an estuary reservoir. Sci. Rep. 2014, 4, 4966. [Google Scholar] [CrossRef]
- Fagerberg, T.; Jephson, T.; Carlsson, P. Molecular size of riverine dissolved organic matter influences coastal phytoplankton communities. Mar. Ecol. Prog. Ser. 2010, 409, 17–25. [Google Scholar] [CrossRef]
- Davis, T.W.; Bullerjahn, G.S.; Tuttle, T.; McKay, R.M.; Watson, S.B. Effects of increasing nitrogen and phosphorus concentrations on phytoplankton community growth and toxicity during Planktothrix blooms in Sandusky Bay, Lake Erie. Environ. Sci. Technol. 2015, 49, 7197–7207. [Google Scholar] [CrossRef]
- Lv, H.; Yang, J.; Liu, L.; Yu, X.; Yu, Z.; Chiang, P.-C.; Jun, Y. Temperature and nutrients are significant drivers of seasonal shift in phytoplankton community from a drinking water reservoir, subtropical China. Environ. Sci. Pollut. Res. Int. 2014, 21, 5917–5928. [Google Scholar] [CrossRef]
- Rangel, L.M.; Soares, M.C.S.; Paiva, R.; Silva, L.H.S. Morphology-based functional groups as effective indicators of phytoplankton dynamics in a tropical cyanobacteria-dominated transitional river–reservoir system. Ecol. Indic. 2016, 64, 217–227. [Google Scholar] [CrossRef]
- Borges, P.A.F.; Train, S.; Rodrigues, L.C. Spatial and temporal variation of phytoplankton in two subtropical Brazilian reservoirs. Hydrobiologia 2008, 607, 63–74. [Google Scholar] [CrossRef]
- Ciric, M.; Gavrilović, B.; Simić, G.S.; Krizmanic, J.; Vidović, M.; Zebic, G. Driving factors affecting spatial and temporal variations in the structure of phytoplankton functional groups in a temperate reservoir. Oceanol. Hydrobiol. Stud. 2015, 44, 431–444. [Google Scholar] [CrossRef]
- León López, N.; Rivera Rondón, C.A.; Zapata, Á.; Jiménez, J.; Villamil, W.; Arenas, G.; Carlos, A.; Tulio, S. Factors controlling phytoplankton in tropical high-mountain drinking-water reservoirs. Limnetica 2012, 31, 305–321. [Google Scholar]
- Becker, V.; Huszar, V.L.M.; Crossetti, L.O. Responses of phytoplankton functional groups to the mixing regime in a deep subtropical reservoir. Hydrobiologia 2009, 628, 137–151. [Google Scholar] [CrossRef]
- Arthaud, F.; Vallod, D.; Robin, J.; Wezel, A.; Bornette, G. Short-term succession of aquatic plant species richness along ecosystem productivity and dispersal gradients in shallow lakes. J. Veg. Sci. 2013, 24, 148–156. [Google Scholar] [CrossRef]
- Zhu, K.; Bi, Y.; Hu, Z. Responses of phytoplankton functional groups to the hydrologic regime in the Daning River, a tributary of Three Gorges Reservoir, China. Sci. Total Environ. 2013, 450–451, 169–177. [Google Scholar] [CrossRef]
- Peng, S.; Qin, X.; Shi, H.; Zhou, R.; Dai, M.; Ding, D. Distribution and controlling factors of phytoplankton assemblages in a semi-enclosed bay during spring and summer. Mar. Pollut. Bull. 2012, 64, 941–948. [Google Scholar] [CrossRef]
- Reynolds, C.S. Towards a functional classification of the freshwater phytoplankton. J. Plankton Res. 2002, 24, 417–428. [Google Scholar] [CrossRef]
- Padisak, J.; Crossetti, L.O.; Naselli-Flores, L. Use and misuse in the application of the phytoplankton functional classification: A critical review with updates. Hydrobiologia 2009, 621, 1–19. [Google Scholar] [CrossRef]
- Xiao, L.-J.; Wang, T.; Hu, R.; Han, B.-P.; Wang, S.; Qian, X.; Padisák, J. Succession of phytoplankton functional groups regulated by monsoonal hydrology in a large canyon-shaped reservoir. Water Res. 2011, 45, 5099–5109. [Google Scholar] [CrossRef]
- De Souza, D.G.; Bueno, N.C.; Bortolini, J.C.; Rodrigues, L.C.; Bovo-Scomparin, V.M.; de Souza Franco, G.M. Phytoplankton functional groups in a subtropical Brazilian reservoir: Responses to impoundment. Hydrobiologia 2016, 779, 47–57. [Google Scholar] [CrossRef]
- Shen, H.; Li, B.; Cai, Q.; Han, Q.; Gu, Y.; Qu, Y. Phytoplankton functional groups in a high spatial heterogeneity subtropical reservoir in China. J. Great Lakes Res. 2014, 40, 859–869. [Google Scholar] [CrossRef]
- Ou, H.S.; Wei, C.H.; Deng, Y.; Gao, N.Y. Principal component analysis to assess the composition and fate of impurities in a large river-embedded reservoir: Qingcaosha Reservoir. Environ. Sci. Process. Impacts 2013, 15, 1613–1621. [Google Scholar] [CrossRef]
- Liu, H.; Pan, D.; Chen, P. A two-year field study and evaluation of water quality and trophic state of a large shallow drinking water reservoir in Shanghai, China. Desalin. Water Treat. 2015, 57, 13829–13838. [Google Scholar] [CrossRef]
- Huang, Z.; Xie, B.; Yuan, Q.; Xu, W.; Lu, J. Microbial community study in newly established Qingcaosha Reservoir of Shanghai, China. Appl. Microbiol. Biotechnol. 2014, 98, 9849–9858. [Google Scholar] [CrossRef]
- Li, Y.; Leng, F.; Liu, H.; Schmidt, W. Stage Variation of Phytoplankton and Environmental Factors in a Large Drinking Water Reservoir: From Construction to Full Operation. Water Air Soil Pollut. 2016, 227, 352. [Google Scholar] [CrossRef]
- Xu, Z.; Jiang, Y.; Te, S.H.; He, Y.; Gin, K.Y.-H. The Effects of Antibiotics on Microbial Community Composition in an Estuary Reservoir during Spring and Summer Seasons. Water 2018, 10, 154. [Google Scholar] [CrossRef]
- Eaton, A.; Rice, E.; Baird, R. Standard Methods for the Determination of Water and Wastewater; APHA Publication Office: Washington, DC, USA, 1995. [Google Scholar]
- Hu, H. The Freshwater Algae of China: Systematics, Taxonomy and Ecology; Science Press: Beijing, China, 2006. [Google Scholar]
- Cole, G.A. Textbook of Limnology; Waveland Press Inc.: Long Grove, IL, USA, 1994. [Google Scholar]
- Kunz, T.J.; Diehl, S. Phytoplankton, light and nutrients along a gradient of mixing depth: A field test of producer-resource theory. Freshw. Biol. 2003, 48, 1050–1063. [Google Scholar] [CrossRef]
- Berger, S.A.; Diehl, S.; Kunz, T.J.; Albrecht, D.; Oucible, A.M.; Ritzer, S. Light supply, plankton biomass, and seston stoichiometry in a gradient of lake mixing depths. Limnol. Oceanogr. 2006, 51, 1898–1905. [Google Scholar] [CrossRef]
- Jensen, J.P.; Jeppesen, E.; Olrik, K.; Kristensen, P. Impact of nutrients and physical factors on the shift from cyanobacterial to chlorophyte dominance in shallow Danish lakes. Can. J. Fish. Aquat. Sci. 1994, 51, 1692–1699. [Google Scholar] [CrossRef]
- Hillebrand, H.; Dürselen, C.-D.; Kirschtel, D.; Pollingher, U.; Zohary, T. Biovolume calculation for pelagic and benthic microalgae. J. Phycol. 1999, 35, 403–424. [Google Scholar] [CrossRef]
- Wetzel, R.G.; Likens, G.E. Limnological Analyses; Springer Science & Business Media: Berlin, Germany, 2013. [Google Scholar]
- Padisák, J.; Borics, G.; Grigorszky, I.; Soróczki-Pintér, É. Use of Phytoplankton Assemblages for Monitoring Ecological Status of Lakes within the Water Framework Directive: The Assemblage Index. Hydrobiologia 2006, 553, 1–14. [Google Scholar] [CrossRef]
- Wang, L.; Cai, Q.; Tan, L.; Kong, L. Phytoplankton development and ecological status during a cyanobacterial bloom in a tributary bay of the Three Gorges Reservoir, China. Sci. Total Environ. 2011, 409, 3820–3828. [Google Scholar] [CrossRef]
- Chen, Y.; Zhu, J. Reducing eutrophication risk of a reservoir by water replacement: A case study of the Qingcaosha reservoir in the Changjiang Estuary. Acta Oceanol. Sin. 2018, 37, 23–29. [Google Scholar] [CrossRef]
- Søndergaard, M.; Jensen, J.P.; Jeppesen, E. Internal phosphorus loading in shallow Danish lakes. In Shallow Lakes’ 98; Springer: Berlin, Germany, 1999; pp. 145–152. [Google Scholar]
- Reynolds, C. Non-determinism to probability, or N: P in the community ecology of phytoplankton: Nutrient ratios. Arch. Für Hydrobiol. 1999, 146, 23–35. [Google Scholar] [CrossRef]
- Zohary, T.; Padisák, J.; Naselli-Flores, L. Phytoplankton in the physical environment: Beyond nutrients, at the end, there is some light. Hydrobiologia 2010, 639, 261–269. [Google Scholar] [CrossRef]
- Filstrup, C.T.; Heathcote, A.J.; Kendall, D.L.; Downing, J.A. Phytoplankton taxonomic compositional shifts across nutrient and light gradients in temperate lakes. Inland Waters 2016, 6, 234–249. [Google Scholar] [CrossRef] [Green Version]
- Huang, G.; Wang, X.; Chen, Y.; Xu, L.; Xu, D. Seasonal succession of phytoplankton functional groups in a reservoir in central China. Fundam. Appl. Limnol. 2018, 192, 1–14. [Google Scholar] [CrossRef]
- Jiang, Z.; Liu, J.; Chen, J.; Chen, Q.; Yan, X.; Xuan, J.; Zeng, J. Responses of summer phytoplankton community to drastic environmental changes in the Changjiang (Yangtze River) estuary during the past 50 years. Water Res. 2014, 54, 1–11. [Google Scholar] [CrossRef]
- Bouterfas, R.; Belkoura, M.; Dauta, A. Light and temperature effects on the growth rate of three freshwater algae isolated from a eutrophic lake. Hydrobiologia 2002, 489, 207–217. [Google Scholar] [CrossRef]
- Fernández, C.; Estrada, V.; Parodi, E.R. Factors Triggering Cyanobacteria Dominance and Succession During Blooms in a Hypereutrophic Drinking Water Supply Reservoir. Water Air Soil Pollut. 2015, 226, 73. [Google Scholar] [CrossRef]
- Wang, N.; Xiong, J.; Wang, X.C.; Zhang, Y.; Liu, H.; Zhou, B.; Pan, P.; Liu, Y.; Ding, F. Relationship between phytoplankton community and environmental factors in landscape water with high salinity in a coastal city of China. Environ. Sci. Pollut. Res. Int. 2018, 25, 28460–28470. [Google Scholar] [CrossRef]
- Dalu, T.; Wasserman, R.J. Cyanobacteria dynamics in a small tropical reservoir: Understanding spatio-temporal variability and influence of environmental variables. Sci. Total Environ. 2018, 643, 835–841. [Google Scholar] [CrossRef]
- Chen, Y.; Qin, B.; Teubner, K.; Dokulil, M.T. Long-term dynamics of phytoplankton assemblages: Microcystis-domination in Lake Taihu, a large shallow lake in China. J. Plankton Res. 2003, 25, 445–453. [Google Scholar] [CrossRef]
- Dellamano-Oliveira, M.J.; Vieira, A.A.H.; Rocha, O.; Colombo, V.; Sant’Anna, C.L. Phytoplankton taxonomic composition and temporal changes in a tropical reservoir. Fundam. Appl. Limnol. 2008, 171, 27–38. [Google Scholar] [CrossRef]
- De Castro Medeiros, L.; Mattos, A.; Lürling, M.; Becker, V. Is the future blue-green or brown? The effects of extreme events on phytoplankton dynamics in a semi-arid man-made lake. Aquat. Ecol. 2015, 49, 293–307. [Google Scholar] [CrossRef]
- Tian, Y.; Huang, B.; Yu, C.; Chen, N.; Hong, H. Dynamics of phytoplankton communities in the Jiangdong Reservoir of Jiulong River, Fujian, South China. Chin. J. Oceanol. Limnol. 2014, 32, 255–265. [Google Scholar] [CrossRef]
- Elliott, J.; Reynolds, C.; Irish, A. An investigation of dominance in phytoplankton using the PROTECH model. Freshw. Biol. 2001, 46, 99–108. [Google Scholar] [CrossRef]
- Sommer, U.; Gliwicz, Z.M.; Lampert, W.; Duncan, A. The PEG-model of seasonal succession of planktonic events in fresh waters. Arch. Hydrobiol. 1986, 106, 433–471. [Google Scholar]
- Qiu, X.; Huang, T.; Zeng, M. Differences in phytoplankton dynamics and community structure between a wet year and dry year in the Zhoucun Reservoir. J. Freshw. Ecol. 2016, 31, 377–391. [Google Scholar] [CrossRef] [Green Version]
- Sin, Y.; Jeong, B. Short-term variations of phytoplankton communities in response to anthropogenic stressors in a highly altered temperate estuary. Estuar. Coast. Shelf Sci. 2015, 156, 83–91. [Google Scholar] [CrossRef]
Figure 1.
Location of the reservoir and distribution of sampling stations along the northern tributary of the Yangtze River. S1 represents the inlet sluice and S12 represents the outlet sluice, and S2 to S11 are located inside the reservoir.
Figure 1.
Location of the reservoir and distribution of sampling stations along the northern tributary of the Yangtze River. S1 represents the inlet sluice and S12 represents the outlet sluice, and S2 to S11 are located inside the reservoir.

Figure 2.
Seasonal variation of main environmental factors in the estuary, and the upstream, midstream and downstream parts of the reservoir. (a) Total Phosphorus (TP); (b) Total Nitrogen (TN); (c) Ammonia Nitrogen (NH4+); (d) Soluble reactive phosphorus (PO43−); (e) Nitrate (NO3−); (f) Chlorophyll a (Chl a).

Figure 3.
Seasonal variation of Secchi depth (b) with standard deviation, Zeu, Zmix and light availability (a) for phytoplankton in the Qingcaosha Reservoir.
Figure 3.
Seasonal variation of Secchi depth (b) with standard deviation, Zeu, Zmix and light availability (a) for phytoplankton in the Qingcaosha Reservoir.

Figure 4.
PCA variables loading plot (a) and samples (n = 144) score plot (b) for axis 1 and axis 2. (b) S1 to S12 were the sampling sites, S1 and S12 located in the estuary, S2 and S3 located in the upstream, S4 to S6 located in the midstream and S7 to S11 located in the downstream of the reservoir.

Figure 5.
Relative abundance (a) and calculated biomass (b) of phytoplankton in the reservoir.

Figure 6.
Seasonal variation in relative biomass (%) of the main phytoplankton functional groups inside the reservoir.
Figure 6.
Seasonal variation in relative biomass (%) of the main phytoplankton functional groups inside the reservoir.

Figure 7.
Ecological status assessment according to the Q index with standard deviation in the Reservoir in 2014.
Figure 7.
Ecological status assessment according to the Q index with standard deviation in the Reservoir in 2014.


Table 1.
Means and ranges (Min-Max) of limnological variables in the epilimnion of the Qingcaosha Reservoir in 2014 (n = 30).
Table 1.
Means and ranges (Min-Max) of limnological variables in the epilimnion of the Qingcaosha Reservoir in 2014 (n = 30).
| Spring | Summer | Autumn | Winter | |||||
|---|---|---|---|---|---|---|---|---|
| Mean | Interval | Mean | Interval | Mean | Interval | Mean | Interval | |
| WT (°C) | 13.7 | 9.5–16.9 | 25.2 | 22.8–25.8 | 19.2 | 15.4–23.0 | 7.0 | 6.8–7.2 |
| pH | 7.8 | 7.3–8.3 | 8.1 | 7.8–8.2 | 8.1 | 7.9–8.2 | 8.1 | 7.8–8.2 |
| DO (mg L−1) | 9.4 | 8.7–9.8 | 8.8 | 8.2–9.5 | 8.9 | 8.7–9.1 | 11.2 | 10.4–11.9 |
| EC (μs cm−1) | 473 | 207–838 | 166 | 160–176 | 182 | 179–186 | 363 | 225–440 |
| TN (mg L−1) | 2.20 | 1.93–2.44 | 1.78 | 1.50–2.19 | 1.54 | 1.41–1.72 | 2.02 | 1.64–2.25 |
| TP (mg L−1) | 0.14 | 0.13–0.15 | 0.13 | 0.10–0.19 | 0.11 | 0.10–0.12 | 0.14 | 0.18–0.20 |
| TN/TP | 18.5 | 15.1–20.7 | 14.9 | 9.4–19.1 | 16.1 | 15.4–17.2 | 21.1 | 14.2–28.5 |
| Chla (μg L−1) | 13.1 | 7.3–17.6 | 30.1 | 17.8–45.6 | 31.1 | 19.3–45.2 | 13.9 | 10.4–17.4 |
| SS (mg L−1) | 21.4 | 7.0–45.4 | 13.2 | 3.4–25.4 | 18.2 | 7.6–42.0 | 19.0 | 8.3–63.0 |
| WT = water temperature; DO = dissolved oxygen; EC = conductivity; TN = total nitrogen; TP = total phosphorus; Chl a = chlorophyll a concentration; SS = suspended solids. | ||||||||
Table 2.
Significant Spearman correlations among 13 environmental variables in the studied area (n = 48).
Table 2.
Significant Spearman correlations among 13 environmental variables in the studied area (n = 48).
| TP | TN | PO43− | NO3− | Chl a | EC | WT | pH | TDP | SS | |
|---|---|---|---|---|---|---|---|---|---|---|
| TP | ||||||||||
| TN | 0.51 ** | |||||||||
| PO43− | 0.69 ** | 0.64 ** | ||||||||
| NO3− | 0.88 ** | 0.53 ** | ||||||||
| NH4+ | ||||||||||
| Chl a | −0.66 ** | −0.71 ** | −0.75 ** | −0.70 ** | ||||||
| EC | 0.60 ** | |||||||||
| WT | −0.47 ** | −0.58 ** | −0.83 ** | |||||||
| pH | −0.50 ** | −0.51 ** | 0.49 ** | |||||||
| DO | 0.70 ** | −0.80 ** | ||||||||
| TDP | 0.67 ** | 0.54 ** | 0.84 ** | −0.64 ** | −0.59 ** | |||||
| SS | 0.61 ** | 0.64 ** | 0.57 ** | 0.63 ** | −0.73 ** | −0.57 ** | 0.55 ** | |||
| Zeu | −0.61 ** | −0.65 ** | −0.71 ** | −0.65 ** | 0.81 ** | 0.54 ** | −0.61 ** | −0.92 ** | ||
| * P < 0.05, ** P < 0.01. | ||||||||||
Table 3.
Significant Spearman correlations between two important variables (Chl a and Zeu) and 13 environmental variables in the estuary, upstream, midstream and downstream of Qingcaosha Reservoir.
Table 3.
Significant Spearman correlations between two important variables (Chl a and Zeu) and 13 environmental variables in the estuary, upstream, midstream and downstream of Qingcaosha Reservoir.
| Variables | Estuary (n = 24) | Upstream (n = 24) | Midstream (n = 36) | Downstream (n = 60) | ||||
|---|---|---|---|---|---|---|---|---|
| Chl a | Zeu | Chl a | Zeu | Chl a | Zeu | Chl a | Zeu | |
| TP | ||||||||
| TN | −0.59 ** | −0.64 ** | −0.60 ** | |||||
| PO43− | ||||||||
| NO3− | −0.83 ** | −0.56 * | −0.77 ** | −0.69 ** | ||||
| NH4+ | ||||||||
| Chla | 0.50 ** | 0.61 ** | ||||||
| EC | −0.68 ** | −0.75 ** | −0.79 ** | −0.73 ** | −0.66 ** | −0.66 ** | ||
| WT | 0.64 ** | 0.88 ** | 0.81 ** | 0.56 ** | 0.57 ** | 0.84 ** | ||
| pH | ||||||||
| DO | −0.54 ** | −0.39 ** | ||||||
| TDP | ||||||||
| SS | −0.79 ** | −0.84 ** | −0.66 ** | −0.51 ** | ||||
| Zeu | 0.55 ** | 0.61 ** | ||||||
| * P < 0.05, ** P < 0.01. | ||||||||
Table 4.
Phytoplankton taxa and their functional and taxonomic groups in Qingcaosha Reservoir.
| Functional Groups | Species Included in the Group | Taxonomic Groups | F Factor |
|---|---|---|---|
| B | Thalassiosira lacustris | Bacillariophyta | 4.0 |
| C | Cyclotella meneghiniana, Asterionella formosa | Bacillariophyta | 5.0 |
| D | Fragilaria acus, Nitzschia spp. | Bacillariophyta | 2.0 |
| N | Cosmarium laeve | Chlorophyta | 5.0 |
| P | Melosira granulata | Bacillariophyta | 5.0 |
| MP | Diploneis ovalis, Cocconeis placentula | Bacillariophyta | 3.5 |
| TC | Oscillatoria spp., Phormidium spp., Gloeobacter spp. | Cyanophyta | 1.0 |
| TD | Ulothrix spp. | Chlorophyta | 4.0 |
| TB | Melosira varians | Bacillariophyta | 5.0 |
| X2 | Chroomonas acuta | Cryptophyta | 3.5 |
| X1 | Chlorella spp., Ankistrodesmus spp., Chlamydomonas spp. ChlororcoccumChlororcoccumChlororcoccumChlororcoccumChlororcoccum | Chlorophyta | 4.0 |
| Y | Cryptomonas ovata, Cryptomonas erosa | Cryptophyta | 2.0 |
| F | Sphaerellocystis ampla, Selenastrum spp., Westellopsis linearis | Chlorophyta | 5.0 |
| G | Pandorina morum | Chlorophyta | 1.0 |
| J | Scenedesmus spp, Crucigenia quadrata | Chlorophyta | 1.0 |
| K | Synechocystis aquatilis, Dactylococcopsis spp. | Cyanophyta | 2.0 |
| LO | Chroococcus spp., Merismopedia spp. | Cyanophyta | 0 |
| M | Microcystis spp. | Cyanophyta | 0 |
© 2019 by the authors. Licensee MDPI, Basel, Switzerland. This article is an open access article distributed under the terms and conditions of the Creative Commons Attribution (CC BY) license (http://creativecommons.org/licenses/by/4.0/).
Share and Cite
MDPI and ACS Style
Yang, C.; Nan, J.; Li, J. Driving Factors and Dynamics of Phytoplankton Community and Functional Groups in an Estuary Reservoir in the Yangtze River, China. Water 2019, 11, 1184. https://doi.org/10.3390/w11061184
AMA Style
Yang C, Nan J, Li J. Driving Factors and Dynamics of Phytoplankton Community and Functional Groups in an Estuary Reservoir in the Yangtze River, China. Water. 2019; 11(6):1184. https://doi.org/10.3390/w11061184
Chicago/Turabian StyleYang, Changtao, Jing Nan, and Jianhua Li. 2019. "Driving Factors and Dynamics of Phytoplankton Community and Functional Groups in an Estuary Reservoir in the Yangtze River, China" Water 11, no. 6: 1184. https://doi.org/10.3390/w11061184
Note that from the first issue of 2016, this journal uses article numbers instead of page numbers. See further details here.