Comparative Study of Methods for Delineating the Wellhead Protection Area in an Unconfined Coastal Aquifer


1
School of Civil Engineering, University of Queensland, Brisbane QLD 4072, Australia
2
Zuckerberg Institute for Water Research, The Jacob Blaustein Institutes for Desert Research, Ben-Gurion University of the Negev, Sede Boqer Campus, Midreshet Ben-Gurion 84990, Israel
*
Author to whom correspondence should be addressed.
Water 2019, 11(6), 1168; https://doi.org/10.3390/w11061168
Submission received: 6 May 2019
/
Revised: 30 May 2019
/
Accepted: 31 May 2019
/
Published: 4 June 2019
(This article belongs to the Special Issue Water Flow, Solute and Heat Transfer in Groundwater)
Abstract
:Various delineation methods, ranging from simple analytical solutions to complex numerical models, have been applied for wellhead protection area (WHPA) delineation. Numerical modeling is usually regarded as the most reliable method, but the uncertainty of input parameters has always been an obstacle. This study aims at examining the results from different WHPA delineation methods and addressing the delineation uncertainty of numerical modeling due to the uncertainty from input parameters. A comparison and uncertainty analysis were performed at two pumping sites—a single well and a wellfield consisting of eight wells in an unconfined coastal aquifer in Israel. By appointing numerical modeling as the reference method, a comparison between different methods showed that a semi-analytical method best fits the reference WHPA, and that analytical solutions produced overestimated WHPAs in unconfined aquifers as regional groundwater flow characteristics were neglected. The results from single well and wellfield indicated that interferences between wells are important for WHPA delineation, and thus, that only semi-analytical and numerical modelling are recommended for WHPA delineation at wellfields. Stochastic modeling was employed to analyze the uncertainty of numerical method, and the probabilistic distribution of WHPAs, rather a deterministic protection area, was generated with considering the uncertain input hydrogeological parameters.
1. Introduction
Worldwide, groundwater provides essential and valuable water resources for drinking water production, agricultural irrigation [1] and industrial processes [2]. Particularly in arid and semi-arid areas where ample surface water sources do not exist, groundwater is often the major, or even the sole, drinking water resource. However, human activities, due to increasing livelihood and development demands, have contributed to the deterioration of groundwater quality. Experience in the last decades has shown that once groundwater is contaminated by chemical, biological or radiological agents, it is always difficult to clean up these contaminants, and the remediation involves high costs [3]. Therefore, protecting groundwater from pollution is a major task for sustainable water management. A central prerequisite for this endeavor is the delineation of wellhead protection area (WHPA) [4].
WHPA delineation is a concept that refers to the adequate management of the areas surrounding groundwater pumping wells where contamination could potentially exist [5,6]. Once WHPA delineation has been conducted, subsequent land-use restrictions and remediation techniques can be applied. WHPA delineation is an effective means of protecting groundwater resources; hence, it is necessary and important to obtain thorough knowledge on how to delineate such an area accurately and precisely. The very early groundwater resource protection with safety area being defined around pumping wells should be dated back to the 1950s in Europe [5], in the purpose of eliminating pathogenic bacteria and viruses from entering groundwater [7]. Later, in the United States, the Amendments to the Safe Drinking Water Act (SDWA) established the first nationwide program to protect groundwater resources [4]. A series of different delineation solutions were then proposed by the U.S. Environmental Protection Agency (EPA) [8]. These methods can be summarized into five major categories, namely, arbitrary and simplified variable shapes, analytical solutions, hydrogeological mapping, semi-analytical method, and numerical modeling [9,10]. Different methods vary greatly in their degrees of complexity and precision, as well as producing different types of protection zones such as the zone of contribution (ZOC), which is the land surface area of the aquifer volume containing all the groundwater that may eventually flow toward the pumping well, or the zone of travel (ZOT), which is defined with a given time of travel (TOT) value for the water to reach the well [8].
Traditional practices determine WHPA using the arbitrary or easily calculated analytical solutions, which ignore the temporal and spatial variability of the local hydrogeological conditions. On the other hand, applying the three-dimensional numerical model gives rise to the possibility of integrating more hydrogeologic characteristics to suit the highly anisotropic and heterogeneous settings [11,12]. The commonly used model in delineating WHPA is MODFLOW [13,14]. Coupled with MODPATH, it provides numerical solution to tracking the pathlines of the particles moving within groundwater flow in a forward or backward manner [15]; thus, the area in which particles could move to can be delineated as the WHPA. However, despite their powerful simulation efficiency, the application of numerical models for WHPA delineation requires a great deal of hydrogeological data from field investigation, through which a complete knowledge of aquifer properties has never been fully achieved. Therefore, the uncertainty of required input data has consistently been an obstacle for obtaining the numerical modeling results [16,17]. Some studies have been conducted to assess the influence of hydrogeological properties on WHPA delineation results, and hydraulic conductivity was identified as the most significant parameter in determining the dimensions of WHPA [18,19]. The principle idea of analyzing the uncertainty of WHPA simulation is to select the input parameters randomly, then run the stochastic modeling over the numerical model to delineate WHPA [6,19].
Reviewing all of the WHPA delineation methods, the simple analytical solution allows us to obtain the protection area through quick calculations, but the results are usually the least accurate, since the real local aquifer conditions are often oversimplified. Numerical modeling has been regarded as the most accurate WHPA delineation method to represent complex aquifer conditions, but the model construction requires the performance of a considerable intensive field investigation and the integration of a large number of hydrogeological parameters, necessitating careful consideration of the modeling uncertainty. Many countries (e.g., the United States, the United Kingdom, Australia, Israel) had listed different methods for defining WHPA, and most of them adopted analytical solutions to define different levels of WHPAs by using ZOTs with different travel times for the national-wide groundwater protection programs [20]. However, a detailed comparative study of using different delineation methods and the comparison between delineation results are still missing in most of the countries. From a practical point of view, the most appropriate method for WHPA delineation should simplify the groundwater flow systems as much as possible for the ease of nationwide program implementation, while still preserving the essential geological and hydrologic characteristics for effective groundwater protection [21].
Therefore, a comparison between the common types of WHPA delineation methods is necessary to ensure a proper protection zone. It is also particularly important for proposing recommendations on the choice of a WHPA delineation method based on the comparison. The major objectives of this study are: (1) to present a comparative study on different methods for delineating WHPAs to examine their performances and to reveal the essential factors that impact WHPA delineation results; (2) to address WHPA delineation uncertainty with numerical modeling by stochastic simulation; and (3) to suggest a general WHPA delineation method selection guideline for conducting groundwater protection program. This study was conducted using two pumping sites in the unconfined coastal aquifer in Israel as an example.
2. Material and Methods
2.1. Delineation Methods Selection
Various delineation methods have been introduced and been applied based on different delineation criteria: distance to the water source, drawdown range of pumping well, time of travel (TOT) of contaminant with flow, assimilative capacity of contaminant, and boundaries which control groundwater flow [8,20,22]. Given the fact that delineating WHPA based on contaminant travel time allows defining WHPA into different vulnerability levels, most of the countries incorporated different TOT values into delineation methods to legislate groundwater protection programs [20,23,24,25,26]. Therefore, in this study, TOT was selected as the delineation criterion. Five commonly used delineation methods were compared: the calculated fixed radius (CFR) method [8], the uniform flow equation method [8,27,28], the WhAEM2000 model [29], the HYBRID method [30] and the MODFLOW–MODPATH model [13,15]. All of the selected methods have been thoroughly explained in the literature, so only brief introductions are provided here. Table 1 summarized the equations for calculating the protection areas by each of the analytical methods.
The CFR method is based on the assumption that water pumped out from the well comes from the porous aquifer media around the well screen, which is distributed as a cylinder, and the infiltrated water is contributed by precipitation. By using CFR method, a fixed radius around the pumping well will be calculated in terms of a specified TOT value. The uniform flow equation calculates the down-gradient flow boundary XL, the maximum width of the up-gradient zone YL and the distance to up-gradient boundary rx (with regard to the specified TOT) to delineate the envelope-shaped protection zone. WhAEM2000 is a semi-analytical model developed by U.S. EPA for facilitating capture zone and protection area mapping. WhAEM2000 includes the CFR and uniform flow methods, but also has its own semi-analytical solution to model steady pumping wells and can solve the influence of hydrological boundaries. HYBRID method combines some of the analytical equations from the CFR and uniform flow equation method. By following the five steps illustrated by Paradis and Martel [30], this method is relatively straight forward. MODFLOW-MODPATH is a widely used groundwater numerical model. All of the WHPA delineation analysis was based on the data compiled from past annual average values which covered both the dry and wet seasons.
Application of the selected delineation methods requires that TOT values be specified for different dimensions of protection areas. In Israel, WHPAs are classified into three protection levels, as in many other countries. According to the regulations from the Israel Ministry of Health [31], a Level-A protection zone is a circle closely located to the pumping well with a radius of 10 m, a Level-B protection zone is delineated by a 100-day TOT, and a Level-C protection zone is delineated by a 400-day TOT. The Level-B and Level-C protection zone results from selected methods were compared, since all the Level-A zones are identical.
2.2. Reference WHPA
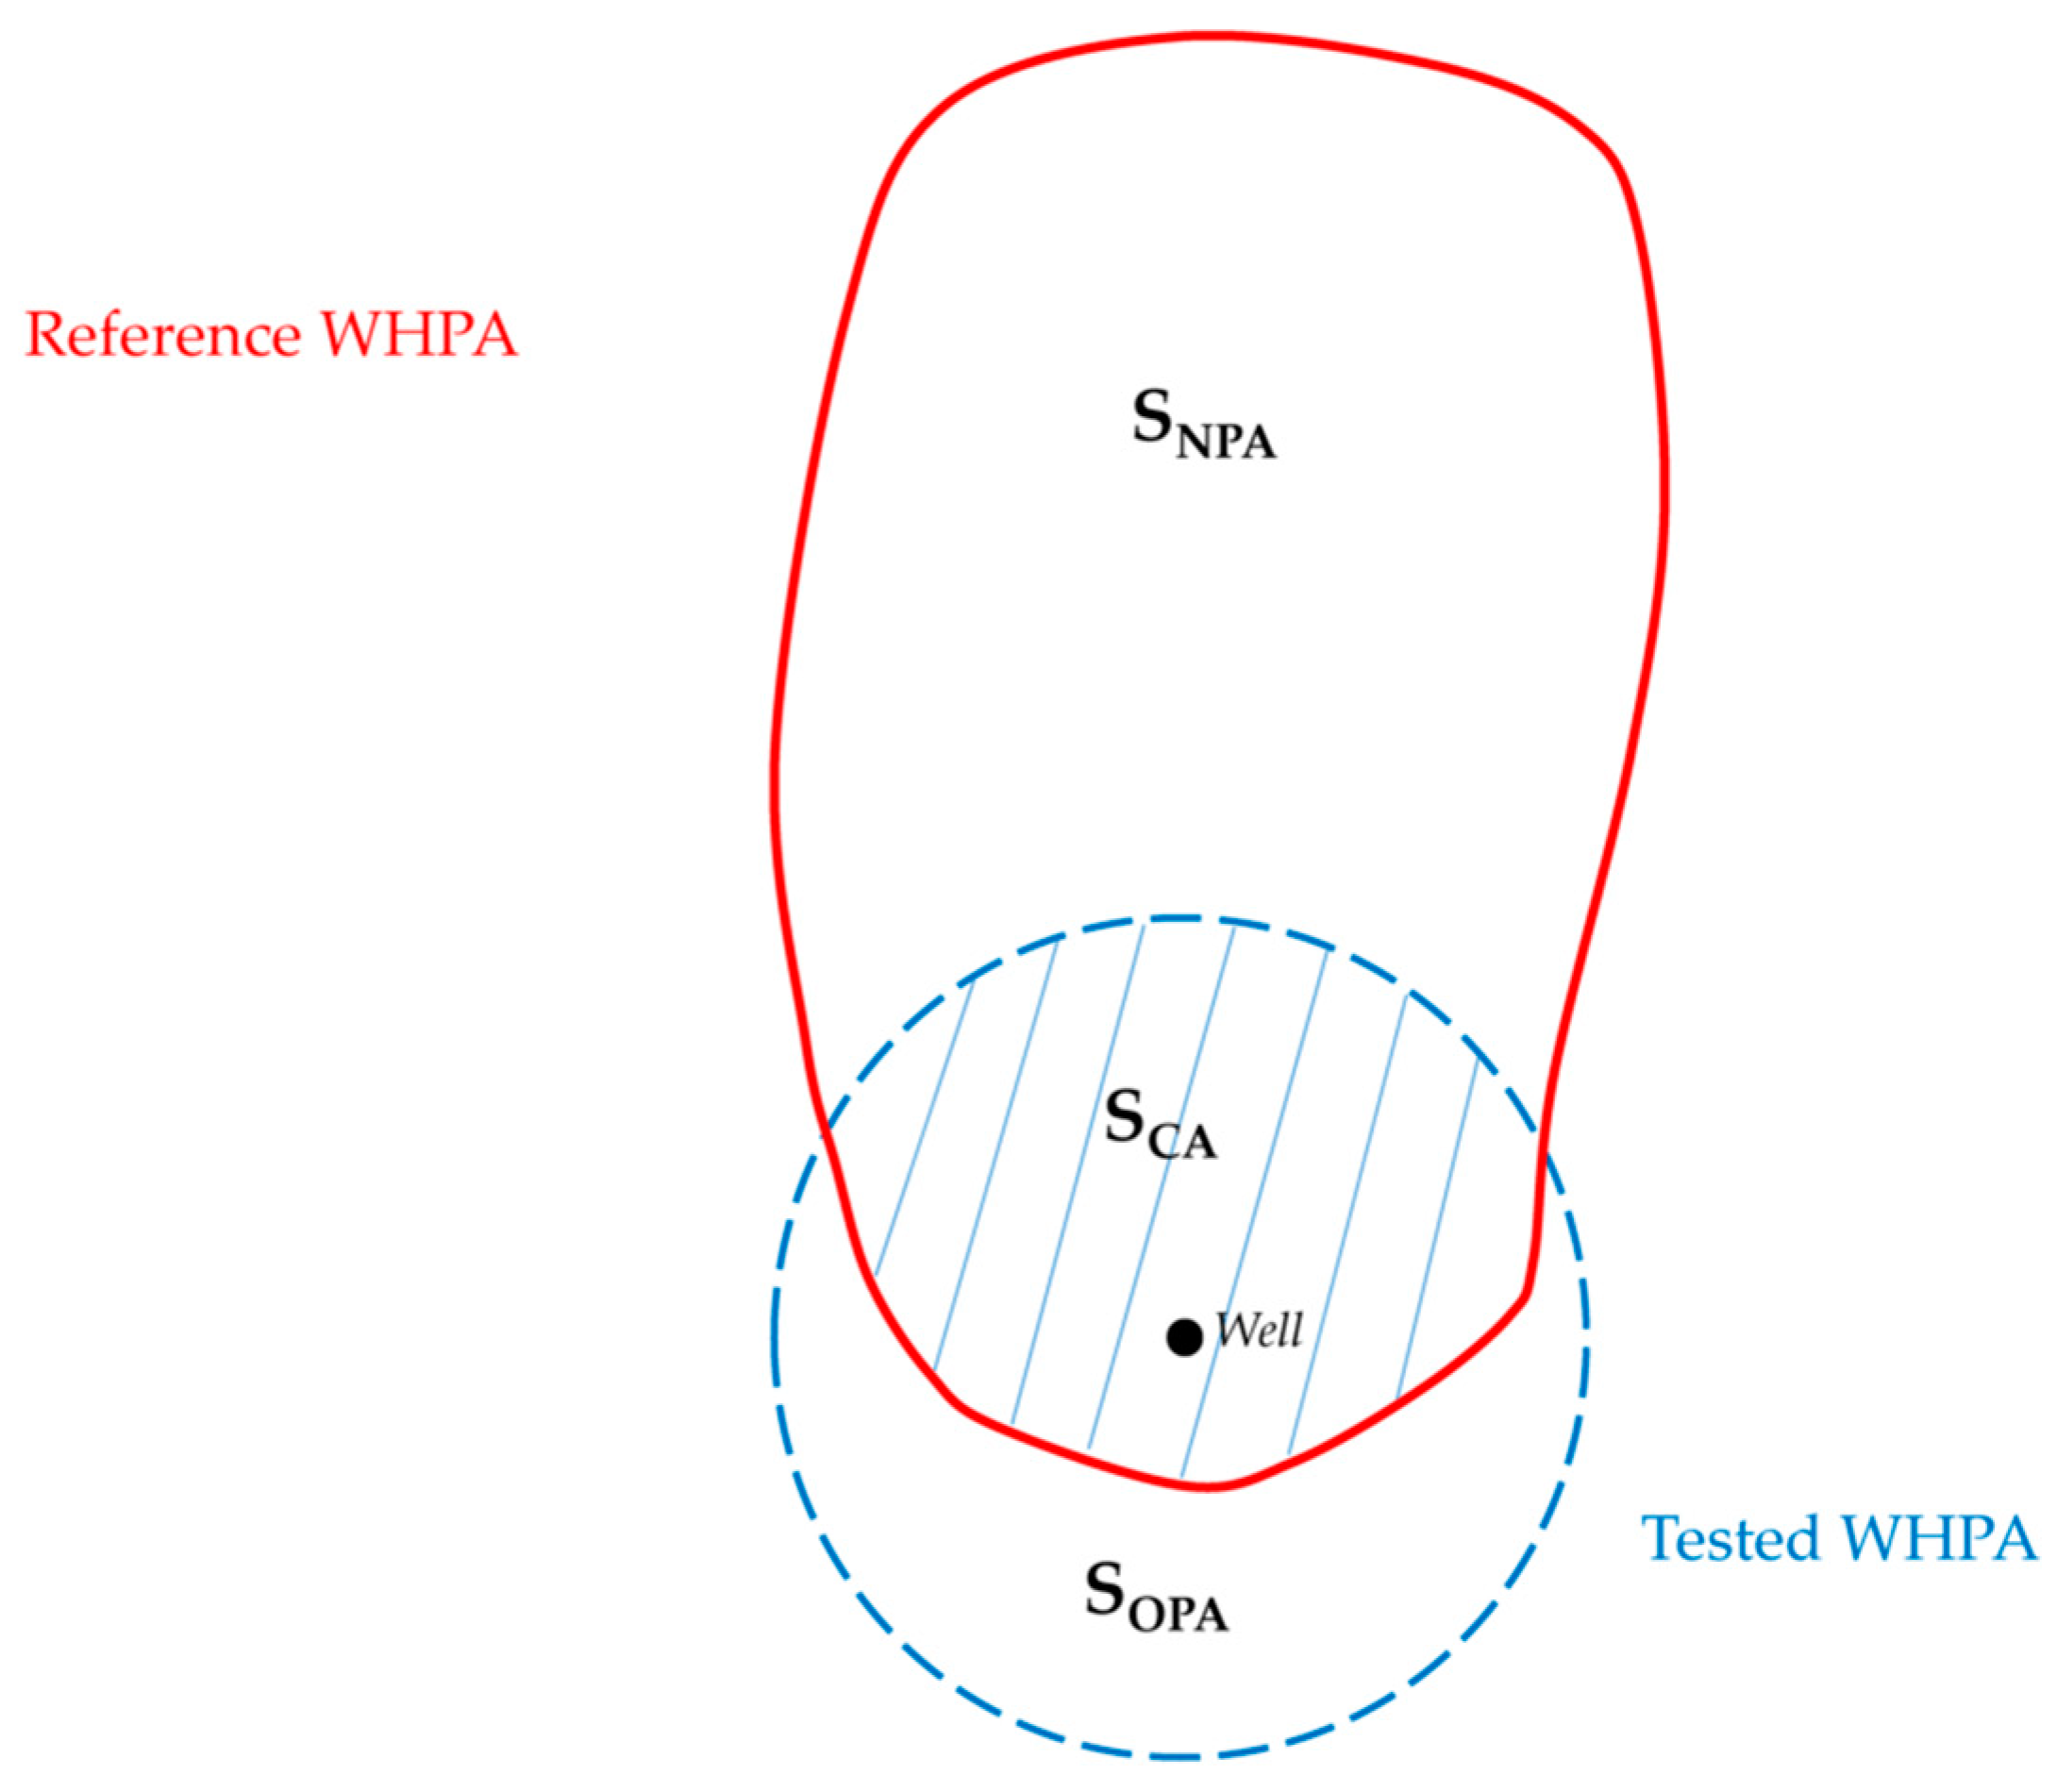
In order to compare the protection zones produced by different methods, a reference WHPA is necessary. We chose the WHPA delineated by MODFLOW-MODPATH as the reference WHPA because numerical modeling most completely accounts for hydrological information of the study area. Referring to the work from Paradis [21] and Miller [32] who tried to assess the differences between WHPAs, we used a comparative index Ci to quantify the difference between the reference WHPA and the WHPAs produced by other methods. Ci index represents how the WHPA from the tested method fits the WHPA from the reference method. The principle of Ci can be illustrated by Figure 1 and Ci is calculated by Equation (1):
where is the common area between the reference and tested WHPA, is the non-protected area by the tested method, and is the over-protected area by the tested method.
According to the definition of the comparative index, a higher value indicates a better fitting to the WHPA delineated by reference numerical modeling method, and vice versa.
2.3. Stochastic Modeling for Uncertainty Analysis
In order to address the impacts of uncertain input parameters of the MODFLOW-MODPATH numerical model on the results of delineation, an uncertainty analysis was conducted by Latin hypercube sampling (LHS) based stochastic modeling. An uncertainty analysis is an evaluation that takes a set of randomly chosen input values and passes them through the testing model to obtain the distribution of the outputs [33]. LHS, rather the common Monte Carlo sampling, was used to avoid clustering samples and to produce fewer iterations of random input number series. By using LHS method, the probability distribution of the sample parameter firstly being stratified into equal probability intervals on the cumulative probability scale, then a random value is taken from each interval. The number of intervals equals the number of iterations. Hydraulic conductivity (K) was chosen as the randomized parameter as it has been examined by many studies on the importance of determining the size of WHPA and its large uncertainty [6,16,34]. Other parameters, such as aquifer effective porosity, can also affect the WHPA delineation. However, the effects of its spatial variability can be smaller than that of the hydraulic conductivity [19]. By giving the minimum, mean, and maximum values of K, as well as the distribution pattern of K, a series of random K values were produced. The random K values were then introduced into the numerical WHPA delineation model for each study area to get the series of WHPAs with different probabilities.
2.4. Study Area
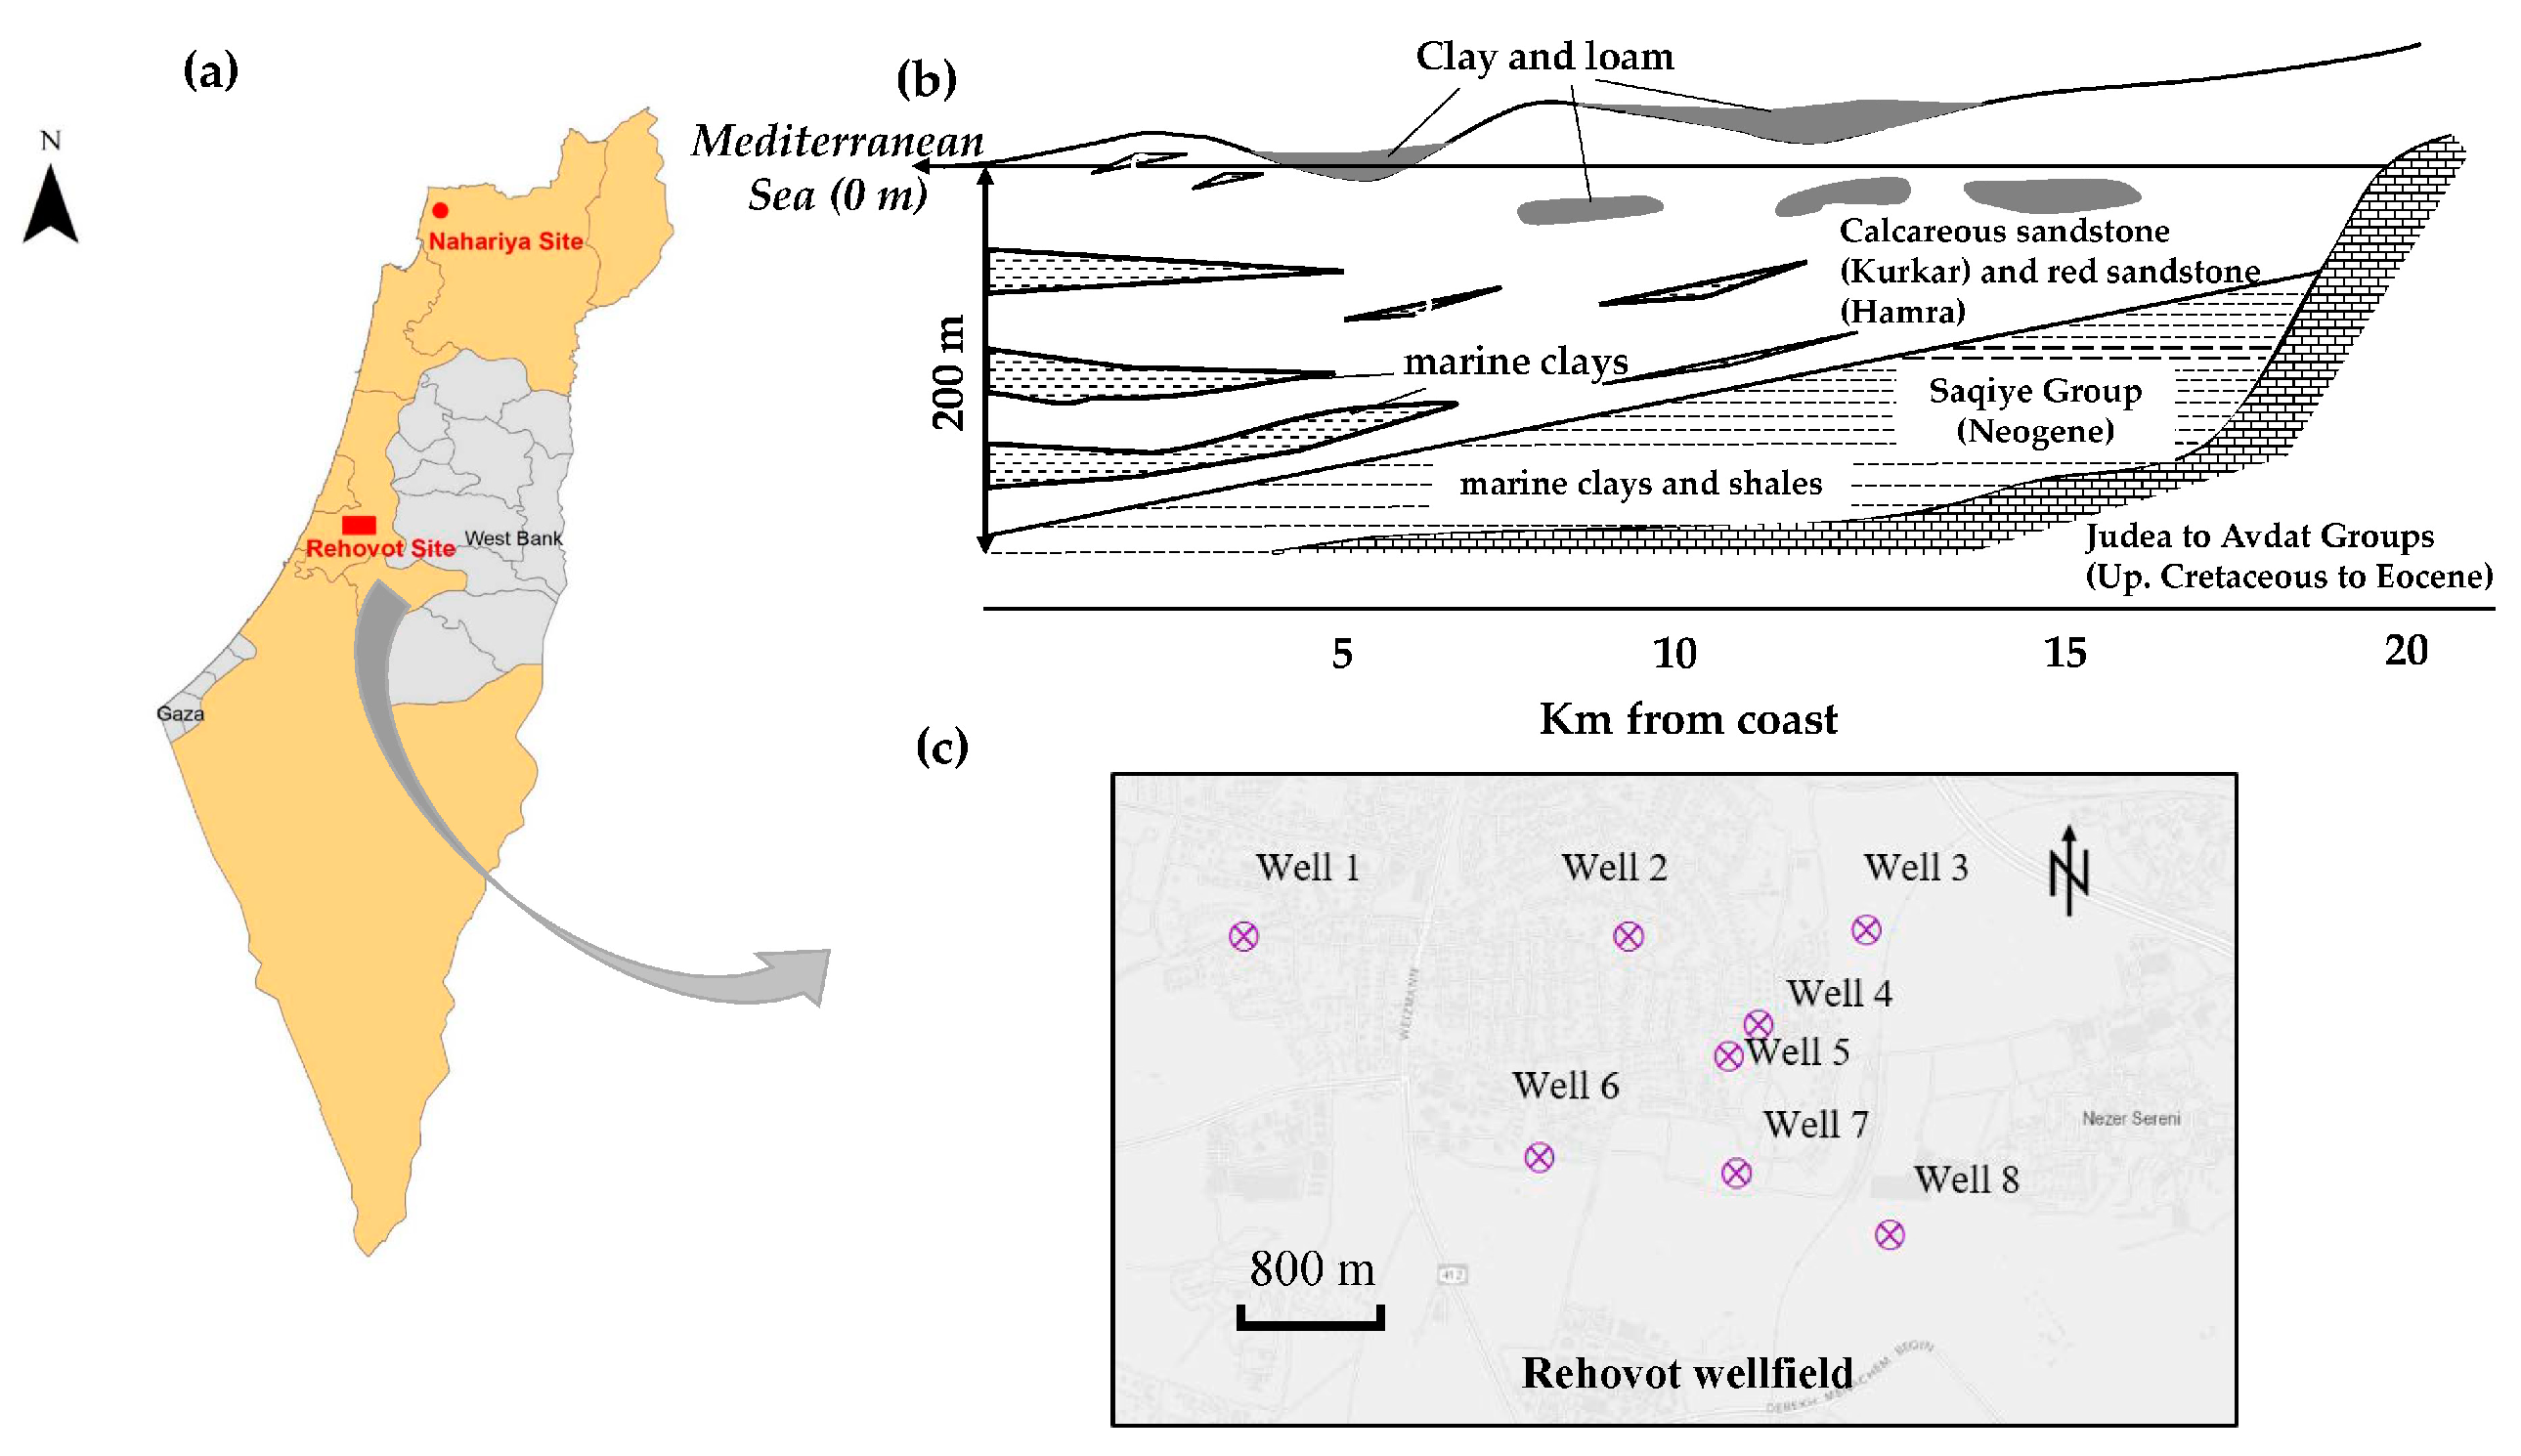
The study was conducted at two pumping sites in Israel: a single groundwater pumping well in the Nahariya city and a multi-well pumping field in the Rehovot area (Figure 2a). Both pumping sites are municipal drinking water supplying wells located on the unconfined coastal aquifer. The overall relief of the coastal plain aquifer increases gradually from east to west, since a series of mountains are located to the east and in the west is the Mediterranean Sea. The coastal plain aquifer of Israel can be represented by a typical cross-section in Figure 2b [35]. The coastal sediments have a thickness up to 200 m in the west and pinch-out to the east. Calcareous sandstone is the major component of the sediments, and is also the major component of the aquifer storing groundwater [36,37]. Several silt and clay aquicludes exist within the sandstone, which divide the overall aquifer into distinct sub-aquifers, significantly improving the heterogeneity of the local aquifer [38]. Due to the local topography, groundwater moves from the east and is discharged into the sea.
The aquifer properties of two sites were compiled from past studies. In the single well pumping site (the Nahariya Site), aquifer recharge due to natural precipitation is approximately 250 mm/year [39], local hydraulic gradient was estimated to be ranging between 0.002 and 0.0032, transmissivity is between 775 and 4650 m2/day, and hydraulic conductivity is 50–300 m/day. The porosity of the supplying aquifer is estimated as 30% [40]. The Nahariya pumping well has a nearly constant pumping rate of 6600 m3/day [41]. In the multi-well pumping field (the Rehovot Site), the local aquifer recharge rate is around 208 mm/year with a hydraulic conductivity of 10.5 m/day [35]. Eight pumping wells in the wellfield are distributed as shown in Figure 2c. The average pumping rate of Well 1 is 3000 m3/day, with 1500 m3/day of Well 2 and 2500 m3/day of Well 6; the remaining wells have the same pumping rate, i.e., 1000 m3/day.
3. Results
For the tested analytical methods (CFR method, uniform flow equation method and HYBRID method), the input parameters are the average values of the data compiled from past field records listed in Section 2. For the semi-analytical model and the reference numerical modeling method, input hydrogeological parameters may have been calibrated to fit the model.
3.1. WHPA Delineation of the Nahariya Site (Single Well)
Table 2 shows the hydrogeological parameters used by different WHPA delineation methods on the Nahariya and the Rehovot pumping sites. The application of CFR method produced circular protection zones around pumping wells (Figure 3). With a pumping rate of 6600 m3/day and the saturated thickness of well is 15.5 m, the radii of Level-B (TOT = 100 days) and Level-C (TOT = 400 days) protection zone was 211 m and 421 m, respectively. The surface area of Level-B zone was 0.14 km2 and the area of the Level-C zone was 0.56 km2. Applying the uniform flow equation method, an average hydraulic gradient of 0.0025 and hydraulic conductivity of 250 m/day [41] were used. The calculated distances from well to the down-gradient boundary (XL) and the maximum width (YL) were 108 m and 341 m. XL and YL values were the same for both Level-B and Level-C protection zone. The size of WHPA depends on distance to the up-gradient boundary (rx), which is the travel distance of contaminants with the up-gradient groundwater flow to enter pumping well. rx of Level-B zone was 365 m and was 1098 m for Level-C zone. Thus, two envelope-shaped WHPAs with different dimensions that extend to the up-gradient direction were produced by uniform flow method. The WHPAs delineated by HYBRID method were represented by two ellipses with different horizontal dimensions (d/2) and vertical dimensions (w/2). Surface area of Level-B and Level-C protection zones were 0.14 km2 and 0.55 km2.
Since the aquifer at the Nahariya pumping well is less heterogeneous than that at the Rehovot site, and groundwater was extracted from the substantial sandstone underneath a thin loam layer on the ground surface, the hydrogeological WhAEM2000 model was constructed as a simple unconfined sandy aquifer with an average thickness of 15.5 m. The groundwater flow direction and magnitude were assigned by model calibration with the groundwater heads data from three observation wells [41]. As shown in Figure 3, a smaller Level-B WHPA with the surface area of 0.097 km2 and a Level-C WHPA with the surface area of 0.37 km2 were delineated.
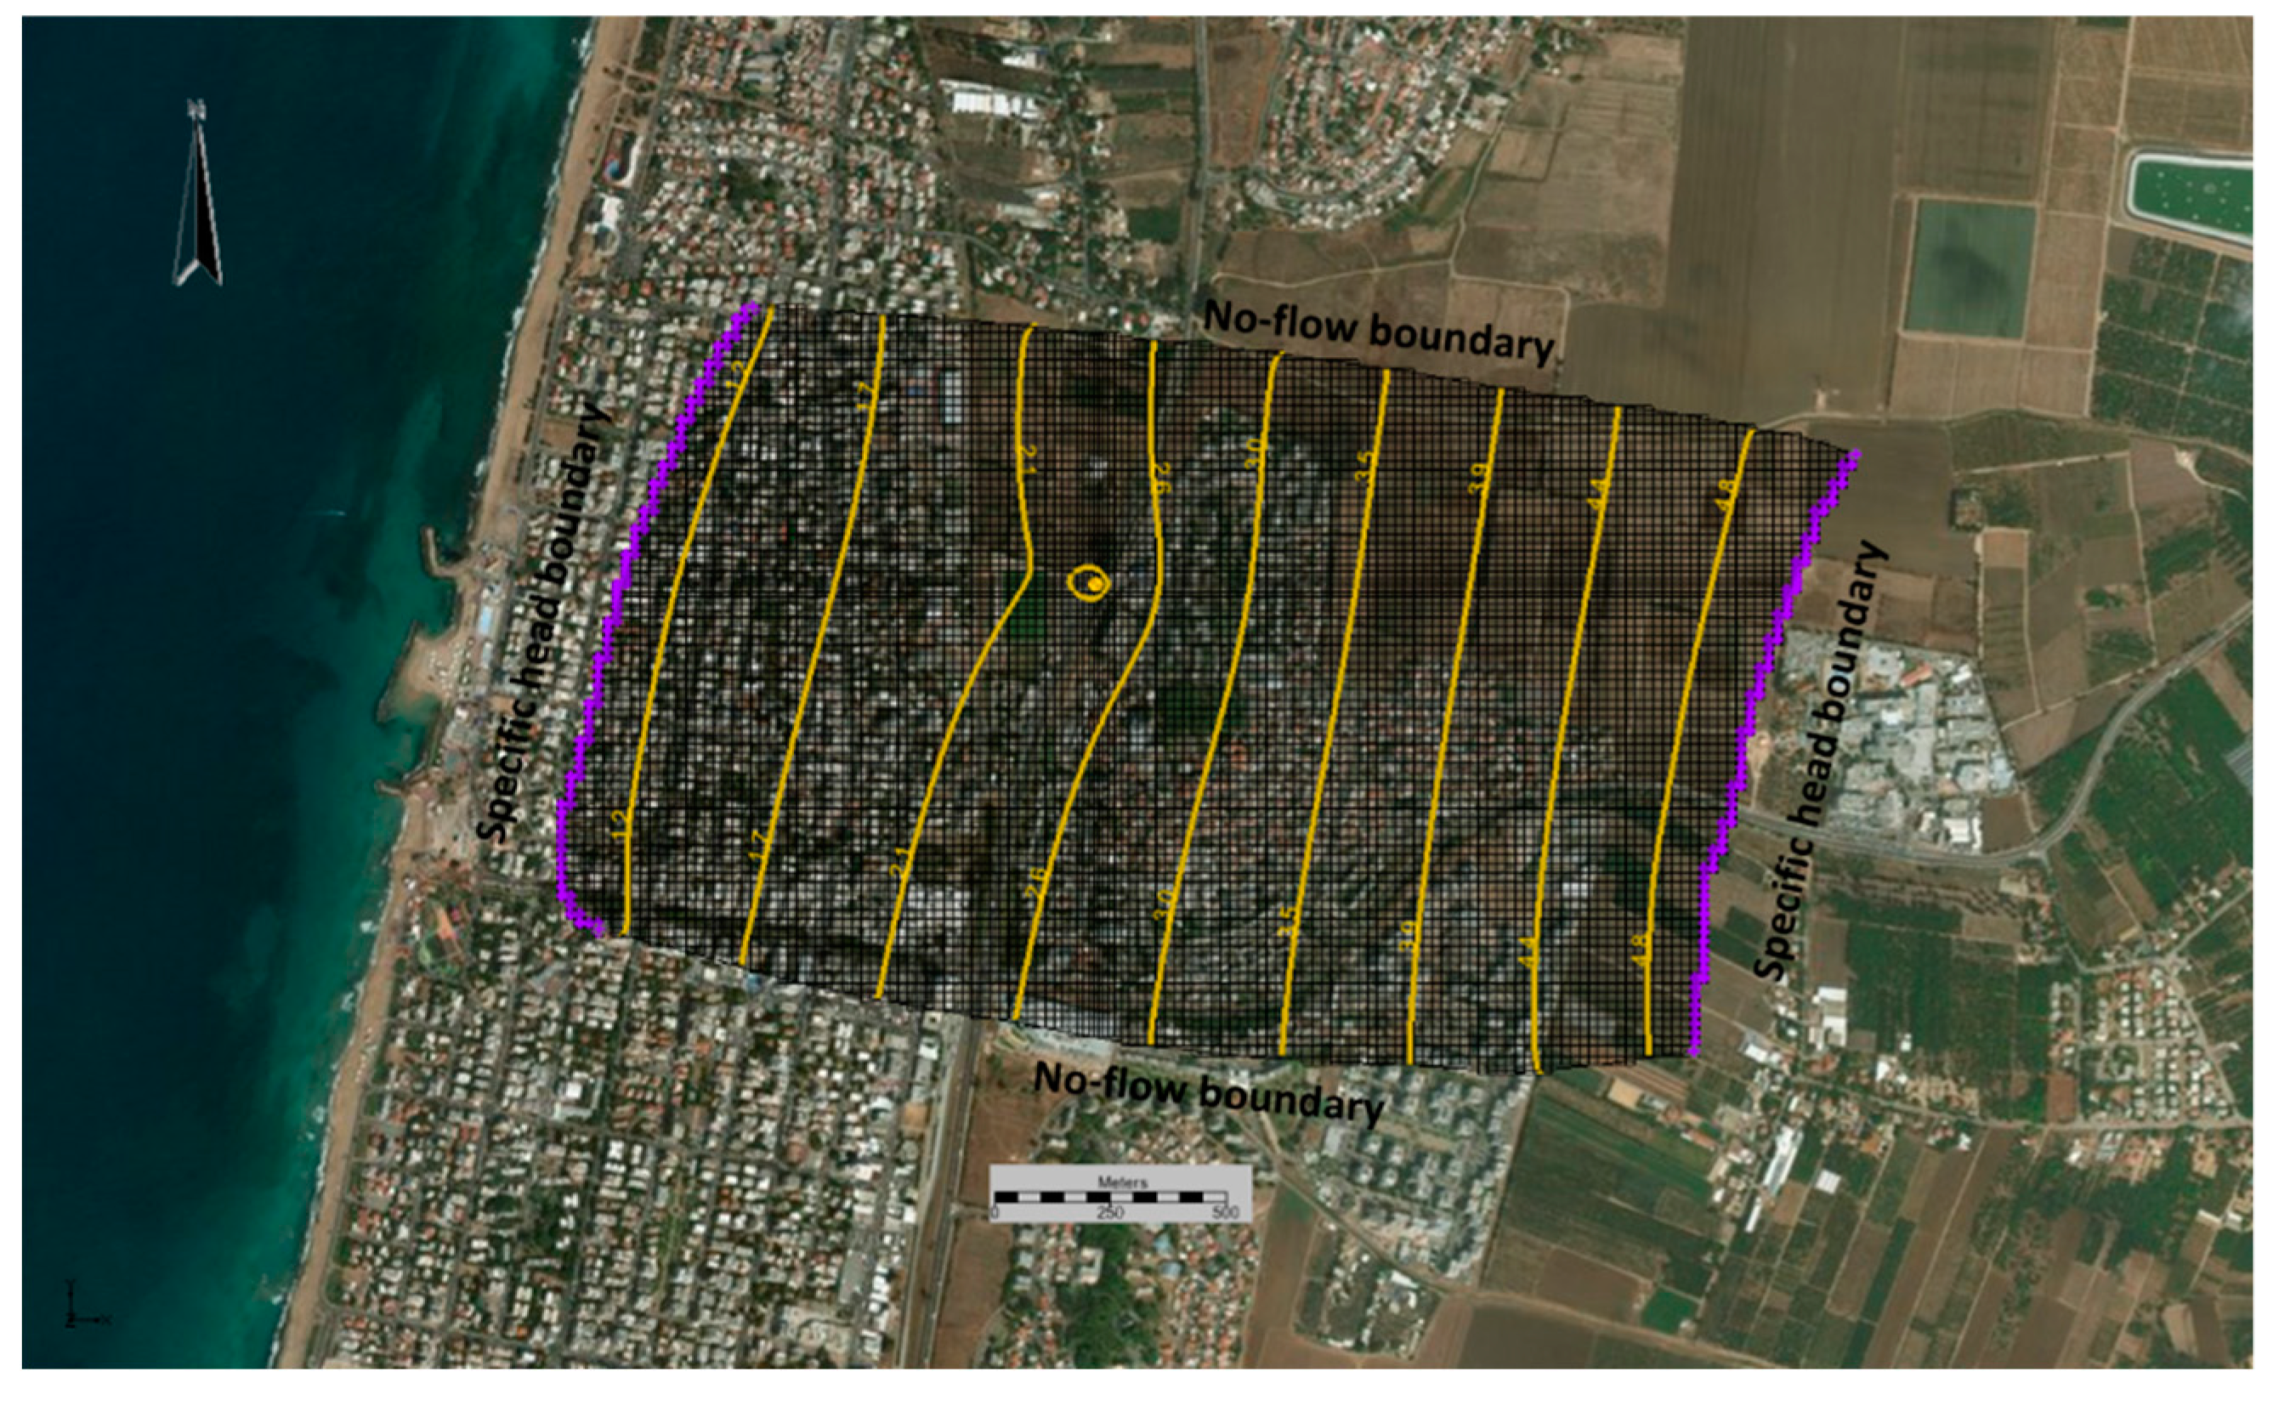
The reference WHPAs delineation was based on the simulation conducted by the Groundwater Modeling System (GMS) 10.2 based on MODFLOW and MODPATH. A 2D single sandy layer model was constructed as shown in Figure 4. The no-flow boundary condition was set for the two boundaries parallel to the groundwater flow, and specific head boundary condition was set for the other two boundaries at the west and east. The same recharge rate of 250 mm/year was used as the analytical methods. WHPAs were outlined with regard to the simulation range of backward particle tracking. The reference Level-B protection zone was 0.0073 km2 and the Level-C protection zone was 0.29 km2. Reference WHPAs aligned with the groundwater flow direction.
3.2. WHPA Delineation of the Rehovot Site (Multi-Well Field)
The same delineation methods were applied for the Rehovot multi-well pumping site. For the application of analytical methods, the WHPA of each pumping well was calculated separately. For the WhAEM2000 and MODFLOW-MODPATH modeling methods, groundwater flow model was constructed for the whole site. Hydrogeological parameter values used for each method were shown in Table 2. The pumping rate of each well in the Rehovot pumping site is much smaller than the pumping rate of the Nahariya well. Consequently, the WHPA of each pumping well would be very small if the TOT values were the same as the Israeli regulation. In order to project all of the Level-B and Level-C WHPAs of each pumping well on the same map to compare the differences, different time scale for delineating Level-B and Level-C protection areas was used for the Rehovot Site. A new TOT of 400 days was used for the Level-B protection zone, and a TOT of 15 years was used for the Level-C protection zone.
The calculation results of the protection area lateral dimensions and surface area of the analytical methods are listed in Table 3. The results of uniform flow equation methods showed great differences between XL, YL and rx. Therefore, the WHPAs of all pumping wells delineated by the uniform equation method expanded significantly in the direction that was perpendicular to the groundwater flow direction, which already deviated from the realistic protection areas for protecting groundwater resources. Owning to this, the uniform flow equation was not used for delineating WHPAs in the Rehovot wellfield and the surface area of WHPAs were not calculated. Since WhAEM2000 is incapable of simulating the aquicludes within aquifer, a homogeneous aquifer similar to the Nahariya site was built and eight pumping wells were distributed with different saturation thickness and pumping rates.
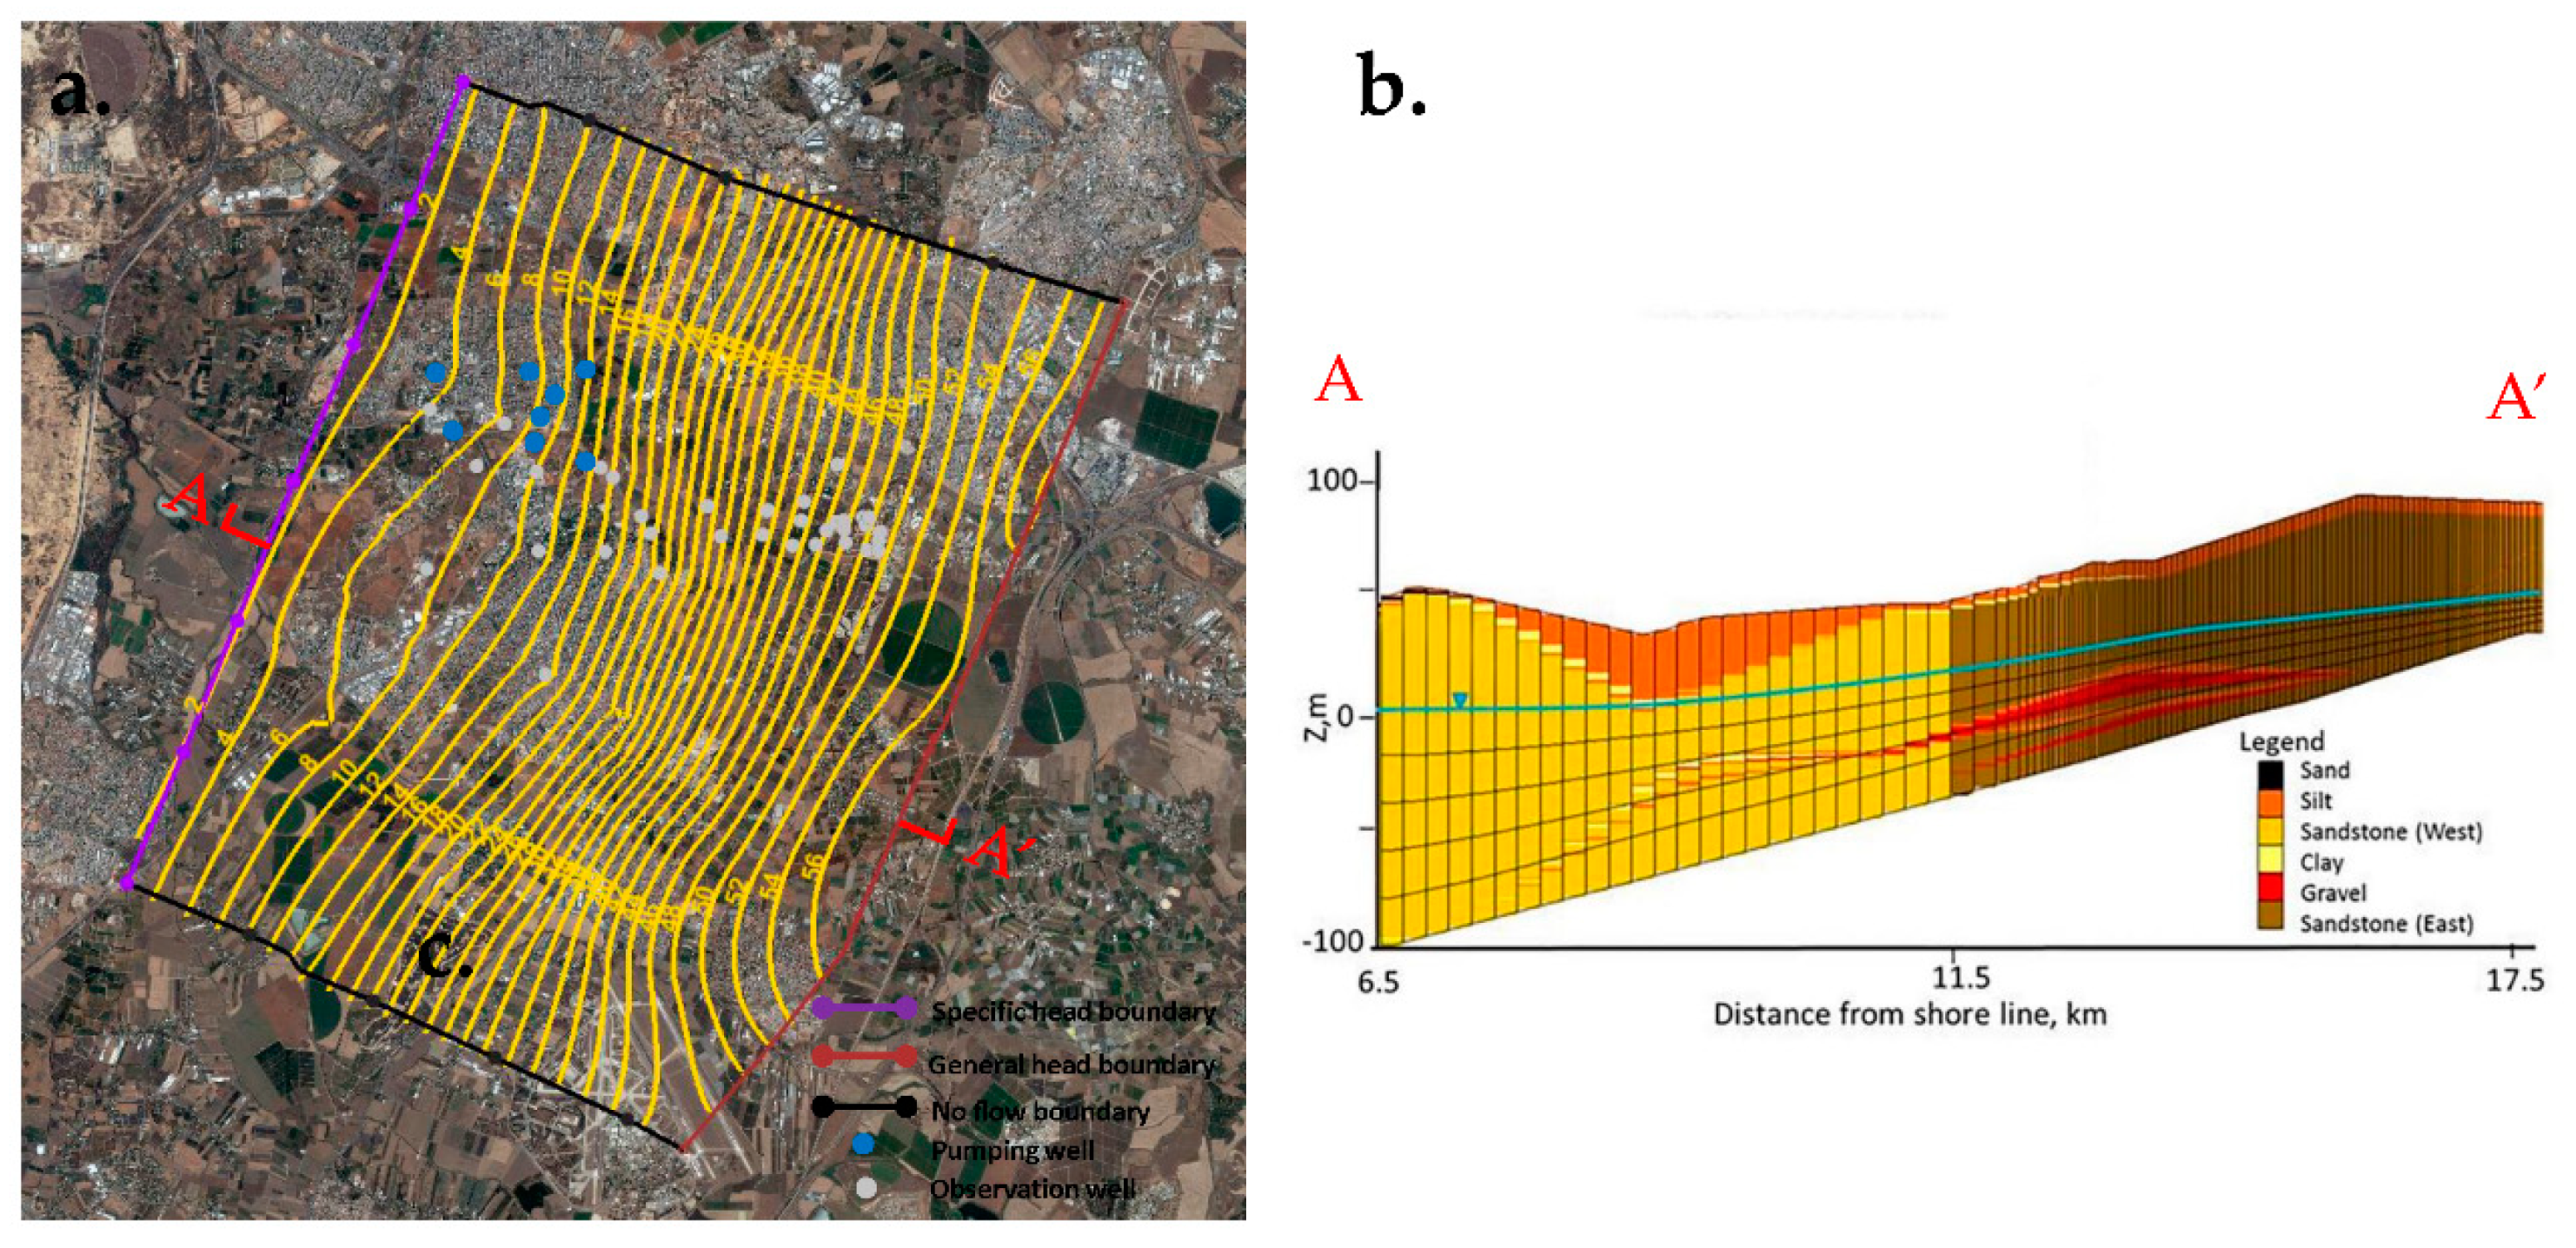
For the numerical simulations, a three-dimensional model (Figure 5) of saturated flow and particle transport was used [42]. Considering the more complex hydrogeological conditions at the Rehovot pumping site, five major materials composing the aquifer were defined: sand, silt, sandstone, clay, and gravel as shown by the cross-section A–A’ in Figure 5b. The model was calibrated to the observed groundwater levels in observation wells (grey dots in Figure 5a) from 1975–1985 [42], and it was found that a significantly improved fit was obtained when the major water-bearing sandstone was divided into two sub-materials with different hydraulic properties which were located in the western and eastern domain of the model (Figure 5b). The recharge rate (Table 2) was produced through calibration as well and varied in space. The MODPATH module was operated by releasing particles at the groundwater table of each pumping well and running backward tracking. All the WHPAs delineated by different methods can be found in Figure 6. Level-C WHPAs delineated with a longer TOT got overlapped between a few of the wells.
3.3. Uncertainty Analysis Results of Numerical Modeling (MODFLOW-MODPATH) Method
Hydraulic conductivities of two pumping sites were randomized to produce a series of conductivity values. For the Nahariya pumping site, the numerical model was built as a homogeneous aquifer; thus only one hydraulic conductivity value, which represents the entire site, was randomized. For the Rehovot pumping site, the hydraulic conductivities of two major sandstone sub-aquifers were randomized. The statistical characteristics of hydraulic conductivities are listed in Table 4. For each pumping site, 64 iterations of parameter sampling were created.
The objective of the stochastic simulation was to generate the stochastic map of the possible areas to be protected and to evaluate the probability distribution of WHPAs that are caused by the uncertainty of input hydraulic conductivities. Here, only the stochastic map produced at the Rehovot multi-well pumping site is shown in Figure 7 since the Nahariya site is a single well and the stochastic modeling results can be represented by the results of the multi-well site. As shown in Figure 7, delineating WHPAs with considering uncertainty of hydraulic conductivity produced a series of protection zones with different possibilities around each pumping well. The darker color area with a higher probability represents a higher priority that this particular location should be protected, and the lighter color refers to a lower probability and a lower protection demand. From Figure 7a,b, it was found that more uncertainties of the generated protection zones, which were indicated by the wider distributed different probability zones, appeared on the southeast of the pumping site. The reason for this was that the groundwater was contributed to by the mountainous area in the southeast side. The heterogeneity of this direction was more influential for the entire groundwater system, as well as for the particle movements. Thus, more uncertainty was encountered in this direction.
Comparing the uncertainty of Level-B WHPAs (Figure 7a) with the uncertainty of Level-C WHPAs (Figure 7b), more uncertainties were found in the larger protection zone delineation which was indicated by the more expanded protection areas with different probabilities around each well in Figure 7b. This is because confidently determining a larger area is more difficult than determining a relatively smaller area. Spatial variables can increase greatly with expanding area. The red shapes in Figure 7 represent the WHPAs for Rehovot pumping site generated by the deterministic MODFLOW-MODPATH numerical model without considering the uncertainty of the input hydraulic conductivities. By comparing the deterministic results with the stochastic modeling results, it was easy to find that the probabilistic maps basically covered all of the 100% to be protected zones and most of the 80% to be protected zones, which indicates that WHPAs delineated by the deterministic numerical modeling method can provide the most necessary protection for groundwater resources. However, there are still the uncovered protection areas due to the uncertainty of input parameters and this could result in possible risks on groundwater resources contamination.
4. Discussion and Recommendation
4.1. Comparison of WHPA Delineation Results
The results of WHPA delineation at the two study areas are shown in Figure 3 and Figure 6. In order to compare the application of five different methods, the Level-B and Level-C WHPA results were analyzed in terms of the surface area, geometric property, and the value.
4.1.1. Comparison of Level-B Protection Zones
The Level-B protection zones of the Nahariya and the Rehovot pumping site are shown in Figure 3a and Figure 6a, respectively. WHPAs delineated by different methods were represented by different colors, and the red zones are the reference protection areas delineated by numerical model. The comparative index values and the surface area of protection zone of each method are listed in Table 5.
The level-B protection zone delineation results from the two pumping sites showed that the differences among the results were significant when different methods were compared. In general, the protection area from the semi-analytical method—WhAEM2000 model, best fit the reference results in both pumping sites ( = 58.6% in the Nahariya site, Average = 34.1% in the Rehovot site), while the delineation results from the uniform flow equation method ( = 25.0% in the Nahariya site) and the HYBRID method ( = 27.0% in the Rehovot site) least fit the reference results. From the perspective of the surface area (S) of the WHPAs being delineated, all of the analytical methods generated overestimated protection zones compared to the surface area of the WHPAs delineated by the MODFLOW-MODPATH model. Exceptionally, the WhAEM2000 model produced a similar scale of protection zones as the reference method.
The application of the CFR method was based on the water balance between the pumping extraction and the aquifer storage and recharge, although the recharge rate can be neglected, as it is usually a small value. In this study, the circular protection zones delineated by the CFR method was four times larger than the reference WHPAs at the Rehovot pumping site, and the values at the two pumping sites were relatively small ( = 43.1% at the Nahariya site, and the average = 28.8% at the Rehovot site), mainly due to the unrealistic shape of the WHPAs from the CFR method. The equation of the CFR method suggests that this method is only valid when the supplying aquifer around pumping well can be regarded as a cylinder, which means that the CFR method is most suitable for confined aquifers and unconfined aquifer with a nearly flat gradient (aquifer hydraulic gradient < 0.0015). In the Nahariya site, the well was located in an unconfined aquifer with a hydraulic gradient of 0.0025 (cannot be regarded as a flat water table); thus the reference protection area ought to elongate along the direction of the groundwater flow, which significantly differed from the circular WHPA determined by the CFR method. Similar results can be observed in the Rehovot site. The hydraulic gradient in this wellfield increased gradually from west to eat (from 0.0015–0.0070). Well 1 was located in the west with a nearly flat hydraulic gradient, therefore, the reference WHPA of well 1 tended to be in a similar shape as the WHPA determined by the CFR method. The WHPAs of the other wells in the east had an elongated shape towards the groundwater flow direction as the gradient increased, which can be seen in Figure 6a.
Implementing the uniform flow equation method requires a certain degree of sloping groundwater table (hydraulic gradient). According to the equations of this method, for a nearly flat aquifer with a small hydraulic gradient value, an extremely large width for the up-gradient zone would be produced. In this study, the uniform flow equation method was only used at the Nahariya site as the pumping well has a relatively large pumping rate (6600 m3/day), and it was located in an unconfined aquifer where a significant asymmetrical drawdown could be created, and the difference between XL and YL values were appropriately small. However, the uniform flow method does not guarantee the water balance between extraction and storage as the CFR method does [30]. Therefore, the value (25.0%) of the uniform flow method was still small at the Nahariya site.
The HYBRID method integrates the water balance factor and the boundary limits of the protection area. An ellipse-shaped WHPA is usually produced by this method. The value of the HYBRID method delineated WHPA was 51.7%, indicating that this method was well suited to the reference method in this setting. However, the HYBRID method performed poorly in delineating WHPAs in the Rehovot site (average = 27.0%). Several WHPAs determined by the HYBRID method at the Rehovot wellfield were similar to the WHPAs determined by the CFR method, particularly for the wells located in small hydraulic gradient zones.
The semi-analytical WhAEM2000 model had the highest accuracy ( = 58.6%) compared with the other analytical methods. At the Rehovot wellfield, although the WhAEM2000 model was still more accurate ( = 34.1%) than the other methods, the WHPAs from the WhAEM2000 model were much smaller than the reference WHPAs and the WHPAs from other methods. This was because the WhAEM2000 model cannot represent the saturated thickness of an individual well. In the WhAEM2000 model, only a constant thickness (in the Rehovot case, saturated thickness = 85 m) can be given to all the well, which was much greater than the real saturated thickness of each well in the numerical model. Hence, under similar hydraulic conductivity values and hydraulic gradients, the WHPAs determined by the WhAEM2000 method had to be much narrower than the WHPAs determined by the numerical model, in order to ensure that the water flux to the well was equivalent to the pumping rate.
4.1.2. Comparison of Level-C Protection Zones
Level-C protection zones were delineated with a longer TOT value. The Level-C WHPAs of two pumping sites can be found in Figure 3b and Figure 6b. The comparison data are listed in Table 6. Since the Level-C WHPA of the individual wells at the Rehovot wellfield overlapped each other, the protection zone information of the entire wellfield is presented. The comparison results of the two sites showed that the WhAEM2000 model still provided the best fitting WHPAs with the highest values, followed by the HYBRID method then the CFR method.
With the CFR methods, a much smaller value (25.1%) was obtained in the Level-C WHPA at the Nahariya site. This was likely due to the fact that the analytical CFR method does not account for the heterogeneity of local aquifers. When the CFR method was implemented to delineate a relatively small area (Level-B zone), the local heterogeneity could be ignored. However, with the expansion of delineating the higher level protection zone, aquifer heterogeneity could no longer be ignored, and the uncertainty that accumulated with the heterogeneity finally resulted in the deviation of the WHPA. At the Rehovot site, the value of the entire Level-C WHPAs was basically the same as the average value of the Level-B protection zones. However, CFR method didn’t produce the WHPAs that reflect the local groundwater flow condition. For instance, by the reference method, the WHPA of well 1 in the Rehovot site should be nearly circular and not overlapping other protection zones of other wells.
The HYBRID method was still more accurate than CFR method, since it considered the groundwater flow property. The WhAEM2000 model generally fits the reference WHPA well. Despite the fact that the WHPA of well 1 delineated by this model at the Rehovot site was more narrowed and elongated to the hydraulic gradient direction. This is because WhAEM2000 model can only handle the same hydrogeological conditions for all pumping wells, which means that the individual properties of the aquifer where each well was located were disregarded. This further proves that WhAEM2000 model is less appropriate for simulating the multi-well field, though this method provides a relatively accurate approximation and offers an easier alternative compared with building a numerical model.
The WHPAs generated by different methods at the Rehovot multi-well pumping site indicated that WHPAs in the wellfield can be overlapped when there are a few wells nearby (Figure 6), or when delineating WHPAs to a larger range. Comparing the values (Table 5 and Table 6) of both Level-B and Level-C WHPAs at the Nahariya site with the average value at the Rehovot wellfield, smaller values were obtained in the Rehovot wellfield, indicating that the same methods performed less accurately in the multi-well field. This is likely due to the influence of well-interference. In a wellfield consisting of several pumping wells, the groundwater flow, as well as the particle transport with the groundwater flow system, can be greatly affected by adjacent wells. Other methods, except WhAEM2000 model and numerical modeling, do not account for the adjacent well interferences.
4.2. Recommendation for Selecting Delineation Method
The comparison between WHPAs, determined by different types of methods, showed significant differences. The WhAEM2000 model fits the reference method best, while all the analytical methods overestimated the protection zones. Analysis in detail indicated that it is important to apply the analytical methods to the appropriate hydrogeological setting.
The principle idea of CFR method is to ensure the water balance, so it can only be used for a confined aquifer or an unconfined aquifer with a nearly flat water table (local hydraulic gradient < 0.0015), and it can only provide a very rough estimate for WHPA delineation. The uniform flow equation is only suitable for a sloping aquifer with a hydraulic gradient higher than 0.0015, but this method aligns well to the groundwater flow direction which reflects the regional flow characteristics. The HYBRID method had better fitting compared to other analytical methods, which indicated that water balance and regional flow characteristics are two essential factors for delineating a proper WHPA. Water balance controls the general size of the protection zone, and the consideration of flow characteristics determines the shape of the protection zone. Furthermore, well interferences existed in the multi-well field could have significant impact on the accuracy of WHPAs delineation. Since the analytical methods are not able to consider the influences from adjacent wells, only WhAEM2000 model and numerical modeling methods are recommended. But the WhAEM2000 model is limited to handle the uniform aquifer condition, which means it’s not appropriate to be used for WHPA delineation while the aquifer parameters vary greatly at each well location.
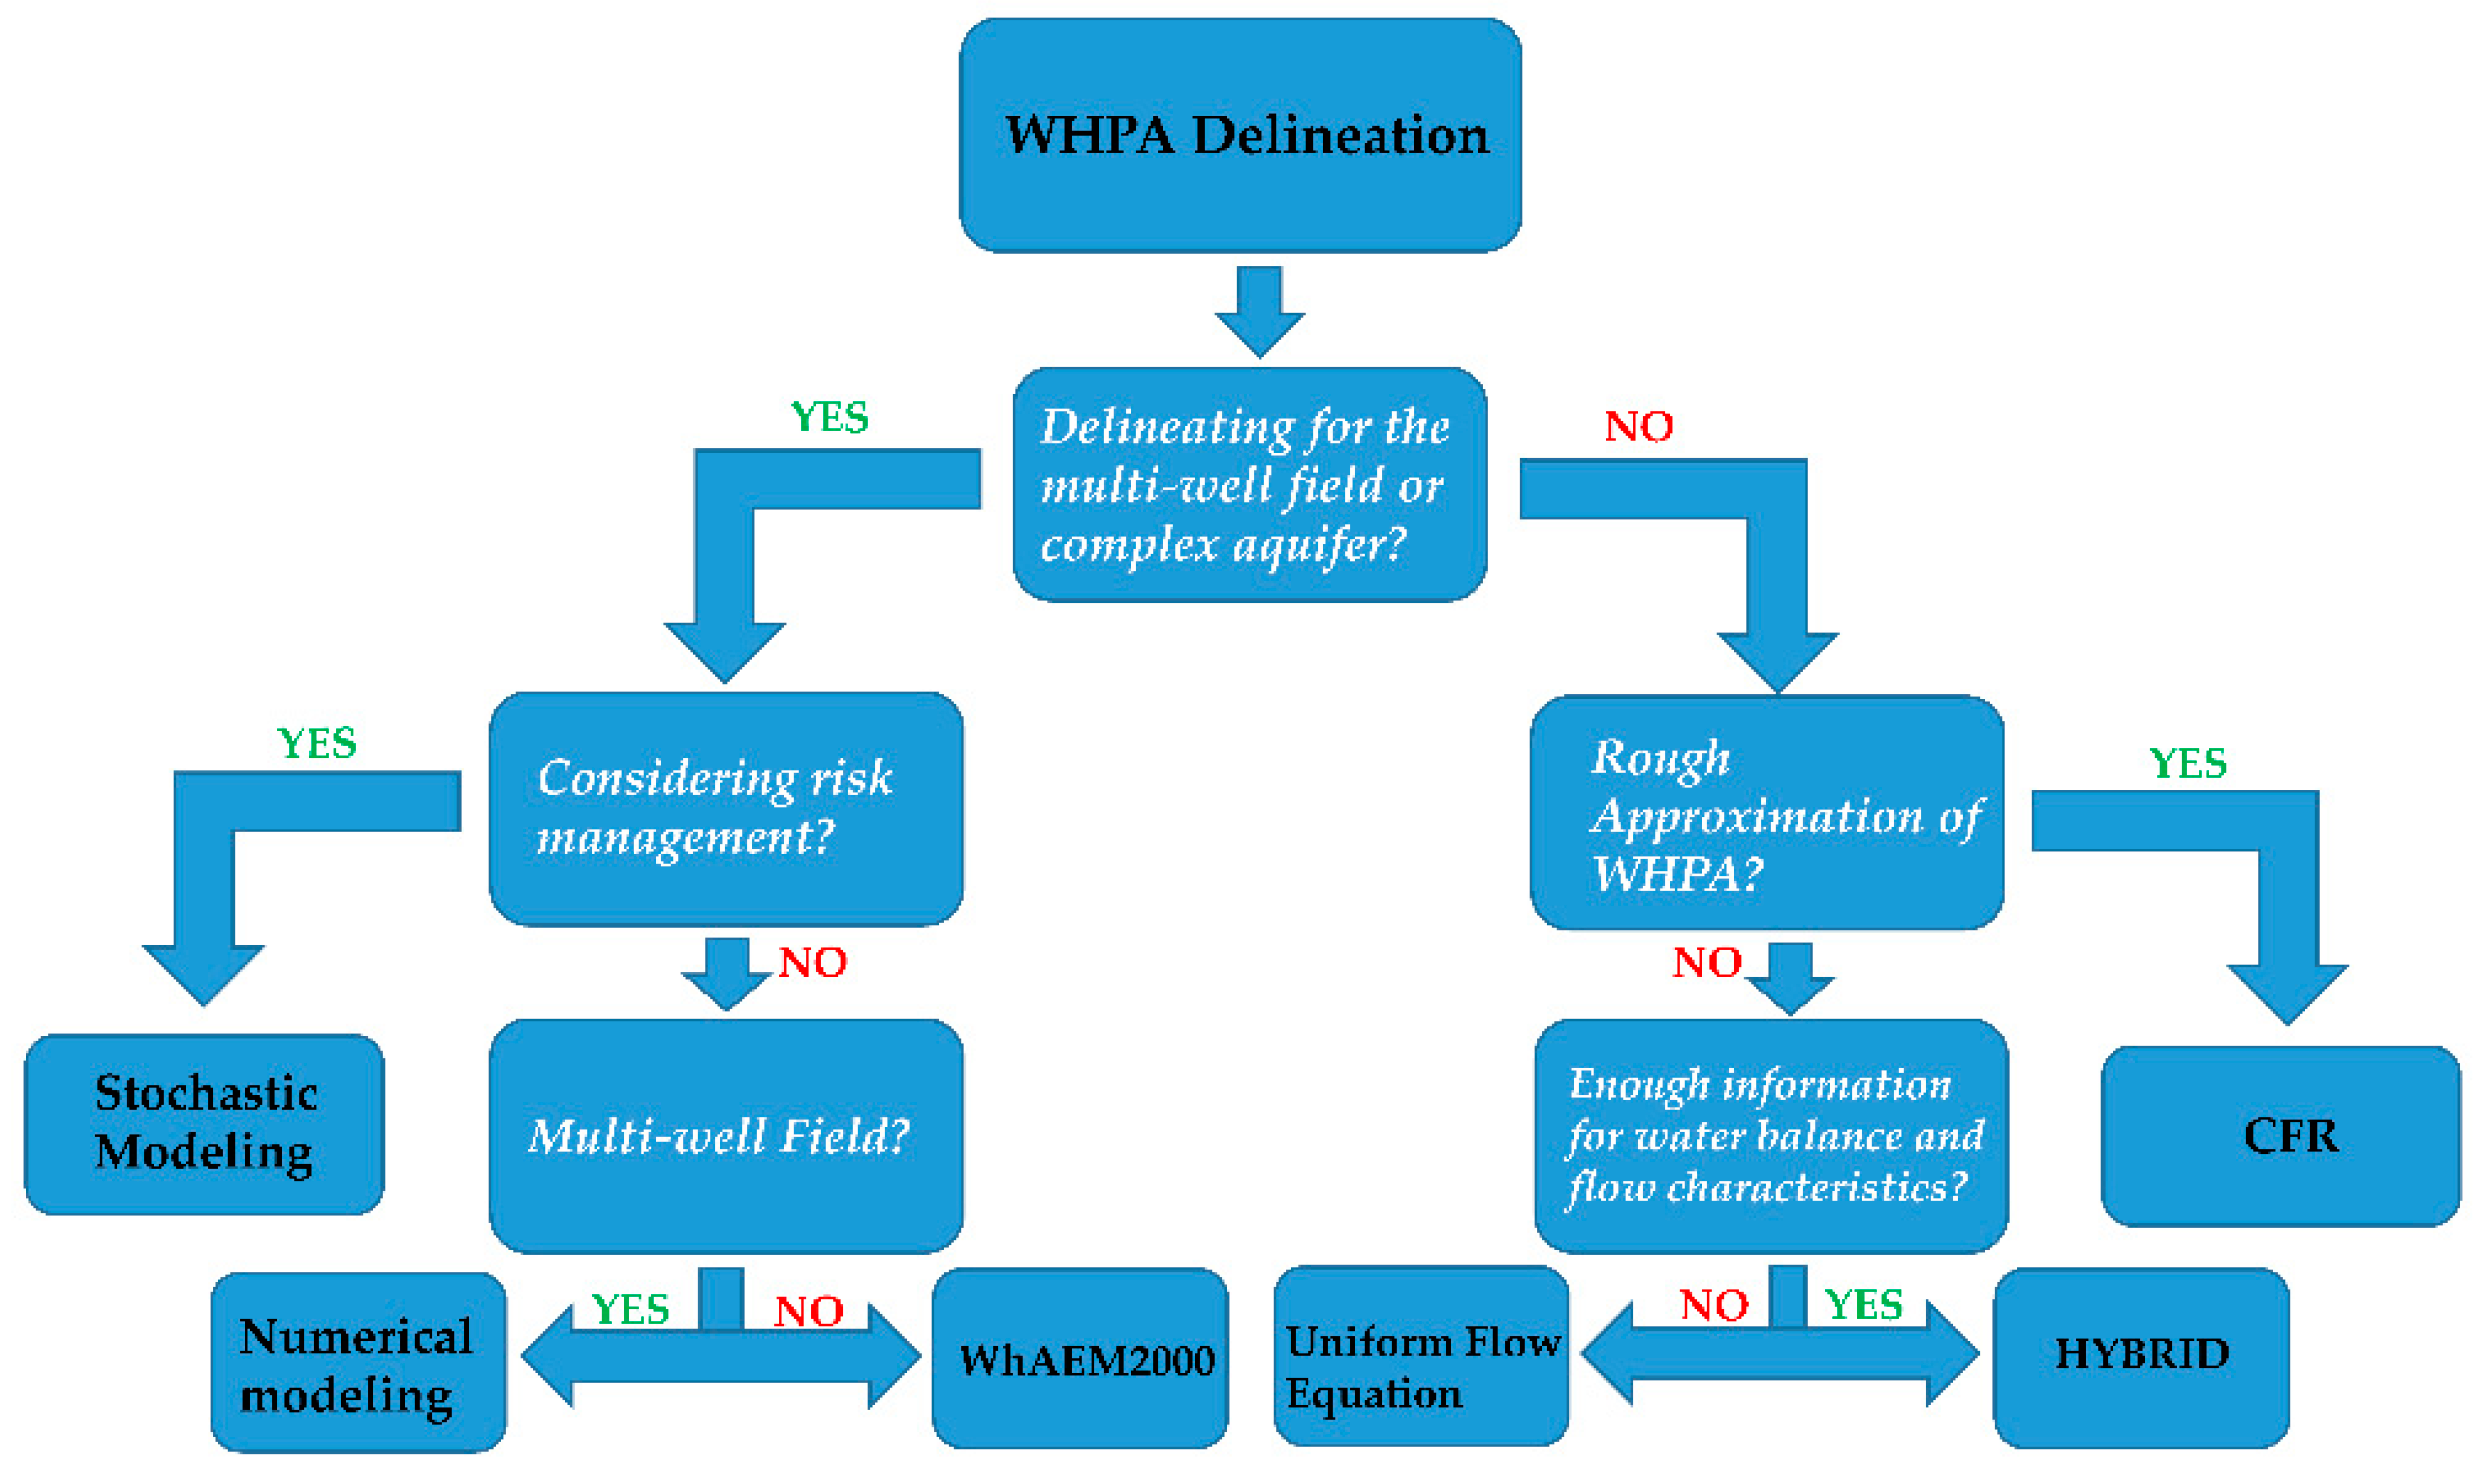
The uncertainty analysis through stochastic modeling produced the probabilistic distribution map of the protection zones (Figure 7). This map shows the different necessities of protecting the areas around the pumping well, and improved the deterministic delineation method which excludes the possibly threated zones. It is useful for land-use risk management around pumping wells to prevent potential contaminating activities. A general WHPA delineation method selection flow chart is depicted in Figure 8. This scheme is recommended to choose a suitable protection zone delineation method based on data availability and delineation expectations.
5. Conclusions
Since the WHPA cannot be measured but only be calculated or simulated, it is necessary to justify the performance of the commonly applied WHPA delineation methods. In this comparative study, five different WHPA delineation methods were employed to define the protection zones for two pumping sites in the unconfined coastal aquifer in Israel. The MODFLOW-MODPATH numerical modeling method was selected as the reference method. By comparing the WHPA results with the reference WHPA, the semi-analytical WhAEM2000 model provides the best fitting, while all of the analytical methods overestimated the protection zones. The CFR method, which is based on water balance between aquifer extraction and storage, provided fast WHPA approximation. But it can only be used for the confined or the unconfined aquifer with a nearly flat water table. On the other hand, the uniform flow equation method preserved groundwater flow property and can only be applied at sloping aquifers. However, the latter does not consider the water balance as the CFR method does; therefore, it could produce unrealistic WHPAs. The better fitting to the reference method of the analytical HYBIRD method indicated that it is essential to ensure water balance calculation as well as to reflecting regional flow characteristics while defining the WHPA. Dealing with a complex hydrological condition and a multi-well field, only semi-analytical or numerical modeling should be applied. Stochastic modeling of both pumping sites generated a probability distribution map for WHPAs, which suggested the different necessities of protecting various areas around the pumping well and offered risk management into WHPA delineation. Therefore, selecting a WHPA delineation method should be based on data availability and delineation expectations. The recommended procedure for choosing the proper delineation method could facilitate this process and resolve the puzzle of finding the “best” method.
Author Contributions
This paper was completed under the supervision of A.Y. and N.W.; Y.L. conducted the calculation and modeling, analyzed the results and wrote the paper. N.W. contributed to the analysis discussion and helped with reviewing the manuscript. A.Y. guided building the concepts of this research, helped with analyzing the results and building up the numerical models, as well as reviewing this manuscript.
Funding
This research was funded by Maccabi Carasso, grant number 87382911.
Acknowledgments
This research was supported by China Scholarship Council and the Council for Higher Education, Israel. Thanks due to Noam Dvory for providing field data of the Nahariya site and to Mikhail Kuznetzov for offering modeling skills supervision.
Conflicts of Interest
The authors declare no conflict of interest.
References
- Siebert, S.; Burke, J.; Faures, J.M.; Frenken, K.; Hoogeveen, J.; Döll, P.; Portmann, F.T. Groundwater use for irrigation—A global inventory. Hydrol. Earth Syst. Sci. 2010, 14, 1863–1880. [Google Scholar] [CrossRef]
- Shah, T.; Burke, J.; Villholth, K.G.; Angelica, M.; Custodio, E.; Daibes, F.; Hoogesteger, J.; Giordano, M.; Girman, J.; Van Der Gun, J.; et al. Groundwater: A Global Assessment of Scale and Significance; Earthscan: London, UK; International Water Management Institute (IWMI): Colombo, Sri Lanka, 2007; pp. 395–423. [Google Scholar]
- World Water Assessment Programme (United Nations). Water: A Shared Responsibility; the United Nations World Water Development Report 2; UN-HABITAT: Nairobi, Kenya, 2006. [Google Scholar]
- EPA. Guidelines for Delineation of Wellhead Protection Areas; EPA-440/5-93-001; United States Environmental Protection Agency: Washington, DC, USA, 1987; p. 212.
- Cleary, T.C.B.F.; Cleary, R.W. Delineation of Wellhead Protection Areas: Theory and Practice. Water Sci. Technol. 1991, 24, 239–250. [Google Scholar] [CrossRef]
- Vassolo, S.; Kinzelbach, W.; Schafer, W. Determination of a well head protection zone by stochastic inverse modelling. J. Hydrol. 1998, 206, 268–280. [Google Scholar] [CrossRef]
- Schleyer, R.; Milde, G.; Milde, K. Wellhead Protection Zones in Germany—Delineation, Research and Management. J. Inst. Water Environ. Manag. 1992, 6, 303–311. [Google Scholar] [CrossRef]
- EPA. Handbook—Groundwater and Wellhead Protection; United States Environmental Protection Agency: Washington, DC, USA, 1994; p. 288.
- Harter, T. Delineating Groundwater Sources and Protection Zones; Rollins, L., Ed.; University of California at Davis: Davis, CA, USA, 2002. [Google Scholar]
- EPA. Literature Review of Methods for Delineating Wellhead Protection Areas; United States Environmental Protection Agency: Washington, DC, USA, 1998; p. 48.
- Rock, G.; Kupfersberger, H. Numerical delineation of transient capture zones. J. Hydrol. 2002, 269, 134–149. [Google Scholar] [CrossRef]
- Piccinini, L.; Fabbri, P.; Pola, M.; Marcolongo, E.; Rosignoli, A. Numerical modeling to well-head protection area delineation, an example in Veneto Region (NE Italy). Rend. Online Soc. Geol. Ital. 2015, 35, 232–235. [Google Scholar] [CrossRef]
- Harbaugh, A.W. MODFLOW-2005: The U.S. Geological Survey Modular Ground-Water Model—The Ground-Water Flow Process; US Department of the Interior, US Geological Survey: Reston, VA, USA, 2005.
- Forster, C.B.; Lachmar, T.E.; Oliver, D.S. Comparison of Models for Delineating Wellhead Protection Areas in Confined to Semiconfined Aquifers in Alluvial Basins. Groundwater 1997, 35, 689–697. [Google Scholar] [CrossRef]
- Pollock, D.W. User Guide for MODPATH Version 7—A Particle-Tracking Model for MODFLOW; US Department of the Interior, US Geological Survey: Reston, VA, USA, 2016; p. 41.
- Evers, S.; Lerner, D.N. How uncertain is our estimate of a wellhead protection zone? Ground Water 1998, 36, 49–57. [Google Scholar] [CrossRef]
- Theodossiou, N.; Fotopoulou, E. Delineating well-head protection areas under conditions of hydrogeological uncertainty. A case-study application in northern Greece. Environ. Process. 2015, 2, 113–122. [Google Scholar] [CrossRef]
- Fadlelmawla, A.A.; Dawoud, M.A. An approach for delineating drinking water wellhead protection areas at the Nile Delta, Egypt. J. Environ. Manag. 2006, 79, 140–149. [Google Scholar] [CrossRef] [PubMed]
- Stauffer, F.; Guadagnini, A.; Butler, A.; Franssen, H.J.H.; Van den Wiel, N.; Bakr, M.; Riva, M.; Guadagnini, L. Delineation of source protection zones using statistical methods. Water Resour. Manag. 2005, 19, 163–185. [Google Scholar] [CrossRef]
- Schmoll, O.; World Health Organization. Protecting Groundwater for Health: Managing the Quality of Drinking-Water Sources; IWA Pub.: London, UK, 2006. [Google Scholar]
- Paradis, D.; Martel, R.; Karanta, G.; Lefebvre, R.; Michaud, Y.; Therrien, R.; Nastev, M. Comparative study of methods for WHPA delineation. Ground Water 2007, 45, 158–167. [Google Scholar] [CrossRef] [PubMed]
- Landmeyer, J.E. Description and Application of Capture Zone Delineation for A Wellfield at Hilton Head Island, South Carolina. Water-Resour. Investig. Rep. 1994, 94, 4012. [Google Scholar]
- ANWQMS. National Water Quality Management Strategies: Guidelines for Groundwater Protection in Australia; Agriculture and Resources Management Council of Australia and New Zealand: Canberra, Australia, 1995.
- DoELG. Groundwater Protection Schemes; Environmental Protection Agency and Geological Survey of Ireland, Department of Environment and Local Government: Dublin, Ireland, 1999.
- DVGW. Code of Practice W101 for Drinking Water Protection Areas Part 1, Protective Areas for Groundwater; German Association of Gas and Water Experts: Bonn, Germany, 1995. [Google Scholar]
- Government of Oman. Water Resources of the Sultanate of Oman; Ministry of Water Resources: Muscat, Oman, 1991.
- Bear, J.; Jacobs, M. On the movement of water bodies injected into aquifers. J. Hydrol. 1965, 3, 37–57. [Google Scholar] [CrossRef]
- Todd, D.K.; Mays, L.W. 4.3 WELL IN A UNIFORM FLOW. In Groundwater Hydrology, 3rd ed.; Bill, Z., Ed.; John Wiley & Sons, Inc.: New York, NY, USA, 2004; p. 656. [Google Scholar]
- Haitjema, H.M.; Wittman, J.; Kelson, V.; Bauch, N. WhAEM: Program Documentation for the Wellhead Analytic Element Model; EPA/600/R-94/210 (NTIS PB95-167373); U.S. Environmental Protection Agency: Washington, DC, USA, 1994.
- Paradis, D.; Martel, R. HYBRID: A Wellhead Protection Delineation Method for Aquifers of Limited Extent; Geological Survey of Canada: Ottawa, ON, Canada, 2007; p. 5.
- Israel Ministry of Health. Public Health Regulations 2013—The Sanitary Quality of Drinking Water and Drinking Water Facilities; Collection of Regulations 7262; Department of Environmental Health, Public Health Services, Ministry of Health: Jerusalem, Israel, 2013; p. 34.
- Miller, C.; Chudek, P.; Babcock, S. A Comparison of wellhead Protection Area Delineation Methods for Public Drinking Water Systems in Whatcom County, Washington. J. Environ. Health 2003, 66, 17. [Google Scholar] [PubMed]
- Loucks, D.P.; van Beek, E.; Stedinger, J.R.; Dijkman, J.P.M.; Villars, M.T. 9. Model Sensitivity and Uncertainty Analysis. In Water Resources Systems Planning and Management: An Introduction to Methods, Models and Applications; Springer International Publishing AG: Basel, Switzerland, 2005. [Google Scholar] [CrossRef]
- Guha, H. A Stochastic Modeling Approach to Address Hydrogeologic Uncertainties in Modeling Wellhead Protection Boundaries in Karst Aquifers1. JAWRA J. Am. Water Resour. Assoc. 2008, 44, 654–662. [Google Scholar] [CrossRef]
- Weinberger, G.; Livshitz, Y.; Givati, A.; Zilberbrand, M.; Tal, A.; Weiss, M.; Zurieli, A. The Natural Water Resources Between the Mediterranean Sea and the Jordan River; Hydro Report 11/1; Israel Hydrological Service: Jerusalem, Israel, 2011; p. 63.
- Eriksson, E.; Khunakasem, V. Chloride concentration in groundwater, recharge rate and rate of deposition of chloride in the Israel Coastal Plain. J. Hydrol. 1969, 7, 178–197. [Google Scholar] [CrossRef]
- Kass, A.; Gavrieli, I.; Yechieli, Y.; Vengosh, A.; Starinsky, A. The impact of freshwater and wastewater irrigation on the chemistry of shallow groundwater: A case study from the Israeli Coastal Aquifer. J. Hydrol. 2005, 300, 314–331. [Google Scholar] [CrossRef]
- Nativ, R.; Weisbrod, N. Hydraulic Connections among Subaquifers of the Coastal-Plain Aquifer, Israel. Ground Water 1994, 32, 997–1007. [Google Scholar] [CrossRef]
- Yosef, B. The Hydrogeology of the Coastal Plain of Western Galilee (in Hebrew); TAHAL: Tel Aviv, Israel, 1967. [Google Scholar]
- Wexler, A. Hydrogeological Plan for the Water Development, Production, and Utilization in the Kavri Basin; GSI/36/2001; Water Commission & Planning Department: Tel Aviv, Israel, 2001.
- Dvory, N. Hydrographic Survey in the Production Field of Nahariya Municipality Drilling Etgar Engineering LTD Report; Etgar: Tel Aviv, Israel, 2009. [Google Scholar]
- Yakirevich, A.; Kuznetsov, M.; Adar, E. Modeling Contaminant Migration in Coastal Aquifer (Givon Region)—Internal Report; Ben-Gurion University of the Negev: Beersheba, Israel, 2015. [Google Scholar]
Figure 1.
Illustration of comparative index (modified according to Paradis et al. [21]).
Figure 1.
Illustration of comparative index (modified according to Paradis et al. [21]).

Figure 2.
Location, representative aquifer cross-section of the two study areas and the well distribution map of the multi-well pumping site in Rehovot: (a) location of two study areas; (b) example hydrogeological cross-section of coastal aquifer in Israel; (c) distribution pattern of eight pumping wells in the Rehovot wellfield.

Figure 3.
Level-B and Level-C WHPAs of the Nahariya pumping site delineated by different methods: (a) Level-B (TOT = 100 days) WHPAs; (b) Level-C (TOT = 400 days) WHPAs.
Figure 3.
Level-B and Level-C WHPAs of the Nahariya pumping site delineated by different methods: (a) Level-B (TOT = 100 days) WHPAs; (b) Level-C (TOT = 400 days) WHPAs.

Figure 4.
2D numerical model domain and boundary conditions of the Nahariya site: yellow lines represent the simulated groundwater heads.
Figure 4.
2D numerical model domain and boundary conditions of the Nahariya site: yellow lines represent the simulated groundwater heads.

Figure 5.
3D numerical model domain of the Rehovot pumping field: (a) Model domain and boundary conditions; (b) Representative cross-section A-A’ of the model after calibration.
Figure 5.
3D numerical model domain of the Rehovot pumping field: (a) Model domain and boundary conditions; (b) Representative cross-section A-A’ of the model after calibration.

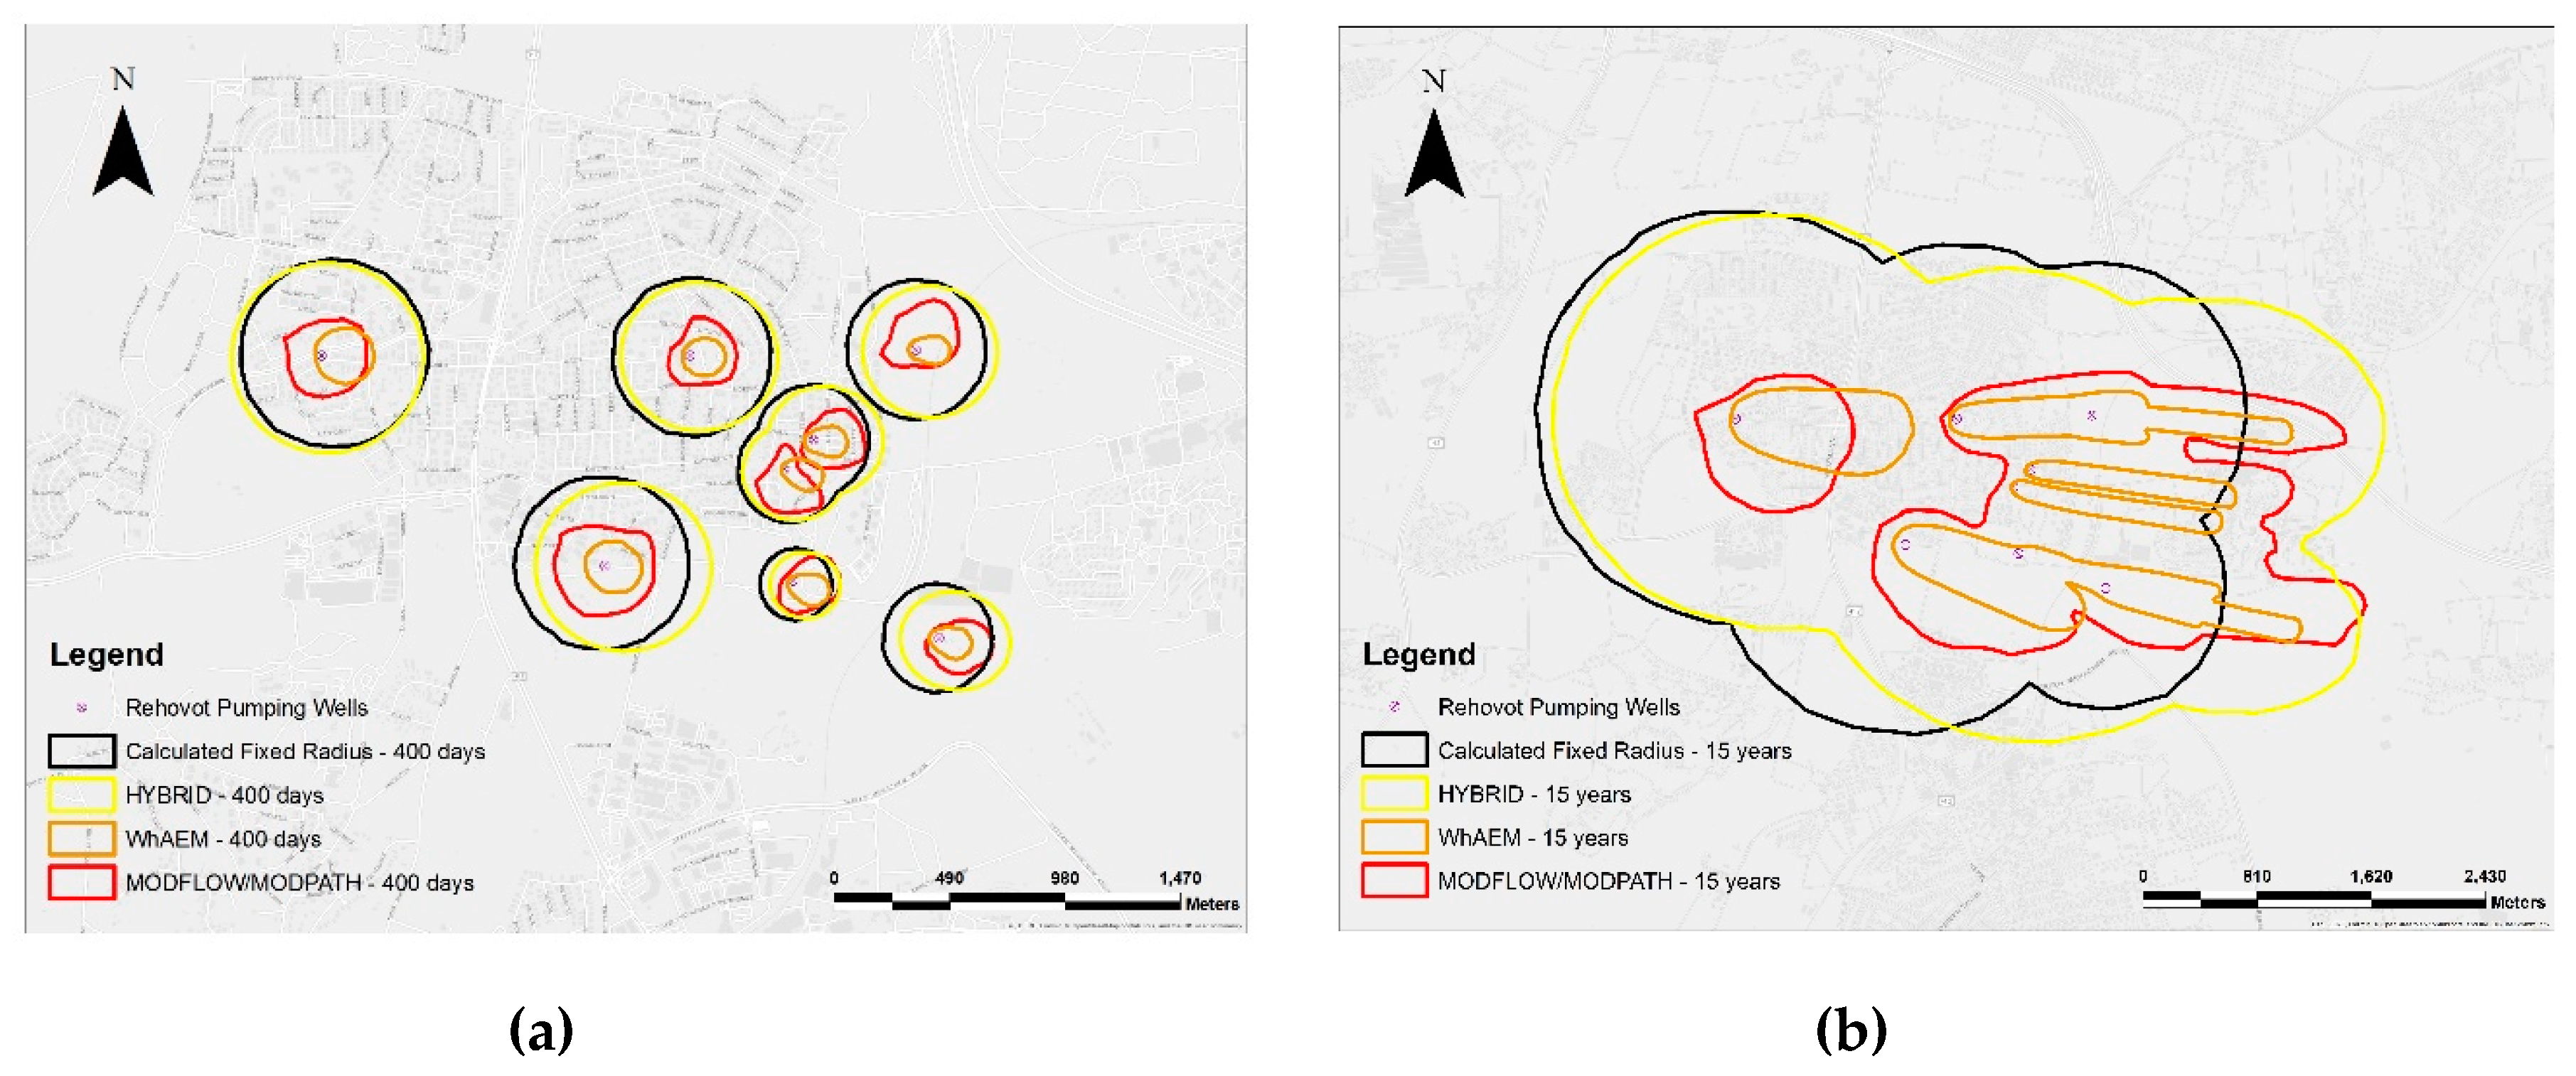
Figure 6.
Level-B and Level-C WHPAs of the Rehovot wellfield pumping site delineated by different methods: (a) Level-B (TOT = 400 days) WHPAs; (b) Level-C (TOT = 15 years) WHPAs.
Figure 6.
Level-B and Level-C WHPAs of the Rehovot wellfield pumping site delineated by different methods: (a) Level-B (TOT = 400 days) WHPAs; (b) Level-C (TOT = 15 years) WHPAs.

Figure 7.
Probabilistic maps produced by stochastic modeling that reflects the uncertainty of WHPAs at the Rehovot wellfield pumping site: (a) Level-B probabilistic map; (b) Level-C probabilistic map. The red shapes represent the WHPAs from the normal deterministic numerical modeling method.
Figure 7.
Probabilistic maps produced by stochastic modeling that reflects the uncertainty of WHPAs at the Rehovot wellfield pumping site: (a) Level-B probabilistic map; (b) Level-C probabilistic map. The red shapes represent the WHPAs from the normal deterministic numerical modeling method.

Figure 8.
Recommended procedure for selecting a WHPA delineation based on data availability and delineation expectation.
Figure 8.
Recommended procedure for selecting a WHPA delineation based on data availability and delineation expectation.


Table 1.
Equations of different analytical WHPA delineation methods.
| Analytical Methods | Equations | Note |
|---|---|---|
| CFR | r (L): radius of the circular WHPA, Q (L3/T): pumping rate, t (T): time of travel, n (-): aquifer porosity, H (L): aquifer thickness, N (L/T): infiltration rate. | |
| Uniform flow equation | XL (L): down-gradient flow boundary, YL (L): max. width of up-gradient zone, tx (T): time of travel, rx(±) (L): distance to up-gradient boundary (+), or to down-gradient boundary (−), K (L/T): hydraulic conductivity, b (L): aquifer thickness, i (-): hydraulic gradient, n (-): aquifer porosity, Q (L3/T): pumping rate. | |
| HYBRID | w/2 (L): vertical dimension of ellipse, d/2 (L): horizontal dimension of ellipse, other parameters are the same as the parameters from uniform flow equation method. |
Table 2.
Hydrogeological parameters used in different methods for the Nahariya and Rehovot pumping sites.
Table 2.
Hydrogeological parameters used in different methods for the Nahariya and Rehovot pumping sites.
| Method | Pumping Rate (m3/day) | Saturated Thickness (m) | Porosity (%) | Recharge Rate (mm/year) | Conductivity (m/day) | Hydraulic Gradient |
|---|---|---|---|---|---|---|
| Nahariya site | ||||||
| CFR | 6600 | 15.5 | 30 | 250 | - | - |
| Uniform flow equation | 6600 | 15.5 | 30 | - | 250 | 0.0025 |
| WhAEM2000 | 6600 | 15.5 | 30 | 250 | 250 | - |
| HYBRID | 6600 | 15.5 | 30 | 250 | 250 | 0.0025 |
| MODFLOW-MODPATH | 6600 | 15.5 | 30 | 250 | 250 | - |
| Rehovot site | ||||||
| CFR | 1000–3000 | 4.9–18.5 | 30 | 208 | - | - |
| WhAEM2000 | 1000–3000 | 85 | 30 | 208 | 10.5 | - |
| HYBRID | 1000–3000 | 4.9–18.5 | 30 | 208 | 10.5 | 0.0019–0.0068 |
| MODFLOW-MODPATH | 1000–3000 | 4.9–18.5 | 30 | 0.1–475 | 0.006–30 | - |
Table 3.
Calculation results of Level-B and Level-C WHPAs in the Rehovot pumping site by analytical methods.
Table 3.
Calculation results of Level-B and Level-C WHPAs in the Rehovot pumping site by analytical methods.
| Well Number | Analytical Methods | ||||||||
|---|---|---|---|---|---|---|---|---|---|
| CFR | Uniform Flow Equation | HYBRID | |||||||
| Level-B WHPA | |||||||||
| r (m) | S (km2) | XL (m) | YL (m) | rx (m) | S (km2) | w/2(m) | d/2 (m) | S (km2) | |
| Well 1 | 397 | 0.49 | 3002 | 9431 | 415 | - | 398 | 397 | 0.50 |
| Well 2 | 335 | 0.35 | 1173 | 3686 | 367 | - | 334 | 336 | 0.35 |
| Well 3 | 295 | 0.27 | 462 | 1450 | 361 | - | 292 | 298 | 0.27 |
| Well 4 | 238 | 0.18 | 374 | 1176 | 291 | - | 236 | 241 | 0.18 |
| Well 5 | 221 | 0.15 | 323 | 1014 | 274 | - | 219 | 224 | 0.15 |
| Well 6 | 367 | 0.42 | 707 | 2223 | 433 | - | 365 | 370 | 0.42 |
| Well 7 | 152 | 0.07 | 160 | 505 | 203 | - | 148 | 156 | 0.07 |
| Well 8 | 231 | 0.17 | 289 | 907 | 296 | - | 227 | 235 | 0.16 |
| Level-C WHPA | |||||||||
| Well 1 | 1467 | 6.76 | 3002 | 9431 | 1715 | - | 1457 | 1477 | 6.76 |
| Well 2 | 1236 | 4.80 | 1173 | 3686 | 1704 | - | 1120 | 1275 | 4.48 |
| Well 3 | 1089 | 3.72 | 462 | 1450 | 2069 | - | 941 | 1260 | 3.72 |
| Well 4 | 880 | 2.43 | 374 | 1176 | 1670 | - | 761 | 1018 | 2.43 |
| Well 5 | 817 | 2.10 | 323 | 1014 | 1613 | - | 692 | 965 | 2.10 |
| Well 6 | 1356 | 5.77 | 707 | 2223 | 2330 | - | 1229 | 1497 | 5.78 |
| Well 7 | 560 | 0.98 | 160 | 505 | 1336 | - | 420 | 748 | 0.99 |
| Well 8 | 852 | 2.28 | 289 | 907 | 1833 | - | 685 | 1060 | 2.28 |
Note: r is the radius of the circular WHPA by CFR method.
Table 4.
Statistical characteristics of the hydraulic conductivities to be randomly sampled at two pumping sites.
Table 4.
Statistical characteristics of the hydraulic conductivities to be randomly sampled at two pumping sites.
| Parameters | Mean(Starting) Value | Value Range | Distribution Pattern |
|---|---|---|---|
| Nahariya Site | |||
| K (m/day) | 200 | 100–300 | Lognormal |
| Rehovot Site | |||
| Kwest (m/day) | 10.43 | 5.0–15.0 | Lognormal |
| Keast (m/day) | 7.30 | 3.5–10.5 | Lognormal |
Note: Kwest is the hydraulic conductivity of the western part sandstone of Rehovot pumping site MODFLOW model; Keast is the hydraulic conductivity of the eastern part sandstone of Rehovot pumping site MODFLOW model.
Table 5.
Level-B protection areas and comparison index of different delineation methods at the Nahariya and the Rehovot pumping site.
Table 5.
Level-B protection areas and comparison index of different delineation methods at the Nahariya and the Rehovot pumping site.
| Pumping Sites | Surface Area (S) | CFR | Uniform Flow Equation | WhAEM2000 | HYBRID | MODFLOW-MODPATH |
|---|---|---|---|---|---|---|
| Nahariya Site (Level-B: 100 days) | ||||||
| Nahariya well | S (km2) | 0.14 | 0.29 | 0.097 | 0.14 | 0.073 |
| (%) | 43.1 | 25.0 | 58.6 | 51.7 | Reference | |
| Rehovot Site (Level-B: 400 days) | ||||||
| Well 1 | S (km2) | 0.49 | - | 0.05 | 0.51 | 0.09 |
| (%) | 18.4 | - | 43.3 | 17.7 | Reference | |
| Well 2 | S (km2) | 0.35 | - | 0.02 | 0.33 | 0.06 |
| (%) | 17.1 | - | 33.3 | 18.2 | Reference | |
| Well 3 | S (km2) | 0.27 | - | 0.02 | 0.25 | 0.07 |
| (%) | 25.9 | - | 28.6 | 28.00 | Reference | |
| Well 4 | S (km2) | 0.18 | - | 0.02 | 0.18 | 0.05 |
| (%) | 27.8 | - | 40.0 | 27.8 | Reference | |
| Well 5 | S (km2) | 0.15 | - | 0.02 | 0.15 | 0.05 |
| (%) | 33.3 | - | 16.7 | 33.3 | Reference | |
| Well 6 | S (km2) | 0.42 | - | 0.04 | 0.41 | 0.13 |
| (%) | 31.0 | - | 30.8 | 31.7 | Reference | |
| Well 7 | S (km2) | 0.07 | - | 0.02 | 0.06 | 0.05 |
| (%) | 51.2 | - | 40.0 | 33.3 | Reference | |
| Well 8 | S (km2) | 0.17 | - | 0.02 | 0.15 | 0.05 |
| (%) | 29.4 | - | 40.0 | 33.3 | Reference | |
| Average | S (km2) | - | - | - | - | - |
| (%) | 28.8 | - | 34.1 | 27.03 | Reference | |
| Sum | S (km2) | 2.00 | - | 0.21 | 1.91 | 0.55 |
| (%) | - | - | - | - | - | |
Note: since the uniform flow equation method was not used in the Rehovot site, surface area of each well was not calculated by this method. Neither the average surface area (S) nor the comparative index values can be calculated to represent the whole Rehovot multi-well site.
Table 6.
Level-C protection areas and comparison index of different delineation methods at the Nahariya and Rehovot pumping sites.
Table 6.
Level-C protection areas and comparison index of different delineation methods at the Nahariya and Rehovot pumping sites.
| Pumping Sites | Surface Area (S) | CFR | Uniform Flow Equation | WhAEM2000 | HYBRID | MODFLOW-MODPATH | |
|---|---|---|---|---|---|---|---|
| Nahariya Site (Level-B: 100 days) | |||||||
| Nahariya well | S (km2) | 0.56 | 0.75 | 0.37 | 0.55 | 0.29 | |
| (%) | 25.1 | 38.6 | 54.3 | 53.2 | Reference | ||
| Rehovot Site (Level-B: 400 days) | |||||||
| Entire wellfield | S (km2) | 14.38 | - | 2.62 | 16.04 | 5.66 | |
| (%) | 30.2 | - | 40.6 | 35.3 | Reference | ||
Note: value of the entire Rehovot wellfield shown in this table was the average value of eight pumping wells in the site.
© 2019 by the authors. Licensee MDPI, Basel, Switzerland. This article is an open access article distributed under the terms and conditions of the Creative Commons Attribution (CC BY) license (http://creativecommons.org/licenses/by/4.0/).
Share and Cite
MDPI and ACS Style
Liu, Y.; Weisbrod, N.; Yakirevich, A. Comparative Study of Methods for Delineating the Wellhead Protection Area in an Unconfined Coastal Aquifer. Water 2019, 11, 1168. https://doi.org/10.3390/w11061168
AMA Style
Liu Y, Weisbrod N, Yakirevich A. Comparative Study of Methods for Delineating the Wellhead Protection Area in an Unconfined Coastal Aquifer. Water. 2019; 11(6):1168. https://doi.org/10.3390/w11061168
Chicago/Turabian StyleLiu, Yue, Noam Weisbrod, and Alexander Yakirevich. 2019. "Comparative Study of Methods for Delineating the Wellhead Protection Area in an Unconfined Coastal Aquifer" Water 11, no. 6: 1168. https://doi.org/10.3390/w11061168
Note that from the first issue of 2016, this journal uses article numbers instead of page numbers. See further details here.