Species-Specific Responses of Submerged Macrophytes to Simulated Extreme Precipitation: A Mesocosm Study


1
Key Laboratory of Aquatic Botany and Watershed Ecology, Wuhan Botanical Garden, Chinese Academy of Sciences, Wuhan 430074, China
2
University of Chinese Academy of Sciences, Beijing 100049, China
3
Sino-Danish Centre for Education and Research (SDC), Beijing 100049, China
4
Lake Ecology Section, Department of Bioscience, Aarhus University, 8600 Silkeborg, Denmark
5
Hubei Key Laboratory of Wetland Evolution & Ecological Restoration, Wuhan Botanical Garden, Chinese Academy of Sciences, Wuhan 430074, China
*
Author to whom correspondence should be addressed.
Water 2019, 11(6), 1160; https://doi.org/10.3390/w11061160
Submission received: 9 April 2019
/
Revised: 29 May 2019
/
Accepted: 30 May 2019
/
Published: 2 June 2019
(This article belongs to the Special Issue Effect of Extreme Climate Events on Lake Ecosystems)
Abstract
:More frequent extreme climate events (e.g., extreme precipitation) are to be expected in the future, and such events may potentially have significant effects on freshwater ecosystems. In the present mesocosm study, the effects of simulated extreme precipitation on submerged macrophytes were evaluated for three different macrophyte community (MC) treatments (MC1, MC2 and MC3). MC1 consisted of only Vallisneria denseserrulata, while MC2 and MC3 included three and six species of various growth forms. Two treatments of extreme precipitation (EP) were simulated—an extreme treatment (E) simulating a sudden increase of water level from 75 cm to 150 cm within one day and a gradual treatment (G) simulating an increase to the same water level within 3 months, combined with two control treatments. Total macrophyte community biomass was resilient to the EP and MC treatments, while species-specific variations in responses, in terms of biomass, maximum height, and sexual reproduction, were found. For instance, E led to earlier flowering of Potamogeton lucens and production of more flowers, while it had adverse effects on the flowering of Ottelia alismoides. We conclude that freshwater ecosystems with high coverage of submerged macrophytes may be overall resilient to extreme precipitation under nutrient-limited conditions, especially communities with diverse growth forms.
1. Introduction
The Intergovernmental Panel on Climate Change predicts more frequent extreme precipitation events in the future with potential strong influence on freshwater ecosystems [1,2]. The effects of extreme precipitation in shallow lakes may both lead to a sudden increase of water levels and an additional input of nutrient. Studies focusing on either extreme precipitation or nutrient pulses have revealed that a sudden water level increase after extreme rainfall significantly influences primary producers in freshwater ecosystems [3,4,5] and that pulse loading of nitrogen can induce marked changes in macrophyte and phytoplankton communities [6]. So far, studies on the combined effects of extreme rainfall-mediated increases in water level and nutrient pulses are scarce. A recent study reported that water level increase combined with a nutrient pulse had no negative effect on the growth of Vallisneria denseserrulata, while a water level increase without extra nutrient loading had, suggesting that nutrients somehow counteracted the effect of the water level increase [7].
Submerged macrophytes are dominant primary producer in shallow clear lakes and they play an important structuring role for the community structure and ecosystem function [8]. For example, macrophytes compete with phytoplankton for light and nutrients [9], and they create and maintain a clear water state [10], but their ecological effect in shallow lakes may differ among growth forms [11,12,13,14]. It has been hypothesised that the clear-water state dominated by charophytes differs from the clear-water state dominated by angiosperms as bottom-up mechanisms (i.e., food webs controlled by nutrient availability and primary producers) characterise the charophyte-dominated state, while top-down mechanisms (i.e., food webs controlled by predators) are more important in an angiosperm-dominated state [13]. However, the effects of angiosperms on contrasting growth forms may also differ. Angiosperm species may be categorised into slow-growing and canopy-forming types [7,12,14,15]; slow-growing angiosperms increase slowly in height and allocate most of their biomass near the lake bottom, while the canopy-forming types distribute large proportions of their biomass near the surface. Vallisneria spp. are considered as a typical slow-growing species, while Potamogeton lucens (P. lucens) is a typical canopy-forming species, and other species are found between these two extremes. Macrophyte communities with diverse growth forms may affect light attenuation in the water column differentially, with implications for the communities of periphyton and macroinvertebrates and, in consequence, the growth of macrophyte species in the entire community [12,16,17]. Moreover, many macrophyte species, like P. lucens and Ottelia alismoides (O. alismoides), which both have broad leaves and a strong affinity for bicarbonate usage, typically have different pH levels on the upper and lower leaf side depending on light conditions (polarised leaves, e.g., [18,19]). This effect, which is strongly driven by photosynthesis [20], induces depletion of free CO2 near the adaxial side of the phyllosphere. Similarly, charophytes are experts in bicarbonate usage and during photosynthesis, one long cell of the thalli is segmented into several adjacent alkaline and acid zones (so-called multi-polarisation), which also affects the pH and alkalinity in the nearby area [21,22]. This could potentially induce carbon limitation of periphyton growth and of nearby submerged macrophytes [23], especially for the species that mainly use free CO2 as their carbon supply (e.g., Cabomba caroliniana according to [24]).
Observed difference in responses of submerged macrophytes to extreme events such as extreme heat waves [25,26,27] may in part reflect differences in growth form. Also, the effects of extreme water level changes may depend on growth forms [14,25,26]. The Otteliid species O. alismoides, for example showed no significant changes in total biomass and root biomass between static and fluctuating water level simulations [28], while Myriophyllym spicatum demonstrated stronger morphological responses (e.g., longer shoots, more branches) and reduced biomass compared with e.g., Hydrilla verticillata at water level fluctuations of 60 cm or larger [29]. In contrast, among the slow-growing types, Vallisneria spp. can adapt to increasing water levels through photosynthetic adjustment [30], and it thus does not exhibit significant shoot elongation when exposed to high water levels and low light availability [31].
Here, we aim to investigate whether the responses of submerged macrophytes to simulated extreme precipitation were species-specific and related to growth form under phosphorus-limited conditions, considering simultaneously two aspects of extreme precipitation (water level increase and nutrient pulse). We hypothesised that (1) due to many positive feedbacks from macrophyte communities (e.g., uptake of excessive nutrients and competition for light with phytoplankton [8,32]), the clear-water state dominated by submerged macrophytes would be resilient to an extreme precipitation event (high nutrient input and a sudden water level increase); (2) macrophyte species specific responses would vary with the growth form combination of the entire macrophyte community as the canopy-forming types compete better for light than the slow-growing types.
2. Materials and Methods
2.1. Experimental Materials
The submerged macrophytes used in the experiment grew naturally in small clear-water ponds in Wuhan Botanical Garden (114.43° E, 30.54° N). The slow-growing Vallisneria denseserrulata (V. denseserrulata) is a perennial submerged species that maintains its aboveground biomass in winter. The species is mainly found in Central-Southern China. It is capable of using bicarbonate but does not form polarised leaves. Likewise, Chara sp. is a typical slow-growing species, showing multi-polarisation in its thalli. The two species differed in plant height, Chara sp. being much shorter (approximately 30 cm) than V. denseserrulata (approximately 50~70 cm) in the same ponds.
Potamogeton lucens and Ottelia alismoides are two typical canopy-forming species, which both are bicarbonate users. P. lucens is a common species in clear-water lakes in the mid-low reaches of Yangtze River and in Yunnan Province, China, while O. alismoides, which used to be widely distributed, is no longer a commonly-found species in recent field surveys [7].
Hydrilla verticillata (H. verticillata) and Cabomba caroliniana (C. caroliniana) distribute their biomass more or less evenly in the water column and represent a growth type in-between the two slow-growing and canopy-forming extremes. H. verticillata is a bicarbonate user with polarised leaves during photosynthesis, while C. caroliniana only uses free CO2 as carbon supply and is an invasive species in China [24].
2.2. Experimental Design
Three contrasting communities of submerged macrophytes were established in the macrophyte community (MC) treatment, and four different scenarios of extreme precipitation (EP) were simulated. In total, 36 concrete mesocosms (four EP treatments and three MC treatments, each treatment with three replicates, each mesocosm with nine pots), 1 m long, 1 m wide and 1.5 m deep, including a total of 324 pots, were used in the experiment.
To mimic the species composition of macrophyte communities in natural lakes, three different macrophyte communities composed of macrophytes of various growth forms were established (hereafter termed MC1, MC2 and MC3). MC1 consisted only of V. denseserrulata (Vd). In this treatment, nine pots (27 cm top diameter × 22 cm bottom diameter × 14 cm height) were placed in one mesocosm, each pot holding two individuals with an initial fresh weight of 1.5 g. MC2 included three species: Vd, P. lucens (Pl) and H. verticillata (Hv). Three pots of each species, four Hv, three Pl and two Vd with equal initial fresh weights (1.5 g) in each pot, were placed randomly in one mesocosm. Besides the three species of MC2, MC3 contained C. caroliniana, Chara sp. and O. alismoides, and three individuals of C. caroliniana and O. alismoides as well as a small clump of Chara sp. The former three species were represented by two pots for each species and the latter three by one pot for each species. In total, nine pots, each with an initial fresh weight of 1.5 g were planted in each mesocosm, ensuring a similar initial biomass for all mesocosms.
During the one-month pre-cultivation period, the water level was set to 75 cm. The control (C) maintained the same water level throughout the experiment. An extreme treatment (E) simulated an extreme precipitation event with a sudden increase in water level to 150 cm within one day. A gradual treatment (G) simulated a gradual increase in water level to 150 cm within three months, 25 cm in a day but adjusted monthly. Tap water (total nitrogen (TN): 2.2 ± 0.5 (standard deviation (SD) here and elsewhere) mg L−1, total phosphorus (TP) 45 ± 12 μg L−1) was used to simulate extreme precipitation, and the increase in water level was obtained by adding tap water until the required level was reached. To separate the effects of nutrient input from those of the sudden water level increase, an extra treatment with a 75 cm stable water level but extra nutrient loading (C_N) was designed. Apart from C, the other three treatments received the same loading of nitrogen and phosphorus in the form of chemicals (KNO3 and KH2PO4).
By adding lake water from Donghu Lake, the water levels were initially kept stable at 75 cm, and nine pots of submerged macrophytes (community composition arranged according to the experiment design defined above) were placed in each mesocosm and pre-cultivated for one month from 13 July 2015. Two approximately 3 cm-long male Gobiocypris rarus, an endemic Chinese planktivore feeding on zooplankton, were released in each mesocosm. Moreover, five approximately 1 cm-long Radix swinhoei were added and acted as the main macro-invertebrates in the system [33].
The experiment lasted from August 2015 to May 2016. On 19 August, a sudden increase in the water level to 150 cm was mimicked in the E treatment by adding tap water (pulse input of approximately 1600 mg N m−2 and 37.5 mg P m−2). The water level in the G treatment was increased by 25 cm on the same day, and the nutrient loadings of C_N and G were also maintained at levels similar to those in E by adding KNO3 and KH2PO4. The water level in G was increased by 25 cm monthly to 150 cm during the following two months, and a similar final nutrient loading as in C_N and E was achieved by the addition of chemicals (approximately 680 mg N m−2 and 13.7 mg P m−2). Tap water was added to maintain the water level in all the treatments afterwards, resulting only in negligible nutrient input [6,34]. Details on the experiment design are given in Figure S1 in the Supplementary Materials.
2.3. Sampling Schedule and Measurement of Plant Traits and Water Physico-Chemical Parameters
On 12 August, water samples for phytoplankton biomass and water chemistry measurements were taken before the EP treatment to record the initial conditions of phytoplankton chlorophyll a (Chla), total nitrogen (TN), nitrate (NO3-N) and total phosphorus (TP). From 19 August to 21 November, weekly water samples were taken to explore the detailed dynamics of the effects of EP in different macrophyte communities. From 6 December to 7 May the next year, water samples were taken biweekly for determination of water chemistry variables and phytoplankton biomass. The water samples were taken in different layers of the water column with a 1 L plastic tube sampler and were thoroughly mixed before analysis, thus representing the entire water column. Water samples of 1 L for phytoplankton Chla analysis were filtered on a GF/C filter (Whatman, Maidstone, UK) following ethanol extraction, and the filtered water was used for NO3-N determination according to the phenol disulphonic acid method [35]. Water samples for TN and TP analysis were unfiltered and determined using the spectrophotometric methods after digestion with K2S2O8 solution [35].
Dissolved oxygen (DO), temperature (T), light attenuation coefficient (Kd), pH and alkalinity were determined monthly. DO and T were measured using a ProODO Optical Dissolved Oxygen Instrument (YSI, Ohio, USA) at 30 cm depth at the same time of the day (2 p.m. to 4 p.m.). Kd was calculated using the light attenuation at 30 cm below the surface applying the formula in [36] based on the measurements of a Li-192 underwater quantum sensor and data-logger Li-1400 (LI-COR, Nebraska, USA). Water samples of 250 ml were collected and sealed in blue cap bottles for pH and alkalinity analysis, and alkalinity was determined by titration using 0.1 mmol L−1 HCl within four hours after sample collection. Theoretical daylight length (DL) was estimated for each month based on the geographical location of the experiment sites. The data of T and DL are provided as background information on environmental conditions in Figure S2 in the Supplementary Materials.
Flower numbers were observed and recorded for V. denseserrulata, P. lucens and H. verticillata during the flowering season (from September to November).
At the end of the experiment, all the macrophytes in the pots, both above and below ground, were harvested and cleansed in tap water. Maximum plant height and biomass were recorded. For V. denseserrulata and P. lucens, the second mature leaf of a randomly-chosen individual was used for determination of epiphyton biomass. The leaf was carefully sampled, placed into a sealed plastic bag and stored in a cooling box. In the laboratory, tap water was added to the sealed plastic bag, and after thorough shaking for 1 min the washed-off water was filtered on GF/C filters for determination of the chlorophyll a content [37]. All remaining leaves were carefully cleaned and, together with the first leaf, divided into three groups indicating different extents of damage: intact (no holes or damages at the leaf edge), minor damage (≤3 holes or leaf edge damages) and major damage (>3 holes or leaf edge damages). Snail biomass and abundance were recorded by using a 500 μm invertebrate net to collect all the snails in each mesocosm before and after draining the mesocosm; in total, over 1000 snail individuals were sampled. Filamentous algae were collected by a 20 cm scraper to remove all the filamentous algae on the 20 cm wide strap at the centre of the walls (the same position for all mesocosms) from the bottom to the surface; the scraping was carefully undertaken after draining the mesocosm to minimise sampling loss. Filamentous algae biomass was determined after drying the algae at 80 °C for 48 h followed by weighing.
2.4. Statistical Analysis
For the data obtained on 12 August, two-way ANOVA was used to assess background conditions before the extreme precipitation using MC and EP as the two main factors. Since the sampling interval shifted from one to two weeks during the course of the experiment, a linear mixed model was considered proper to handle the dataset [38]. For the water physico-chemical variables recorded during the experiment, linear mixed models (LMMs) were used to identify the effects of the MC and EP treatments on each parameter. In the model, MC and EP were set as fixed factors, and sampling time and tank id were used as random factors based on the function ‘lmer’ in package ‘lmerTest’. Residual plots were used to check for normality and homogeneity of variance by visual inspection. Post-hoc Tukey tests were conducted using the package ‘multicomp’. For the data on plant traits, snail biomass, filamentous algae and epiphyton biomass recorded at the end of experiment, two-way ANOVA was applied to explore the effects of the MC and EP treatments. For correlation analyses between snail biomass (or abundance) and periphyton biomass (or submerged macrophyte leaf intactness) we used the function ‘chart.Correlation’ in package ‘PerformanceAnalytics’. Data were log transformed to satisfy the assumption of normality and homogeneity of variance, if needed. All statistical analyses were performed using R 3.5.3 (R Foundation for Statistical Computing, Vienna, Austria).
3. Results
3.1. Water Physico-Chemical Parameters
Prior to the EP treatment (on 12 August), TN, NO3-N, TP, phytoplankton Chla, alkalinity, pH, Kd and DO did not differ among the three MC or four EP treatments after one month of pre-cultivation in July, excepting pH that was 8.20 ± 0.13 in MC1, which was slightly higher than in MC2 (8.04 ± 0.12) and MC3 (8.08 ± 0.15) (for pH between MC, F = 3.87, p < 0.05).
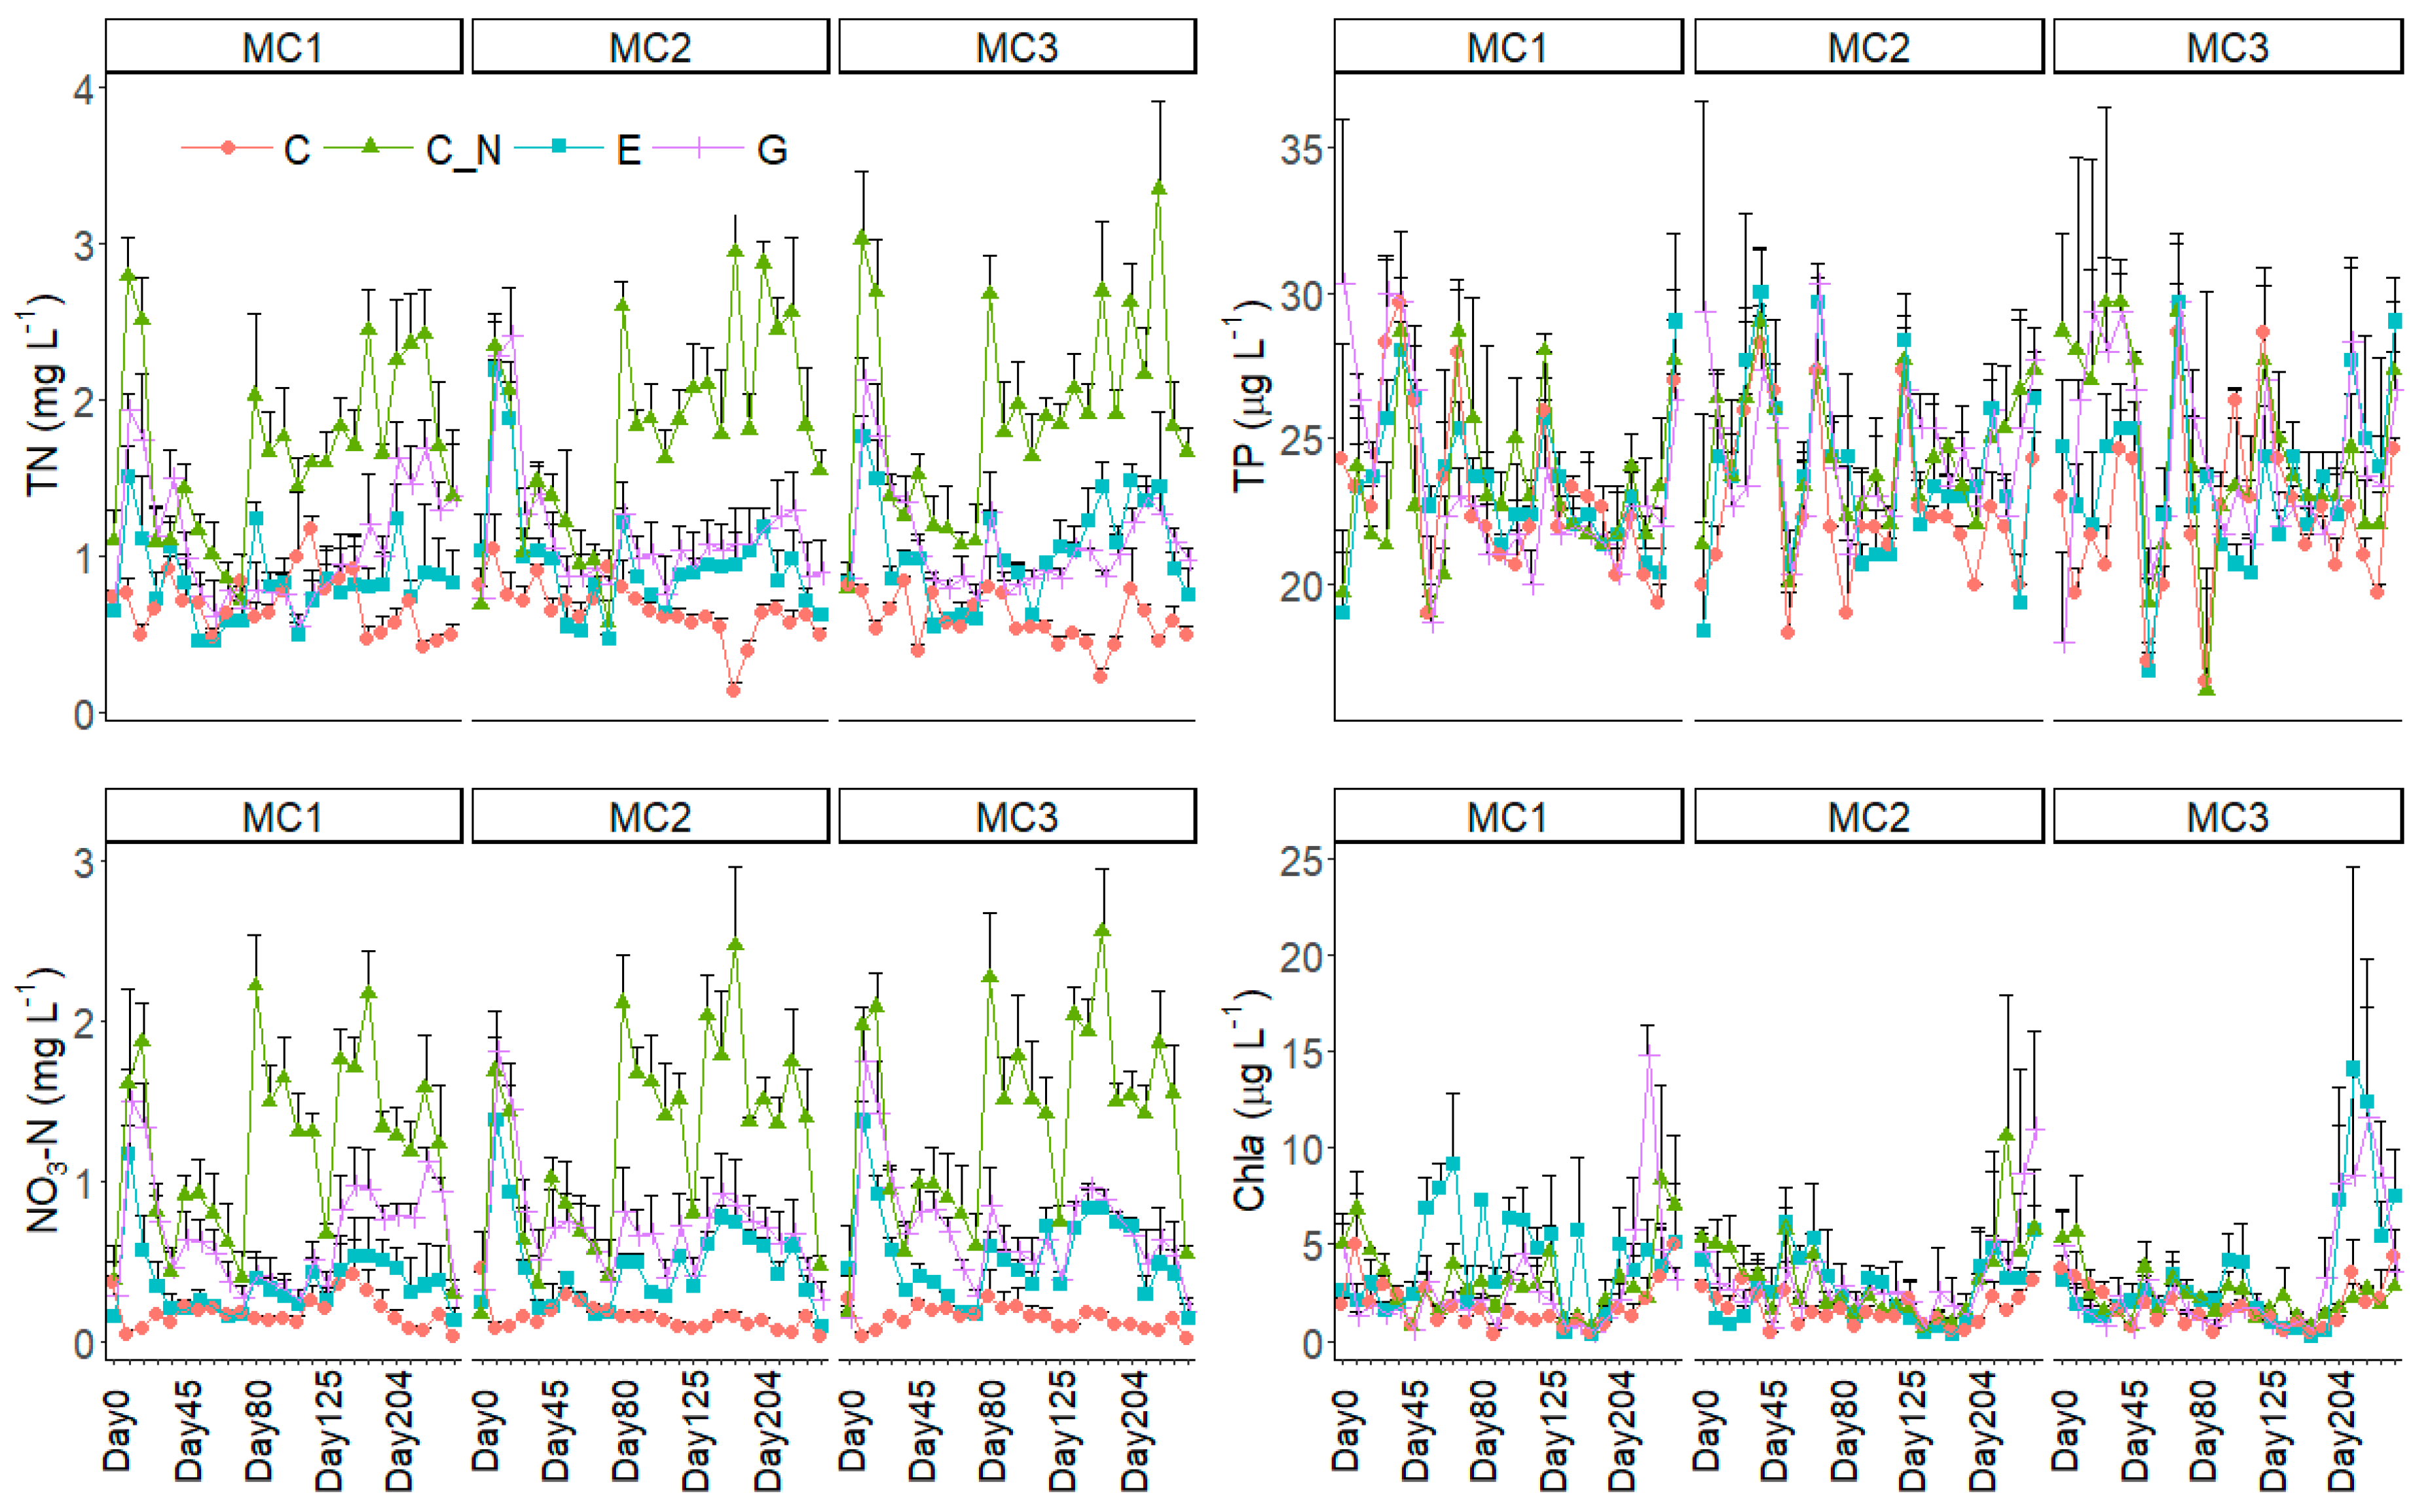
TP generally ranged within 20~25 μg L−1 except on the first sampling event after the simulated extreme precipitation, where it was higher in C_N and G than in C (Table 1, Figure 1). TN and NO3-N did not differ among the three macrophyte community treatments, but for the four EP treatments, TN and NO3-N were highest in C_N, being 1.77 ± 0.72 mg L−1 and 1.27 ± 0.68 mg L−1, respectively, and lowest in C, being 0.64 ± 0.23 mg L−1 and 0.16 ± 0.13 mg L−1, respectively.
Phytoplankton Chla fluctuated during the experiment and did not differ among the four treatments in the post-hoc test (Table 1, Figure 1). After dividing the dataset into three subsets consisting of each MC treatment, LMM revealed that phytoplankton Chla was lower in C than in E in subset MC1 (F = 4.18, p < 0.05) but not in subset MC2 or MC3 (F < 1.08, p > 0.05 for both).
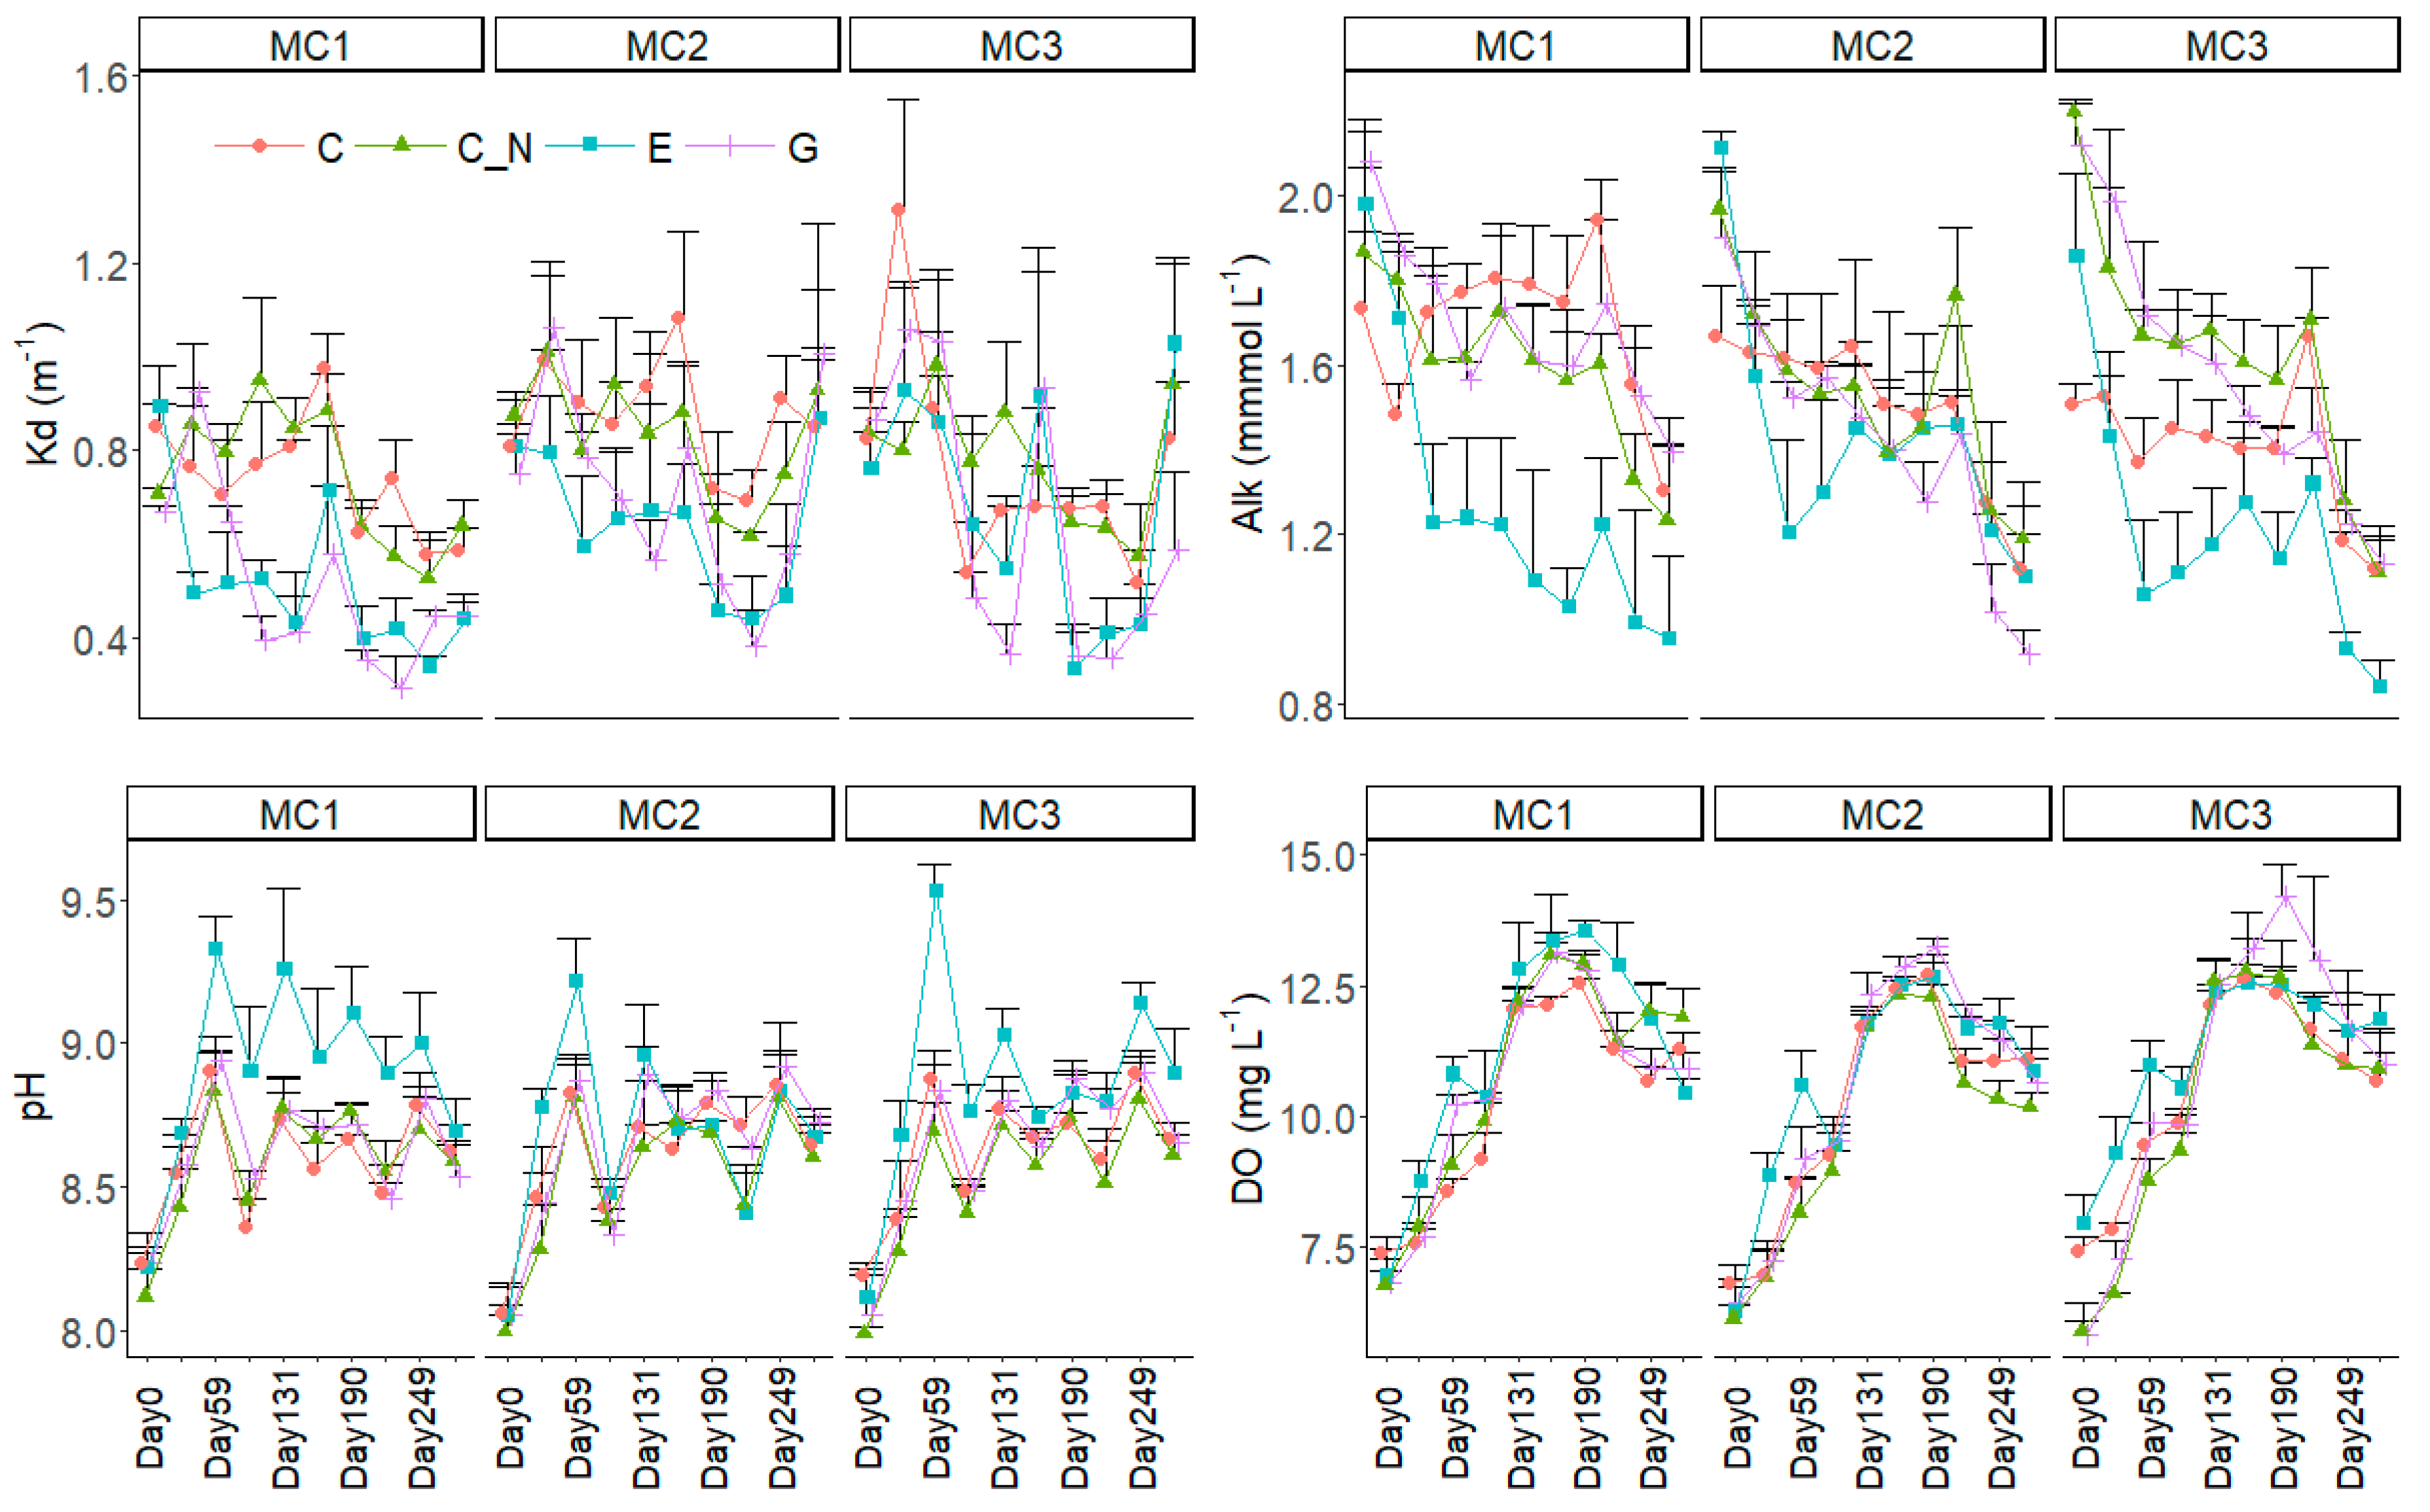
Kd was lowest in MC1 holding only V. denseserrulata and also lower in the two water level increase treatments (E and P) than in C and C_N (Table 1, Figure 2). Alkalinity was significantly lower, and pH was higher, in E than in the other three EP treatments, but DO was only significantly different (higher) in E than in C and C_N and did not differ from G. All three indicators, Kd, alkalinity and DO, did not differ among the three macrophyte communities.
3.2. Macrophyte Communities
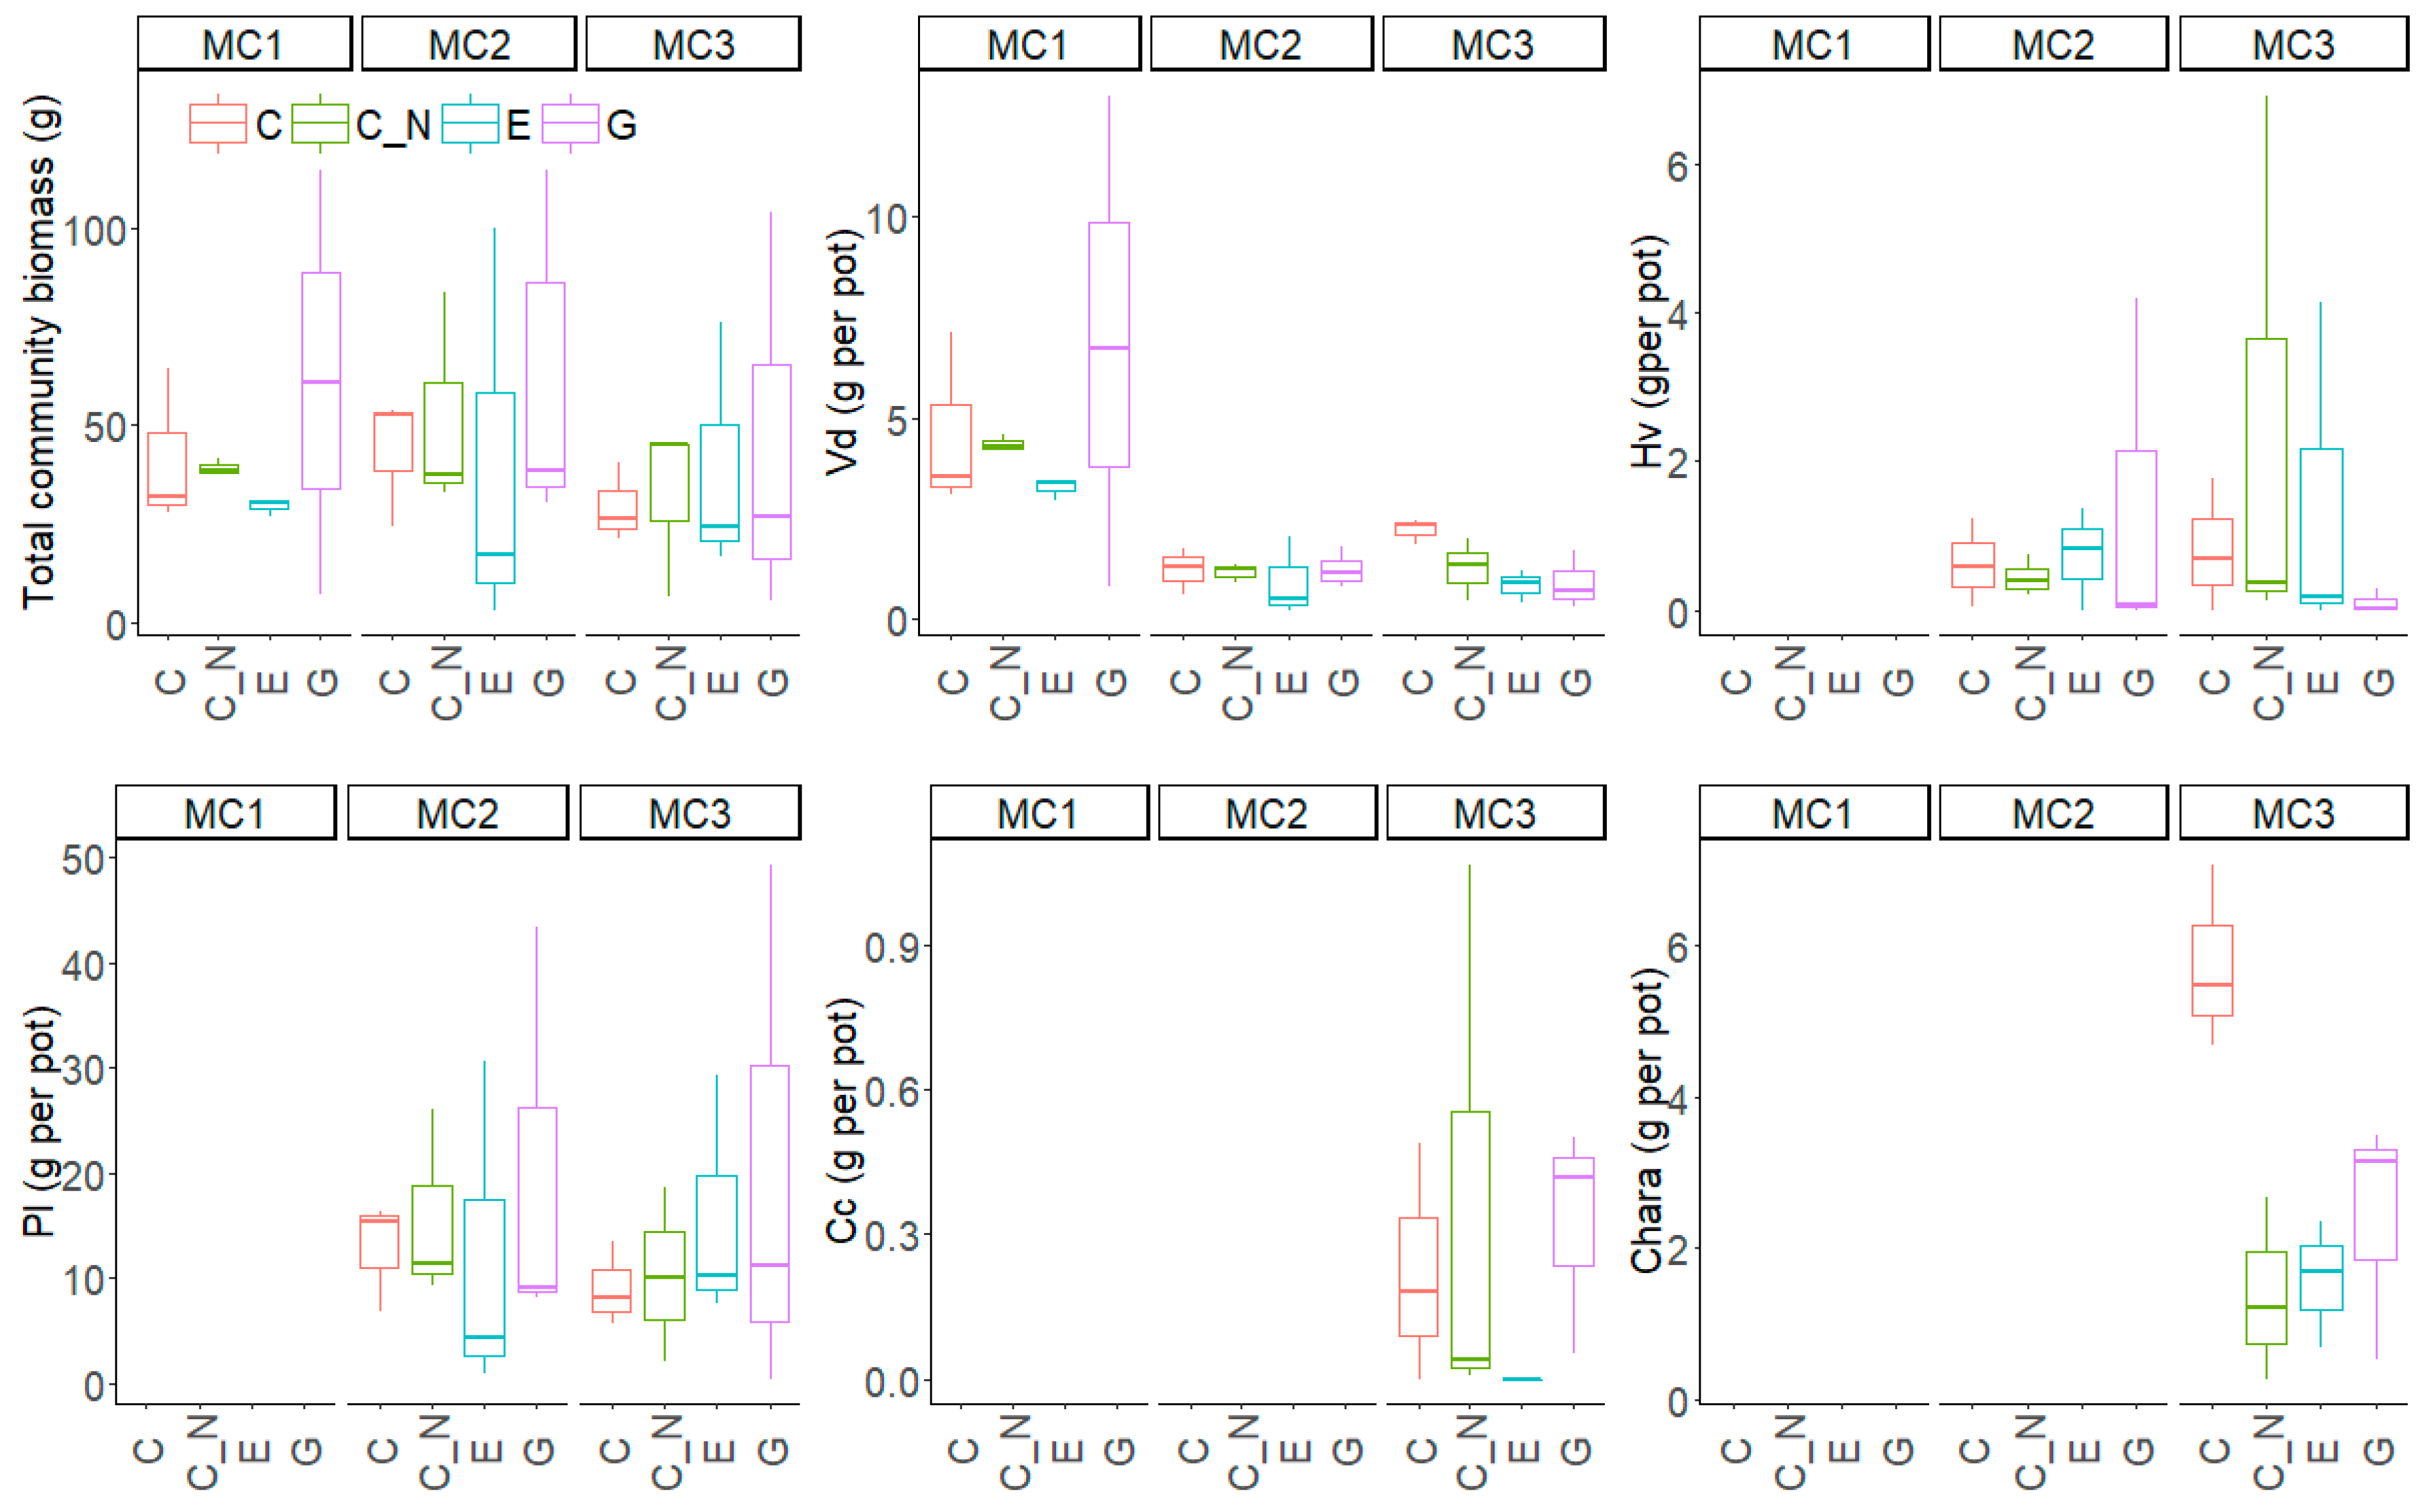
The total biomass of macrophytes did not differ between the three MC or the four EP treatments, but at the species level contrasting responses emerged (Table 2, Figure 3). The biomass (per pot) and maximum plant height of V. denseserrulata were significantly larger in MC1 than in the other two macrophyte communities (Figure S3). In contrast, P. lucens had larger maximum plant height in the two water level increase treatments (E and G) than in C_N, but the biomass of P. lucens did not respond significantly to the MC or EP treatments. For H. verticillata, total biomass and maximum plant height did not differ between MC2 and MC3 or among the EP treatments. In MC3, C. caroliniana had lowest biomass in E, while Chara sp. had the largest biomass and maximum plant height in C.
3.3. The Flowering Phase of V. denseserrulata, O. alismoides and P. lucens
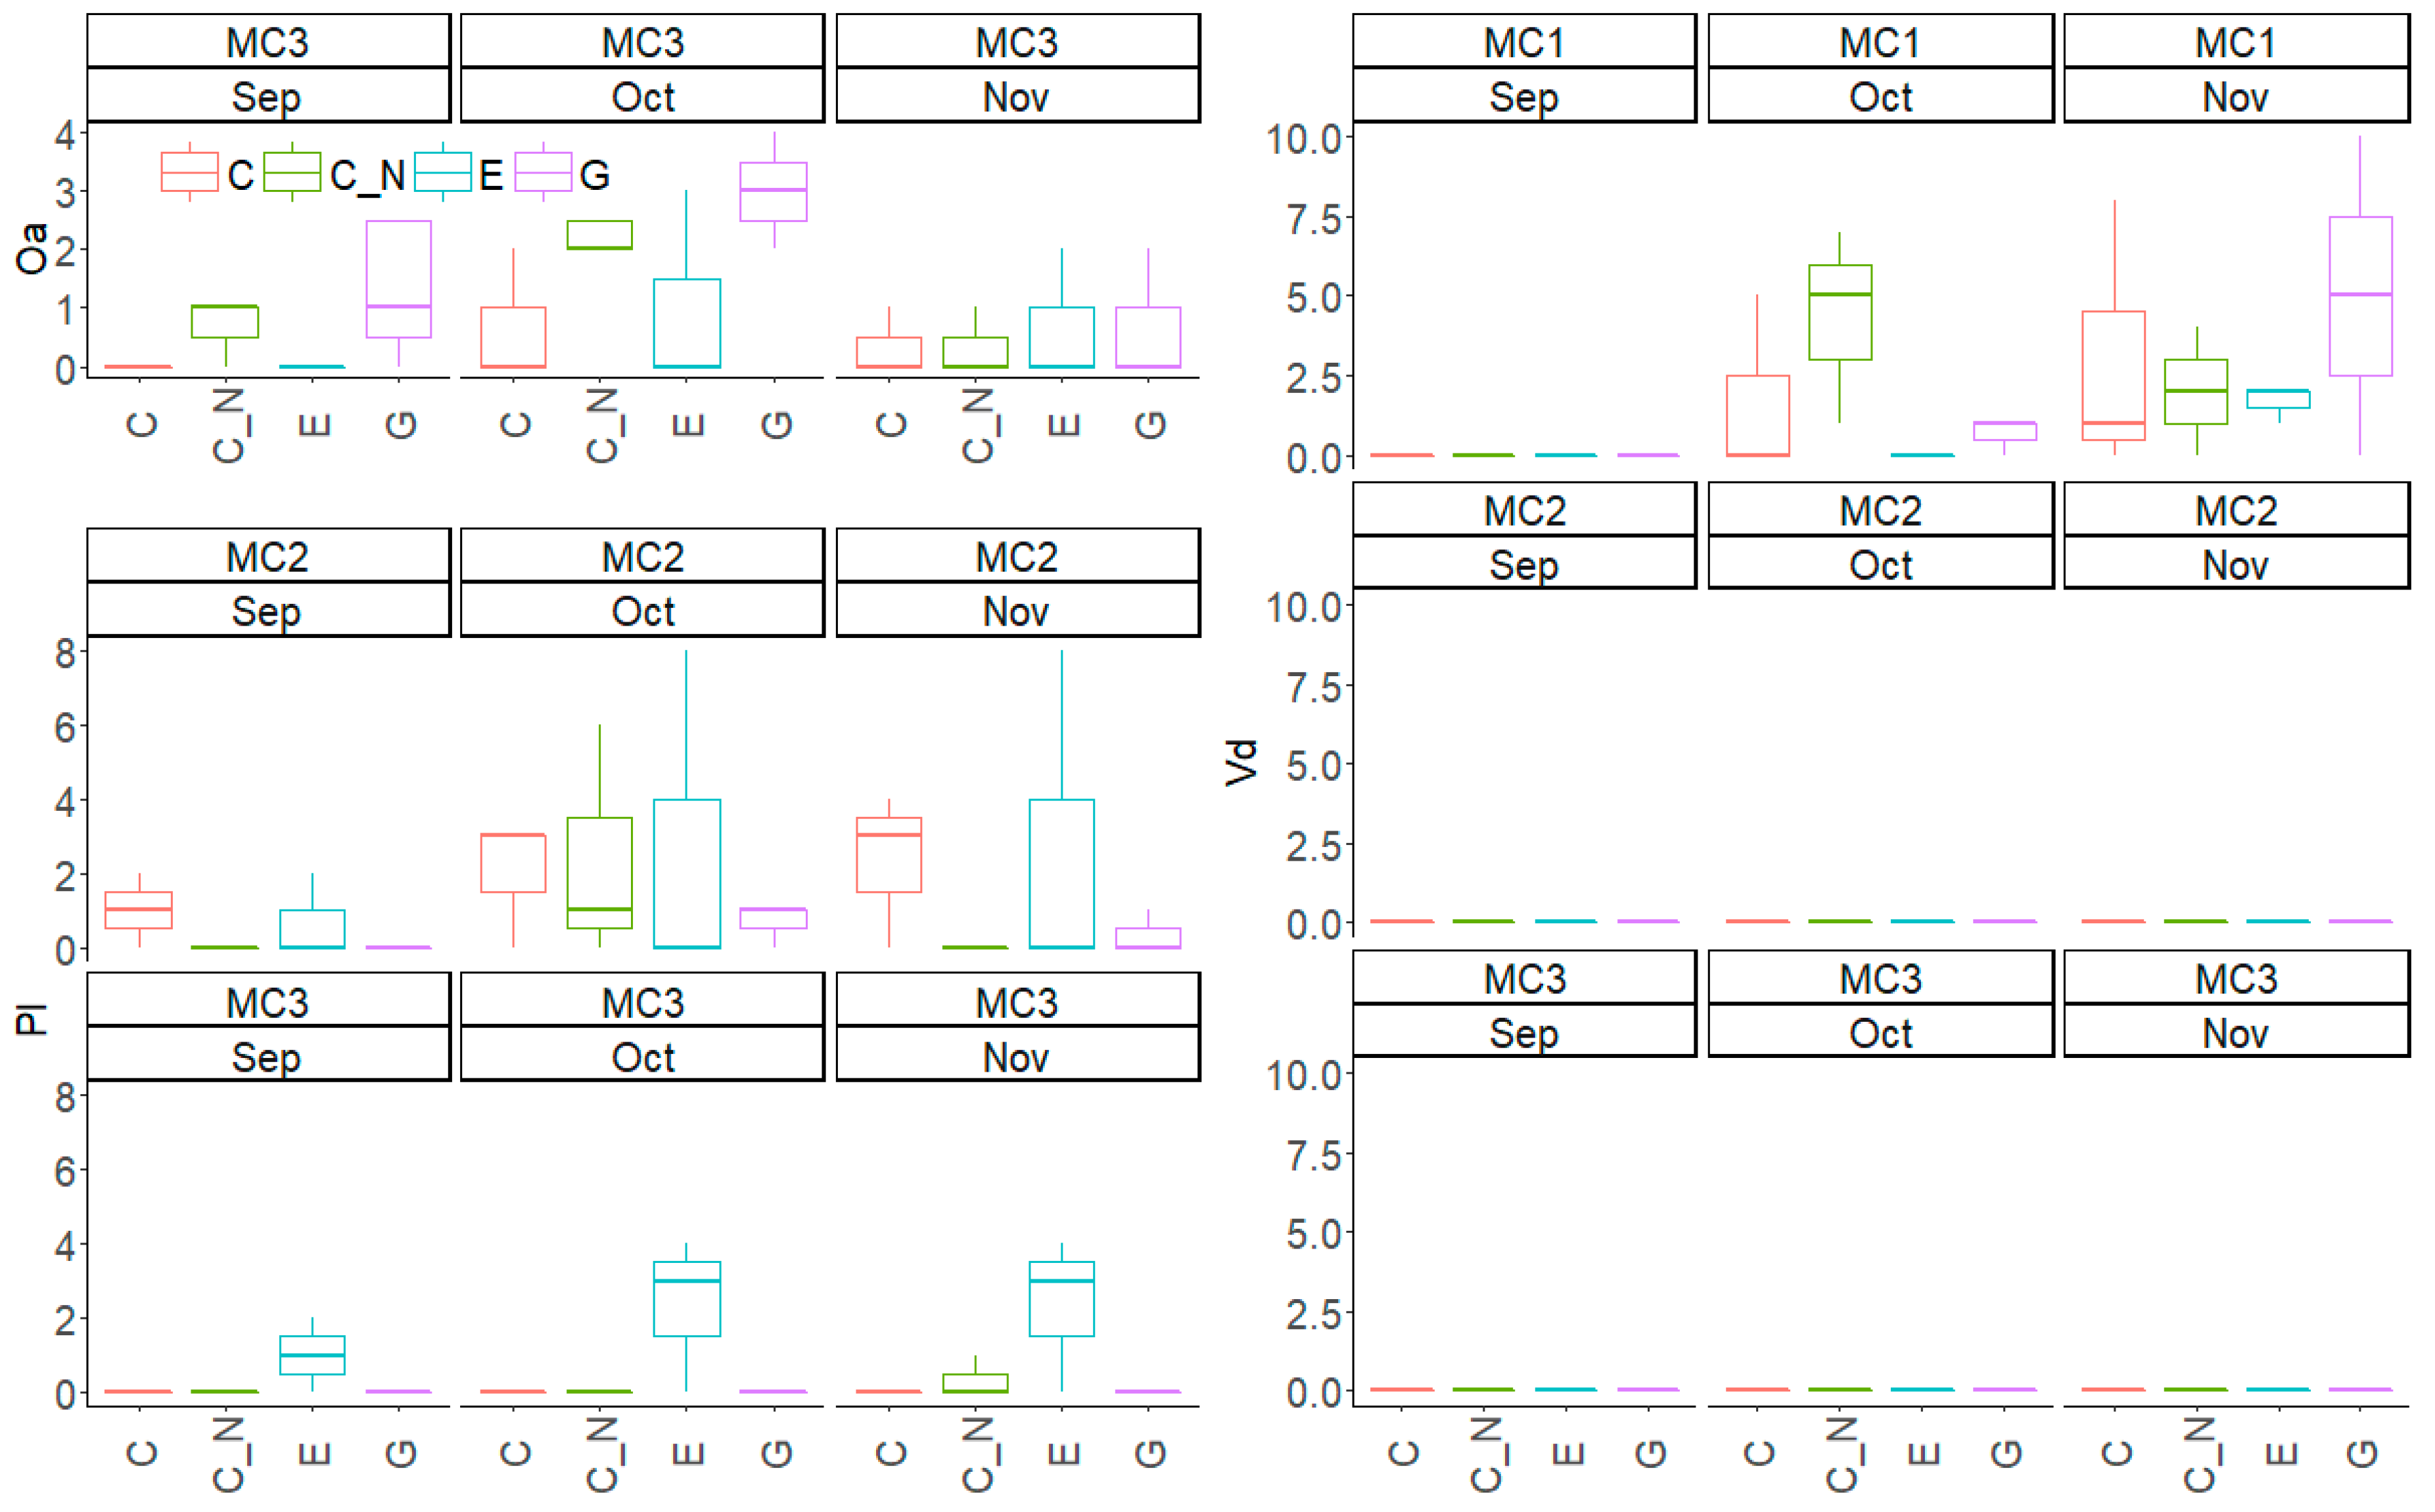
V. denseserrulata had the largest number of female flowers in both October and November (F > 6.92, p < 0.01 for MC; Figure 4), reaching 2.9 ± 3.3 per tank in November in MC1. The flowering number did not differ among the four EP treatments during the experiment (F < 2.42, p > 0.05). However, the species did not flower in MC2 and MC3 at any time during the experiment.
The flowering of O. alismoides in the C_N and G treatment occurred earlier in September than in the other two treatments. The flowering number per tank did not differ between the four EP treatments (F = 2.09, p > 0.05), which were 0.7 ± 1.2 (C), 2.3 ± 1.6 (C_N), 1.0 ± 1.7 (E) and 3.0 ± 1.0 (G), respectively.
In contrast to O. alismoides, P. lucens had no flowers in C_N and G but flowered in C and E in September. It displayed delayed flowering in MC3 and had no flowers in October except in the mesocosms exposed to an extreme water level increase in E. Though no significant differences were found between the MC or EP treatments in the individual months (F < 2.95, p > 0.05 for MC and EP), P. lucens tended to have more flowers in E.
3.4. Biomass of Snails, Filamentous Algae and Epiphyton and Intactness Status of Leaves for V. denseserrulata and P. lucens
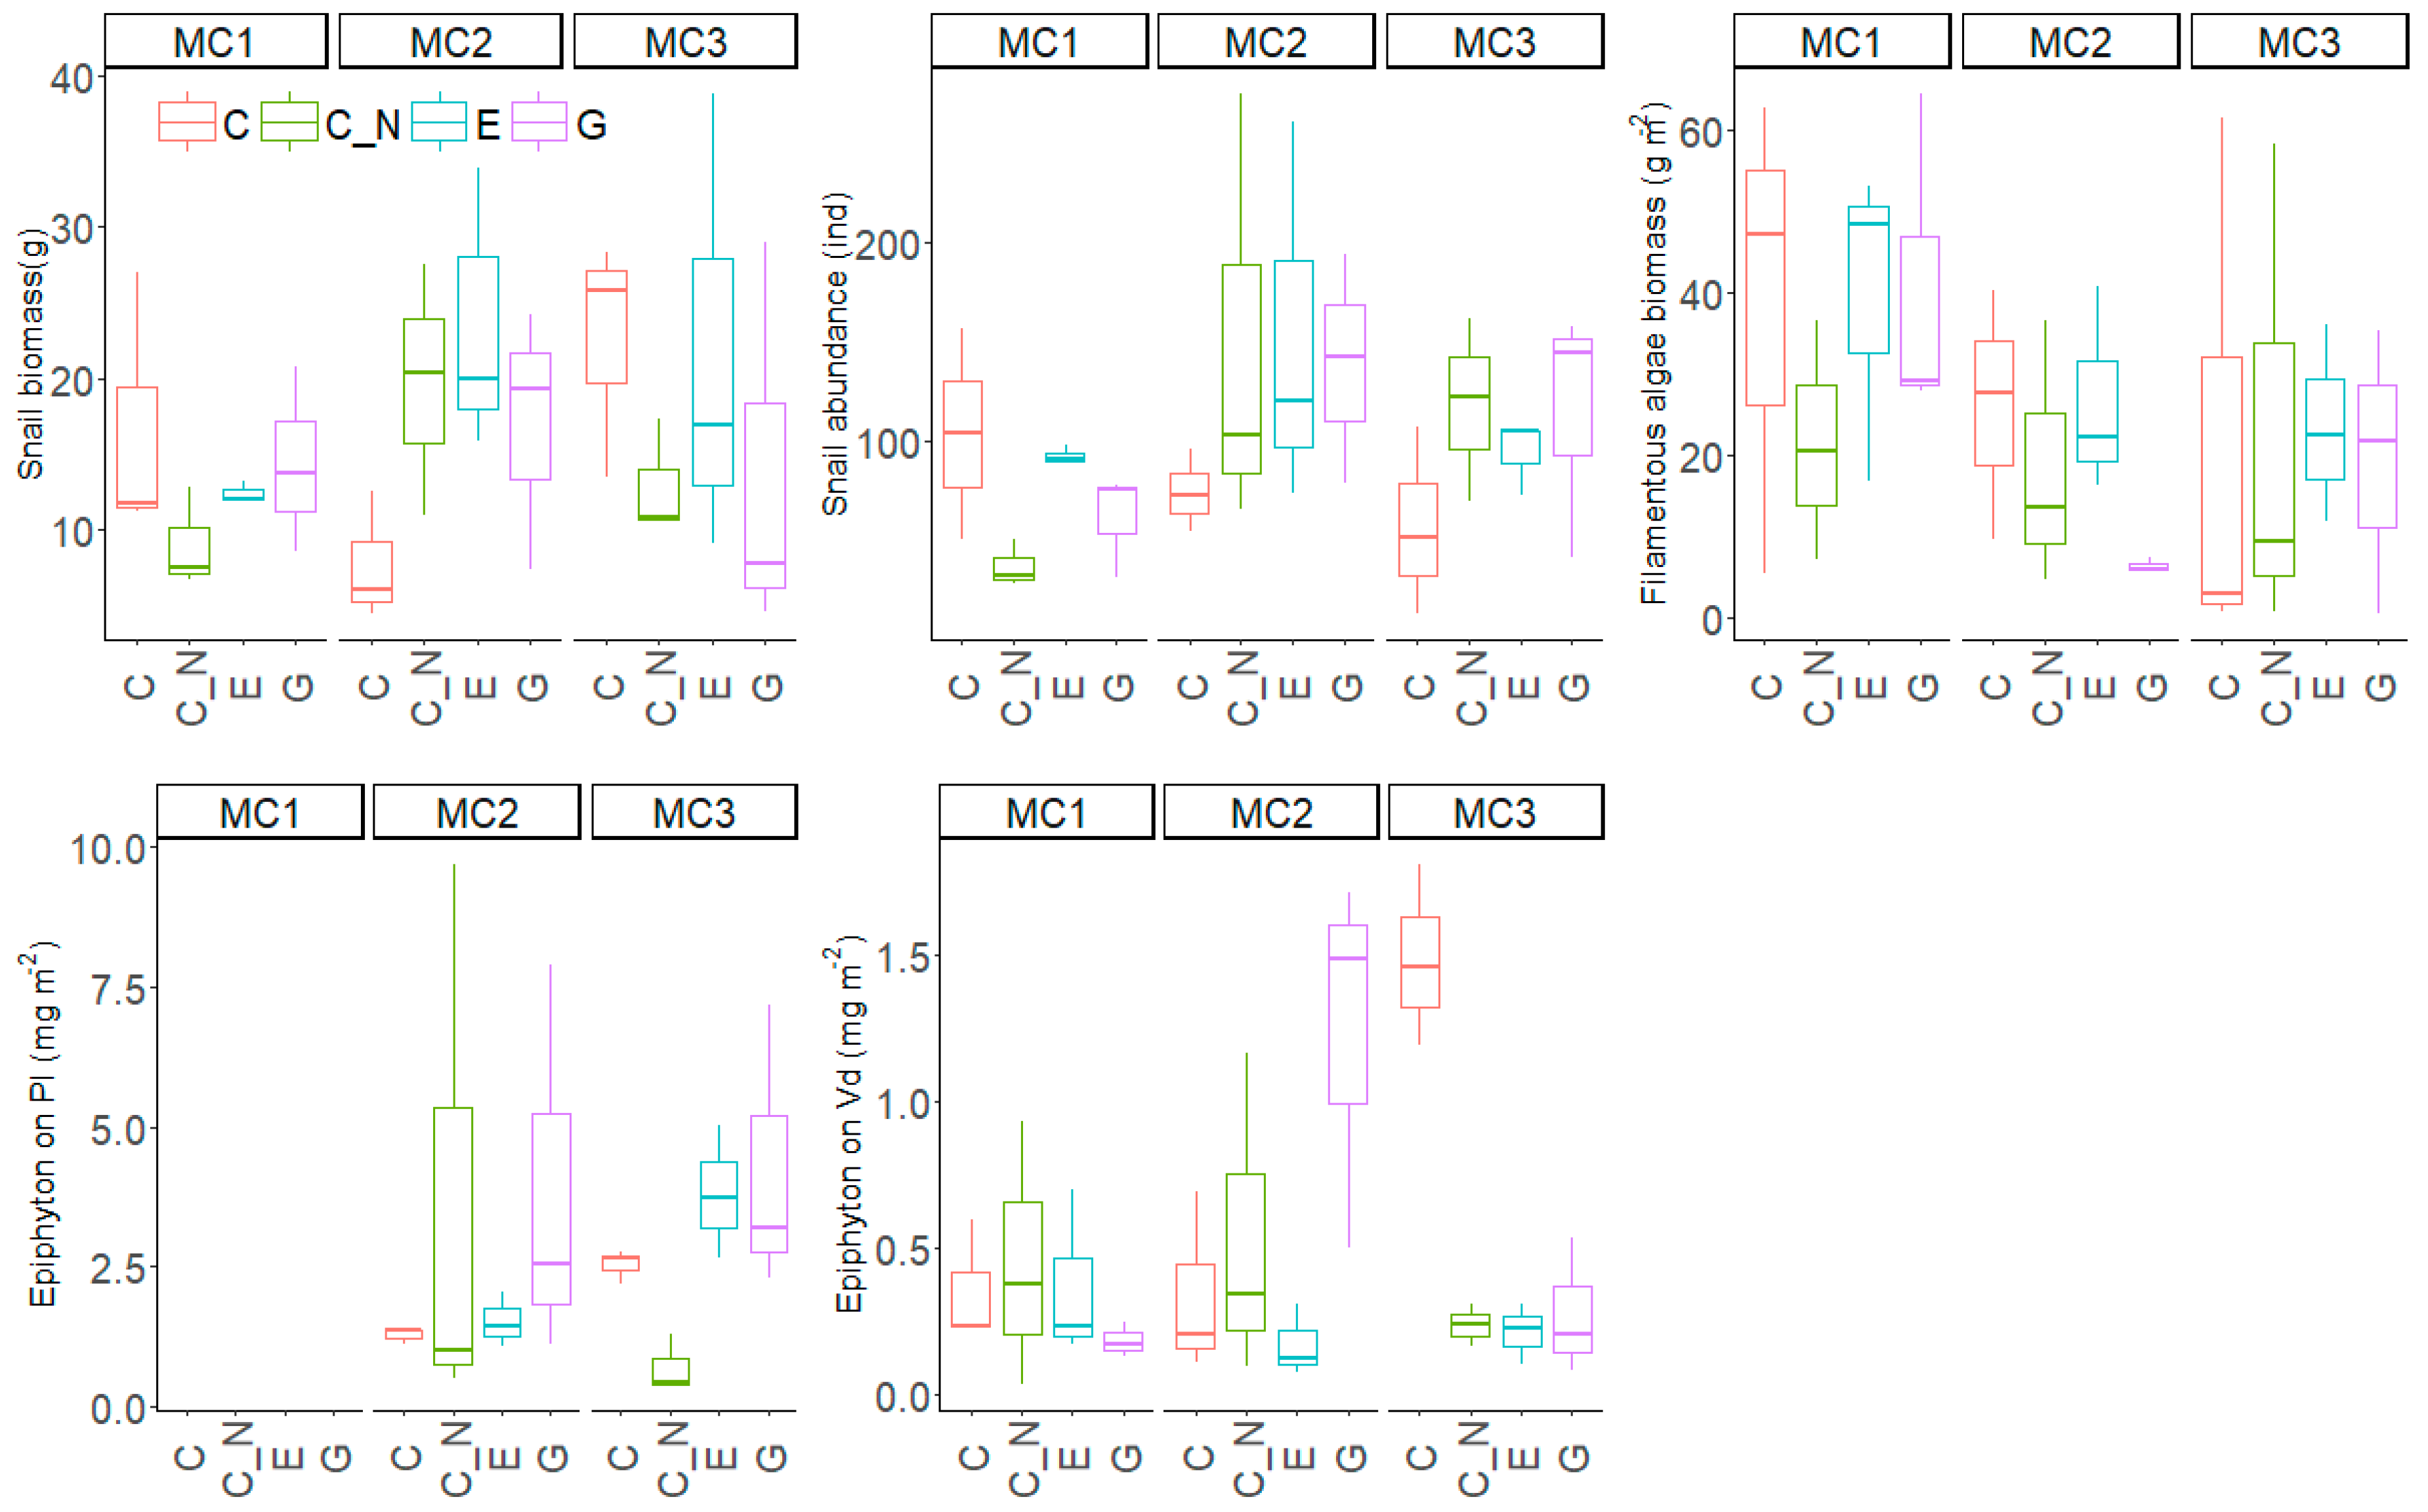
The biomass of filamentous algae on the concrete walls did not differ significantly among the treatments and averaged 25.3 ± 19.8 mg m−2 (Table 3, Figure 5). Snail biomass and abundance were similar and relatively large, averaging 15.9 ± 8.8 g m−2 and 99 ± 60 ind m−2, respectively, but showing no significant differences among treatments.
The epiphyton biomass on P. lucens was 2.7 ± 2.4 g m−2 and thus significantly higher than that on V. denseserrulata (0.57 ± 0.77 g m−2). The epiphyton biomass on P. lucens did not respond significantly to either the EP treatment, the MC treatment or their interaction, but the biomass on V. denseserrulata showed significant interaction between the EP and the MC treatment. After dividing the dataset into subsets for each MC treatment, epiphyton biomass on V. denseserrulata was significantly higher in C than in the other three EP treatments in MC1 (F = 14.71, p < 0.001), but no significant difference was found between the four EP treatments in either MC2 or MC3 (F < 3.01, p > 0.05). In addition, there was no significant correlation between snail biomass (or abundance) and the biomass of filamentous algae and epiphyton on the two submerged species (p > 0.05 for all correlation analyses).
The leaf intactness of the two species P. lucens and V. denseserrulata was evaluated based on division into three categories: intact, minor and major damages. The proportions of intact, minor or major damage of the total leaf numbers did not differ among the four EP treatments for either of the species (for all three types of leaf intactness, F < 2.52, p > 0.05). We also found that that the proportion of the intact V. denseserrulata leaves correlated negatively with snail abundance (p < 0.05; Figure S4), and the proportion of leaves with major damages positively with snail abundance (p < 0.05). A similar pattern was found for P. lucens (Figure S5). None of the proportions of the three categories of leaf intactness status correlated with snail biomass.
4. Discussion
As indicated by the biomasses of total macrophyte communities, snails, phytoplankton and two types of periphyton (filamentous algae and epiphyton on P. lucens), our freshwater ecosystems were resilient to a simulated extreme event and run under low phosphorus concentrations. Total biomasses did not differ among the three macrophyte communities, which supports our first hypothesis. However, phytoplankton Chla was higher in the extreme water level increase treatment compared with the control for the macrophyte community consisting of V. denseserrulata only.
An epiphyton biomass of 10 mg m−2 has been reported to produce strong shading limiting the growth of submerged macrophytes [39]. A study involving experiments in glass tanks revealed that a snail biomass of approximately 10~20 g m−2 sufficed to reduce periphyton biomass to <5 mg m−2 and promote the growth of V. spinulosa [37]. In our study, snail biomass (15.9 ± 8.8 g m−2) was comparable with that in [37] and, expectedly then, the grazing effect on epiphyton would be strong. Consistently, the epiphyton biomass on the two chosen species (V. denseserrulata and P. lucens) was low in all treatments, indicating high grazing from snails and thus probably low shading effects from epiphyton on the macrophytes. Previous studies revealed that flooding, resulting in a sudden increase of water level and a nutrient pulse, might strongly change the primary producers (e.g., biomass of benthic algae) in tropical river–floodplain ecosystems [40]. However, submerged macrophytes are known to have positive feedbacks maintaining a clear-water state in shallow lakes by outcompeting phytoplankton, reducing resuspension and removing excessive nutrients from the water column [8]. Although total nitrogen and nitrate were higher in the extreme treatment than in C, phytoplankton biomass and Kd were low in all treatments, probably due to phosphorus limitation of phytoplankton growth. The macrophytes included in our study can efficiently take up phosphorus from the sediment [41] and apparently did not suffer from nutrient and light limitation as the total macrophyte biomass was not affected by the simulated extreme precipitation.
Extreme events such as heatwaves have been reported to significantly affect the growth and reproduction of submerged macrophytes, and macrophytes have shown clear species-specific responses to extreme events [25,26]. In our study, species-specific responses to the different extreme precipitation treatments were also found depending on growth form. The height of slow-growing Chara sp. (approximately 40 cm) in the C treatment was twice as large as in other treatments, indicating that extra nutrient loading alone or together with a high water-level has adverse effects on the growth of charophytes [42,43]. Though well-known for its invasiveness [44], C. caroliniana had disappeared at the end of the experiment in the extreme treatment, perhaps due to high pH and low alkalinity inducing carbon limitation of the growth [24]. Both species were short-growing (<50 cm), so the shading from other higher macrophytes (e.g., P. lucens) might have been a contributing factor.
A significantly higher biomass of V. denseserrulata was found in the V. denseserrulata-only community than in the other two communities with diverse growth forms, which is consistent with the lower Kd in this treatment. A study conducted in the same mesocosms found contrasting responses of the leaf chlorophyll parameters of V. denseserrulata growing in different macrophyte communities, but the biomass and morphology of this species did not differ when growing in macrophyte communities with diverse growth forms [7]. The different results observed for the same species might be attributed to differences in pot size; the plastic cups (diameter top 6.8 cm, bottom 4.8 cm; height 74 cm) in [7] were small compared with the pots used in this study, which likely limited macrophyte growth and diminished the effects of the macrophyte community. Only for P. lucens did maximum plant height show significant responses to higher water levels, reflecting the growth form of this canopy-forming macrophyte type. On average, light intensity was reduced by 1/3 of surface radiation at 65 cm depth in the 150 cm water level treatments and at 50 cm depth in the 75 cm water level treatments. Accordingly, light availability may have been sufficient for growth of the species with large plant height, which may explain why the biomasses of V. denseserrulata, P. lucens and H. verticillata did not respond significantly to an increase in water level or nutrient loading. Significantly lower epiphyton biomass was found on V. denseserrulata than P. lucens leaves, probably indicating preference by snails for the epiphyton on this species. In addition, based on the leaf intactness, there is potentially direct grazing by snails on both species. Due to the low shading from epiphyton and the high proportion of intact and minor-damaged leaves, the direct effects of snails and epiphyton on macrophyte growth were assumed to be minor in our study compared with the studies in [37,45]. In summary, our results showed that the growth form combination of the macrophyte communities plays a more vital role in regulating the growth of rosette-like (or bottom-dwelling) species than of canopy-forming species, which supports our second hypothesis. Moreover, the short species (Chara sp.) was more affected by extreme precipitation than the taller species (V. denseserrulata), even though they have a similar growth form.
The sexual reproduction of the three submerged macrophytes also showed species-specific responses. Generally, O. alismoides tolerates moderate water level fluctuations, but sexual reproduction exhibited a decreasing trend at the water level change of 75 cm [28]. Flower numbers did not differ among the four extreme precipitation treatments (even for the 75 cm increase), but the flowering phase advanced after nutrient addition alone or a gradual water level increase. With the pollination mode of entomophily [46], the change in the flowering phase of O. alismoides might affect interaction with pollinators. O. alismoides is an annual species and did not recover after winter in the experiment, preventing us from evaluating the effects of extreme precipitation on biomass at the end of the experiment. The responses of flowering also depend on growth form; thus, the rosette-type macrophyte V. denseserrulata produces female flowers at the bottom of the plant, while the canopy-forming P. lucens flowers at the growing tips after the tips reach the water surface [30]. Thus, P. lucens elongated to the surface even in the extreme treatment and tended to exhibit advanced florescence with more flowers, while V. denseserrulata likely faced a higher cost of producing female flowers in deeper water [47].
5. Conclusions
In conclusion, we found that, at community level, high-coverage macrophytes were resilient to one event of extreme precipitation and at species level, species-specific responses were found for macrophyte biomass and sexual reproduction. We conclude that the growth form of submerged macrophytes is important when considering the effects of climate change and that maximum plant height is an important trait in the adaptation of submerged macrophytes to extreme precipitation. It should be noted that our results were obtained at low phosphorus concentrations and cannot readily be transferred to more nutrient-rich conditions.
Supplementary Materials
The following material is available online at https://www.mdpi.com/2073-4441/11/6/1160/s1, Figure S1: Diagram showing the experiment setup, Figure S2: Monthly changes in temperature (T, °C) and theoretical daylight length (DL, hour) during the experiment period, Figure S3: Maximum height of the five submerged macrophyte species used at the end of the experiment for three macrophyte community treatments (MC1, MC2 and MC3) and four extreme precipitation treatments (EP: C, C_N, E, and G). Vd = Vallisneria denseserrulata; Hv = Hydrilla verticillata; Pl = Potamogeton lucens; Cc = Cabomba caroliniana; Chara = Chara sp., Figure S4: Correlation analysis between the three categories of leaf intactness of Vallisneria denseserrulata and snail biomass (and abundance). Leaf intactness was categorised into intact, minor and major damages. The number on the upper diagonal is the Pearson correlation coefficient, r, and the star (*) indicates the significance level: * = p < 0.05; *** = p < 0.001, Figure S5: Correlation analysis between the three categories of leaf intactness of Potamogeton lucens and snail biomass (and abundance). Leaf intactness was categorised into intact, minor and major damages. The number on the upper diagonal is the Pearson correlation coefficient, r, and the star (*) indicates the significance level: * = p < 0.05; ** = p <0.01; *** = p < 0.001.
Author Contributions
Conceptualisation, E.J., Y.C. and W.L.; investigation, Y.Z. and Y.C.; writing—original draft preparation, Y.C. and W.L.; writing—review and editing, E.J. and W.L.
Funding
This research was funded by NATIONAL NATURAL SCIENCE FOUNDATION OF CHINA (31870345 and 31670368), CLEAR (a Villum Kann Rasmussen Centre of Excellence project) and the MARS project (Managing Aquatic ecosystems and water Resources under multiple Stress) funded under the 7th EU Framework Programme, Theme 6 (Environment including Climate Change), Contract No.: 603378 (http://www.mars-project.eu), PROGNOS (Predicting in-lake RespOnses to chanGe using Near real time mOdelS—Water Joint Programme Initiative) and AQUACOSM (Network of Leading European AQUAtic MesoCOSM Facilities Connecting Mountains to Oceans from the Arctic to the Mediterranean).
Acknowledgments
We thank Anne Mette Poulsen for valuable editorial comments.
Conflicts of Interest
The authors declare no conflict of interest.
References
- Field, C.B.; Barros, V.R.; Mach, K.; Mastrandrea, M. Climate Change 2014: Impacts, Adaptation, and Vulnerability. Part A: Global and Sectoral Aspects. Contribution of Working Group II to the Fifth Assessment Report of the Intergovernmental Panel on Climate Change; Cambridge University Press: Cambridge, UK, 2014; pp. 1–32. [Google Scholar]
- Cobbaert, D.; Wong, A.; Bayley, S.E. Precipitation-induced alternative regime switches in shallow lakes of the boreal plains (Alberta, Canada). Ecosystems 2014, 17, 535–549. [Google Scholar] [CrossRef]
- Hidding, B.; Sarneel, J.M.; Bakker, E.S. Flooding tolerance and horizontal expansion of wetland plants: Facilitation by floating mats? Aquat. Bot. 2014, 113, 83–89. [Google Scholar] [CrossRef]
- Zhang, X.; Liu, X.; Wang, H. Effects of water level fluctuations on lakeshore vegetation of three subtropical floodplain lakes, China. Hydrobiologia 2014, 747, 43–52. [Google Scholar] [CrossRef]
- Poznańska, M.; Goleniewska, D.; Gulanicz, T.; Kakareko, T.; Jermacz, Ł.; Kobak, J. Effect of substratum drying on the survival and migrations of a freshwater pulmonate snail Planorbarius corneus (Linnaeus, 1758). Hydrobiologia 2015, 747, 177–188. [Google Scholar] [CrossRef]
- Zhang, Z.; Cao, Y.; Jeppesen, E.; Li, W. The response of Vallisneria spinulosa (Hydrocharitaceae) and plankton to pulse addition of inorganic nitrogen with different loading patterns. Hydrobiologia 2016, 767, 175–184. [Google Scholar] [CrossRef]
- Zhi, Y.; Cao, Y.; Sun, J.; Li, W.; Jeppesen, E. Indirect effects of extreme precipitation on the growth of Vallisneria denseserrulata Makino. Environ. Exp. Bot. 2018, 153, 229–235. [Google Scholar] [CrossRef]
- Jeppesen, E.; Sondergaard, M.; Sondergaard, M.; Christofferson, K. The Structuring Role of Submerged Macrophytes in Lakes; Springer Science & Business Media: New York, NY, USA, 1998; ISBN 1461206952. [Google Scholar]
- Kosten, S.; Meerhoff, M. Lake Communities. In eLS.; John Wiley & Sons, Ltd.: Chichester, UK, 2014; ISBN 9780470015902. [Google Scholar]
- Scheffer, M.; Jeppesen, E. Regime shifts in shallow lakes. Ecosystems 2007, 10, 1–3. [Google Scholar] [CrossRef]
- Wiegleb, G. Analysis of flora and vegetation in rivers: Concepts and applications. In Vegetation of Inland Waters; Springer: Dordrecht, The Netherlands, 1988; pp. 311–340. [Google Scholar]
- Vis, C.; Hudon, C.; Carignan, R. Influence of the vertical structure of macrophyte stands on epiphyte community metabolism. Can. J. Fish. Aquat. Sci. 2006, 63, 1014–1026. [Google Scholar] [CrossRef]
- Blindow, I.; Hargeby, A.; Hilt, S. Facilitation of clear-water conditions in shallow lakes by macrophytes: Differences between charophyte and angiosperm dominance. Hydrobiologia 2014, 737, 99–110. [Google Scholar] [CrossRef]
- Hao, B.; Wu, H.; Cao, Y.; Xing, W.; Jeppesen, E.; Li, W. Comparison of periphyton communities on natural and artificial macrophytes with contrasting morphological structures. Freshw. Biol. 2017, 62, 1783–1793. [Google Scholar] [CrossRef]
- Kelly, R.; Harrod, C.; Maggs, C.A.; Reid, N. Effects of Elodea nuttallii on temperate freshwater plants, microalgae and invertebrates: Small differences between invaded and uninvaded areas. Biol. Invasions 2015, 17, 2123–2138. [Google Scholar] [CrossRef]
- Ferreiro, N.; Feijoó, C.; Giorgi, A.; Leggieri, L. Effects of macrophyte heterogeneity and food availability on structural parameters of the macroinvertebrate community in a Pampean stream. Hydrobiologia 2011, 664, 199–211. [Google Scholar] [CrossRef]
- Ferreiro, N.; Giorgi, A.; Feijoó, C. Effects of macrophyte architecture and leaf shape complexity on structural parameters of the epiphytic algal community in a Pampean stream. Aquat. Ecol. 2013, 47, 389–401. [Google Scholar] [CrossRef]
- Prins, H.B.A.; Snel, J.F.H.; Zanstra, P.E.; Helder, R.J. The mechanism of bicarbonate assimilation by the polar leaves of Potamogeton and Elodea. CO2 concentrations at the leaf surface. Plant Cell Environ. 1982, 5, 207–214. [Google Scholar] [CrossRef]
- Zhang, Y.; Yin, L.; Jiang, H.S.; Li, W.; Gontero, B.; Maberly, S.C. Biochemical and biophysical CO2 concentrating mechanisms in two species of freshwater macrophyte within the genus Ottelia (Hydrocharitaceae). Photosynth. Res. 2014, 121, 285–297. [Google Scholar] [CrossRef]
- Elzenga, J.T.M.; Prins, H.B.A. Light-induced polar pH changes in leaves of Elodea canadensis I. Effects of carbon concentration and light intensity. Plant Physiol. 1989, 91, 62–67. [Google Scholar] [CrossRef]
- Lucas, W.J. Mechanism of acquisition of exogenous bicarbonate by internodal cells of Chara corallina. Planta 1982, 156, 181–192. [Google Scholar] [CrossRef]
- Bulychev, A.A.; Polezhaev, A.A.; Zykov, S.V.; Pljusnina, T.Y.; Riznichenko, G.Y.; Rubin, A.B.; Janto, W.; Zykov, V.S.; Müller, S.C. Light-triggered pH banding profile in Chara cells revealed with a scanning pH microprobe and its relation to self-organization phenomena. J. Theor. Biol. 2001, 212, 275–294. [Google Scholar] [CrossRef]
- Van den Berg, M.S.; Coops, H.; Simons, J.; Pilon, J. A comparative study of the use of inorganic carbon resources by Chara aspera and Potamogeton pectinatus. Aquat. Bot. 2002, 72, 219–233. [Google Scholar] [CrossRef]
- Yin, L.; Li, W.; Madsen, T.V.; Maberly, S.C.; Bowes, G. Photosynthetic inorganic carbon acquisition in 30 freshwater macrophytes. Aquat. Bot. 2017, 140, 48–54. [Google Scholar] [CrossRef]
- Cao, Y.; Neif, É.M.; Li, W.; Coppens, J.; Filiz, N.; Lauridsen, T.L.; Davidson, T.A.; Søndergaard, M.; Jeppesen, E. Heat wave effects on biomass and vegetative growth of macrophytes after long-term adaptation to different temperatures: A mesocosm study. Clim. Res. 2015, 66, 265–274. [Google Scholar] [CrossRef]
- Li, Z.; He, L.; Zhang, H.; Urrutia-Cordero, P.; Ekvall, M.K.; Hollander, J.; Hansson, L. Climate warming and heat waves affect reproductive strategies and interactions between submerged macrophytes. Glob. Chang. Biol. 2016, 23, 108–116. [Google Scholar] [CrossRef] [PubMed]
- Hao, B.; Roejkjaer, A.F.; Wu, H.; Cao, Y.; Jeppesen, E.; Li, W. Responses of primary producers in shallow lakes to elevated temperature: A mesocosm experiment during the growing season of Potamogeton crispus. Aquat. Sci. 2018, 80, 34. [Google Scholar] [CrossRef]
- Yu, L.-F.; Yu, D. Responses of the threatened aquatic plant Ottelia alismoides to water level fluctuations. Fundam. Appl. Limnol. Hydrobiol. 2009, 174, 295–300. [Google Scholar] [CrossRef]
- Zhang, X.; Liu, X.; Ding, Q. Morphological responses to water-level fluctuations of two submerged macrophytes, Myriophyllum spicatum and Hydrilla verticillata. J. Plant Ecol. 2012, 6, 64–70. [Google Scholar] [CrossRef]
- Zhou, Y.; Li, X.; Zhao, Y.; Zhou, W.; Li, L.; Wang, B.; Cui, X.; Chen, J.; Song, Z. Divergences in reproductive strategy explain the distribution ranges of Vallisneria species in China. Aquat. Bot. 2016, 132, 41–48. [Google Scholar] [CrossRef]
- Chen, J.; Cao, T.; Zhang, X.; Xi, Y.; Ni, L.; Jeppesen, E. Differential photosynthetic and morphological adaptations to low light affect depth distribution of two submersed macrophytes in lakes. Sci. Rep. 2016, 6, 34028. [Google Scholar] [CrossRef] [Green Version]
- Scheffer, M.; Hosper, S.H.; Meijer, M.L.; Moss, B.; Jeppesen, E. Alternative equilibria in shallow lakes. Trends Ecol. Evol. 1993, 8, 275–279. [Google Scholar] [CrossRef]
- Wang, H.; Pan, B.; Liang, X.; Wang, H. Gastropods on submersed macrophytes in Yangtze lakes: Community characteristics and empirical modelling. Int. Rev. Hydrobiol. 2006, 91, 521–538. [Google Scholar] [CrossRef]
- Li, W.; Zhang, Z.; Jeppesen, E. The response of Vallisneria spinulosa (Hydrocharitaceae) to different loadings of ammonia and nitrate at moderate phosphorus concentration: A mesocosm approach. Freshw. Biol. 2008, 53, 2321–2330. [Google Scholar]
- Huang, X.F.; Chen, W.M.; Cai, Q.M. Survey, Observation and Analysis of Lake Ecology—Standard Methods for Observation and Analysis in Chinese Ecosystem Research Network, Series V; China Standard Press: Beijing, China, 1999. [Google Scholar]
- Kirk, J.T.O. Attenuation of light in natural waters. Mar. Freshw. Res. 1977, 28, 497–508. [Google Scholar] [CrossRef]
- Cao, Y.; Li, W.; Jeppesen, E. The response of two submerged macrophytes and periphyton to elevated temperatures in the presence and absence of snails: A microcosm approach. Hydrobiologia 2014, 738, 49–59. [Google Scholar] [CrossRef]
- Zuur, A.F.; Ieno, E.N.; Walker, N.J.; Saveliev, A.A.; Smith, G.M. Mixed Effects Models and Extensions in Ecology with R; Springer-Verlag: New York, NY, USA, 2009; ISBN 9780387874586. [Google Scholar]
- Roberts, E.; Kroker, J.; Körner, S.; Nicklisch, A. The role of periphyton during the re-colonization of a shallow lake with submerged macrophytes. Hydrobiologia 2003, 506, 525–530. [Google Scholar] [CrossRef]
- Winemiller, K.O.; Montaña, C.G.; Roelke, D.L.; Cotner, J.B.; Montoya, J.V.; Sanchez, L.; Castillo, M.M.; Layman, C.A. Pulsing hydrology determines top-down control of basal resources in a tropical river–floodplain ecosystem. Ecol. Monogr. 2014, 84, 621–635. [Google Scholar] [CrossRef]
- Sand-Jensen, K.; Borum, J. Interactions among phytoplankton, periphyton, and macrophytes in temperate freshwaters and estuaries. Aquat. Bot. 1991, 41, 137–175. [Google Scholar] [CrossRef]
- Christensen, J.P.A.; Sand-Jensen, K.; Staehr, P.A. Fluctuating water levels control water chemistry and metabolism of a charophyte-dominated pond. Freshw. Biol. 2013, 58, 1353–1365. [Google Scholar] [CrossRef]
- Azzella, M.M.; Rosati, L.; Iberite, M.; Bolpagni, R.; Blasi, C. Changes in aquatic plants in the Italian volcanic-lake system detected using current data and historical records. Aquat. Bot. 2014, 112, 41–47. [Google Scholar] [CrossRef]
- Schooler, S.S. Shade as a management tool for the invasive submerged macrophyte, Cabomba caroliniana. J. Aquat. Plant Manag. 2008, 46, 168–171. [Google Scholar]
- Cao, Y.; Olsen, S.; Gutierrez, M.F.; Brucet, S.; Davidson, T.A.; Li, W.; Lauridsen, T.L.; Søndergaard, M.; Jeppesen, E. Temperature effects on periphyton, epiphyton and epipelon under a nitrogen pulse in low-nutrient experimental freshwater lakes. Hydrobiologia 2017, 795, 267–279. [Google Scholar] [CrossRef]
- Du, Z.Y.; Wang, Q.F. Correlations of life form, pollination mode and sexual system in aquatic angiosperms. PLoS ONE 2014, 9, e115653. [Google Scholar] [CrossRef]
- Li, L.; Bonser, S.P.; Lan, Z.; Xu, L.; Chen, J.; Song, Z. Water depth affects reproductive allocation and reproductive allometry in the submerged macrophyte Vallisneria natans. Sci. Rep. 2017, 7, 16842. [Google Scholar] [CrossRef] [PubMed]
Figure 1.
The changes in physico-chemical parameters (mean + SD) including total nitrogen (TN), total phosphorus (TP), nitrate (NO3-N) and phytoplankton chlorophyll a (Chla) during the experiment for the three macrophyte community treatments (MC1, MC2 and MC3) and the four extreme precipitation treatments (EP: C, C_N, E and G). For clarity, SD values are only shown in one direction.

Figure 2.
Changes in physico-chemical parameters (mean + SD) including light attenuation coefficient (Kd), alkalinity (Alk), pH and dissolved oxygen (DO) during the experiment for three macrophyte community treatments (MC1, MC2 and MC3) and the four extreme precipitation treatments (EP: C, C_N, E and G). For clarity, SD values are only shown in one direction.

Figure 3.
Total community biomass and biomass of five submerged macrophytes species (per pot) during the experiment for the three macrophyte community treatments (MC1, MC2 and MC3) and the four extreme precipitation treatments (EP: C, C_N, E and G). Vd = Vallisneria denseserrulata; Hv = Hydrilla verticillata; Pl = Potamogeton lucens; Cc = Cabomba caroliniana; Chara = Chara sp.

Figure 4.
Number of flowering of three submerged macrophytes species in September (Sep), October (Oct) and November (Nov) in the experiment including three macrophyte community treatments (MC1, MC2 and MC3) and four extreme precipitation treatments (EP: C, C_N, E and G). Oa = Ottelia alismoides; Pl = Potamogeton lucens; Vd = V. denseserrulata.

Figure 5.
Snail biomass and abundance, biomass of filamentous algae and epiphyton on two submerged macrophytes at the end of the experiment for the three macrophyte community treatments (MC1, MC2 and MC3) and the four extreme precipitation treatments (EP: C, C_N, E and G). Pl = Potamogeton lucens; Vd = V. denseserrulata.


Table 1.
Statistical summary of results of the linear mixed models (LMMs) on the effects of macrophyte community (MC: MC1, MC2 and MC3) and extreme precipitation (EP: control (C), extra nutrient loading (C_N), extreme treatment (E) and gradual treatment (G)) on physico-chemical parameters including total phosphorus (TP), total nitrogen (TN), nitrate (NO3-N), phytoplankton Chla, alkalinity, pH, light attenuation coefficient (Kd) and dissolved oxygen (DO). The post-hoc test was conducted by the Tukey method. NS = not significant; * = p < 0.05; ** = p < 0.01; *** = p < 0.001.
| Indicators | LMMs F Values and Significance (Sig.) | Post-Hoc Test | |||
|---|---|---|---|---|---|
| MC | EP | Interaction | MC | EP | |
| TP | 1.47, NS | 4.82, ** | 1.20, NS | C< C_N, G | |
| TN | 0.73, NS | 62.62, *** | 0.58, NS | C< E, G < C_N | |
| NO3-N | 0.51, NS | 45.62, *** | 0.20, NS | C< E < G < C_N | |
| Phytoplankton Chla | 0.30, NS | 3.26, * | 0.51, NS | ||
| Kd | 10.46, *** | 15.34, *** | 1.01, NS | MC1 < MC2, MC3 | E, G < C, C_N |
| Alkalinity | 1.03, NS | 4.37, * | 1.11, NS | E < C, G, C_N | |
| pH | 0.63, NS | 6.15, ** | 0.62, NS | E > C, G, C_N | |
| DO | 2.77, NS | 4.26, * | 0.58, NS | E > C, C_N | |
Table 2.
Statistical summary of two-way ANOVA on the effects of the macrophyte community (MC: MC1, MC2 and MC3) and extreme precipitation (EP: C, C_N, E and G) on plant biomass and morphology at the end of the experiment. The post-hoc test was conducted by the Tukey method. NS = not significant; * = p < 0.05; ** = p < 0.01; *** = p < 0.001.
| Species/Indicators | Two-Way ANOVA | Post-Hoc Test | ||||
|---|---|---|---|---|---|---|
| MC F Values, Sig. | EP F Values, Sig. | Interaction F Values, Sig. | MC | EP | ||
| Macrophyte community | Total biomass | 0.49, NS | 0.74, NS | 0.09, NS | - | - |
| Vallisneria denseserrulata | Total biomass | 23.10, *** | 1.09, NS | 0.80, NS | MC1 > MC2, MC3 | - |
| Maximum height | 4.97, * | 1.15, NS | 0.87, NS | MC1 > MC2, MC3 | - | |
| Potamogeton lucens | Total biomass | 0.05, NS | 0.25, NS | 0.29, NS | - | - |
| Maximum height | 0.01, NS | 4.49, * | 0.62, NS | - | C_N < E, G | |
| Hydrilla verticillata | Total biomass | 0.03, NS | 0.18, NS | 0.55, NS | - | - |
| Maximum height | 0.07, NS | 0.76, NS | 0.19, NS | - | - | |
| Cabomba carolinana | Total biomass | Not tested | 4.452, * | Not tested | - | E < G, C, C_N |
| Maximum height | Not tested | 4.31, * | Not tested | - | E < G | |
| Chara sp. | Total biomass | Not tested | 7.84, ** | Not tested | - | C > G, E, C_N |
| Maximum height | Not tested | 14.37, ** | Not tested | - | C > G, E, C_N | |
Table 3.
Statistical summary of two-way ANOVA on the effects of macrophyte community (MC: MC1, MC2 and MC3) and extreme precipitation (EP: C, C_N, E and G) on the biomass (or abundance) of filamentous algae, snails and epiphyton at the end of the experiment. NS = not significant; * = p < 0.05; *** = p < 0.001.
| Indicators | Two-Way ANOVA | ||
|---|---|---|---|
| MC F Values, Sig. | EP F Values, Sig. | Interaction F Values, Sig. | |
| Filamentous algae biomass | 2,34, NS | 0.72, NS | 0.39, NS |
| Snail biomass | 0.51, NS | 0.72, NS | 2.04, NS |
| Snail abundance | 2.77, NS | 1.07, NS | 1.75, NS |
| Epiphyton on V. denseserrulata | 1.93, NS | 4.18, * | 6.82, *** |
| Epiphyton on P. lucens | 0.05, NS | 0.88, NS | 1.32, NS |
© 2019 by the authors. Licensee MDPI, Basel, Switzerland. This article is an open access article distributed under the terms and conditions of the Creative Commons Attribution (CC BY) license (http://creativecommons.org/licenses/by/4.0/).
Share and Cite
MDPI and ACS Style
Cao, Y.; Zhi, Y.; Jeppesen, E.; Li, W. Species-Specific Responses of Submerged Macrophytes to Simulated Extreme Precipitation: A Mesocosm Study. Water 2019, 11, 1160. https://doi.org/10.3390/w11061160
AMA Style
Cao Y, Zhi Y, Jeppesen E, Li W. Species-Specific Responses of Submerged Macrophytes to Simulated Extreme Precipitation: A Mesocosm Study. Water. 2019; 11(6):1160. https://doi.org/10.3390/w11061160
Chicago/Turabian StyleCao, Yu, Yongwei Zhi, Erik Jeppesen, and Wei Li. 2019. "Species-Specific Responses of Submerged Macrophytes to Simulated Extreme Precipitation: A Mesocosm Study" Water 11, no. 6: 1160. https://doi.org/10.3390/w11061160
Note that from the first issue of 2016, this journal uses article numbers instead of page numbers. See further details here.