Multi-Objective Optimal Operations Based on Improved NSGA-II for Hanjiang to Wei River Water Diversion Project, China


State Key Laboratory of Eco-hydraulics in Northwest Arid Region of China, Xi’an University of Technology, Xi’an 710048, China
*
Author to whom correspondence should be addressed.
Water 2019, 11(6), 1159; https://doi.org/10.3390/w11061159
Submission received: 30 March 2019
/
Revised: 20 May 2019
/
Accepted: 21 May 2019
/
Published: 2 June 2019
(This article belongs to the Section Water Resources Management, Policy and Governance)
Abstract
:It is important to investigate the laws of reservoir multi-objective optimization operations, because it can obtain the best benefits from inter-basin water transfer projects to mitigate water shortage in intake areas. Given the multifaceted demands of the Hanjiang to Wei River Water Diversion Project, China (referred hereafter as “the Project”), an easy-to-operate multi-objective optimal model based on simulation is built and applied to search the multi-objective optimization operation rules between power generation and energy consumption. The Project includes two reservoirs connected by a water transfer tunnel. One is Huangjinxia, located in the mainstream of Hanjiang with abundant inflow but no regulation ability, and the other is Sanhekou, located in the tributary of Hanjiang with multi-year regulation ability but less water. The layout of the Project increases the difficulty of reservoir joint optimization operations. Therefore, an improved Non-dominated Sorting Genetic Algorithm-II (I-NSGA-II) with a feasible search space is proposed to solve the model based on long-term series data. The results show that: (1) The validated simulation model is helpful to obtain Pareto front curves to reveal the rules between power generation and energy consumption. (2) Choosing a reasonable search step size to build a feasible search space based on simulation results for the I-NSGA-II can help find more optimized solutions. Considering the influence of the initial populations of the algorithm and limited computing ability of computers, the qualified rate of Pareto points solved by I-NSGA-II are superior to NSGA-II. (3) According to the characteristics of the Project, water transfer ratio threshold value of two reservoirs are quantified for maximize economic benefits. Moreover, the flood season is a critical operation period for the Project, in which both reservoirs should supply more water to intake areas to ensure the energy balanced of the entire system. The findings provide an easy-to-operate multi-objective operation model with the I-NSGA-II that can easily be applied in optimal management of inter-basin water transfer projects by relevant authorities.
1. Introduction
The water-energy-food security Nexus has received worldwide attention since 2011, when the World Economic Forum identified it as one of the three largest threats to the global economy [1]. In particular, the “available water resource” is considered the core element of Nexus [2]. However, social problems caused by water problems, especially water shortages, have attracted more public attention [3,4]. Therefore, many countries have explored efficient measures to solve the contradiction between uneven distribution and the continually growing demand for water resources, including seawater desalination [5] and Inter-Basin Water Transfer (referred hereafter as “IBWT”) projects [6]. More than 160 IBWT projects have been completed worldwide [7,8]. For example, California’s South-North Water Transfer Project [9], the South-North Water Transfer Project of China and Hanjiang to Wei River Water Diversion Project (referred hereafter as “the Project”) began operating in 2013.
As a bridge connecting multiple river basins, IBWT projects are researched by many scholars, including examining the quality of water [10], optimized operations [11], and ecological assessment [12]. In areas of reservoir optimization operations of IBWT projects, a few experts have explored multiple engineering scenarios and optimization objectives to search for best operation processes and rules. Guo [13] proposed a bi-level model to consider water transfer and water supply together in view of hierarchical structure problems. Zhou [14] built a multi-objective model of the maximum water supply and the highest efficiency for diversion, and decomposed it into a single-objective model to obtain joint operation charts. Zeng [15] proposed a water transfer triggering mechanism by considering the uncertain nature of inflow and the shortage of reservoirs to improve the system’s operation performance. Jamshid [16] presented a simulation optimization framework for reliability-based optimal sizing, operation and water allocation. Scant literature is available on reservoir optimization operations of IBWT projects, and the relevant methods may be challenging to apply for managers to deal with potential changes. It is thus important to explore an easy-to-operate multi-objective operation model.
At the same time, some multi-objective evolutionary algorithms (MOEAs), like Multi-Objective Particle Swarm Optimization, Nearest-Neighbor Interpolation Algorithm, and Non-Dominated Sorting Genetic Algorithm-II (NSGA-II) have been applied in reservoir optimization operations and water resources allocation. Abido [17] used the newly developed Pareto-based MOEA to solve a practical power system multi-objective nonlinear optimization problem. Zhou [18] used the probability of an improvement vector to propose a generalized resource allocation (GRA) strategy for decomposition-based MOEAs to allocate resources more reasonably. Alizadeh [19] used the NSGA-II to build a fuzzy multi-objective simulation optimization model for decision making. According to the effectiveness of these algorithms, the NSGA-II is thus chosen to solve the multi-objective optimal operation model in this paper [20].
The water resource system has evolved into a complex nonlinear system with multi-objectives, multi-attributes, multi-levels, multi-functions and multi-stages [21]. Many experts have improved the solution methods in combination with practical scenarios to obtain better optimization results. Bai used the Progressive Optimality Algorithm-Dynamic Programming Successive Approximation method to solve the multi-objective optimal operation model for hydropower generation, flood and ice control based on long-term data in the Upper Yellow River basin. Reddy [22] combined MOPSO with Elitist Mutation to provide solutions convergent with true Pareto-optimal solutions, and applied EM-MOPSO to solve MOPs concerning the Indian Bhadra reservoir system. With regard to NSGA-II used in this paper, some scholars have researched improvements. Wang [23] proposed an improved NSGA-II with individual and group constraints (ICGC-NSGA-II) to explore the relationship among water supply, power generation and ecological benefits. All these findings achieved good results on the studied cases they considered.
Nonetheless, the basic criterion of algorithm improvement has two aspects. Firstly, the algorithm should obtain exact transformation rules for multi-objectives and a balanced solution process for Pareto non-dominant points. Secondly, the algorithm should be easy to apply for managers. Therefore, this paper integrates multi-objectives optimization operations with simulation results to propose the improved NSGA-II (I-NSGA-II) to meet these requirements. Specifically, a feasible search space is added to ensure the range of evolutionary population of the I-NSGA-II, and the search step sizes based on simulation results are applied to narrow the feasible search space. Moreover, the search step size can be obtained by trial calculation according to water transfer scale of the Project.
Considering that the Project is still under construction, there is little relatively research on reservoir operation, especially on using MOEA to optimize the multi-objective operation model. The paper aims to develop a multi-objective optimal operation model of the Project based on simulated results. This paper considers the multi-objectives of power generation and energy consumption. Water quantity based on simulation model is used to verify the feasibility of the framework compared with the designed conditions, as the foundation of the multi-objective model. For this model, trial calculation in the feasible search range is applied to determine the feasible space of the I-NSGA-II. The operation chart is drafted by statistical methods based on Pareto front curves.
2. Study Area and Data
2.1. Study Area
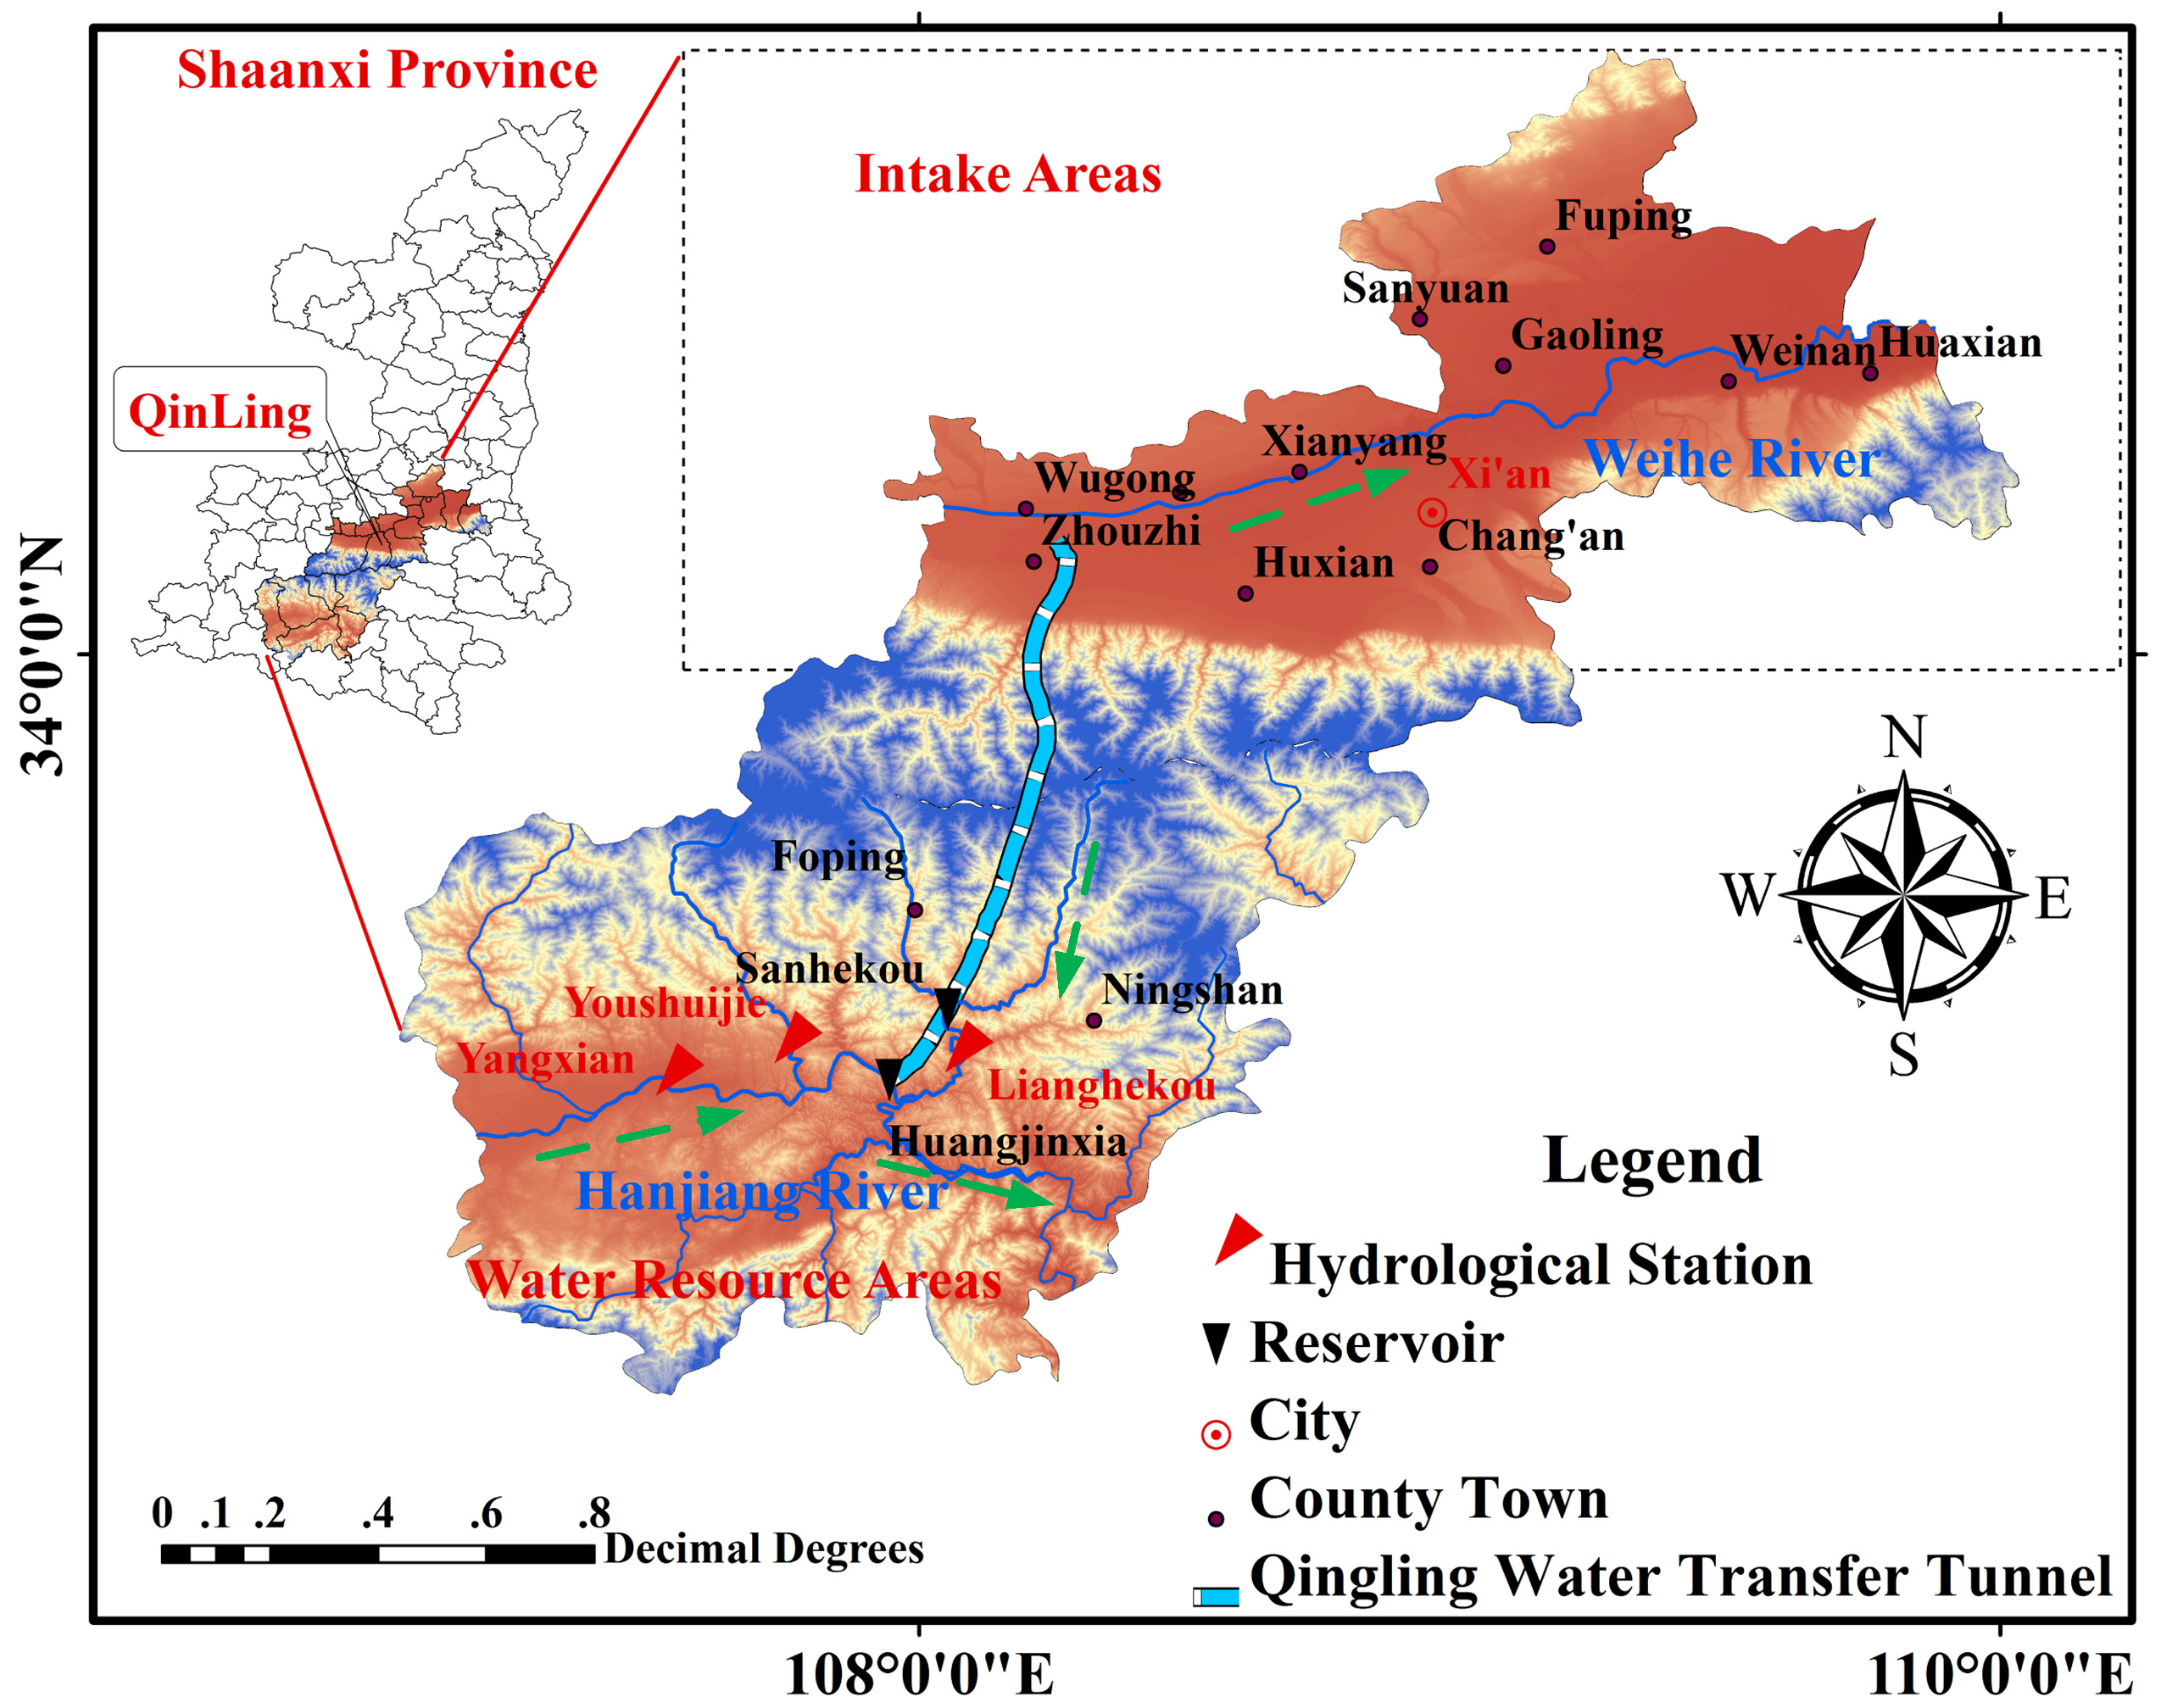
The Project spans the Yangtze River basin and the Yellow River basin, and will transfer water from the Han River basin to Guanzhong area of the Wei River basin. The summary of the two basins is provided below as shown in Figure 1.
As the largest tributary of the Yellow River, Wei River originates from Gansu province, which is 818 km long and covers approximately 134,800 km2 [24,25]. The northern part of the Wei River basin is in the Loess Plateau and the southern part is in the Qinling Mountains. Social development has been retarded by water shortages because of rapid economic growth [26]. Water supply to Guanzhong has continually increased from 49.08 billion m3 in 2010 to 54.2 billion m3 in 2015. The ratio of surface water to groundwater is equal in the water supply structure. The development and level of utilization of surface water resources is 44%, higher than the internationally recognized level (40%). Moreover, overexploitation of underground water is frequent, which has damaged the ecological environment of the Wei River basin. Thus, the Project is a necessary engineering measure in the basin to alleviate water shortage, maintain river ecosystem health and promote social and economic sustainability.
Han River is the largest tributary of the Yangtze River, and is designed as the water source area for the Project [27]. It originates from the south of Qinling Mountains, is 1577 km long, and flows through southern Shaanxi, covering approximately 159,000 km2. The Han River basin is in the subtropical monsoon climate zone with an average annual precipitation of 700~1100 mm, and the average surface water resource is 55.5 billion m³. The Danjiangkou reservoir is an important water source in the Han River, and supplies approximately 384 million m3 for the South-to-north Water Diversion Project [28].
2.2. The Hanjiang to Wei River Water Diversion Project
The main task of the Project is to transfer an average of 1.5 billion m3 water per year from Han River to 21 users in Guanzhong area of Shaanxi province, including important cities, counties and industrial parks. The Project will mitigate water shortages, gradually increase ecological water and reduce the mining of groundwater in the Wei River basin.
The Project (Figure 1) mainly includes water source areas and intake areas. The water source area is composed of two reservoirs, pump stations, hydropower stations and water-transferred tunnels in the Upper Han River.
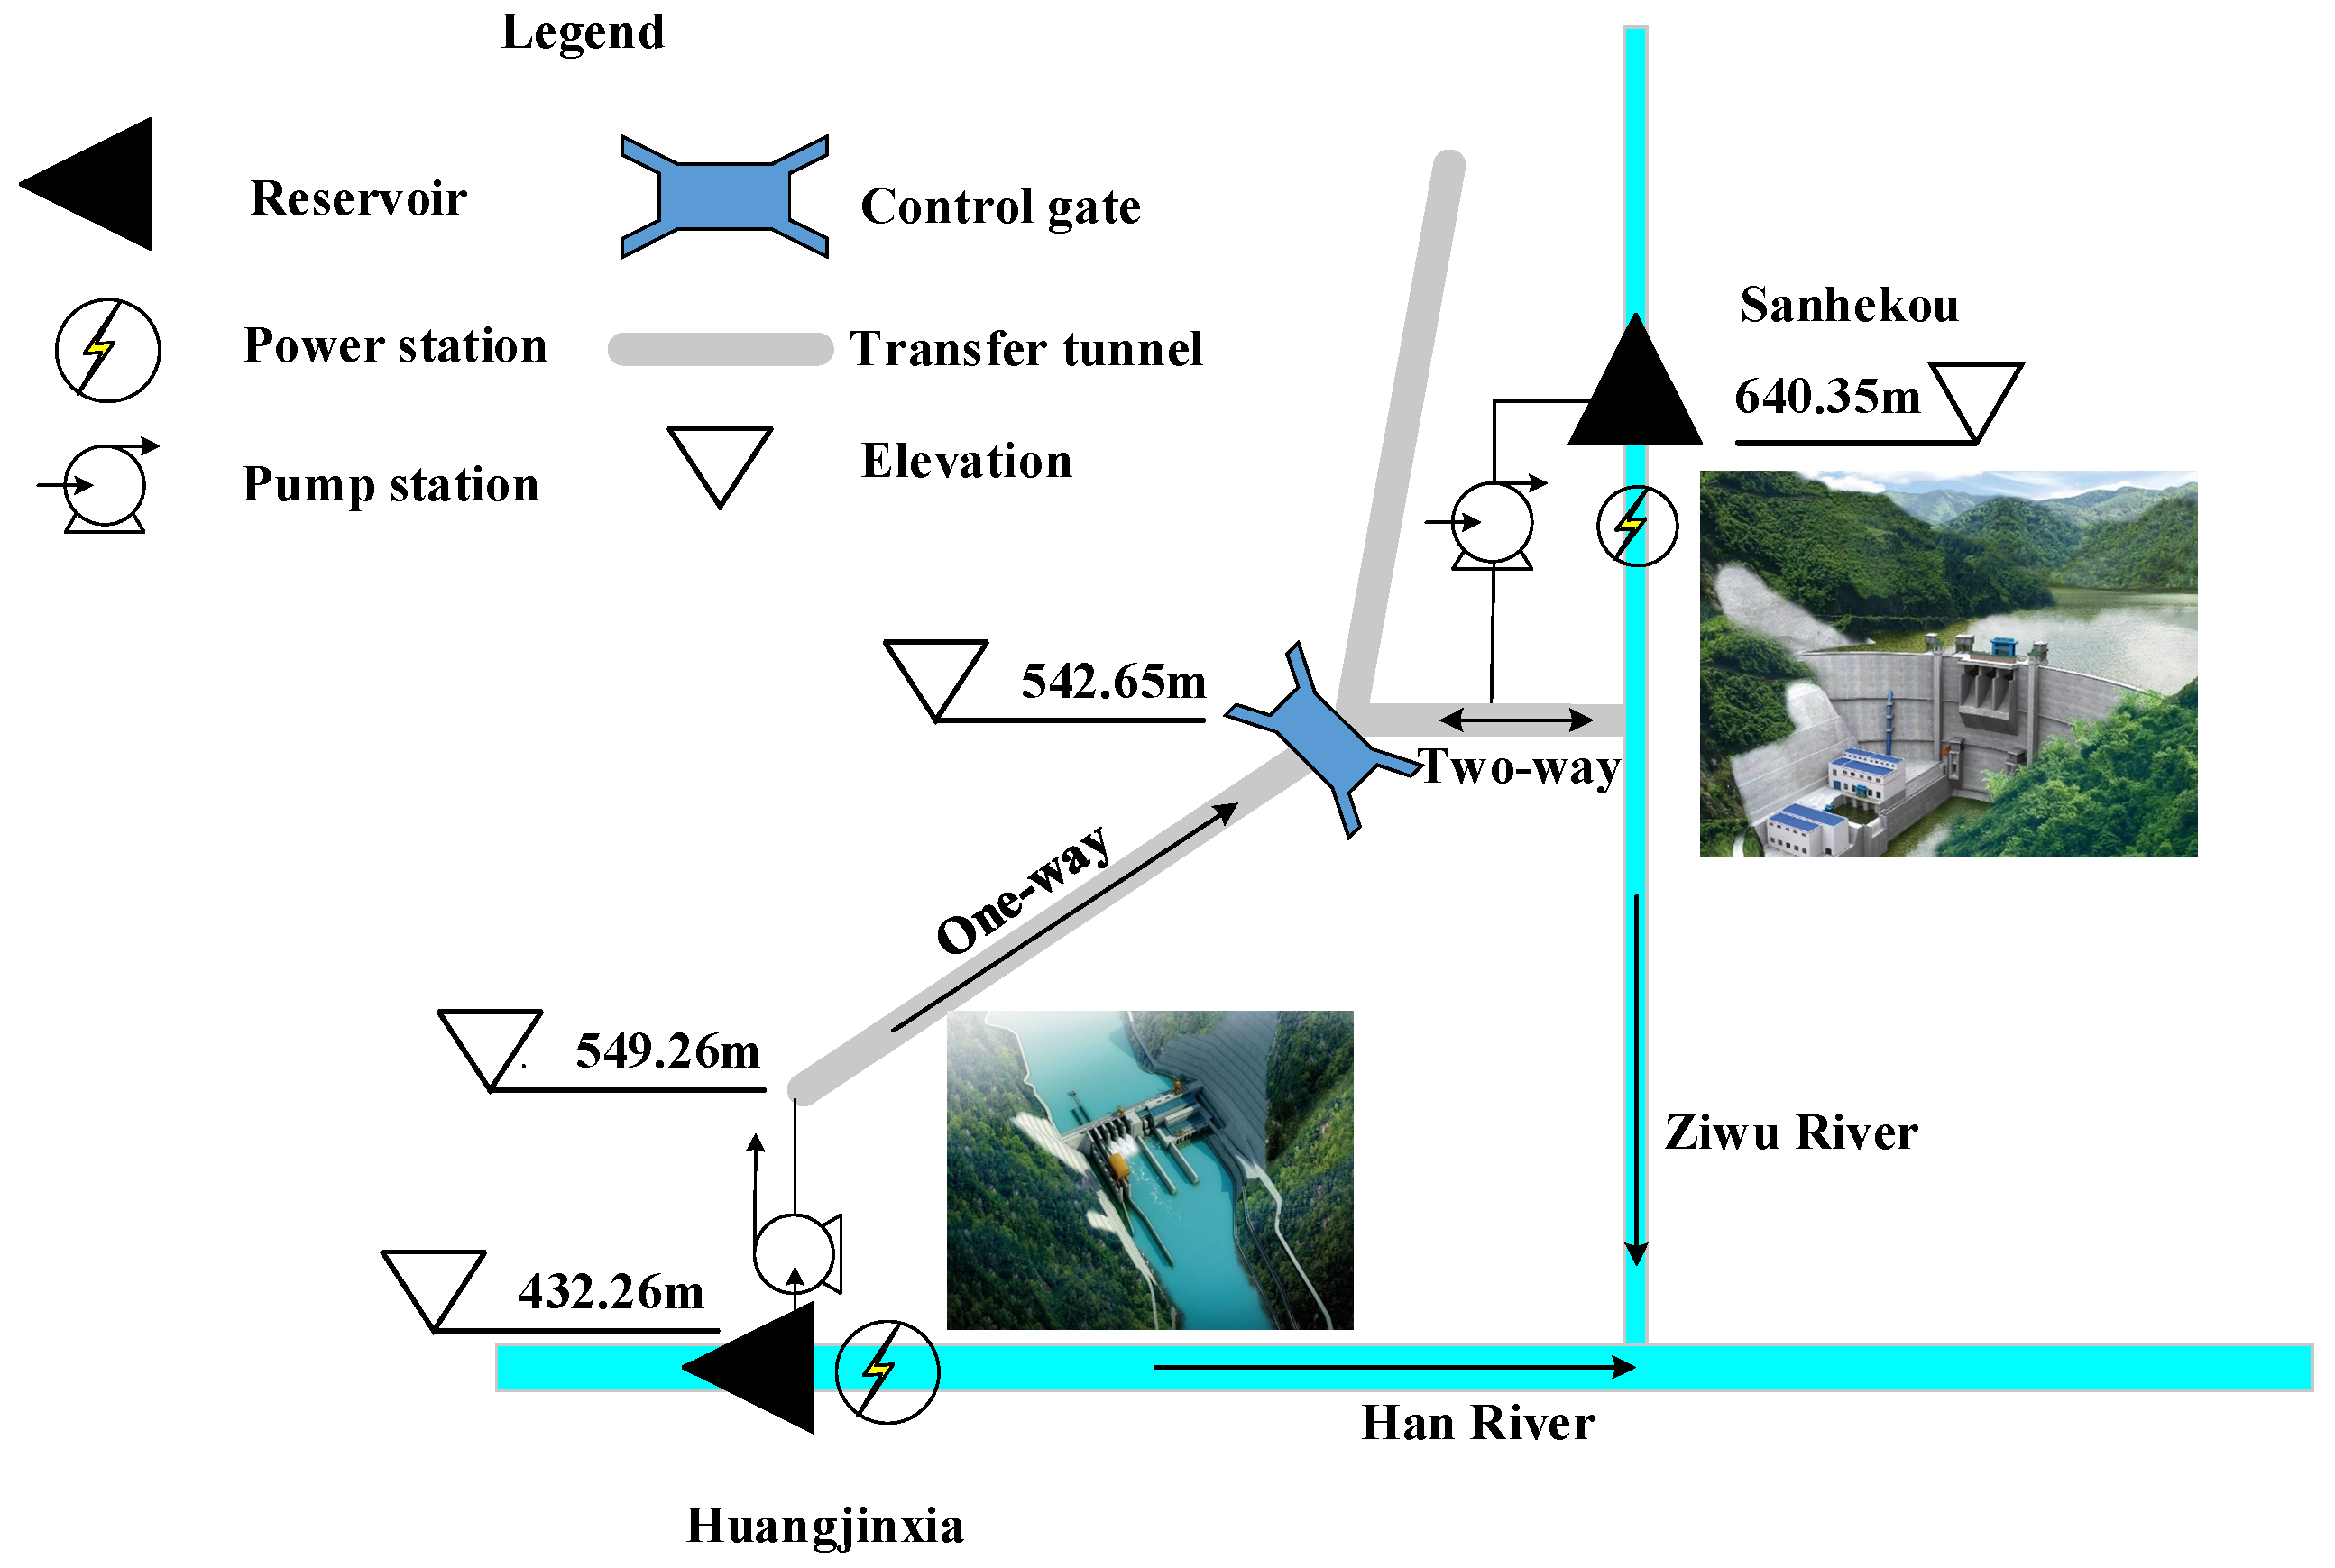
The water resource area of the Project (Figure 2) has two water sources. Huangjinxia reservoir (HJX) is the primary water source area, which is located in Han River, and Sanhekou reservoir (SHK) is another water source area, which is located in Ziwu River, a branch of Han River. Both reservoirs have their own pump stations and hydropower stations. The elevation of the Qinling tunnel is higher than HJX and lower than SHK, so that the HJX pump station consumes power to raise water to the Qinling tunnel, and water from SHK flows into Qinling tunnel automatically. In particular, the SHK pump station is reversible, which means that two pump units are used to generate power when SHK pump station does not raise water from Qinling tunnel to SHK. The maximum water transfer capability of the Qinling tunnel is 70 m3/s, and its water loss coefficient is 1.5%. The concrete parameters of the Project are presented in Table 1.
2.3. Data Situation
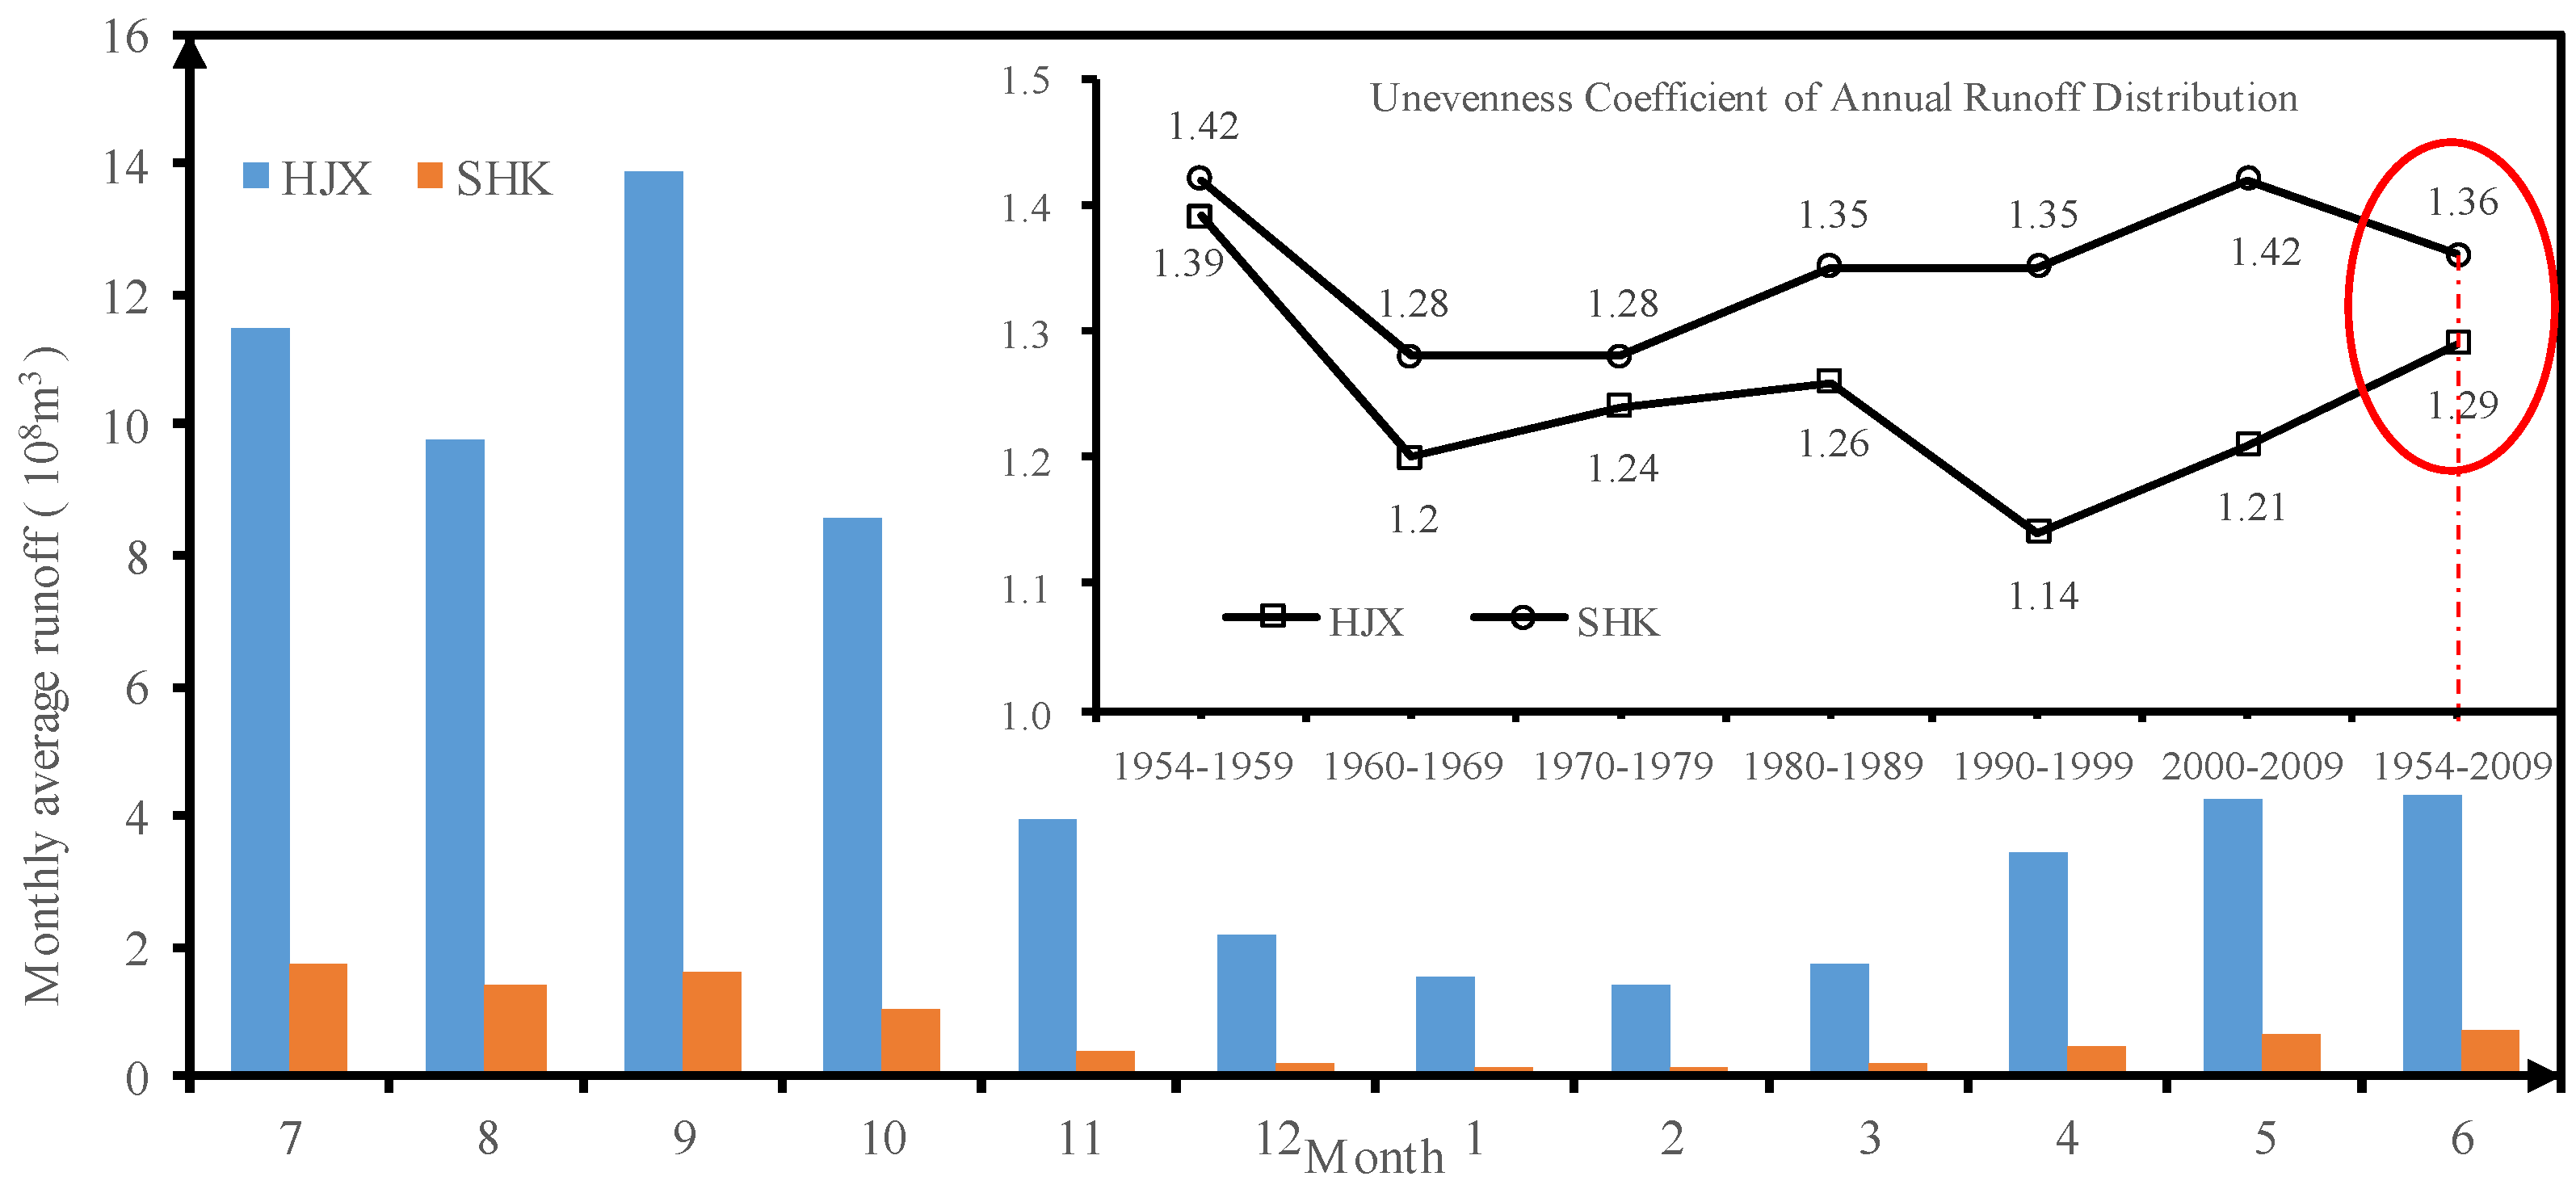
In this paper, the monthly inflow data series of two reservoirs are all taken from July 1954 to June 2010, provided by the Water Resources Bureau of the Yangtze River Water Resources Commission. Figure 3 shows that the unevenness coefficients [29] of annual runoff distribution are 1.29 (HJX) and 1.36 (SHK), respectively, which indicates that the annual distributions of the two inflow series are uneven, but most of the water is centralized in the flood season (from July to October).
3. Modeling and Methodology
3.1. Simulated Operation Model of Water Quantity
The simulated operational model is mainly used to establish operational framework and verify design parameters of the Project, which also provide key parameters for optimal operation model. Thus, the basic requirement of simulated operation model is to meet water demand based on designed operation rules. The objective function is formulated as follows:
where is annual average of 1.5 billion m3, which is the total water transfer of the Project (108 m3/s); is the length of operation cycle; is the period of reservoir operation with a month as step (s); is the number of reservoirs, where 1 represents HJX reservoir and 2 represents SHK reservoir; and is water supplied by HJX and SHK reservoirs in period t (m3/s).
3.2. Multi-Objective Optimization Operation Model
The main task of the Project is to supply enough water while minimizing operating cost. Thus, both water supply and net power generation should be considered in the multi-objective model. However, the prices of energy consumption and hydropower generation are RMB 1 yuan/kWh and RMB 0.2 yuan/kWh, respectively, hydropower stations and pump stations operation rules would be not obvious if net hydropower generation is directly chosen as the model objective. Thus, we chose energy consumption and hydropower generation to build a multi-objective model. Results should ensure that power generation is maximized, and energy consumption is minimized.
(1) Multi-objective function
Sub-objective one: Minimizing energy consumption
Sub-objective two: Maximizing power generation
where is set of optimal solutions for multi-objective operation models, is total energy consumption of the two pump stations in operation series, is total hydropower generation of the two hydropower stations in operation series. , , and have the same meanings as Section 3.1, is consumed power of the pump station m in period t; is transfer water flow of the pump station m in period t; is efficiency of the pump station m, is acceleration due to gravity; is generated hydropower generation of hydropower station m in period t; is outflow of the hydropower station m in period t; is water head of the reservoir m in period t; and is power coefficient of the hydropower station m.
(2) Constraints
Both the simulation and multi-objective model have the same operational constraints, as follows:
- (1)
- Water balance
- (2)
- Water level
- (3)
- Transferable water quantity
- (4)
- Maximum overflow
- (5)
- Output of power station
- (6)
- Power of pump stationwhere is storage capacity of the reservoir m in period t (108 m3); , , and represent inflow runoff, outflow runoff and water-transferred flow of reservoir m in period t, respectively (m3/s); is water level of SHK reservoir in period t(m); is dead water level of SHK reservoir (m); and is the highest water level of SHK reservoir (m), mainly including flood control level in flood season and normal high water level in non-flood season. is the maximum transferable quantity of water of Han River in period t (108 m3); is outflow of hydropower station m in period t; is the maximum outflow of hydropower station m (m3/s); is average transfer flow in Qinling tunnel in period t; is the maximum water transfer capability of Qinling tunnel (m3/s); is output of hydropower station m in period t; is installed capacity of the hydropower station m; and represent output in dry season and guaranteed output of the HJX hydropower station, respectively (MW); is power consumption of the pump station m in period t; and is installed capacity of the pump station m. All variables are non-negative.
3.3. Feasible Search Space
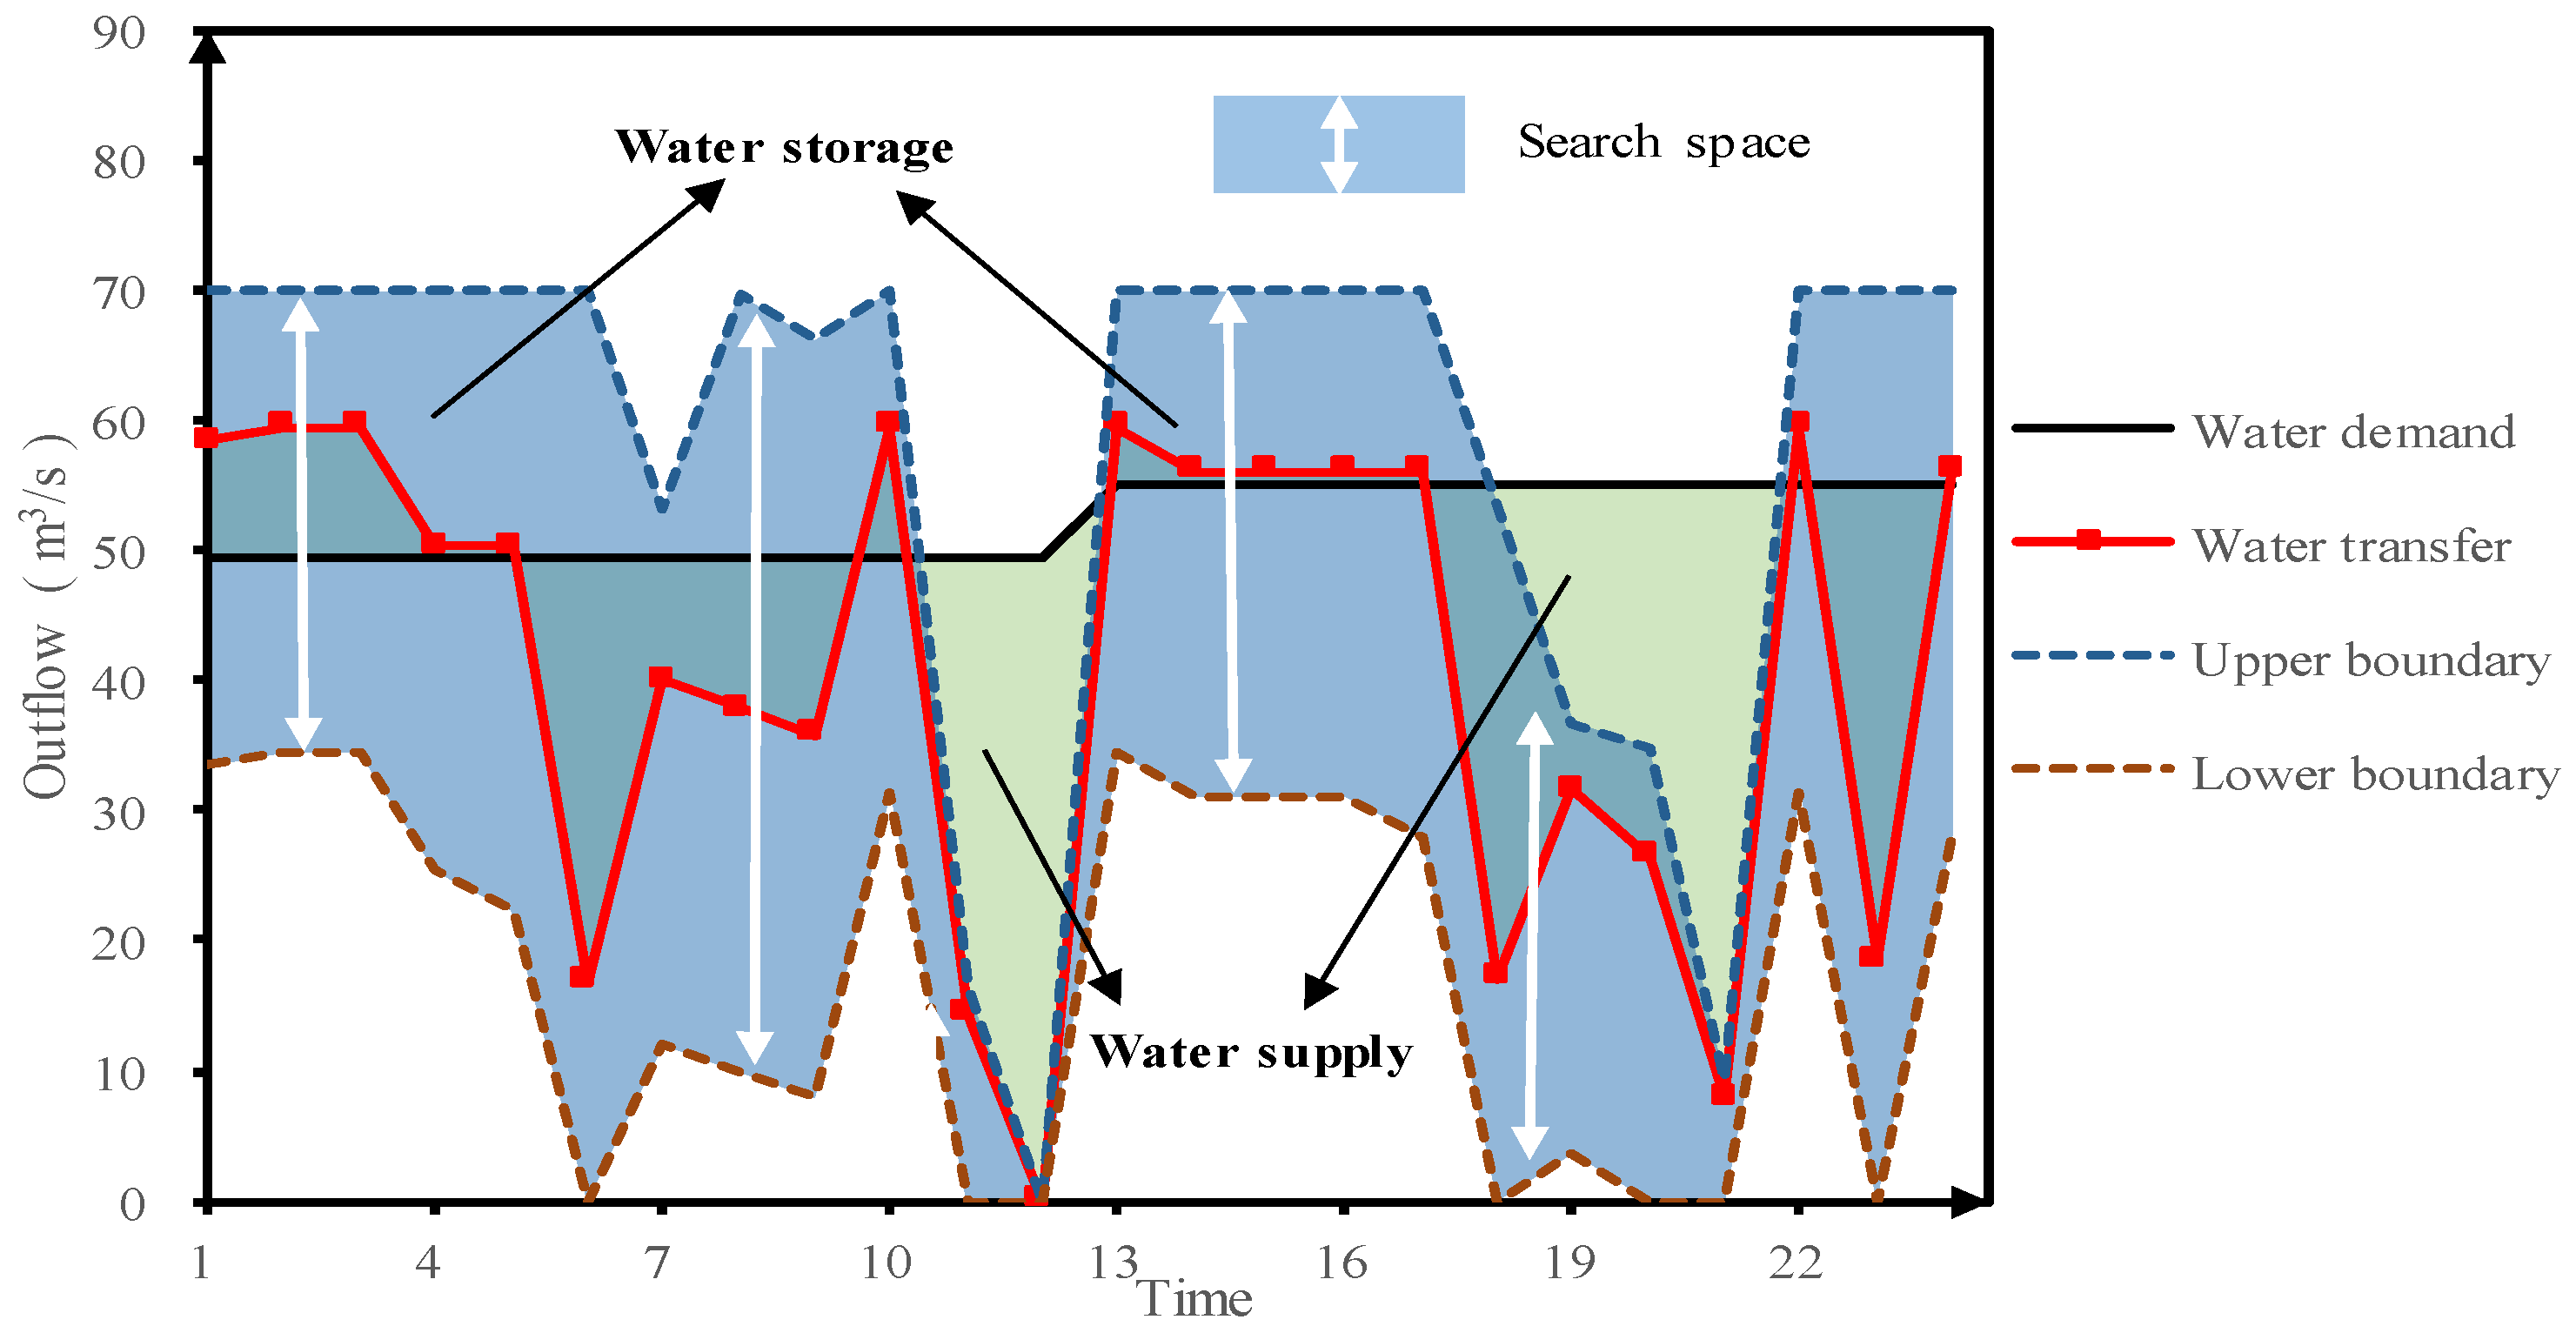
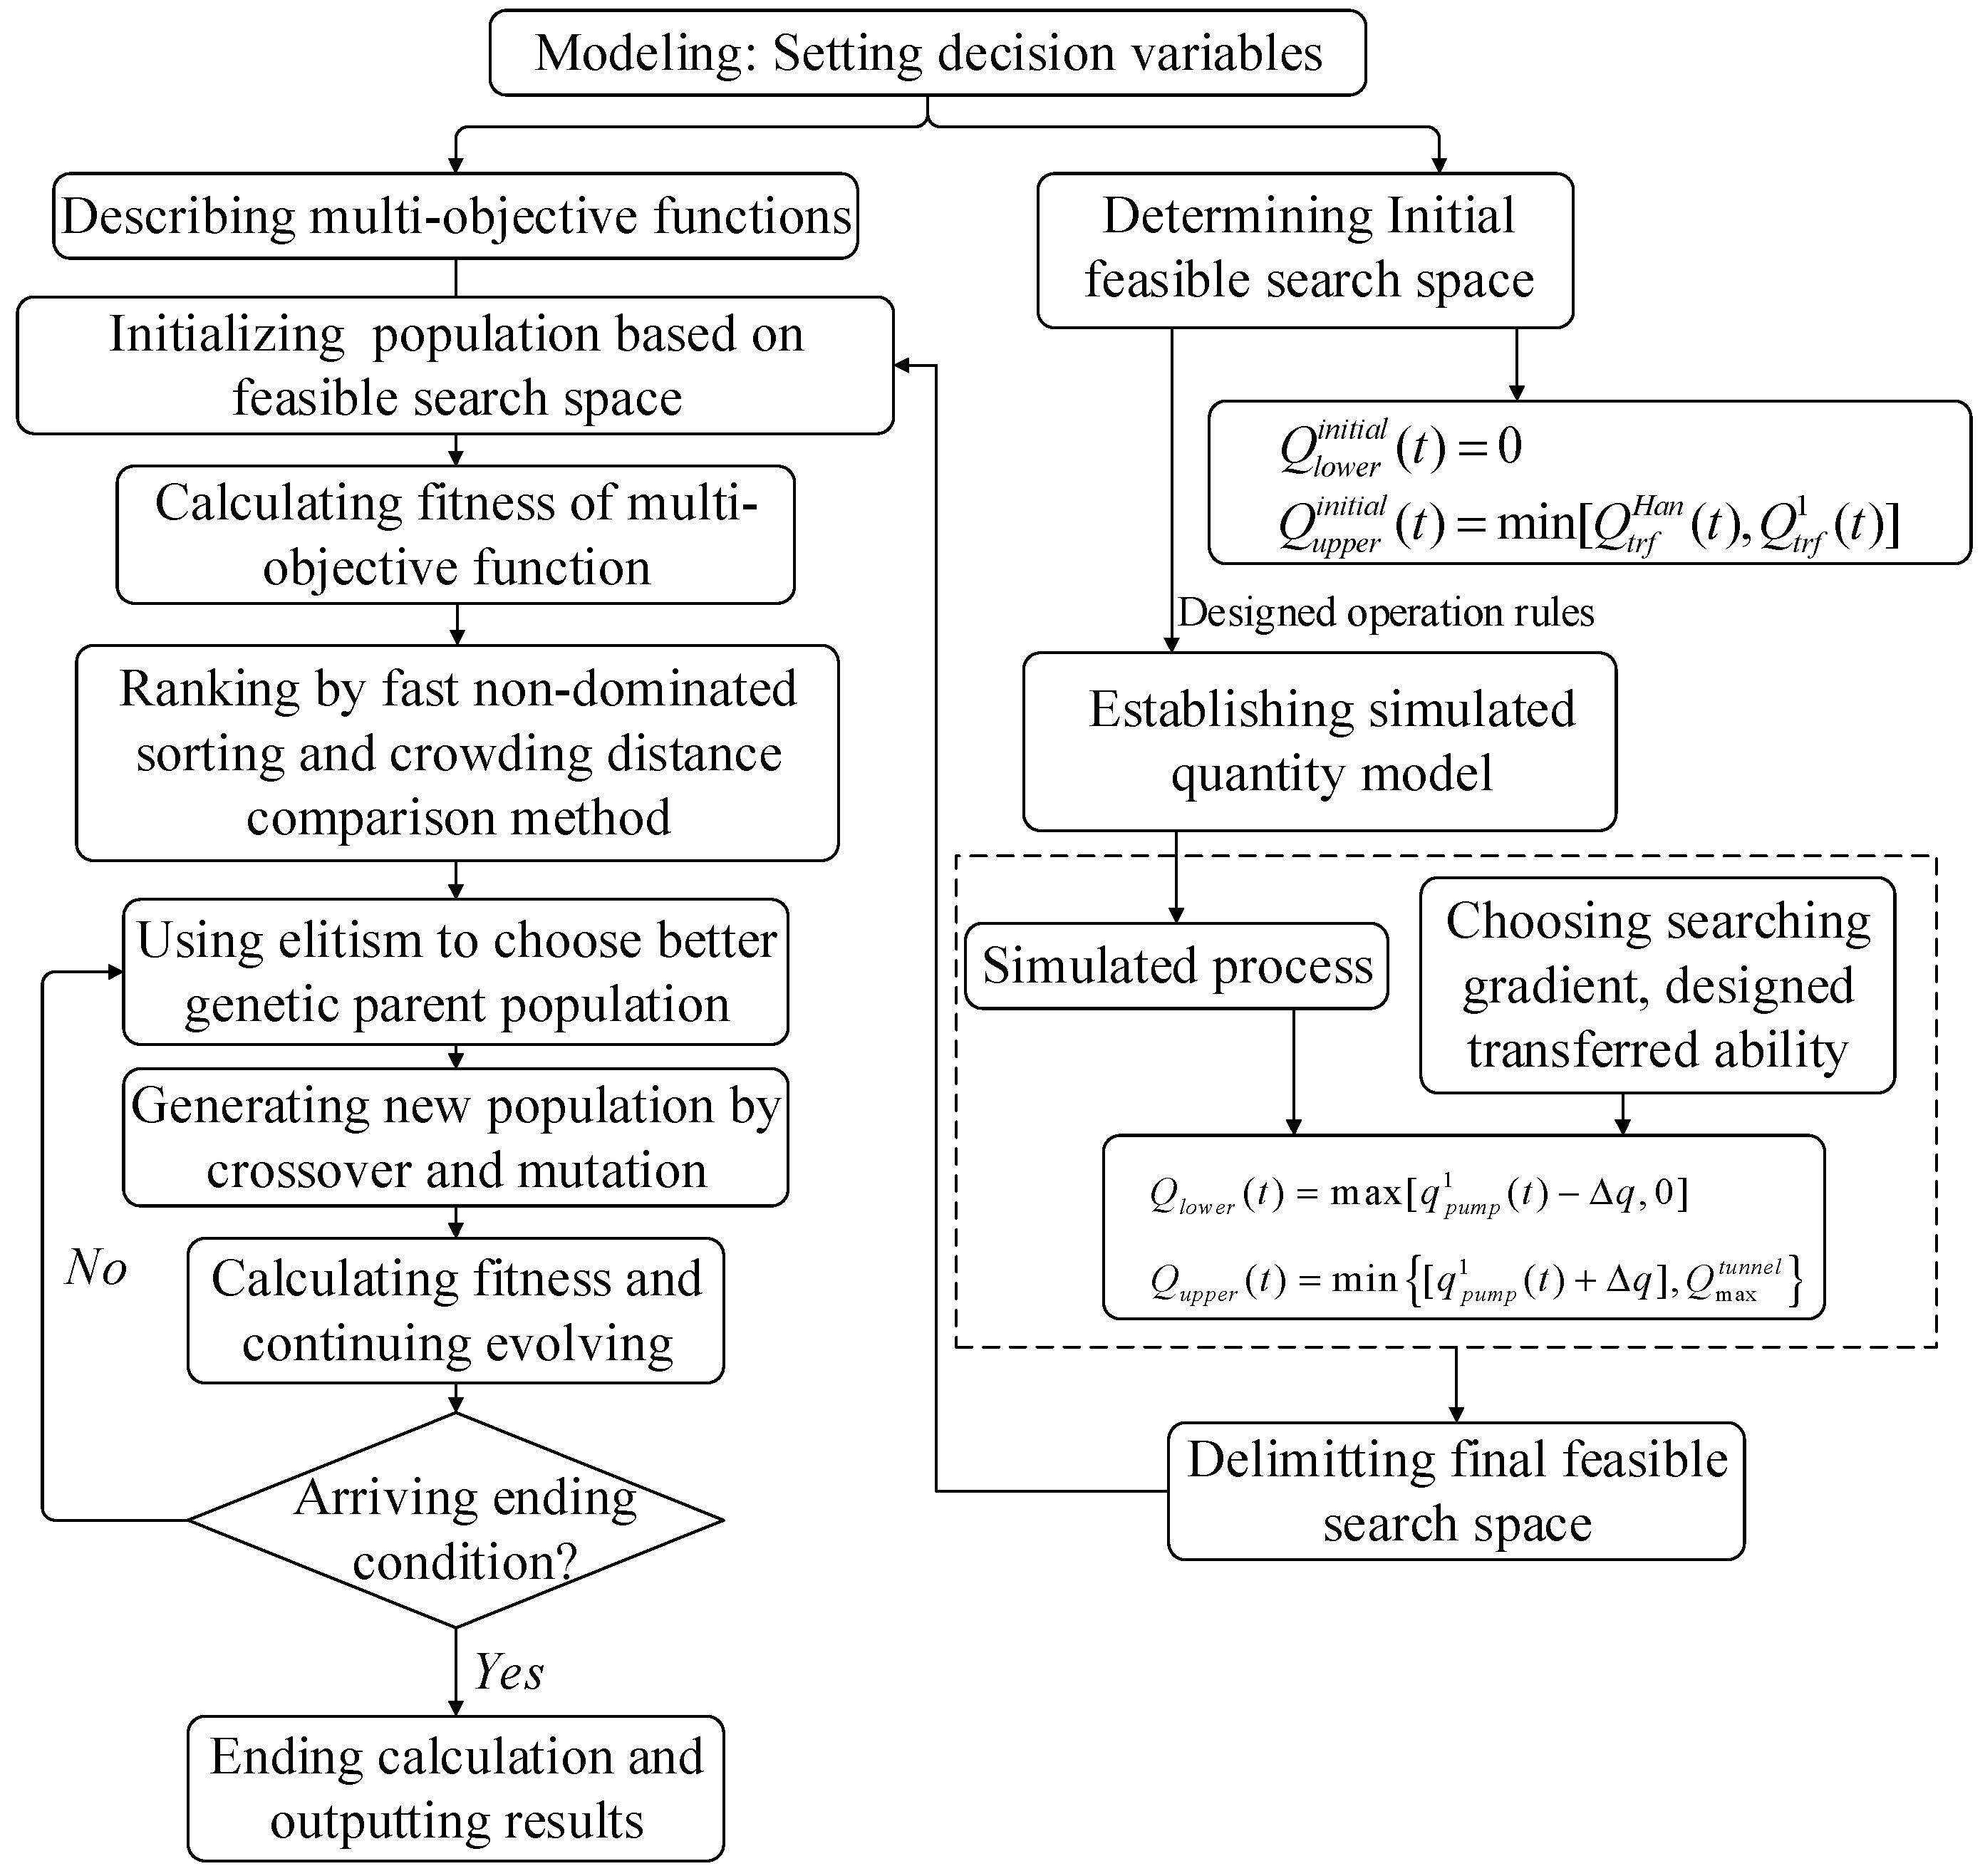
When evolutionary algorithms (EAs) are applied in optimal models with multi-dimensional variables, the large search space may reduce search efficiency [30]. Moreover, an unreasonable evolutionary direction may yield local optimal solutions [31] instead of a globally optimal one Therefore, to better apply MOEAs to reservoir optimal operation models, a feasible search space that considers the characteristics of the IBWT project is proposed as an improved NSGA-II to solve the multi-objective model. The improved process can be described as follows:
Step 1: Set decision variables.
As shown in the Project design reports, the Project raises water from HJX, and then SHK decides to store or supply water depending on the water supply quantity of HJX reservoir. Thus, the transfer flows of HJX pump station are set as decision variables, which are different from past research, while the outflows or water levels of the regulating reservoirs are usually set as decision variables. This can reduce the difficulty of satisfying the demand for water, and make full use of the abundant quantity of water in the Han River as well as the storage capacity of SHK reservoir.
Step 2: Determine the range of initial feasible search space.
The initial feasible search space is composed of the upper and lower boundaries of the final adjustable water. The final adjustable water is allowed by the government for the Project. The lower boundaries are all zero. We then compare the adjustable water in the HJX with the designed adjustable water of the Han River, and choose the smaller value in period t as the upper boundary. The adjustable water of HJX is obtained by deducting ecological water and integrated water from the natural runoff:
Step 3: Obtain a search benchmark process.
According to the designed rules of operation rules, the simulated operation model of water quantity is applied to obtain a reasonable water transfer process. The simulated transfer process is used as the search benchmark in the feasible search space for the multi-objective optimal model.
Step 4: Determine the range of feasible search space.
Choose a dynamic searching step size () and combine it with the simulated results to build a temporary search space. Compare the initial and temporary search spaces and determine the upper and lower boundaries of the feasible search space (Figure 4), the delimiting formulae can be described as follows:
where and are the boundaries of the initial feasible search space in periods (m3/s); and are the boundaries of the final feasible search space in (m3/s); is the search step size of the feasible space (m3/s); and are the maximized adjustable waters of Han River and the HJX reservoir in (m3/s), respectively.
3.4. Steps of the Solution and Settings of the Schemes
As mentioned in the Introduction, the MOEAs can reduce the influence of subjective factors for the decision maker in MOPs. The NSGA-II in particular is regarded as an effective and representative algorithm in solving MOPs [32,33]. The procedures of the NSGA-II are as follows: (1) Introduce fast, non-dominant sorting to reduce computational complexity. (2) Use elitism to improve genetic performance and prevent better individuals from getting lost in the evolution. (3) Replace the shared function method with the crowding distance comparison method to maintain the diversity of the population.
As described in Section 3.3, feasible search space techniques are adopted to improve NSGA-II to increase search efficiency and avoid locally optimal solutions, and I-NSGA-II are novel propositions in this paper. The solution steps of the I-NSGA-II are shown in Figure 5.
3.5. Drafting the Operation Chart of Water Supply
Operation chart is one of the most common tools to present reservoir operation rules, and consist of different guide curves and corresponding operation zones [34]. The operation chart has yielded more economic benefits in reservoir operation, and is mainly used in power generation, water supply and flood control. Many scholars have researched and explored operation charts with different features. The operation chart is usually obtained through reverse calculation by using hydrological inflow data from typical previous years. In this paper, an operation chart of water supply is necessary for the reservoir to acquire the maximum efficiency of the Project. Two main methods are used to obtain the operation chart of water supply, including deterministic operation and random operation. In order to response many uncertainties, Matteo Sangiorgio and Guariso [35] proposed an implicit stochastic optimization approach that has extremely flexible functions, such as Artificial Neural Networks (ANN), is used to design release rules for the reservoir management problem solution. Different from that, this study uses deterministic model results to generate the operation chart by statistical method.
The content and composition of operation charts need to be determined according to practical scenarios. In fact, the main operation feature in SHK reservoir is water supply. Thus, five curves are drawn on the operation chart: the maximum storage capacity, the minimum storage capacity, curves of the hedging rule for abandoned water, the combined water supply and basic water supply. The detailed method can be described as follows.
Choose a point in the Pareto front as operation scheme and analyze its corresponding results, including the water level of the SHK and three water-transferred processes: from the HJX to the intake area, from the SHK to the intake area, and from the HJX to the SHK.
- (1)
- The maximum storage capacity: this is determined by design data of the maximum water level in flood season and maximum water level in non-flood season.
- (2)
- The minimum storage capacity: this is decided by design data of dead water level.
- (3)
- The hedging rule curve for abandoned water: this is decided by the outsourcing line composed of the initial water level for each month in the abandoned water year during long time series data.
- (4)
- The hedging rule curve for combined water supply: this is determined by the outsourcing line composed of the initial water level of each month in the year of SHK pump stations operation involved during long time series data.
- (5)
- The hedging rule curve for basic water supply: this is decided by the outsourcing line composed of the initial water level of each month in the year, in this situation, water demand can’t be satisfied and only the SHK reservoir supplies.
4. Results and Discussion
This section provides the conclusions of eight schemes, the simulated and optimal results are provided in sequence.
4.1. Simulation Model (Scheme 1)
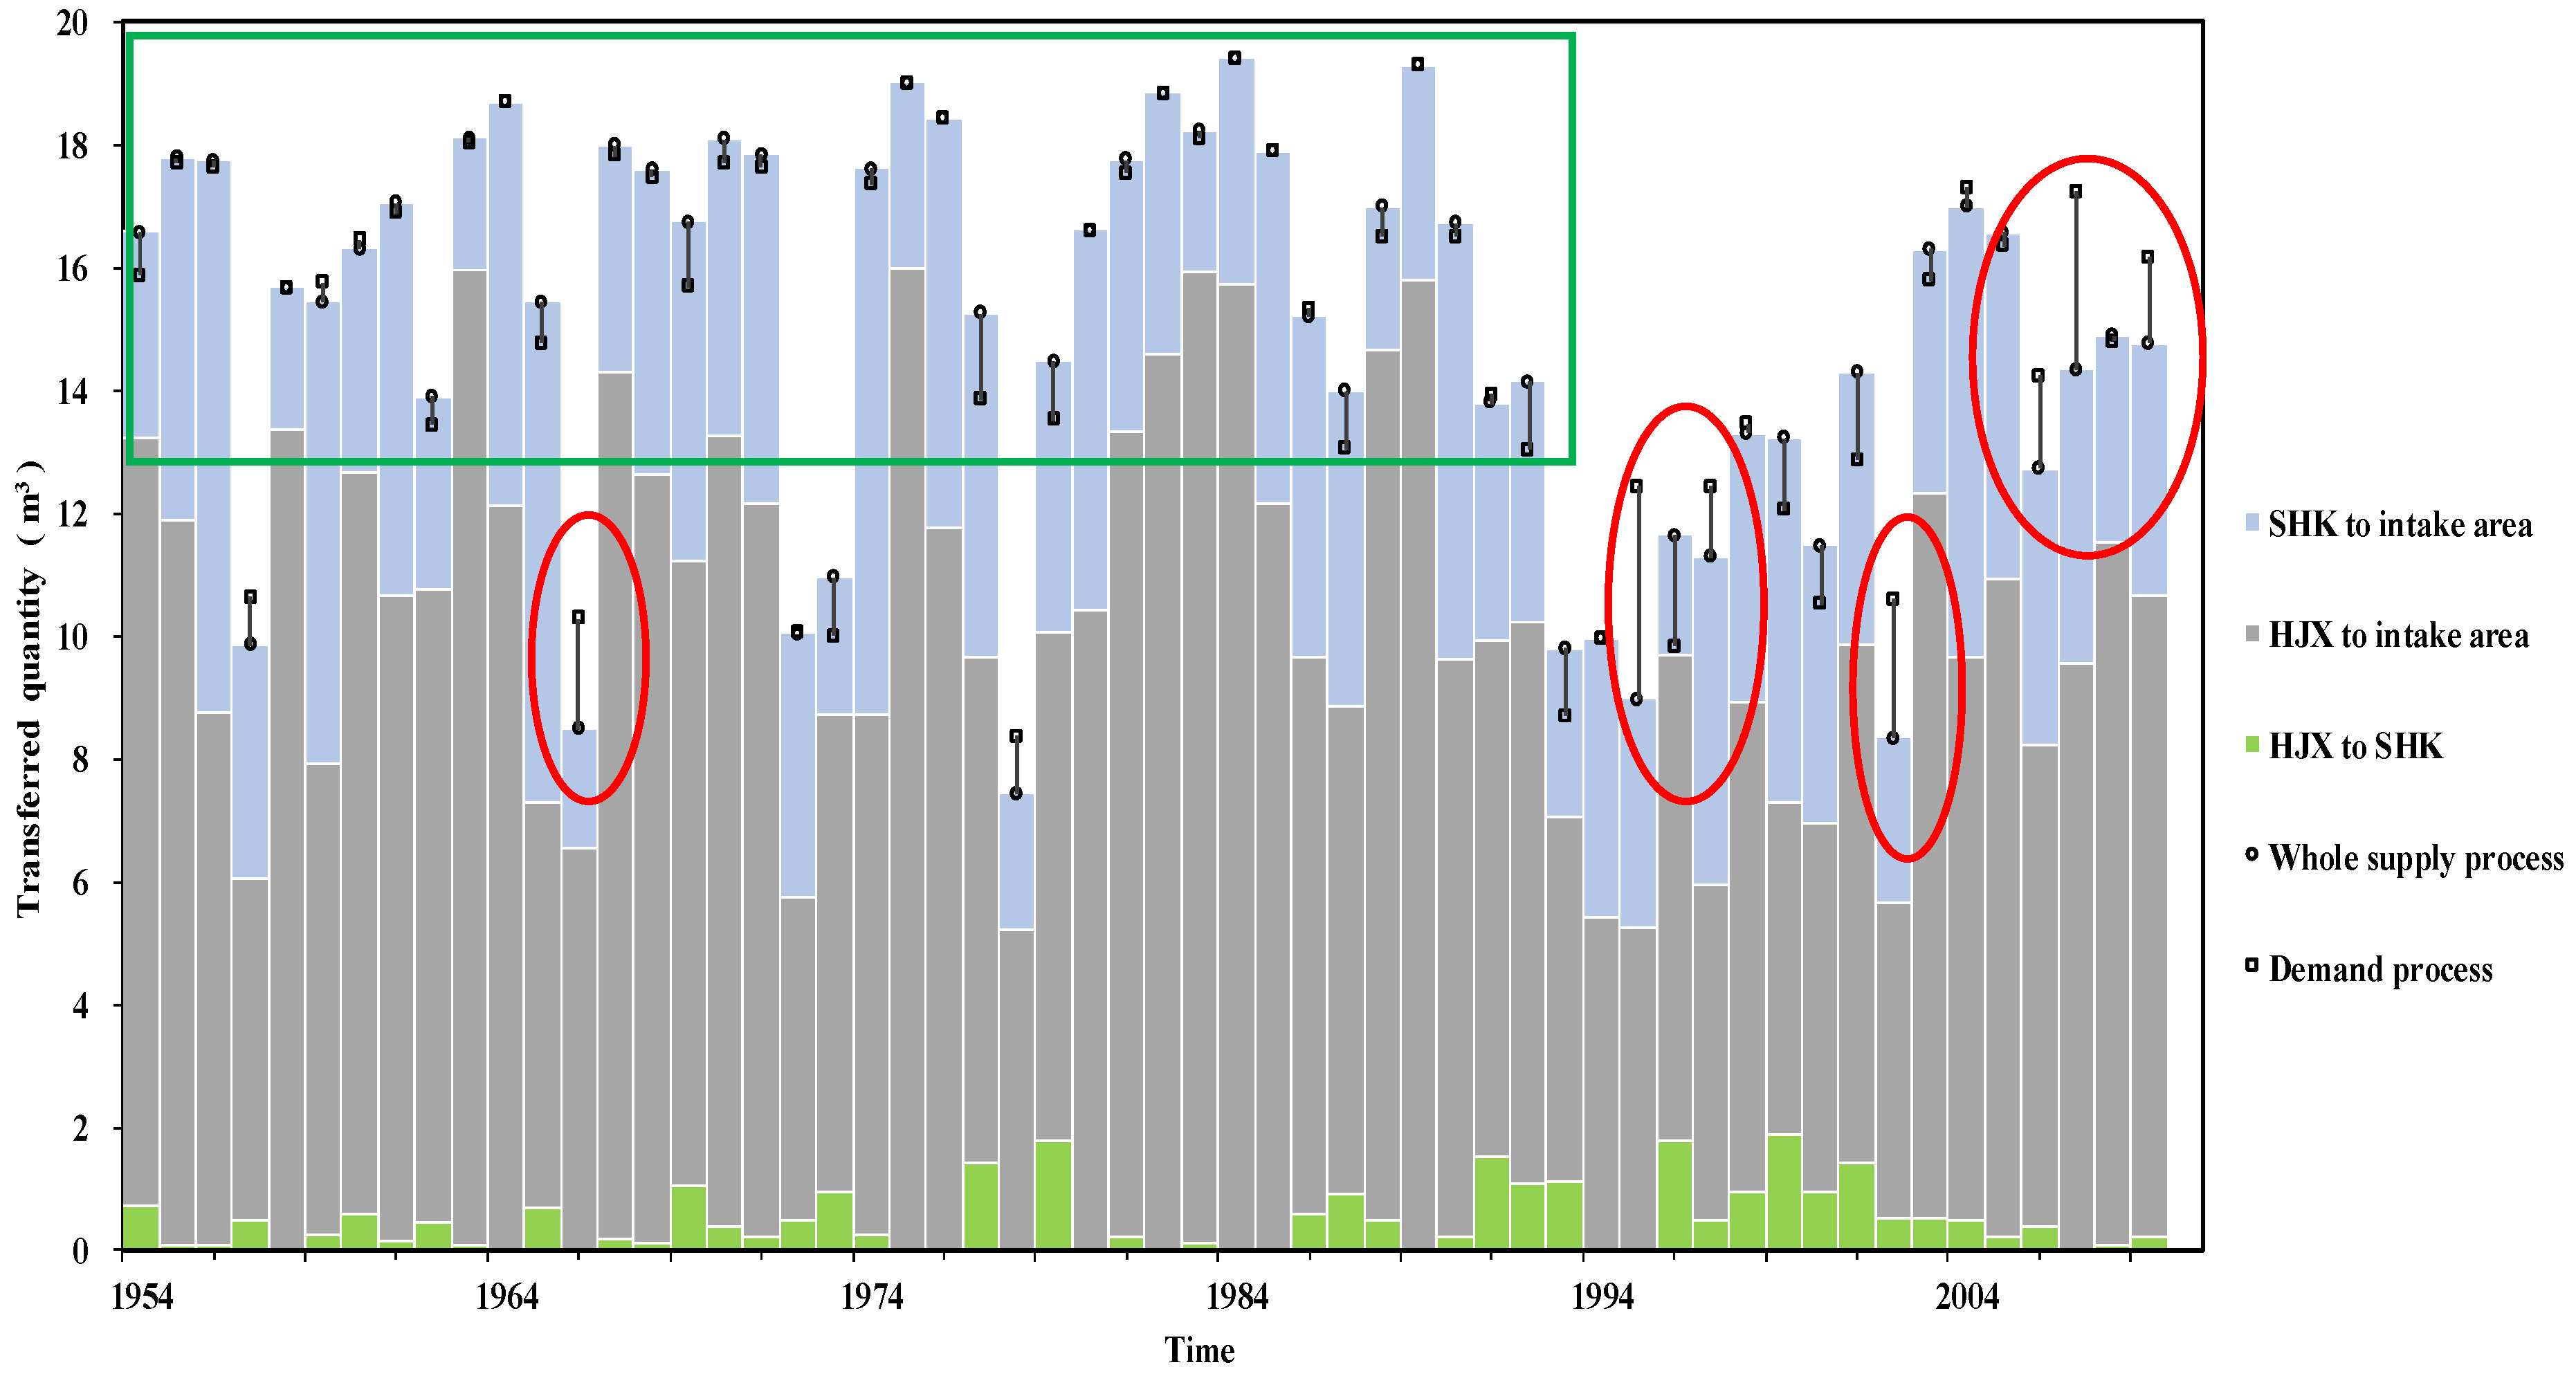
The specific values of the quantity of water transferred, power generation, and energy consumption in scheme 1 are listed in Table 4. The three water transfer processes used in the simulated operation are shown in Figure 6, representing the process from the SHK to the intake area, and from the HJX to the intake area and the SHK, respectively.
In scheme 1, the total quantity of water is equal to the designed value for the Project. Similarly, HJX supplies most of the transferred quantity of water (gray part in Figure 6). Moreover, water transferred from HJX to the intake area increases by 1.41% and that from SHK to the intake area decreased by 1.88%. At the same time, the change in the quantity of water for the HJX and SHK causes corresponding, slight changes in power generation and energy consumption. The total power decreases by 0.58% and total energy consumption increases by 2.97%, and this is mainly influenced by the increased quantity of water from HJX. The rate of guaranteed water-supply of the Project is 82.4% according to the results of the simulated model, superior to the designed guaranteed rate of 50%. Only in eight years—1995–2009, marked in red rings in Figure 6, of the historical data considered—is the demand for water not met. The inflow of Han River also decreases during this time. Considering uncertainty in the undefined rules of operation for building the Project, the change of rate is relatively small, and the proposed simulation model is feasible. Therefore, the simulated results show that the operational framework and parameters are close to the practical situation, and the simulated operational framework and parameters can be used in the multi-objective model.
The results of the multi-objective model are detailed in the following, and include the improvement in the I-NSGA-II and the best Pareto front in different search spaces.
4.2. Improvement in NSGA-II (Schemes 2 and 3)
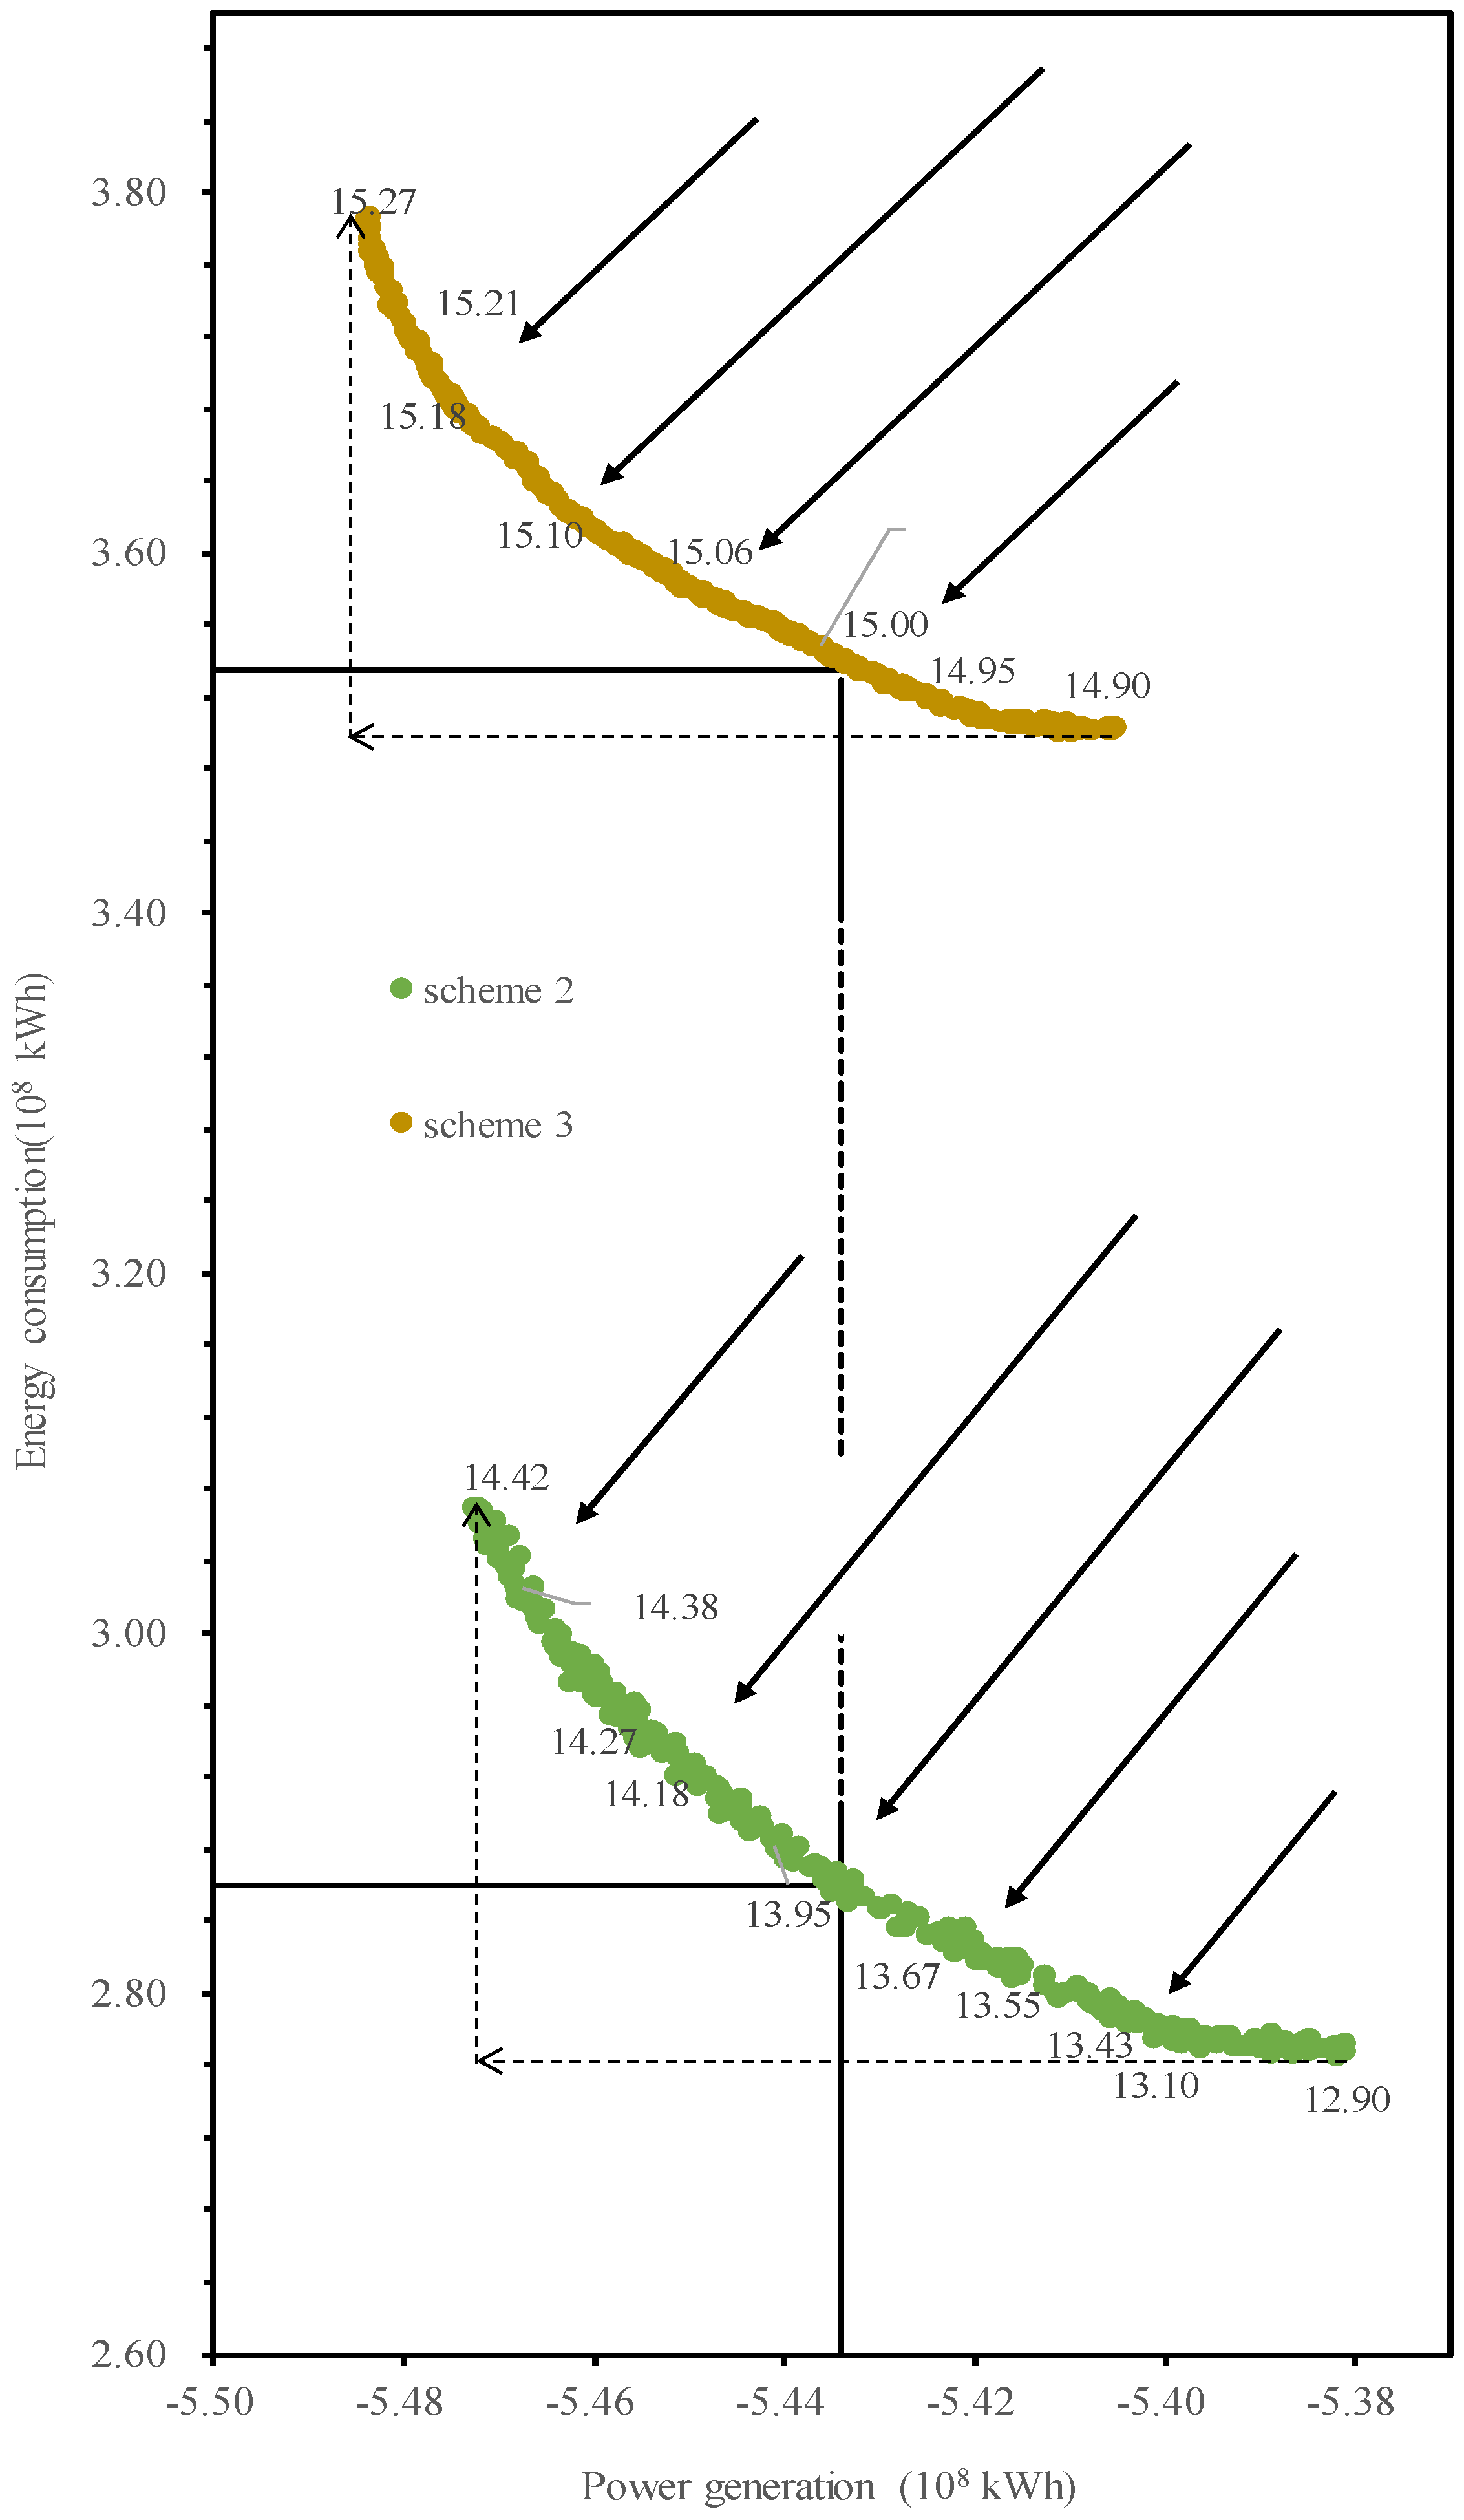
The Pareto front is usually regarded as the main evaluation index of the results of multi-objective models, and two Pareto curves are shown in Figure 7. Time and accuracy were chosen to estimate the model solved by the NSGA-II and I-NSGA-II, respectively. Water supply is regarded as the most important task of the Project. Thus, the evaluation criterion of the accuracy of two algorithms is whether the water supply met or exceeded demand. Statistics suggest that: (1) the time needed to solve schemes 2 and 3, respectively, is 396 and 429 s. (2) The qualified rate of Pareto points satisfying water quantity of schemes 2 and 3 are 0% and 94%, respectively.
As shown in Figure 7, (1) the negative trend of the two Pareto curves indicates that the multi-objective model is feasible, with an increase in values along the X-axis and a decrease of those along the Y-axis. (2) The largest volume of water in scheme 2, 14.42 × 10⁸ m3, could not satisfy the demand for intake areas. On the contrary, most of the results for scheme 3 satisfies demand. The absolute value of the slope of the Pareto curve of scheme 2 is 0.33, greater than that of 0.27 for scheme 3. This means that the accuracy of the results and speeds of are better with a smaller search space, which is also intuitive. (3) Power generation and energy consumption are positively correlated in the results of the model, in contrast to the mathematical conclusion in (1) above, where they appear to be inversely proportional. This is an odd result: with an increase in the volume of transferred water, both energy consumption and power generation increase. However, according to experience, the greater water quantity is transferred, the smaller power generates.
By inspecting and analyzing the fitness functions of the optimal model, the paper finds that the water quantity plays a pivotal role in the direction of evolution of power generation and energy consumption. According to the designed scale, an average adjustable water volume of 1.5 billion m3 can be annually transferred by the Project. Transferring more water and increasing net power generated under the constraint of adjustable water is thus a critical decision for management. Significantly, this appears to obey a preliminary rule, and is explored in greater detail below.
When HJX pump station of operates, it needs energy to lift water in the reservoir to the Qinling tunnel, and causes the HJX outflow decrease. Compared with the maximum designed the generator sets flow, this reduced outflow may influence power generation. If the outflow is still more than the maximum designed generating flow, this implies that an increase in transferred water quantity has no influence on power generation, whether or not water is pumped. Otherwise, the increase in transferred water influences power generation. In contrast to the operation of the HJX pump station, the SHK supplies gravity-driven flow to the Qinling tunnel without energy consumption, where this flow could also generate power for the SHK power station. A review of the characteristics of the Project shows that the cascade power generation is mainly driven by the SHK outflow, and the water sources of the SHK constitute its natural inflow and HJX reservoir’s supply. Therefore, the water quantity transferred from HJX and SHK reservoirs to the intake area determine cascade power generation, where different composition ratios can cause varying operating conditions. It becomes clearly that the composition ratio of the water transferred is a key factor, which the ratio is the proportion of each reservoir that undertakes water transfer. This critical value of this ratio is necessary to reveal the mechanism of system optimization. This is calculated by collecting and analyzing the results of previous multi-objective models to determine the critical value of transferred water, and extracting key scheduling rules:
- (1)
- In the design of the Project, if the average annual transferred quantity of water is 1.5 billion, the best water transferred ratio is one where the HJX reservoir transferred approximately 0.8–0.9 billion m3 and the SHK reservoir approximately 0.6–0.7 billion m3.
- (2)
- The HJX reservoir should undertake the main task of transferring water in flood season to the intake area and the SHK reservoir, and the pumping flow of the HJX pump station is better controlled at around 50 m3/s if the adjustable water is sufficient in volume.
- (3)
- The SHK pump station is better at reducing operating frequencies and time to save energy. Once the SHK pump station begins operating, it meant the HJX pump station has consumed energy to lift water to the SHK reservoir. The highest volume of water transferred from HJX to SHK is 0.05–0.08 billion m3.
- (4)
- The SHK reservoir should increase water supply to reduce abandoned water in flood season and avoid drastic fluctuations in the water level.
As shown in Figure 7, when power generation is kept constant along the Y-axis, the quantity of water in scheme 3 is larger than in scheme 2, and energy consumption increases concurrently. The efficiency of computation in all search spaces is slightly higher than in the limited search space, but a relatively large search space increases the difficulty of finding populations that could satisfy the demand for water of the intake area. Taken together, the initial populations of the algorithm and limited computing ability have a significant influence on the multi-evolutionary algorithm. Thus, a feasible search space is useful in finding optimal solutions.
The following section describes the search step size chosen to build a better feasible search space.
4.3. Feasible Search Space in I-NSGA-II (Schemes 3~9)
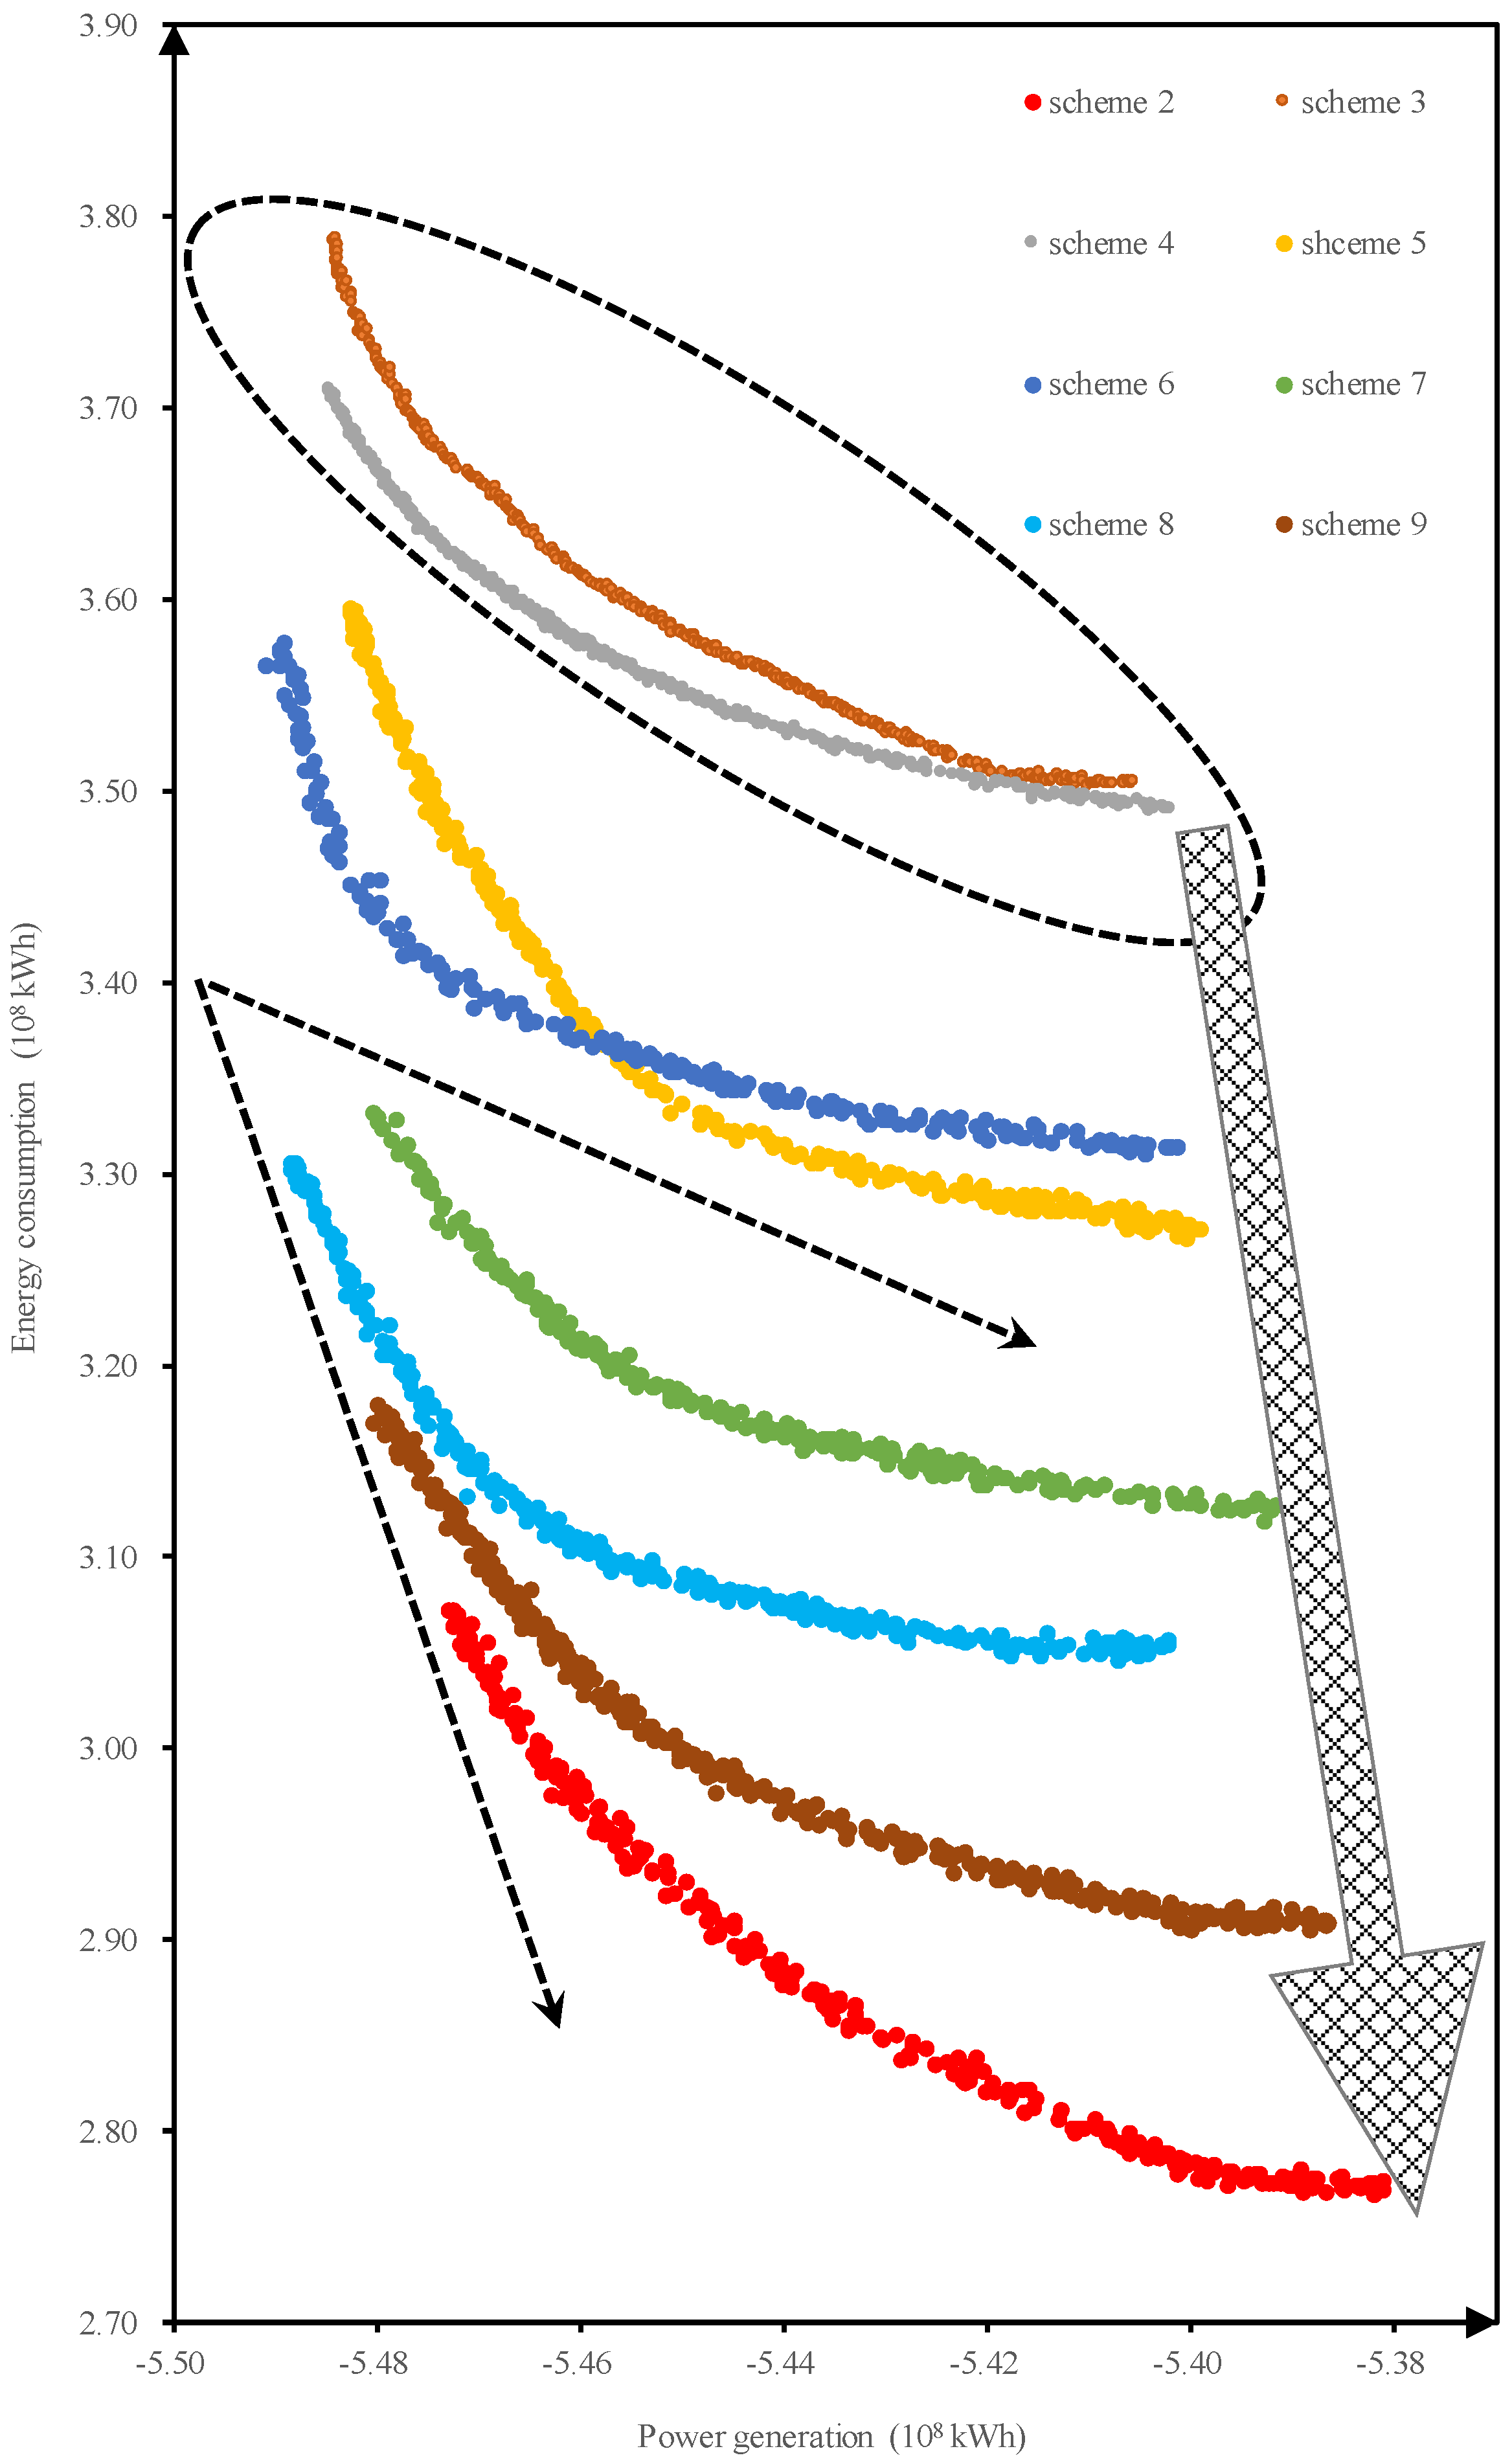
Section 4.2 shows that the I-NSGA-II has a satisfactory ability to find a solution under conditions of limited computation. The best feasible search space that can achieve more optimal results requires further research. Therefore, seven schemes were used with different search step sizes and solved by I-NSGA-II in the multi-objective model, and the best search step size is determined by comparing the locations of eight Pareto fronts, checking whether the results met their own constraints, and evaluating the processes on non-dominated solution sets. Detailed parameters of these schemes are shown in Table 3. As in Figure 7, eight Pareto curves were used to assess different search step sizes of the search space in Figure 8.
As shown in Figure 8, all Pareto curves are consistent with rules of the multi-objective model. The Pareto curves in schemes 3 to 9 move to the lower right when the search step size increases from 5 to 60 m3/s, and the Pareto curves from schemes 4 to 9 are above scheme 2 and under scheme 3. The curve of scheme 4 is very close to that of scheme 3, and this results from similar and small search galleries based on close search step size. From results of the quantity of water, only schemes 3 and 4 meet the water demand.
In summary, the progressive change in the Pareto curves is mainly caused by the gradual increase in the search space, which is caused by the gradual increase in the search step size. We classify and analyze the reservoirs operation processes corresponding to the points on the Pareto curves. Pareto points that do not meet water demand all resulted from the pumping flow of the pump station of the HJX reservoir. Once the pumping flow of the station is too small at time t, there is a chain reaction in the SHK reservoir. If the SHK reservoir has enough adjustable water, it begins supplying water to the GuanZhong area to meet demand; otherwise, it could only meet part of the demand. However, the worst case is that HJX might have abandoned water in flood season. Similarly, if the pumping flow of the HJX station is too large, it affects power generation, especially in drought season. Moreover, the water level of the SHK reservoir is continuously high, and some water is abandoned at some time during the flood season. If these similar situations appear continuously, they must influence the water transferred and power generation deeply and directly. These reasons further show that choosing proper search step sizes to build a feasible search space combined with the simulated results is necessary for the optimal model.
If decision makers choose the best search step size by the position of the Pareto curves, scheme 4 in Figure 8 is the most appropriate, because the constraints on it are all met and energy consumption is lower than in scheme 3. The final results of the optimization model are as crucial as the corresponding operation process. The Water Shortage Index (WSI) is thus used to evaluate the deviation in the optimal operation process and water demand. It can be expressed as follows:
where is value of WSI, and is water demand process of the intake area in period t. The other symbols have the same meanings as in Section 3.
The Pareto curves contain hundreds of non-dominated solution points, and the decision makers can choose the one operation process as a strategy that can satisfy their needs. Two individuals were chosen from schemes 3 and 4, named scheme 3-1 and scheme 4-1, respectively, to further estimate model optimization. Moreover, the total water transferred by the chosen individuals should be equal to or greater than 1.5 billion m3. We compared schemes 3-1 and 4-1 with scheme 1, and analyzed the relative rate of change (referred hereafter to as “R”) of the model’s objective value, especially the WSI. The values are listed in Table 5.
The data in Table 5 suggest that the WSI in schemes 3-1 and 4-1 decrease compared with that of scheme 1 based on satisfying the demand for water. This means that the operational processes of the optimal solutions are better than the simulated results. According to the WSI, scheme 4-1 (Δq = 10 m3/s) is more suitable for demand than scheme 3-1 (Δq = 5 m3/s). An examination of their corresponding search spaces indicates that restricting their widths would influence the genetic manipulation of individual genes. When the space is too small at time t, this means that the value of the individual gene is stable in the evolutionary iteration, and it adds the difficulties and requirements before time (t − 1). Moreover, the range of the search space fluctuates excessively at time t and (t + 1), which causes the value of the gene to easily become unstable. Therefore, it is suitable to choose 10 m3/s as search step size to build the search gallery in solving this model from the perspective of water supply.
The result would be different if decision makers choose the search step size by comparing schemes from the perspective of energy. In addition to the benefits of water supply, the power generation and energy consumption of the Project should be considered. As the pie charts of three schemes show in Figure 9, the net power of scheme 3-1 increases by 0.64 and 0.41 billion kWh compared with schemes 1 and 4, respectively, which results from the water transferred quantity composition ratio of the HJX and SHK reservoirs. Moreover, the values of power generation and energy consumption are consistent with the distribution of the water transfer quantity composition ratio, which is feasible in the context of empirical values. If the on-grid price of power generation is RMB 0.2 yuan/kWh and the price of electricity for the operation of the pump station is RMB 1 yuan/kWh, scheme 3-1 yields a profit of RMB 33 million yuan more than scheme 4-1. Therefore, it is more efficient for the hydropower station from the perspective of energy to choose 5 m3/s as search step size to build the search gallery in this model and to meet water demand.
There are different options of search step size for the trade-off between water supply and net electricity consumption, because it is necessary to consider the practical conditions of the Project. One particularly important feature is that there is no reservoir in the intake area to operate and allocate the transferred water, which is transported directly to different waterworks. This feature also makes the Project operate and manage more challengingly. According to the government’s plan, the price of the transferred water will be RMB 2–3 yuan/m3, and this will promote economic development and increase revenue by RMB 50 billion yuan. The average WSI of the Pareto points in scheme 4-1 is 5.31%, which can ensure water safety in the intake area. In summary, we chose a search step size of 10 m3/s to build the search gallery in this multi-objective model.
Previous results verify the feasibility of the model framework and confirm the method of solution. The operation charts of the Project are used as reference for its future operation.
4.4. Operation Chart of the Project
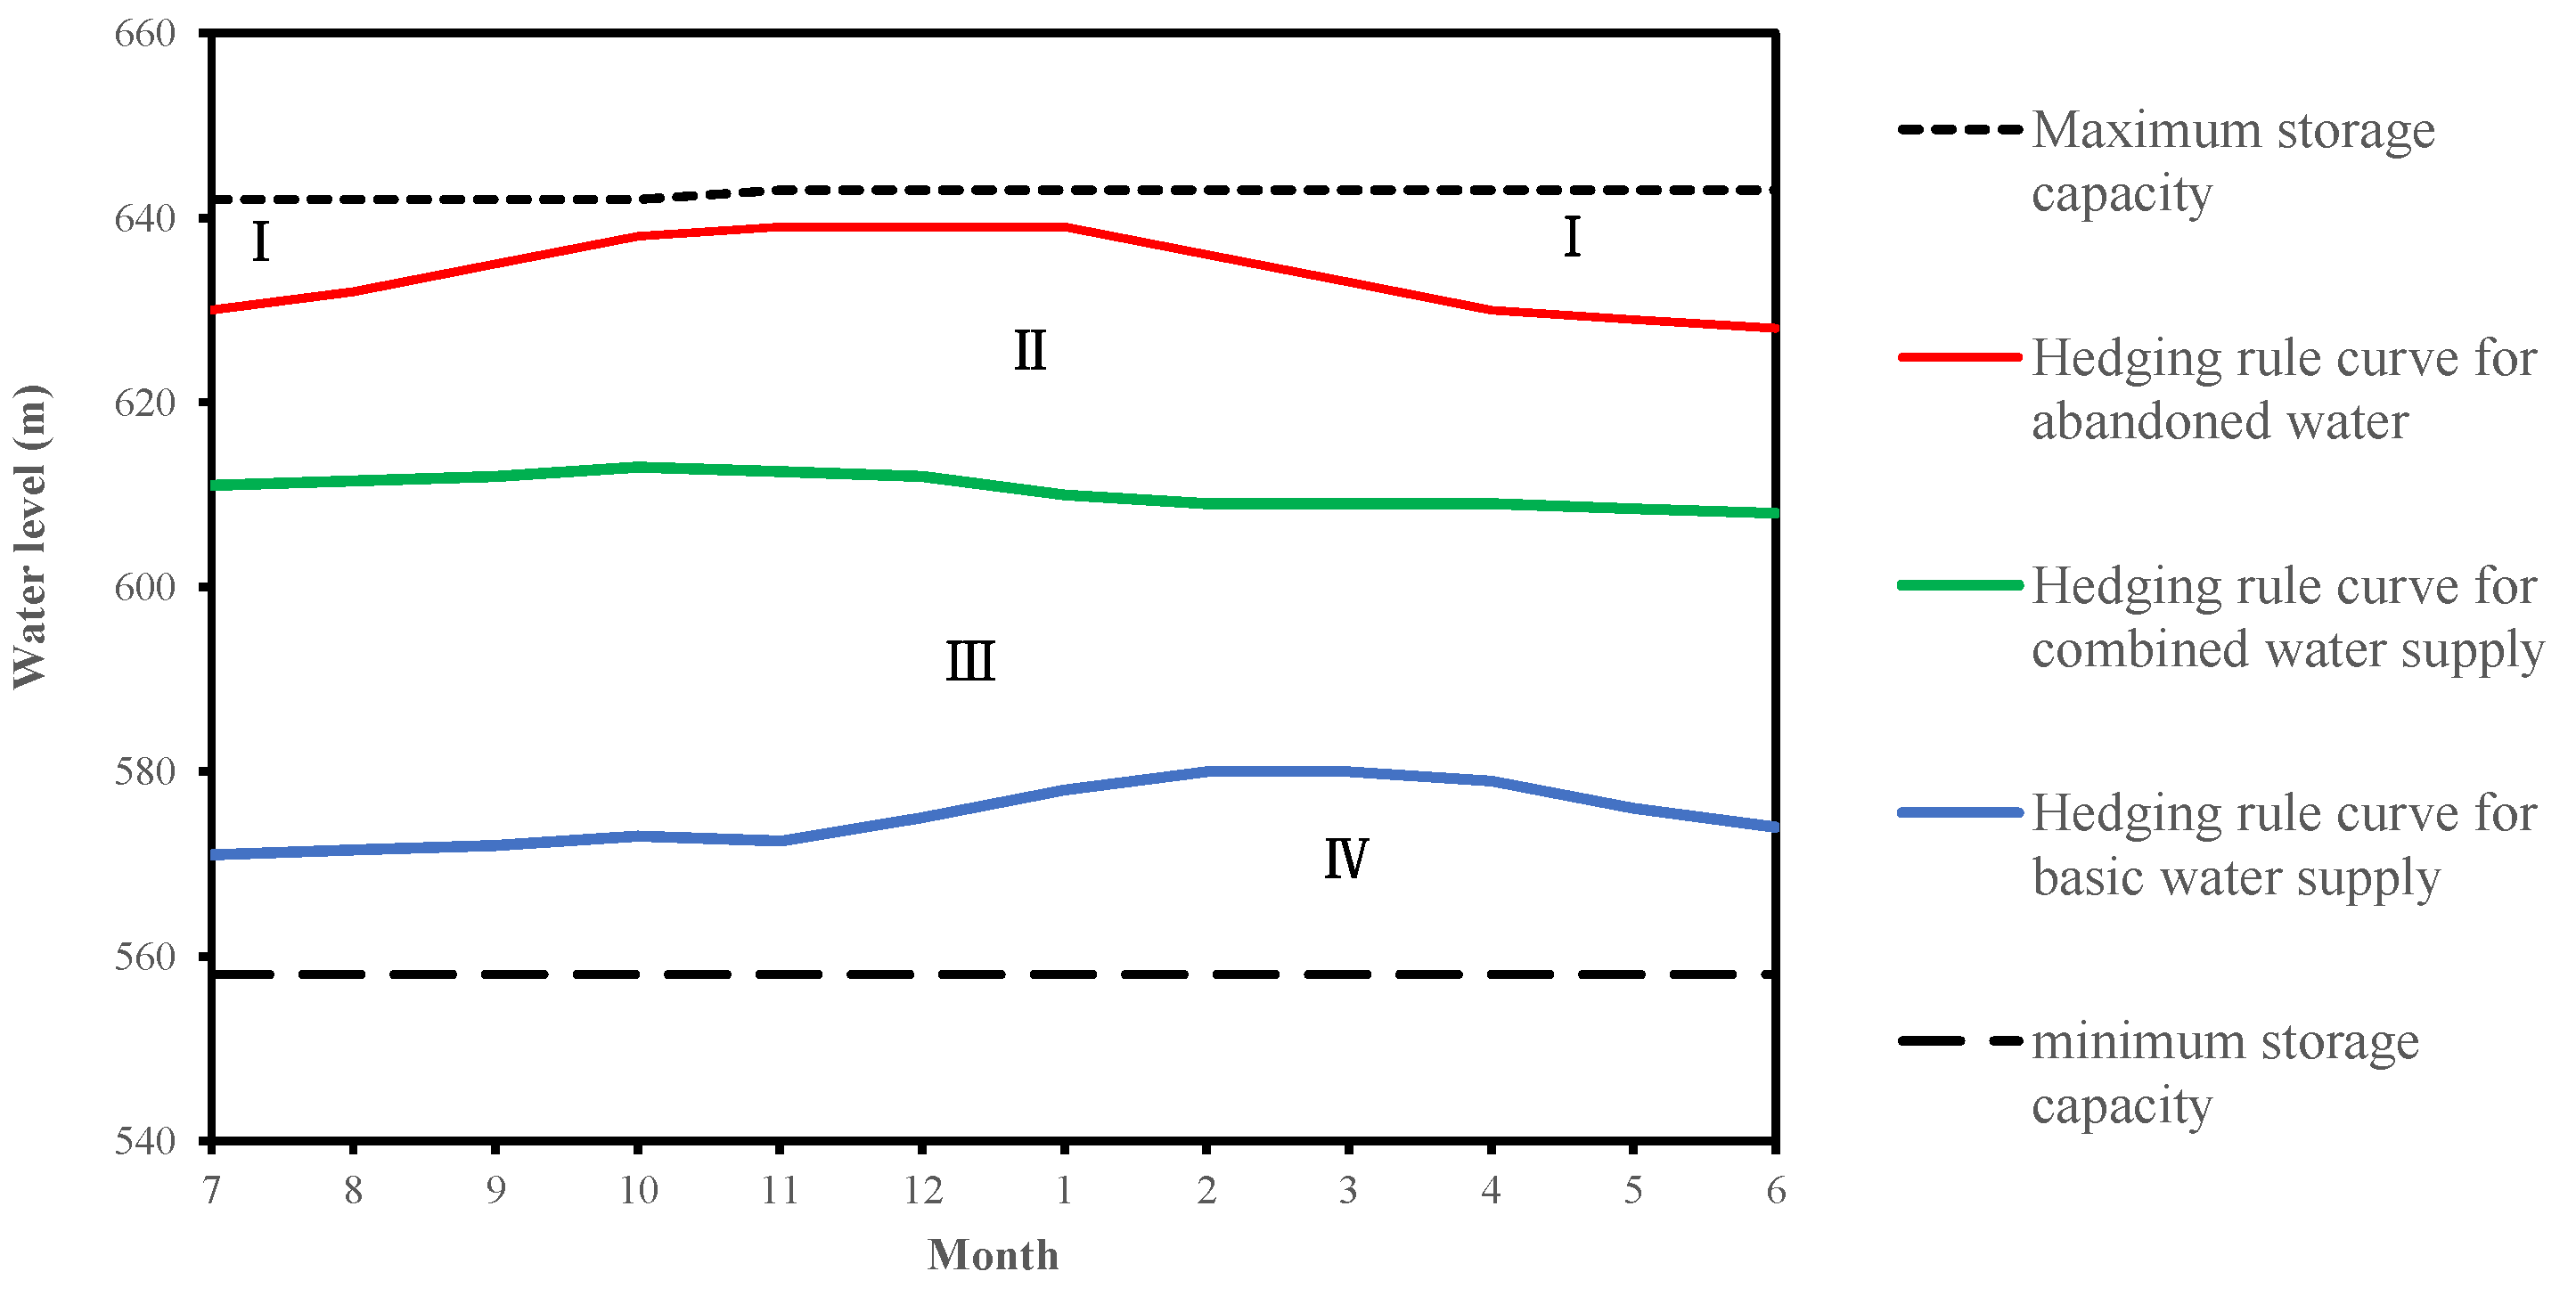
Different Pareto points represent different combinations of objective interests. This means that different operation charts with different decision factors should be drafted to provide to decision makers. Based on the above research, scheme 4-1 was chosen to draft the operation chart (Figure 10) as described in Section 3.5. The selected point in scheme 4 mainly considers the quantity of water in the middle of the Pareto front and is listed as an example to show the operational rules summarized from multi-objective, non-inferior solution sets.
As shown in Figure 10, the entire operation chart is divided into four parts and the rule of operation of each part can be described as follows:
(1) Part I
This part is defined as the operation area used to prevent the occurrence of abandoned water. If the water level of the SHK reservoir at time t is in this location, in order to save energy, the SHK reservoir is regarded as the first water source to supply and its pump station would not operate in this situation. At the same time, the HJX reservoir would be regarded as an auxiliary water resource. If SHK met the demand of the Guanzhong area, the pump station of HJX would not need to operate, otherwise, HJX would start supply.
(2) Part II
This part is defined as the operational guarantee area of the combined water supply. If the water level of the SHK reservoir at time t is at this location, it would have been regarded as the first water source, with its pump station supplying to the Guanzhong area and the SHK reservoir as much as possible. Unless water in HJX is not sufficient, the SHK reservoir would start to supply it. In this part, the Project should meet the water demand of the Guanzhong area.
(3) Part III
This part is defined as the control operation area of combined water supply. In this part, the HJX and SHK reservoirs would supply to the Guanzhong area, and the former HJX reservoir stopped to supply to the latter. The water supply of the Project could not meet demand according to the modified ratios set by the decision makers.
(4) Part IV
This part is defined as the water supply operation area with the minimum capacity. Both HJX and SHK reservoirs supply to this part according to their minimum capacities. HJX stops to supply to the SHK reservoir.
5. Conclusions
Complex MOEAs with large numbers of dimensions and partially optimized solutions have reduced their scope of application for managers and increased operational difficulties in reservoir management. Therefore, it is useful to find an easy-to-operate, scientific and feasible solution method. The Project is taken as the research object in this study to develop such a method. A simulation model of water quantity is built to clarify and verify the relationship between system nodes. Based on the model, a multi-objective model of power generation, energy consumption and the volume of water supply is established, and the NSGA-II algorithm is chosen to solve the problem. A feasible search space is then built based on practical constraints, such as the volume of adjustable water, and the degree of influence of the feasible search space on multi-target results is verified. Finally, based on a non-dominant solution, a water supply operation chart is established, and operational rules are extracted. The primary conclusions are as follows:
- (1)
- The simulation results show that the operational framework in this paper is superior to other models designed under the same initial conditions. Therefore, it can be applied to subsequent research.
- (2)
- Setting a reasonable feasible search space with the NSGA-II can help find better optimal solutions. With the same influence of the initial populations of the algorithm and limited computing ability, the qualified rate of the I-NSGA-II is much higher than that of the NSGA-II.
- (3)
- It is determined that 10 m3/s is the most suitable search step size value for the feasible search space in this case study. Power generation, energy consumption, rate of guaranteed water supply and the WSI of intake area should all be regarded as factors of evaluation to determine the search step size. A very large or too small feasible search space affects the optimization results.
- (4)
- It is useful to manage water resources of large-scale IBWT projects in combination with the specific characteristics of the projects, especially under strict constraints of government regulation and the interests of all parties. If the Project operates as shown in Figure 10, it can both meet the demand for water and ensure the optimal conversion of energy in the system according to the needs of the decision makers.
The paper reports basic research on MOEAs and reservoir operation. We hope that the rapid development of optimization algorithms can be combined with empirical scenarios in engineering operation so that managers can apply them. Additionally, power generation and energy consumption are balanced in the Pareto curve, and all the above rules are based on meeting the demand of the intake area for water. Thus, rules concerning power generation and energy consumption are executed simultaneously with those for the transfer of water. Our future work in the area will emphasize the differences in rules pertaining to power generation and energy consumption in the non-dominant solutions along the X- and Y-axes of the Pareto front.
Author Contributions
Conceptualization, T.B. and Q.H.; methodology, T.B. and L.W.; Data curation, J.W.; investigation, X.L.; resources, T.B.; writing—original draft preparation, L.W.; writing—review and editing, T.B. and L.W.; supervision, Q.H.; project administration, Q.H.; funding acquisition, T.B. and Q.H.
Funding
This study is supported by the National Key R&D Program of China (2017YFC0405900), the National Department Public Benefit Research Foundation of Ministry of Water Resources (201501058), Planning Project of Science and Technology of Water Resources of Shaanxi (2017slkj-16, 2017slkj-27), the China Postdoctoral Science Foundation (2017M623332XB), the Postdoctoral Research Funding Project of Shaanxi Province (2017BSHYDZZ53), and the Basic Research Plan of Natural Science in Shaanxi Province (2018JQ5145).
Acknowledgments
The authors are indebted to the reviewers and editors for their valuable comments and suggestions.
Conflicts of Interest
The authors declare no conflict of interest.
References
- Lawford, R.G.; Marx, S. Earth Observations and the Water-Energy-Food Security Nexus. In Proceedings of the AGU Fall Meeting, San Francisco, CA, USA, 9–13 December 2013. [Google Scholar]
- Zhang, C.; Chen, X.; Li, Y.; Ding, W.; Fu, G. Water-Energy-Food Nexus: Concepts, Questions and Methodologies. J. Clean. Prod. 2018, 195, 625–639. [Google Scholar] [CrossRef]
- Zhang, F.; Wang, Y.; Chu, Y.; Gao, B.; Yue, Q.; Yang, Z.; Li, Q. Reduction of Organic Matter and Trihalomethane Formation Potential in Reclaimed Water from Treated Municipal Wastewater by Coagulation and Adsorption. Chem. Eng. J. 2013, 223, 696–703. [Google Scholar] [CrossRef]
- Ho, Y.C.; Luh, P.B.; Zheng, Y.P.; Wu, J.M. Incentives in Production: A Case Study. IEEE Trans. Autom. Control 1988, 33, 227–237. [Google Scholar] [CrossRef]
- Elimelech, M.; Phillip, W.A. The Future of Seawater Desalination: Energy, Technology, and the Environment. Science 2011, 333, 712–717. [Google Scholar] [PubMed]
- Akron, A.; Ghermandi, A.; Dayan, T.; Hershkovitz, Y. Interbasin Water Transfer for the Rehabilitation of a Transboundary Mediterranean Stream: An Economic Analysis. J. Environ. Manag. 2017, 202, 276–286. [Google Scholar] [CrossRef] [PubMed]
- Jain, S.K.; Agarwal, P.K.; Singh, V.P. Inter-Basin Water Transfer; Cambridge University Press: Cambridge, UK, 2007; pp. 1065–1109. [Google Scholar]
- Ghassemi, F.; White, I. Inter-Basin Water Transfer: Case Studies from Australia, United States, Canada, China and India; Cambridge University Press: Cambridge, UK, 2007. [Google Scholar]
- Zhang, Y.; Dong-Hui, L.V. Feasibility of Building “Water Bank” for the South-to-North Water Transfer Project by Studying California Case. South-North Water Transf. Water Sci. Technol. 2007, 1, 26–28. [Google Scholar]
- Manshadi, H.D.; Niksokhan, M.H.; Ardestani, M. A Quantity-Quality Model for Inter-Basin Water Transfer System Using Game Theoretic and Virtual Water Approaches. Water Resour. Manag. 2015, 29, 4573–4588. [Google Scholar]
- Wang, G.L.; Liang, G.H.; Cao, X.L.; Zhou, H.C. Negotiation-based multi-objective and multi-person optimal decision making model for inter-basin water transfer schemes. J. Hydraul. Eng. 2010, 41, 624–629. [Google Scholar]
- Matete, M.; Hassan, R. Integrated Ecological Economics Accounting Approach to Evaluation of Inter-Basin Water Transfers: An Application to the Lesotho Highlands Water Project. Ecol. Econ. 2007, 60, 246–259. [Google Scholar]
- Guo, X.; Hu, T.; Zhang, T.; Lv, Y. Bilevel Model for Multi-Reservoir Operating Policy in Inter-Basin Water Transfer-Supply Project. J. Hydrol. 2012, 424, 252–263. [Google Scholar] [CrossRef]
- Zhou, H.C.; Liu, S.; Cheng, A.M.; Zhang, C.B. Joint Operation of Water Transfer-Supply for the Reservoir in Intake Area during Inter-Basin Water Transfer. J. Hydraul. Eng. 2013, 39, 883–891. [Google Scholar]
- Zeng, X.; Hu, T.; Guo, X.; Li, X. Water Transfer Triggering Mechanism for Multi-Reservoir Operation in Inter-Basin Water Transfer-Supply Project. Water Resour. Manag. 2014, 28, 1293–1308. [Google Scholar] [CrossRef]
- Jamshid Mousavi, S.; Anzab, N.R.; Asl-Rousta, B.; Kim, J.H. Multi-Objective Optimization-Simulation for Reliability-Based Inter-Basin Water Allocation. Water Resour. Manag. 2017, 31, 3445–3464. [Google Scholar] [CrossRef]
- Abido, M.A. Multiobjective Evolutionary Algorithms for Electric Power Dispatch Problem. IEEE Trans. Evol. Comput. 2006, 10, 315–329. [Google Scholar] [CrossRef]
- Zhou, A.; Zhang, Q. Are All the Subproblems Equally Important? Resource Allocation in Decomposition-Based Multiobjective Evolutionary Algorithms. IEEE Trans. Evol. Comput. 2016, 20, 52–64. [Google Scholar] [CrossRef]
- Alizadeh, M.R.; Nikoo, M.R.; Rakhshandehroo, G.R. Hydro-Environmental Management of Groundwater Resources: A Fuzzy-Based Multi-Objective Compromise Approach. J. Hydrol. 2017, 551, 540–554. [Google Scholar] [CrossRef]
- Reddy, M.J.; Kumar, D.N. Optimal Reservoir Operation Using Multi-Objective Evolutionary Algorithm. Water Resour. Manag. 2006, 20, 861–878. [Google Scholar] [CrossRef] [Green Version]
- Bai, T.; Chang, J.X.; Chang, F.J.; Huang, Q.; Wang, Y.M.; Chen, G.S. Synergistic Gains from the Multi-Objective Optimal Operation of Cascade Reservoirs in the Upper Yellow River Basin. J. Hydrol. 2015, 523, 758–767. [Google Scholar] [CrossRef]
- Reddy, M.J.; Nagesh Kumar, D. Multi-Objective Particle Swarm Optimization for Generating Optimal Trade-Offs in Reservoir Operation. Hydrol. Process. 2010, 21, 2897–2909. [Google Scholar] [CrossRef]
- Wang, X.; Chang, J.; Meng, X.; Wang, Y. Research on Multi-Objective Operation Based on Improved Nsga-ii for the Lower Yellow River. J. Hydraul. Eng. 2017, 48, 135–145. [Google Scholar]
- Zhao, G.; Mu, X.; Tian, P.; Wang, F.; Gao, P. Climate Changes and their Impacts on Water Resources in Semiarid Regions: A Case Study of the Wei River Basin, China. Hydrol. Process. 2012, 27, 3852–3863. [Google Scholar] [CrossRef]
- Zhao, J.; Huang, Q.; Chang, J.; Liu, D.; Huang, S.; Shi, X. Analysis of Temporal and Spatial Trends of Hydro-Climatic Variables in the Wei River Basin. Environ. Res. 2015, 139, 55–64. [Google Scholar] [CrossRef]
- Chang, J.; Li, Y.; Wang, Y.; Yuan, M. Copula-Based Drought Risk Assessment Combined with an Integrated Index in the Wei River Basin, China. J. Hydrol. 2016, 540, 824–834. [Google Scholar] [CrossRef]
- Li, S.; Gu, S.; Liu, W.; Han, H.; Zhang, Q. Water Quality in Relation to Land Use and Land Cover in the Upper Han River Basin, China. Catena 2008, 75, 216–222. [Google Scholar] [CrossRef]
- Zhu, K.; Zhang, Y. South-to-North Water Diversion Project in China. Phys. Rev. A 2008, 60, 982–985. [Google Scholar]
- Savenije, H.H.G. The Runoff Coefficient as the Key to Moisture Recycling. J. Hydrol. 1996, 176, 219–225. [Google Scholar] [CrossRef]
- Toğan, V.; Daloğlu, A.T. An Improved Genetic Algorithm with Initial Population Strategy and Self-Adaptive Member Grouping. Comput. Struct. 2008, 86, 1204–1218. [Google Scholar]
- Li, M.; Yang, S.; Li, K.; Liu, X. Evolutionary Algorithms with Segment-Based Search for Multi objective Optimization Problems. IEEE Trans. Cybern. 2013, 44, 1295–1313. [Google Scholar] [CrossRef] [PubMed]
- Deb, K.; Pratap, A.; Agarwal, S.; Meyarivan, T. A Fast and Elitist Multi objective Genetic Algorithm: NSGA-I. IEEE Transact. Evol. Comput. 2002, 6, 182–197. [Google Scholar] [CrossRef]
- Li, H.; Zhang, Q. Multi objective Optimization Problems with Complicated Pareto Sets, MOEA/D and NSGA-II. IEEE Trans. Evol. Comput. 2009, 13, 284–302. [Google Scholar] [CrossRef]
- Chang, J.; Wang, X.; Li, Y.; Wang, Y.; Zhang, H. Hydropower Plant Operation Rules Optimization Response to Climate Change. Energy 2018, 160, 886–897. [Google Scholar] [CrossRef]
- Sangiorgio, M.; Guariso, G. NN-Based Implicit Stochastic Optimization of Multi-Reservoir Systems Management. Water 2018, 10, 303. [Google Scholar] [CrossRef]
Figure 1.
Schematic diagram of the Hanjiang to Wei River Water Diversion Project, the green arrow indicates the direction of the water flow.
Figure 1.
Schematic diagram of the Hanjiang to Wei River Water Diversion Project, the green arrow indicates the direction of the water flow.

Figure 2.
Layout of water resource area of the Project in China.

Figure 3.
Distribution characteristics of average annual inflow runoff.

Figure 4.
The upper and lower boundaries of feasible search space.

Figure 5.
Solution steps flowchart of the improved Non-dominated Sorting Genetic Algorithm-II (I-NSGA-II).
Figure 5.
Solution steps flowchart of the improved Non-dominated Sorting Genetic Algorithm-II (I-NSGA-II).

Figure 6.
Water transfer process of Huangjinxia reservoir (HJX) and Sanhekou reservoir (SHK) in scheme 1.
Figure 6.
Water transfer process of Huangjinxia reservoir (HJX) and Sanhekou reservoir (SHK) in scheme 1.

Figure 7.
The Pareto front solved by NSGA-II and I-NSGA-II, the number mark on the Pareto point represents the amount of water supply.
Figure 7.
The Pareto front solved by NSGA-II and I-NSGA-II, the number mark on the Pareto point represents the amount of water supply.

Figure 8.
Eight Pareto curves of search space with different search step sizes.

Figure 9.
Comparison of water supply, power generation and energy consumption in different schemes (combined with Table 5).
Figure 9.
Comparison of water supply, power generation and energy consumption in different schemes (combined with Table 5).

Figure 10.
Operation chart of SHK reservoir.


Table 1.
Parameters of the water source areas of the Project in China.
| Items | Units | HJX | SHK | ||||
|---|---|---|---|---|---|---|---|
| Reservoir | Power Station | Pump Station | Reservoir | Power Station | Pump Station | ||
| Regulating storage | 108 m3 | 0.92 | - | - | 7.10 | - | - |
| Inflow | 108 m3 | 66.36 | - | - | 8.61 | - | - |
| Regulation ability | - | Daily | - | - | Multi-year regulating | - | - |
| Normal high water level | m | 450 | - | - | 643 | - | - |
| Flood control level | m | 448 | - | - | 642 | - | - |
| Dead water level | m | 440 | - | - | 558 | - | - |
| Working head | m | - | 36.5 | 104.5 | - | - | 97.7 |
| Installed capacity | MW | - | 135 | 126 | - | 60/40 | 20 |
| Firm power | MW | - | 0.86 | - | - | - | - |
| Maximum outflow | m3/s | - | 435.30 | 70 | 72.71 | - | 18 |
| Ecological flow | m3/s | 25 | - | - | 2.71 | - | - |
Table 2.
Descriptions of schemes used in the IBWT project from Han to Wei.
| Scheme | Δq b | Search Space | Method | Objects |
|---|---|---|---|---|
| 1 | - | All feasible space | Simulated | Water quantity (15) a |
| 2 | - | NSGA-II | Energy consumption Power generation | |
| 3 | Δq = 5 | reference Equations (14) and (15) | I-NSGA-II | |
| 4 | Δq = 10 | |||
| 5 | Δq = 20 | |||
| 6 | Δq = 30 | |||
| 7 | Δq = 40 | |||
| 8 | Δq = 50 | |||
| 9 | Δq = 60 |
Units: a—108 m3; b—m3/s.
Table 3.
Parameters of solution algorithm.
| Parameters | NSGA-II/I-NSGA-II |
|---|---|
| Number of decision variables | 672 |
| Population size | 500 |
| Generation | 1000 |
| Number of objective functions | 3 |
| Mutation probability | 0.2 |
| Crossover probability | 0.4 |
Table 4.
Operation values of the Project in scheme 1.
| Index | Designed | Simulated | ||||||
|---|---|---|---|---|---|---|---|---|
| Wa | Epowerc | Epumpc | Wa | Epowec | Epumpc | |||
| to Intake Area | to SHK | to Intake Area | to SHK | |||||
| HJX | 9.19 | 0.50 | 3.87 | 3.84 | 9.32 | 0.47 | 3.70 | 3.88 |
| SHK | 5.31 | 1.32 | 0.20 | 5.21 | 1.46 | 0.19 | ||
| Total | 15.00 | 5.19 | 4.04 | 15.00 | 5.16 | 4.07 | ||
Units: a—108 m3; c—108 kWh.
Table 5.
Objective values of the model and relative rates of change.
| Objectives | Model | Simulated | Multi Objective Optimized | Relative Change Rate | ||
|---|---|---|---|---|---|---|
| Scheme | 1 | 3-1 | 4-1 | 3-1 | 4-1 | |
| Water Supplying a | HJX to intake area | 9.32 | 7.91 | 8.52 | −15.13% | −8.58% |
| HJX to SHK | 0.47 | 0.51 | 0.58 | +8.51% | +23.40% | |
| SHK to intake area | 5.21 | 6.58 | 5.90 | +26.3% | +13.24% | |
| Total | 15.00 | 15.00 | 15.00 | 0 | 0 | |
| WSI | 10.21% | 6.92% | 3.25% | - | - | |
| Power generation c | HJX power station | 3.70 | 3.90 | 3.78 | +5.41% | +2.16% |
| SHK power station | 1.46 | 1.53 | 1.55 | +4.79% | +6.16% | |
| Total | 5.16 | 5.43 | 5.33 | +5.23% | +3.29% | |
| Energy consumption c | HJX pump station | 3.88 | 3.50 | 3.78 | −9.79% | −2.58% |
| SHK pump station | 0.19 | 0.20 | 0.23 | +5.26% | +21.05% | |
| Total | 4.07 | 3.70 | 4.01 | −9.79% | −2.58% | |
Units: a—108 m3; c—108 kWh.
© 2019 by the authors. Licensee MDPI, Basel, Switzerland. This article is an open access article distributed under the terms and conditions of the Creative Commons Attribution (CC BY) license (http://creativecommons.org/licenses/by/4.0/).
Share and Cite
MDPI and ACS Style
Wu, L.; Bai, T.; Huang, Q.; Wei, J.; Liu, X. Multi-Objective Optimal Operations Based on Improved NSGA-II for Hanjiang to Wei River Water Diversion Project, China. Water 2019, 11, 1159. https://doi.org/10.3390/w11061159
AMA Style
Wu L, Bai T, Huang Q, Wei J, Liu X. Multi-Objective Optimal Operations Based on Improved NSGA-II for Hanjiang to Wei River Water Diversion Project, China. Water. 2019; 11(6):1159. https://doi.org/10.3390/w11061159
Chicago/Turabian StyleWu, Lianzhou, Tao Bai, Qiang Huang, Jian Wei, and Xia Liu. 2019. "Multi-Objective Optimal Operations Based on Improved NSGA-II for Hanjiang to Wei River Water Diversion Project, China" Water 11, no. 6: 1159. https://doi.org/10.3390/w11061159
Note that from the first issue of 2016, this journal uses article numbers instead of page numbers. See further details here.