Article

Community Assembly Mechanisms Underlying the Core and Random Bacterioplankton and Microeukaryotes in a River–Reservoir System

1
Aquatic EcoHealth Group, Key Laboratory of Urban Environment and Health, Institute of Urban Environment, Chinese Academy of Sciences, Xiamen 361021, China
2
University of Chinese Academy of Sciences, Beijing 100049, China
*
Author to whom correspondence should be addressed.
Water 2019, 11(6), 1127; https://doi.org/10.3390/w11061127
Submission received: 16 April 2019 / Revised: 19 May 2019 / Accepted: 24 May 2019 / Published: 29 May 2019
(This article belongs to the Section Water Quality and Contamination)

Abstract

:
Whether bacterioplankton are assembled in the same way as microeukaryotes is a key question that has been answered only partially in microbial ecology. In particular, relating distribution patterns to the underlying ecological processes for plankton communities in highly dynamic ecosystems, such as river–reservoirs subjected to anthropogenic impacts, remains largely unstudied. Here, we analyzed taxonomic distribution patterns, and unraveled community assembly processes underlying the core and random bacterioplankton and microeukaryotes from a subtropical river–reservoir system. These plankton domains were modelled using the spatial abundance distributions (SpADs) of the operational taxonomic units (OTUs) as a proxy for abundant and rare taxa delineation. Both bacterioplankton and microeukaryote plankton communities exhibited significant distance–decay relationships, and samples were grouped depending on reservoir or river habitats. The neutral community model showed that 35–45% of the plankton community variation could be explained by neutral processes. The phylogenetic null model revealed that dispersal limitation accounted for the largest percentage of pairwise comparisons (42–68%), followed by environmental selection (18–25%). We concluded that similar prevalence of ecological processes acting on particular subsets of the bacterioplankton and microeukaryotes might have resulted from similar responses to environmental change, potentially induced by human activities in the watershed.

1. Introduction

Earth’s biogeochemical cycles are regulated by highly diverse microorganisms which provide ecosystem functions and services for humans, animals, and plants [1,2]. Thanks to a decade-long community profiling study via high-throughput sequencing technologies, it is now known that microbial communities exhibit various ecological patterns (e.g., species abundance distributions, distance–decay relationships, species–area relationships) that were previously known only for macroorganisms [3,4,5]. However, the assembly processes by which individual taxa colonize, interact to establish themselves, and maintain local communities for generating regional distribution patterns such as distance–decay, are not well understood in microbial ecology.
Although rivers represent only a very small fraction of Earth’s water resources, they are inhabited by ecologically and functionally important microbial communities that exhibit successions along the river continuum [6,7,8,9,10]. In recent years, anthropogenic activities such as reservoir construction and nutrient pollution in watersheds have challenged traditional views of river ecology by creating heterogeneous but longitudinally connected local habitats [8,11]. These ecosystems offer means to address mounting questions in microbial ecology, as environmental conditions vary gradually along the continuum due to changing landscape and hydrology [12]. In particular, rivers draining small-scale watersheds form a good basis to evaluate determinants of the assembly processes underlying microbial distribution patterns. In fact, they are subject to fewer confounding factors such as climate and soil type changes [8].
Generally, both niche- and neutrally-related processes concurrently drive patterns of microbial compositional turnover. Delineating the relative importance of either process is a central question that has not received much attention in microbial ecology [13,14]. Based on fundamental processes of birth, death, dispersal, and speciation, both niche and neutral processes are not mutually exclusive [15]. For this reason, Vellend [16] proposed a conceptual synthesis that bridges the niche and the neutral theories into four components of ecological processes, namely selection, dispersal, drift, and diversification. Within this mechanistic predictive framework, recent studies have delineated the relative importance of the assembly processes in soils [17], lentic waters, [18,19] and marine ecosystems [20] by using a phylogenetic null model. This model enables the quantification of the interplay between ecological processes involved in the assembly of microbes [21]. To the best of our knowledge, there exist limited studies evaluating the niche and neutral processes in river–reservoir ecosystems.
Microbial communities freely living in water comprise both prokaryotic and eukaryotic plankton (referred to as bacterioplankton and microeukaryotes in this study). Microeukaryotes have cells with a more complex structure than those of bacterioplankton [22]. Their organelles are designed for different functions, allowing them to perform distinct roles, including phototrophy, heterotrophy, parasitism, commensalism, mutualism, symbionts, etc. [22,23]. Microeukaryotes also have the ability to form resting stages, and have differential sinking rates that provide a wide array of responses to environmental heterogeneity. According to the ‘size–plasticity’ hypothesis, smaller organisms such as bacterioplankton are less environment filtered than larger organisms. They are more likely to be plastic in metabolic abilities and have greater environmental tolerance [23]. Therefore, similar or distinct processes may underpin the same or different distribution patterns between bacterioplankton and microeukaryotes, as a result of cell trait differences.
Both bacterioplankton and microeukaryotes typically exhibit a recurrent and skewed structure of species abundance distribution. They are composed of a small number of abundant taxa co-existing alongside a large number of tremendously rare ones, termed the “rare biosphere” [24,25,26]. The rare taxa can act as a reservoir of genetic diversity, carry out metabolic activities, and perform multiple functions despite their low abundances [26]. This view has complemented the old understanding that only the most abundant taxa are important for ecosystem functioning. In line with this, several phenomena, such as inherent trade-offs in life history strategies, dormancy, and biotic interactions, have been identified as key for rarity formation [24,26]. Despite these efforts, however, the operational definition of rarity in microbial ecology is still challenging [27,28]. There exist taxa that constitute a “seed bank,” and may shift from rare to abundant under specific environmental conditions [29]. In other words, rare taxa in some conditions may became dominant at certain occasions [30,31]. Tackling this challenge requires an integrated approach that can give the expected frequency of an individual at each abundance level in terms of relative frequencies [32]. For this reason, Niño-García et al. [27] analogously delineated abundant and rare taxa into “core” and “random” sub-communities by modelling the spatial abundance distributions of individual taxa. They identified groups of taxa with distinct abundance exhibiting contrasting distribution patterns in freshwater boreal ecosystems. Whether these community subsets are structured by similar or distinct assembly mechanisms remains unknown. One expectation would be that the random sub-communities could be governed by niche processes (environmental variable selection) since they include many taxa that may occasionally reach high abundances (bimodal; see Materials and Methods section).
Here, we investigated patterns and processes of bacterioplankton and microeukaryote communities, sampled ten times over the period of five years in a subtropical river–reservoir ecosystem located in southeast China. We aimed to depict the relative importance of community assembly processes structuring bacterioplankton and microeukaryote communities. First, we identified core and random bacterioplankton and microeukaryote sub-communities using SpADs. We then explored these data to see if they responded similarly to environmental change, and depicted the assembly processes by generating their distribution patterns. Overall, we found that dispersal limitation primarily governs the similar distribution patterns observed for the core and random plankton for both bacterioplankton and microeukaryotic communities. Since plankton are passively dispersed by the unidirectional water movement in the studied small-scale system, dispersal seems not to be significantly restricted. Instead, the establishment of individual taxa in new locations was plausibly constrained by local hydrological change induced by anthropogenic activities, such as reservoir construction and urban land expansion in the studied watershed. This was probably the cause of the observed upstream–downstream plankton community decay.

2. Materials and Methods

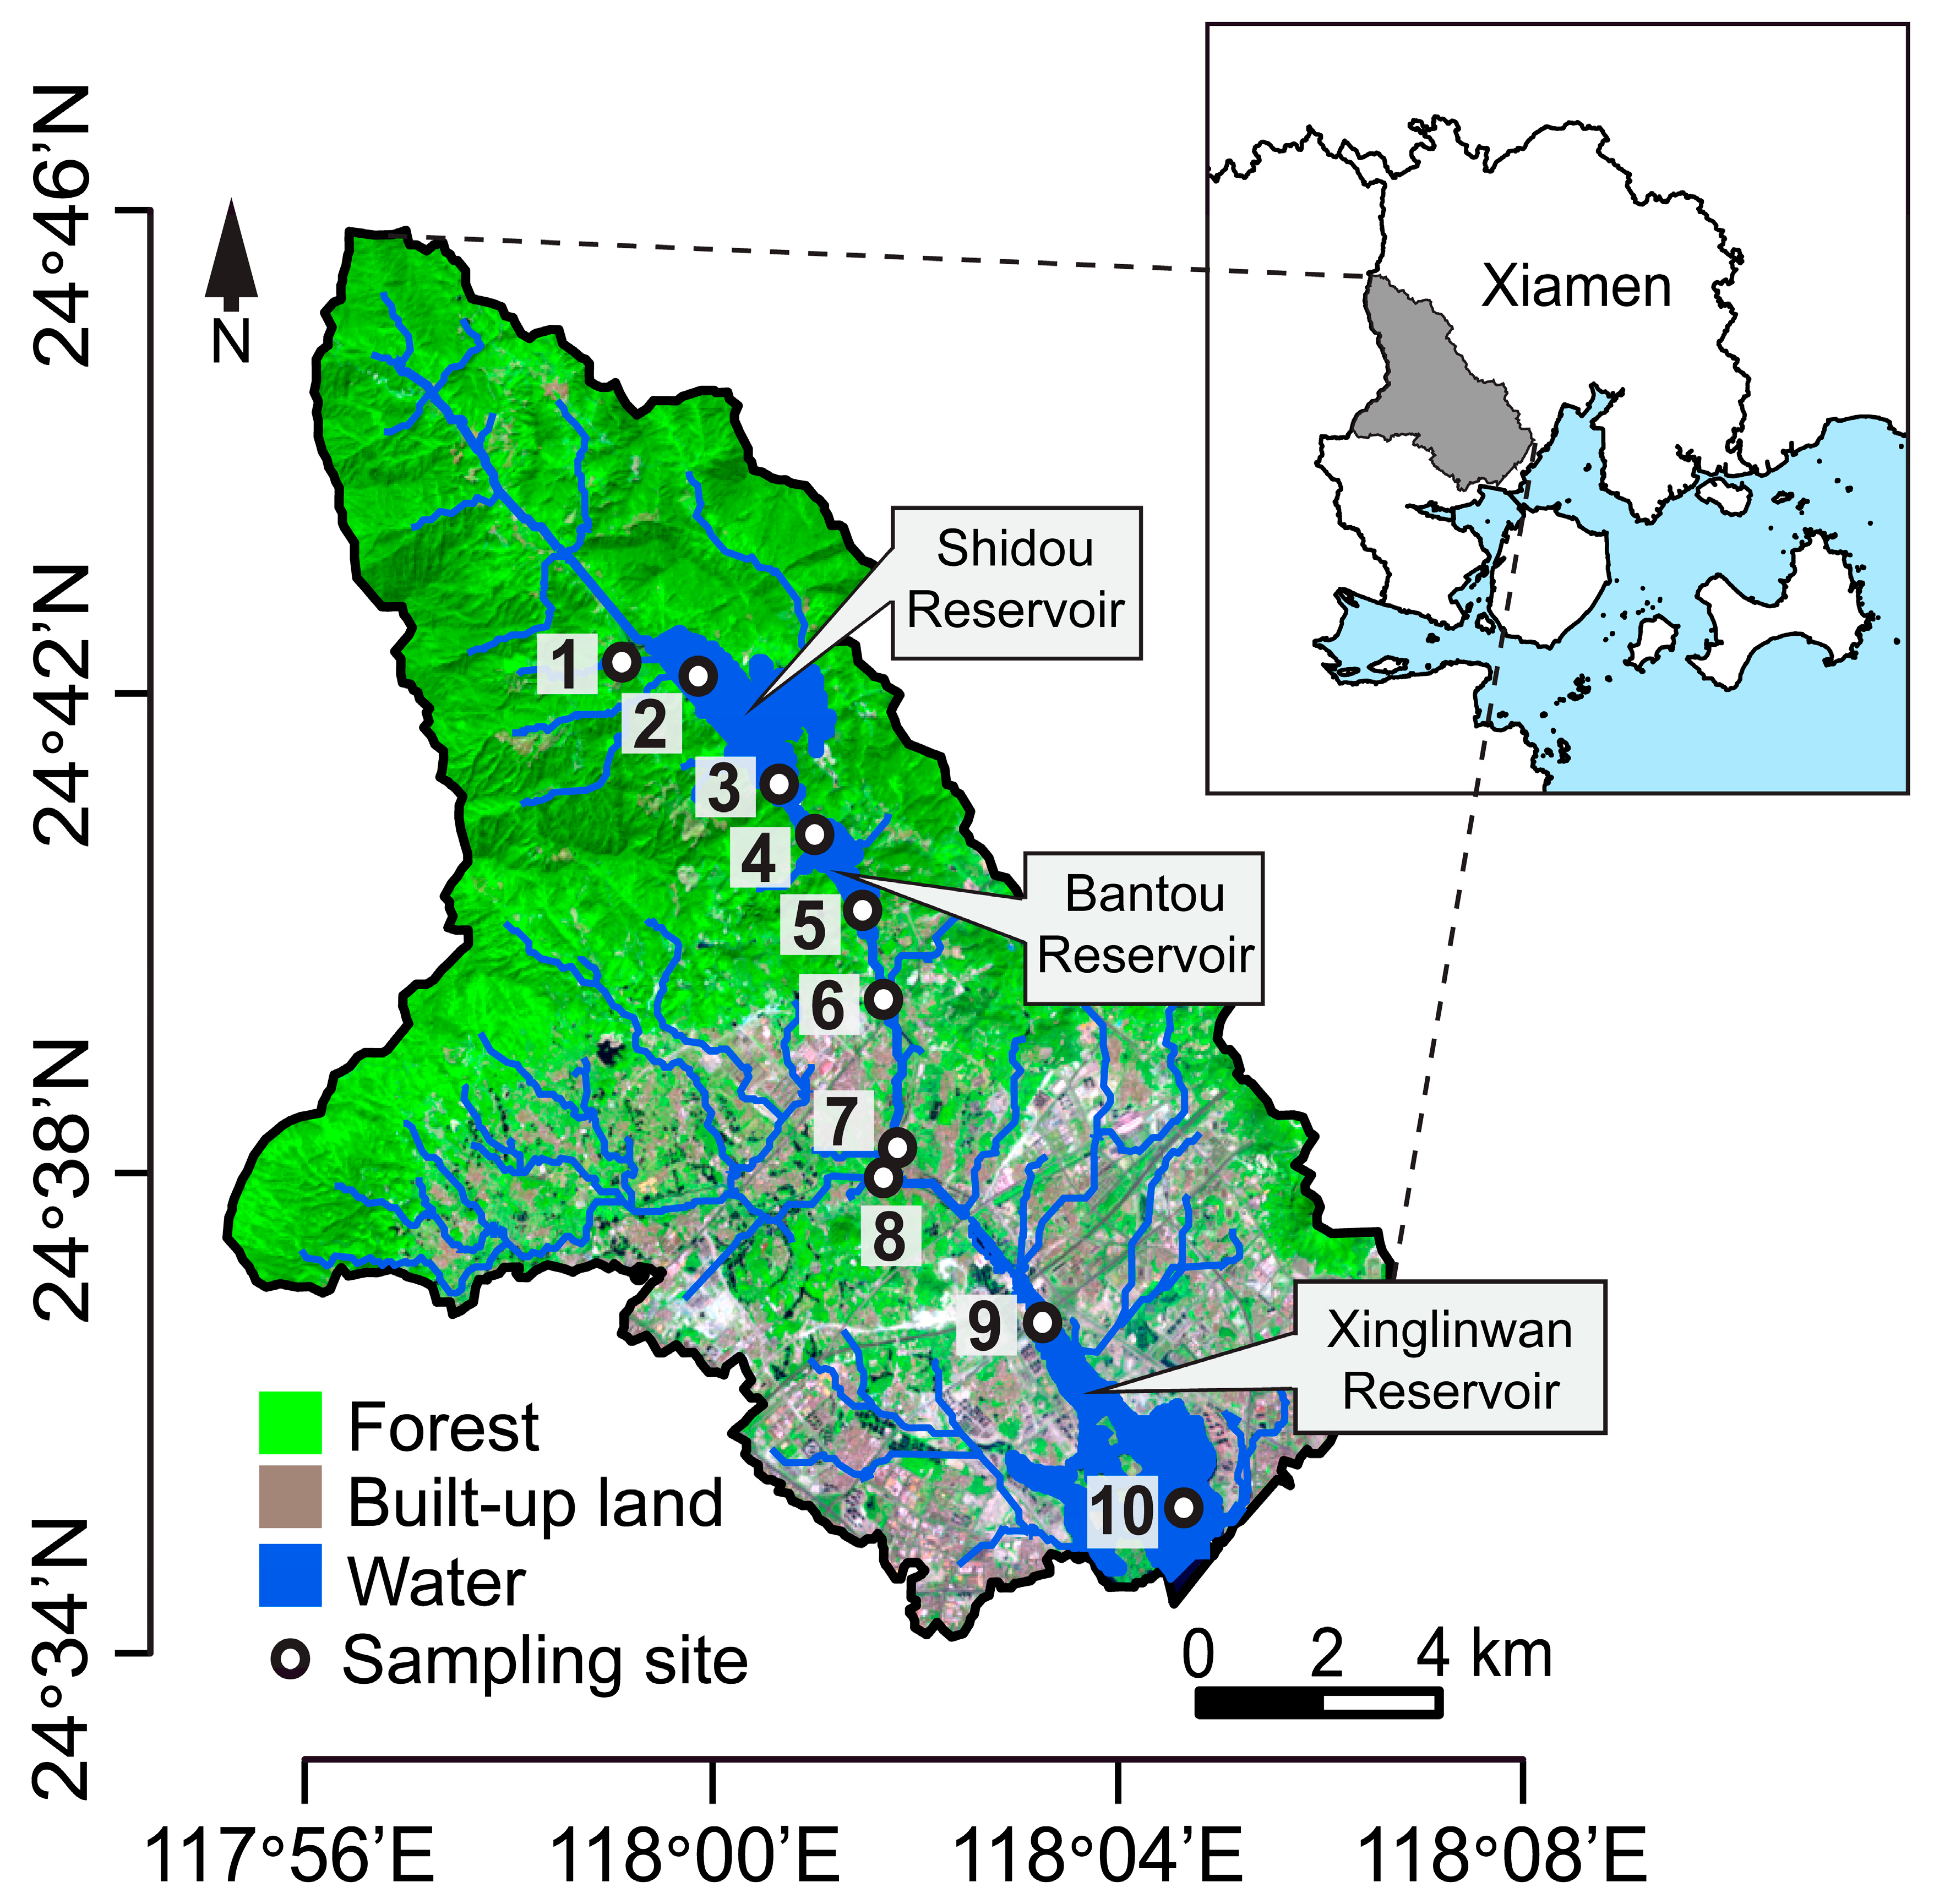
2.1. Study Area and Sample Collection

Water samples were collected from the surface layer (<0.5 m) at the mid-point of the Houxi River, located northwest of Xiamen city, Fujian, China (24°34′–24°46′ N and 117°56′–118°8′ E; Figure 1. Houxi River watershed covers 205 km2 of the surface area, with a river length of approximately 25 km. The upstream section of Houxi River is dominated by forested land, and the downstream section drains an urban area of the rapidly growing Xiamen city. The annual mean temperature is 20.7 °C, and the annual mean precipitation is 1335.8 mm in Xiamen [33,34]. A total of 100 samples were collected in January and July of the years 2012–2016, during ten sampling visits at ten sampling sites. In the upstream, pristine area, one sampling site in the headwater (Site 1), and four sites (Sites 2–5) in the lacustrine and riverine zones of two reservoirs (Shidou and Bantou reservoirs; Figure 1) were selected. These reservoirs were constructed to supply drinking water for downstream urban population. The remaining sites, located in the downstream urban area, included two sites in the peri-urban area (Sites 7 and 8) and two sites in the fully urban area (Sites 9 and 10; Figure 1).

2.2. Environmental Variables

Physical and chemical variables, namely the water temperature (WT), pH, dissolved oxygen (DO), chlorophyll-a (Chl-a), turbidity, electrical conductivity (EC), salinity, and oxidation–reduction potential (ORP) were measured using a Hydrolab DS5 water quality analyzer (Hach Company, Loveland, CO, USA). Current velocity was recorded using SonTek FlowTracker (Handheld-ADV® YSI, San Diego, CA, USA). Duplicate water samples for nutrient concentrations and plankton community profiling were transported to the laboratory immediately after sampling. Water samples of about 500 mL were immediately pre-filtered through a 200 μm mesh to remove larger particles, and then filtered through 0.22 μm pore size polycarbonate filters (47 mm diameter, Millipore, Billerica, MA, USA) using pressurized vacuum pumps. The filters were stored at −80 °C until DNA extraction. Nutrient concentrations were quantified following our previous study [35].

2.3. DNA Extraction

Total DNA was extracted from each of 100 filters using the FastDNA spin kit (MP Biomedicals, Santa Ana, CA, USA) according to the manufacturer’s instructions. It was checked for quality and quantity using a NanoDrop device (ND-1000 Thermo Fisher Scientific, Waltham, MA, USA).

2.4. Illumina Sequencing

Two 20 μL DNA sub-samples from each of the 100 samples were amplified separately using universal bacterial (341F–806R) and microeukaryotic (1380F–1510R) primers that target the V3–V4 hypervariable regions of the 16S rRNA gene and V9 region of 18 rRNA gene, respectively. Gene fragments were sequenced on Illumina HiSeq platform (Illumina Inc., San Diego, CA, USA) using a paired end strategy. The original images obtained by the sequencer were converted into sequence data by base calling. The 16S rRNA and 18S rRNA batch libraries resulted into a total of 6,596,530 and 8,128,028 raw sequences, respectively. Barcode and primer sequence removals were carried out in QIIME 1.9.1 [36], and the output data were made publically available at the GenBank sequence read archive (SRA) under BioProject numbers PRJNA383082, SRP104354 (bacteria) and PRJNA381645, SRP103724 (microeukaryotes).

2.5. Bioinformatics Analyses

Bioinformatic analyses were carried out using VSEARCH [37], a free, versatile software for USEARCH, with a consistent protocol for both 16S rRNA and 18S rRNA gene data. In brief, merged sequences were filtrated to find a representative of one or more sequences in the data. The unoise3 algorithm with default settings (minsize = 8) was used to denoise sequences and remove chimeras from a set of unique sequences to construct biologically corrected sequences. Quality filtered sequences were assigned to OTUs at a 97% sequence similarity threshold via the usearch_global command. The OTU taxonomies were assigned using the sintax algorithm on a query sequences mapped against the Greengenes v13_8 for bacterioplankton [38] and V9_PR2 [39] for microeukaryotes, respectively. Rooted phylogenetic trees were generated from the fasta files of the biologically corrected sequences using the cluster_agg command. The resulting OTU tables were subjected to subsequent processing of singleton, archaea, and chloroplast deletion for bacterioplankton, and singleton deletion and taxa curation for microeukaryotes. The OTU tables were rarefied to the lowest number of sequences per sample, that is, 16,854 and 28,993 sequences for bacterioplankton and microeukaryotes, respectively (Figure S1).

2.6. Modelling Spatial Abundance Distributions (SpADs)

The analysis of the spatial abundance distributions of individual species (SpADs) across sites was used to evaluate distribution patterns of OTUs that had distinct occurrence frequencies and relative abundances. This approach allows the identification of core taxa, which are normally, normally-like, or bimodally distributed. The log normally distributed occur infrequently in the inventory (often called occasional taxa), and are characterized as random. They are typically low in abundance and follow a log series distribution. These analyses were performed distinctively for bacterioplankton and microeukaryotes in R, using specific packages as follows. The Hartigans’ dip test statistic implemented in the diptest package [40] was used to identify all OTU abundance distributions that deviated from the unimodal distributions. If the p-value < 0.01, the OTU was considered to have bimodal distribution. For all unimodal OTUs, we fitted other candidate model distributions, such as normal, Weibull, logistic, gamma, lognormal, Cauchy, and exponential. These were evaluated using the maximum likelihood estimation through the functions available in the fitdistrplus package [41]. The model fit with the lowest Akaike information criterion (AIC) values was selected as the best fit for the observed abundance distribution for each unimodally distributed OTU. The normal and bimodal categories, which included a low percentage of OTUs but a high percentage of sequence numbers, were considered the “core” community. The logistic and lognormal categories, including a high percentage number of OTUs but a low percentage of sequence numbers, were pooled together as the “random” community [27]. By modelling the spatial abundance distributions of bacterioplankton and microeukaryote OTUs, we distinguished the core and random plankton communities, respectively. As shown in Figure S2, the normal and normal-like (Weibull and Gamma) distribution models included taxa with peaking densities when the relative abundance was high. Together with the bimodal distributions, these models were classified as the core community, and constituted a low number of OTUs but a high number of sequences. By contrast, the lnnormal and logistic distributions were collectively considered as the random community, and comprised a high number of OTUs with a low number of sequences.

2.7. Multivariate Analyses

Principal coordinate analysis and the analysis of similarities (ANOSIM) were used to evaluate the overall sample clustering based on the Bray–Curtis distance among samples. These matrices were also regressed against the spatial distance matrix to test whether the communities undergo distance–decay. The relationships were evaluated using the Mantel tests, supplemented by multivariate Mantel correlograms to further investigate the underlying structure of the correlative relationship along the spatial distance. The correlograms were plotted using the mpmcorrelogram package in R [42].

2.8. Neutral Community Model

The neutral community model (NCM) was used to evaluate the importance of neutral processes underlying bacterioplankton and microeukaryote community dynamics [43]. This model predicts a relationship between the occurrence frequency of individuals in a set of local communities and their relative abundance across the wider metacommunity, as an adaptation of the neutral theory [44] adjusted for microbial communities. It uses the least squares method to produce the best fits of the observed abundance–frequency relationship, with a beta distribution derived from neutral theory [14,43]. In this model, the r-squared is used to estimate of the percentage of the community explained by neutral processes in the metacommunity, and m is the immigration rate [14]. This neutral model predicts the relationship between the frequency with which taxa occur in a set of local communities and their abundance across the wider metacommunity. In general, the NCM predicts that taxa that are abundant in the metacommunity will also be widespread. R code to run this analysis can be found at https://rdrr.io/github/DanielSprockett/reltools/src/R/modeling_tools.R.

2.9. Phylogenetic Null Model Analysis

The phylogenetic null model assumes that the phylogenetic signal occurs when more closely related species are ecologically similar [21]. Using this model, we quantitatively estimated the percentage of plankton compositional turnover linked to niche and neutral processes, as follows. The core and random plankton sub-communities, in combination with the phylogenetic tree, were used to quantify the phylogenetic beta diversity expressed as the empirical beta-mean nearest taxon distance (beta-MNTD) metric by using the comdistnt and cophenetic functions of the picante package [45]. After 999 randomizations, the observed mean value (beta-MNTDobs) was compared to a null expectation, where selection does not influence community assembly (beta-MNTDnull). This deviation was estimated as the beta-nearest taxon index (beta-NTI) metric. The percentage of pairwise comparisons whose beta-NTIs <–2 and >2 were denoted as homogeneous selection and variable selection, respectively. These thresholds indicate strong influences of deterministic processes. The remaining pairwise comparisons that were non-significant indicate the influence of stochastic processes. They were selected and subjected to a comparison of the observed values of the Bray–Curtis dissimilarity, modified to account for Raup–Crick to a null expectation when neither dispersal nor selection influenced the community assembly. These pairwise comparisons were denoted as homogenizing dispersal and dispersal limitation if their modified Raup–Crick for Bray–Curtis (RCBray-Curtis) coefficients were <−0.95 or >0.95, respectively. Pairwise comparisons with RCBray–Curtis metrics ranging from −0.95 to 0.95 were denoted as the “undominated” [17,21]. R codes for this analysis are made publically available at https://github.com/stegen/Stegen_etal_ISME_2013.

2.10. Quantifying Environmental Synchrony

The cohesion metric assumes that stronger cohesion indicates a community with many taxa responding simultaneously to environmental fluctuation [46]. It was used to evaluate environmental synchrony between microeukaryotes and bacterioplankton taxa. Briefly, the cohesion is calculated by multiplying the abundance of each taxon in a sample by its associated connectedness values, and then summing the products of all taxa in a sample. For this analysis, we set the persistence cutoff of 0.1 for retaining taxa in the analysis. The OTUs with very low contribution (0.01%) to the overall total number of sequences were removed, and 50 iterations were used in this study. Positive and negative cohesions resulting from core and random communities were compared by overlaying the results of the analysis of variance (ANOVA) on violin plots through the easyGgplot2 and ggpubr packages. Furthermore, Spearman correlations between the environmental variables and the number of sequences and OTUs were performed to investigate relationships between plankton communities and environmental conditions.

3. Results

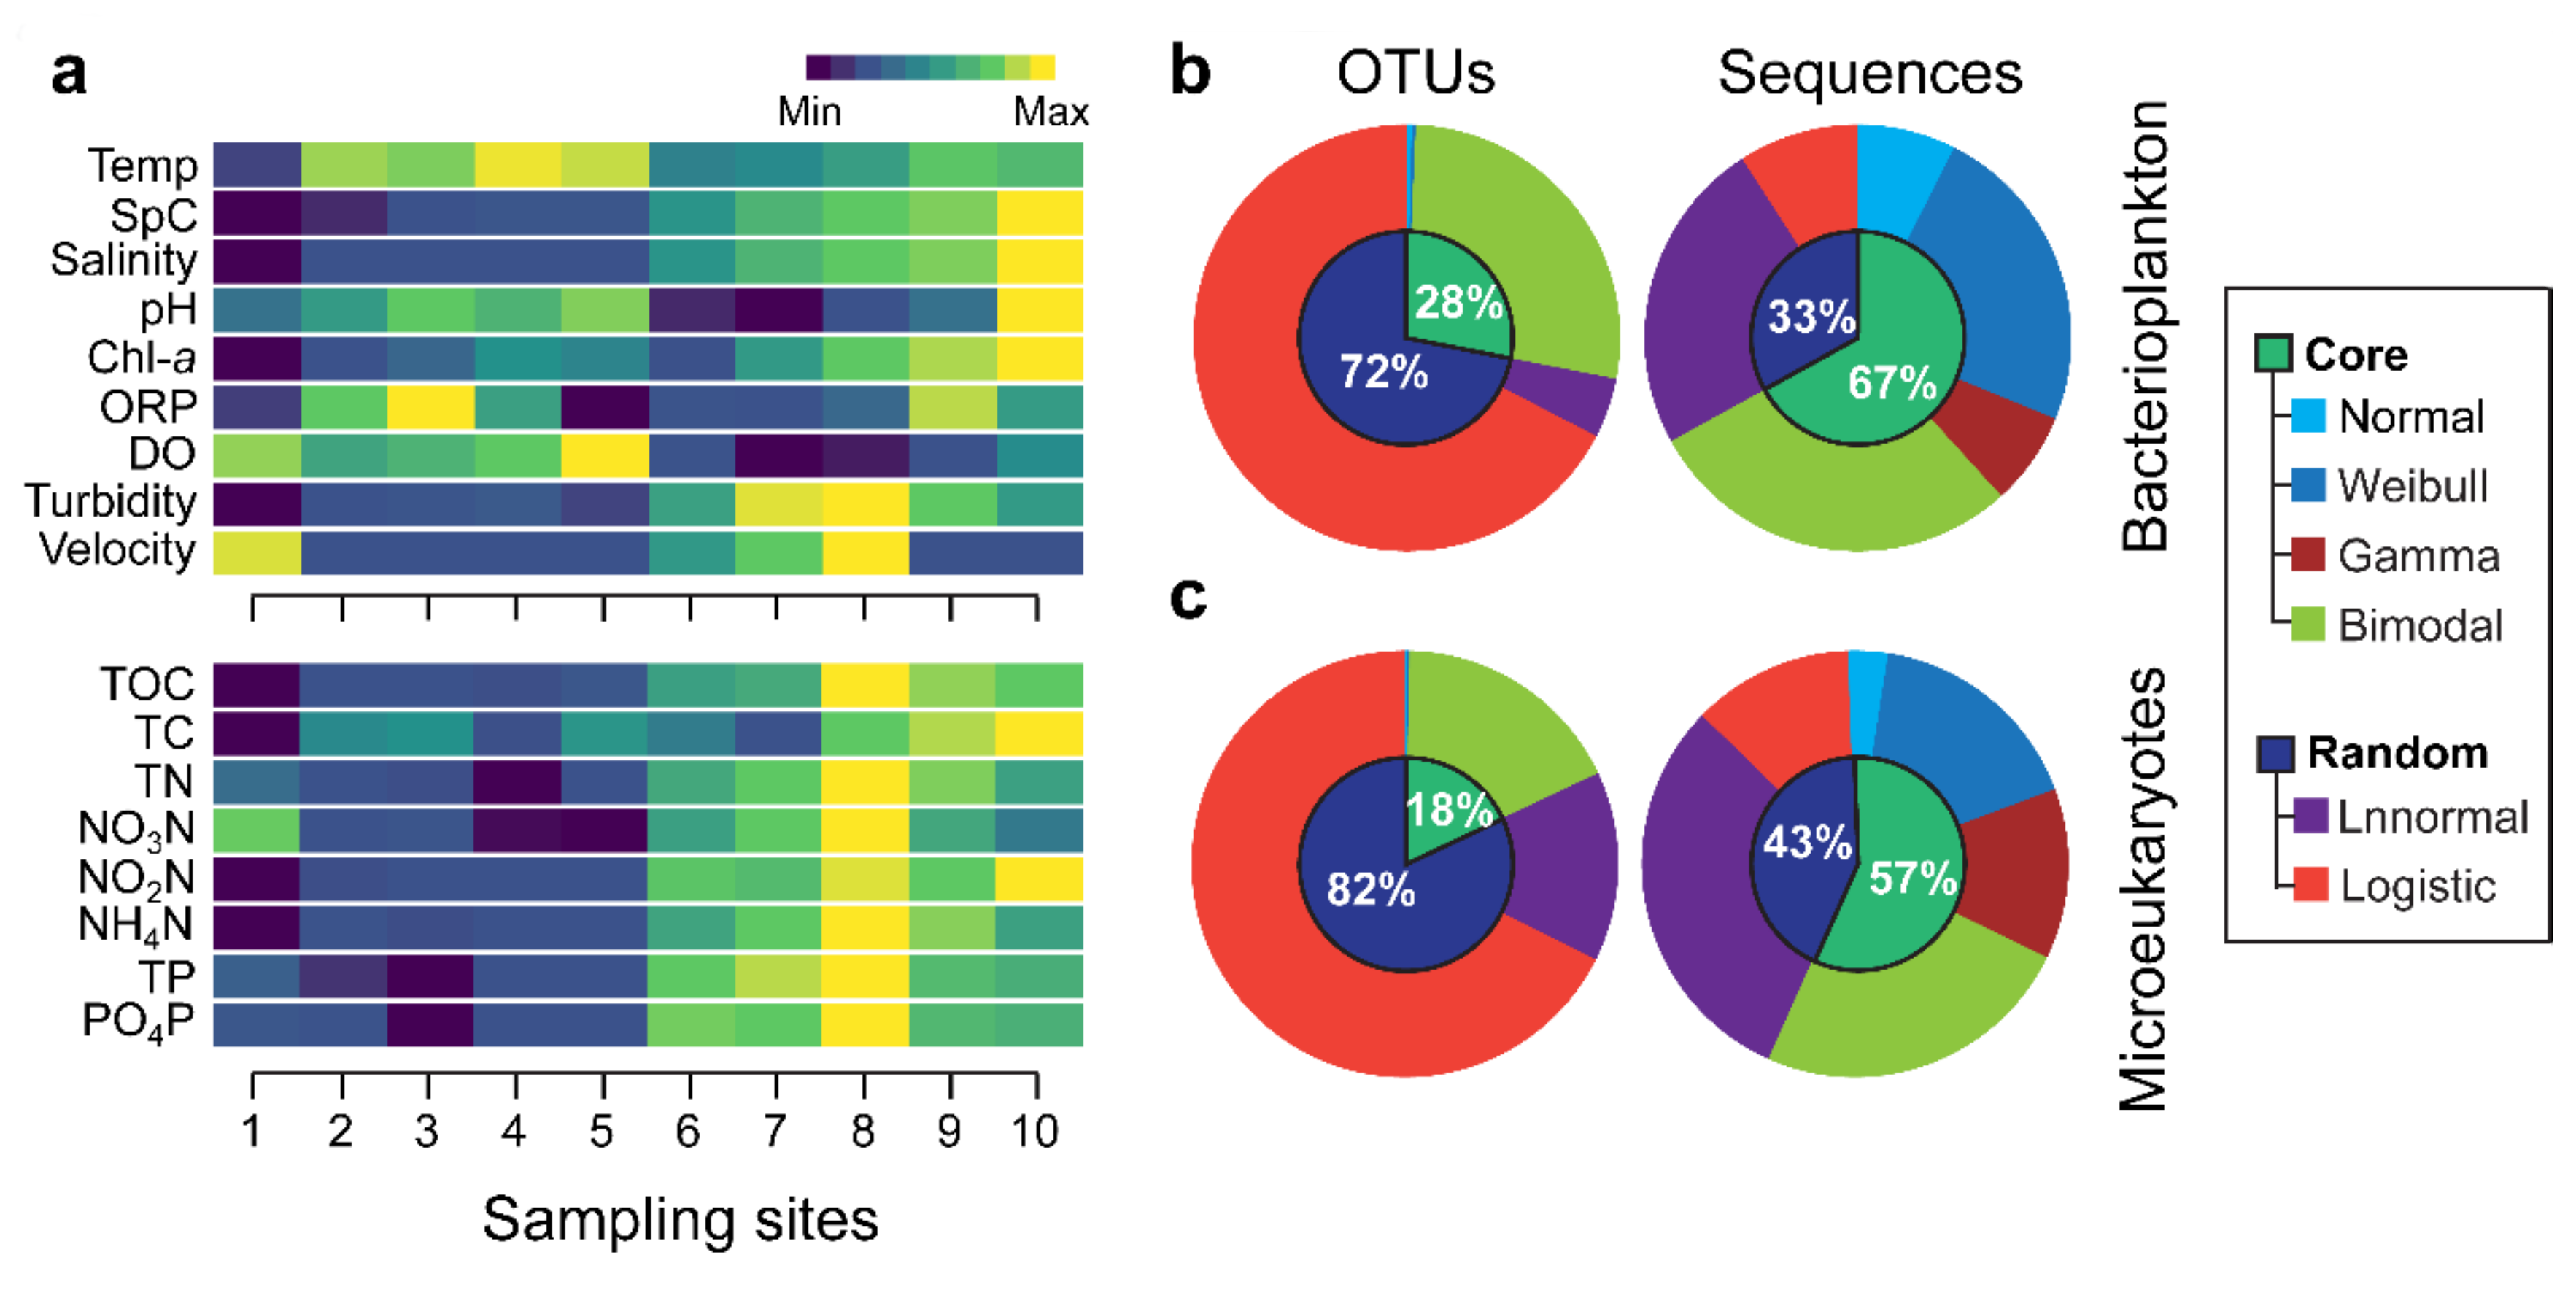
3.1. Environmental Variation and Spacies Abundance Distributions (SpADs)

The Houxi River system exhibited environmental heterogeneity as a result of landscape and hydrological changes in its watershed (Figure 1; Figure 2a). By averaging the values of the physical and chemical parameters over the ten sampling visits, our data confirmed this heterogeneity, as there were clear differences between the pristine upstream and the downstream sites in the urban areas (Figure 2a). In particular, nutrient concentrations were much higher in the downstream than the upstream sites, indicating human-induced pollution in the urban area. Nevertheless, this highly dynamic system remains connected by the river flow throughout the year, suggesting contrasting external forces acting on plankton communities.
After rarefying bacterioplankton and microeukaryotes OTU tables at the lowest sequences per sample, we retained 10,330 and 12,613 OTUs for bacterioplankton and microeukaryotes, respectively. The rarefaction curves tended to plateau, indicating that the efforts for sequencing depth were generally maximized (Figure S1). Bacterioplankton were generally assigned to 36 phyla, 91 classes, 150 orders, 242 families, and 466 genera, while microeukaryotes were assigned to 29 phyla, 139 classes, 271 orders, 583 families, and 1854 genera. Only 6.2% of bacterial OTUs and 13.6% microeukaryotic OTUs could be classified at the species level (details not shown).
The core taxa comprised 28% and 18% of the total number of OTUs for bacterioplankton and microeukaryotes, respectively. These taxa corresponded to 67% and 57% of the total number of bacterial and microeukaryotic sequences, respectively. In contrast, the random taxa comprised 72% and 82% of the total number of OTUs for bacterioplankton and microeukaryotes, respectively. The random taxa accounted for 33% and 43% of the total number of bacterial and microeukaryotic sequences, respectively (Figure 2). There were no OTUs that could fit other tested models such as the Cauchy and exponential distributions.

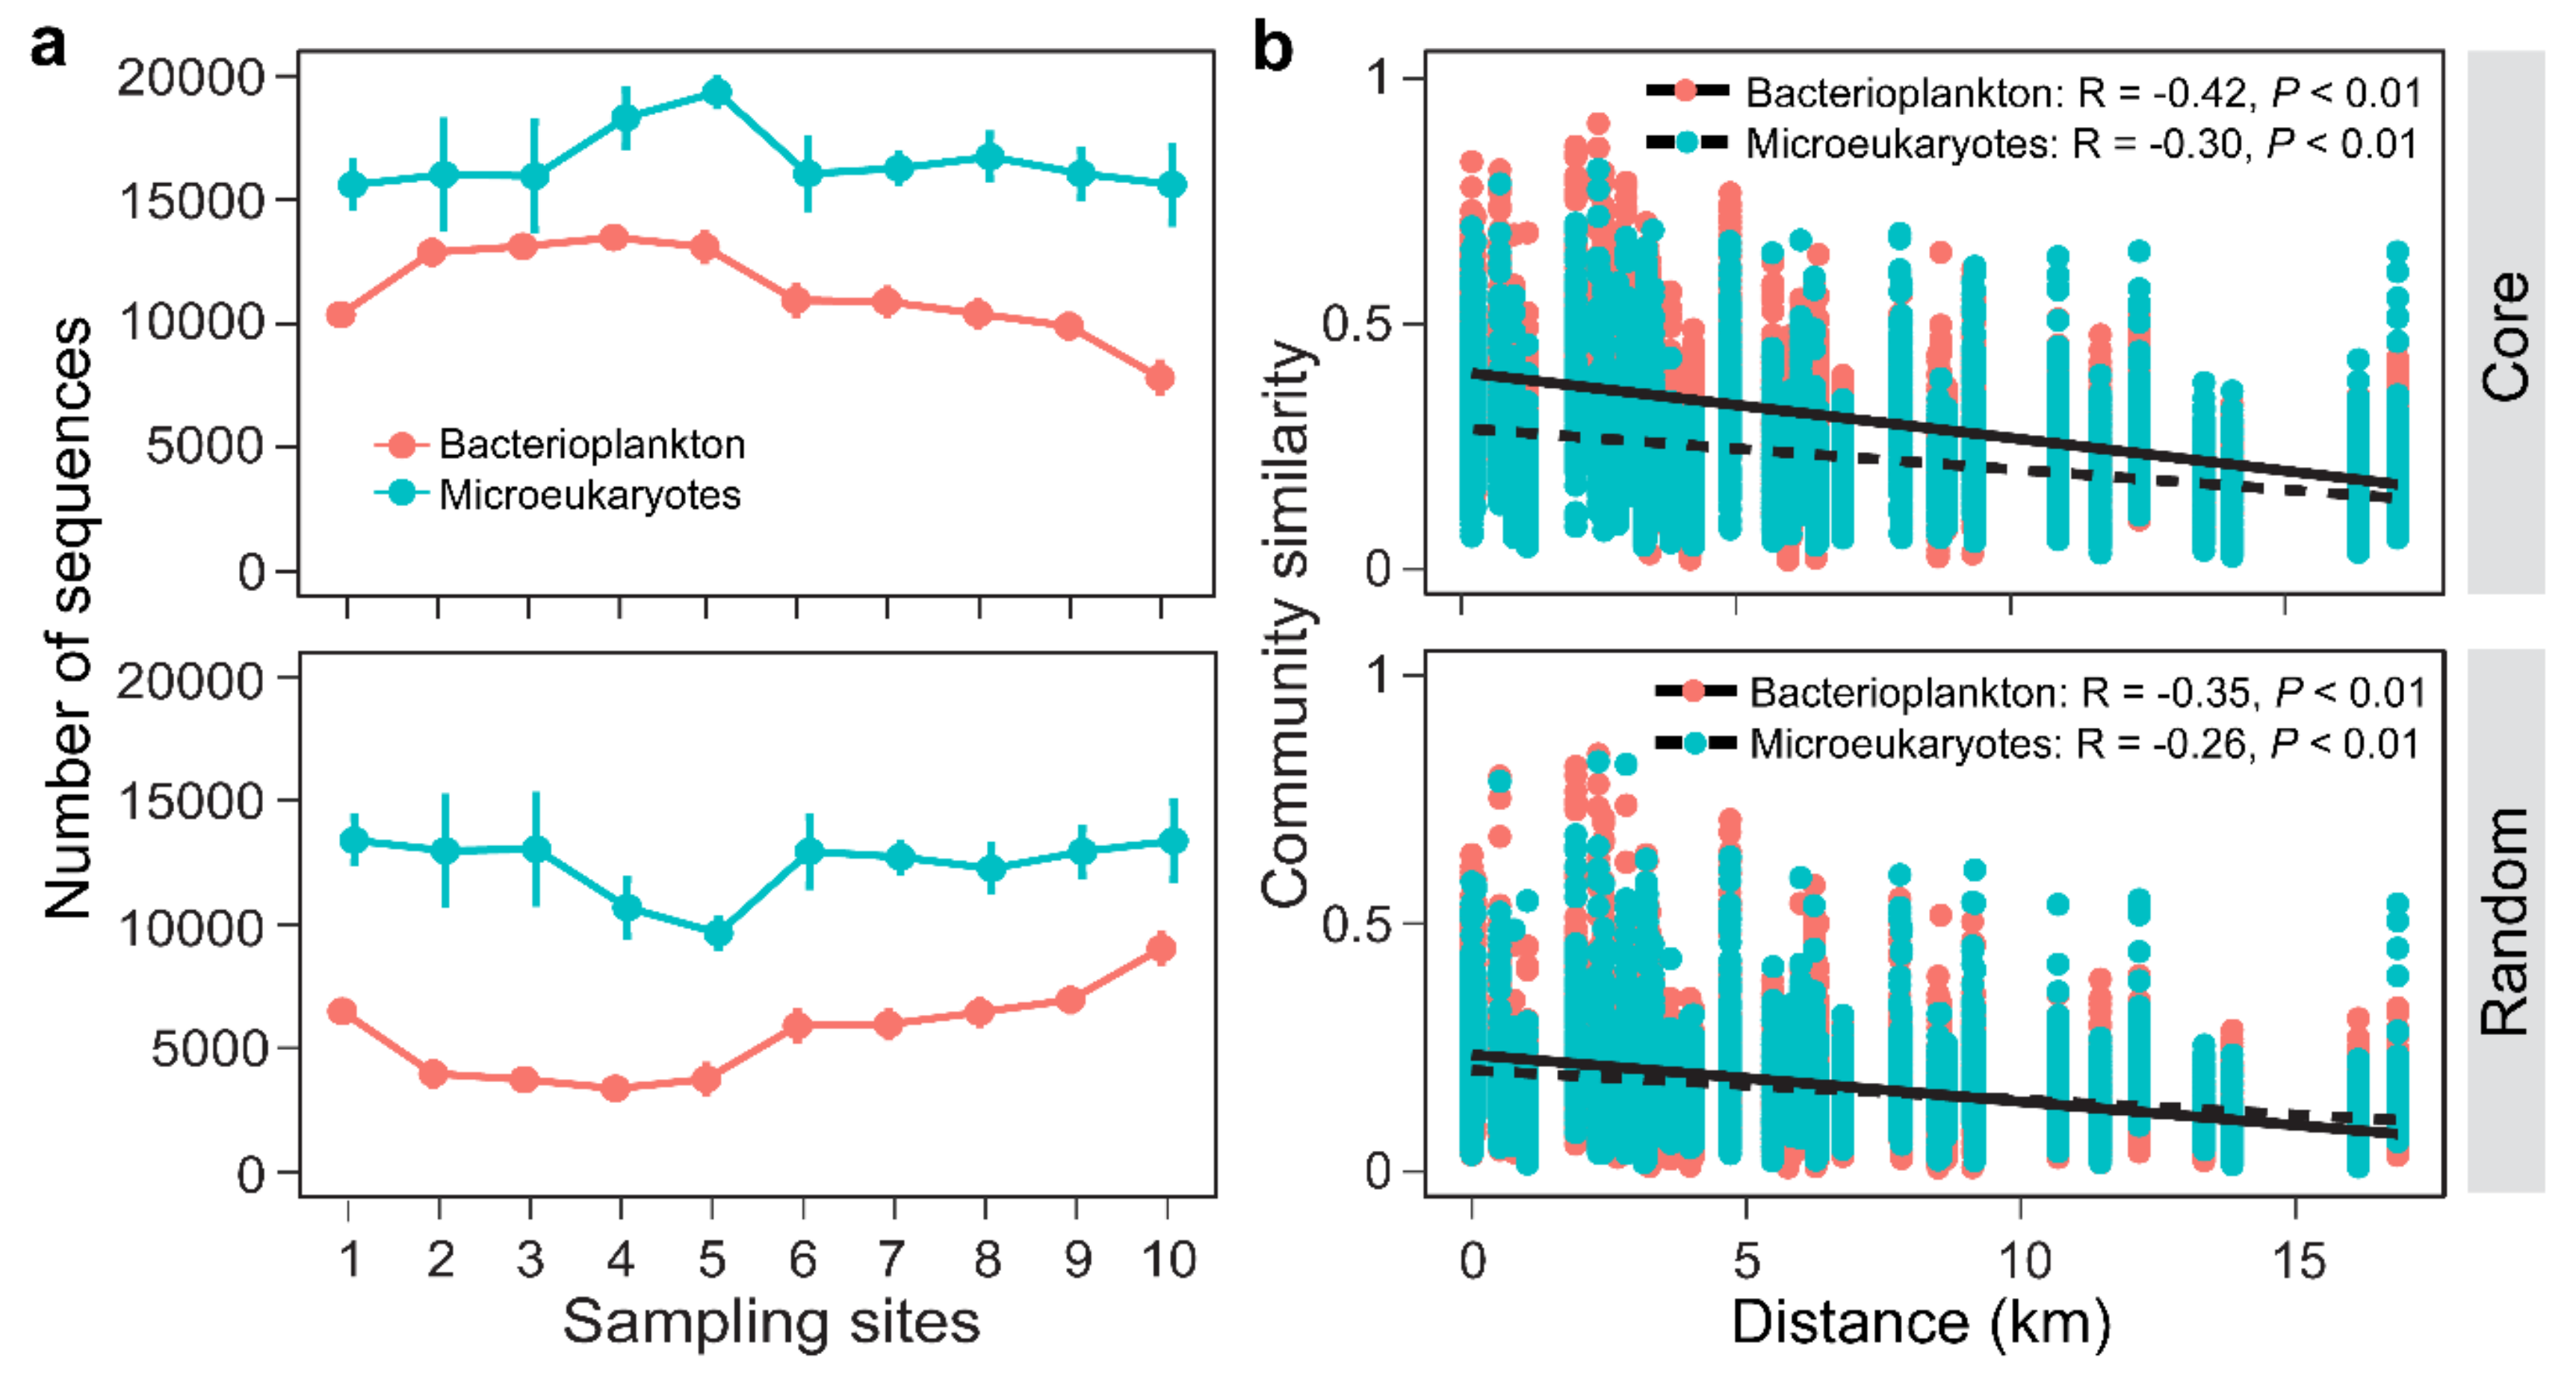
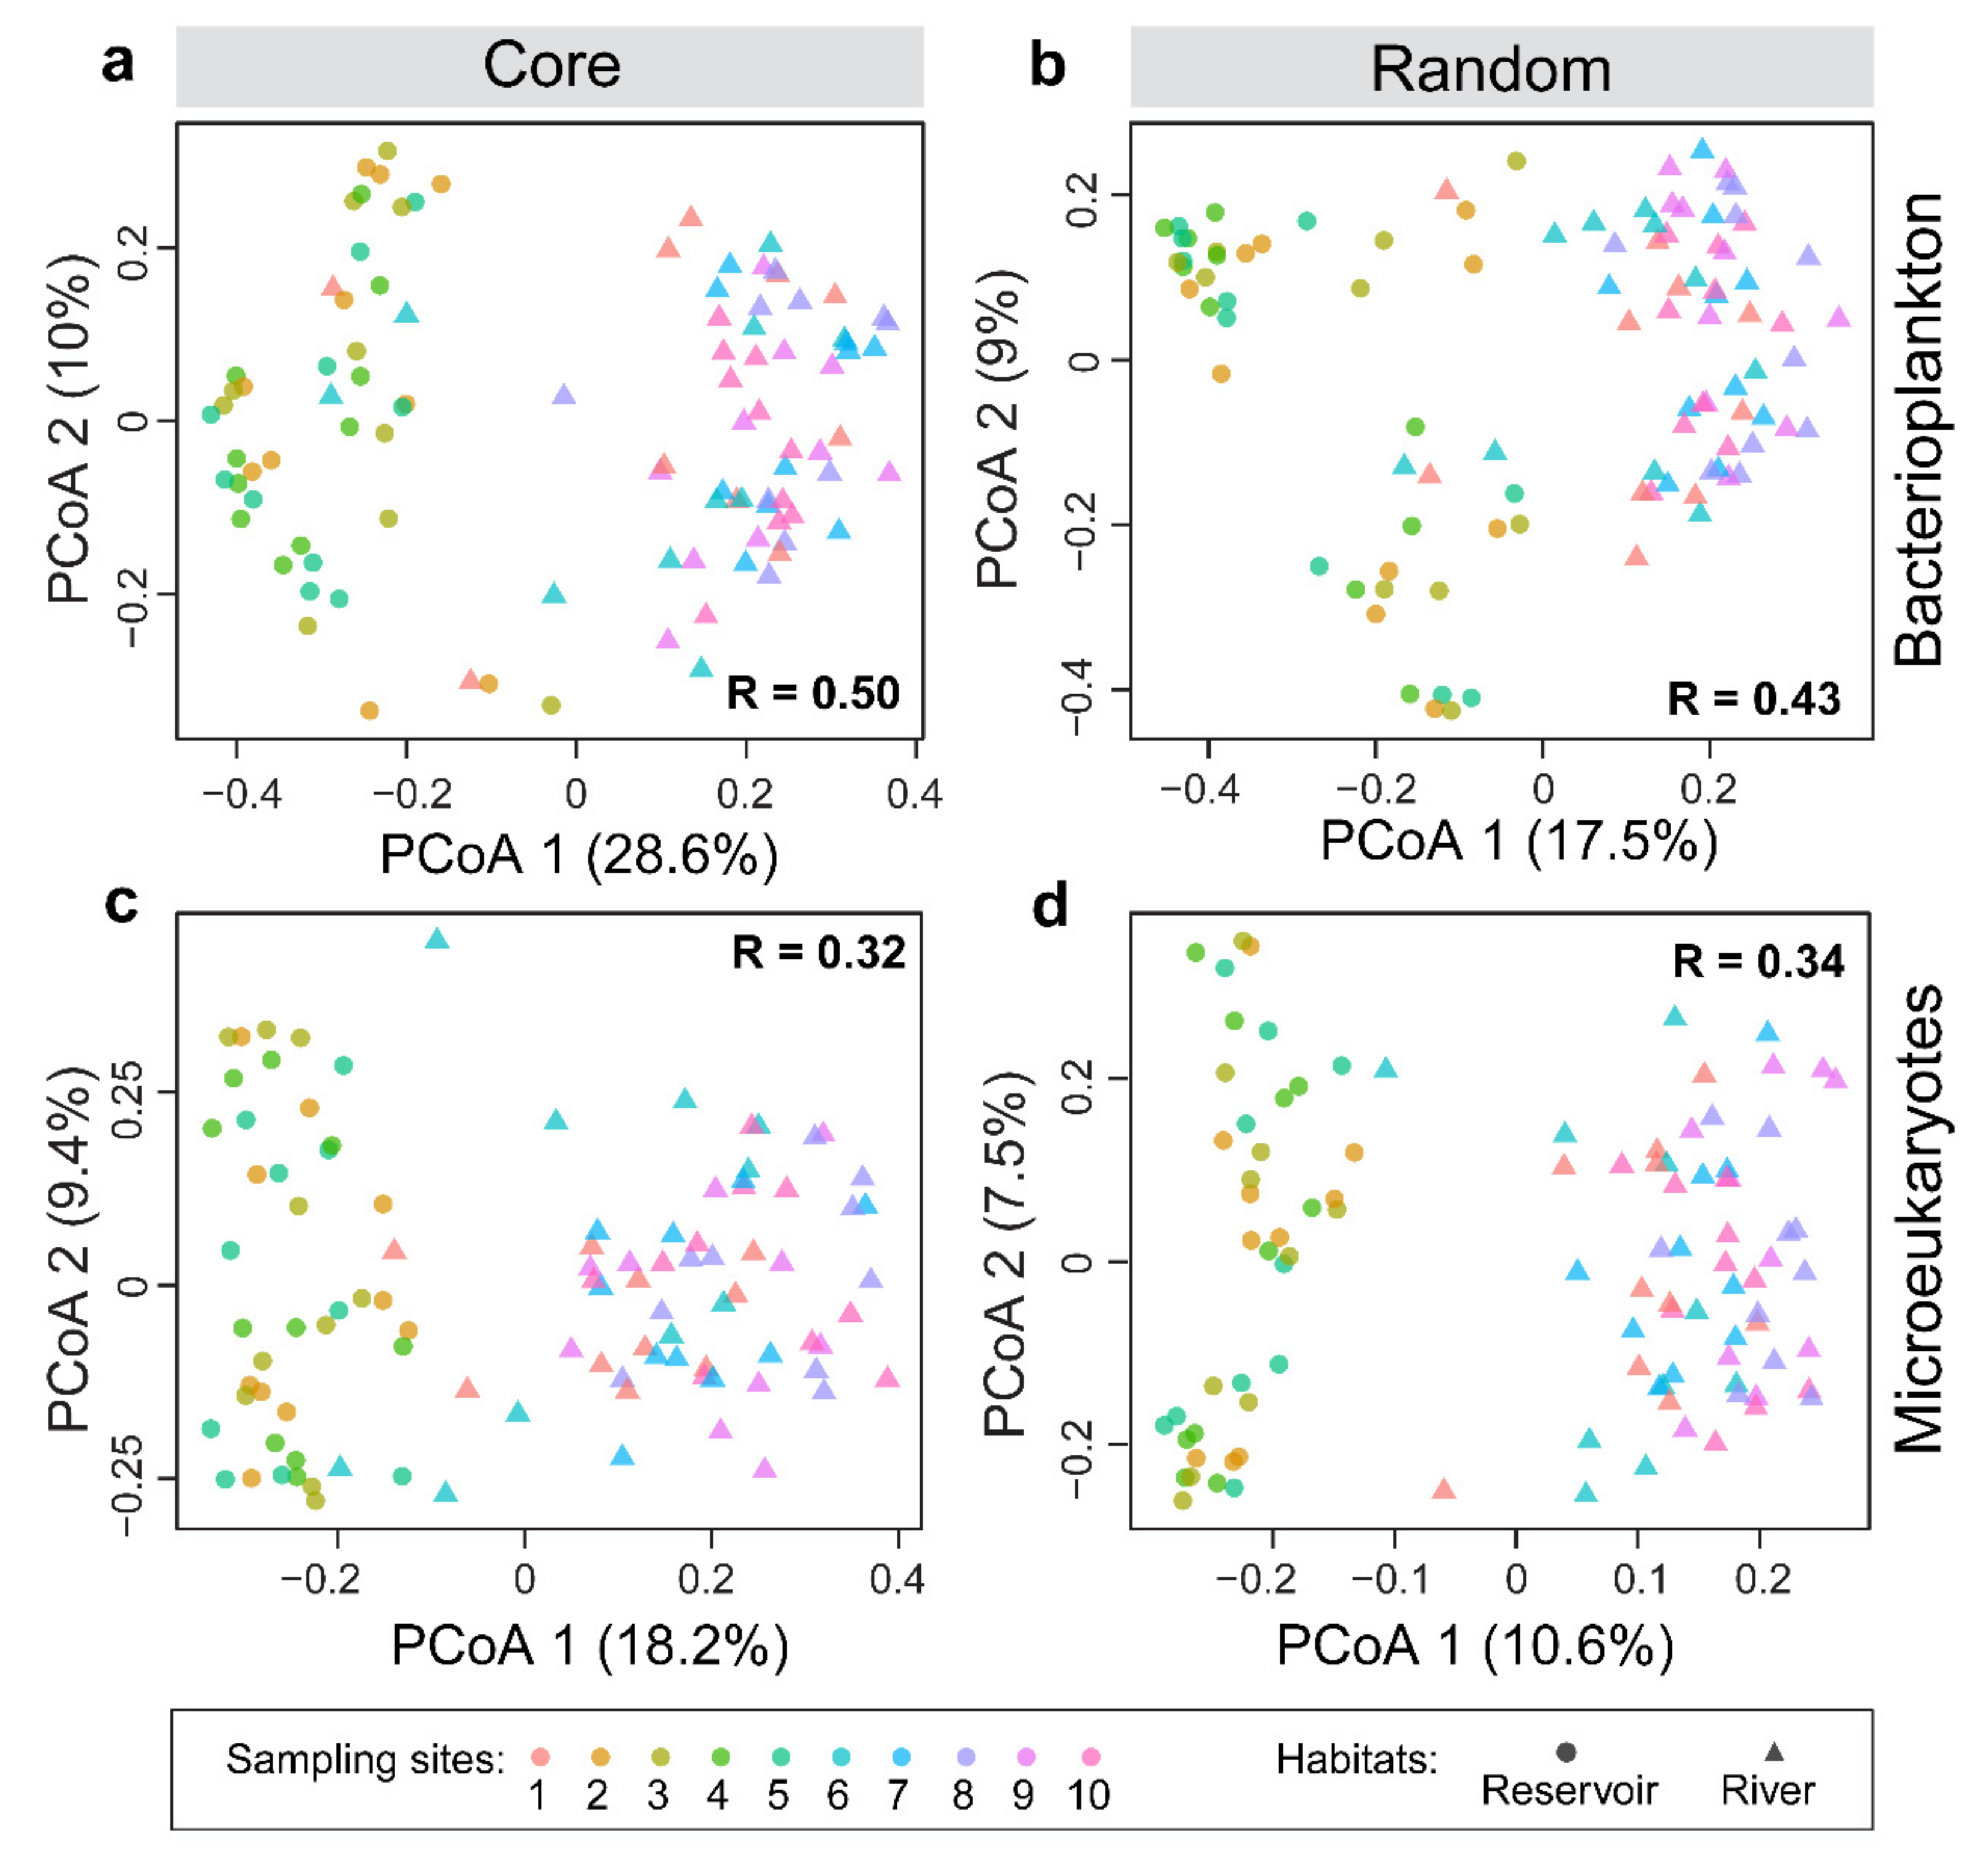
3.2. Distribution Patterns of the Core and Random Plankton

Along the spatial gradient of the studied river–reservoir system, the number of sequences of the core and random categories exhibited distinct patterns (Figure 3a). The core community increased at the reservoir sites in the upstream region and decreased at the downstream river sites. The random category showed an opposite trend, with a decreasing number of sequences in the lentic sites and an increased number at the lotic sites. This observation was common between the bacterioplankton and microeukaryote communities.
Nevertheless, contrasting patterns within the core or random subsets were observed at the phylum and class levels. At the phylum level, the majority of the core bacterioplankton OTUs were assigned to the Proteobacteria and Actinobacteria phyla (Figure S3a). The majority of random bacterioplankton OTUs were assigned to Proteobacteria, followed by Bacteriodetes and Firmicutes (Figure S3b). The majority of core microeukaryotic OTUs were assigned to the phyla Fungi, Ochrophyta, and Chlorophyta (Figure S3c), and the random microeukaryotes were mainly from the phylum Fungi (Figure S3d).
At the class level, the core and random community subsets exhibited longitudinal changes in the Houxi River. For example, whereas the gram-negative Actinobacteria were dominant in the Shidou and Bantou reservoirs, the Alphaproteobacteria dominated the river sites upstream and downstream of the reservoirs (Figure S4). The Betaproteobacteria and the Gammaproteobacteria core and random sequences increased concomitantly in the downstream sites. The random bacterioplankton assigned to the classes Deltaproteobacteria and Spartobacteria prevailed in the reservoir sites and reduced significantly in the downstream sites (Figure S4).
Distinct microeukaryote classes also underwent longitudinal changes, resulting in sample clusters that roughly correspond to hydrological changes in the Houxi River (Figure S5). However, we observed no obvious differences between the core and random microeukaryotic communities. Among the most dominant classes based on total sequence numbers, the classes Chlorophyceae, Bacillariophyta, and Trebouxiophyceae were lower at the reservoir sites than the river sites. By contrast, the classes Arthropoda, Rotifera, Dinophyceae, and Raphidophyceae increased in the Shidou and Bantou reservoir sites (Figure S5).
Further, we found that core and random categories for both bacterioplankton and microeukaryotes exhibited significant distance–decay relationships (Figure 3b). The strongest community decay was found for core bacterioplankton taxa (Mantel R = −0.42, p < 0.01), followed by random bacterioplankton (R = −0.35, p < 0.01), core microeukaryotes (R = −0.30, p < 0.01), and random microeukaryotes (R = −0.26, p < 0.01).
Consistent with the inferences from the number of sequences (Figure 3a), the PCoA revealed clusters identifying whether samples were from the reservoirs or river sites (Figure 4). The ANOSIM showed that the core and random bacterioplankton communities were significantly distinct across the ten sampling sites. The global R was 0.50 (p < 0.01) and 0.43 (p < 0.01) for core and random bacterioplankton, respectively. Similar observations were found for the microeukaryotes, but with a relatively low global R, indicating a less spatially segregated community. For microeukaryotes, the global R was 0.32 (p < 0.01) and 0.34 (p < 0.01) for core and random subsets, respectively (Figure 4).
Both bacterioplankton and microeukaryotes correlated positively in the upstream distance classes, but the correlations became negative and sometime non-significant in the downstream areas (Figure S6). The above similar patterns between both bacterioplankton and microeukaryotes were reflected by the correlation between beta-diversities of both plankton, and their corresponding core and random subsets (Mantel R = 0.51 for all; 0.50 for the core and 0.52 for the random; p = 0.001; Figure S7).

3.3. Environmental Synchrony Among the Core and Random Plankton Communities

Spearman-based correlation analyses showed a similar environmental preference between the core and random communities for both bacterioplankton and microeukaryotes. There were significant positive correlations between the number of sequences of the core and random communities and water velocity, total nitrogen, and nitrate–nitrogen for both bacterioplankton and microeukaryotes (Figure 5a). Significant and negative correlations between the dissolved oxygen and pH, and the number of sequences, were also found, except for the random bacterioplankton community. These community subsets were positively correlated with other nutrients, namely the total phosphorus and phosphate–phosphorus. The number of OTUs associated to the core bacterioplankton community had significant negative correlations with most environmental variables. On the other hand, the random bacterioplankton OTUs were positively correlated with most environmental variables, except the ORP (Figure S8). The core and random microeukaryotes OTUs did not have significant correlations with environmental factors, with the exception of a significant negative correlation between the pH and core microeukaryotes. Further, the cohesion metric results showed that the core and random plankton communities featured significant but distinct cohesion values. The random bacterioplankton community exhibited the highest positive cohesion, followed by the core bacterioplankton, the core microeukaryotes, and the random microeukaryotes. Higher negative cohesion values for core than random communities were observed for both bacterioplankton and microeukaryotes (Figure 5b).

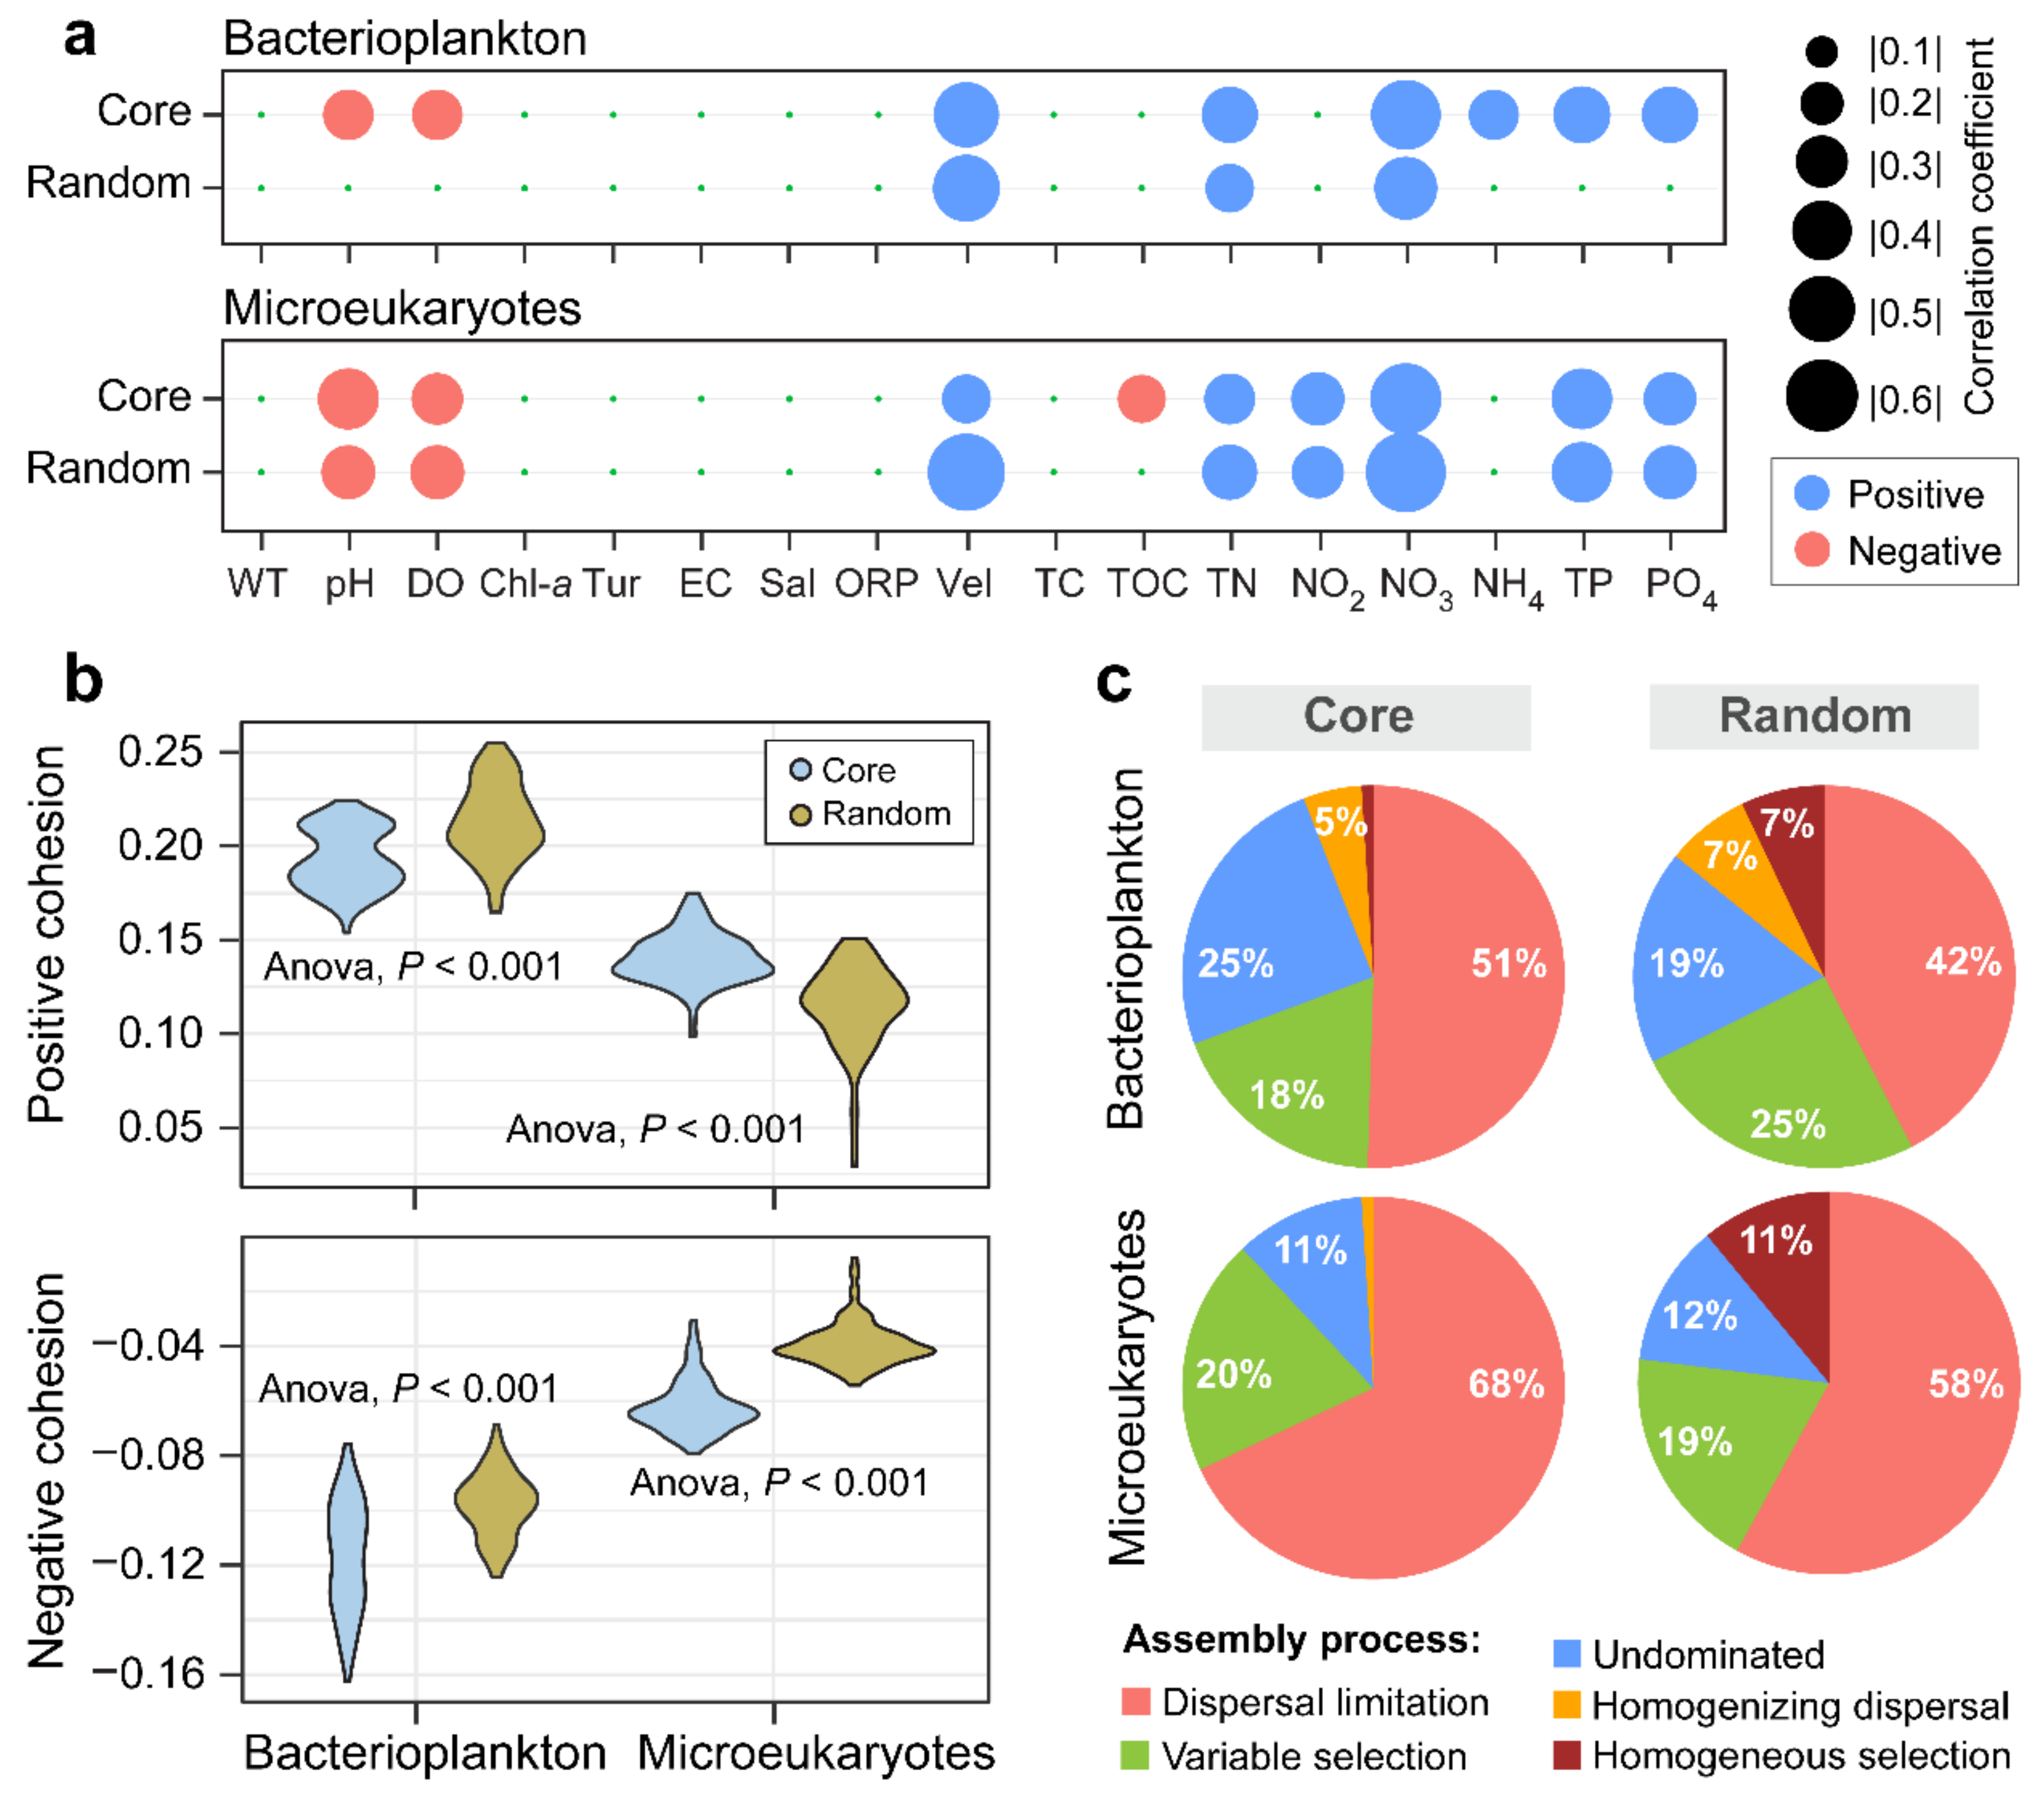
3.4. Ecological Processes Underlying the Core and Random Plankton Communities

The neutral community model resulted in a relatively low model fit for both the core and random bacterioplankton and microeukaryote subsets. As shown in Table 1, the model fit for the core (R2 = 0.45) was similar to that of the random (R2 = 0.44) bacterioplankton communities. By contrast, a better fit was observed for the random (R2 = 0.41) than the core (R2 = 0.35) microeukaryotes. Similarly, the immigration size (m) was greater for the core bacterioplankton (m = 0.26) than the rest of community subsets, which collectively exhibited low immigration size (m < 0.1). Nevertheless, all plankton communities fitted the neutral model well (R2 = 0.62 for bacterioplankton and R2 = 0.56 for microeukaryotes).
The results of the phylogenetic null model by using the four components of ecological processes mirrored the findings from the NCM. The largest percentage of pairwise comparisons was associated with dispersal limitation (42–68%) followed by variable selection (18–25%) for both bacterioplankton and microeukaryotes (Figure 5c). The percentage of pairwise comparisons explained by none of the four ecological components (i.e., the undominated fraction) was larger for bacterioplankton than microeukaryotes (18–25% vs. 10–12%). Homogenizing dispersal was higher for core and random bacterioplankton than their microeukaryote counterparts (5–7% vs. 1%). Both bacterioplankton and microeukaryote random communities showed a significant percentage of homogenizing selection (8–10%), which could not be found in the core subsets (Figure 5c). Taken together, these results suggest that dispersal limitation potentially underlies the core and random bacterioplankton and microeukaryotes, followed by environmental selection.

4. Discussion

It is important to unravel the assembly processes that shape distribution patterns for distinct facets of microbial populations in different ecosystems. This knowledge not only allows the prediction of community change over spatial and/or temporal gradients, but also has potential implications for ecosystem functioning and biodiversity conservation [4,47,48]. Notably, a recent simulation study has shown that spatiotemporal variations in the selection–dispersal balance influence hydrobiogeochemical function [49]. Another study has shown that increasing influences of environmental selection may lead to increased biochemical rates, whereas increasing influences of dispersal may decrease biogeochemical rates [50].
Numerous studies have previously depicted the relative influence of niche and neutral processes on generating distribution patterns of plankton, but inconsistent results and methodological pitfalls exist, calling for more field studies [14]. For instance, bacterial communities were generally structured by both niche and neutral processes in Chinese plateau lakes [51], but their specialist and generalist components were structured by contrasting ecological processes [52]. These and many previous studies [8,12,13,48,53] have partitioned beta diversity into components explained by local and regional factors. Regional factors are represented by spatial distance, an approach which is often compounded by the fact that distance effect is most likely overestimated, since it cannot exclude the impacts of unmeasured environmental variables [14]. Furthermore, in highly dynamic habitats, such as riverine ecosystems, dramatic environmental variations and strong dispersal effects occur. As such, it may be difficult to distinguish the pure effects of selection and dispersal, and planktonic populations are highly influenced by the coalescence of taxa from adjacent terrestrial or aquatic ecosystems [54]. Needless to say, purely neutral ecological processes and the local niche-based evolution of regional neutrality cannot be separated by partitioning beta diversity without looking at trait variation [55]. Nowadays, the dichotomy of delineating niche and neutral processes has been suppressed by niche and neutral models, as it has become broadly accepted that fitness differences between organisms and stochastic processes of death and birth influence community assembly simultaneously [28]. Therefore, to address our main objectives, we complemented neutral models with a phylogenetic null model that does not relate community composition to explanatory variables (Table 1 and Figure 5c). These models allowed us to evaluate processes generating distribution patterns observed in the distance–decay plots (Figure 3b). SpADs were used to mirror the common taxa classification into abundant and rare plankton, without making a priori assumptions about the abundance distributions or using a given percentage cutoff [24,28,31]. Through this rarely used approach, we efficiently characterized the core plankton, having a high number of sequences (high abundance) with low number of OTUs (low richness), and the random plankton, composed of a low number of sequences (low abundance) and a high number of OTUs (high richness). Similarly to Niño-García et al.’s findings [27], the random component of community members was strongly related to dispersal and immigration, while the non-random core component was more related to species sorting.
We found consistent distribution patterns for the core and random bacterioplankton and microeukaryote communities, which might be a result of human-induced hydrological changes in the Houxi River watershed. This could be validated by checking whether these community subsets respond similarly to environmental changes in the studied ecosystem. Distance–decay relationships for the four plankton community subsets were significant (Mantel’s r varied between −0.26 and −0.42; p < 0.01; Figure 3b). Consistent with the results of the phylogenetic null model, community subsets with strong distance–decay were strongly influenced by dispersal limitation (Figure 5c). Specifically, the core plankton communities exhibited stronger distance–decay than the random communities. The core community subsets were also more dispersal-limited, compared with the random subsets. These results contrast with a previous assumption that individuals of abundant taxa should have a greater dispersal potential than individuals from low abundance populations, regardless of taxon identity [47]. However, our results agree with a recent review by Jia et al. [28], which suggested that the highest community turnover results from dispersal limitation combined with drift. Dispersal limitation was previously found to prevail in the assembly of bacterial communities in ponds [56], soil permafrost of a boreal forest landscape [57], and in mineral-associated soils [58]. Microeukaryotes were also dispersal-limited in a subtropical marine ecosystem [59]. Together with our findings, these studies provide a contrasting view to the previously known ubiquity of microbial communities [60]. They also suggested a focus on dispersal limitation to manage and conserve the key ecosystem services provided by freshwater microbial populations, as has been previously suggested for soil microbiome [61].
Comparing bacterioplankton with microeukaryotes, Wu et al. [23] found a contrasting relative importance of selection and dispersal limitation shaping marine bacterial versus eukaryotic communities in the East China Sea. Logares et al. [20] further showed that bacteria were predominantly structured by ecological selection, and protists by ecological drift in lakes in the Vestfold Hills (Eastern Antarctica). In this study, both bacterioplankton and microeukaryotes were mainly structured by dispersal limitation, but exhibited distinct responses to environmental synchrony (Figure 5b). According to Hubbell’s neutral theory [44], dispersal limitation decreases community similarity along spatial gradients [9]. Organisms can show dispersal limitation either if their movement to a new location is restricted, or if establishment of individuals in a new location is hindered [47]. Environmental factors in the studied river–reservoir system were somehow spatially auto-correlated (Figure 2a). Therefore, one potential expectation would be that local environmental selection produces significant distance–decay relationships, in which compositional similarity between any two locations decreases as the geographical distance between them increases [47]. For instance, along an estuarine gradient in Moreton Bay (Australia), salinity was highly spatially auto-correlated, with highly saline conditions near the ocean and fresher conditions further inland [62]. Being highly sensitive to salinity, microbial communities in locations near the ocean were likely to be more similar to one another to a location further inland. In this study, water temperature, pH, dissolved oxygen, and oxidation–reduction potential were elevated in reservoir sites of Shidou and Bantou. Nutrient concentrations and salinity were higher in downstream sites located in urban area than upstream (Figure 2a). Therefore, environmental selection and ecological drift (often embedded in the ‘undominated fraction’; Figure 5c) might have generated the observed distance–decay relationships, as both processes accounted for a significant percentage of pairwise comparisons. This observation may be supported by fact that the study area is relatively small but longitudinally connected, and the low percentage of community variation of both core and random plankton explained the by the NCM (< 50%; Table 1). Finally, the two models employed here have been both praised and criticized [14]. Calls for more inclusive and mechanistic approaches have been made, due to challenges associated with them. These challenges include, but are not limited to the fact that using observational data alone may hardly allow more or less reliable inferences about underlying causal processes. In addition, microbial speciation and diversification are certainly important factors in generating the diversity and distribution patterns of microorganisms across ecosystems. Neither the NCM nor the phylogenetic null model can be used to discern the relative role of speciation.

5. Conclusions

Our study was carried out in a longitudinally connected river–reservoir system which drains an urbanizing watershed in its downstream section. Dispersal limitation could primarily shape the upstream–downstream community decay of the high and low abundant taxa (core and random). This observation was common for both bacterioplankton and microeukaryote plankton communities. Since plankton are passively dispersed by the unidirectional water movement in the studied small-scale system, dispersal seemed not to be significantly restricted. Similar distribution patterns and similar prevalence of ecological processes acting on particular subsets of the studied plankton communities might be the result of similar responses to longitudinal environmental change. These changes were potentially induced by strong human activities in the watershed, and were coupled with the directional recruitment driven by the flow of water in the landscape to control plankton community changes. These findings constitute the first step for testing the species coexistence theory [55], because microbial taxa presumably occupy discrete habitat patches. However, they could be better validated by future studies that could incorporate coalescence of taxa from adjacent microhabitats such as sediments, soils, biofilms, and groundwater recruitment from hyporheic zones. Our findings imply that human-induced hydrological change and anthropogenic pollution in freshwater ecosystems influence plankton taxonomic distribution and the assembly processes underlying plankton communities. In turn, this may influence ecosystem functioning along the river.

Supplementary Materials

The following are available online at https://www.mdpi.com/2073-4441/11/6/1127/s1, Figure S1: Rarefaction curves of the studied plankton communities in the Houxi River, Figure S2: Density plots exemplifying the spatial abundance distributions of typical core and random OTUs of bacteria and microeukaryotes, Figure S3: Heatmaps of taxonomic affiliation and site clustering of core and random bacterioplankton and microeukaryotes at phylum level, Figure S4: Upstream-downstream variation in the number of sequences assigned to different bacterial taxa, Figure S5: Upstream-downstream variation in the number of sequences assigned to different microeukaryotic taxa, Figure S6: Correlations between spatial proximity and core or random plankton community similarities within different distance classes, Figure S7: Relationships between Bray-Curtis dissimilarities of microeukaryotes and bacterioplankton in different taxa categories, Figure S8: Spearman correlations between the environmental variables and the number of OTUs for each plankton community facet.

Author Contributions

This study was conceived and designed by J.Y. Samples were collected by H.C., Y.W., and A.I., H.C. determined physico-chemical parameters and nutrient concentrations. A.I., K.R., Y.W. and F.P. extracted DNA, performed bioinformatics and analyzed the plankton data. A.I. and J.Y. interpreted the data and wrote the first draft of the manuscript. All authors discussed the results and contributed to the development of the manuscript.

Funding

This study was funded by the National Natural Science Foundation of China (91851104 and 31672312), the Strategic Priority Research Program of the Chinese Academy of Sciences (XDA23040302), and the Key Laboratory of Urban Environment and Health, Institute of Urban Environment, Chinese Academy of Sciences (KLUEH-C-201801).

Acknowledgments

We thank David M. Wilkinson for polishing the English. We acknowledge the support by the Wuhan Supercomputing Center, Chinese Academy of Sciences, and thank Lemian Liu and Jun R. Yang for their assistance in field samplings. We also thank Jean Claude Ndayishimiye and two anonymous reviewers for their comments during the peer-review process. A.I. acknowledges the CAS-TWAS President’s Fellowship for international students in China.

Conflicts of Interest

The authors declare no conflict of interest.

References

  1. Russell, J.A.; Dubilier, N.; Rudgers, J.A. Nature’s microbiome: Introduction. Mol. Ecol. 2014, 23, 1225–1237. [Google Scholar] [CrossRef]
  2. Locey, K.J.; Lennon, J.T. Scaling laws predict global microbial diversity. Proc. Natl. Acad. Sci. USA 2016, 113, 5970–5975. [Google Scholar] [CrossRef] [Green Version]
  3. Sogin, M.L.; Morrison, H.G.; Huber, J.A.; Mark Welch, D.; Huse, S.M.; Neal, P.R.; Arrieta, J.M.; Herndl, G.J. Microbial diversity in the deep sea and the underexplored “rare biosphere”. Proc. Natl. Acad. Sci. USA 2006, 103, 12115–12120. [Google Scholar] [CrossRef]
  4. Nemergut, D.R.; Schmidt, S.K.; Fukami, T.; O’Neill, S.P.; Bilinski, T.M.; Stanish, L.F.; Knelman, J.E.; Darcy, J.L.; Lynch, R.C.; Wickey, P. Patterns and processes of microbial community assembly. Microbiol. Mol. Biol. Rev. 2013, 77, 342–356. [Google Scholar] [CrossRef] [PubMed]
  5. Shade, A.; Dunn, R.R.; Blowes, S.A.; Keil, P.; Bohannan, B.J.M.; Herrmann, M.; Kusel, K.; Lennon, J.T.; Sanders, N.J.; Storch, D.; et al. Macroecology to unite all life, large and small. Trends Ecol. Evol. 2018, 33, 731–744. [Google Scholar] [CrossRef]
  6. Savio, D.; Sinclair, L.; Ijaz, U.Z.; Parajka, J.; Reischer, G.H.; Stadler, P.; Blaschke, A.P.; Bloschl, G.; Mach, R.L.; Kirschner, A.K.T.; et al. Bacterial diversity along a 2600 km river continuum. Environ. Microbiol. 2015, 17, 4994–5007. [Google Scholar] [CrossRef] [PubMed]
  7. Zeglin, L.H. Stream microbial diversity in response to environmental changes: Review and synthesis of existing research. Front. Microbiol. 2015, 6, 454. [Google Scholar] [CrossRef] [PubMed]
  8. Isabwe, A.; Yang, J.R.; Wang, Y.; Liu, L.; Chen, H.; Yang, J. Community assembly processes underlying phytoplankton and bacterioplankton across a hydrologic change in a human-impacted river. Sci. Total Environ. 2018, 630, 658–667. [Google Scholar] [CrossRef] [PubMed]
  9. Liu, T.; Zhang, A.N.; Wang, J.W.; Liu, S.F.; Jiang, X.T.; Dang, C.Y.; Ma, T.; Liu, S.T.; Chen, Q.; Xie, S.G.; et al. Integrated biogeography of planktonic and sedimentary bacterial communities in the Yangtze River. Microbiome 2018, 6, 16. [Google Scholar] [CrossRef]
  10. Read, D.S.; Gweon, H.S.; Bowes, M.J.; Newbold, L.K.; Field, D.; Bailey, M.J.; Griffiths, R.I. Catchment-scale biogeography of riverine bacterioplankton. ISME J. 2015, 9, 516–526. [Google Scholar] [CrossRef]
  11. Xenopoulos, M.A.; Downing, J.A.; Kumar, M.D.; Menden-Deuer, S.; Voss, M. Headwaters to oceans: Ecological and biogeochemical contrasts across the aquatic continuum. Limnol. Oceanogr. 2017, 62, S3–S14. [Google Scholar] [CrossRef]
  12. Niño-García, J.P.; Ruiz-González, C.; Del Giorgio, P.A. Interactions between hydrology and water chemistry shape bacterioplankton biogeography across boreal freshwater networks. ISME J. 2016, 10, 1755–1766. [Google Scholar] [CrossRef] [Green Version]
  13. Mo, Y.; Zhang, W.; Yang, J.; Lin, Y.; Yu, Z.; Lin, S. Biogeographic patterns of abundant and rare bacterioplankton in three subtropical bays resulting from selective and neutral processes. ISME J. 2018, 12, 2198–2210. [Google Scholar] [CrossRef] [Green Version]
  14. Zhou, J.; Ning, D. Stochastic community assembly: Does it matter in microbial ecology? Microbiol. Mol. Biol. Rev. 2017, 81, e00002-17. [Google Scholar] [CrossRef]
  15. Hubbell, S.P.; Borda-De-Agua, L. The unified neutral theory of biodiversity and biogeography: Reply. Ecology 2004, 85, 3175–3178. [Google Scholar] [CrossRef]
  16. Vellend, M. Conceptual synthesis in community ecology. Q. Rev. Biol. 2010, 85, 183–206. [Google Scholar] [CrossRef]
  17. Dini-Andreote, F.; Stegen, J.C.; van Elsas, J.D.; Salles, J.F. Disentangling mechanisms that mediate the balance between stochastic and deterministic processes in microbial succession. Proc. Natl Acad. Sci. USA 2015, 112, E1326–E1332. [Google Scholar] [CrossRef]
  18. Yan, Q.; Stegen, J.C.; Yu, Y.; Deng, Y.; Li, X.; Wu, S.; Dai, L.; Zhang, X.; Li, J.; Wang, C.; et al. Nearly a decade-long repeatable seasonal diversity patterns of bacterioplankton communities in the eutrophic Lake Donghu (Wuhan, China). Mol. Ecol. 2017, 26, 3839–3850. [Google Scholar] [CrossRef]
  19. Danczak, R.E.; Johnston, M.D.; Kenah, C.; Slattery, M.; Wilkins, M.J. Microbial community cohesion mediates community turnover in unperturbed aquifers. mSystems 2018, 3, e00066-18. [Google Scholar] [CrossRef]
  20. Logares, R.; Tesson, V.M.S.; Canbäck, B.; Pontarp, K.M.; Hedlund, R.K. Contrasting prevalence of selection and drift in the community structuring of bacteria and microbial eukaryotes. Environ. Microbiol. 2018, 20, 2231–2240. [Google Scholar] [CrossRef]
  21. Stegen, J.C.; Lin, X.J.; Fredrickson, J.K.; Chen, X.Y.; Kennedy, D.W.; Murray, C.J.; Rockhold, M.L.; Konopka, A. Quantifying community assembly processes and identifying features that impose them. ISME J. 2013, 7, 2069–2079. [Google Scholar] [CrossRef]
  22. Massana, R.; Logares, R. Eukaryotic versus prokaryotic marine picoplankton ecology. Environ. Microbiol. 2013, 15, 1254–1261. [Google Scholar] [CrossRef] [PubMed]
  23. Wu, W.X.; Lu, H.P.; Sastri, A.; Yeh, Y.C.; Gong, G.C.; Chou, W.C.; Hsieh, C.H. Contrasting the relative importance of species sorting and dispersal limitation in shaping marine bacterial versus protist communities. ISME J. 2018, 12, 485–494. [Google Scholar] [CrossRef]
  24. Pedrós-Alió, C. The rare bacterial biosphere. Annu. Rev. Mar. Sci. 2012, 4, 449–466. [Google Scholar] [CrossRef] [PubMed]
  25. De Vargas, C.; Audic, S.; Henry, N.; Decelle, J.; Mahe, F.; Logares, R.; Lara, E.; Berney, C.; Le Bescot, N.; Probert, I.; et al. Ocean plankton. Eukaryotic plankton diversity in the sunlit ocean. Science 2015, 348, 1261605. [Google Scholar] [CrossRef] [PubMed]
  26. Lynch, M.D.J.; Neufeld, J.D. Ecology and exploration of the rare biosphere. Nat. Rev. Microbiol. 2015, 13, 217–229. [Google Scholar] [CrossRef]
  27. Niño-García, J.P.; Ruiz-González, C.; Del Giorgio, P.A. Landscape-scale spatial abundance distributions discriminate core from random components of boreal lake bacterioplankton. Ecol. Lett. 2016, 19, 1506–1515. [Google Scholar] [CrossRef]
  28. Jia, X.; Dini-Andreote, F.; Salles, J.F. Community assembly processes of the microbial rare biosphere. Trends Microbiol. 2018, 26, 738–747. [Google Scholar] [CrossRef]
  29. Ruiz-González, C.; Niño-García, J.P.; Kembel, S.W.; del Giorgio, P.A. Identifying the core seed bank of a complex boreal bacterial metacommunity. ISME J. 2017, 11, 2012–2021. [Google Scholar] [CrossRef] [Green Version]
  30. Shade, A.; Jones, S.E.; Caporaso, J.G.; Handelsman, J.; Knight, R.; Fierer, N.; Gilbert, J.A. Conditionally rare taxa disproportionately contribute to temporal changes in microbial diversity. mBio 2014, 5, e01371-14. [Google Scholar] [CrossRef]
  31. Liu, M.; Liu, L.; Chen, H.; Yu, Z.; Yang, J.; Xue, Y.; Huang, B.; Yang, J. Community dynamics of free-living and particle-attached bacteria following a reservoir Microcystis bloom. Sci. Total Environ. 2019, 660, 501–511. [Google Scholar] [CrossRef] [PubMed]
  32. Matthews, T.J.; Whittaker, R.J. Neutral theory and the species abundance distribution: Recent developments and prospects for unifying niche and neutral perspectives. Ecol. Evol. 2014, 4, 2263–2277. [Google Scholar] [CrossRef]
  33. Zhu, Z.X.; Gao, X.F.; Peng, F.; Chen, H.H.; Tang, L.N.; Yang, J. Relationship between water quality and landscape characteristics of Houxi River watershed in Xiamen city along a rural-urban gradient. Acta Ecol. Sin. 2019, 39, 2021–2033. (In Chinese) [Google Scholar]
  34. Peng, F.; Isabwe, A.; Guo, Y.; Chen, H.; Yang, J. An extensively shared antibiotic resistome among four seasons suggests management prioritization in a subtropical riverine ecosystem. Sci. Total Environ. 2019, 673, 533–540. [Google Scholar] [CrossRef]
  35. Yang, J.; Yu, X.Q.; Liu, L.M.; Zhang, W.J.; Guo, P.Y. Algae community and trophic state of subtropical reservoirs in southeast Fujian, China. Environ. Sci. Pollut. Res. 2012, 19, 1432–1442. [Google Scholar] [CrossRef] [Green Version]
  36. Caporaso, J.G.; Kuczynski, J.; Stombaugh, J.; Bittinger, K.; Bushman, F.D.; Costello, E.K.; Fierer, N.; Pena, A.G.; Goodrich, J.K.; Gordon, J.I.; et al. QIIME allows analysis of high-throughput community sequencing data. Nat. Methods 2010, 7, 335–336. [Google Scholar] [CrossRef] [Green Version]
  37. Rognes, T.; Flouri, T.; Nichols, B.; Quince, C.; Mahé, F. VSEARCH: A versatile open source tool for metagenomics. PeerJ 2016, 4, e2584. [Google Scholar] [CrossRef]
  38. DeSantis, T.Z.; Hugenholtz, P.; Larsen, N.; Rojas, M.; Brodie, E.L.; Keller, K.; Huber, T.; Dalevi, D.; Hu, P.; Andersen, G.L. Greengenes, a chimera-checked 16S rRNA gene database and workbench compatible with ARB. Appl. Environ. Microbiol. 2006, 72, 5069–5072. [Google Scholar] [CrossRef] [PubMed]
  39. Guillou, L.; Bachar, D.; Audic, S.; Bass, D.; Berney, C.; Bittner, L.; Boutte, C.; Burgaud, G.; de Vargas, C.; Decelle, J.; et al. The Protist Ribosomal Reference database (PR2): A catalog of unicellular eukaryote small sub-unit rRNA sequences with curated taxonomy. Nucleic Acids Res. 2013, 41, D597–D604. [Google Scholar] [CrossRef]
  40. Maechler, M. Diptest: Hartigan’s Dip Test Statistic for Unimodality-Corrected. R Package Version 0.75-7. Available online: https://CRAN.R-project.org/package=diptest (accessed on 17 December 2018).
  41. Delignette-Muller, M.L.; Dutang, C. Fitdistrplus: An R package for fitting distributions. J. Stat. Softw. 2014, 64, 1–34. [Google Scholar]
  42. Matesanz, S.; Gimeno, T.E.; de la Cruz, M.; Escudero, A.; Valladares, F. Competition may explain the fine-scale spatial patterns and genetic structure of two co-occurring plant congeners. J. Ecol. 2011, 99, 838–848. [Google Scholar] [CrossRef] [Green Version]
  43. Sloan, W.T.; Woodcock, S.; Lunn, M.; Head, I.M.; and Curtis, T.P. Modeling taxa-abundance distributions in microbial communities using environmental sequence data. Microb. Ecol. 2007, 53, 443–455. [Google Scholar] [CrossRef]
  44. Hubbell, S.P. The Unified Neutral Theory of Biodiversity and Biogeography (MPB-32); Princeton University Press: Princeton, NJ, USA, 2001. [Google Scholar]
  45. Kembel, S.W.; Cowan, P.D.; Helmus, M.R.; Cornwell, W.K.; Morlon, H.; Ackerly, D.D.; Blomberg, S.P.; Webb, C.O. Picante: R tools for integrating phylogenies and ecology. Bioinformatics 2010, 26, 1463–1464. [Google Scholar] [CrossRef] [Green Version]
  46. Herren, C.M.; McMahon, K.D. Cohesion: A method for quantifying the connectivity of microbial communities. ISME J. 2017, 11, 2426–2438. [Google Scholar] [CrossRef]
  47. Hanson, C.A.; Fuhrman, J.A.; Horner-Devine, M.C.; Martiny, J.B.H. Beyond biogeographic patterns: Processes shaping the microbial landscape. Nat. Rev. Microbiol. 2012, 10, 497–506. [Google Scholar] [CrossRef]
  48. Liu, L.M.; Yang, J.; Yu, Z.; Wilkinson, D.M. The biogeography of abundant and rare bacterioplankton in the lakes and reservoirs of China. ISME J. 2015, 9, 2068–2077. [Google Scholar] [CrossRef]
  49. Graham, E.B.; Stegen, J.C. Dispersal-based microbial community assembly decreases biogeochemical function. Processes 2017, 5, 65. [Google Scholar] [CrossRef]
  50. Stegen, J.C. At the nexus of history, ecology, and hydrobiogeochemistry: Improved predictions across scales through integration. mSystems 2018, 3, e00167-17. [Google Scholar] [CrossRef]
  51. Liao, J.Q.; Cao, X.F.; Wang, J.; Zhao, L.; Sun, J.H.; Jiang, D.L.; Huang, Y. Similar community assembly mechanisms underlie similar biogeography of rare and abundant bacteria in lakes on Yungui Plateau, China. Limnol. Oceanogr. 2017, 62, 723–735. [Google Scholar] [CrossRef] [Green Version]
  52. Liao, J.; Cao, X.; Zhao, L.; Wang, J.; Gao, Z.; Wang, M.C.; Huang, Y. The importance of neutral and niche processes for bacterial community assembly differs between habitat generalists and specialists. FEMS Microbiol. Ecol. 2016, 92, fiw174. [Google Scholar] [CrossRef] [Green Version]
  53. Wu, W.X.; Liu, H.B. Disentangling protist communities identified from DNA and RNA surveys in the Pearl River-South China Sea Continuum during the wet and dry seasons. Mol. Ecol. 2018, 27, 4627–4640. [Google Scholar] [CrossRef] [PubMed]
  54. Mansour, I.; Heppell, C.M.; Ryo, M.; Rillig, M.C. Application of the microbial community coalescence concept to riverine networks. Biol. Rev. 2018, 93, 1832–1845. [Google Scholar] [CrossRef] [Green Version]
  55. Leibold, M.A.; Urban, M.C.; De Meester, L.; Klausmeier, C.A.; Vanoverbeke, J. Regional neutrality evolves through local adaptive niche evolution. Proc. Natl Acad. Sci. USA 2019, 116, 2612–2617. [Google Scholar] [CrossRef] [Green Version]
  56. Hu, A.; Li, S.; Zhang, L.; Wang, H.; Yang, J.; Luo, Z.; Rashid, A.; Chen, S.; Huang, W.; Yu, C.-P. Prokaryotic footprints in urban water ecosystems: A case study of urban landscape ponds in a coastal city, China. Environ. Pollut. 2018, 242, 1729–1739. [Google Scholar] [CrossRef]
  57. Bottos, E.M.; Kennedy, D.W.; Romero, E.B.; Fansler, S.J.; Brown, J.M.; Bramer, L.M.; Chu, R.K.; Tfaily, M.M.; Jansson, J.K.; Stegen, J.C. Dispersal limitation and thermodynamic constraints govern spatial structure of permafrost microbial communities. FEMS Microbiol. Ecol. 2018, 94, fiy110. [Google Scholar] [CrossRef]
  58. Whitman, T.; Neurath, R.; Perera, A.; Chu-Jacoby, I.; Ning, D.; Zhou, J.; Nico, P.; Pett-Ridge, J.; Firestone, M. Microbial community assembly differs across minerals in a rhizosphere microcosm. Environ. Microbiol. 2018, 20, 4444–4460. [Google Scholar] [CrossRef] [PubMed] [Green Version]
  59. Zhang, H.; Huang, X.; Huang, L.; Bao, F.; Xiong, S.; Wang, K.; Zhang, D. Microeukaryotic biogeography in the typical subtropical coastal waters with multiple environmental gradients. Sci. Total Environ. 2018, 635, 618–628. [Google Scholar] [CrossRef] [PubMed]
  60. Fenchel, T.; Finlay, B.J. The ubiquity of small species: Patterns of local and global diversity. Bioscience 2004, 54, 777–784. [Google Scholar] [CrossRef]
  61. Powell, J.R.; Karunaratne, S.; Campbell, C.D.; Yao, H.Y.; Robinson, L.; Singh, B.K. Deterministic processes vary during community assembly for ecologically dissimilar taxa. Nat. Commun. 2015, 6, 8441. [Google Scholar] [CrossRef] [PubMed]
  62. Hewson, I.; Fuhrman, J.A. Richness and diversity of bacterioplankton species along an estuarine gradient in Moreton Bay, Australia. Appl. Environ. Microbiol. 2004, 70, 3425–3433. [Google Scholar] [CrossRef]
Figure 1. Map of the Houxi River watershed in Xiamen city, Southeast China, showing the ten sampling sites selected along the river continuum.
Water 11 01127 g001
Figure 2. Longitudinal variation in the averaged values of physical and chemical parameters and plankton community segregation based on spatial abundance distributions (SpADs) of individual taxa. (a) The minimum and maximum average values of sampled physico-chemical variables are shown by the blue and yellow extreme colors of the palette. Percentage of the OTUs and sequences assigned to each of the SpADs models for both bacterioplankton (b) and microeukaryotes (c). The inner pie charts illustrate the percentage of taxa assigned to core and random taxa, depending on their respective SpADs.
Water 11 01127 g002
Figure 3. Plankton community variation along the Houxi River continuum. (a) Changes in the bacterioplankton and microeukaryote sequences classified as core and random, respectively. (b) Distance–decay of core and random plankton community similarities measured using the Bray–Curtis distance. Mantel’s correlation coefficients (R) and the p-values are shown. The error bars in (a) represent the standard error of the mean (n = 10).
Water 11 01127 g003
Figure 4. Principal coordinate analysis (PCoA) of core and random plankton communities in the Houxi River. (a) Core bacterioplankton, (b) random bacterioplankton, (c) core microeukaryotes, and (d) random microeukaryotes. The R values indicate the global R of the ANOSIM based on ten groups of sampling sites. The colors of data points correspond to the sampling sites from upstream to downstream. The shapes of data points represent habitats of sampling sites (i.e., reservoir and river sites as shown in Figure 1).
Water 11 01127 g004
Figure 5. Community–environment relationships, community stability, and assembly processes. (a) Spearman correlations between the environmental variables and the number of sequences. (b) Violin plots illustrating positive and negative cohesion as a means to evaluate environmental synchrony among core and random communities. (c) Depiction of the assembly processes underlying the core and random microbial plankton communities. The percentages of pairwise comparisons that correspond to different ecological processes generating distribution patterns of core and random bacterioplankton and microeukaryotes taxa are shown. Low percentage contributions (< 1%) are not shown. WT: water temperature, DO: dissolved oxygen, Chl-a: chlorophyll-a, Tur: turbidity, EC: electrical conductivity, Sal: salinity, ORP: oxidation-reduction potential, TC: total carbon, TOC: total organic carbon, TN: total nitrogen, NO3: nitrate (nitrogen), NO2: nitrite (nitrogen), NH4: ammonium (nitrogen), TP: total phosphorus, PO4: phosphate (phosphorus).
Water 11 01127 g005
Table 1. Fit to the neutral community model for all, core, and random taxa communities of bacterioplankton and microeukaryotes in the Houxi River.
CategoryBacterioplanktonMicroeukaryotes
R2mR2m
All0.620.190.560.04
Core0.450.260.350.06
Random0.440.080.410.03
R2 indicates the fit to the neutral model. m indicates the corresponding immigration size.

