Water Balance Assessment under Different Glacier Coverage Scenarios in the Hunza Basin


1
College of Applied Sciences-Nepal, Tribhuvan University, Kathmandu 9303, Nepal
2
International Center for Integrated Mountain Development (ICIMOD), Kathmandu 3226, Nepal
*
Author to whom correspondence should be addressed.
Water 2019, 11(6), 1124; https://doi.org/10.3390/w11061124
Submission received: 5 April 2019
/
Revised: 7 May 2019
/
Accepted: 13 May 2019
/
Published: 29 May 2019
(This article belongs to the Special Issue Hydrological and Environmental Modeling: from Observations to Predictions)
Abstract
:The potential impact of glacier recession on river discharge from the Hunza river basin was estimated as an indicator for downstream changes in the Indus river system. The J2000 model was used to analyze the water balance in the basin and simulate the contribution of snow and ice melt to total discharge at present and under three scenarios of glacier recession. Precipitation was corrected using virtual weather stations created at a higher elevation and a precipitation gradient. Snowmelt from the whole basin contributed, on average, 45% of the total river discharge during the modeling period and 47% of the ice melt from the glacier area. Total ice melt declined by 55%, 81%, and 96% under scenarios of glacier recession to 4000, 4500, and 5000 masl, respectively. The contribution of ice melt to river discharge decreased to 29%, 14%, and 4% under the three scenarios, while total discharge from the Hunza river decreased by 28%, 40%, and 46%. The results suggest that glacier recession in the Hunza river basin could have serious implications for downstream water availability. Understanding melt contribution in the basin based on ongoing and projected future climatic change can play a crucial role in future water resource management.
1. Introduction
The Hindu Kush Himalaya (HKH) has some of the largest glaciers in the world [1]. They act as natural water storage—reservoirs that store precipitation in the winter in the form of snow and release it in the summer as meltwater [2]. A major part of the flow in the Indus river system in the western Himalaya comes from snow and glacier fed river catchments in the Karakoram region [3]. Modeling studies suggest that the contribution of snow and glacier melt in the Indus river is as high as 50–80% [4,5,6,7].
Climate change is expected to affect various components in the hydrological cycle [8]. Recent changes identified at high elevations in the Karakoram include shifts in seasonal temperatures, snowfall, and snow cover [9]. Temperature change is expected to adversely affect the glacier and ice reserves of the Himalayan region with a potential shift in the equilibrium line altitude (ELA), recession of glacier termini to higher elevations, and reduction in glacier area and ice volume [10]. Khattak, et al. [11] reported an increase in winter maximum temperatures between 1976 and 2005 in the upper, the middle, and the lower parts of the Indus basin of 1.79, 1.66, and 1.20 °C, respectively. Nepal and Shrestha [12] also reported an overall gradual increase in temperature in the Indus basin but with some differences in the reported seasonal trends. Bolch, et al. [13] project that HKH glaciers will lose more than one-third of their volume, even if warming is kept to 1.5 °C. In the first instance, rising temperatures are likely to lead to an increased melt rate and runoff [14]. Archer [15] suggests that a 1 °C rise in mean summer temperature would result in a 16% increase in summer runoff into the Hunza and the Shyok rivers due to accelerated glacier melt. However, as the glacier storage is reduced, the runoff is expected to decrease [14]. The changes in glacier mass and groundwater storage are likely to impact water resources at a regional scale. Reduction in runoff has serious implications for the extensive downstream areas of the Indus river and especially for the people who rely on meltwater for their water supply [16,17,18]. Climate change is projected to compound the pressure on natural resources and the environment associated with rapid urbanization, industrialization, and economic development [19] and interact with these resources in a complex way across the HKH [20]. Better understanding of the potential impact on downstream water availability resulting from changes in snow and glacier reserves in the high mountain catchments of the Indus will be crucial for future planning in the region.
The impact of potential changes in glaciers on water resources can be assessed using glacio-hydrological simulation [21,22,23], but developing reliable models is difficult in high mountain areas due to the lack of available input data and the extreme topography. Precipitation data are the most important input in distributed hydrological modeling of mountainous river basins [24], and uncertainty in spatial distribution and amount can strongly affect the results. Precipitation in the Himalayas remains poorly defined due to remoteness and the lack of reliable rainfall networks [25]. There are very few measuring stations in high mountain areas in the Himalayas, and even the available stations are mostly valley based [26,27], while the satellite derived precipitation products are generally of insufficient resolution and quality to capture the spatial variation and magnitude of mountain precipitation, especially at the basin scale [26].
The Hunza basin, a glaciated sub-catchment of the Indus river, was selected for a study of the impact of potential glacier recession on river discharge and indicator of potential downstream changes in the Indus river system. The flow regime of the Hunza river is dominated by snow and glacier melt runoff [4,5,28]. Various studies suggest that snow and glacier melt contribute 83–90% of flow in the basin, and that glacier ice melt alone contributes 33–85% [4,14,29]. The variation is in part due to the different way in which glacier ice melt processes are treated in the modeling context. Very few hydrological models have incorporated glacier mass change processes. These include the Spatial Processes in Hydrology (SPHY) cryosphere-hydrological model, which was used to calculate the change in glacier area resulting from climate change in the Hunza basin [30], and a glacier mass balance and ice redistribution model applied by Shea, et al. [31] in the Mount Everest region for historic and future periods.
The J2000 hydrological model was selected to simulate snow cover area and runoff in the basin. The model is designed for use at different catchment scales and has been used for simulations of flow elsewhere in the Himalayan region—in the eastern catchment of the Ganges [32,33,34] and the Tibetan Plateau [35]—as well as other parts of the world. The study had three main objectives: (1) to assess the capability of the J2000 model to perform the simulations of snow cover and river flow, (2) to simulate the contribution of snowmelt and different components of glacier melt to total river discharge, and (3) to test the potential effects of different scenarios of glacier recession on ice melt and river discharge. The novelty of the study lies in the application of the J2000 model to simulate hydrological processes in the western Himalaya using snow cover and discharge data and to assess the potential effects of glacier recession on water availability downstream.
2. Materials and Methods
2.1. Study Area
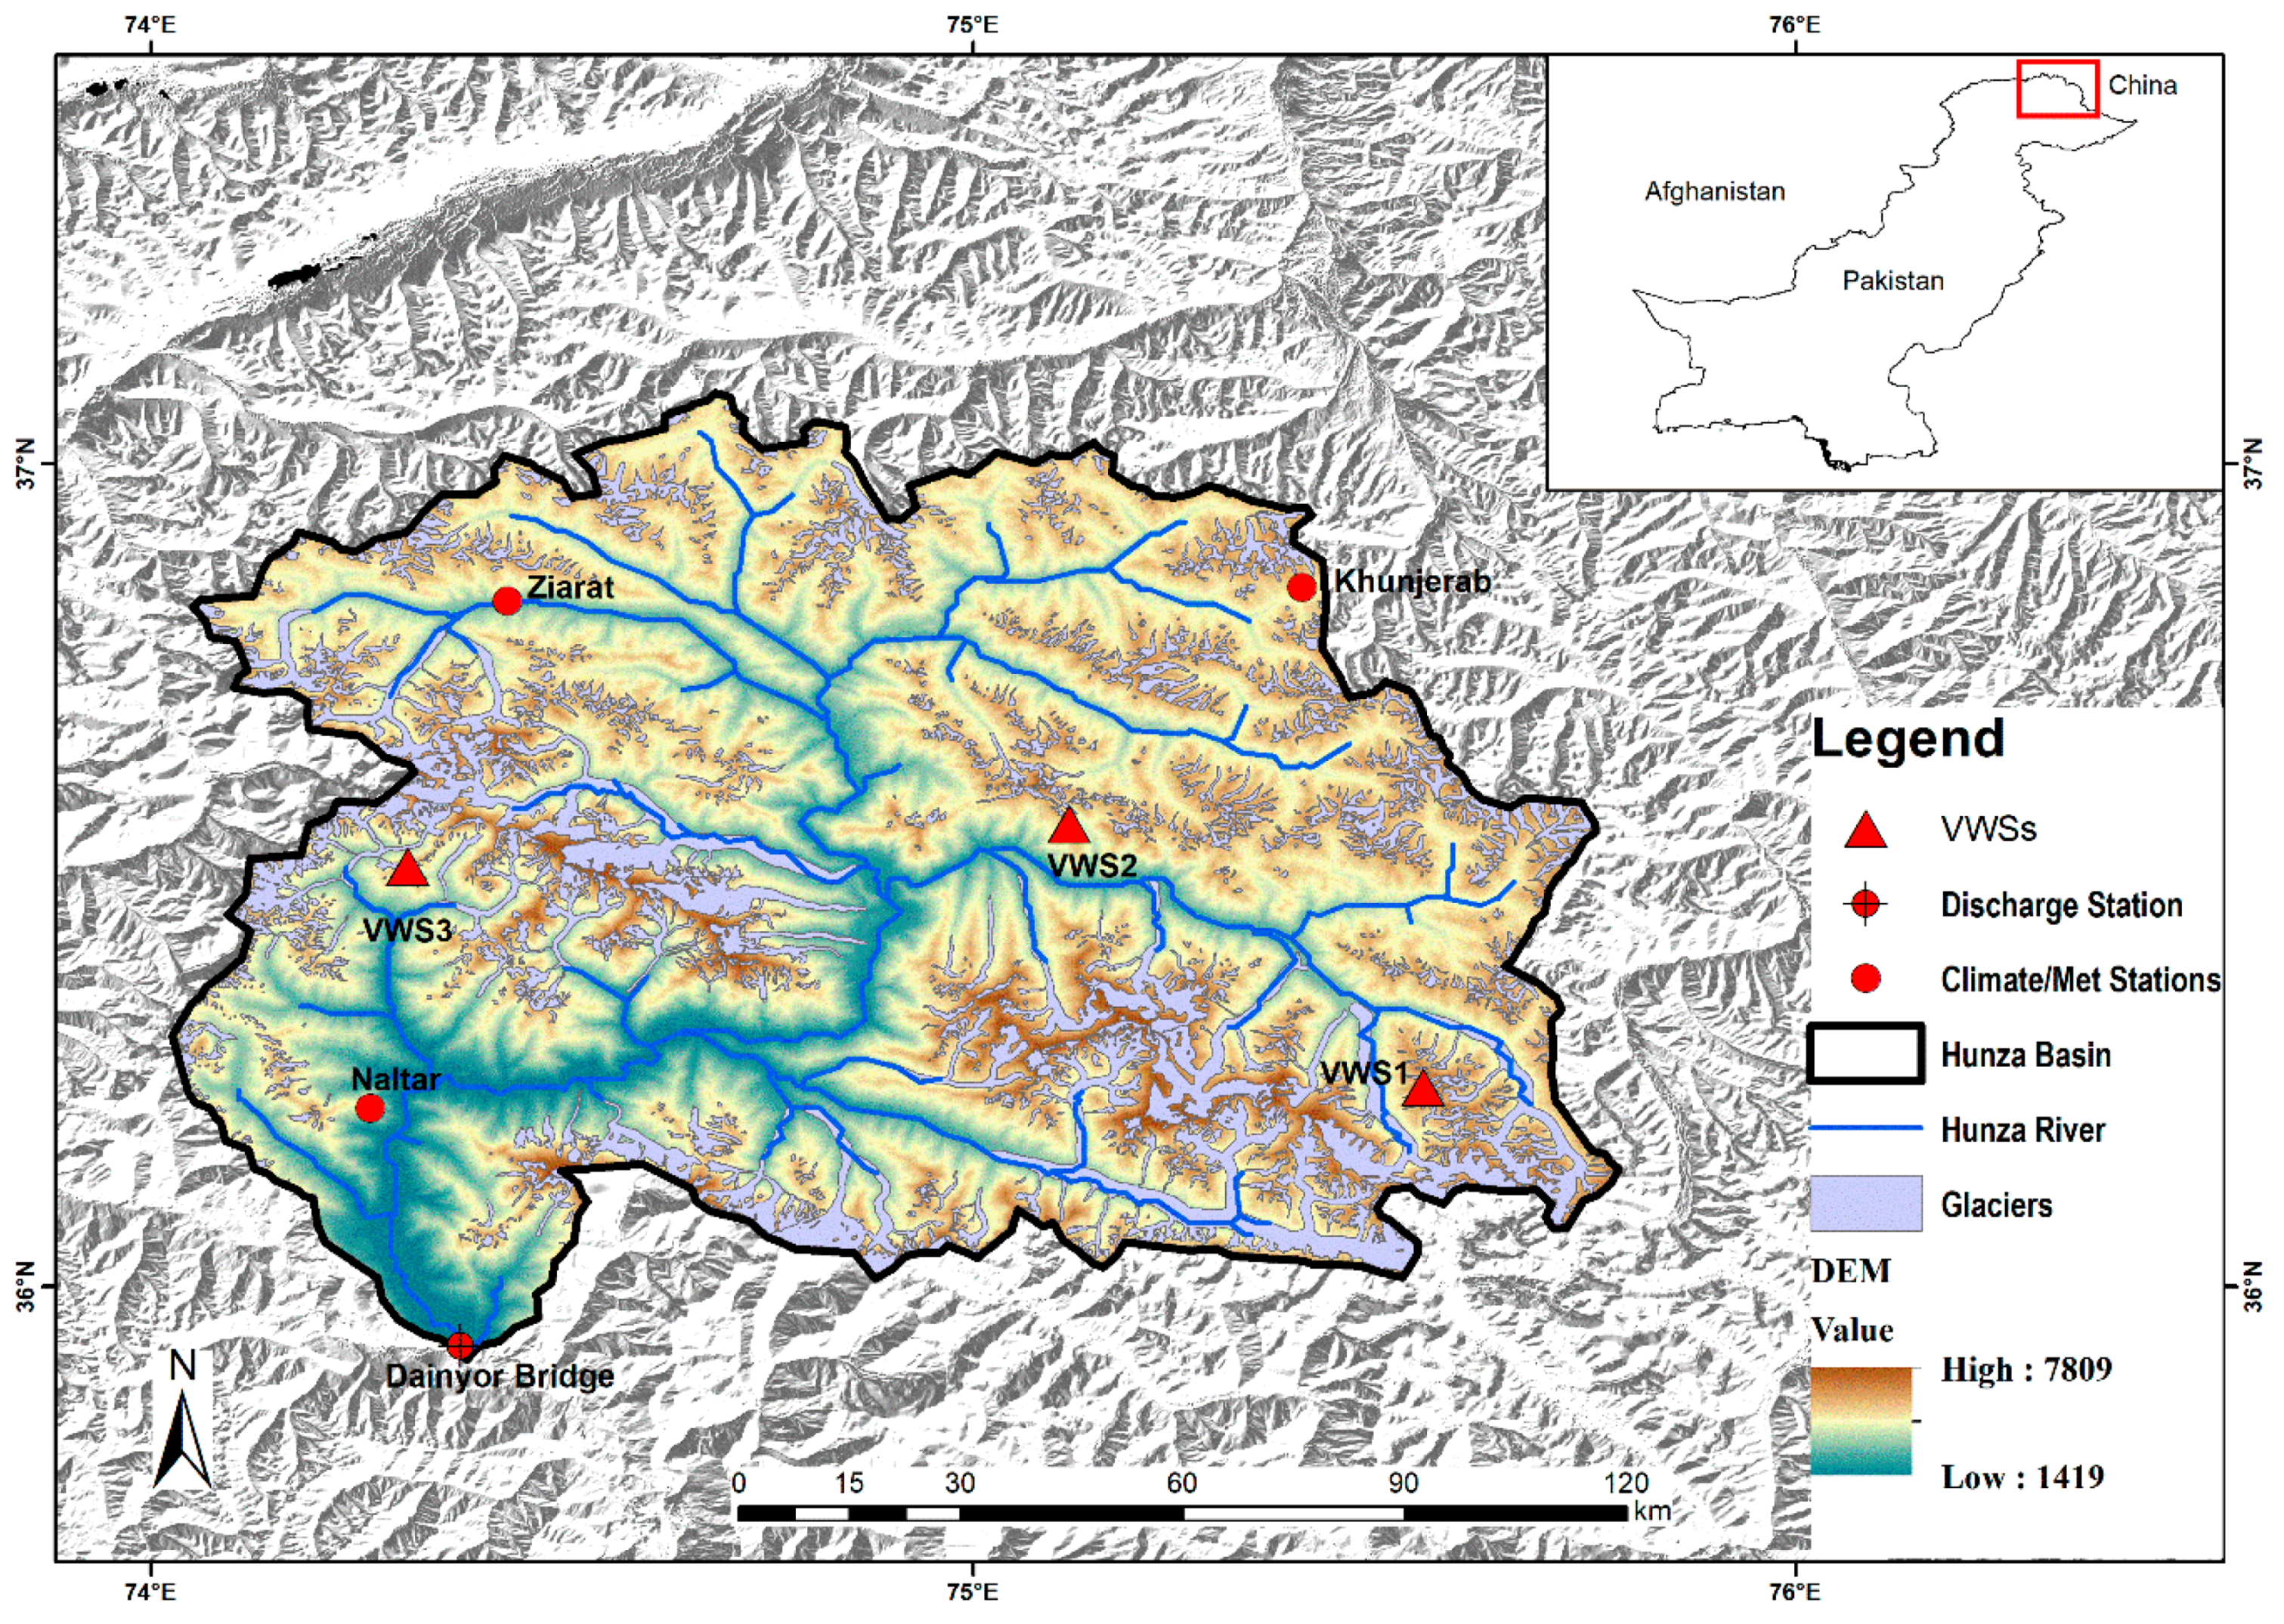
The study area was the Hunza river basin, a glaciated sub-catchment of the Indus river in the far north of the upper Indus basin in the western Karakoram Himalayan region of Pakistan (Figure 1). The basin has a total area of 13,761 km2 with an elevation range of 1419–7809 masl; 20% of the area is covered by glaciers. The discharge gauging station is at Dainyor bridge (1450 masl).
The Pakistan Water and Power Development Authority (WAPDA) has installed three climate stations with precipitation gauges at different elevations, as shown in Figure 1 and Table 2. Additional virtual weather stations were created for this study, and they are described below in Section 2.3.2. The Hunza basin has an arid to semi-arid climate characterized by cold winters and hot summers at lower altitudes, with a wide variation between temperature extremes. The high mountains limit the intrusion of the monsoon, whose influence weakens northwestward [36]. The westerly circulation brings weak intensity precipitation in both summers and winters, which is the primary source of precipitation, contributing about two-thirds of high-altitude snowfall in the Karakoram region [7]. The basin has close to 80% snow cover in winters and 30% in summers [3]. About 90% of the total glaciated area in the Karakoram range lies at 5000–6000 masl, and most of this area is in the accumulation zone [37]. Maximum precipitation occurs at an elevation of around 5500 masl [37,38].
The distribution of elevation range in a catchment area is crucial in hydrological modeling. Table 1 shows the hypsometry of the Hunza basin. Close to 80% of the basin area lies in the elevation range of 3500–5500 masl, thus any changes that occur in this elevation range could have a significant impact on the basin’s hydrological dynamics. Similarly, more than 50% of the glacier area lies in the elevation range of 4500–5500 masl, and this elevation range is particularly important for glacio-hydrological processes.
2.2. The J2000 Model
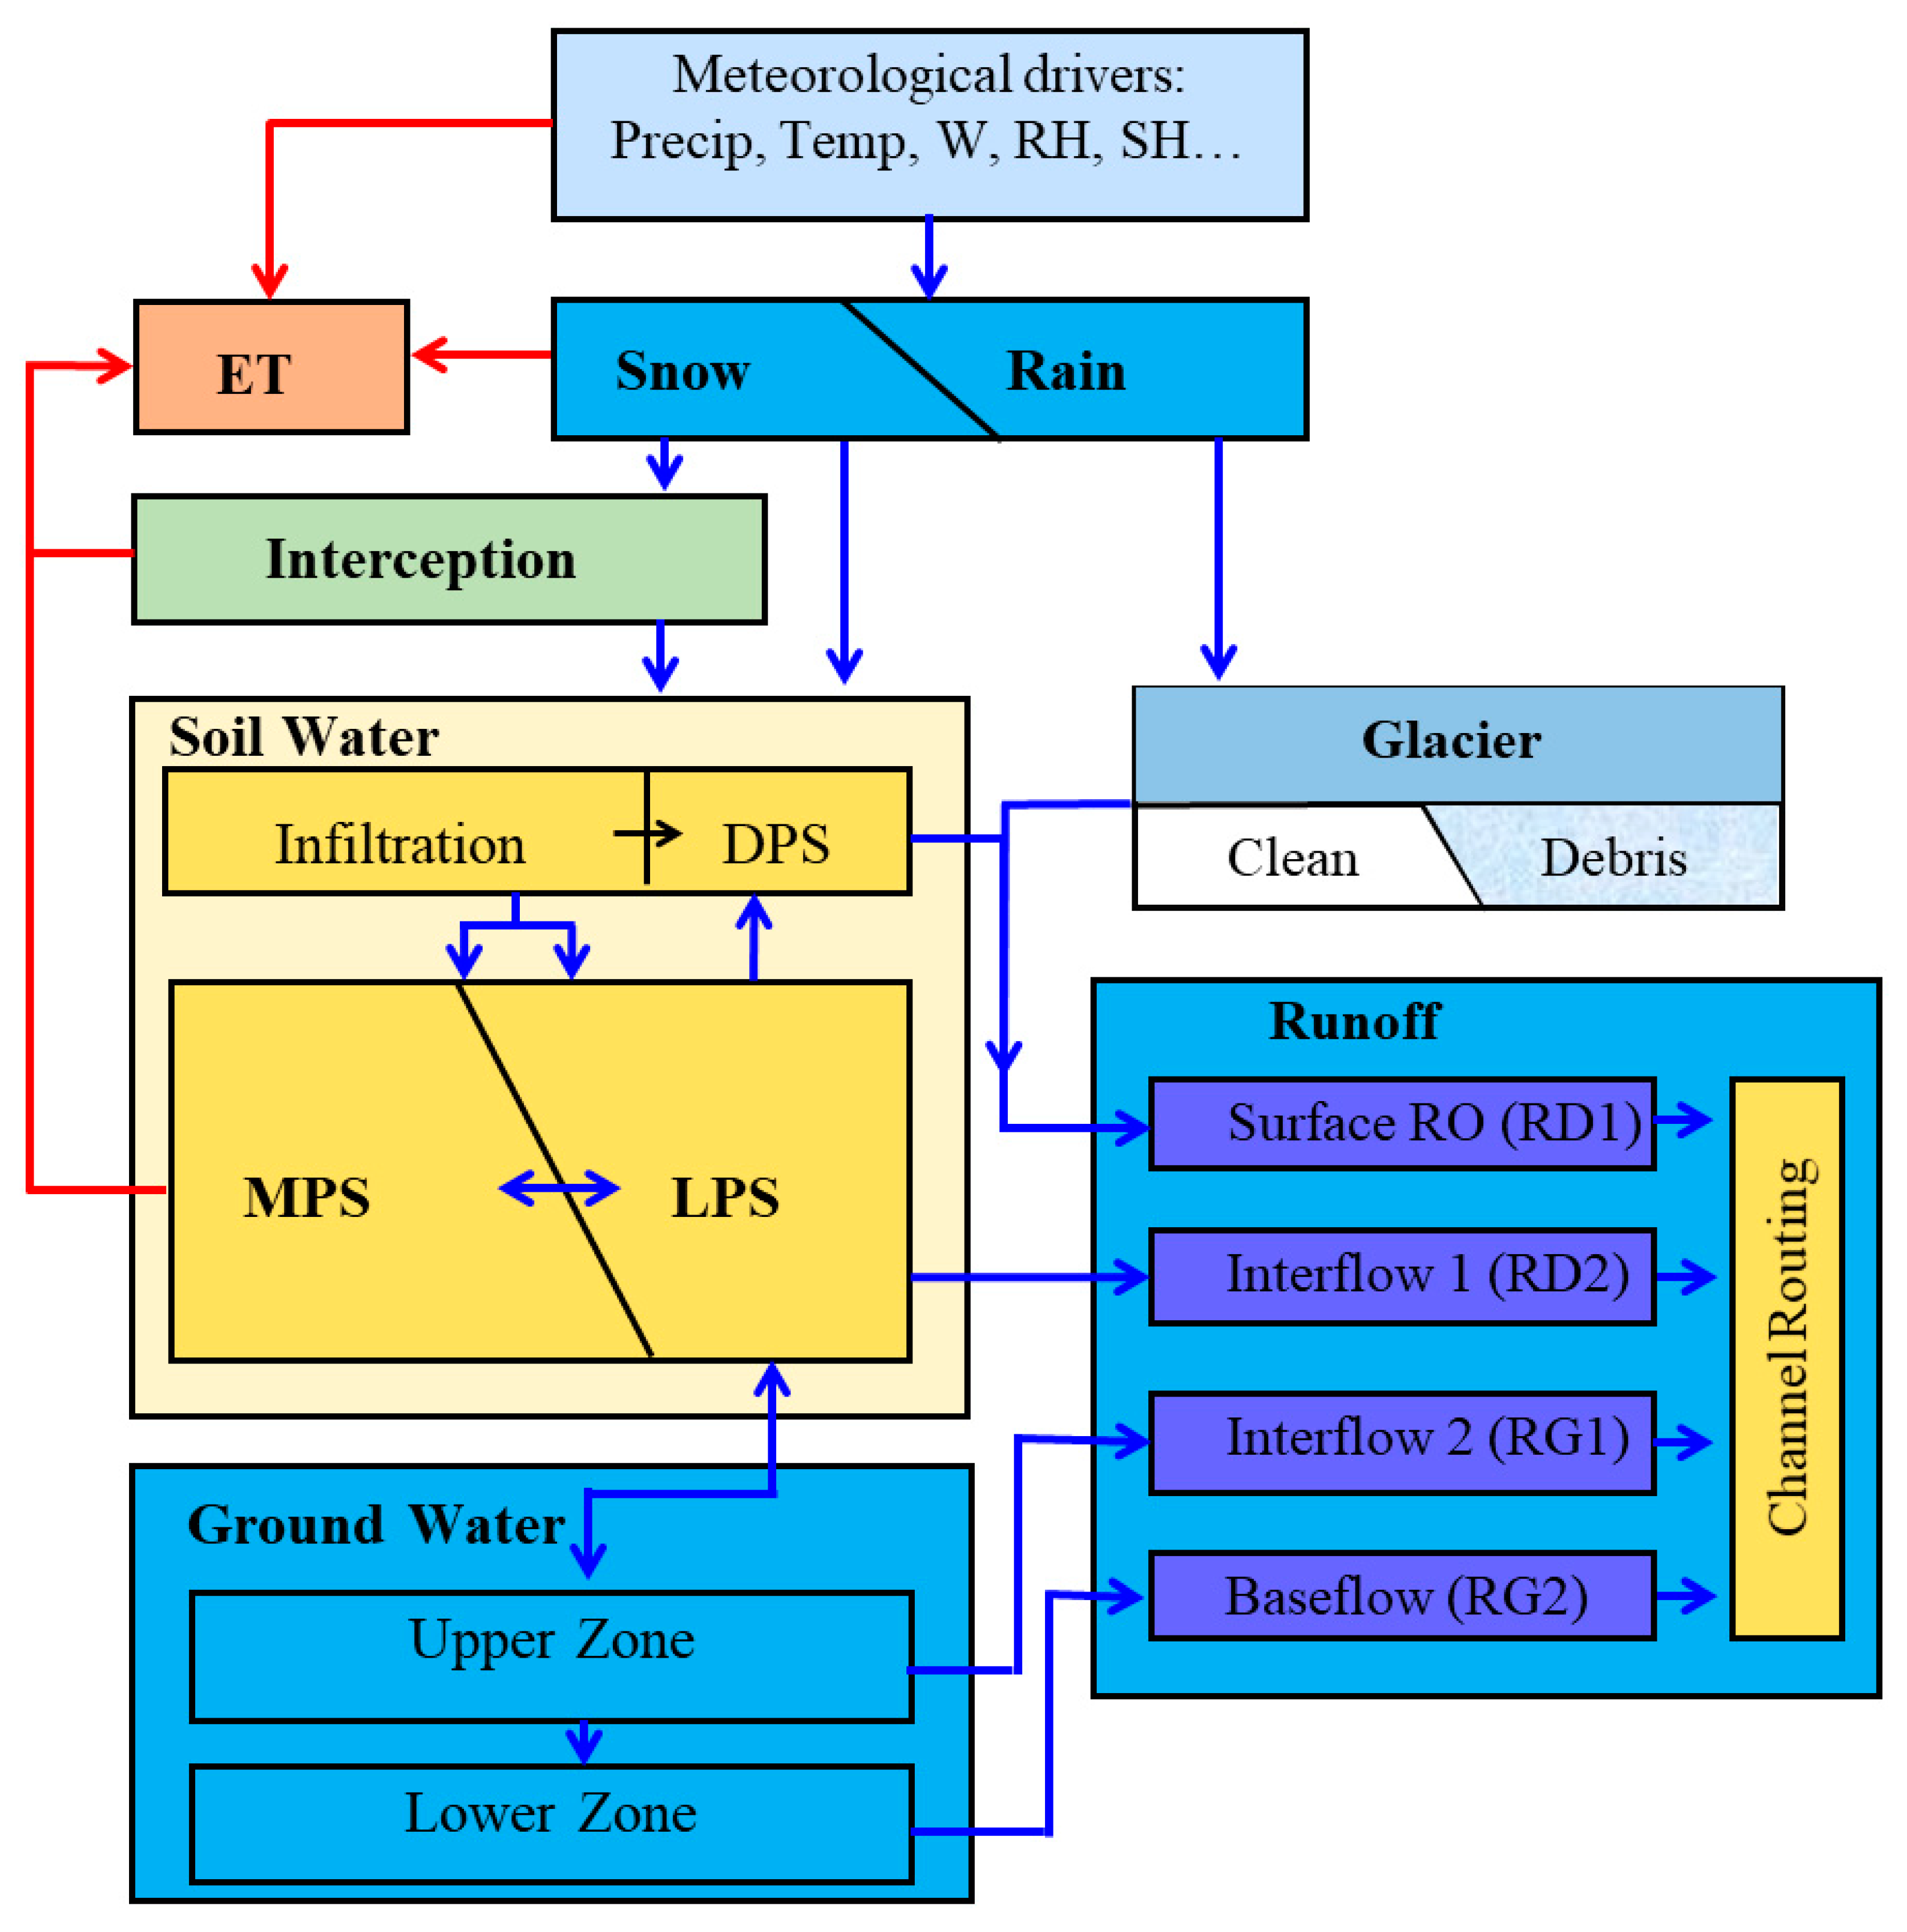
The J2000 hydrological model is a process-oriented hydrological model for hydrological simulations of mesoscale and macroscale catchments [39,40] implemented in the Jena Adaptable Modeling System (JAMS). JAMS is a software framework for component-based development and application of environmental models [41,42]. The simulation of different hydrological processes is carried out in encapsulated process modules, which are, to a great extent, independent of each other. The flexibility of this model allows changing, substituting, or adding of individual modules or processes without having to restructure the model from the start. A glacier module was integrated into the J2000 modeling system to simulate glacier runoff from a glacierized area. Figure 2 shows the system of different modules within the J2000 model.
The model takes into account all the important hydrological processes and components, such as interception, evapotranspiration, snow and glacier melt, soil water, groundwater, and routing. Details of the modeling application, model input data, and calibration parameters are provided in [33].
2.3. Model Input Data
2.3.1. Hydro-Meteorological Data
Table 2 shows the hydro-meteorological data available for the Hunza basin in the installed stations and a gauging station at Dainyor bridge. Wind speed (m/s) data were obtained from the Cultural Area of Khunjerab station installed by the University of Bonn close to Ziarat station. Sunshine hours data were obtained from the Meteorological Department of Pakistan. All data had a daily temporal resolution.
2.3.2. Precipitation Correction Using Lapse Rate
Precipitation uncertainty is one of the main challenges for hydrological simulation in the Hunza basin. The meteorological stations are all valley-based and lie below the elevation of maximum precipitation in the Karakoram region at 5000–6000 masl [43,44,45], thus the precipitation recorded at the stations is likely to represent under-catch [27]. To address this, three virtual weather stations (VWSs) were created at elevations around the maximum precipitation zone: VWS 1 at 5351 masl, VWS2 at 5393 masl, and VWS3 at 5364 masl (for location, see Figure 1). Precipitation at the VWSs was calculated using a vertical precipitation gradient (PG) of 0.04% m−1, as suggested in various studies [46,47,48,49,50], using the values from a linked observation station at lower elevation as the base. The precipitation at VWS1 was calculated using precipitation at Naltar station as a reference, at VWS2 using precipitation at Khunjerab station as a reference, and at VWS3 using precipitation at Ziarat station as reference. Table 3 shows details of the stations and average annual precipitation measured or calculated at each. The average annual precipitation in the Hunza basin during the modeling period was calculated to be 731 mm (using data from both the installed stations and the virtual weather stations). This is close to the estimate of 795 mm for the Hunza river catchment made by Khan and Koch [51] using a new approach for interpolation and regionalization of observed precipitation data across the upper Indus basin with adjustment for orographic effects and changes in glacier storage.
All six precipitation stations were used as precipitation input to the J2000 model, i.e., three physical stations and three virtual stations.
2.3.3. Hydrological Response Units (HRU)
The land cover data [52] were derived from the 300 m global land cover map from the European Space Agency GlobCover initiative. The fifteen GlobCover land cover classes found in the study area were reclassified to five classes that have similar effects on hydrological dynamics at a resolution of 500 m. The permanent snow and ice layers in GlobCover were combined and designated as bare land, because snow accumulation is calculated within the J2000 model. A glacier layer derived by ICIMOD [53] for the period 2005 ± 3 was overlaid on the land cover data.
Harmonized World Soil Database (HWSD) version 1.2 data [54] were used to determine the soil parameters in the model. Four major different soil types were found in the study area. Due to the lack of a geological dataset, geological information for the study area was derived from the basic geological characteristic of the region that controls maximum percolation rates and ground water storage. Three regional classes of geological information from the soil data and the literature were used. In the model, there is no infiltration or percolation to the soil in glacier areas, thus these are regarded as no soil areas.
The Shuttle Radar Topographic Mission (SRTM) digital elevation model (DEM) at 90 m resolution from the CGIAR Consortium for Spatial Information [55] was used to define the topography and delineate watershed boundaries and hydrological response units (HRUs). The preparation and the quantification of model parameter files were done in a GIS environment. For preparation of the soil parameter file, soil texture information in percentages was provided as input data to the software “HYDRUS 1D” to understand the pedo-transfer function of soils under three different pressure scenarios (0 mbar, 60 mbar, and 15,000 mbar). The parameter files and their values were static in the modeling application. All the input data (i.e., soil, land-cover, and DEM) were prepared in raster format at the same resolution of 500 m; this mainly controls the number of HRUs to be formed without losing the heterogeneity of a catchment. These data were used to delineate HRUs using the web-based tool (http:/intecral.uni-jena.de/hruweb).
2.4. Modeling Strategy
2.4.1. Calibration with Snow Cover
The J2000 simulated snow cover was compared with Moderate Resolution Imaging Spectroradiometer (MODIS) snow cover data [56] and the comparison used to calibrate the snow and glacier related parameters. The snow cover comparison was carried out from March 2000 to November 2010. MODIS snow products have been used by others to understand snow extent in the Indus basin [3,4,14]. Both the coefficient of determination (R2) and visual inspection were used to compare the modeled snow extent with MODIS snow extent.
2.4.2. Calibration and Validation with Discharge
The ice melt and rainfall-runoff parameters were then calibrated by comparing the simulated discharge with the observed discharge measured at Dainyor bridge. Simulated discharge data from the model for the period 2000–2004 were used for calibration and for 2008–2010 for validation. The model performance was evaluated using both efficiency criteria and visual inspection related to systematic (over and under prediction) and dynamic (timing, rising/falling limb, and base flow) behaviors of the model. A combination of four different efficiency criteria—Kling-Gupta efficiency (KGE), Nash-Sutcliffe efficiency (ENS), logarithm of Nash-Sutcliffe (LNS), and coefficient of determination (R2)—was used, as a single criterion often cannot provide a complete picture of model performance [57]. KGE is a decomposition of ENS that facilitates analysis of the relative importance of its different components in the context of hydrological modeling. ENS uses the observed mean as a baseline, which can lead to overestimation of a model’s skill for highly seasonal variables such as runoff in snowmelt dominated basins [58,59].
2.4.3. Discharge under Different Glacier Recession Scenarios
The Karakoram glaciers are in a transition phase from positive to negative mass balance [60]. There is a slightly negative mass balance in glaciers up to 5000 masl elevation [61]. Although most of the terrain is high enough to have temperatures sufficiently far below freezing to maintain glacier mass, climate models project that the warmer climate will lead to a reduction in annual snowfall of 20–40% in the upper Indus [62]. Reference [11] reported that the winter maximum temperature in the upper Indus basin increased at an average rate of 1.79 °C per 39 years between 1987 and 2005. If this type of temperature increase continues, it could lead to increased glacier melt and recession of glaciers, converting the glacier area to bare land.
3. Results and Discussion
3.1. Snow Cover Simulation
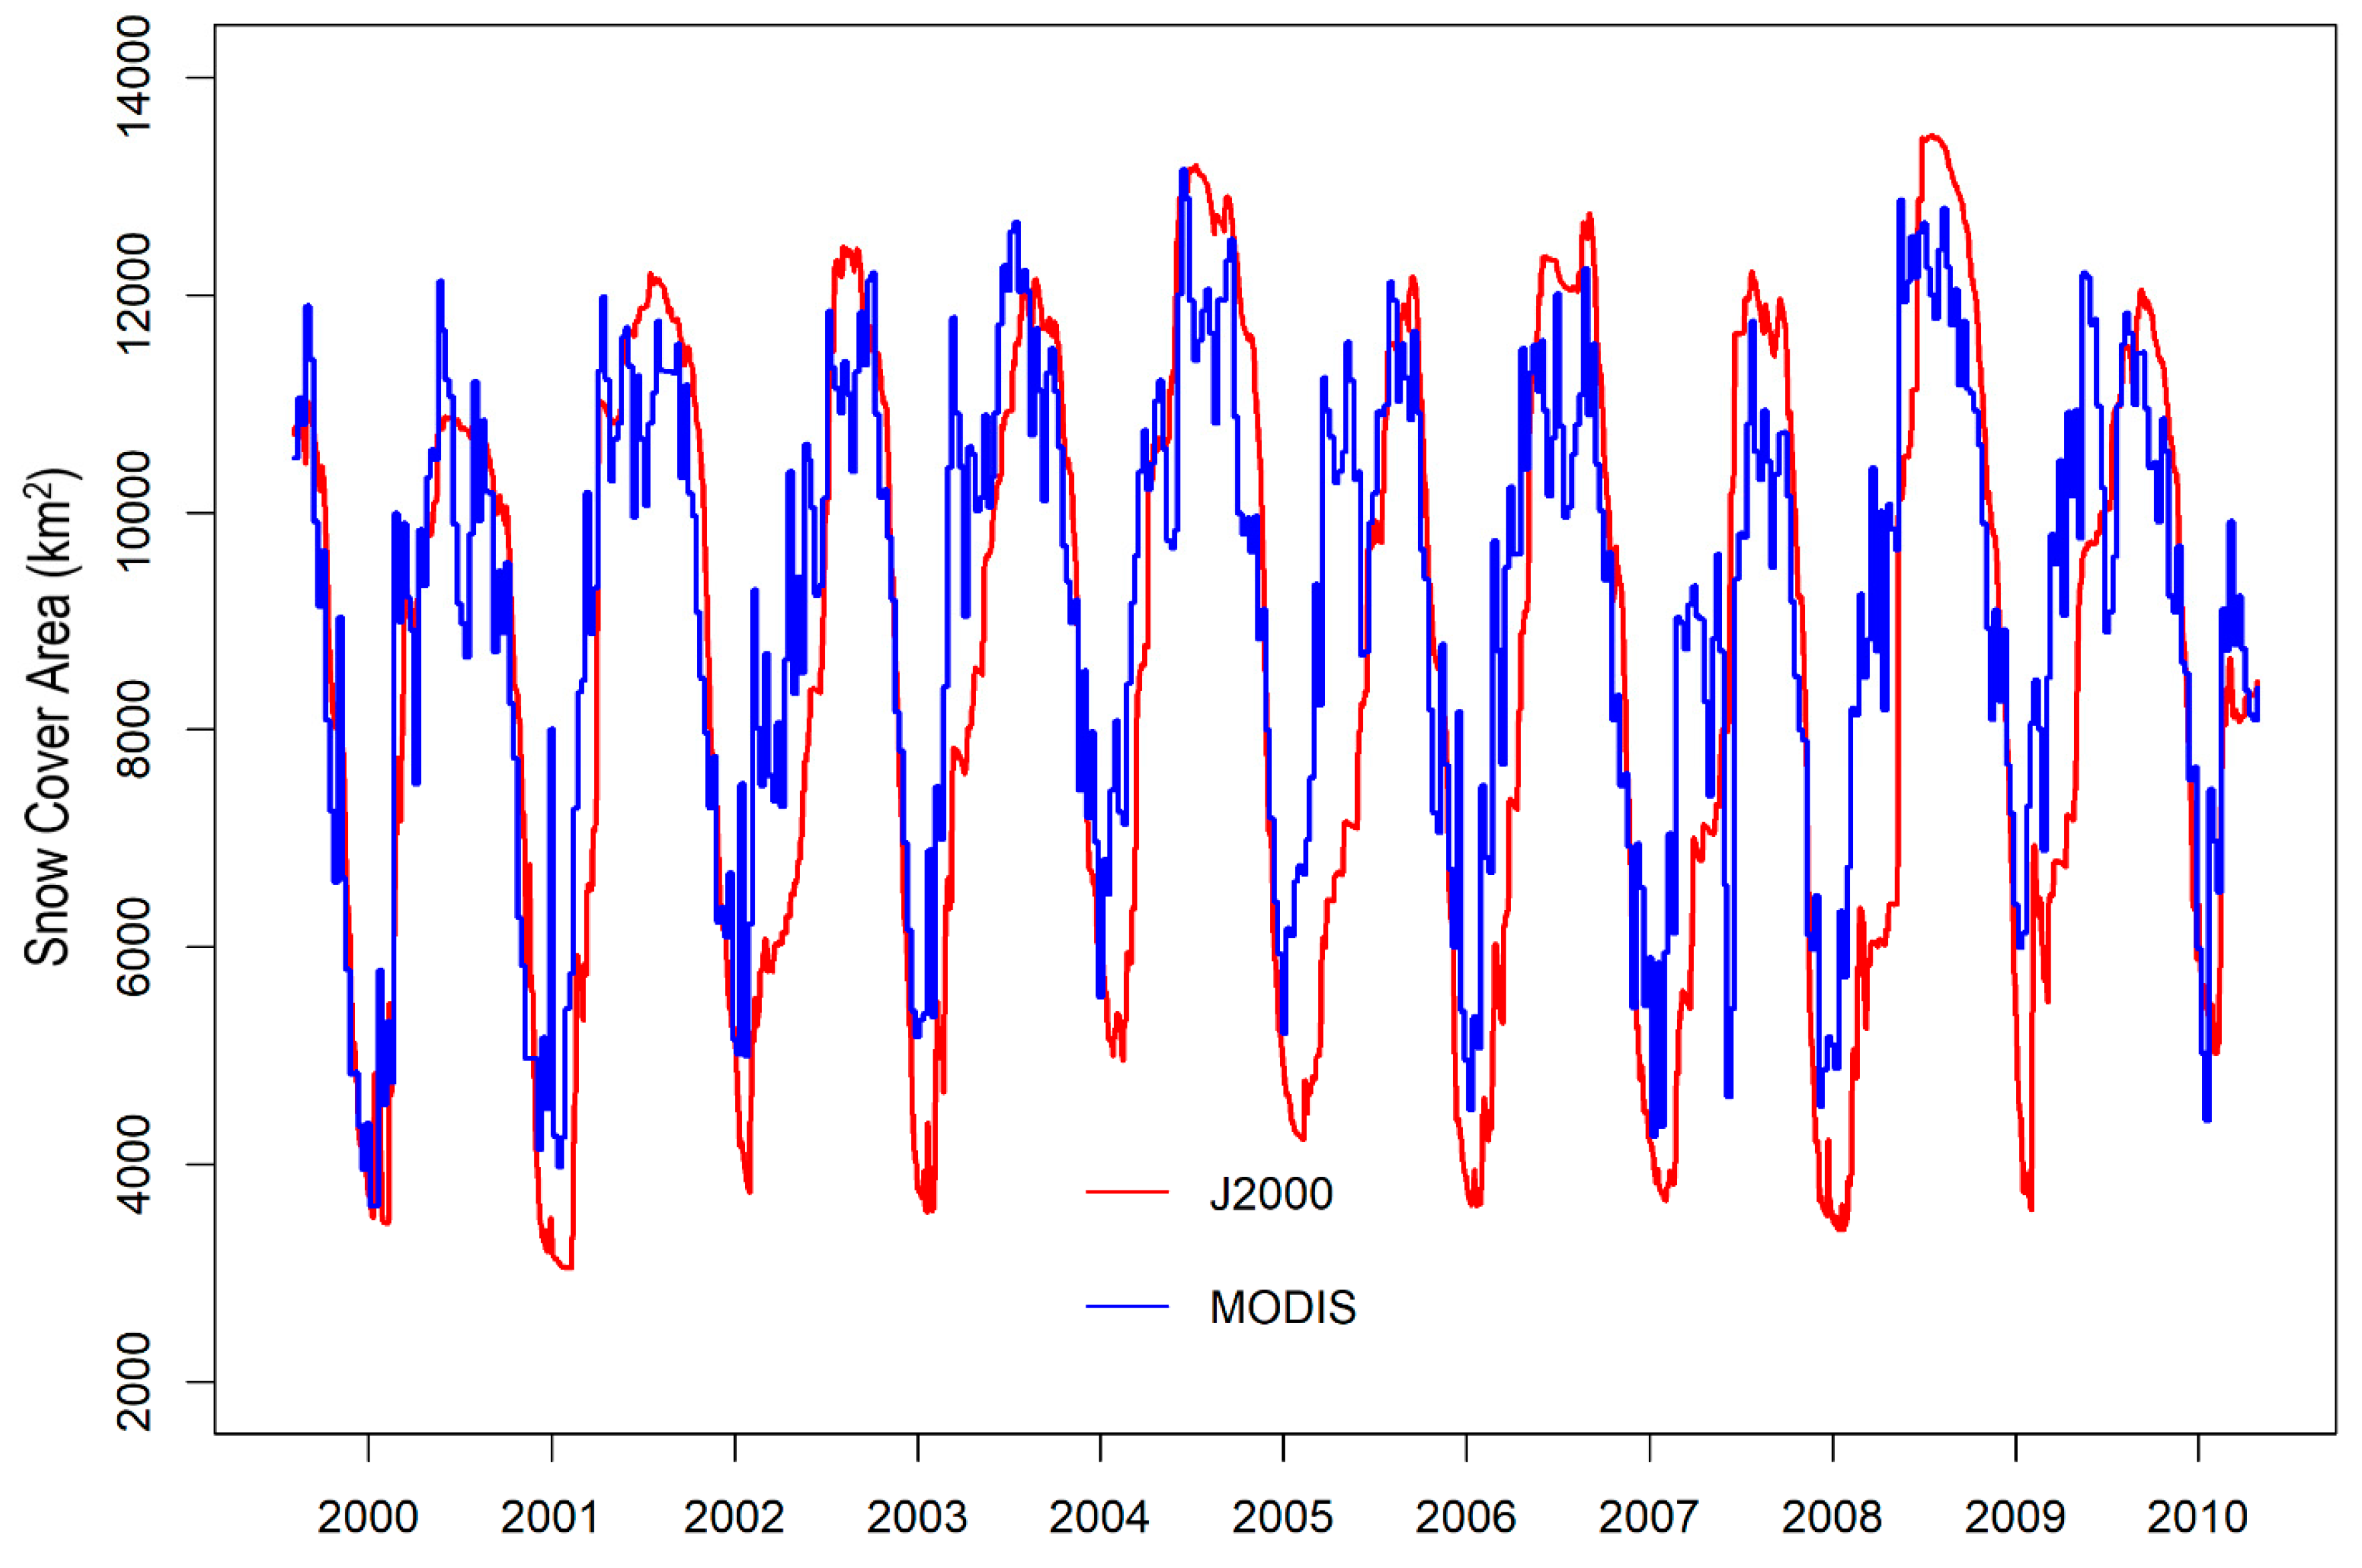
The J2000 model’s ability to simulate seasonal snow cover was assessed by comparing the simulated snow cover area (calculated using the corrected precipitation values) with MODIS snow cover values (Figure 4). In J2000, the maximum snow cover area of the 8-day interval matching the MODIS time period was chosen. The snow cover area simulated by the model was in good agreement with the area inferred from the MODIS snow cover data (R2 = 0.65; positive bias of 6%).
The MODIS data for the Hunza basin show a maximum average snow cover area of 81% (11,213 km2) in March and a minimum average snow cover area of 42% (5835 km2) in August for 2000–2010. The simulated values from the J2000 model for maximum snow cover area (11,904 km2) in March were similar to the observed values; those for the minimum snow cover area (4128 km2) in August were lower than the observed values, but there was good agreement in the period of snow melt. In some years (2002, 2005, 2008), the snow accumulation was underestimated by the J2000 model. Overall, the snow cover area was simulated well by the J2000 model, but snow cover variability was less well represented.
3.2. Hydrograph Analysis during Calibration and Validation
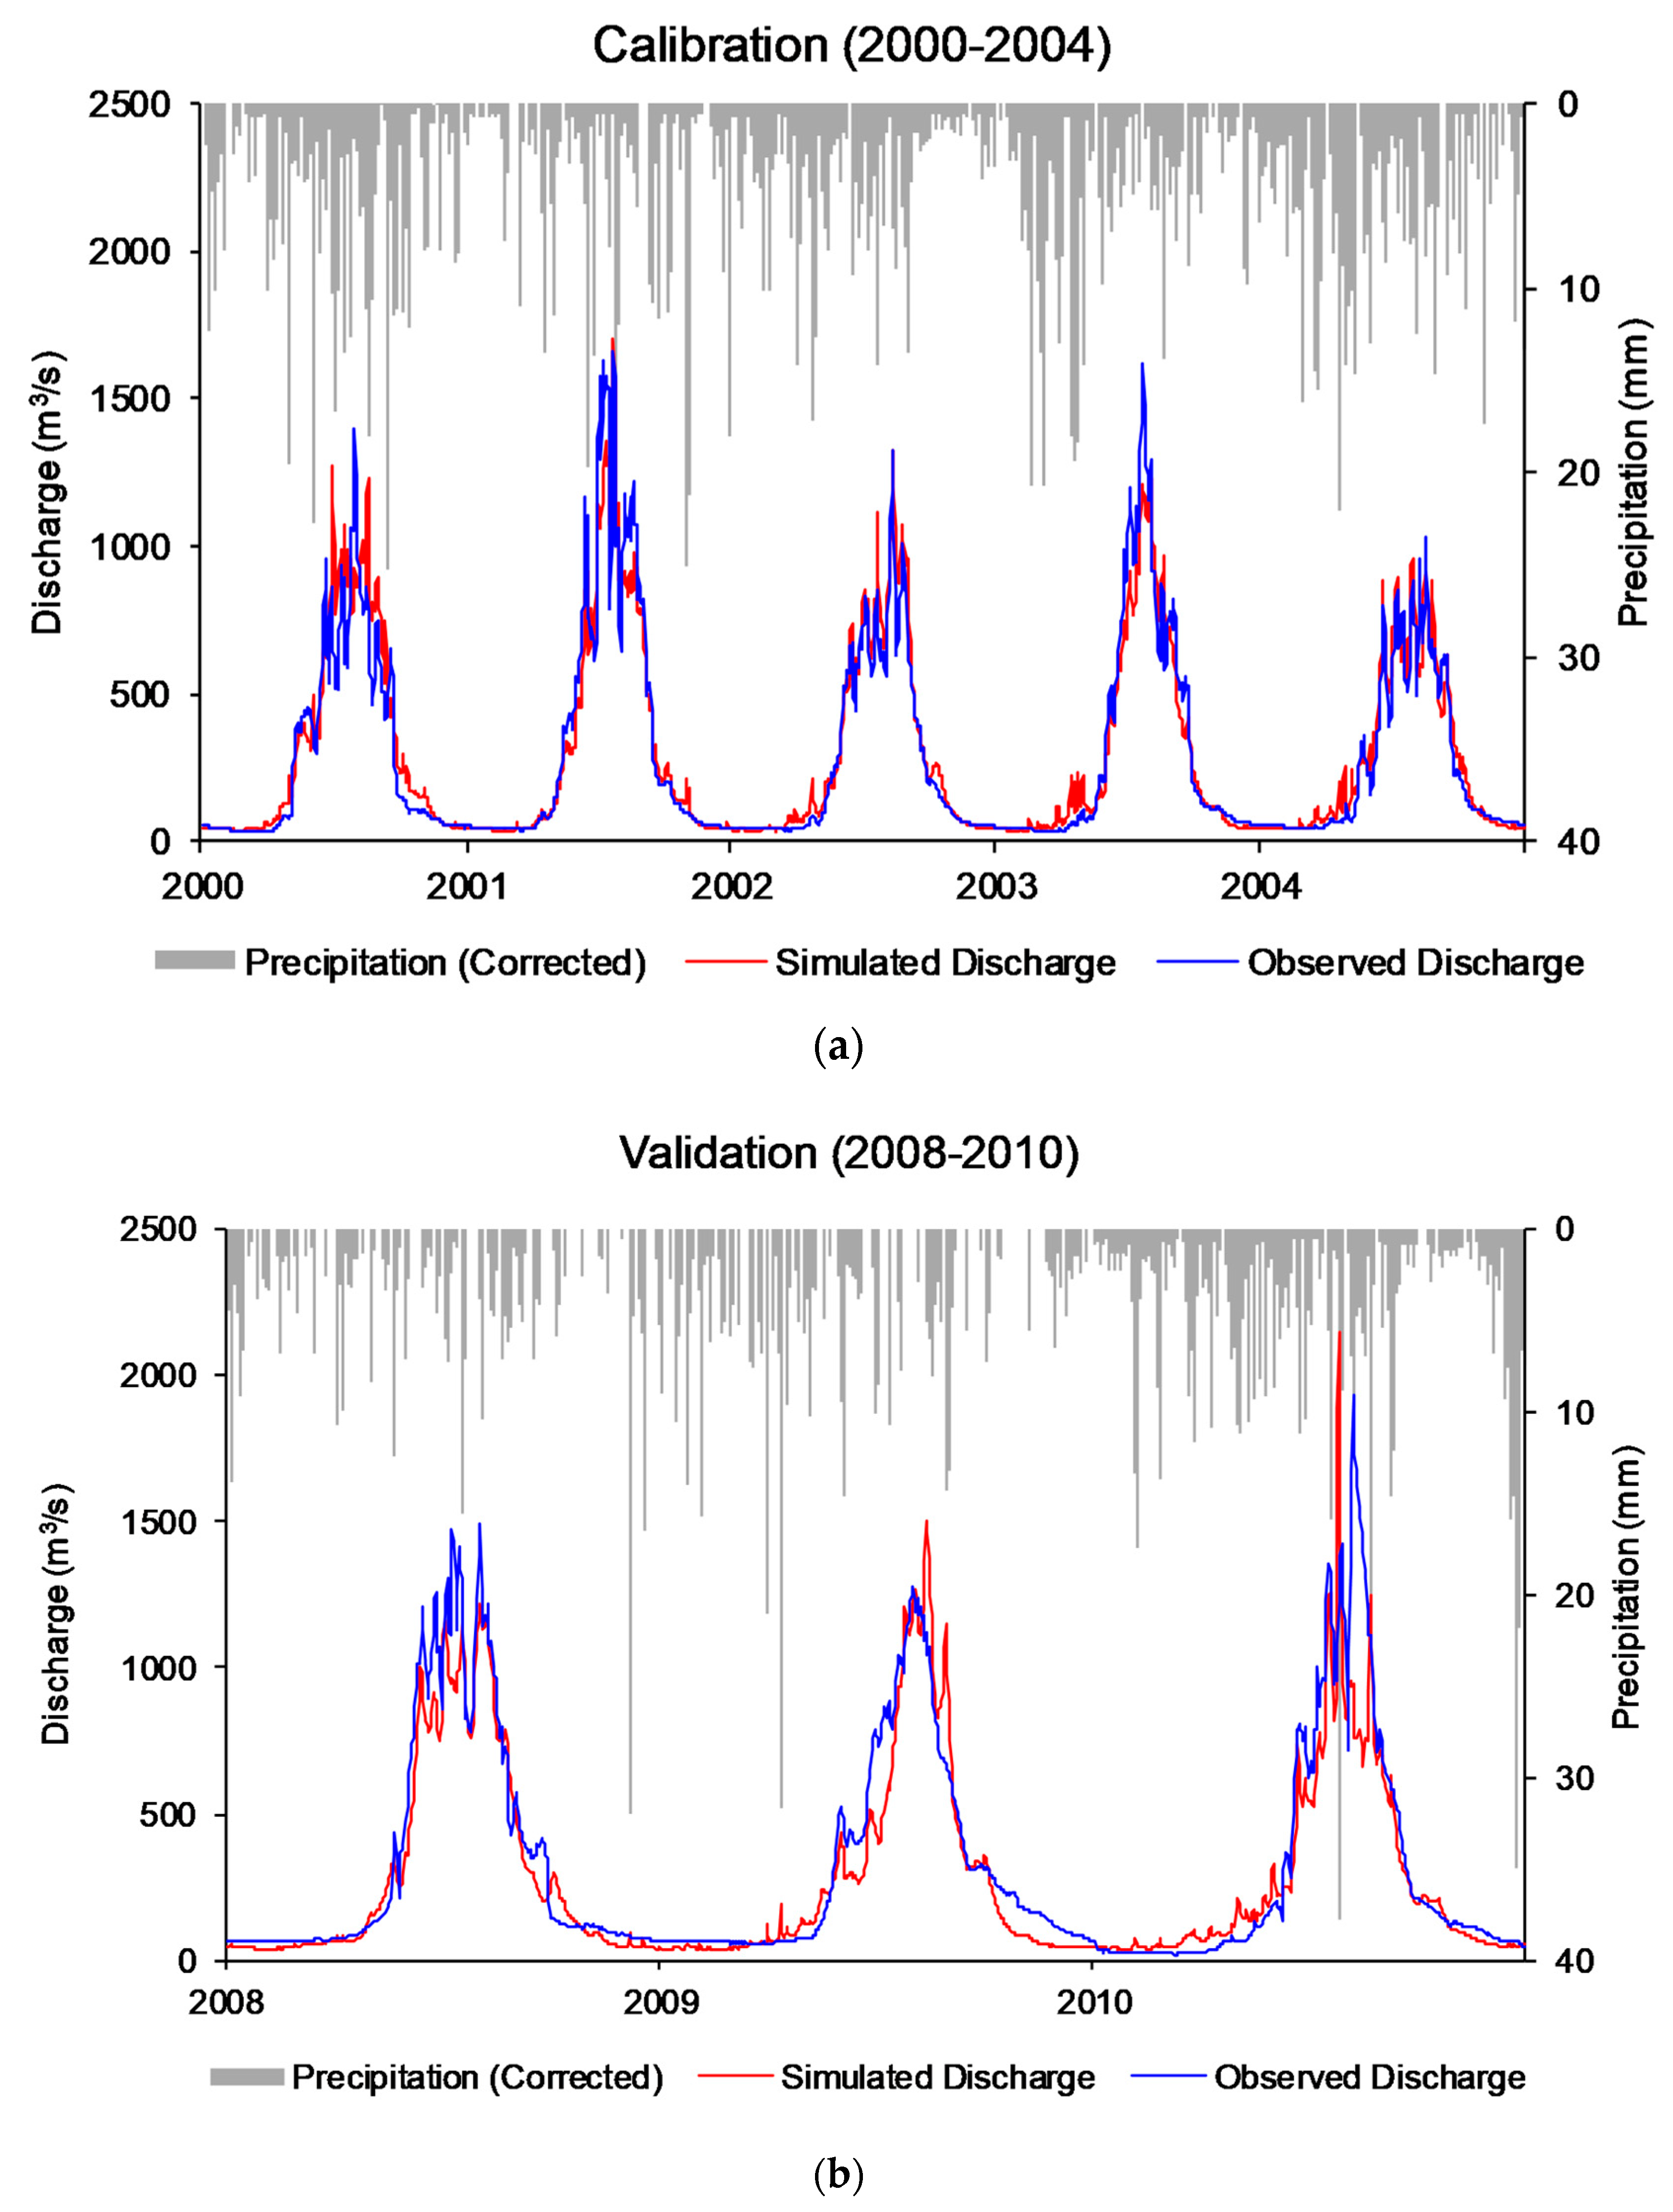
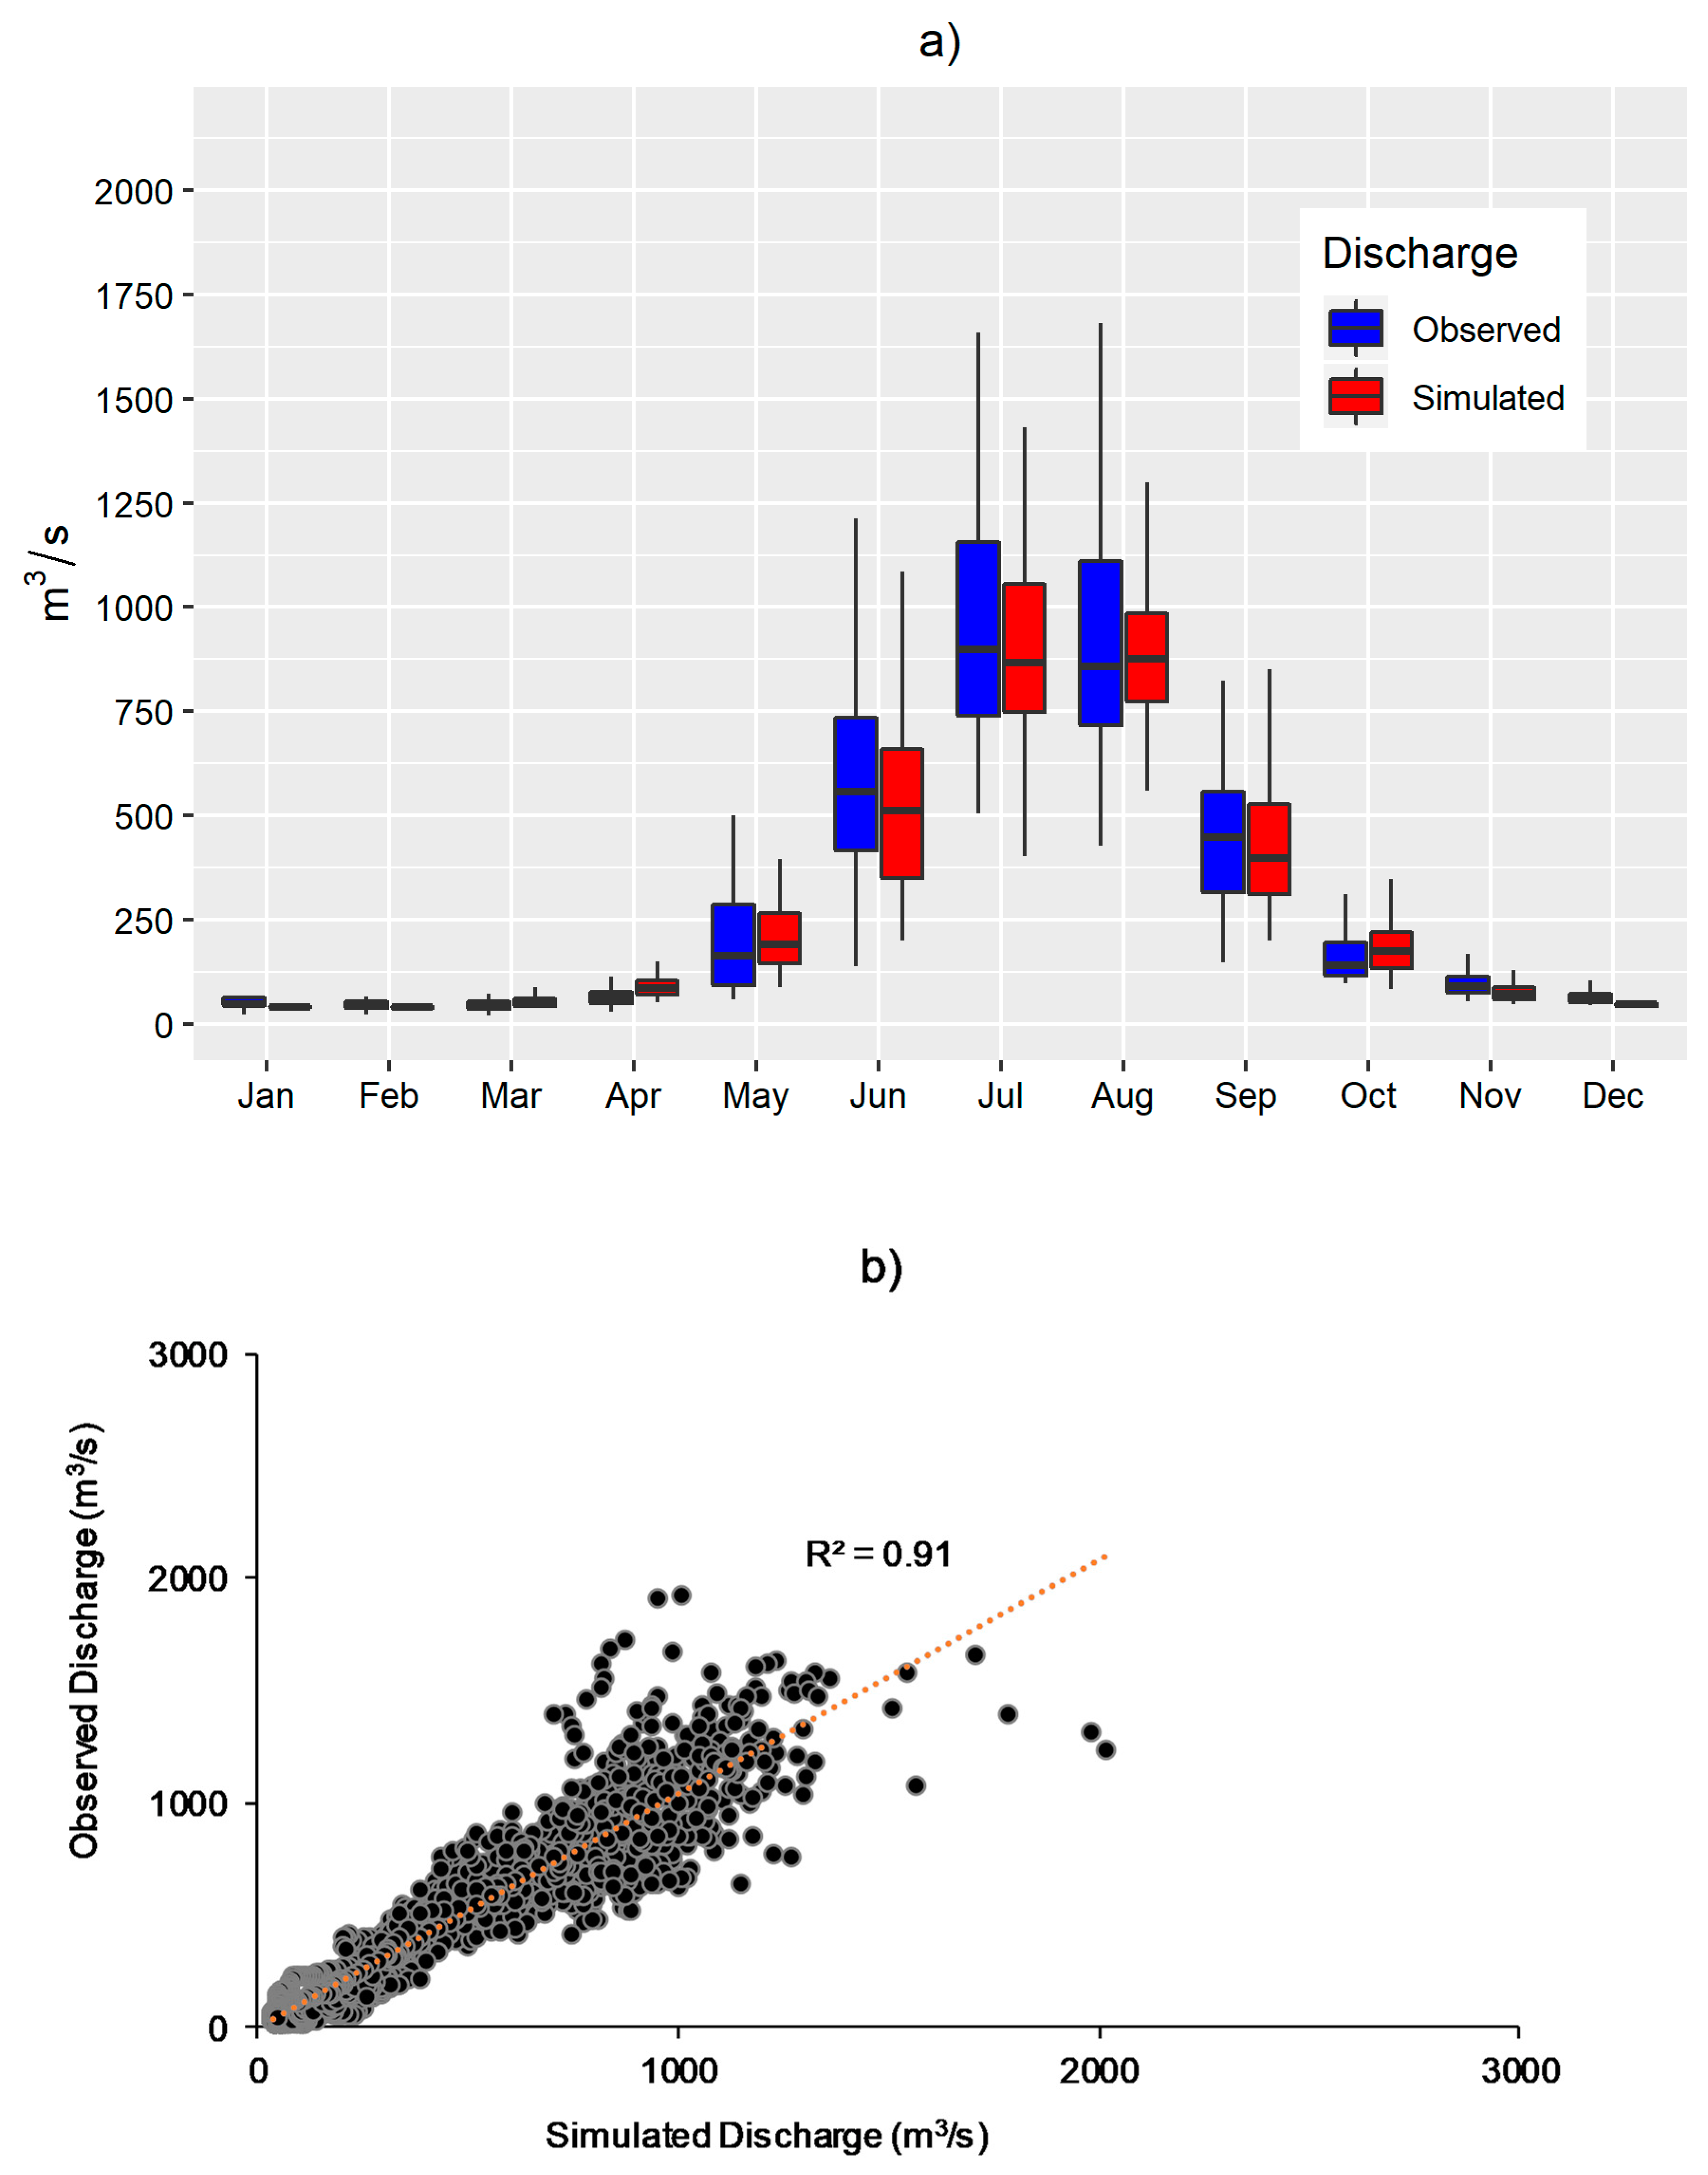
A split sample procedure was used for calibration and validation of the simulated discharge values against observed discharge [63]. The period for which data was available was not very long, thus a larger part (2000–2004) was used for calibration to ensure calibration was meaningful and the remainder [2008–2010 (no data available for 2005–2007)] was used for validation. Figure 5 shows the simulated and the observed daily discharge values for the calibration and the validation periods together with the corrected precipitation, and Figure 6 shows the average monthly simulated and observed discharge values and a scatter plot of the daily observed and simulated discharge values. Table 5 shows the values of the different efficiency criteria derived from comparison of the simulated daily discharge values with observed values over the calibration and the validation periods using the observed precipitation values and the corrected precipitation values. For the water balance assessment (discussed in the later sections), we took the data from the period of 2000–2004 and 2008–2010 (a total of eight years).
The graphical and the statistical evaluation showed that the J2000 model was able to reproduce the overall hydrological dynamics fairly well. The base flow was well simulated during both the calibration and the validation periods. The rising and the falling limbs were also well simulated by the model. However, there were some high peaks shown in the simulated discharge in April 2002 and 2003 that were not identified in the observed discharge. Both visual inspection and the efficiency criteria values indicated that the simulated discharge values (especially base flow and discharge peaks) were considerably closer to the observed values when using the corrected precipitation in both the calibration and the validation periods.
3.3. Contribution of Ice Melt to Total Discharge
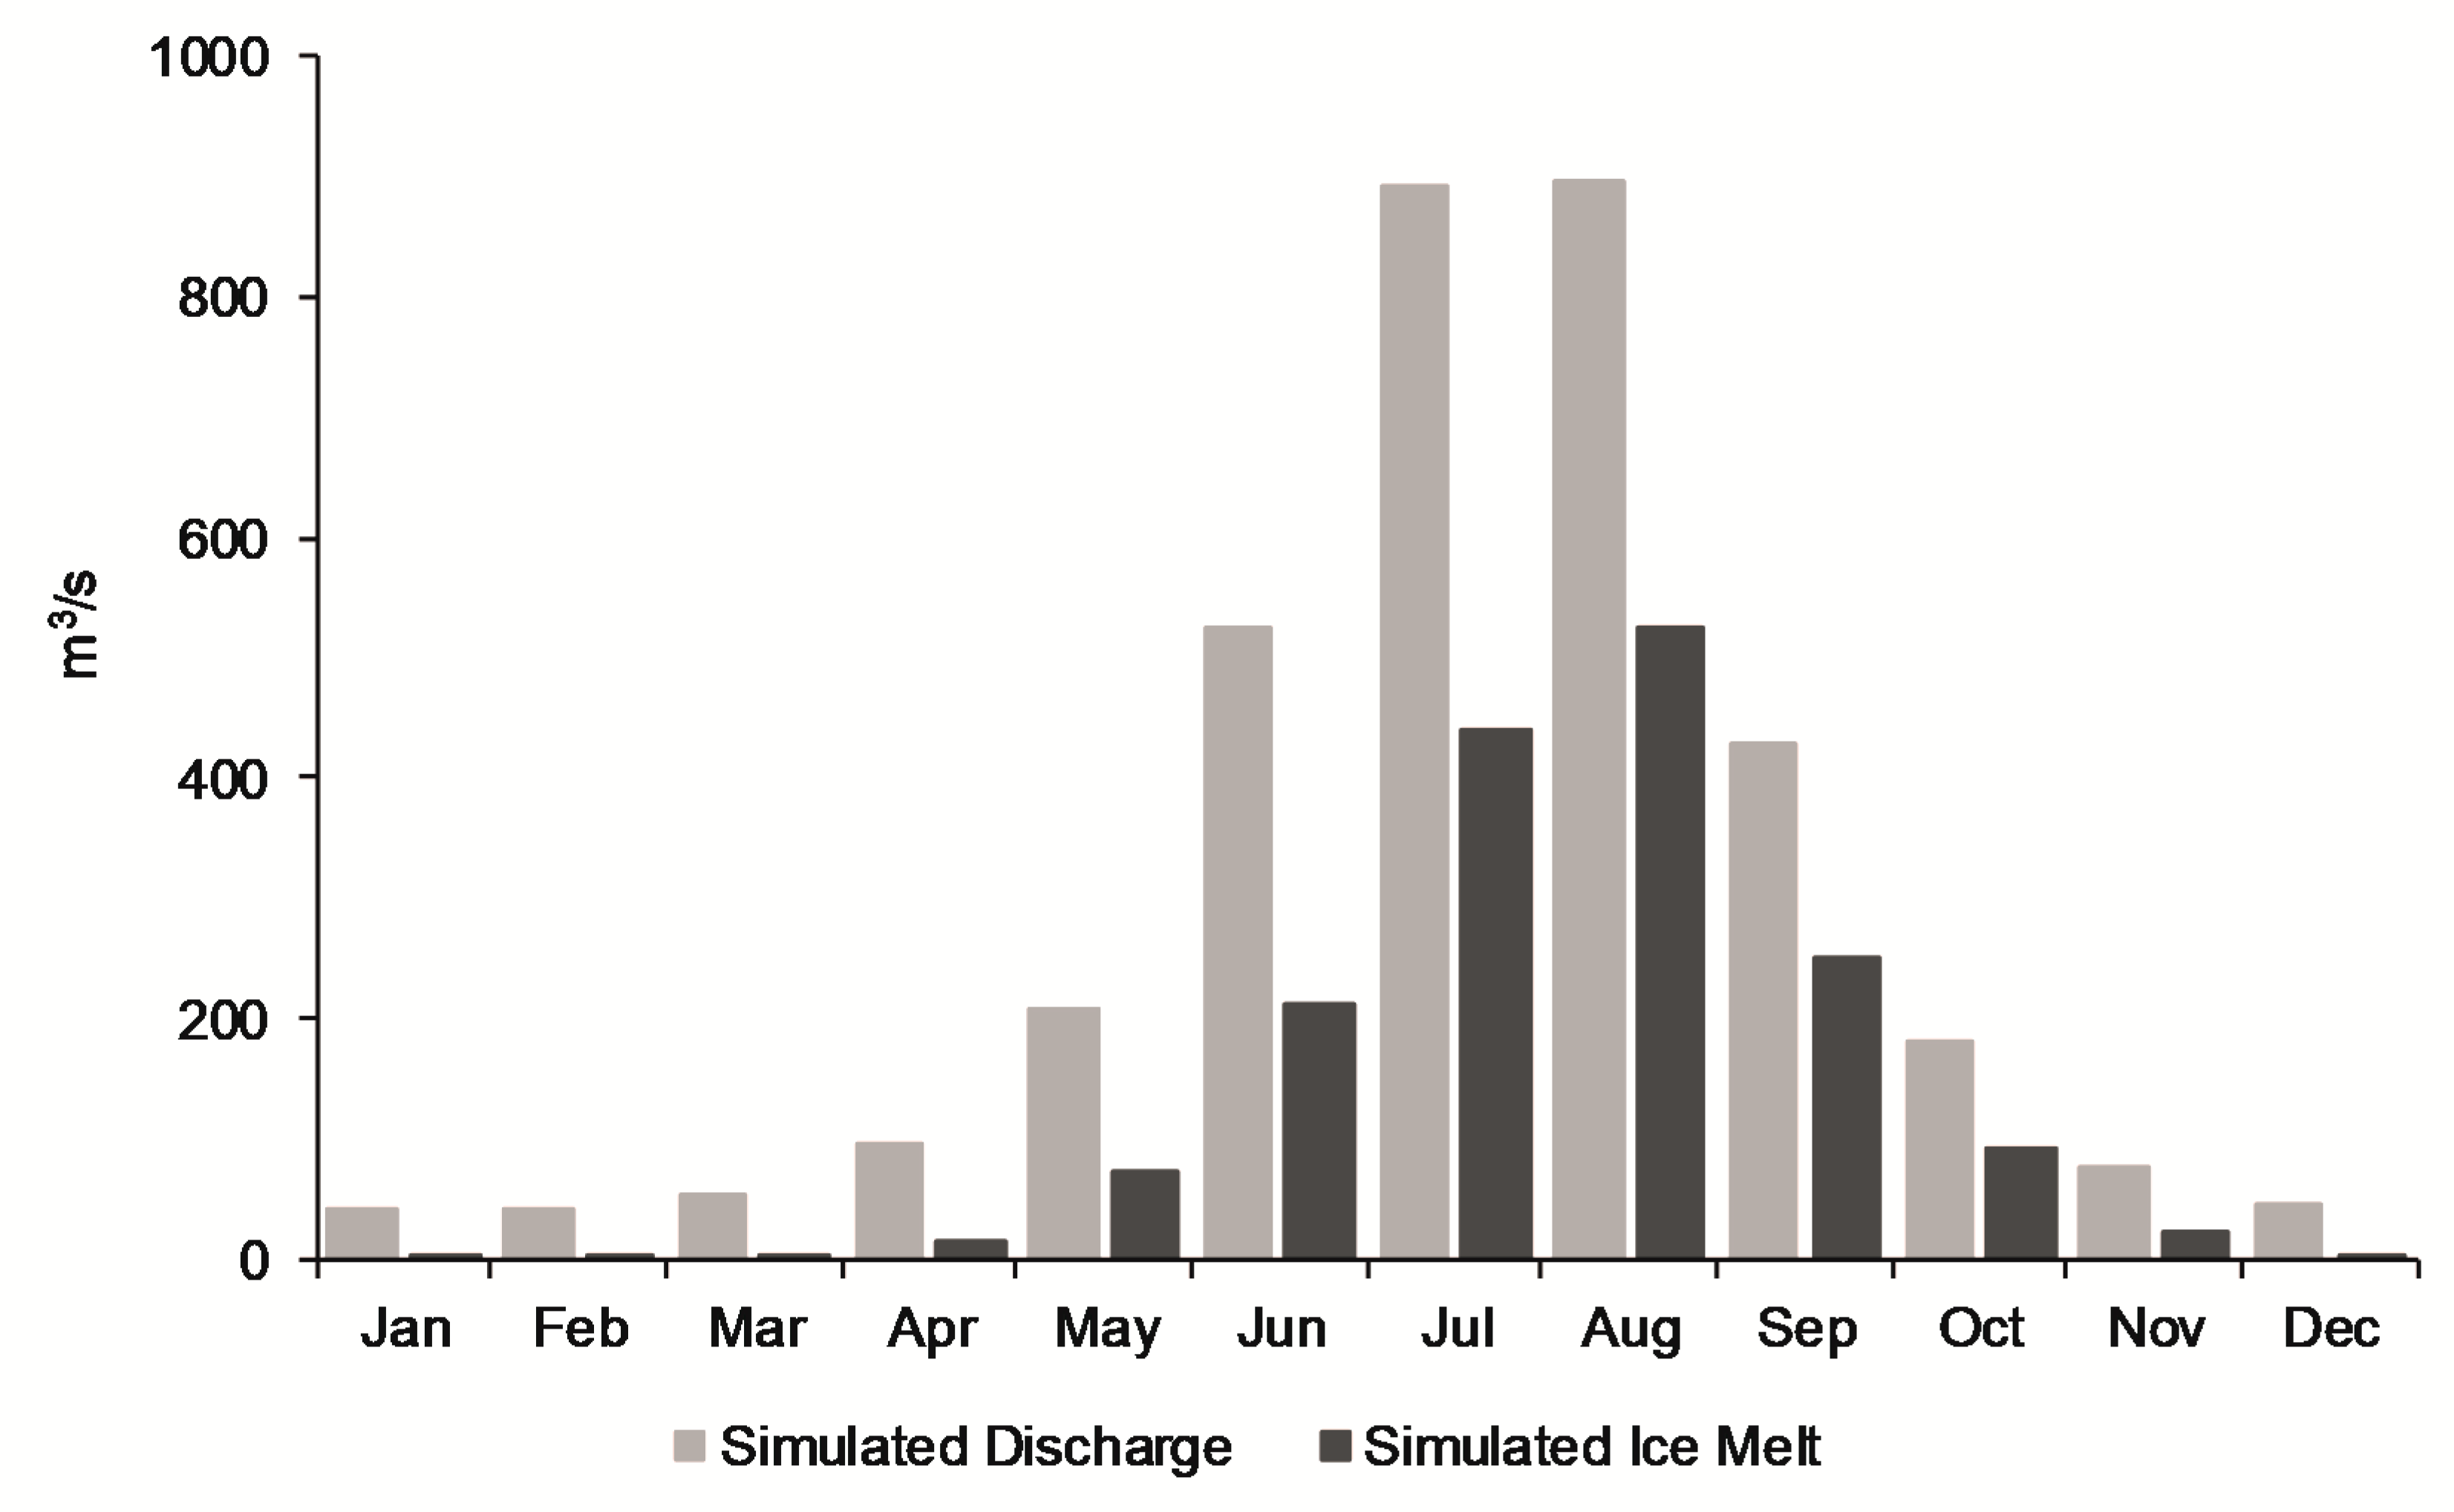
In the model, glacier melt runoff (melt from the glacier area) is the sum of snowmelt runoff (seasonal snowfall), ice melt runoff, and rain runoff (from rainfall over the glacier area). Glacier ice melt begins in a glacier HRU after the seasonal snowfall has melted and the seasonal snow storage on that HRU is zero. Figure 7 shows the simulated monthly average contribution of the ice melt component to total simulated discharge from the basin. The monthly values of proportional contribution to basin total discharge for the individual components are shown in Table 6.
Melt from the glacier area contributed 60% (on average) to the total discharge from the basin during the modeling period; 47% of the total from ice melt, 12% from seasonal snowmelt, and 1% from rain runoff. The maximum average contribution of glacier melt to total discharge was in August (73%); there was no contribution in December, January, or February. The seasonal contribution of ice melt was particularly significant at 52% of the average monthly discharge in the summer period (June to October).
Snowmelt from outside of the glacier area comprised 39% of total runoff in the basin, but a part of this infiltrated to soil and evaporated (about 6%), thus the total contribution of snowmelt from outside the glacier area to discharge was 33%. The contribution of all snowmelt to total discharge was 45% (33% snowmelt from outside the glacier area and 12% snowmelt from the glacier area).
Table 7 shows the contribution of snowmelt, glacier ice melt, and total snow and glacier melt to discharge identified in various modeling studies in and close to the Hunza basin. Glacier ice melt is given separately to meet the different definitions used in the studies. For example, Refs. [14,29] do not include snowfall or rainfall on the glacier surface and only consider glacier ice melt, whereas the present study used seasonal snowfall and rainfall as well as glacier ice melt to assess the contribution to discharge from the glacier area (contribution to glacier ice melt alone was 47%, and both snow and ice melt was 59%). Our results suggest that snow and glacier melt from the whole basin contribute 92% of total discharge, which is close to the values given by [4,14,29], the studies that provide the most direct comparison in terms of area and basin size. The approach used by [4] was similar to that used in the J2000, with seasonal snowfall on the glacier taken into consideration, although the value calculated for glacier ice melt in our study was slightly higher. The values calculated for glacier ice melt by [14,29] were higher again than those calculated using our approach because of the different methods used to realize glacier melt.
3.4. Water Balance Analysis
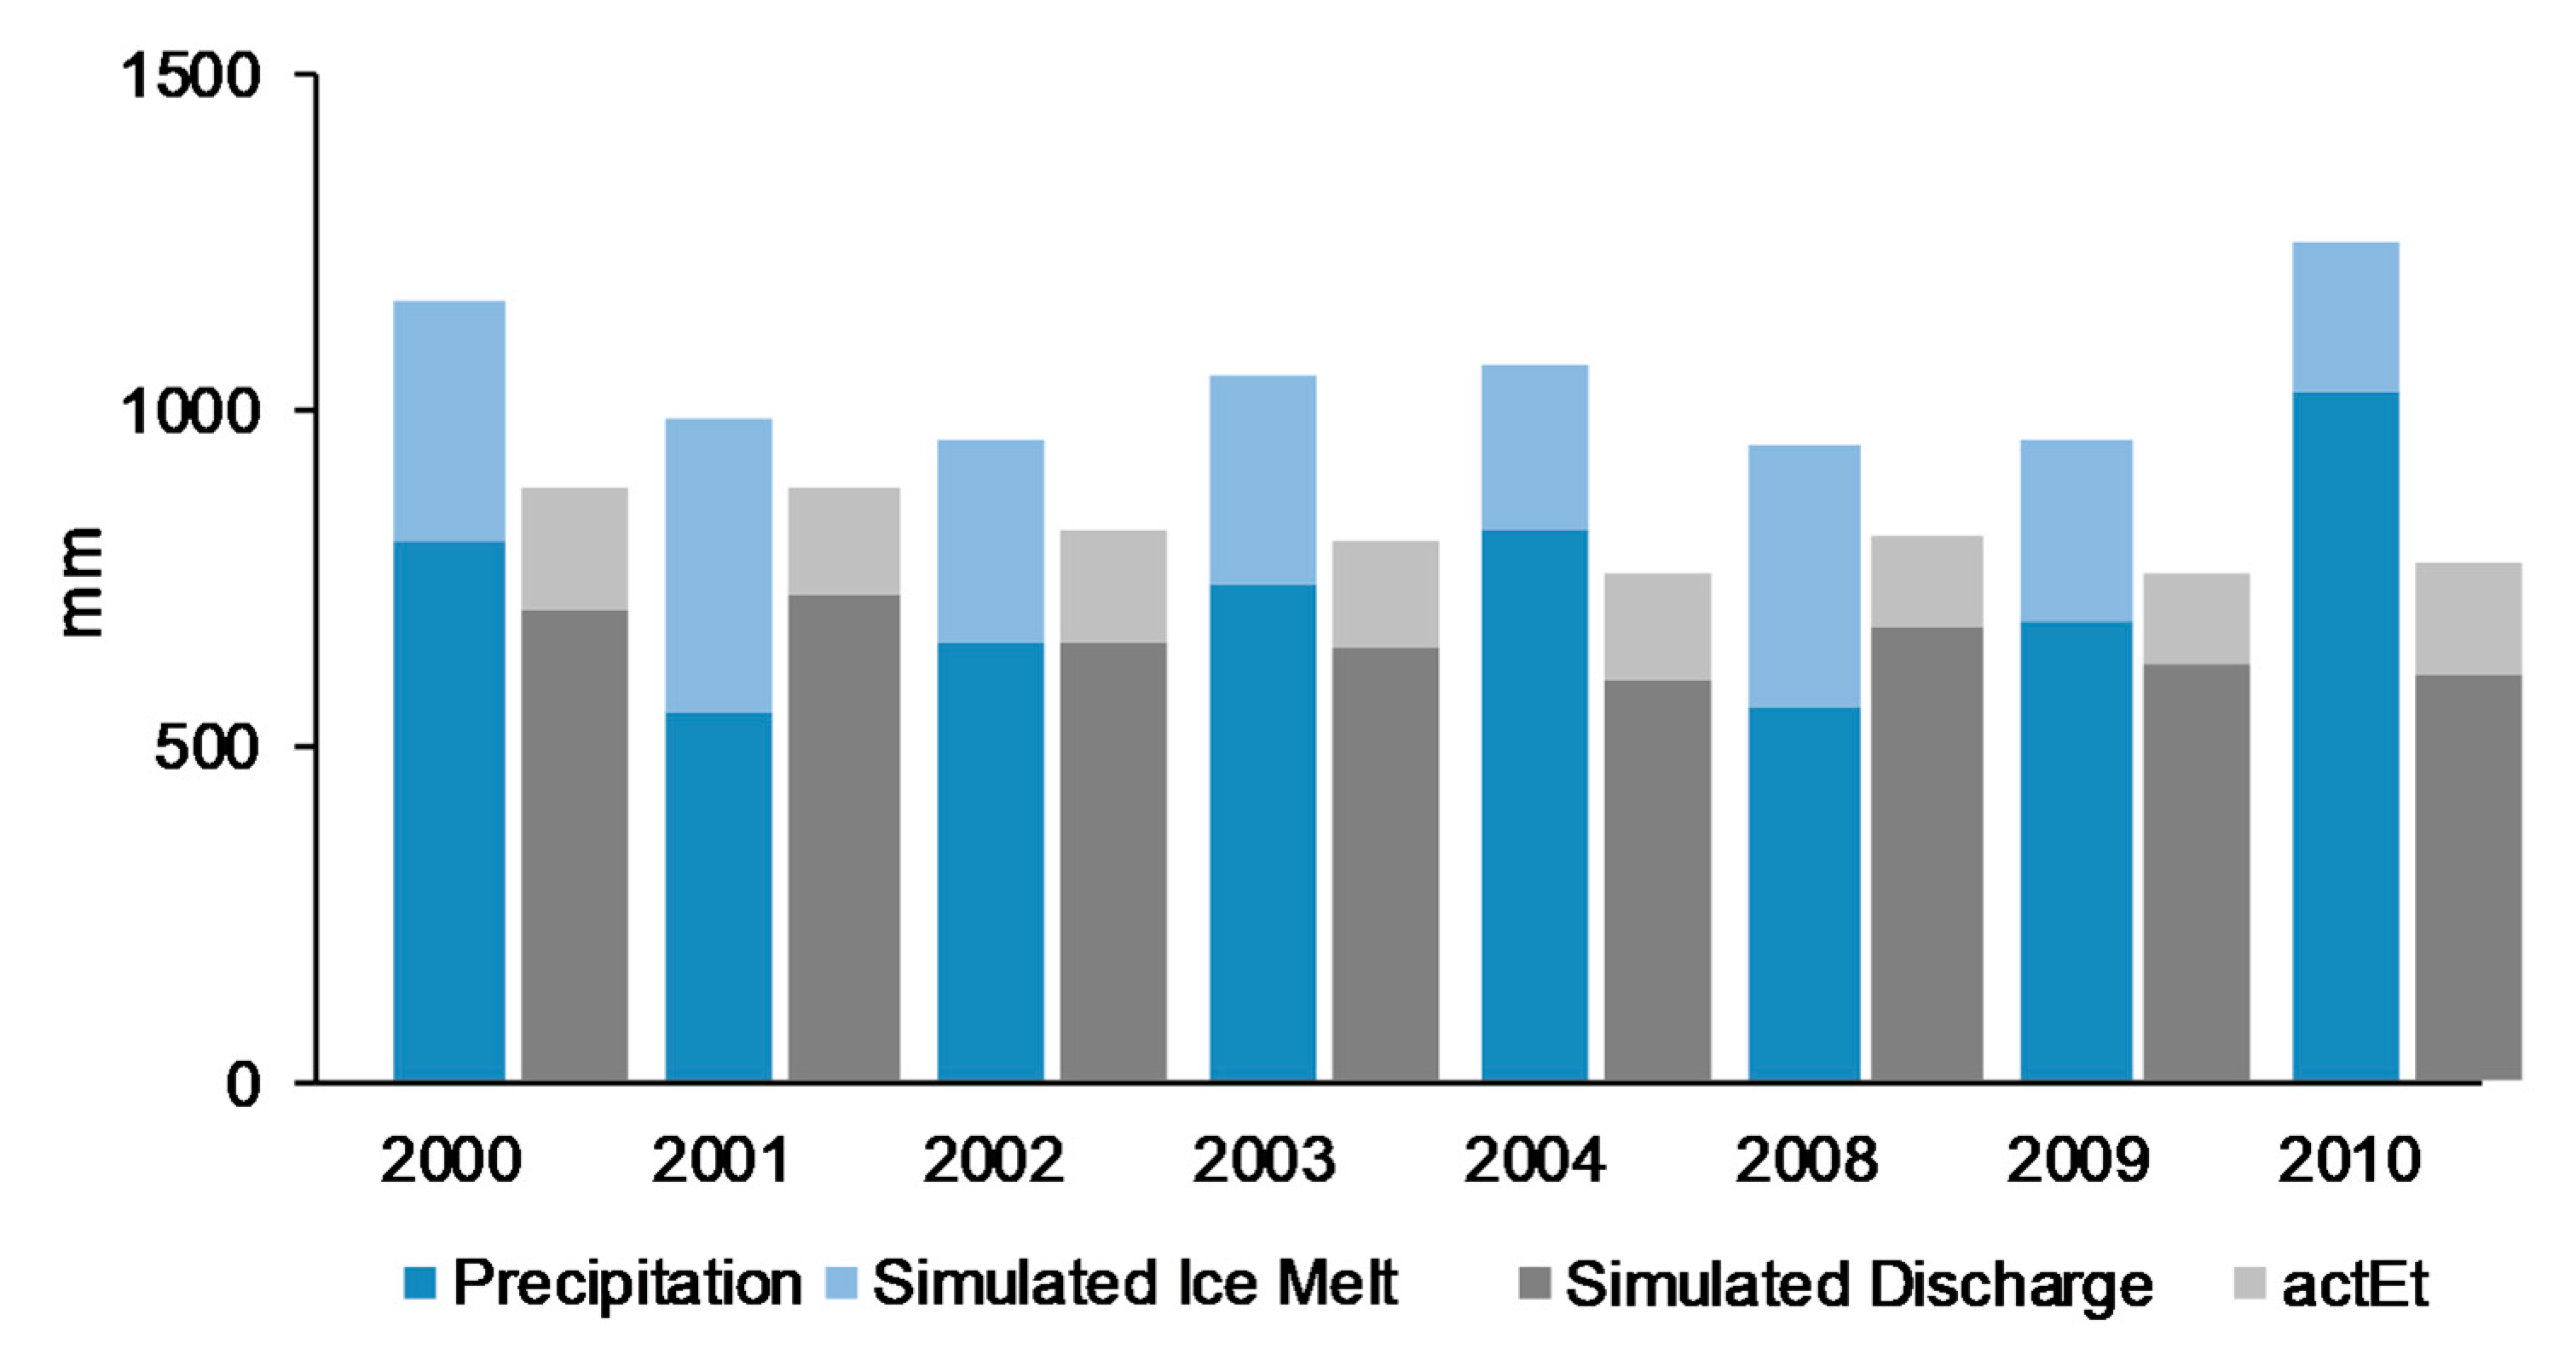
The results of the overall water balance analysis for the Hunza basin are shown in Figure 8. The average annual input to total water during the modeling period was 731 mm (70%) from precipitation and 315 mm (30%) from glacier ice melt, giving a total of 1046 mm. Actual evapotranspiration (actEt) returned 162 mm (16%) of total input to the atmosphere, 672 mm (64%) left the basin as total river discharge, and 20% remained in different forms of storage, such as snow, soil, and groundwater.
3.5. Impact of Different Scenarios on Ice Melt Runoff and River Discharge
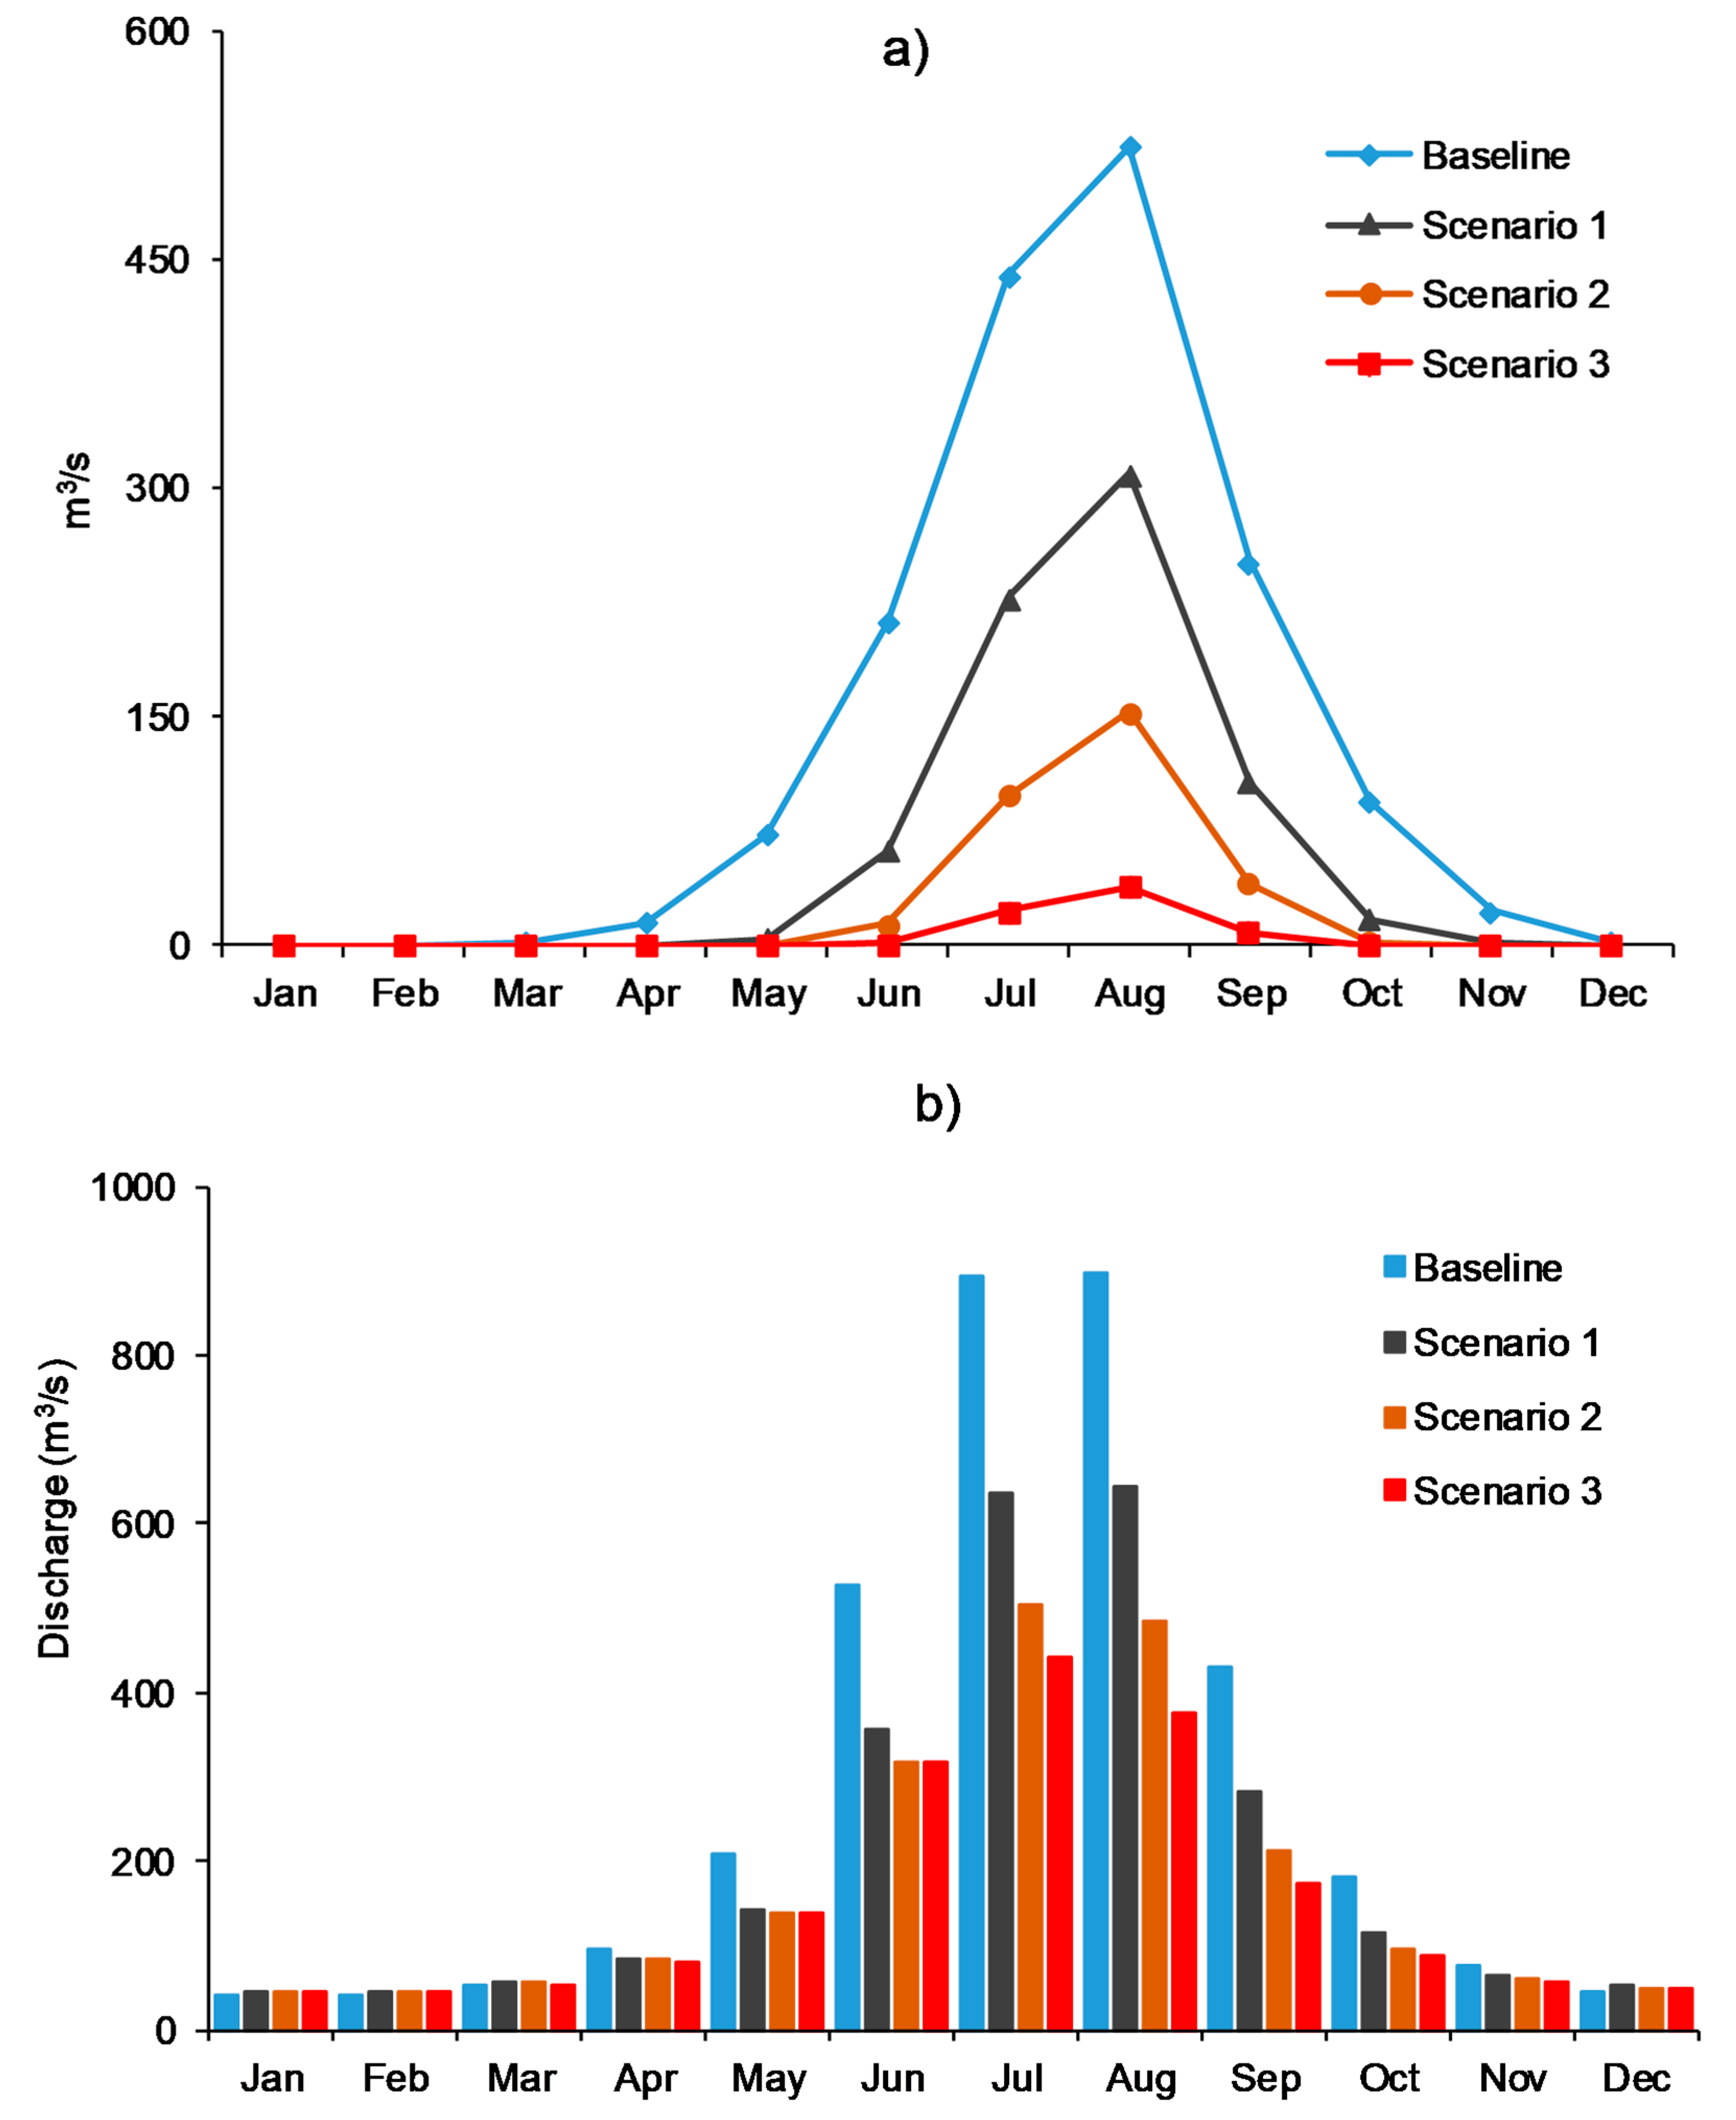
Figure 9 shows the results of the analysis of the impact of glacier recession on ice melt runoff as well as the resultant total discharge calculated using the J2000 model. The analysis focused on the impact on ice melt, as this is likely to be the component most affected. The snowfall and rainfall components are not affected by the change in glacier area (the only component changed in the scenario), as they will simply runoff from bare land instead of the glacier surface. In a warming world, the change in temperature will also affect snowfall distribution and other hydrological processes, but in this study, we only looked at the glacier recession scenario.
The simulated monthly average ice melt runoff during the modeling period was used as the baseline for the glacier shrinkage scenarios. Total ice melt declined by 55%, 81%, and 96%, respectively, under the scenarios of recession to 4000, 4500, and 5000 masl; the average annual contribution to total discharge declined from 47% at the baseline to close to zero (29%, 14%, and 4%, respectively), and the total average annual river discharge declined by 28%, 40%, and 46%, respectively. The reduction was mainly in summer discharge. Discharge actually increased very slightly in some months during the accumulation period (December, January, February, and March) because, as glaciers recede, the snow falls on bare land, infiltrates after melt, and contributes to river discharge through interflow and groundwater.
3.6. Uncertainties and Limitations
Climate data quality plays a very crucial role in hydrological modeling. The climate stations in the Hunza basin are valley-based and do not sufficiently represent the spatial distribution of precipitation in the mountain range. The precipitation in this study was corrected using a precipitation gradient, but these were calculated values, and some uncertainty remains. The validation of the J2000 model simulated snow cover area using MODIS snow cover data helped to constrain the snow and glacier related parameters in the model, which reduced the parametric uncertainties. However, the MODIS snow cover data also contained some uncertainty, as they were limited to 500 m resolution over an 8-day period. Finally, both accuracy and length of discharge data are essential to calibrate and validate hydrological models, but limited data availability meant that the typical length of the modeling period in this study was only eight years.
4. Conclusions
The key findings of the analysis of the water balance in the Hunza river basin using the J2000 hydrological model and precipitation values corrected using virtual weather stations were as follows:
- The snow cover area of the basin simulated by the model was in good agreement (R2 = 0.65) with the snow cover area calculated from the 8-day interval MODIS data. The snow cover validation helped to constrain the snow and glacier related parameters, which gave additional confidence to the water balance simulations compared to validation of discharge data only.
- The J2000 model can be used successfully for snow and glacier melt simulation in the western Himalaya. Snowmelt from the whole Hunza basin contributed, on average, 45% of the total river discharge during the modeling period, and glacier ice melt contribution was 47%.
- Total ice melt declined by 55%, 81%, and 96% under scenarios of glacier recession to 4000, 4500, and 5000 masl, respectively.
- The contribution of ice melt to river discharge decreased to 29%, 14%, and 4% under the three scenarios, respectively, while total discharge from the Hunza river decreased by 28%, 40%, and 46%.
The drastic reduction in ice melt contribution to river flow with glacier recession suggests that glacier storage in the Hunza basin is crucial for sustaining river flow. The Hunza river is one of the main contributors of snow and glacier melt to the Indus river. If storage capacity is lost, the flow in the whole Indus river could be affected adversely, which could have a marked impact on all the downstream systems that depend on the river water.
Author Contributions
Conceptualization, S.S. and S.N.; writing—original draft preparation, S.S. and S.N.; writing—review and editing supervision, S.S. and S.N.
Funding
This research received no external funding.
Acknowledgments
We thank Adnan Shafiq Rana, Pakistan Meteorological Department, for providing the hourly sunshine data for the basin. Suggestions from Bhupendra Devkota, College of Applied Sciences-Nepal and Rishi Ram Sharma, Department of Hydrology and Meteorology, Nepal are gratefully acknowledged and appreciated. We are thankful to two anonymous reviewers whose comments and feedback helped to improve the quality of the paper. We very much appreciate the guidance of Arun B. Shrestha, Programme Manager for River Basins and Cryosphere at ICIMOD. This work was supported by the Indus Basin Initiative of ICIMOD, which contributes to the Sustainable Development Investment Portfolio of the Department of Foreign Affairs and Trade, Government of Australia. The study was partially supported by ICIMOD core funds (contributed by the governments of Afghanistan, Australia, Bangladesh, Bhutan, China, India, Myanmar, Nepal, Norway, Pakistan, Switzerland, and the United Kingdom). All views and interpretations expressed in this publication are those of the authors and are not necessarily attributable to the institutions mentioned above.
Conflicts of Interest
The authors declare no conflict of interest.
References
- Sharma, E.; Molden, D.; Rahman, A.; Khatiwada, Y.R.; Zhang, L.; Singh, S.P.; Yao, T.; Wester, P. Introduction to the Hindu Kush Himalaya Assessment. In The Hindu Kush Himalaya Assessment; Wester, P., Mishra, A., Mukherji, A., Shrestha, A.B., Eds.; Springer International Publishing: Cham, Switzerland, 2019; pp. 1–16. [Google Scholar] [CrossRef] [Green Version]
- Jansson, P.; Hock, R.; Schneider, T. The concept of glacier storage: A review. J. Hydrol. 2003, 282, 116–129. [Google Scholar] [CrossRef]
- Tahir, A.A.; Chevallier, P.; Arnaud, Y.; Neppel, L.; Ahmad, B. Modeling snowmelt-runoff under climate scenarios in the Hunza River basin, Karakoram Range, Northern Pakistan. J. Hydrol. 2011, 409, 104–117. [Google Scholar] [CrossRef]
- Shrestha, M.; Koike, T.; Hirabayashi, Y.; Xue, Y.; Wang, L.; Rasul, G.; Ahmad, B. Integrated simulation of snow and glacier melt in water and energy balance-based, distributed hydrological modeling framework at Hunza River Basin of Pakistan Karakoram region. J. Geophys. Res. Atmos. 2015, 120, 4889–4919. [Google Scholar] [CrossRef] [Green Version]
- Lutz, A.; Immerzeel, W.; Kraaijenbrink, P. Gridded Meteorological Datasets and Hydrological Modelling in the Upper Indus Basin; Final Report, for International Centre for Integrated Mountain Development (ICIMOD); FutureWater: Costerweg, The Netherlands, 2014; Volume 1, p. 6702. [Google Scholar]
- Jeelani, G.; Feddema, J.J.; Veen, C.J.; Stearns, L. Role of snow and glacier melt in controlling river hydrology in Liddar watershed (western Himalaya) under current and future climate. Water Resour. Res. 2012, 48. [Google Scholar] [CrossRef] [Green Version]
- Bookhagen, B.; Burbank, D.W. Toward a complete Himalayan hydrological budget: Spatiotemporal distribution of snowmelt and rainfall and their impact on river discharge. J. Geophys. Res. Earth Surf. 2010, 115. [Google Scholar] [CrossRef] [Green Version]
- Immerzeel, W.W.; van Beek, L.P.; Bierkens, M.F. Climate change will affect the Asian water towers. Science 2010, 328, 1382–1385. [Google Scholar] [CrossRef] [PubMed]
- Hewitt, K. Glacier Change, Concentration, and Elevation Effects in the Karakoram Himalaya, Upper Indus Basin. Mt. Res. Dev. 2011, 31, 188–200. [Google Scholar] [CrossRef]
- Rowan, A.V.; Egholm, D.L.; Quincey, D.J.; Glasser, N.F.J.E.; Letters, P.S. Modelling the feedbacks between mass balance, ice flow and debris transport to predict the response to climate change of debris-covered glaciers in the Himalaya. Earth Planet. Sci. Lett. 2015, 430, 427–438. [Google Scholar] [CrossRef] [Green Version]
- Khattak, M.S.; Babel, M.S.; Sharif, M. Hydro-meteorological trends in the upper Indus River basin in Pakistan. Clim. Res. 2011, 46, 103–119. [Google Scholar] [CrossRef]
- Nepal, S.; Shrestha, A.B. Impact of climate change on the hydrological regime of the Indus, Ganges and Brahmaputra river basins: A review of the literature. Int. J. Water Resour. Dev. 2015, 31, 201–218. [Google Scholar] [CrossRef]
- Bolch, T.; Shea, J.M.; Liu, S.; Azam, F.M.; Gao, Y.; Gruber, S.; Immerzeel, W.W.; Kulkarni, A.; Li, H.; Tahir, A.A.; et al. Status and Change of the Cryosphere in the Extended Hindu Kush Himalaya Region. In The Hindu Kush Himalaya Assessment; Wester, P., Mishra, A., Mukherji, A., Shrestha, A.B., Eds.; Springer International Publishing: Cham, Switzerland, 2019; pp. 209–255. [Google Scholar] [CrossRef] [Green Version]
- Lutz, A.F.; Immerzeel, W.W.; Kraaijenbrink, P.D.; Shrestha, A.B.; Bierkens, M.F. Climate Change Impacts on the Upper Indus Hydrology: Sources, Shifts and Extremes. PLoS ONE 2016, 11, e0165630. [Google Scholar] [CrossRef] [PubMed]
- Archer, D. Contrasting hydrological regimes in the upper Indus Basin. J. Hydrol. 2003, 274, 198–210. [Google Scholar] [CrossRef]
- Molden, D.J.; Shrestha, A.B.; Nepal, S.; Immerzeel, W.W. Downstream Implications of Climate Change in the Himalayas. In Water Security, Climate Change and Sustainable Development; Springer: Berlin/Heidelberg, Germany, 2016; pp. 65–82. [Google Scholar] [CrossRef]
- Mukherji, A.; Molden, D.; Nepal, S.; Rasul, G.; Wagnon, P. Himalayan Waters at the Crossroads: Issues and Challenges; Routledge: Abingdon, UK, 2015. [Google Scholar] [CrossRef]
- Nepal, S. Impacts of climate change on the hydrological regime of the Koshi river basin in the Himalayan region. J. Hydro-Environ. Res. 2016, 10, 76–89. [Google Scholar] [CrossRef] [Green Version]
- Eriksson, M.; Jianchu, X.; Shrestha, A.B.; Vaidya, R.A.; Nepal, S.; Sandström, K. The Changing Himalayas: Impact of Climate Change on Water Resources and Livelihoods in the Greater Himalayas; International Centre for Integrated Mountain Development (ICIMOD): Patan, Nepal, 2009. [Google Scholar]
- Wang, Y.; Wu, N.; Kunze, C.; Long, R.; Perlik, M. Drivers of Change to Mountain Sustainability in the Hindu Kush Himalaya. In The Hindu Kush Himalaya Assessment; Wester, P., Mishra, A., Mukherji, A., Shrestha, A.B., Eds.; Springer International Publishing: Cham, Switzerland, 2019; pp. 17–56. [Google Scholar] [CrossRef] [Green Version]
- Frans, C.D.; Naz, B.; Clarke, G.; Lettenmaier, D.P.; Burns, P.J. Modeling the effect of glacier recession on streamflow response using a coupled glacio-hydrological model. Hydrol. Earth Syst. Sci. 2014, 18, 787–802. [Google Scholar] [CrossRef] [Green Version]
- Li, H.; Beldring, S.; Xu, C.-Y.; Huss, M.; Melvold, K.; Jain, S.K. Integrating a glacier retreat model into a hydrological model–Case studies of three glacierised catchments in Norway and Himalayan region. J. Hydrol. 2015, 527, 656–667. [Google Scholar] [CrossRef]
- Luo, Y.; Arnold, J.; Liu, S.; Wang, X.; Chen, X. Inclusion of glacier processes for distributed hydrological modeling at basin scale with application to a watershed in Tianshan Mountains, Northwest China. J. Hydrol. 2013, 477, 72–85. [Google Scholar] [CrossRef]
- Garen, D.C.; Marks, D. Spatially distributed energy balance snowmelt modelling in a mountainous river basin: Estimation of meteorological inputs and verification of model results. J. Hydrol. 2005, 315, 126–153. [Google Scholar] [CrossRef]
- Bookhagen, B.; Burbank, D.W. Topography, relief, and TRMM-derived rainfall variations along the Himalaya. Geophys. Res. Lett. 2006, 33. [Google Scholar] [CrossRef] [Green Version]
- Immerzeel, W.W.; Wanders, N.; Lutz, A.F.; Shea, J.M.; Bierkens, M.F.P. Reconciling high-altitude precipitation in the upper Indus basin with glacier mass balances and runoff. Hydrol. Earth Syst. Sci. 2015, 19, 4673–4687. [Google Scholar] [CrossRef] [Green Version]
- Barry, R. Mountain Weather and Climate; Cambridge University Press: Cambridge, UK, 2008. [Google Scholar]
- Hewitt, K.; Wake, C.P.; Young, G.; David, C. Hydrological investigations at Biafo Glacier, Karakoram Range, Himalaya; an important source of water for the Indus River. Ann. Glaciol. 1989, 13, 103–108. [Google Scholar] [CrossRef]
- Lutz, A.; Immerzeel, W.; Shrestha, A.; Bierkens, M. Consistent increase in High Asia’s runo due toincreasing glacier melt and precipitation. Nat. Clim. Chang. 2014. [Google Scholar] [CrossRef]
- Wijngaard, R.R.; Lutz, A.F.; Nepal, S.; Khanal, S.; Pradhananga, S.; Shrestha, A.B.; Immerzeel, W.W. Future changes in hydro-climatic extremes in the Upper Indus, Ganges, and Brahmaputra River basins. PLoS ONE 2017, 12, e0190224. [Google Scholar] [CrossRef] [PubMed]
- Shea, J.; Immerzeel, W.; Wagnon, P.; Vincent, C.; Bajracharya, S. Modelling glacier change in the Everest region, Nepal Himalaya. Cryosphere 2015, 9, 1105–1128. [Google Scholar] [CrossRef] [Green Version]
- Eeckman, J.; Nepal, S.; Chevallier, P.; Camensuli, G.; Delclaux, F.; Boone, A.; De Rouw, A. Comparing the ISBA and J2000 approaches for surface flows modelling at the local scale in the Everest region. J. Hydrol. 2019, 569, 705–719. [Google Scholar] [CrossRef]
- Nepal, S.; Krause, P.; Flügel, W.A.; Fink, M.; Fischer, C. Understanding the hydrological system dynamics of a glaciated alpine catchment in the Himalayan region using the J2000 hydrological model. Hydrol. Process. 2014, 28, 1329–1344. [Google Scholar] [CrossRef]
- Nepal, S.; Flügel, W.-A.; Krause, P.; Fink, M.; Fischer, C. Assessment of spatial transferability of process-based hydrological model parameters in two neighbouring catchments in the Himalayan Region. Hydrol. Process. 2017, 31, 2812–2826. [Google Scholar] [CrossRef]
- Gao, T.; Kang, S.; Krause, P.; Cuo, L.; Nepal, S. A test of J2000 model in a glacierized catchment in the central Tibetan Plateau. Environ. Earth Sci. 2011, 65, 1651–1659. [Google Scholar] [CrossRef]
- Young, G.; Hewitt, K. Hydrology research in the upper Indus basin, Karakoram Himalaya, Pakistan. Hydrol. Mt. Areas 1990, 190, 139–152. [Google Scholar]
- Hewitt, K. Tributary glacier surges: An exceptional concentration at Panmah Glacier, Karakoram Himalaya. J. Glaciol. 2007, 53, 181–188. [Google Scholar] [CrossRef]
- Immerzeel, W.W.; Pellicciotti, F.; Shrestha, A.B. Glaciers as a Proxy to Quantify the Spatial Distribution of Precipitation in the Hunza Basin. Mt. Res. Dev. 2012, 32, 30–38. [Google Scholar] [CrossRef]
- Krause, P. Das Hydrologische Modellsystem J2000: Beschreibung und Anwendung in großen Flußgebieten; Forschungszentrum Jülich: Jülich, Germany, 2001. [Google Scholar]
- Krause, P. Quantifying the impact of land use changes on the water balance of large catchments using the J2000 model. Phys. Chem. Earthparts A/B/C 2002, 27, 663–673. [Google Scholar] [CrossRef]
- Kralisch, S.; Krause, P. JAMS-A framework for natural resource model development and application. In Proceedings of the iEMSs Third Biannual Meeting “Summit on Environmental Modelling and Software”, Burlington, VT, USA, 9–13 July 2006. [Google Scholar]
- Kralisch, S.; Krause, P.; Fink, M.; Fischer, C.; Flügel, W. Component based environmental modelling using the JAMS framework. In Proceedings of the MODSIM 2007 International Congress on Modelling and Simulation, Christchurch, New Zealand, 10–13 December 2007; pp. 812–818. [Google Scholar]
- Hewitt, K. The Karakoram Anomaly? Glacier Expansion and the ‘Elevation Effect,’ Karakoram Himalaya. Mt. Res. Dev. 2005, 25, 332–340. [Google Scholar] [CrossRef]
- Hewitt, K. Glaciers of the Karakoram Himalaya: Glacial Environments, Processes, Hazards and Resources; Springer Science & Business Media: Berlin/Heidelberg, Germany, 2013. [Google Scholar]
- Kaab, A.; Berthier, E.; Nuth, C.; Gardelle, J.; Arnaud, Y. Contrasting patterns of early twenty-first-century glacier mass change in the Himalayas. Nature 2012, 488, 495–498. [Google Scholar] [CrossRef]
- Ragettli, S.; Immerzeel, W.W.; Pellicciotti, F. Modeling the glacio-hydrological response of a Himalayan watershed to climate change using a physically-oriented distributed model: Sources of model uncertainty. In Proceedings of the International Symposium on Glaciers and Ice Sheets in a Warming Climate, Fairbanks, AK, USA, 25–29 June 2012; p. 0645. [Google Scholar]
- Immerzeel, W.W.; Petersen, L.; Ragettli, S.; Pellicciotti, F. The importance of observed gradients of air temperature and precipitation for modeling runoff from a glacierized watershed in the Nepalese Himalayas. Water Resour. Res. 2014, 50, 2212–2226. [Google Scholar] [CrossRef] [Green Version]
- Ahmad, Z.; Hafeez, M.; Ahmad, I. Hydrology of mountainous areas in the upper Indus Basin, Northern Pakistan with the perspective of climate change. Environ. Monit. Assess. 2012, 184, 5255–5274. [Google Scholar] [CrossRef]
- Mayer, C.; Lambrecht, A.; Belo, M.; Smiraglia, C.; Diolaiuti, G. Glaciological characteristics of the ablation zone of Baltoro glacier, Karakoram, Pakistan. Ann. Glaciol. 2006, 43, 123–131. [Google Scholar] [CrossRef] [Green Version]
- Immerzeel, W.W.; van Beek, L.P.; Konz, M.; Shrestha, A.B.; Bierkens, M.F. Hydrological response to climate change in a glacierized catchment in the Himalayas. Clim. Chang. 2012, 110, 721–736. [Google Scholar] [CrossRef] [PubMed]
- Khan, A.; Koch, M. Correction and Informed Regionalization of Precipitation Data in a High Mountainous Region (Upper Indus Basin) and Its Effect on SWAT-Modelled Discharge. Water 2018, 10, 1557. [Google Scholar] [CrossRef]
- Defourny, P.; Vancutsem, C.; Bicheron, P.; Brockmann, C.; Nino, F.; Schouten, L.; Leroy, M. GLOBCOVER: A 300 m global land cover product for 2005 using Envisat MERIS time series. In Proceedings of the ISPRS Commission VII Mid-Term Symposium: Remote Sensing: From Pixels to Processes, Enschede, The Netherlands, 8–11 May 2006. [Google Scholar]
- Bajracharya, S.R.; Shrestha, B.R. The Status of Glaciers in the Hindu Kush-Himalayan Region; International Centre for Integrated Mountain Development (ICIMOD): Patan, Nepal, 2011. [Google Scholar]
- FAO. Harmonized World Soil Database, version 1.2; FAO: Rome, Italy; IIASA: Laxenburg, Austria, 2012. [Google Scholar]
- Shuttle Radar Topographic Mission. SRTM 90m DEM Digital Elevation Database. Available online: http://srtm.csi.cgiar.org/ (accessed on 1 December 2018).
- Gurung, D.R.; Giriraj, A.; Aung, K.S.; Shrestha, B.R.; Kulkarni, A.V. Snow-Cover Mapping and Monitoring in the Hindu Kush-Himalayas; International Centre for Integrated Mountain Development (ICIMOD): Patan, Nepal, 2011. [Google Scholar]
- Krause, P.; Boyle, D.; Bäse, F. Comparison of different efficiency criteria for hydrological model assessment. Adv. Geosci. 2005, 5, 89–97. [Google Scholar] [CrossRef] [Green Version]
- Kling, H.; Fuchs, M.; Paulin, M. Runoff conditions in the upper Danube basin under an ensemble of climate change scenarios. J. Hydrol. 2012, 424–425, 264–277. [Google Scholar] [CrossRef]
- Gupta, H.V.; Kling, H.; Yilmaz, K.K.; Martinez, G.F. Decomposition of the mean squared error and NSE performance criteria: Implications for improving hydrological modelling. J. Hydrol. 2009, 377, 80–91. [Google Scholar] [CrossRef] [Green Version]
- Kääb, A.; Treichler, D.; Nuth, C.; Berthier, E. Brief Communication: Contending estimates of 2003–2008 glacier mass balance over the Pamir–Karakoram–Himalaya. Cryosphere 2015, 9, 557–564. [Google Scholar] [CrossRef]
- Brun, F.; Berthier, E.; Wagnon, P.; Kaab, A.; Treichler, D. A spatially resolved estimate of High Mountain Asia glacier mass balances, 2000–2016. Nat. Geosci. 2017, 10, 668–673. [Google Scholar] [CrossRef] [PubMed]
- Viste, E.; Sorteberg, A. Snowfall in the Himalayas: An uncertain future from a little-known past. Cryosphere 2015, 9, 1147–1167. [Google Scholar] [CrossRef]
- Klemeš, V. Operational testing of hydrological simulation models. Hydrol. Sci. J. 1986, 31, 13–24. [Google Scholar] [CrossRef]
- Singh, P.; Jain, S.; Kumar, N. Estimation of snow and glacier-melt contribution to the Chenab River, Western Himalaya. Mt. Res. Dev. 1997, 49–56. [Google Scholar] [CrossRef]
- Immerzeel, W.W.; Droogers, P.; De Jong, S.; Bierkens, M. Large-scale monitoring of snow cover and runoff simulation in Himalayan river basins using remote sensing. Remote Sens. Environ. 2009, 113, 40–49. [Google Scholar] [CrossRef]
- Zhang, L.; Su, F.; Yang, D.; Hao, Z.; Tong, K. Discharge regime and simulation for the upstream of major rivers over Tibetan Plateau. J. Geophys. Res. Atmos. 2013, 118, 8500–8518. [Google Scholar] [CrossRef]
Figure 1.
Map of the Hunza basin showing the position of the Discharge Station, Climate/Meteorological Stations, and Virtual Weather Stations. Inset shows the location within the Indus river basin.
Figure 1.
Map of the Hunza basin showing the position of the Discharge Station, Climate/Meteorological Stations, and Virtual Weather Stations. Inset shows the location within the Indus river basin.

Figure 2.
Principal layout of the J2000 model (source: adapted from Krause [40] and Nepal et al. [33]). Note: ET = evapotranspiration, P = precipitation, T = air temperature, W = wind speed, RH = relative humidity, SH = sunshine hours, LPS = large pore storage, MPS = middle pore storage, DPS = depression storage, RO = runoff.

Figure 3.
Glacier coverage of the Hunza basin under different scenarios: (a) baseline with no recession; (b) recession to 4000 masl; (c) recession to 4500 masl; (d) recession to 5000 masl.
Figure 3.
Glacier coverage of the Hunza basin under different scenarios: (a) baseline with no recession; (b) recession to 4000 masl; (c) recession to 4500 masl; (d) recession to 5000 masl.

Figure 4.
Daily snow cover area simulated by the J2000 model compared with MODIS 8-day interval snow cover data for the same period.
Figure 4.
Daily snow cover area simulated by the J2000 model compared with MODIS 8-day interval snow cover data for the same period.

Figure 5.
Hydrograph during (a) the calibration period, and (b) the validation period.

Figure 6.
Observed and simulated discharge during the modeling period: (a) boxplot of average monthly observed and simulated values; (b) scatter plot of daily observed and simulated values.
Figure 6.
Observed and simulated discharge during the modeling period: (a) boxplot of average monthly observed and simulated values; (b) scatter plot of daily observed and simulated values.

Figure 7.
Monthly average contribution of ice melt to total discharge during the modeling period.

Figure 8.
Annual water balance components in the Hunza river basin during the modeling period. Note: actEt = actual evapotranspiration
Figure 8.
Annual water balance components in the Hunza river basin during the modeling period. Note: actEt = actual evapotranspiration

Figure 9.
Ice melt and river discharge under different scenarios of glacier recession: (a) change in ice melt; (b) change in total discharge (Scenarios 1, 2, 3 correspond to recession to 4000, 4500, and 5000 masl, respectively).
Figure 9.
Ice melt and river discharge under different scenarios of glacier recession: (a) change in ice melt; (b) change in total discharge (Scenarios 1, 2, 3 correspond to recession to 4000, 4500, and 5000 masl, respectively).


Table 1.
Hypsometry of the Hunza basin.
| Elevation Range (masl) | Mean Elevation (masl) | Area | Installed Stations in the Elevation Range | |
|---|---|---|---|---|
| (km2) | (%) | |||
| Whole basin | ||||
| 1470–2500 | 2118 | 363 | 3 | - |
| 2500–3500 | 3087 | 1522 | 10 | Naltar |
| 3500–4500 | 4072 | 4078 | 30 | Ziarat |
| 4500–5500 | 4989 | 6457 | 47 | Khunjerab |
| 5500–6500 | 5800 | 1203 | 9 | - |
| 6500–7345 | 6718 | 138 | 1 | - |
| Glacier area | ||||
| 2712–3500 | 3207 | 103 | 4 | Naltar |
| 3500–4500 | 4099 | 519 | 18 | Ziarat |
| 4500–5500 | 5070 | 1544 | 53 | Khunjerab |
| 5500–6500 | 5818 | 637 | 22 | - |
| 6500–7345 | 6741 | 75 | 3 | - |
Table 2.
Hydro-meteorological data available for the Hunza basin 2000–2010.
| Station | Available Data | Data Period |
|---|---|---|
| Naltar | P, Tmin, max, RH | 2000–2010 |
| Khunjerab | P, Tmin, max, RH | 2000–2010 |
| Ziarat | P, Tmin, max, RH | 2000–2010 |
| Dainyor Bridge | Discharge | 2000–2004, 2008–2010 |
Note: P = precipitation (mm), Tmin, max = minimum and maximum temperature (°C), RH = relative humidity (%).
Table 3.
Climate/meteorological stations in the Hunza basin.
| Station | Elevation (m) | Latitude (deg) | Longitude (deg) | Annual Average Rainfall 2000–2010 (mm) |
|---|---|---|---|---|
| Naltar | 2810 | 36.21 | 74.26 | 699 |
| VWS1 | 5351 | 36.24 | 74.54 | 1409 |
| Khunjerab | 4730 | 36.85 | 75.4 | 188 |
| VWS2 | 5393 | 36.56 | 75.11 | 236 |
| Ziarat | 3669 | 35.83 | 74.43 | 253 |
| VWS3 | 5364 | 36.51 | 74.31 | 424 |
Note: VWS1 = Virtual Weather Station 1, VWS2 = Virtual Weather Station 2, VWS3 = Virtual Weather Station 3.
Table 4.
Glacier recession scenarios.
| Scenario | Conditions | Change from Baseline |
|---|---|---|
| Scenario 1 | Glacier termini recede to 4000 masl | Glacier area decreases by 10% |
| Scenario 2 | Glacier termini recede to 4500 masl | Glacier area decreases by 22% |
| Scenario 3 | Glacier termini recede to 5000 masl | Glacier area decreases by 41% |
Table 5.
Efficiency criteria derived from a comparison of simulated daily discharge values with observed values using observed and corrected precipitation.
Table 5.
Efficiency criteria derived from a comparison of simulated daily discharge values with observed values using observed and corrected precipitation.
| Efficiency Criteria | Observed Precipitation | Corrected Precipitation | ||
|---|---|---|---|---|
| Calibration | Validation | Calibration | Validation | |
| ENS | 0.86 | 0.77 | 0.93 | 0.87 |
| LNS | 0.87 | 0.77 | 0.95 | 0.86 |
| R2 | 0.92 | 0.89 | 0.93 | 0.88 |
| KGE | 0.87 | 0.78 | 0.93 | 0.87 |
KGE: Kling-Gupta efficiency, ENS: Nash-Sutcliffe efficiency, LNS: logarithm of Nash-Sutcliffe, R2: coefficient of determination.
Table 6.
Average monthly melt contribution from glacier area to total discharge from the Hunza basin.
Table 6.
Average monthly melt contribution from glacier area to total discharge from the Hunza basin.
| Month | Melt Runoff from Glacier Area (mm) | Snowmelt (mm) | Ice Melt (mm) | Rain Runoff (mm) |
|---|---|---|---|---|
| January | 0 | 0 | 0 | 0 |
| February | 0 | 0 | 0 | 0 |
| March | 1 | 0 | 1 | 0 |
| April | 4 | 1 | 3 | 0 |
| May | 20 | 5 | 14 | 0 |
| June | 59 | 18 | 40 | 1 |
| July | 117 | 28 | 86 | 3 |
| August | 127 | 22 | 102 | 4 |
| September | 53 | 5 | 47 | 1 |
| October | 20 | 1 | 18 | 0 |
| November | 4 | 0 | 4 | 0 |
| December | 0 | 0 | 0 | 0 |
| Annual | 405 (60%) | 81 (12%) | 315 (47%) | 9 (1.3%) |
(Note: total glacier melt is the sum of snowmelt, ice melt, and rain runoff from the glacier area).
Table 7.
Values of snow and glacier melt contribution to total river discharge according to various studies in areas in or near to the Hunza basin.
Table 7.
Values of snow and glacier melt contribution to total river discharge according to various studies in areas in or near to the Hunza basin.
| Publication/Study | Basin | Area (km2) | Snowmelt from the Basin (%) | Glacier Ice Melt * (%) | Snow and Glacier Melt (%) |
|---|---|---|---|---|---|
| [64] | Chenab (Indus) | 22,200 | - | - | 49 |
| [65] | Upper Indus | 200,677 | 40 | 32 | 72 |
| [7] | Indus | 205,536 | 65.7 | - | - |
| [6] | Liddar (Indus) | 653 | 60 | 2 | 62 |
| [66] | Gojal lake (Indus) | 9056 | - | 87 | - |
| [29] | Hunza (Indus) | 13,733 | 9.6 | 80.6 | 90.2 |
| [4] | Hunza (Indus) | 13,733 | 50 | 33 | 83 |
| [14] | Hunza (Indus) | 13,733 | - | 85 | - |
| Present study | Hunza (Indus) | 13,761 | 45 | 47 | 92 |
Note: * the percentage contribution of ice melt runoff from the glacier area to river discharge (excludes snowmelt and rain runoff from the glacier area).
© 2019 by the authors. Licensee MDPI, Basel, Switzerland. This article is an open access article distributed under the terms and conditions of the Creative Commons Attribution (CC BY) license (http://creativecommons.org/licenses/by/4.0/).
Share and Cite
MDPI and ACS Style
Shrestha, S.; Nepal, S. Water Balance Assessment under Different Glacier Coverage Scenarios in the Hunza Basin. Water 2019, 11, 1124. https://doi.org/10.3390/w11061124
AMA Style
Shrestha S, Nepal S. Water Balance Assessment under Different Glacier Coverage Scenarios in the Hunza Basin. Water. 2019; 11(6):1124. https://doi.org/10.3390/w11061124
Chicago/Turabian StyleShrestha, Saroj, and Santosh Nepal. 2019. "Water Balance Assessment under Different Glacier Coverage Scenarios in the Hunza Basin" Water 11, no. 6: 1124. https://doi.org/10.3390/w11061124
Note that from the first issue of 2016, this journal uses article numbers instead of page numbers. See further details here.