Hydrological Components Variability under the Impact of Climate Change in a Semi-Arid River Basin

1
College of Water Sciences, Beijing Normal University, Beijing 100875, China
2
CECEP Consulting Co., Ltd., Beijing 100082, China
*
Author to whom correspondence should be addressed.
Water 2019, 11(6), 1122; https://doi.org/10.3390/w11061122
Submission received: 1 April 2019
/
Revised: 20 May 2019
/
Accepted: 24 May 2019
/
Published: 29 May 2019
(This article belongs to the Section Hydrology)
Abstract
:With increased attention paid to the changes of global climate, the impacts on hydrological processes remain poorly understood in specific basins. In this study, we selected Luanhe River Basin, which is an important source of water supply to Beijing and Hebei, as a case study for the analysis of the combined impact of precipitation and temperature change to hydrological components in a semi-arid river basin. This study investigated the change of the blue water flow (BWF), green water flow (GWF), and green water storage (GWS) by employing the SWAT (Soil and Water Assessment Tool) model and stochastic methods in different time scales during 1960 to 2017. The contribution of climate changes to hydrological change were quantified by 16 hypothetical scenarios by recombining climatic data. The results show that the annual daily maximum and minimum temperature (Tmax, Tmin) increased while their differences (DTR) decreased. However, there was no significant trend in annual precipitation and hydrological components. The trend of precipitation has a positive impact to the change of all three hydrological components. Although precipitation contributes more to changes in hydrological components, more attention also needs to be given to the change of DTR, which has positive impact of GWF that contrasts with that of BWF and GWS. Seasonal scale studies of these changes suggested that more attention should be paid to the climate change in spring and winter when the hydrological components were more sensitive to climate change. Our results summarized hydrological components variability under the impact of climate change and demonstrated the importance of analyses at different time scales, which was expected to provide a reference for water resources management in other semi-arid river basins.
1. Introduction
Climate change has been recognized as one of the major threats to the earth environment in the 21st century [1,2]. Changes in temperature and precipitation patterns are expected to alter regional climates and hydrological systems [3], affecting freshwater availability at the regional scale [4]. The conflict of freshwater consumption between the human society and ecosystem may threat socio-economic sustainability and ecosystem health (e.g., leading to ecosystem degradation). Thus, improved understanding of water availability for both humans and ecosystems in the context of climate change is critical for better water resources management.
As far as the hydrological cycle is concerned, the composition of water resources includes blue water (BW) and green water (GW). Blue water is critical for domestic and industrial water consumption, while green water is crucial for supporting plant growth in rain-feed regions [5]. With the development and improvement of hydrologic modeling, the spatial and temporal variation of surface and sub-surface hydrological components can be explicitly assessed by portioning water into Blue Water Flow (BWF; total water yield and deep aquifer recharge), green water flow (GWF; actual evapotranspiration) and green water storage (GWS; soil water content) [6,7]. Long-term spatio-temporal changes in BW-GW can indicate the change in overall hydrological change at watershed scale.
Unlike the humid area, the semi-arid regions are more sensitive in streamflow reduction to climate change or anthropogenic water management, because of their remarkable seasonal climate characteristics. Climate warming in the semi-arid regions might cause increasing open water evaporation and plant transpiration [8] which will further affect the formation of precipitation. Due to the limitation of surface water availability, understanding how the surface and ground water can be well managed in this region to meet the local urban agricultural and environmental demands under climate change is critical to water supply [9]. Besides, seasonal differences, which are very important for agricultural and domestic water supply, are often neglected due to the concentration of precipitation in summer in these regions. Luanhe River Basin is a typical semi-arid region with uneven distribution of the precipitation. A total of 70%–80% of the annual precipitation falls in the rainy months of June to September [10]. In addition, the southeast region received more precipitation than the northwest region with mean precipitation that varied from 400 to 800 mm from the northwestern to southeastern region. Therefore, the availability and temporal variability of hydrological components is of primary importance for fresh water planning and ecological security conservation in this basin.
Hydrological modelling has been employed to assess water availabilities in semi-arid and arid regions. Guo and Shen [11,12] estimated water availability and agricultural water demand and proposed effective adaptation strategies to cope with severe water shortages under possible climate change trends in the arid region of northwestern China. Hydrological simulation and evaluation have also been conducted in Luanhe River Basin to evaluate the runoff change [10], water scarcity [13], and hydrological droughts under the climate change and human activities. Previous studies mainly focused on the integrated influences of LULC (Land Use/Land Cover) change and climate change, in which the individual effects of temperature and precipitation variations are often neglected. However, in Luanhe River Basin and other basins where vegetation is well protected, LULC has less influence on regional hydrological process. Hence, improved understanding of BW and GW under the influence of temperature and precipitation variability is of critical importance in the Luanhe River.
The present study was conducted in Luanhe River Basin, a semi-arid catchment in China. The objectives were as follows: (1) analyze the temporal variation of temperature and precipitation in the last five decades; (2) assess hydrological response to climate change in terms of different hydrologic components (BW and GW); (3) investigate the contribution of temperature and precipitation to the hydrological process.
2. Materials
2.1. Study Area
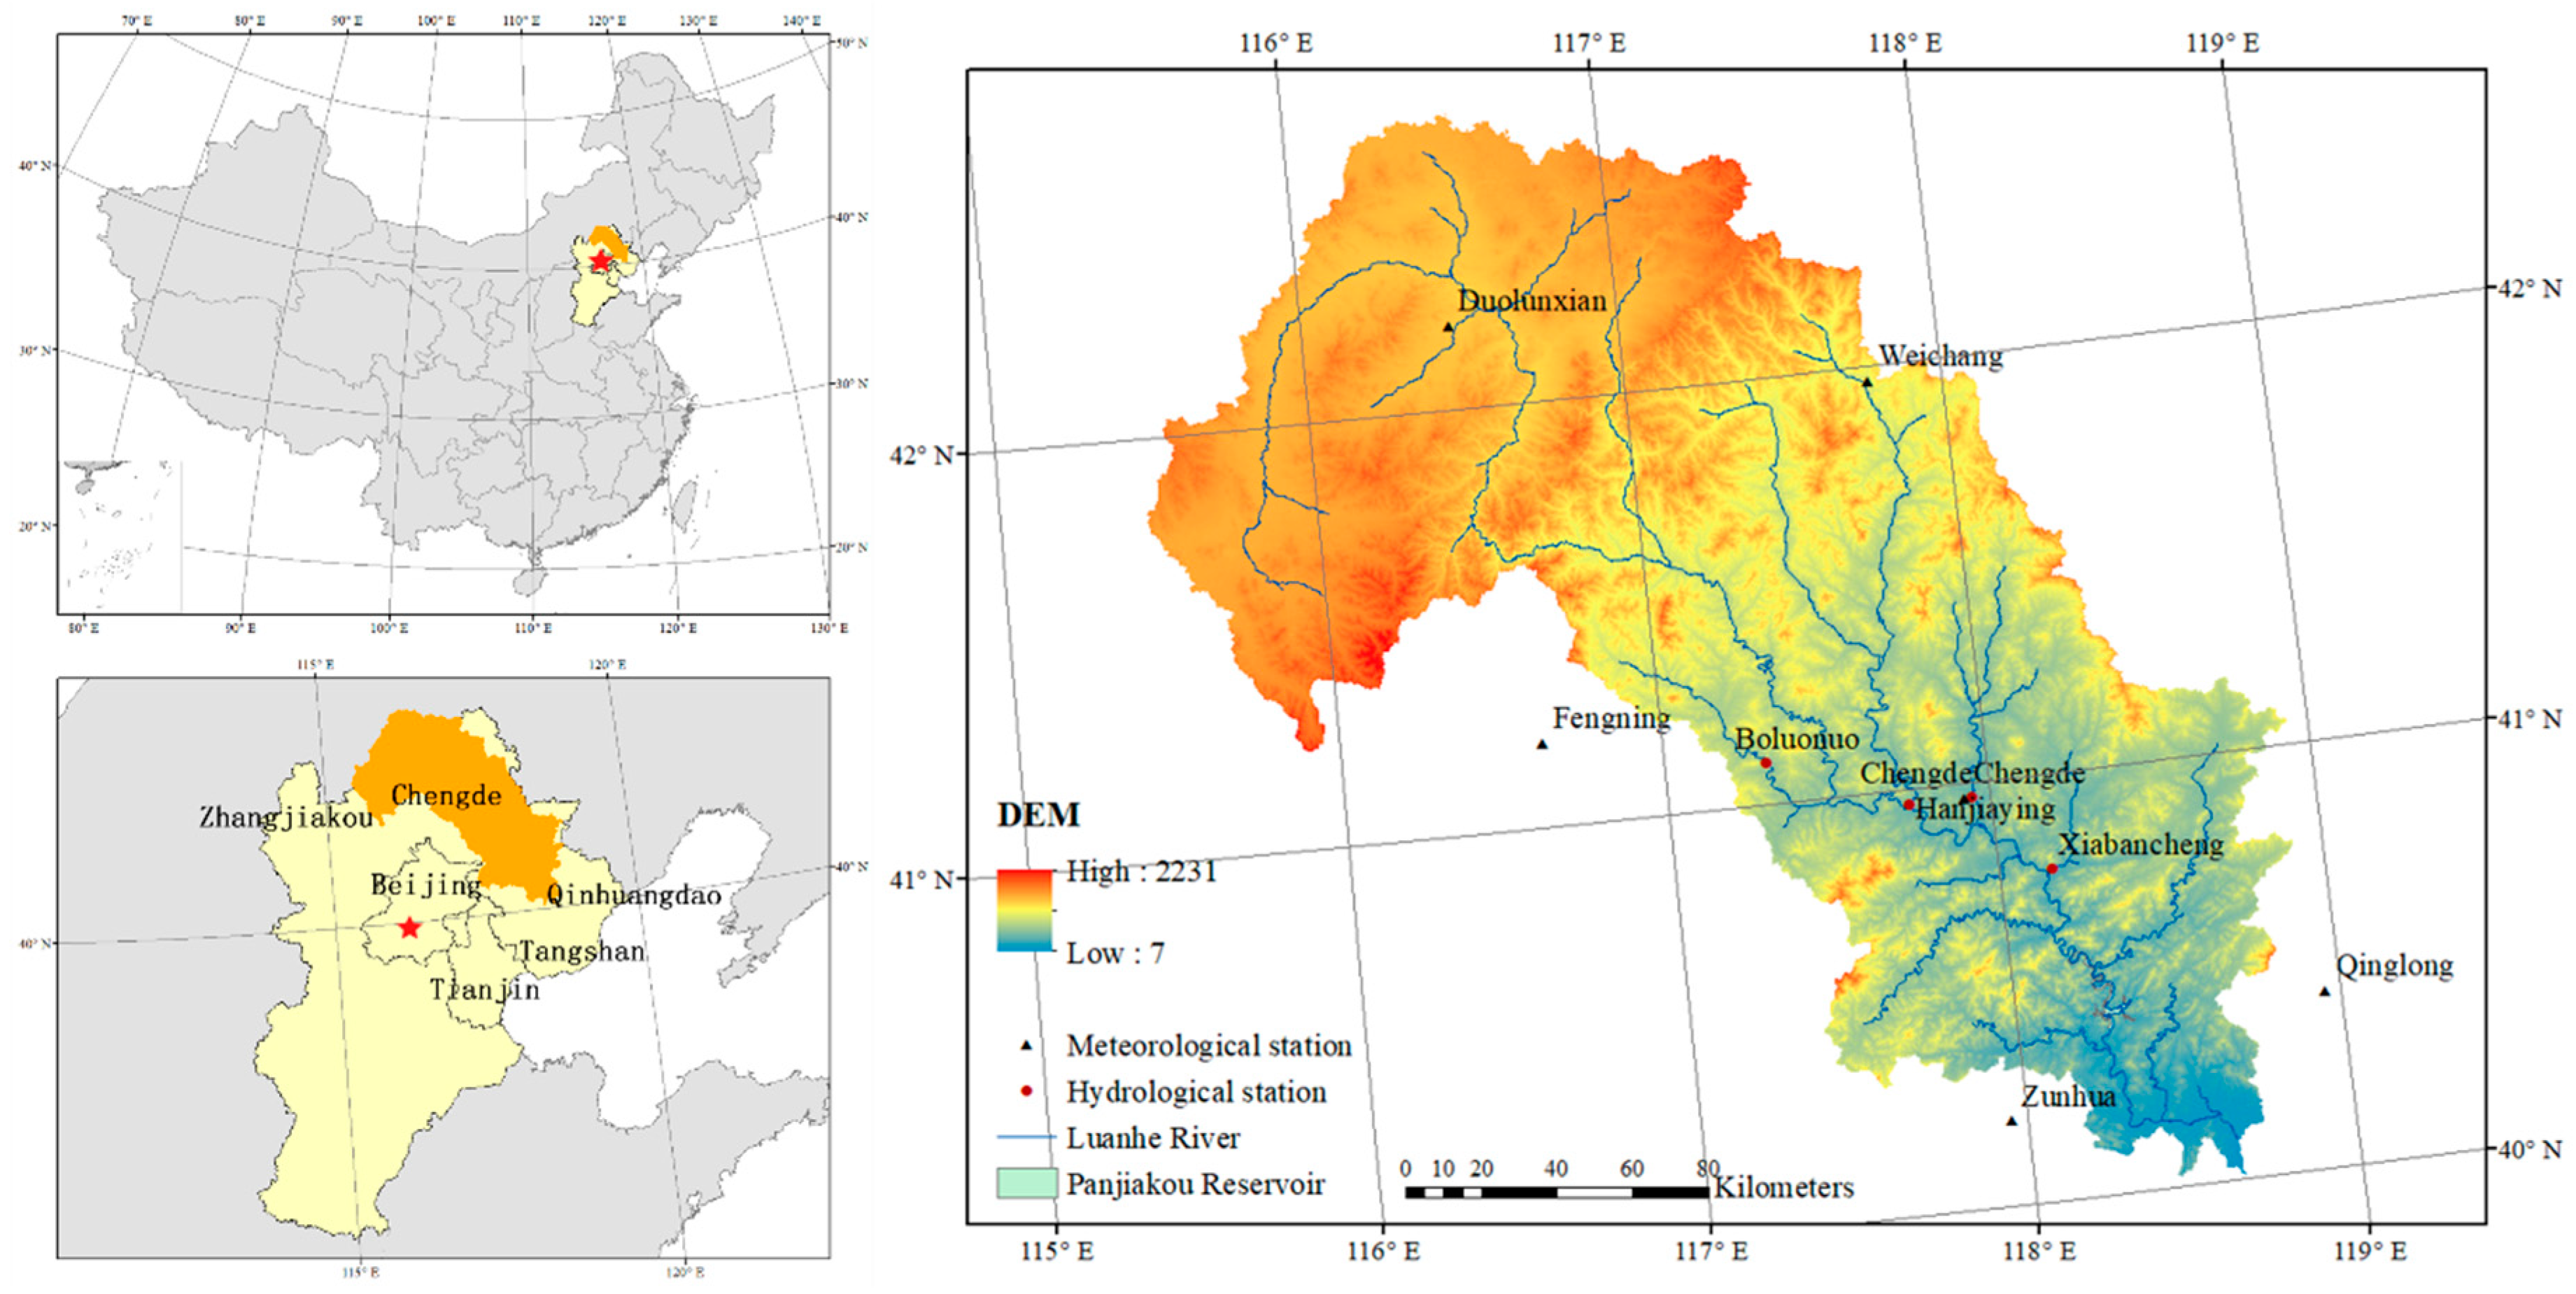
Luanhe River Basin is located between 115°30′ N and 119°45′ N and between 39°10′ E and 42°40′ E (Figure 1). The total basin area is 44,750 km2, including 43,940 km2 of the mountain area and 810 km2 of the plain area. It originates from the northern foot of Bayanguer mountain in the northwest of Fengning Manchu Autonomous county, Hebei province, and flows into the Bo sea at Leting county Hebei province with the total length of 888 km. The part of the Luanhe River Basin above the Panjiakou Reservoir which covers 38,185.34 km2 is the research area of this paper. The climate of this area varies greatly from north to south, with the annual average temperature increasing from 1 to 11 °C and precipitation ranges from 400 to 800 mm, which belongs to the typical temperate continental monsoon climate. The major land cover in the river basin is forest, accounting for about 40% of the total area, followed by grassland and arable land. The main soil types are brown earth and cinnamon soil. The study area occupies 72.12% of the area of Chengde, Hebei province and is the mother river of Chengde. Furthermore, after its operation at the end of the flood season in 1979, Panjiakou Reservoir has become the main project of water supply from Luanhe to Tianjin and Tangshan. Therefore, the water resource of this basin plays a very important role in ensuring water resources development in Beijing-Tianjin-Hebei (Jing-Jin-Ji) region. The study of changes and distribution of water resources is expected to provide theoretical support for ensuring regional water supply security in this area.
2.2. Data Collection
The digital elevation model (DEM) with 30 m resolution was acquired from Geospatial Data Cloud (http://www.gscloud.cn). Land use images of 2015 were used from Resource and Environment Data Cloud Platform (http://www.resdc.cn/), including Forest, Agriculture, Grassland, Urban and Unused Land. In this paper, the LULC of 2015 was used as the basis for SWAT modelling. We only focused on the impact of climate change on hydrological processes in this region. Soil layers and property data (1:1,000,000) came from China Soil Database (http://vdb3.soil.csdb.cn/) and are divided into four types in this study: Cinnamon soil, Yellow loessal soil, Chestnut soil, Brown soil according to Chinese Soil Taxonomy. Daily meteorological data at six weather stations near the study area (Figure 1) were obtained from National Meteorological Information Center (http://data.cma.cn/), which included temperature, precipitation (minimum, maximum and average), wind speed, solar radiation, and relative humidity from 1957 to 2017. Monthly runoff data from 2008 to 2013 of four hydrological stations at Boluonuo, Chengde, Hanjiaying and Xiabancheng located in the main stream of Luanhe River were also collected.
3. Methods
3.1. Trend Analysis
3.1.1. Mann–Kendall Trend Test
The Mann–Kendall (MK) test [14,15] is a rank based non-parametric method which has been commonly used to detect the long-term trend of meteorological elements and hydrological components. It is recommended by the World Meteorological Organization for non-parametric analysis [16] of the significance of monotonic trends of hydrological or climatological variables. It has been widely used in hydro-climatic studies including precipitation [17], runoff [18], and temperature [19,20]. The advantage of the MK test is that the trend analysis is not influenced by a small number of outliers for sequence analysis and the calculation is simple. For this study, a significance level of 0.05 was utilized.
The magnitudes of estimated changes in the trend of meteorological variables in this study were estimated by an application of the Sen slope method [21,22]. This technique calculates the gradient as a change in the measurements correlated with units of temporal change. The advantages of this method include the allowances for missing data, avoidance of assumptions on distributions of tested data, and the averting of the effects of gross data errors and outliers. The Theil–Sen’s estimator (β) is used to identify the slope of the trend line in hydrological time series. β > 0 shows an increasing trend while β < 0 indicates a decreasing trend.
3.1.2. Hurst’s Index
Hurst’s [23] index is capable of predicting future trends for time series in relation to past trends, and it has been used to predict hydrological and climatological processes [24]. H always ranges between 0 and 1. When 0.5 < H < 1, it shows that the time series is a persistent sequence, and the trend of future will consistent with the past trend. When 0 < H < 0.5, it shows that the time series has a reverse hold, which means the trend of change in the future is contrary to that in the past.
3.2. Model Set-Up, Calibration and Validation
3.2.1. SWAT Model
The Soil and Water Assessment Tool (SWAT) is a distributed hydrological model which has been widely used to simulate the quality and quantity of surface and ground water, and applied in prediction of the environmental impact of land use, land management practices, and climate change [25]. The model divided watershed into several sub-basins, and divided each sub-basin into several Hydrological Response Units (HRUs) according to the geographical condition, including digital elevation model (DEM), land use/land cover map and soil map data etc. The HRUs were the minimum units that were used to calculate the transportation of solute and water, while hydrologic cycle equation simulated by SWAT is based on the following governing water balance equation as follows (Equation (1)) [26].The daily climate data including rainfall, temperature, relative humidity, solar radiation and wind speed was applied as input to setup the model.
where, SWt is the final soil water content (mm); SW0 is the previous soil water (mm); t is the step of time (d); Rday, Qsurf, and Ea are the amount of precipitation, surface runoff, and evaporation on day i (mm), respectively; Wseep is the amount of water entering the vadose zone from the soil profile on day i (mm) and Qgw is the amount of the return flows on day i (mm).
3.2.2. Model Calibration and Validation
Monthly streamflow data in range of 2008 to 2013 with four hydrological stations mentioned above was used for the calibration and validation. SWAT-CUP 2012 and SUFI-2 arithmetic were applied to the calibration and validation to obtain optimal parameters. The decision coefficient (R2), Nash–Sutcliffe efficiency coefficient (NS) and relative error (RE) were used as objective functions to assess the performance of the model simulation [27,28] as following Equations (2)–(4), respectively:
where is the observed streamflow, is the simulated streamflow, and are the average observed and simulated streamflow values, respectively, and n is the simulation number. The higher the NS and R2 and the smaller RE, the better the model performs. When R2 > 0.6, NS > 0.5, the simulated runoff by the SWAT model was considered to be valid [29].
3.3. Contribution Analysis
3.3.1. Contribution Rate
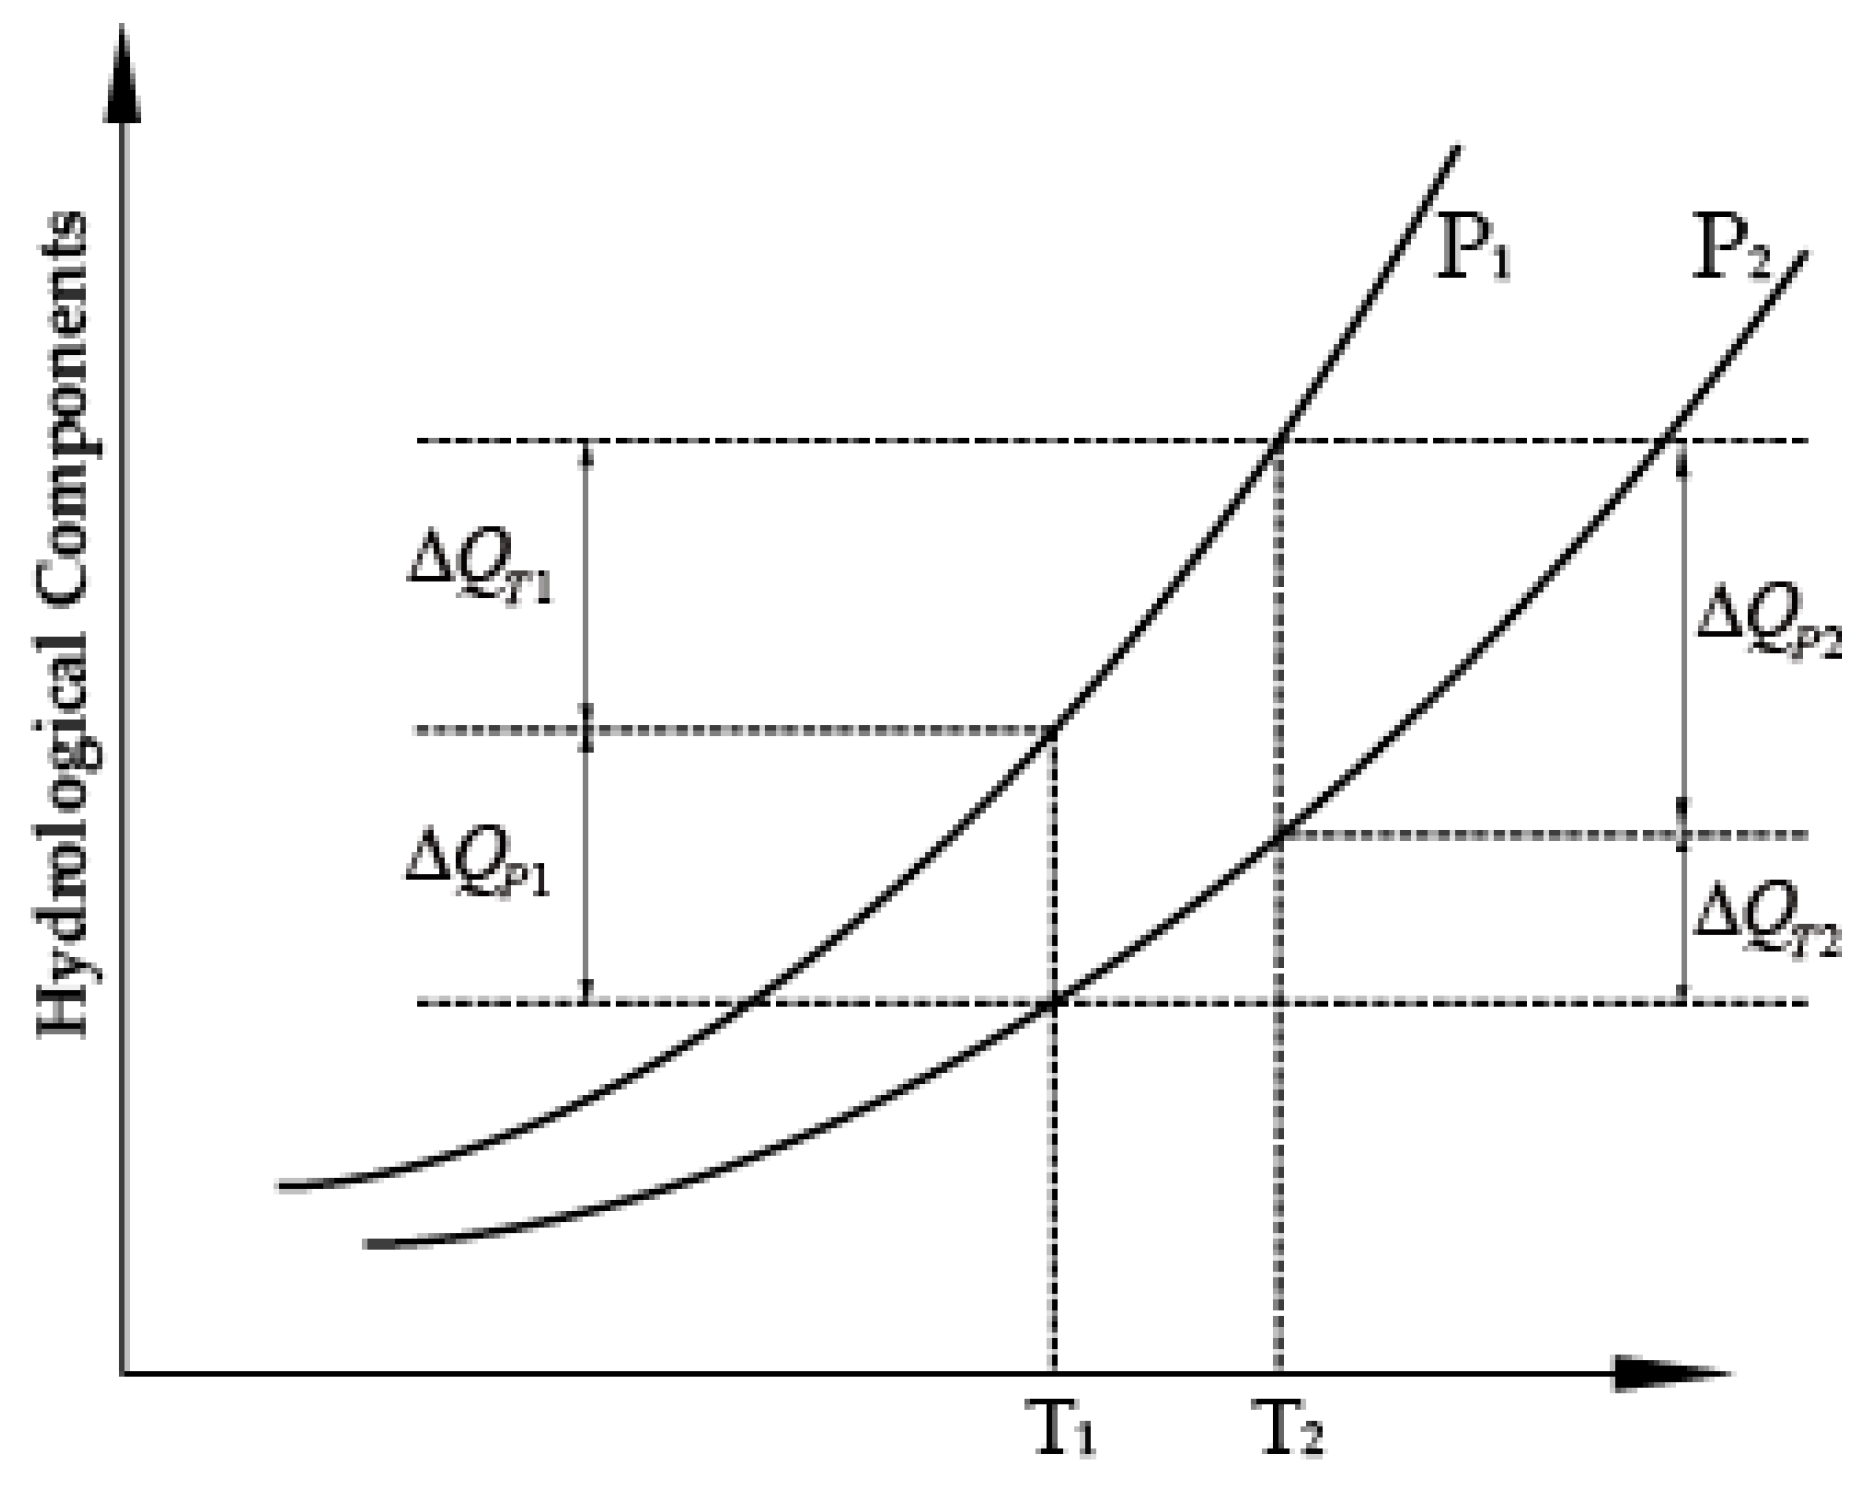
In Luanhe River Basin, changes in hydrological processes are mostly caused by climate variability [30,31], and temperature and precipitation are considered to be the most important factors in the study of climate change. In this study, hydrological processes were treated as a function of the two variables. The contribution of the two components can be calculated with the method shown in Figure 2. The separated impact of temperature changes on hydrological processes under precipitation, P1, and P2 are applied to calculate ΔQT1 and ΔQT2, respectively. In general, the smaller the change caused by precipitation change (ΔP), the closer the ΔQT1 to ΔQT2 is. Thus, we utilized an average of the ΔQT1 and ΔQT2 values to denote the separate impacts of temperature on hydrological elements (ΔQT) (Equation (5)):
Similarly, the effects of precipitation on hydrological processes were calculated by applying the difference of hydrological component values under temperature conditions T1 and T2, which are denoted as ΔQP1 and ΔQP2 (Figure 2). The smaller the influence in temperature (ΔT), the closer ΔQP1 to ΔQP2 is. The arithmetic means of ΔQP1 and ΔQP2 can be used to assess the separated impacts of the change of precipitation to the hydrological component variations (Equations (6)):
Therefore, the contribution of the temperature (βT) and precipitation (βP) for the change of hydrological process in an altered period (ΔQ) can be calculated as Equations (7)–(9):
3.3.2. Scenarios Setting
A variety of scenarios were set to quantitatively analyze the impact of climate change on the hydrological components’ variability. Meteorological data (temperature and precipitation) was divided into six decades (1960s (1960–1969), 1970s (1970–1979), 1980s (1980–1989), 1990s (1990–1999), 2000s (2000–2009) and 2010s (2010–2017)) respectively. The calibrated SWAT model was applied to conduct the scenario analysis by changing one factor at a time and keeping the rest constant, as shown in Table 1. The contribution of temperature and precipitation to the decadal hydrological variations can be calculated by conducting 16 sets of scenarios.
4. Results
4.1. SWAT Model Simulation
In this study, the simulation period covered 61 years (1957–2017) while the first 3 years (1957–1959) were used as warm up period, in order to avoid the influence of initial conditions on the simulation results, and the time step was set as one day. The study area was delineated into 51 sub-basins and further divided into 324 HRUs using the watershed delineation module in SWAT. In the application of SWAT model, the observed monthly runoff data Boluonuo, Chengde, Hanjiaying and Xiabancheng hydrological stations from 2008 to 2011 were used to calibrate parameters while data from 2012 to 2013 was adopted for validation. The seven most sensitive parameters were selected for model calibration and are shown in Table 2.
Observed and simulated monthly streamflow hydrographs from 2008 to 2013 in the four stations are shown in Figure 3. The R2, NS and RE between simulation and observation data (Figure 3), which ranged from 0.68 to 0.86, 0.54 to 0.80 and 0.6% to 24.7%, indicated that the model could simulate the hydrological process in Luanhe River Basin satisfactorily.
4.2. Annual Variation of Hydrological Components under the Impact of Climate Change
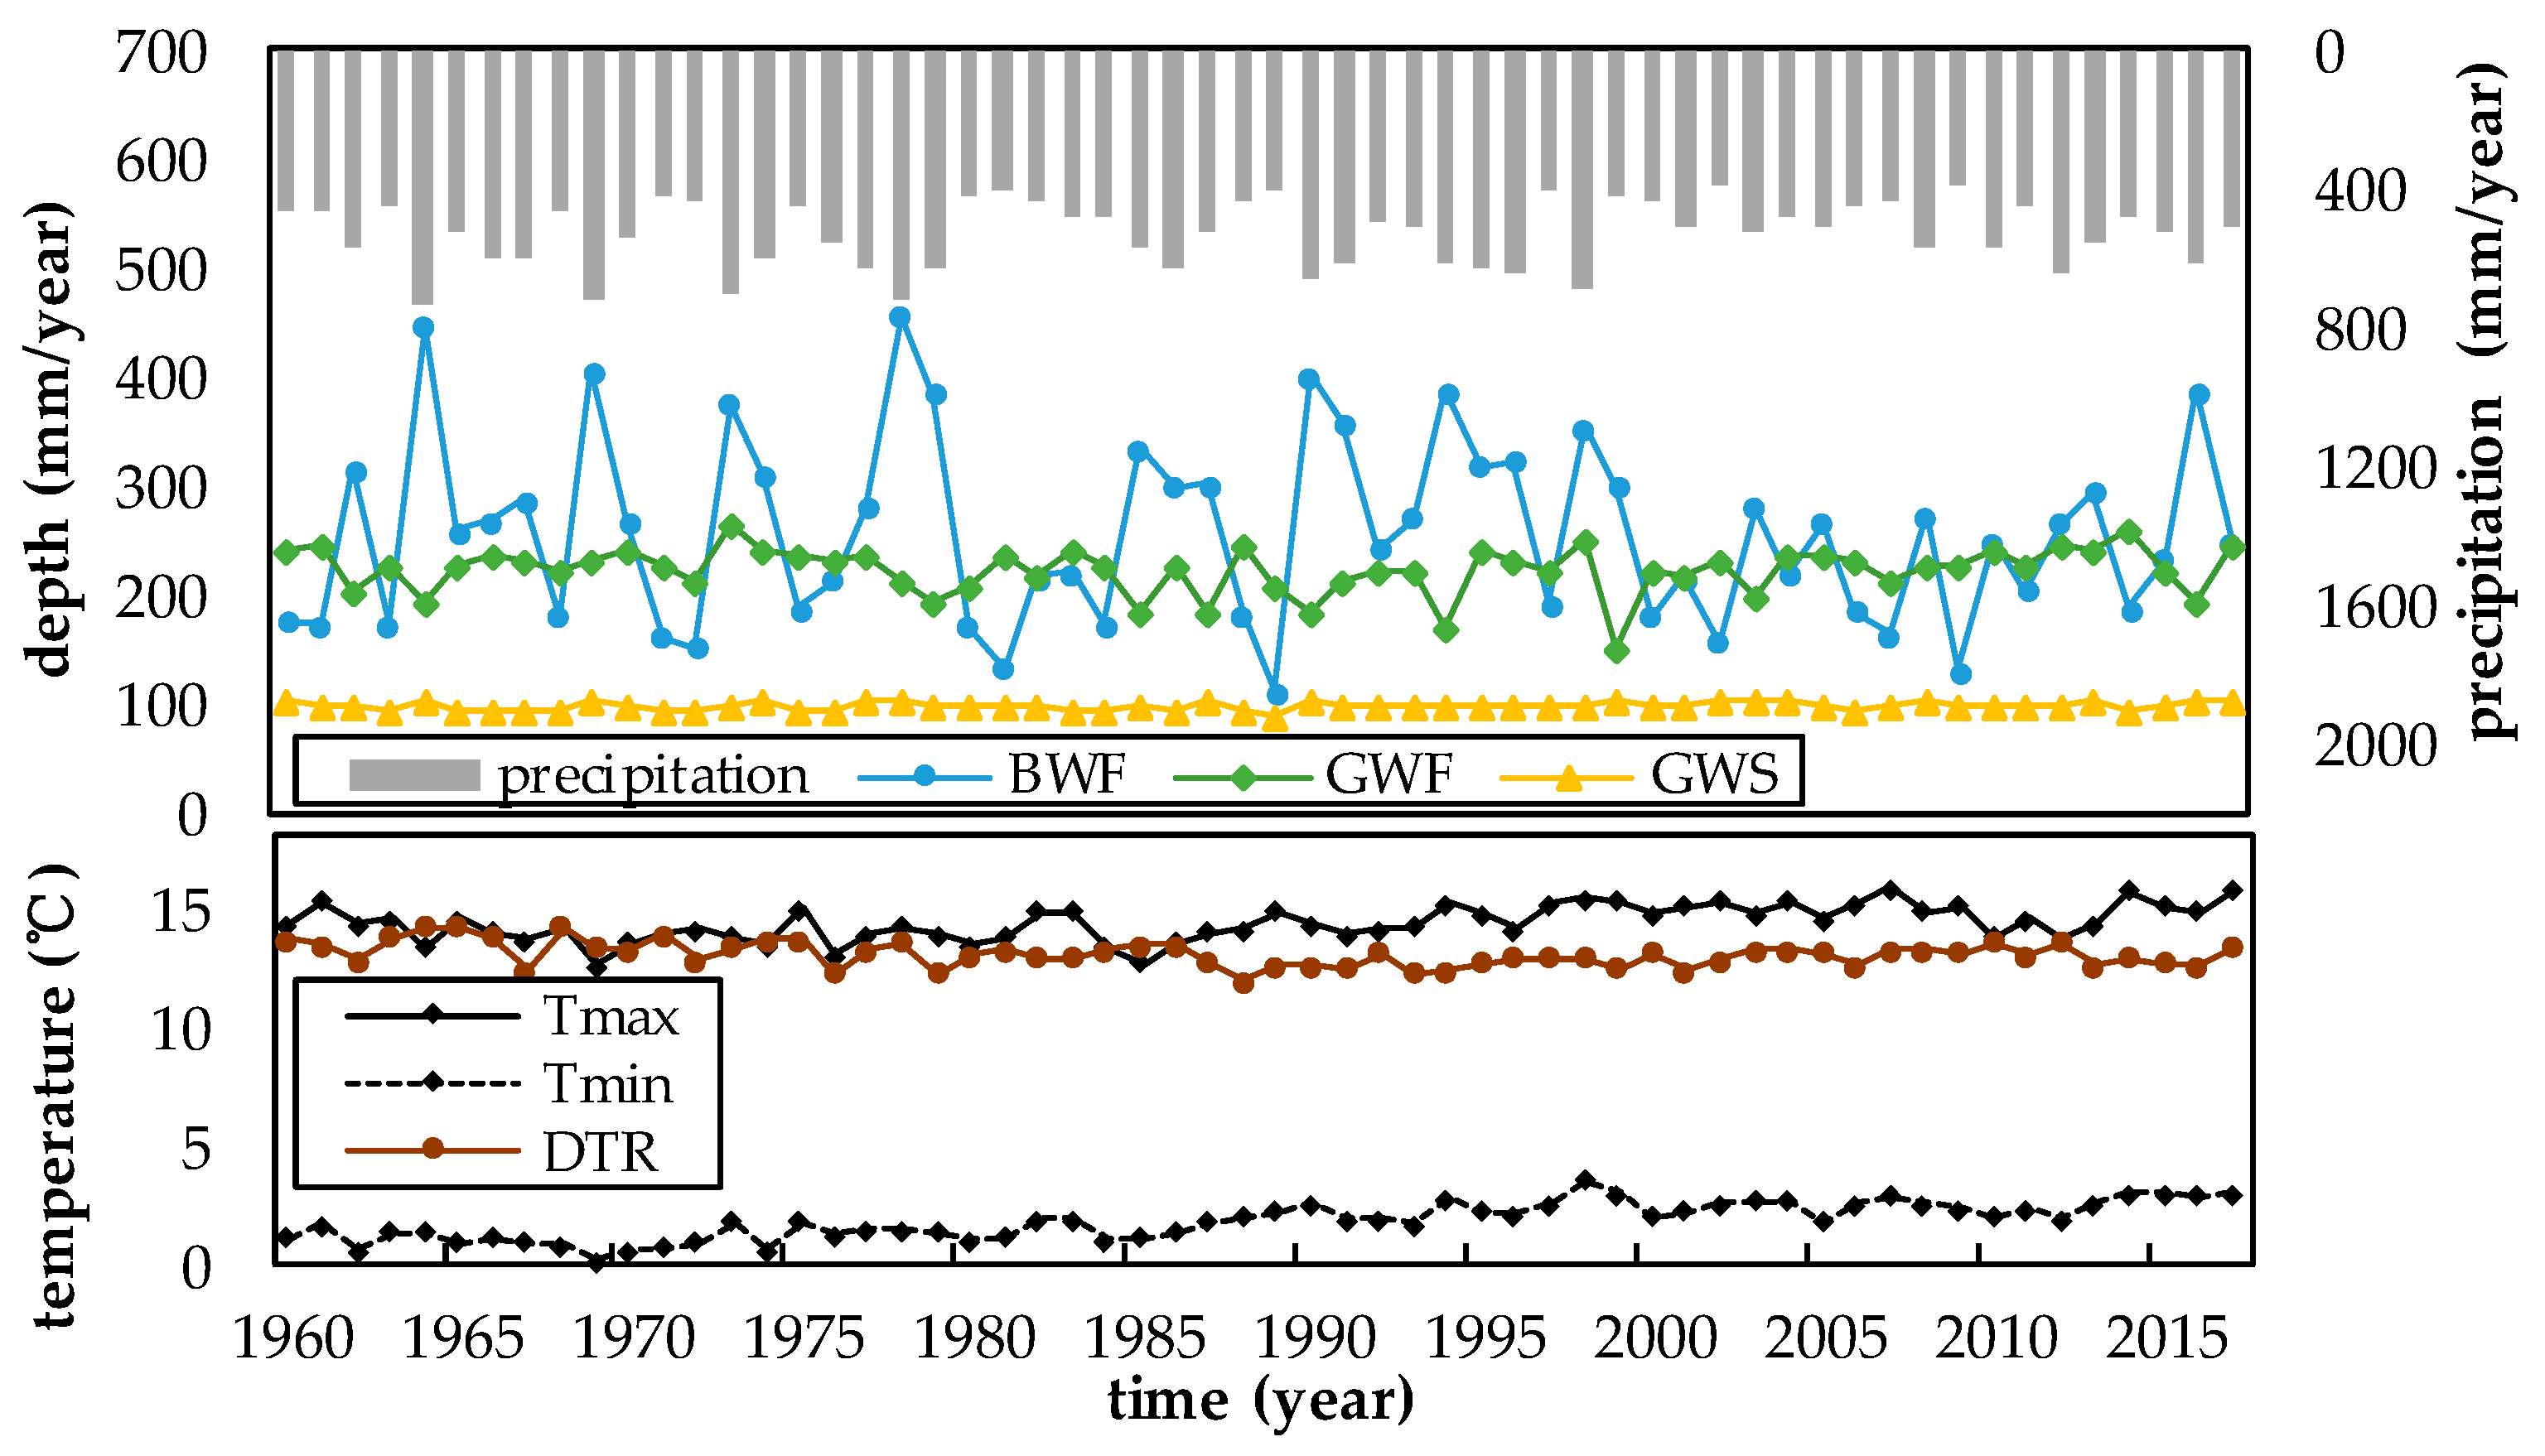
The annual variation trend of hydrological components demonstrated a complex relationship with the meteorological factors. Data of six meteorological stations was used to assess the climate changes. The average maximum temperature (Tmax) is 14.37 °C and average minimum temperature (Tmin) is 1.86 °C in the Luanhe River Basin. Both the times varying curve (Figure 4) and the results of MK test (Table 3) showed a significant feature of warming with the increase of Tmax and Tmin. Notably, the reduction of the surface diurnal temperature range (DTR) was also observed in this area. During the 58 years, Tmin increased 1.78 °C with an average annual growth rate of 1.57%, while Tmax increased only 1.35 °C with the rate of 0.16%. Tmin increased at a faster rate than Tmax, leading to the drop of DTR since 1960. The average precipitation was 500.93 mm/year and no significant trend was observed at the annual scale. Simulated results (including runoff, evaporation, and soil water content) were adopted in this study to calculate the BWF, GWF, and GWS. As shown in Figure 4, the annual average BWF and GWF was 256.30 and 222.94 mm/year, respectively. However, the fluctuation range of BWF was much obvious than that of GWF. The annual average GWS is more stable than that of BWF and GWF, and the annual average GWS was only 97.92 mm/year. Results of MK test in Table 3 show that the BWF decreased, while the GWF and GWS increased during the past 58 years. However, the change of all three variables was not significant. The Hurst indexes of the BWF, GWF, and GWS were 0.57, 0.71, and 0.73, which indicated this trend was likely to continue in the future.
Compared with meteorological factors and hydrological components, annual variation of hydrological components, especially the BWF, correlated closely with the fluctuations of precipitation (Figure 4). Precipitation had a more direct impact on hydrological cycle. However, in some years there are differences in runoff and evapotranspiration that may be caused by the influence of temperature and other potential factors (e.g., land use).
4.3. Seasonal Variation of Climate and Hydrological Components
Luanhe River Basin is a typical temperate monsoon climate area with four distinct seasons, where the weather is hot and rainy in summer, cold and dry in winter. The precipitation mostly concentrated in summer (371.45 mm/year) accounting for more than 75% of the total annual rainfall, which will affect the trend of annual precipitation change. The precipitation during winter was lower than other seasons with a range of about 0.90–25.72 mm. The result of MK test for seasonal variation of precipitation showed it had an insignificant increase in spring, autumn and winter, and only decreased in summer. The temperature of each season also shows remarkable variation characteristics. The annual average Tmax and Tmin during the freeze winter could reach −1.40 and −13.91 °C, while raised up to 27.79 and 16.61 °C in summer. Additionally, their difference (DTR) had much smaller ranges, which were highest in spring (14.20 °C) and lowest in summer (11.72 °C). The MK test in Table 4 showed that the air temperature (Tmax, Tmin) increased significantly (p < 0.05) in every season. The Tmax increased faster in spring while the Tmin increased faster in winter. The trend of DTR showed that the Tmin increased significantly faster than the Tmax in autumn and winter.
At seasonal scale, the variation of GWS was not obvious, but the BWF and GWF was extremely uneven throughout the region. Previous studies on the hydrological process were concentrated on the inter-annual scale but the seasonal hydrological cycle under the impact of climate characteristics is still relatively limited, which is essential for the domestic water supply and vegetation health. In spring, there was more GWF than BWF, which could provide a relatively humid environment for germination of plants. The increasing of temperature and rainfall in summer would accelerate the hydrological cycle. A total of 61.4% of the annual BWF and 51.3% of the annual GWF concentrated in summer and the quantity of BWF exceeds GWF in this season. Moreover, the BWF fluctuated from 256.6 to 62.0 mm/year which would cause some extreme events, when summer monsoon intensity is weak (strong), drought (flood) will happen. In winter, temperature decreased below zero with only a small amount of snow which counted for only 2.2% and 1.5% of the annual BWF and GWF. The variation trends of climate elements and hydrological components (Table 4) were not significant with an exceptional of GWS in spring, indicating that the impacts of climate change on blue and green water are very complex and difficult to describe with a simple trend analysis during these years.
4.4. Contribution of Climate Change to Hydrological Change
4.4.1. Annual Scale
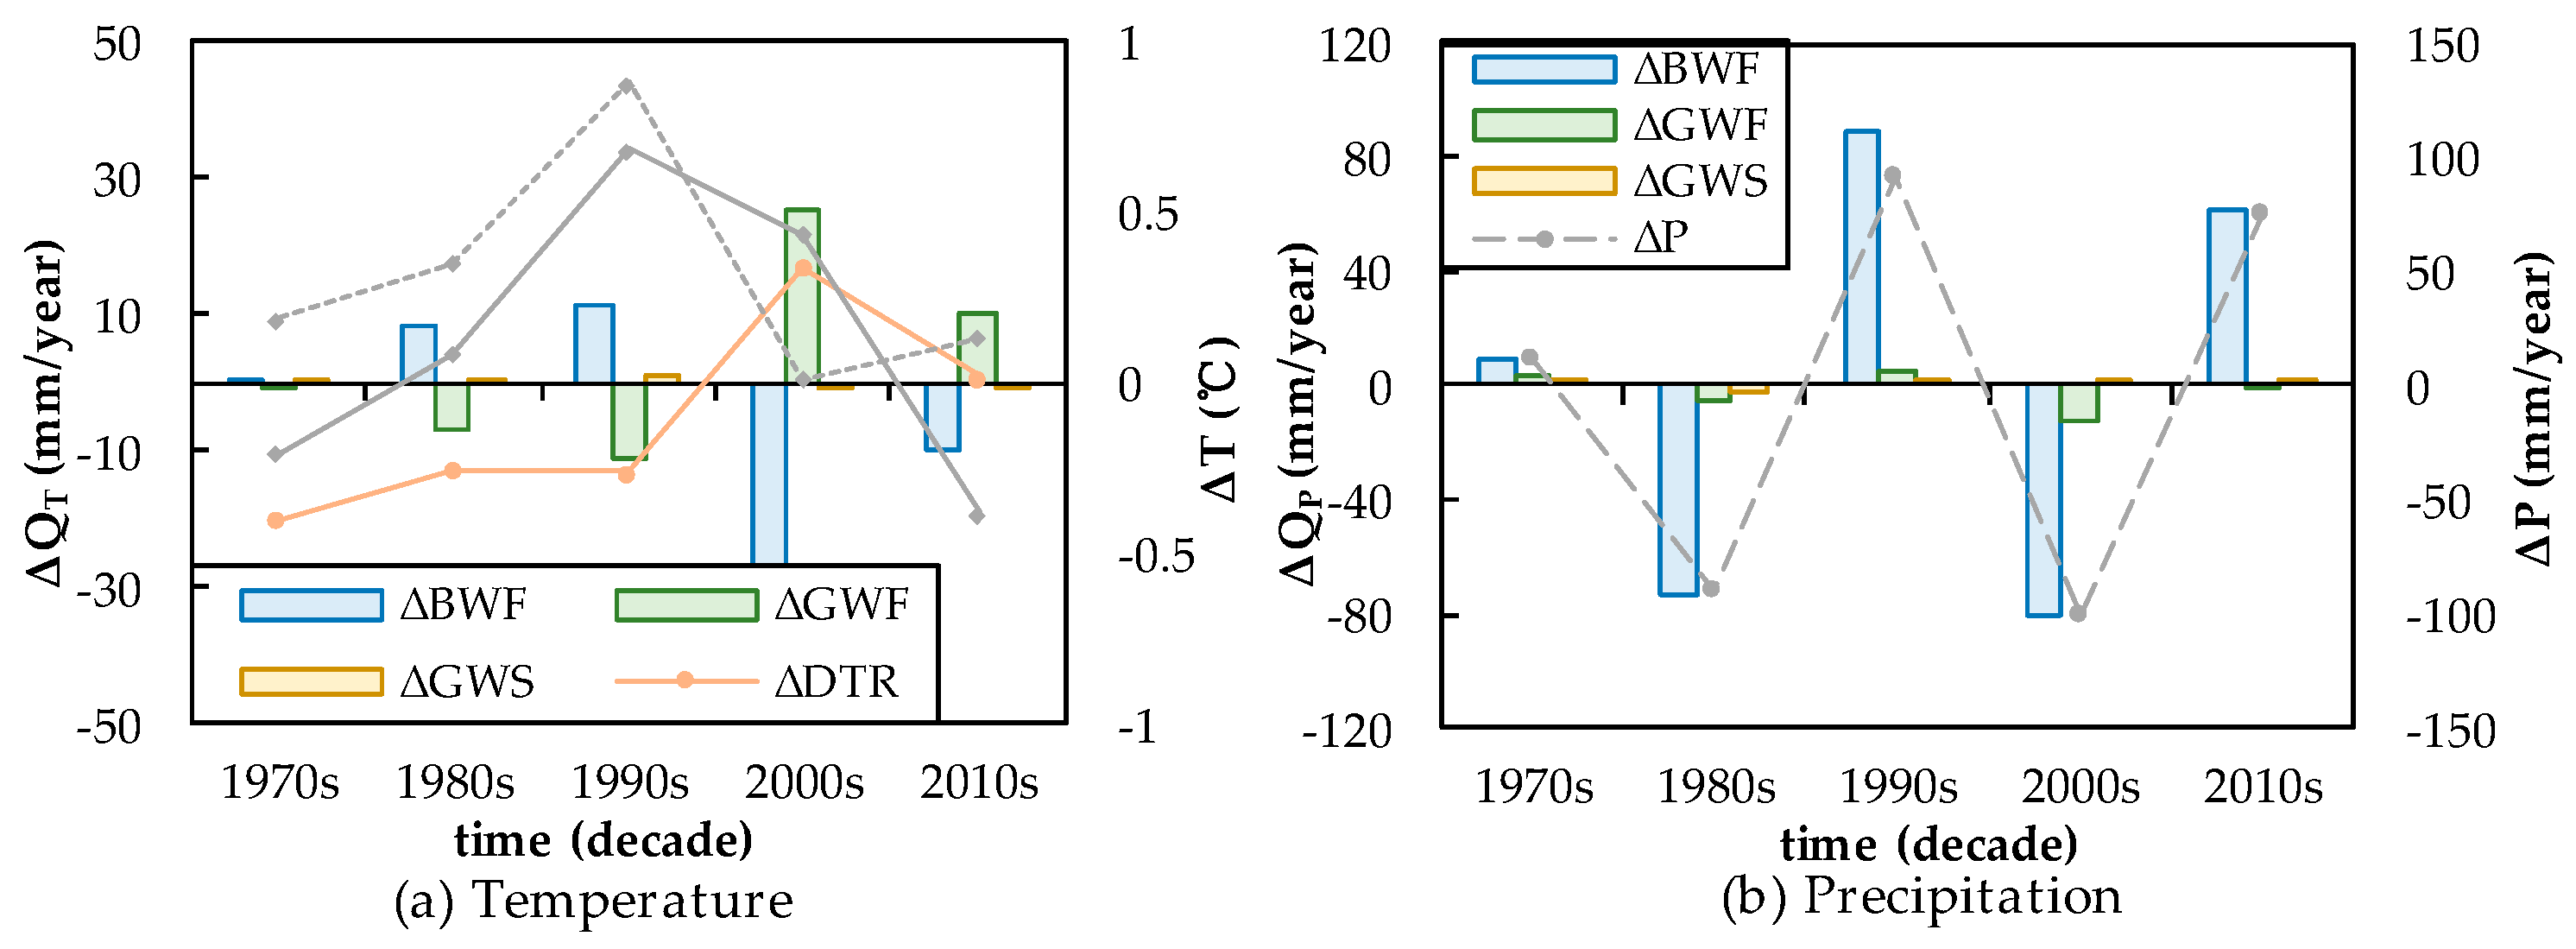
The hypothetical scenarios M1–M16 were used to separate the effects of temperature or precipitation changes in different decades on hydrological components. From 1970s to 1980s precipitation declined 90.35 mm/year and the difference between scenario M4 and M5 can reflect the impact of this precipitation change on the hydrological cycle. Based on the comparison of the simulation results of scenario M4 and M5, BWF decreased 60.16 mm/year. It reduced 84.99 mm/year from scenario M6 to M7. The average of differences between M5 and M4 and those of M7 and M6 reflected the influence of precipitation from 1970s to 1980s. By this method, the average variation (ΔQT, ΔQP) of each hydrological component under the influence of climate variability (ΔT, ΔP) in different decades can be obtained. The results of the respective influence by temperature and precipitation are shown in Figure 5. It can be clearly seen from Figure 5a that when only the influence of temperature is taken into account, the variation of BWF and GWS is opposite to that of GWF. The change trend of DTR is positively correlated with BWF and GWS, while DTR is negatively correlated with GWF. At the same time, the higher the temperature is, the greater the variation range of hydrological components is. Compared with temperature, the change of precipitation has a greater impact on BWF and GWS, and a smaller impact on GWF, as shown in Figure 5b. The positive and negative Qp of the three are the same, indicating the same change pattern, and both are positively correlated with the change of precipitation. As mentioned above, the rising of DTR was mostly caused by the larger warming in Tmin than in Tmax. The faster increase of Tmin can increase the evaporation and then decrease the runoff in the water cycle processes. Meanwhile, regional precipitation decreases may directly aggravate the reduction of runoff and further reduce the amount of water in each link of water transmission and transportation in the hydrological process.
The combined effort of precipitation and temperature on hydrological components was determined by their contribution rate to the variation of hydrological components. For example, in the 1980s, the precipitation and DTR decreased simultaneously. The decrease of precipitation will lend to the BWF decrease of 72.58 mm, and the decrease of DTR will add 8.23 mm BWF. Therefore, the BWF decreased 64.3 mm under climate change. The absolute change of BWF was 80.81 mm, which was contributed by the temperature (8.23 mm) and precipitation (72.58 mm) change. Corresponding contribution rates for the BWF change were 10.19% and 89.81% respectively.
Different interannual contribution rates shown in Table 5 suggested that the variation of BWF and GWS were mainly affected by precipitation, while that of GWF was largely dependent on the change of temperature. With the change of temperature and precipitation in different periods, the contribution rate of the two components to the blue and green water varies significantly. The effect of temperature changes on BWF ranged from 2.27% to 24.75%, on GWF ranged from 5.24% to 98.95%, and on GWS ranged from 6.67% to 58.38%. This phenomenon had a good agreement with temperature variation, which indicated that with the increase of temperature, its influence on hydrological process was amplified.
4.4.2. Seasonal Scale
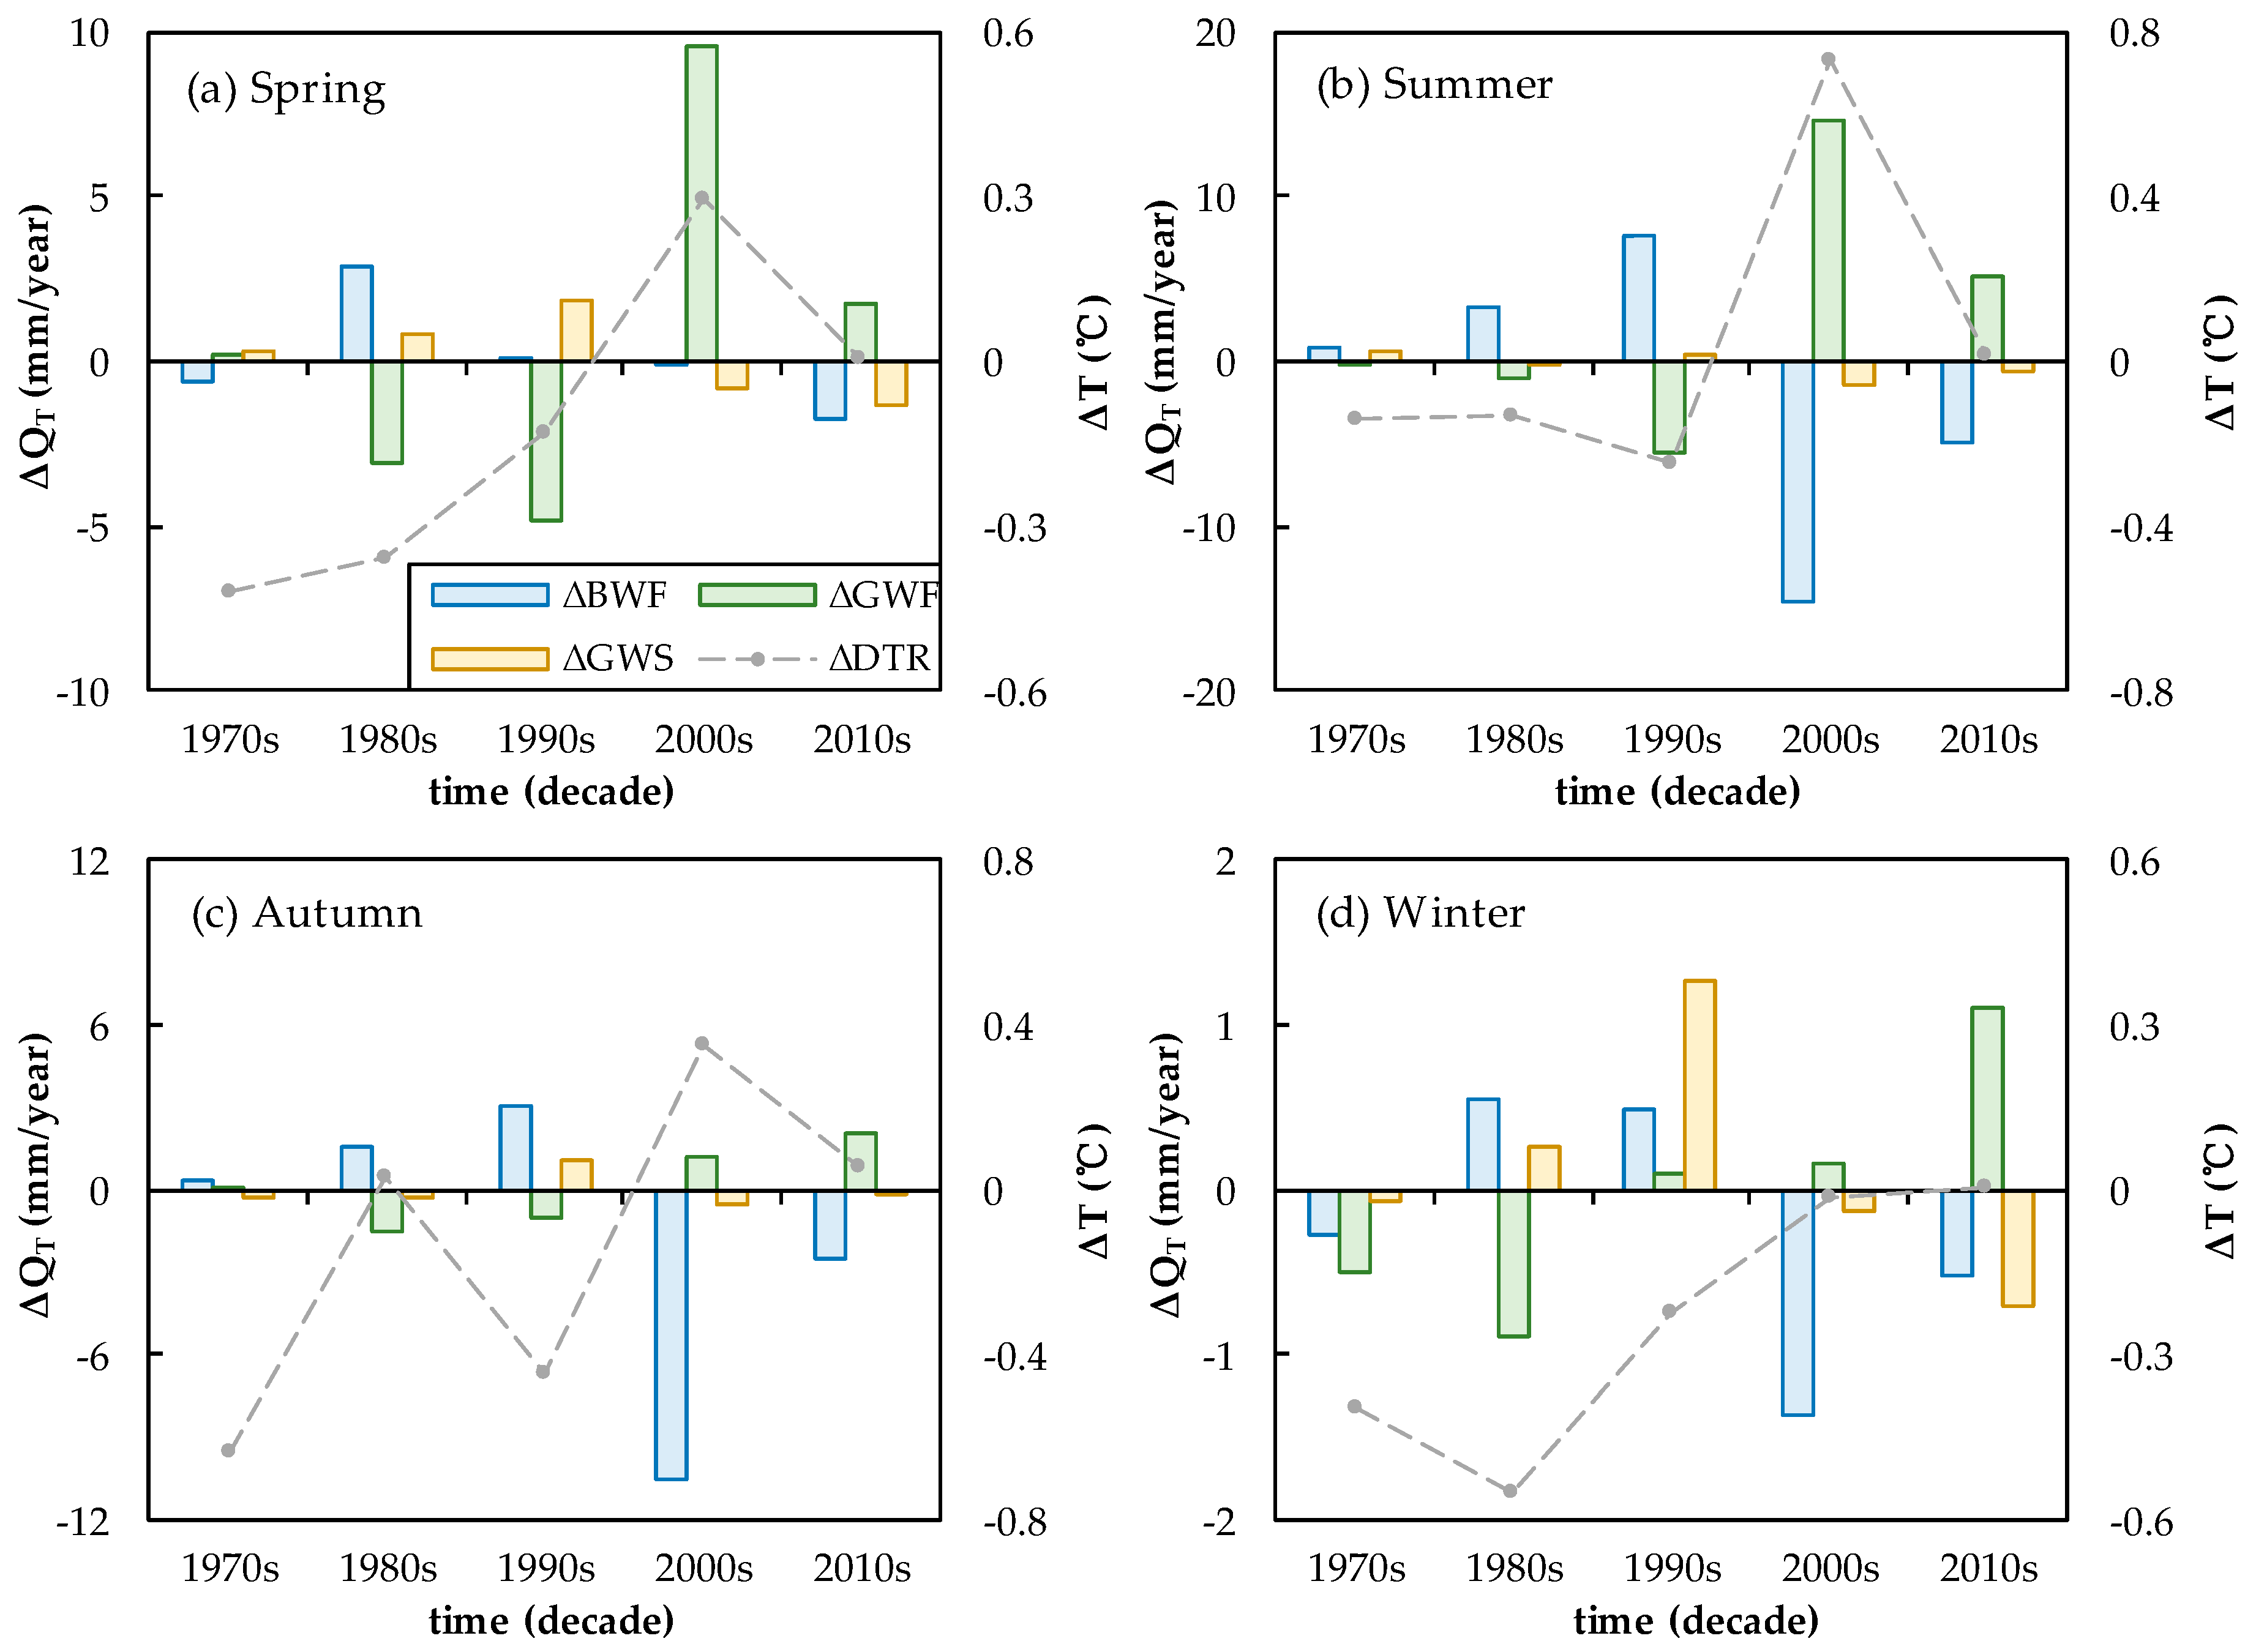
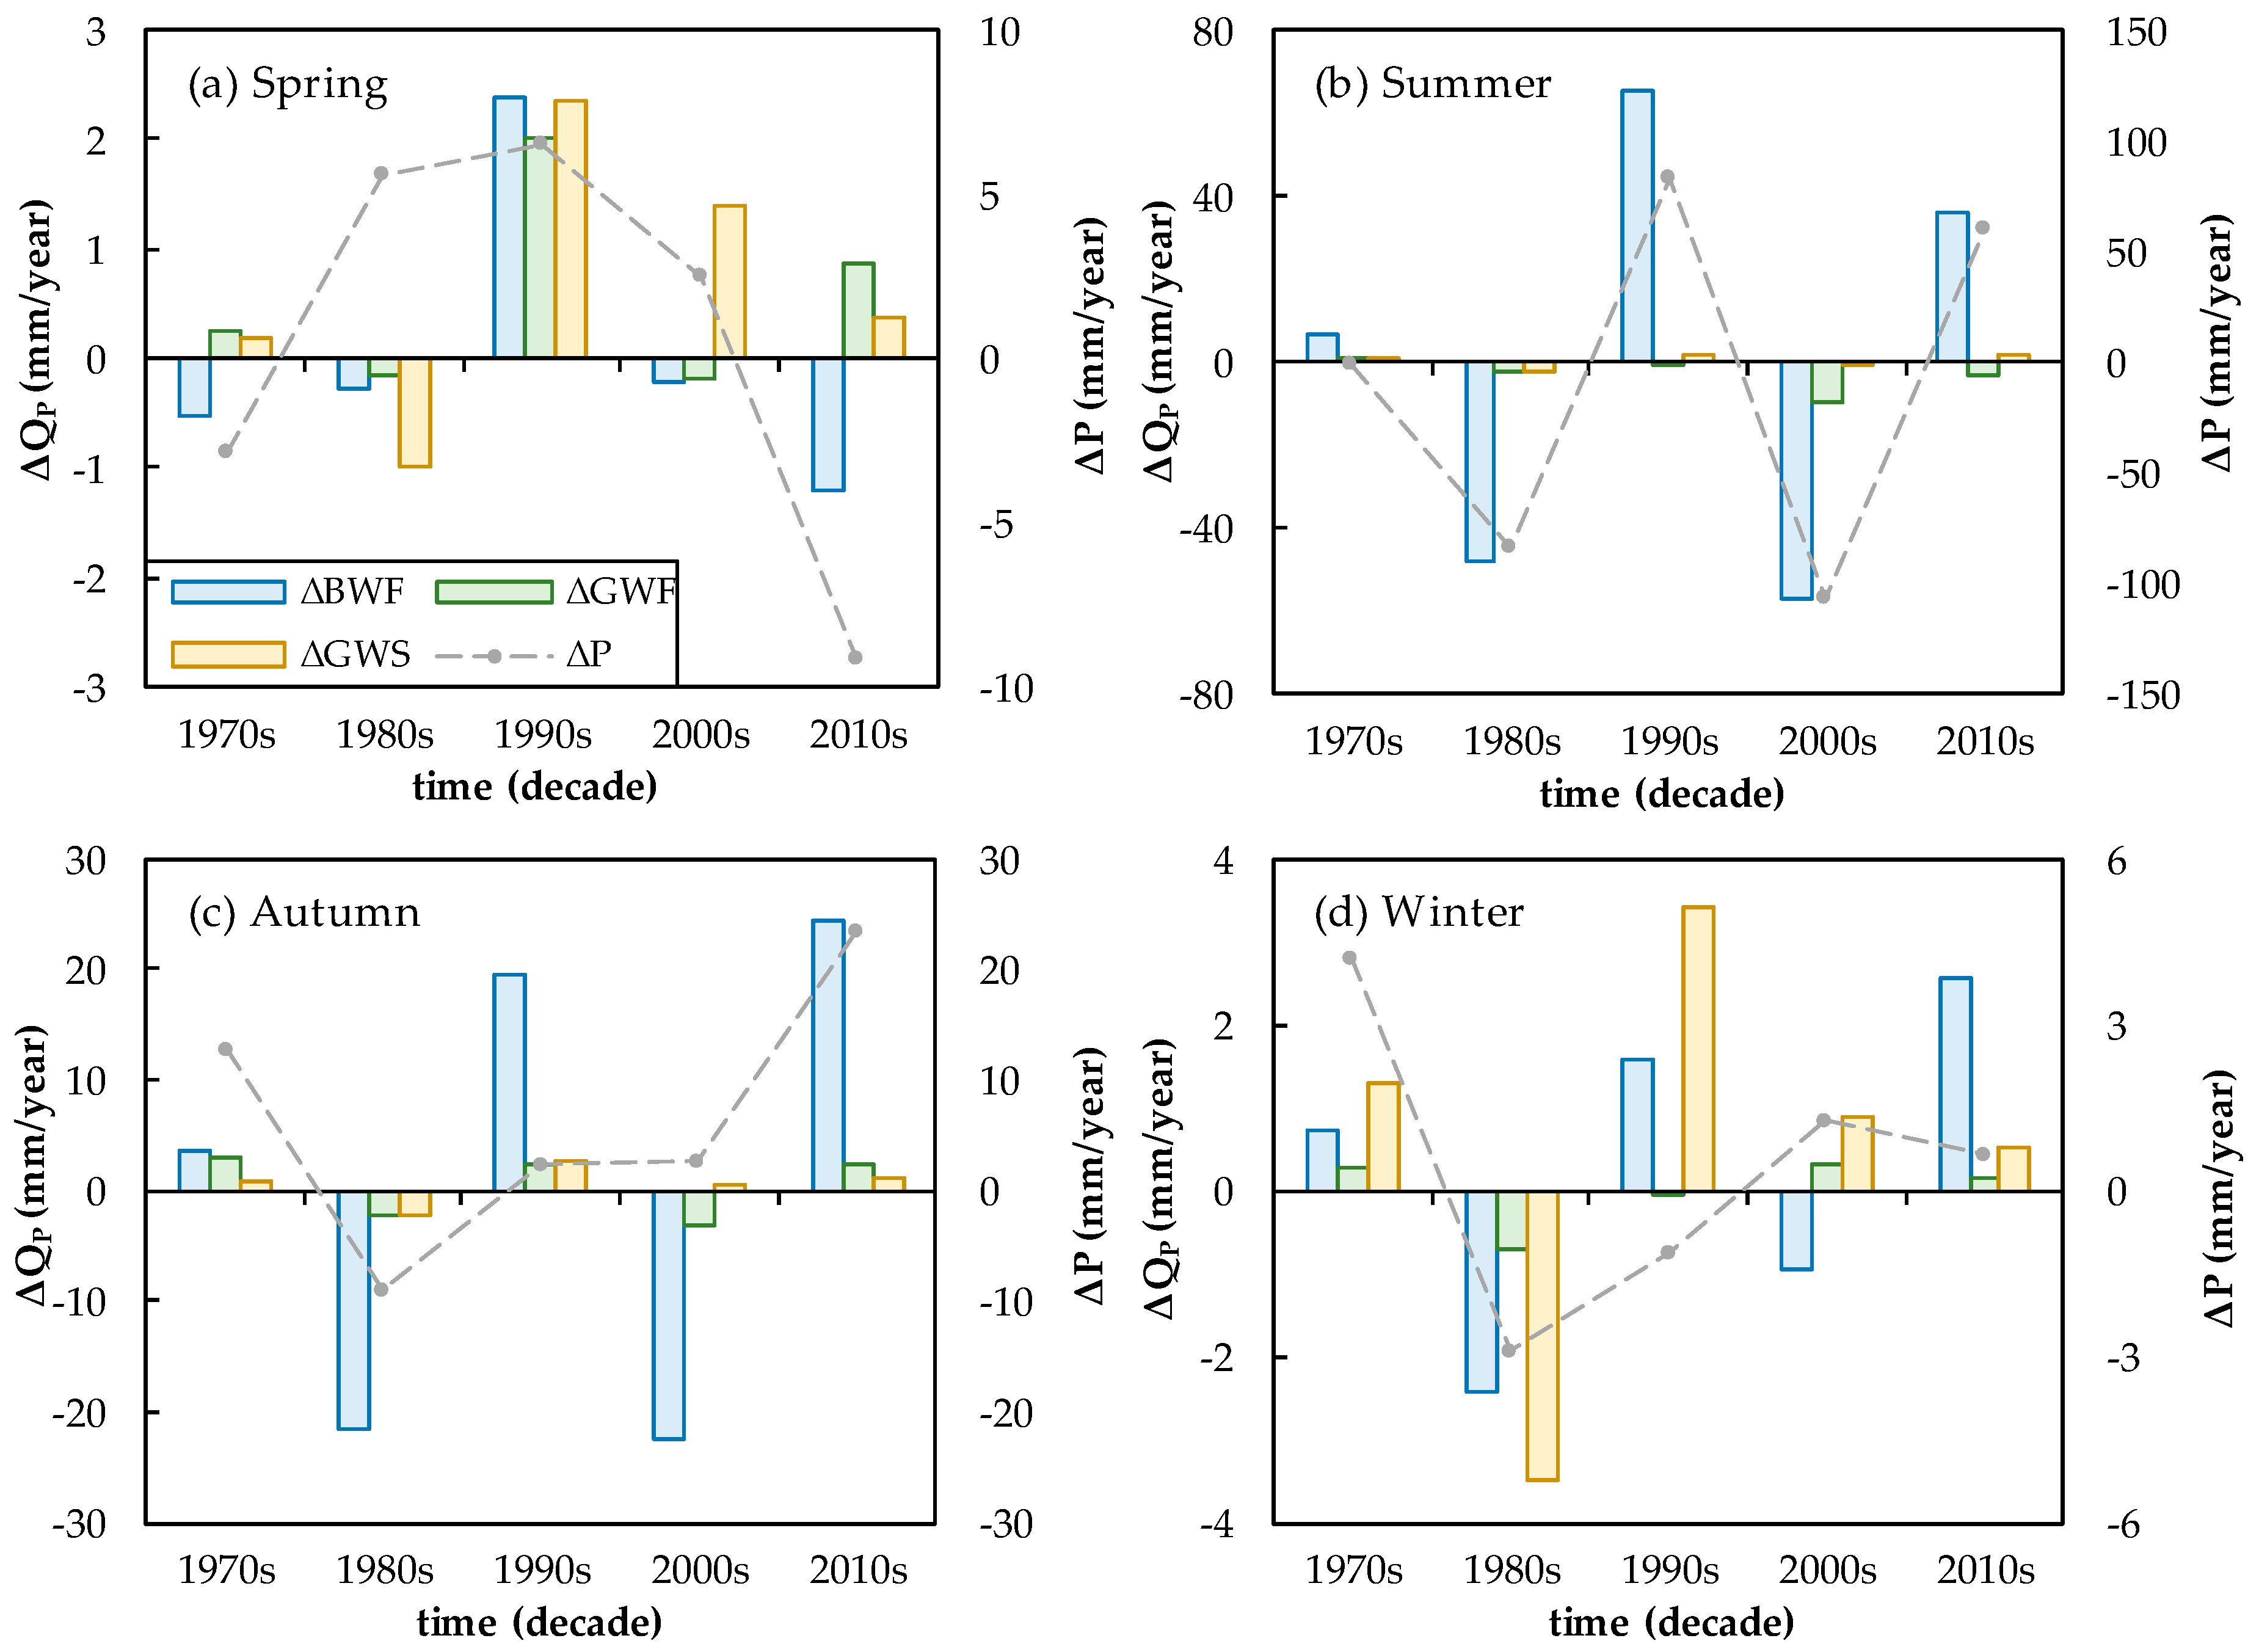
The effect of climate change on hydrological components was more complicated. The attribution of change in DTR (ΔT) and in precipitation (ΔP) are shown in Figure 6 and Figure 7. When DTR was changed with the constant precipitation, ΔQT of different decades was calculated to analyze the influence of temperature change on hydrological components. In different seasons, the trend of ΔQT for BWF and GWS were the same, which was opposite to GWF and DTR. It indicated that BWF was negatively correlated with GWS and DTR, and GWF was positively correlated with DTR. When it came to ΔQP, it was interesting that only BWF was always positively correlated with precipitation in different seasons. GWF was correlated with precipitation in spring and summer, and positively correlated in autumn and winter. GWS was negatively correlated with precipitation in spring and positively correlated with precipitation in other seasons.
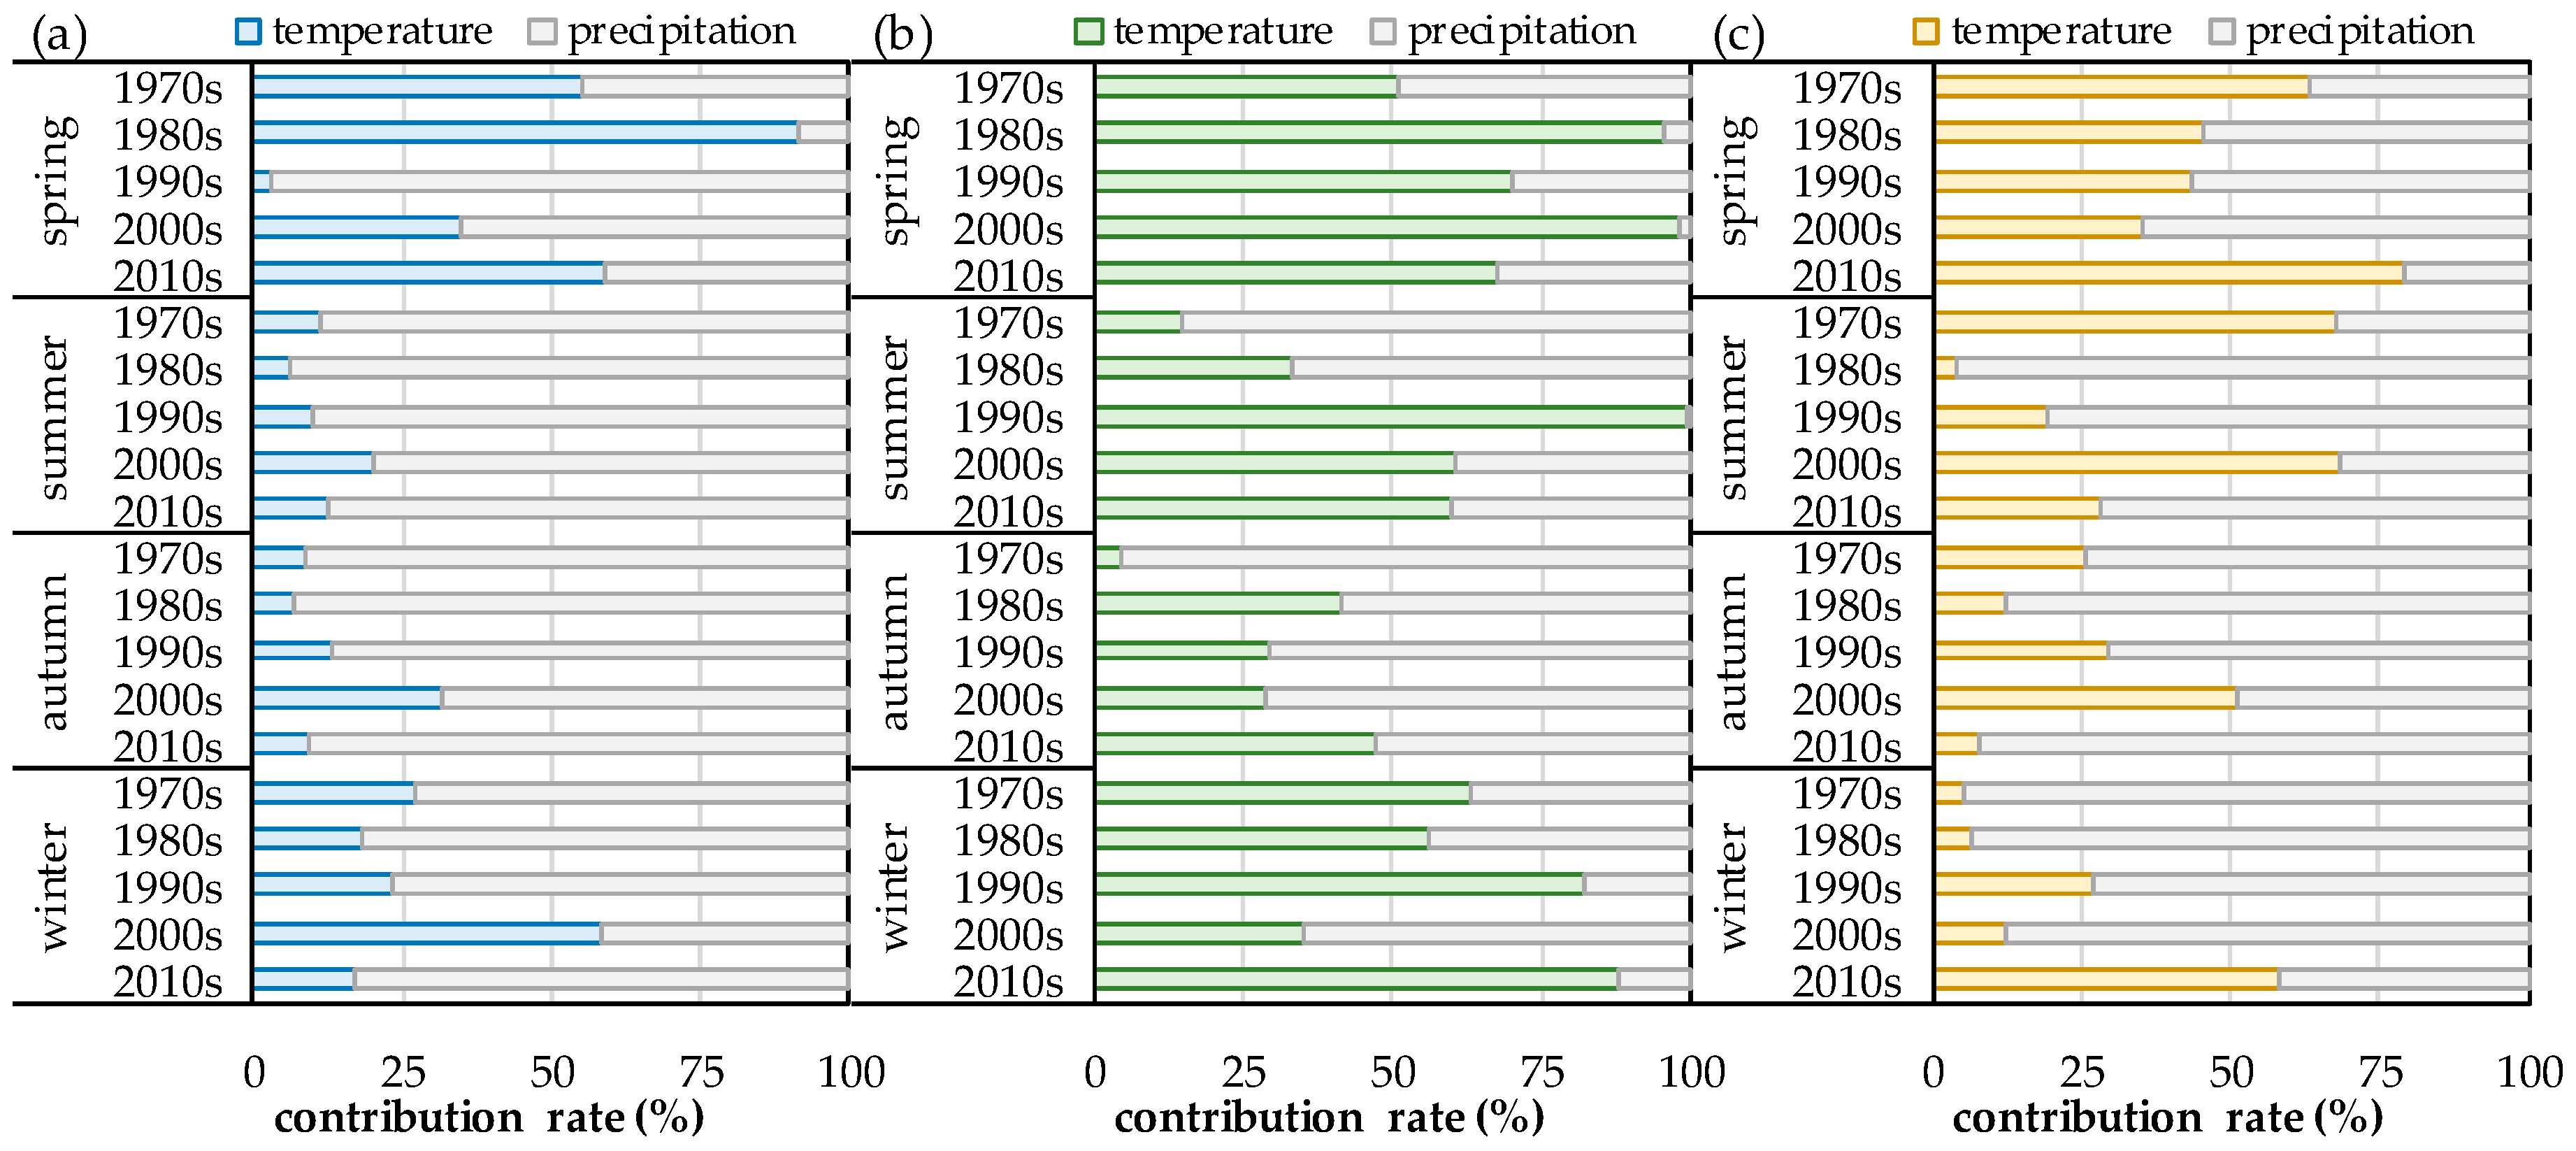
Figure 8 shows the contribution rates of variation in temperature and precipitation to BWF, GWF, and GWS changes in different seasons. Influenced by significant seasonal climate variations, the hydrological cycle showed seasonal patterns accordingly. In spring, the average contribution of temperature to the variation of BWF, GWF, and GWS was 50.39%, 77.01%, and 51.93%, respectively, which was obviously higher than that of any other seasons. This might due to the reason that in the semi-arid region, snow melting was the main source of runoff in spring. As mentioned above, as the temperature in spring began to rise since 1960, the contribution of temperature to the change of hydrological components became more and more important. Thus, more attention should be paid to the risk of flooding in spring considering the increase of temperature when formulating water resource planning and management policies. Besides, increase of spring temperature would further bring forward the date of plant sprout, where more soil water would be needed and results in consumption of green water. In summer, the contribution of precipitation to hydrological components increased significantly, caused by the concentrated rainfall in summer. However, with the increase of temperature, it’s contribution rate to GWF raised up quickly from 1970s (14.82%) to 2010s (64.59%) while temperature played a major role in the change of GWF. The variation characteristics of blue water and green water in summer implied that blue water was more sensitive to the change of precipitation while green water was more sensitive to temperature. These characteristics continued into autumn, but weakened slightly with the decrease of temperature and precipitation. The contribution rate of precipitation to BWF decreases to 85.45% and that of temperature to GWF decreases to 30.35%. In winter, when the water was distributed to the land as snow, which is more affected by temperature changes, the contribution of precipitation to BWF and GWF was further decreased to 29.85% and 64.15%. Moreover, as shown in Figure 8b,c, it was remarkable that the contribution rate of the two components (GWS and GWF) had a complementary relationship with each other in spring, summer, and autumn from 1970s to 2010s. This might be due to the reason that plant roots absorb soil water (GWS) from the soil and evaporated into the air (GWF) through leaves. By contrast, they had the same change tendency in winter which might due to the synchronization evaporation of snow and soil in this season.
5. Discussion and Conclusions
The impact of climate change on the acceleration of the hydrological cycle has gradually attracted increased attention. Based on the result of the SWAT model, this study discussed the variation trend of hydrological components under the impact of climate change in Luanhe River Basin during 1960–2017.
At the annual scale, the results of this study showed no significant trend in precipitation and hydrological components (BWF, GWF, and GWS) which was consistent with that of Zhang’s study [10]. However, the novelty of this study resides in that we not only consider the influence of average temperature on hydrological process, but also take into account the influence of maximum and minimum temperature and their differences (DTR), which has been suggested to have a more significant effect on evapotranspiration [31,32]. It is not sufficient to conclude that the influence of climate change on hydrological components were relatively small in the past 60 years, because the effects of climate elements on hydrological components may offset each other and had not emerged yet. Therefore, as suggested by Luo [18], in the case of lacking a significant linear trend, decadal analysis was necessary and effective in the study of variation of hydrological components under the impacts of climate change. The increase of precipitation would lead to the increase of all three hydrological components, while the increase of DTR would reduce the increasing of GWF and decreasing of BWF and GWS.
At a seasonal scale, although there was no significant trend in the variation of precipitation and hydrological components in different seasons, there were distinct differences in their inter-generational variations. Moreover, with significant increasing of the temperature in all four seasons, we noticed that temperature, especially the lowest temperature (Tmin) in winter, increased faster than that of other seasons, which resulted in a significant decrease in winter DTR. These trends were similar to results reported by Kowalczyk [33], which also showed that the warming during the winter period was more evident than that in summer at the same study area. This study confirmed that unlike interannual variations, GWF and GWS might have the opposite trend with precipitation in spring, and the same trend in autumn and winter. This implied that the available water (rainfall) did not fully satisfy the atmospheric water demand in spring. Although influence trend of temperature was in accordance with the annual variation, the contribution rate of temperature changes to hydrological components varied significantly. Research had shown that the influence of climate change was especially concentrated in spring and winter, in which the influence was very complex [34], such as the increasing of spring temperature would lead to the earlier beginning dates of growing season, and warming in winter would cause earlier snowmelt or precipitation falling as rain rather than snow, as mentioned in Vano’s research [35]. Under the effected of these factors, uncertainty existed in the results, but it confirmed that both precipitation and temperature did have an important impact on hydrological processes in this region, especially in spring and winter [36].
Climate change could be divided into four types: (I) DTR increase, humidity increase (2010s) (II) DTR decrease, humidity decrease (1980s); (III) DTR increase, humidity decrease (2000s); (IV) DTR decrease, humidity increase (1970s, 1990s). Manifestations about hydrological components of the different types of climate change were related to the response relationship. In one case, the effects of precipitation and temperature changes on hydrological components might be consistent with each other which was same as Lemann‘s opinions [37]. Such as when the climate change type (I) occurred, the GWF would increase, whereas in type (II), the decrease of precipitation and DTR commonly promoted the decrease of GWF. When climate change type (III) occurred, BWF and GWS would decrease, while they would increase in type (IV). In another case, the effects of precipitation and temperature changes countered each other such as the changes of BWF and GWS in type (I) and (II) and that of GWF in type (III) and (IV), in which the change trend of hydrological components depended on the climate elements that have the larger contribution rate. Mostly precipitation dominated the change of BWF and GWS, while change of temperature had more contribution to the change of GWF, and with the increase of the temperature, its influence increased further. If the current climate trend continued in the future, as predicted by Hurst index, precipitation and DTR would decrease and temperature would rise, similar to 1980s, the circulating water in nature, especially GWF, would continue to decrease, and pose a great threat to plant growth [38].
The study contributed to our understanding of the impacts of climatic factors on green and blue water variability in the Luanhe River Basin. As many studies [10,13] have confirmed, the SWAT model could better interpret the changes of hydrological components in Luanhe River Basin, and the simulation accuracy were in good agreement with previous studies [13,39,40]. However, there are certain uncertainties in the contribution analysis method. The meteorological series were already influenced by climate variability and land use change. Therefore, reorganization of meteorological data may change the relationship between meteorological elements, and further affect the calculation of contribution rates. There are several factors (e.g., short record, lack of hydrological stations) that may induce uncertainties and affect the simulation results. For example, due to the short length of calibration period, the simulation of the water balance component in climatically different periods may be subject to large uncertainties [41]. In addition, the negligence of the building of hydraulic structures (reservoir, dam, and dike project) and the impact of groundwater exploitation also might have an influence on model accuracy and the water cycle. Therefore, future studies will focus more on the impacts of climate change and human activities including the construction of hydraulic engineering, irrigation, and exploiting groundwater on hydrological processes. Despite the uncertainty, the simulation accuracy of this model was satisfactory and can be used to evaluate the hydrological process in the study area. Results from this study are expected to help policymakers to better manage the water resources in the context of global and regional climate change. Relative impacts of precipitation and temperature in changing the dynamics of hydrological components, as quantified in this study, would help to adjust the urbanization, industrialization, and agriculture activities with the variability, and also could help to design planned climate change adaptation strategies for the governing factor in a more efficient and targeted way in this region.
Author Contributions
Conceptualization, X.Z. and F.H.; methodology, Y.X.; software, C.L.; validation, X.Z., Y.X. and C.L.; formal analysis, X.Z.; investigation, Y.X.; resources, X.W.; data curation, Y.X.; Writing—Original Draft preparation, Y.X.; Writing—Review and Editing, X.Z.; visualization, C.L.; supervision, F.H.; project administration, X.W.; funding acquisition, X.Z.
Funding
This work was financially supported in part by the supported by “the Fundamental Research Funds for the Central Universities” (2017XTCX01).
Acknowledgments
We appreciate the China Meteorological Data Sharing Service System for providing highly valuable documents of the meteorological data, which contains temperature, wind speed, sunshine duration, and relative humidity, and most notably, for keeping an open mind for scientific research. The authors are grateful to the editor and anonymous reviewers.
Conflicts of Interest
The authors declare no conflict of interest. The founding sponsors had no role in the design of the study; in the collection, analyses, or interpretation of data; in the writing of the manuscript, and in the decision to publish the results.
References
- Solomon, S. IPCC (2007): Climate Change the Physical Science Basis; American Geophysical Union: Washington, DC, USA, 2007. [Google Scholar]
- Mishra, A.K.; Singh, V.P. A review of drought concepts. J. Hydrol. 2010, 391, 202–216. [Google Scholar] [CrossRef]
- Scibek, J.; Allen, D.M.; Cannon, A.J.; Whitfield, P.H. Groundwater–surface water interaction under scenarios of climate change using a high-resolution transient groundwater model. J. Hydrol. 2007, 333, 165–181. [Google Scholar] [CrossRef]
- Kundzewicz, Z.W.; Mata, L.J.; Arnell, N.W.; Döll, P.; Jimenez, B.; Miller, K.; Oki, T.; Şen, Z.; Shiklomanov, I. The implications of projected climate change for freshwater resources and their management. Hydrol. Sci. J. 2008, 53, 3–10. [Google Scholar] [CrossRef]
- Falkenmark, M.; Rockström, J. The New Blue and Green Water Paradigm: Breaking New Ground for Water Resources Planning and Management. J. Water Resour. Plan. Manag. 2006, 132, 129–132. [Google Scholar] [CrossRef]
- Gerten, D.; Hoff, H.; Bondeau, A.; Lucht, W.; Smith, P.; Zaehle, S. Contemporary “green” water flows: Simulations with a dynamic global vegetation and water balance model. Phys. Chem. Earth Parts A/B/C 2005, 30, 334–338. [Google Scholar] [CrossRef]
- Zang, C.F.; Liu, J.; van der Velde, M.; Kraxner, F. Assessment of spatial and temporal patterns of green and blue water flows in inland river basins in Northwest China. Hydrol. Earth Syst. Sci. Discuss. 2012, 9, 3311–3338. [Google Scholar] [CrossRef]
- Chu, J.T.; Xia, J.; Xu, C.-Y.; Singh, V.P. Statistical downscaling of daily mean temperature, pan evaporation and precipitation for climate change scenarios in Haihe River, China. Theor. Appl. Climatol. 2010, 99, 149–161. [Google Scholar] [CrossRef]
- Bao, Z.; Zhang, J.; Liu, J.; Wang, G.; Yan, X.; Wang, X.; Zhang, L. Sensitivity of hydrological variables to climate change in the Haihe River basin, China. Hydrol. Process. 2012, 26, 2294–2306. [Google Scholar] [CrossRef]
- Zhang, T.; Wang, Y.; Wang, B.; Feng, P. Understanding the Main Causes of Runoff Change by Hydrological Modeling: A Case Study in Luanhe River Basin, North China. Water 2018, 10, 1028. [Google Scholar] [CrossRef]
- Guo, Y.; Shen, Y. Agricultural water supply/demand changes under projected future climate change in the arid region of northwestern China. J. Hydrol. 2016, 540, 257–273. [Google Scholar] [CrossRef]
- Wang, W.; Wei, J.; Shao, Q.; Xing, W.; Yong, B.; Yu, Z.; Jiao, X. Spatial and temporal variations in hydro-climatic variables and runoff in response to climate change in the Luanhe River basin, China. Stoch. Environ. Res. Risk Assess. 2015, 29, 1117–1133. [Google Scholar] [CrossRef]
- Chen, F.; Li, J. Quantifying drought and water scarcity: A case study in the Luanhe river basin. Nat. Hazards 2016, 81, 1913–1927. [Google Scholar] [CrossRef]
- Mann, H.B. Nonparametric Tests Against Trend. Econometrica 1945, 13, 245–249. [Google Scholar] [CrossRef]
- Kendall, M.G. Rank Correlation Methods; C. Griffin: London, UK, 1948. [Google Scholar]
- Gilbert, R.O. Statistical Methods for Environmental Pollution Monitoring; Van Nostrand Reinhold Co: New York, NY, USA, 1987. [Google Scholar]
- Onyutha, C.; Tabari, H.; Taye, M.T.; Nyandwaro, G.N.; Willems, P. Analyses of rainfall trends in the Nile River Basin. J. Hydro Environ. Res. 2016, 13, 36–51. [Google Scholar] [CrossRef]
- Luo, K.; Tao, F.; Moiwo, J.P.; Xiao, D. Attribution of hydrological change in Heihe River Basin to climate and land use change in the past three decades. Sci. Rep. 2016, 6, 33704. [Google Scholar] [CrossRef]
- Zeleňáková, M.; Purcz, P.; Poórová, Z.; Alkhalaf, I.; Hlavatá, H.; Portela, M.M. Monthly Trends of Precipitation in Gauging Stations in Slovakia. Procedia Eng. 2016, 162, 106–111. [Google Scholar] [CrossRef]
- Bari, S.H.; Rahman, M.T.U.; Hoque, M.A.; Hussain, M.M. Analysis of seasonal and annual rainfall trends in the northern region of Bangladesh. Atmos. Res. 2016, 176–177, 148–158. [Google Scholar] [CrossRef]
- Sen, P.K. Estimates of the Regression Coefficient Based on Kendall’s Tau. J. Am. Stat. Assoc. 1968, 63, 1379–1389. [Google Scholar] [CrossRef]
- Theil, H. A Rank-Invariant Method of Linear and Polynomial Regression Analysis; Springer: Dordrecht, The Netherlands, 1992. [Google Scholar]
- Hurst, H.E. Long term storage capacity of reservoirs. Trans. Am. Soc. Civil Eng. 1951, 116, 776–808. [Google Scholar]
- Rehman, S. Study of Saudi Arabian climatic conditions using Hurst exponent and climatic predictability index. Chaos Solitons Fractals 2009, 39, 499–509. [Google Scholar] [CrossRef]
- Zhang, Y.; Shao, Q.; Xia, J.; Bunn, S.E.; Zuo, Q. Changes of flow regimes and precipitation in Huai River Basin in the last half century. Hydrol. Process. 2011, 25, 246–257. [Google Scholar] [CrossRef]
- Arnold, J.G.; Srinivasan, R.; Muttiah, R.S.; Williams, J.R. Large Area Hydrologic Modeling and Assessment Part I: Model Development. J. Am. Water Resour. Assoc. 1998, 34, 73–89. [Google Scholar] [CrossRef]
- Ritter, A.; Muñoz-Carpena, R. Performance evaluation of hydrological models: Statistical significance for reducing subjectivity in goodness-of-fit assessments. J. Hydrol. 2013, 480, 33–45. [Google Scholar] [CrossRef]
- Yuan, Z.; Xu, J.; Meng, X.; Wang, Y.; Yan, B.; Hong, X. Impact of Climate Variability on Blue and Green Water Flows in the Erhai Lake Basin of Southwest China. Water 2019, 11, 424. [Google Scholar] [CrossRef]
- Mishra, A.; Froebrich, J.; Gassman, P.W. Evaluation of the SWAT Model for Assessing Sediment Control Structures in a Small Watershed in India. Trans. ASABE 2007, 50, 469–477. [Google Scholar] [CrossRef]
- Jiang, Y.; Liu, C.; Li, X. Hydrological Impacts of Climate Change Simulated by HIMS Models in the Luanhe River Basin, North China. Water Resour. Manag. 2015, 29, 1365–1384. [Google Scholar] [CrossRef]
- Wang, F.; Zhang, C.; Peng, Y.; Zhou, H. Diurnal temperature range variation and its causes in a semiarid region from 1957 to 2006. Int. J. Climatol. 2014, 34, 343–354. [Google Scholar] [CrossRef]
- Shen, Y.; Liu, C.; Liu, M.; Zeng, Y.; Tian, C. Change in pan evaporation over the past 50 years in the arid region of China. Hydrol. Process. 2010, 24, 225–231. [Google Scholar] [CrossRef]
- Kowalczyk, E.A.; Stevens, L.E.; Law, R.M.; Harman, I.N.; Dix, M.; Franklin, C.N.; Wang, Y.-P. The impact of changing the land surface scheme in ACCESS (v1.0/1.1) on the surface climatology. Geosci. Model Dev. 2016, 9, 2771–2791. [Google Scholar] [CrossRef]
- Githui, F.; Gitau, W.; Mutua, F.; Bauwens, W. Climate change impact on SWAT simulated streamflow in western Kenya. Int. J. Climatol. 2009, 29, 1823–1834. [Google Scholar] [CrossRef]
- Vano, J.A.; Nijssen, B.; Lettenmaier, D.P. Seasonal hydrologic responses to climate change in the Pacific Northwest. Water Resour. Res. 2015, 51, 1959–1976. [Google Scholar] [CrossRef]
- Bu, J.; Lu, C.; Niu, J.; Gao, Y. Attribution of Runoff Reduction in the Juma River Basin to Climate Variation, Direct Human Intervention, and Land Use Change. Water 2018, 10, 1775. [Google Scholar] [CrossRef]
- Lemann, T.; Roth, V.; Zeleke, G. Impact of precipitation and temperature changes on hydrological responses of small-scale catchments in the Ethiopian Highlands. Hydrol. Sci. J. 2017, 62, 270–282. [Google Scholar] [CrossRef]
- Li, L.; Zhang, L.; Xia, J.; Gippel, C.J.; Wang, R.; Zeng, S. Implications of Modelled Climate and Land Cover Changes on Runoff in the Middle Route of the South to North Water Transfer Project in China. Water Resour. Manag. 2015, 29, 2563–2579. [Google Scholar] [CrossRef]
- Li, J.; Guo, Y.; Wang, Y.; Lu, S.; Chen, X. Drought Propagation Patterns under Naturalized Condition Using Daily Hydrometeorological Data. Adv. Meteorol. 2018, 2018, 2469156. [Google Scholar] [CrossRef]
- Li, J.; Li, G.; Zhou, S.; Chen, F. Quantifying the Effects of Land Surface Change on Annual Runoff Considering Precipitation Variability by SWAT. Water Resour. Manag. 2016, 30, 1071–1084. [Google Scholar] [CrossRef]
- Merz, R.; Parajka, J.; Blöschl, G. Time stability of catchment model parameters: Implications for climate impact analyses. Water Resour. Res. 2011, 47, 17. [Google Scholar] [CrossRef]
Figure 1.
Location of the Luanhe river with hydrological and meteorological stations.

Figure 2.
A schematic view of separating the effects of temperature and precipitation.

Figure 3.
Comparison of the observed monthly runoff and simulated monthly runoff in hydrological stations: (a) Boluonuo, (b) Chengde, (c) Hanjiaying, (d) Xiabancheng.
Figure 3.
Comparison of the observed monthly runoff and simulated monthly runoff in hydrological stations: (a) Boluonuo, (b) Chengde, (c) Hanjiaying, (d) Xiabancheng.

Figure 4.
Time varying processes of precipitation and hydrological components in annual scale from 1960 to 2017 in Luanhe River Basin.
Figure 4.
Time varying processes of precipitation and hydrological components in annual scale from 1960 to 2017 in Luanhe River Basin.

Figure 5.
Changes in decadal hydrological components impacted by (a) temperature; (b) precipitation.
Figure 5.
Changes in decadal hydrological components impacted by (a) temperature; (b) precipitation.

Figure 6.
Changes in seasonal hydrological components impacted by temperature.

Figure 7.
Changes in seasonal hydrological components impacted by precipitation.

Figure 8.
The seasonal contribution rates (%) of temperature and precipitation for hydrological components: (a) blue water flow (BWF), (b) green water flow (GWF), (c) green water storage (GWS).
Figure 8.
The seasonal contribution rates (%) of temperature and precipitation for hydrological components: (a) blue water flow (BWF), (b) green water flow (GWF), (c) green water storage (GWS).


Table 1.
The list of different model scenarios used to evaluate the impacts of climate variability on the hydrology components of Luanhe River Basin.
Table 1.
The list of different model scenarios used to evaluate the impacts of climate variability on the hydrology components of Luanhe River Basin.
| Scenario | Temperature | Precipitation | Scenario | Temperature | Precipitation |
|---|---|---|---|---|---|
| M1 | 1960s | 1960s | M9 | 1990s | 1980s |
| M2 | 1960s | 1970s | M10 | 1990s | 1990s |
| M3 | 1970s | 1960s | M11 | 1990s | 2000s |
| M4 | 1970s | 1970s | M12 | 2000s | 1990s |
| M5 | 1970s | 1980s | M13 | 2000s | 2000s |
| M6 | 1980s | 1970s | M14 | 2000s | 2010s |
| M7 | 1980s | 1980s | M15 | 2010s | 2000s |
| M8 | 1980s | 1990s | M16 | 2010s | 2010s |
Table 2.
The calibrated values of the model parameters.
| Parameter | Description | Calibration Range | Calibrated Value | |||
|---|---|---|---|---|---|---|
| Boluonuo | Chengde | Hanjiaying | Xiabancheng | |||
| r_CN2 | Initial SCS runoff curve number for moisture condition Ⅱ | (−0.9, 0.9) | 0.24 | 0.27 | −0.7 | 0.02 |
| v_ESCO | Soil evaporation compensation factor | (0, 1) | 0.70 | 0.75 | 0.86 | 0.25 |
| r_SOL_AWC | Available water capacity of the soil layer (mm H2O/mm soil) | (−0.9, 0.9) | 0.27 | −0.04 | −0.33 | −0.44 |
| r_SOL_K | Saturated hydraulic conductivity (mm/h) | (−0.9, 0.9) | −0.64 | −0.89 | 0.17 | 0.13 |
| v_ALPHA_BF | Baseflow Alpha factor (1/days) | (0, 1) | 0.55 | 0.42 | 0.85 | 0.06 |
| v_REVAPMN | Threshold depth of water in the shallow aquifer for “revap” or percolation to the deep aquifer to occur (mm H2O) | (0, 500) | 249.66 | 375.99 | 34.73 | 306.98 |
| v_CH_K2 | Effective hydraulic conductivity in tributary channel alluvium (mm/h) | (0, 500) | 288.96 | 131.99 | 179.66 | 424.42 |
Note: “r_” indicates relative changes to existing parameter values and “v_” indicates existing parameter values to be replaced by given values.
Table 3.
The result of Mann–Kendall (MK) test for annual variability of meteorological factors and hydrological components from 1960 to 2017.
Table 3.
The result of Mann–Kendall (MK) test for annual variability of meteorological factors and hydrological components from 1960 to 2017.
| Meteorological Factors | p-Value | Z | Trend | Hydrological Components | p-Value | Z | Trend | |
|---|---|---|---|---|---|---|---|---|
| Precipitation | 0.537 | 0.270 | ↑ | Blue water flow | 0.225 | 0.253 | ↑ | |
| Temperature | Tmax | 1.63×10⁻⁴ | 0.023 | ↑ ** | Green water flow | 0.707 | −0.120 | ↓ |
| Tmin | 5.89×10⁻¹² | 0.037 | ↑ ** | Green water storage | 0.477 | −0.060 | ↓ | |
| DTR | 0.01 | −0.012 | ↓ ** | |||||
(**) means significant at p = 0.05.
Table 4.
The result of MK test for seasonal variation of climate elements and hydrological components in Luanhe River Basin.
Table 4.
The result of MK test for seasonal variation of climate elements and hydrological components in Luanhe River Basin.
| Spring | Summer | Autumn | Winter | ||||||||||
|---|---|---|---|---|---|---|---|---|---|---|---|---|---|
| p-Value | Z | Trend | p-Value | Z | Trend | p-Value | Z | Trend | p-Value | Z | Trend | ||
| Precipitation | 0.225 | 0.253 | ↑ | 0.070 | −1.251 | ↓ * | 0.289 | 0.270 | ↑ | 0.318 | 0.031 | ↑ | |
| Temperature | Tmax | 0.001 | 0.033 | ↑ ** | 0.003 | 0.022 | ↑ ** | 0.308 | 0.008 | ↑ | 0.010 | 0.029 | ↑ ** |
| Tmin | 1.94×10⁻⁷ | 0.040 | ↑ ** | 1.06×10⁻⁴ | 0.021 | ↑ ** | 1.80×10⁻⁷ | 0.032 | ↑ ** | 1.80×10⁻⁷ | 0.061 | ↑ ** | |
| DTR | 0.126 | −0.010 | ↓ | 0.620 | 0.003 | ↑ | 0.050 | −0.013 | ↓ * | 2.04E-06 | −0.025 | ↓ ** | |
| BWF | 0.133 | 0.068 | ↑ | 0.707 | −0.120 | ↓ | 0.639 | −0.148 | ↓ | 0.707 | −0.005 | ↓ | |
| GWF | 0.243 | 0.080 | ↑ | 0.477 | −0.060 | ↓ | 0.968 | −0.001 | ↓ | 0.376 | −0.011 | ↓ | |
| GWS | 0.049 | 0.105 | ↑ ** | 0.537 | −0.014 | ↓ | 0.355 | 0.040 | ↑ | 0.070 | 0.074 | ↑ * | |
(**) means significant at p = 0.05, (*) means significant at p = 0.1.
Table 5.
The contribution rates (%) of temperature and precipitation for hydrological components in Luanhe River Basin.
Table 5.
The contribution rates (%) of temperature and precipitation for hydrological components in Luanhe River Basin.
| Contribution (%) | 1970s | 1980s | 1990s | 2000s | 2010s | |
|---|---|---|---|---|---|---|
| Blue water flow | Temperature | 2.27 | 10.19 | 11.09 | 24.75 | 14.61 |
| Precipitation | 97.73 | 89.81 | 88.91 | 75.25 | 85.39 | |
| Green water flow | Temperature | 5.24 | 55.44 | 71.73 | 67.38 | 98.95 |
| Precipitation | 94.76 | 44.56 | 28.27 | 32.62 | 1.05 | |
| Green water storage | Temperature | 19.45 | 6.67 | 31.11 | 58.38 | 50.85 |
| Precipitation | 80.55 | 93.33 | 68.89 | 41.62 | 49.15 |
© 2019 by the authors. Licensee MDPI, Basel, Switzerland. This article is an open access article distributed under the terms and conditions of the Creative Commons Attribution (CC BY) license (http://creativecommons.org/licenses/by/4.0/).
Share and Cite
MDPI and ACS Style
Zhang, X.; Xu, Y.; Hao, F.; Li, C.; Wang, X. Hydrological Components Variability under the Impact of Climate Change in a Semi-Arid River Basin. Water 2019, 11, 1122. https://doi.org/10.3390/w11061122
AMA Style
Zhang X, Xu Y, Hao F, Li C, Wang X. Hydrological Components Variability under the Impact of Climate Change in a Semi-Arid River Basin. Water. 2019; 11(6):1122. https://doi.org/10.3390/w11061122
Chicago/Turabian StyleZhang, Xuan, Yang Xu, Fanghua Hao, Chong Li, and Xiao Wang. 2019. "Hydrological Components Variability under the Impact of Climate Change in a Semi-Arid River Basin" Water 11, no. 6: 1122. https://doi.org/10.3390/w11061122
Note that from the first issue of 2016, this journal uses article numbers instead of page numbers. See further details here.