An Autopsy Study of a Fouled Reverse Osmosis Membrane Used for Ultrapure Water Production


1
School of Urban and Environmental Engineering, Ulsan National Institute of Science and Technology (UNIST), 50 UNIST-gil, Eonyang-eup, Ulju-gun, Ulsan 44919, Korea
2
Department of Environmental Engineering, College of Engineering, Kangwon National University, 1 Kangwondaehak-gil, Chuncheon-si, Gangwon-do 24341, Korea
*
Authors to whom correspondence should be addressed.
Water 2019, 11(6), 1116; https://doi.org/10.3390/w11061116
Submission received: 19 April 2019
/
Revised: 15 May 2019
/
Accepted: 24 May 2019
/
Published: 28 May 2019
(This article belongs to the Special Issue Membrane and Membrane-Based Hybrid Processes for Water Treatment)
Abstract
:This study investigated the fouling and cleaning behaviors of reverse osmosis (RO) membranes in a lab–scale ultrapure water (UPW) production system via membrane autopsies and characterization of dissolved organic matter (DOM) and membrane foulants. Most of DOM were effectively removed by the MFC filter, with the exception of the peak at 150 Da. The RO membranes were effective in reducing conductivity, DOM, total nitrogen (TN), and ultraviolet A (UVA254nm) concentration; the polishing stage using IER filter resulted in ultra-trace levels of all these parameters required for semiconductor manufacturing (> 18.2 ΩM). The quantity of the desorbed RO membrane foulants, in terms of dissolved organic carbon (DOC), varied considerably depending on the type of desorbing agents: 0.1 N NaCl (65.12 mgC m−2) > 0.1 N NaOH (46.14 mgC m−2) > deionized water (25.39 mgC m−2) > 0.1 N HCl (15.95 mgC m−2). The high cleaning efficiency of the salt solution (0.1 N NaCl) was attributed to the efficient desorption of hydrophilic DOM foulants from the RO membrane surfaces. These results demonstrate that the salt cleaning may provide a promising option to recover the performance of the RO membranes fouled primarily by hydrophilic DOM fractions.
1. Introduction
During recent decades, the demand for ultrapure water (UPW) has risen continuously in a variety of industrial applications, such as power generation, pharmaceutical formulations, and semiconductor manufacturing [1]. The use of UPW is essential for improving energy efficiencies of power generation plants and boiler facilities which produce a huge amount of steam [2,3]. In addition, UPW is considered a key determinant of the quality and performance of high value-added industrial products, including pharmaceuticals and semiconductors, which require a high degree of accuracy in manufacturing processes [4]. Therefore, UPW production has received considerable attention as an emerging water market throughout the world. Global Water Intelligence (GWI) reported that UPW accounted for approximately 20% of the world water market in 2011, and is anticipated to increase to 4 billion dollars by 2025, which is equivalent to the proportion of seawater desalination in the world water market [4].
The production of UPW aims to remove all types of contaminants, including suspended solids, salt ions, organic and inorganic materials, particulate and colloidal matters, bacteria, dissolved gases (i.e., CO2 and O2), and trace ions, leaving only water molecules [1]. However, the required degree of purity of UPW varies considerably depending on its specific uses. For UPW used as cooling water, it is important to eliminate potentially corrosive substances and scale–forming materials from source water, as deposits via chemical precipitation promote corrosion and/or scaling on the surfaces of heat-exchangers, which may decrease thermal and mechanical efficiencies of heat-exchangers in power generation plants and boiler facilities [5]. Removal of bacteria and endogenous pyrogens from source water is crucial for pharmaceutical formulations, since UPW is utilized as a diluent or solvent [6]. In the semiconductor industry, contamination by particulate and/or ionic materials and the formation of native oxide layers in the presence of dissolved oxygen (> 0.1 μg L−1) on surfaces of the silicon wafers during rinsing procedures may lead to poor performance and low yields of semiconductor devices [7,8,9]. Therefore, UPW used in semiconductor manufacturing requires at least 18 MΩ cm of the electrical resistivity at 25 °C and extremely low concentrations of all water contaminants [1].
The UPW production systems typically combine 5 to 10 different unit processes (e.g., coagulation/flocculation, ion-exchange adsorption, gas separation, membrane, and oxidative processes), since there is no unit process which can solely eliminate all contaminants from source water [10,11]. Consequently, the purity degree of UPW is largely dependent on synergistic effects from the combination of various unit processes. The UPW production systems have progressed in conjunction with advances in membrane technologies [10,11,12]. Early UPW production systems in the 1970s contained anion and cation exchange resin filters, followed by a mix-bed deionizer to remove inorganic materials where removal of ionic materials relied on anion and cation exchange resin filters. In the early 1980s, reverse osmosis (RO) membranes were adopted for UPW production to eliminate total dissolved solids, particulate matters, and dissolved organic carbon (DOC). In the mid-1980s, ultrafiltration (UF) membranes were introduced as a polishing stage for the removal of microorganisms and macromolecules before providing UPW to end users [1]. More recently, the combination of RO-mix-bed deionization-UF processes has replaced anion and cation exchange resin filters coupled with a mixed-bed deionizer as a mainstream feature of UPW production systems, due to great advances in membrane technologies associated with water recovery, chemical usage for cleaning, and water qualities [11,13,14,15].
In recent years, RO membranes have increasingly been considered a core technology of UPW production systems as they enable the removal of most contaminants from source water. The previous study demonstrated that the use of the RO membranes as a primary stage of UPW production systems could result in produced UPW having the maximum electrical resistivity of 2 MΩ cm [16]. However, very little is known about the RO membranes used for UPW production (i.e., removal of ionic materials and formation of membrane fouling) compared to the electro-deionization (EDI) processes [2,3,6]. The majority of previous studies on UPW production have focused on removing ionic materials using EDI processes for achieving high demineralization levels [3,17]. Although a recent study has emphasized the importance of the RO membranes in UPW production systems with the latest trends occurring in the world water market, there has been no comprehensive research on fouling characteristics of the RO membranes used for UPW production [1,3,4,6].
The primary objective of this study is to provide insights into fouling and cleaning behaviors of the RO membranes fed with tap water for UPW production. Dissolved organic matter (DOM) in feed and treated waters, foulants, and deposited on the RO membrane surfaces, were rigorously analyzed using a variety of characterization techniques to identify effects of DOM properties on fouling formation of the RO membranes. In addition, surface features of virgin, fouled, and cleaned RO membranes were investigated through membrane autopsies and straightly correlated to observed fouling characteristics of the RO membranes and effects of desorbing agents (i.e., deionized (DI) water, acid, base, and salt solutions) on the fouled RO membranes. This enabled elucidation of the cleaning mechanisms of the RO membranes used as a pre-treatment of ion-exchange resin (IER) filters in the UPW production system.
2. Materials and Methods
2.1. Description of the UPW Production System
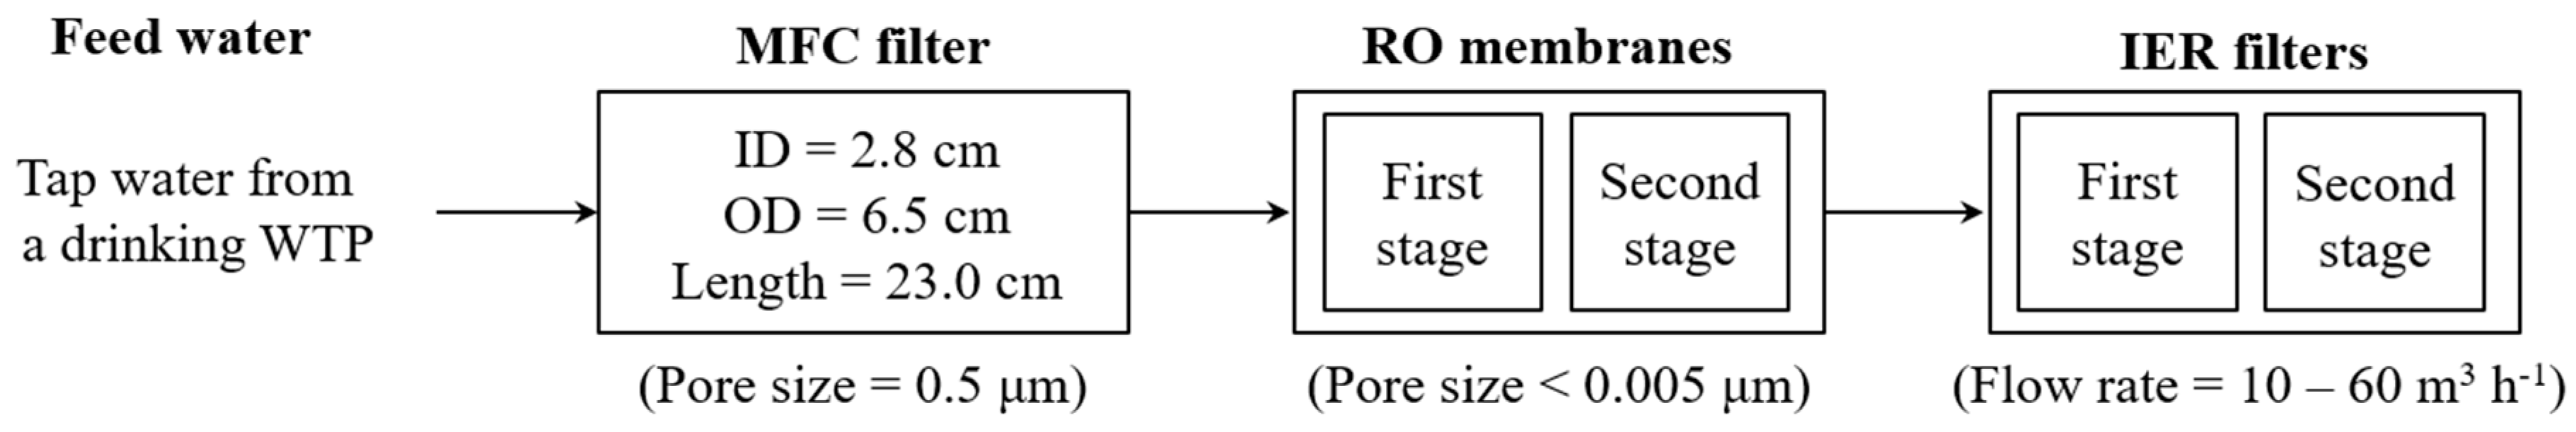
A lab-scale UPW production system consisting of a microfiltration cartridge (MFC) filter, two RO membranes, and two IER filters was operated intermittently for nearly 3 years (Figure 1). Tap water from a drinking water treatment plant (DWTP, Ulju-gun, Ulsan, Republic of Korea) was filtered using an MFC filter with a nominal pore size of 0.5 μm (SP32410, SpectraPure, Tempe, AZ, USA). This was operated in ‘dead-end mode’ (recovery rate = 97%) and further treated by two serially connected spiral-wound thin-film composite polyamide RO membrane modules (recovery rate = 15%; effective surface area of each module = 0.4 m2) with a nominal pore size < 0.005 μm (RE-1812-50, Toray Chemical Korea, Republic of Korea). There is the IER filters process after RO membrane process in the UPW production system. Therefore, we operated RO membrane process with a relatively low rejection for the long-term operation.
The physicochemical characteristics of the MFC filter and the RO membrane are summarized in Table 1. The RO permeate was polished with two serially connected IER filters (Dowex Monosphere MR-450 UPW, Dow Chemical, Midland, MI, USA). Each IER filter had the H+ exchange capacity of 1.9 eq L−1 and the OH− exchange capacity of 1.0 eq L−1 (Table 1). The specifications of the IER filter are provided in Table 2.
2.2. Preparation of Water and Foulant Samples
2.2.1. Water Samples
Four different water samples were obtained from the tested lab-scale UPW production system to investigate the removal of organic, inorganic materials, and ionic species and variations in physicochemical properties of DOM in feed and treated waters: (i) The tap water from the DWTP (feed), (ii) the permeate of the MFC filter (MFC permeate), (iii) the permeate of the RO membranes (RO permeate), and (iv) the permeate of the IER filters (IER permeate). All water samples were pre-filtered using 0.45 μm mixed cellulose ester membrane filters (Millipore, Bedford, MA, USA) prior to analyses.
2.2.2. Foulant Samples
Foulants were extracted from the fouled RO membranes after 3-years operation using four different desorbing agents: (i) DI water (RO-DI), (ii) an acid (0.1 N HCl) solution (RO-A), (iii) a base (0.1 N NaOH) solution (RO-B), and (iv) a salt (0.1 N NaCl) solution (RO-S). Four coupons of the fouled RO membranes (effective surface area of each coupon = 0.04 m2) collected from the first stage of the RO membrane modules were soaked in 500 mL of each desorbing solution for 10 hours under moderate stirring conditions (150 rpm). The pH of the foulant samples extracted using acid and base solutions was maintained at approximately 6.5 by the addition of NaOH and HCl. All foulant samples were pre-filtered using 0.45 μm mixed cellulose ester membrane filters.
2.3. Virgin, Fouled, and Cleaned RO Membranes
The virgin RO membranes were rinsed several times using DI water and soaked in DI water overnight to remove membrane-coating materials (i.e., humectants) from membrane surfaces. The soaked, fouled, and cleaned RO membranes using DI water (cleaned RO-DI), acid (cleaned RO-A), base (cleaned RO-B), and salt (cleaned RO-S) solutions were dried in a desiccator overnight. Their surface characteristics and performance were analyzed to investigate effects of DOM properties on fouling formation of the RO membranes.
2.4. Lab-Scale Cross-Flow RO Filtration Unit
The performance of the virgin, fouled, and cleaned RO membranes (i.e., permeate flux and salt rejection) were investigated with a lab-scale cross-flow RO filtration unit using 0.1 M NaCl solution. This unit was comprised of a flat-sheet filtration cell (effective surface area = 96 cm2; channel height = 0.04 cm), a high-pressure pump (CAT pumps, model 1050 10 GPM 2200, Minneapolis, MN, USA), and a feed water reservoir. Prior to all filtration tests, the RO filtration unit was stabilized for 2 hours using DI water. The RO filtration unit was operated in re-circulation mode at 20 ± 1 °C. During filtration tests, feed water pressure was maintained at 1000 kPa with a cross-flow velocity of 8.68 cm sec−1. The rejection rates of NaCl by the RO membranes and their permeate fluxes were calculated using the following equations:
Cf and Cp are NaCl concentrations in the feed and permeate water, Q is the permeate flow (L h−1), and A is the membrane surface area (m2).
2.5. Analytical Methods
Dissolved organic carbon (DOC) and total nitrogen (TN) concentrations in water and foulant samples were measured using a total organic carbon analyzer (TOC-VCPH, Shimadzu, Kyoto, Japan) equipped with a TN analyzer (TNM-1, Shimadzu, Kyoto, Japan). The aromatic carbon contents of DOM were evaluated using a UV/Vis spectrometer (UV-1601, Shimadzu, Kyoto, Japan) with a 1 cm quartz cell (Hellma, Mülheim, Germany) at UV absorbance at 254 nm (UVA254); specific UV absorbance (SUVA) values were determined as the ratio of UVA254 to DOC concentration. Concentrations of inorganic materials in water and foulants samples were quantified using an inductively coupled plasma-optical emission spectrophotometer (700-ES, Varian, Walnut Creek, CA, USA).
The three-dimensional fluorescence excitation-emission matrix (3D FEEM) and molecular weight (MW) distributions of DOM were confirmed using fluorescence spectroscopy (RF-5301, Shimadzu, Kyoto, Japan), high-performance size-exclusion chromatography (HPSEC) equipped with a Protein-Pak 125 column (Waters, Milford, MA, USA), with fluorescence detection at excitation (Ex) wavelength 278 nm and emission (Em) wavelength 353 nm (RF-10AXL; Shimadzu, Kyoto, Japan) and UV detection at 254 nm (SPD-10AVP; Shimadzu, Kyoto, Japan), and phosphate buffer(96 mM NaCl + 2.4 mM NaH2PO4 + 1.6 mM Na2HPO4, ionic strength 0.1 M, pH 6.8), with a flow rate of 0.7 mL min−1 and an injection volume of 200 μL [18,19]. An electrophoretic light scattering spectrophotometer (ELSZ-2000, Otsuka Electronics, Osaka, Japan) and a goniometer (Phoenix Multi/Tilting, SEO, Gyeonggi-do, Korea) were applied to identify differences in surface zeta potential and contact angle of the virgin, fouled, and cleaned RO membranes. Prior to analyze surface feature, the virgin, fouled and cleaned RO membranes were soaked with DI water for overnight and were dried in a vacuum desiccator for 48 hours. Functional group compositions of the virgin and fouled RO membranes were analyzed using attenuated total reflection-Fourier transform infrared (ATR-FTIR) spectroscopy (Vertex70, Bruker, MA, USA), utilizing a ZnSe crystal at an incident angle of 45° over a scanning wavelength of 750–1750 cm−1 with a resolution of 0.4 cm−1 [20,21].
3. Results and Discussions
3.1. Water Quality Analyses
Bulk water quality parameters (i.e., pH and conductivity), amounts and nature of DOM (i.e., DOC, TN, UVA254, and SUVA), presence and concentrations of ionic species, and metals and metalloids in the feed and treated waters were identified to assess the performance of the tested UPW system (Table 3). The RO membranes were effective in reducing conductivity and DOC, TN, and UVA254 concentrations; the polishing stage using IER filters resulted in ultra-trace levels of all these parameters (conductivity = 0.55 μS cm−1; DOC = 0.07 mg L−1; UVA254 = 0.001 cm−1; TN = 0.05 mg N L−1). Similar to conductivity and DOM, most ionic species, metals, and metalloids in feed water were hardly removed using the MFC filter. However, there were significant decreases in these parameters after the RO membranes, and almost complete removal of conductivity, DOC, TN, and UVA254 from the RO permeate by the use of IER filters. Consequently, the achieved purity degree of UPW satisfied the electrical resistivity of the IER permeate (> 18.2 ΩM) at room temperature (~ 20 °C) that is required for semiconductor manufacturing [1].
3.2. Characterization of DOM
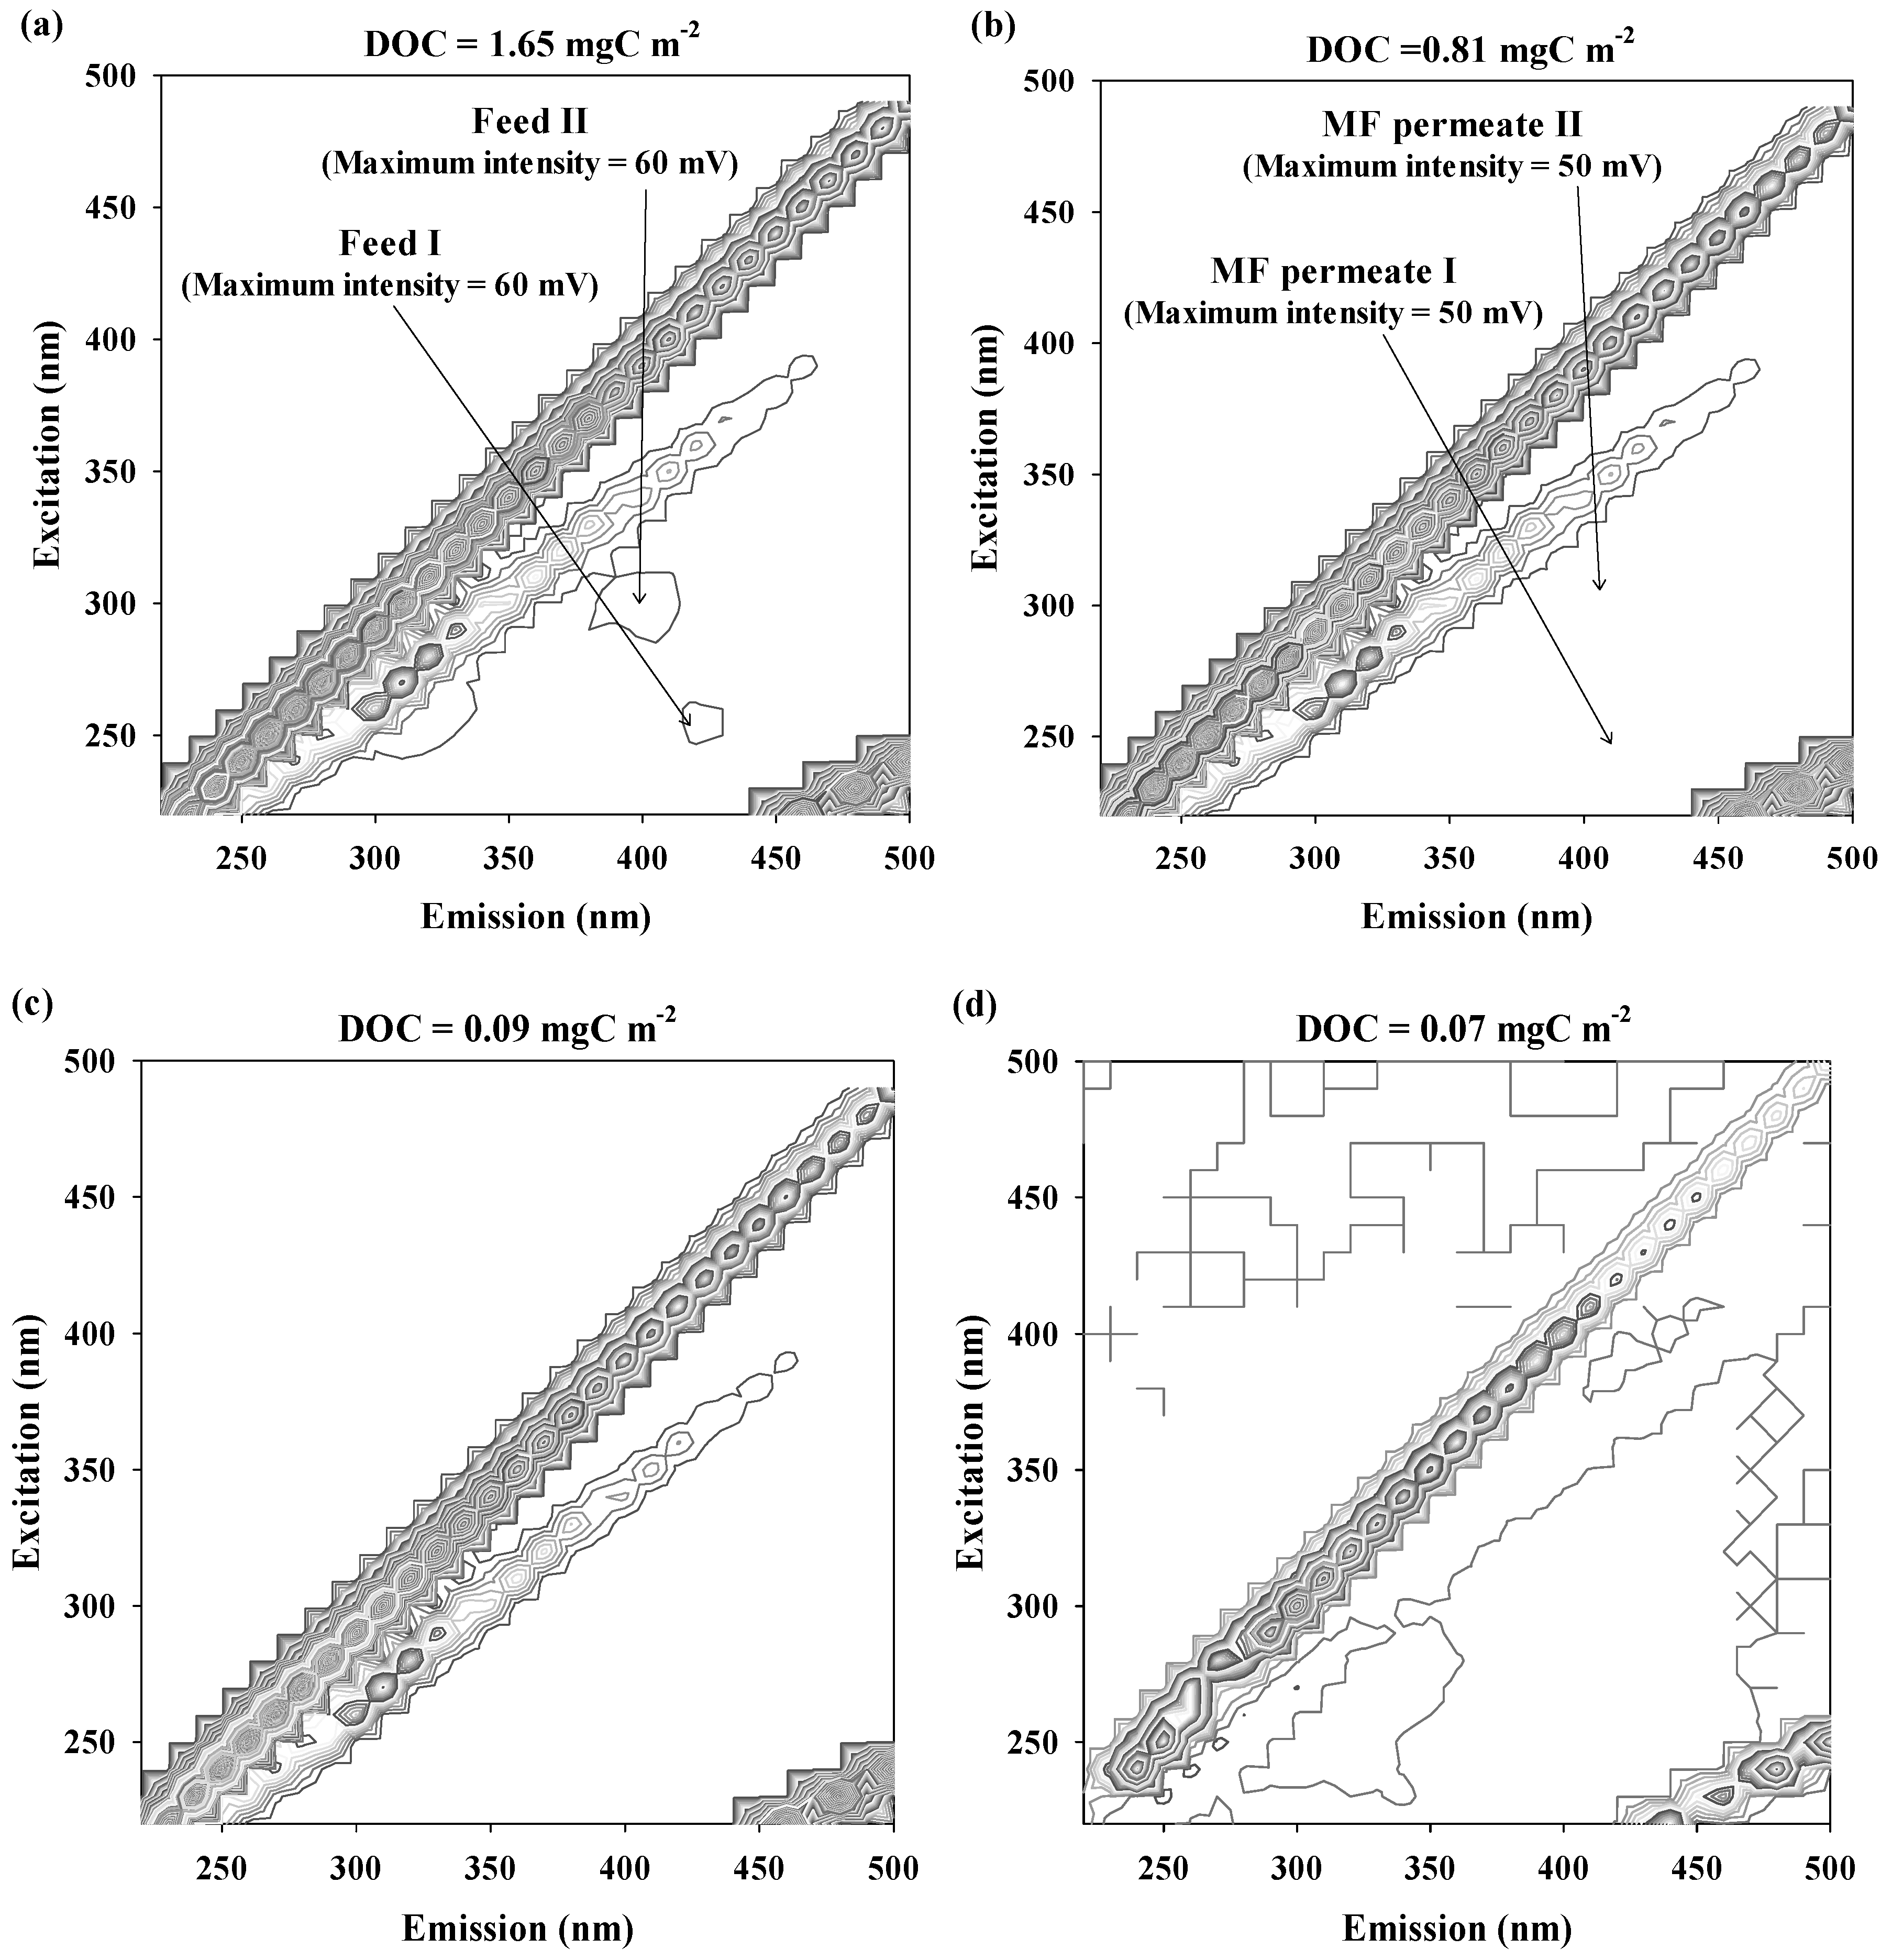
The 3D FEEM of DOM in feed and treated waters are illustrated in Figure 2. Two pairs of humic-like fluorophores were detected for the feed water at excitation wavelength (Ex) = 250 nm/emission wavelength (Em) = 430 nm (Feed I; the maximum intensity = 60 mV) and Ex = 300 nm/Em = 400 nm (Feed II; the maximum intensity = 60 mV) [22]. Despite the considerable decrease in DOC concentration, the intensities of humic-like fluorophores were slightly lower after treatment with the MFC filter (the maximum intensity of MFC permeate I at Ex = 250 nm/Em = 430 nm = 50 mV; the maximum intensity of MFC permeate II at Ex = 300 nm/Em = 400 nm = 50 mV). In addition, distinctive humic-like fluorophores were not observed for the RO and IER permeates due to the almost complete removal of DOM (DOC of RO permeate = 0.09 mgC L−1; DOC of IER permeate = 0.07 mgC L−1). These results were in good agreement with the abatement trend of SUVA values through the UPW production system.
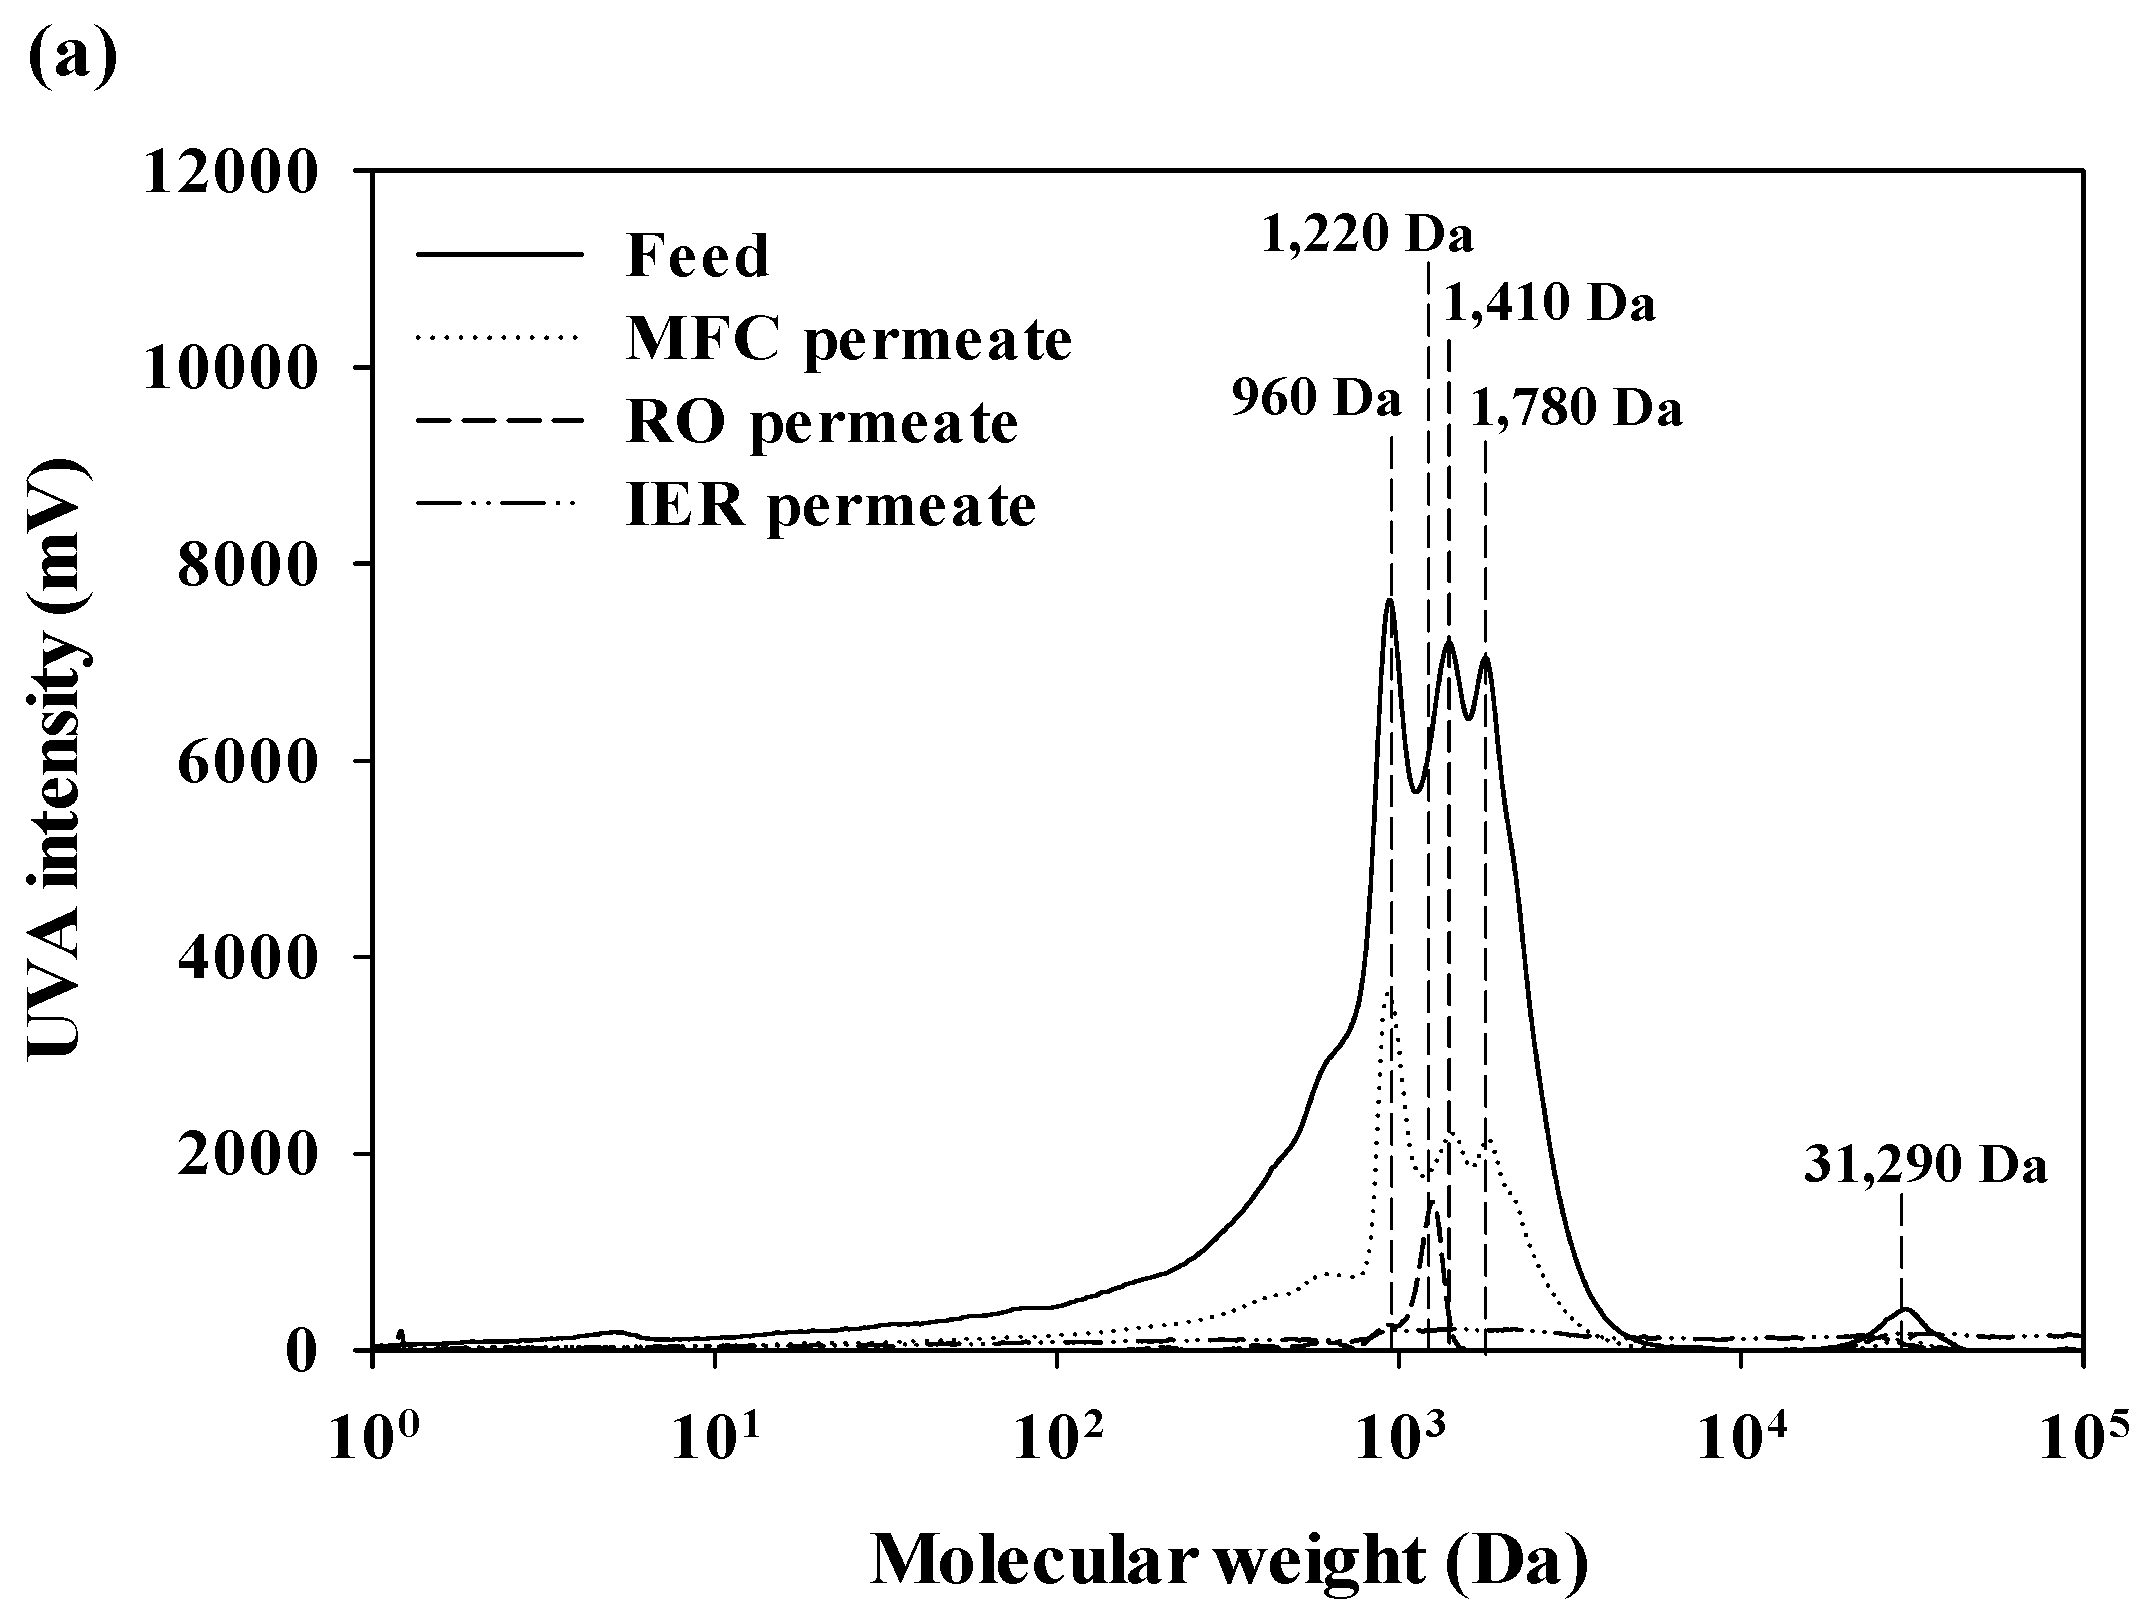
The MW distributions of aromatic and protein-like substances in DOM of feed and treated waters are presented in Figure 3 [23]. The aromatic substances of DOM in feed water contained either low (960–1780 daltons (Da)) or high MW fractions (31,290 Da), with the highest peak at 960 Da (Figure 3a). After passing through the MFC filter, the high MW fraction was completely removed and the UVA intensities of the low MW fractions were substantially decreased. A low MW fraction was found only for the RO permeate at 1220 Da, and its UVA intensity was mostly eliminated after the IER filters. Protein-like substances of DOM in feed water ranged from 150 Da to 48,640 Da, with the highest peak at 6660 Da (Figure 3b). Most MW fractions were effectively removed by the MFC filter, with the exception of the peak at 150 Da. No distinctive peaks were detected for the fluorescence chromatograms of RO and IER permeates. Although the fluorescence detection had higher sensitivity compared to the UVA detection, fluorescence intensities of DOM (the maximum intensity = 3423 mV) were much lower than UVA intensities (the maximum intensity = 6740 mV) [24,25]. Based on these observations, it could be postulated that DOM in feed water is dominantly composed of hydrophobic components.
3.3. Characterization of the RO Membrane Foulants
3.3.1. Organic and Inorganic Contents
The composition of desorbed foulants from the RO membranes utilized in the UPW production system is listed in Table 4. The salt solution (0.1 N NaCl) was more effective than DI water, acid (0.1 N HCl) or base (0.1 N NaOH) solutions in desorbing DOC (RO-DI = 25.39 mgC m−2; RO-A= 15.95 mgC m−2; RO-B = 46.14 mgC m−2; RO-S = 65.12 mgC m−2) and TN (RO-DI = 2.71 mgN m−2; RO-A= 2.72 mgN m−2; RO-B = 2.85 mgN m−2; RO-S = 3.57 mgN m−2) foulants from the RO membranes. Moreover, the desorbed RO membrane foulants using the salt solution exhibited a lower SUVA value than the desorbed RO membrane foulants using other solutions (RO-DI = 2.17 L mg−1 m−1; RO-A= 0.81 L mg−1 m−1; RO-B = 4.96 L mg−1 m−1; RO-S = 0.13 L mg−1 m−1).
This shows that the reduced the electrostatic interaction of charged membrane surface and NOM, leading to double layer compaction and charge screening due to structural variations in cross-linked fouling gel layers during exposure of the RO membrane surfaces to the salt solution may lead to the desorption of hydrophilic organic foulants [26]. Furthermore, some fraction of neutrals foulants can be easily desorbed by decreased hydrophobic/hydrophilic interaction with infiltrating sodium and chlorides ions into Stern layer [27,28,29].
In general, membrane fouling can be categorized into two groups according to the adhesion strength of foulants to membrane surfaces: (i) Irreversible fouling (i.e., desorbable using chemical cleaning) and (ii) reversible fouling (i.e., desorbable using hydraulically cleaning) [23]. The sum of DOC of the desorbed RO membrane foulants using acid, base, and salt solutions was defined as irreversible membrane fouling, and the DOC of the desorbed foulants using DI water was defined as reversible membrane fouling. It is therefore evident that irreversible membrane fouling may govern fouling behavior and characteristics of the RO membranes used in UPW production systems.
The quantity of desorbed metals and metalloids from the RO membranes was highly variable depending on the type of desorbing agents. Furthermore, despite the relatively lower DOC concentration of RO-B (46.14 mgC m−2) compared to RO-S (65.12 mgC m−2), RO-B had higher Al, Ca, and Fe concentrations than RO-S, as most multivalent ions had a greater potential to form complexes with hydrophobic DOM components [25,30]. This observation was strongly supported by the relatively higher SUVA value of desorbed foulants from RO-B compared to that of RO-S. Previous studies have demonstrated that accumulation of complexes with multivalent ions and hydrophobic DOM components onto membrane surfaces can intensify the formation of organic fouling in the RO membrane processes [31].
3.3.2. Fluorescence Spectroscopy
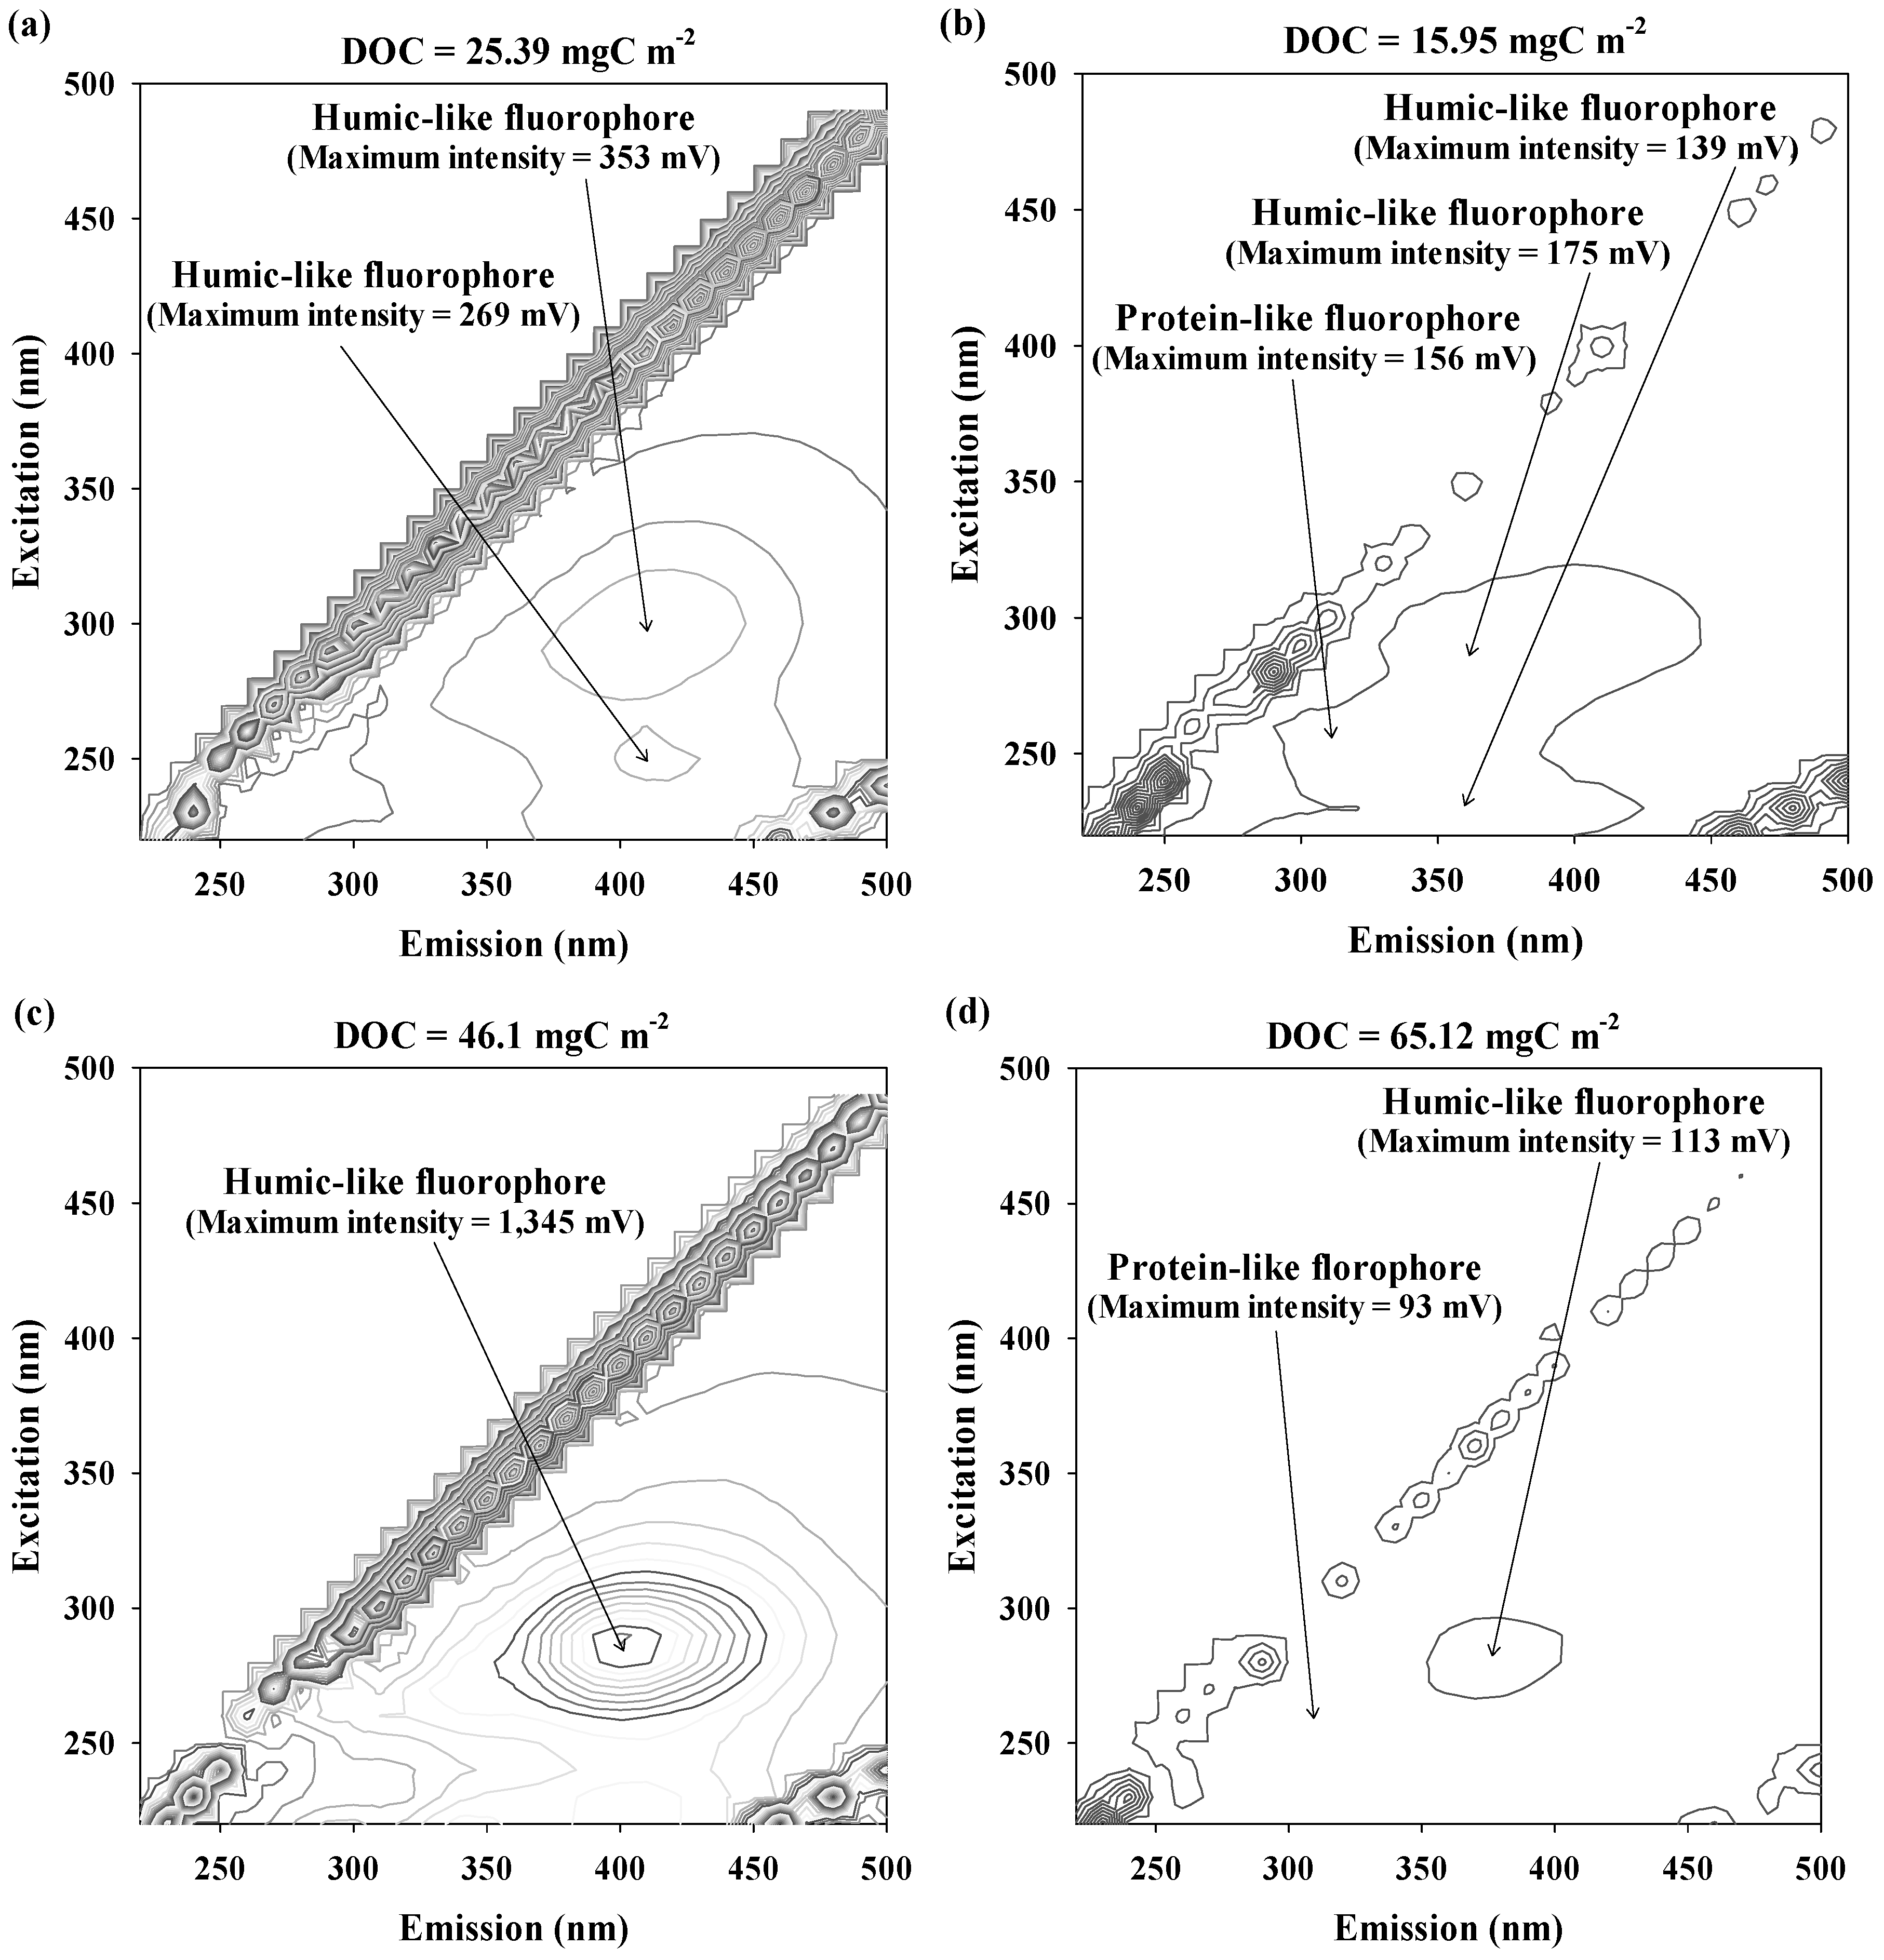
The fluorescence spectral properties of desorbed foulants from the RO membranes are depicted in Figure 4. Three types of fluorophores were found for the desorbed RO membrane foulants using DI water, acid, base, and salt solutions. The RO-DI showed two pairs of humic-like fluorophores at Ex = 250 nm/Em = 410 nm (RO-DI I; the maximum intensity = 269 mV) and Ex = 290 nm/Em = 410 nm (RO-DI II; the maximum intensity = 269 mV). Three different fluorophores were found for RO-A at Ex = 230/Em = 260 nm (RO-A I; protein-like fluorophore, the maximum intensity = 156 mV), Ex = 250/Em = 360 nm (RO-A II; humic-like fluorophore, the maximum intensity = 175 mV), and Ex = 290/Em = 360 nm (RO-A III; humic-like fluorophore, the maximum intensity = 156 mV) while a relatively strong humic-like fluorophore was detected for the RO-B at Ex = 290 nm and Em = 400 nm (RO-B I; the maximum intensity = 1,345 mV). Despite having the highest DOC concentration, the RO-S exhibited two types of relatively weak fluorophores at Ex = 260 nm/Em = 310 nm associated with protein-like fluorophores (the maximum intensity = 93 mV) and Ex = 280 nm/Em = 380 nm, indicative of humic-like fluorophores (the maximum intensity = 113 mV). These results support the assumption that the salt solution is an effective agent to desorb hydrophilic organic foulants from the surfaces of the RO membranes used for UPW production [26].
3.3.3. HPSEC Analysis
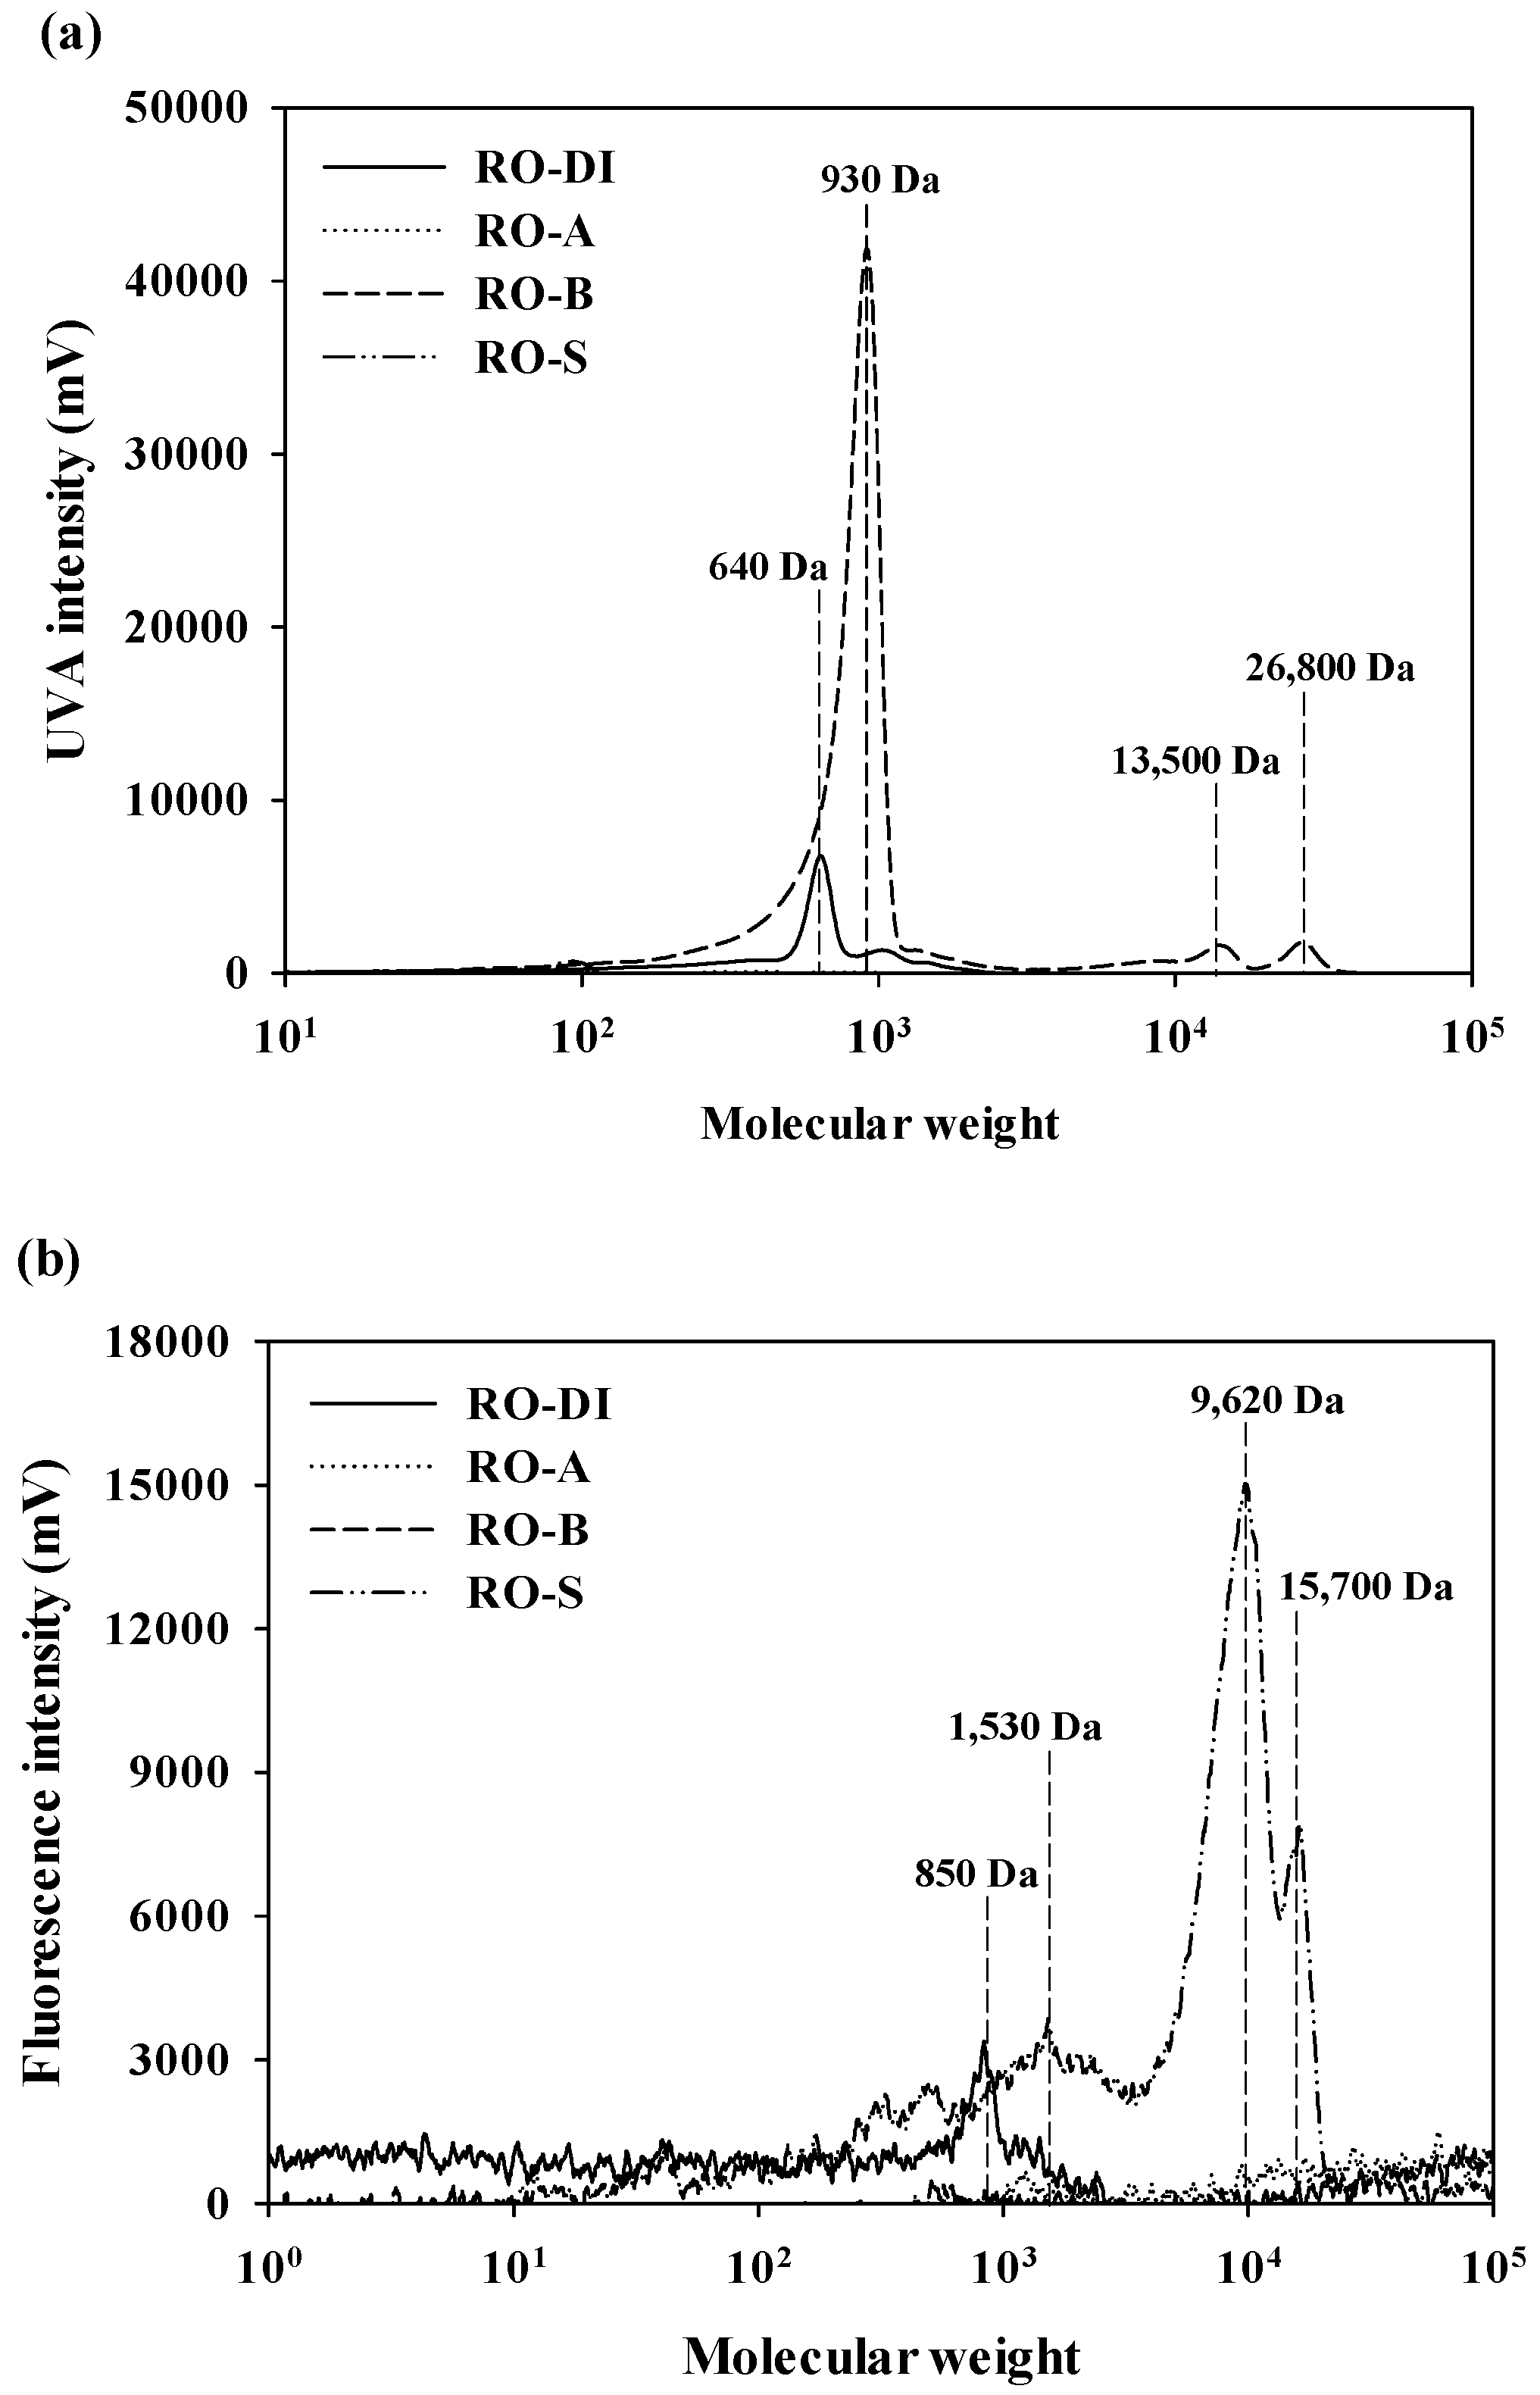
The MW distributions of the desorbed RO membrane foulants using DI water, acid, base, and salt solutions, in terms of aromatic and protein-like substances, are shown in Figure 5. There were no prominent MW peaks for aromatic substances in RO-A and RO-S (Figure 5a). Even though aromatic substances of RO-B included both low (930 Da) and high MW fractions (13,500 Da and 26,800 Da), UVA intensities of high MW fractions (the maximum intensity at 13,500 Da = 1,806 mV; the maximum intensity at 26,800 Da = 2018 mV) were negligible compared to that of low MW fractions the (maximum intensity at 930 Da = 41,787 mV). In addition, a relatively weak peak was observed for aromatic substances of RO-DI at 640 Da (the maximum intensity = 6802 mV). The MW distribution patterns of the protein-like substances (Figure 5b) differed considerably from those of the aromatic substances (Figure 5a), due to significant differences in the major foulant components according to the type of desorbing agent used. No distinctive MW peaks were observed for protein-like substances of RO-A and RO-B. However, the MW distribution of the protein-like substances in RO-S ranged from 1530 Da to 15,700 Da, with the highest peak at 9620 Da (the maximum intensity = 15,043 mV); RO-DI exhibited a very weak fluorescence peak at 850 Da (the maximum intensity = 3398 mV). The absence of prominent UVA peaks and the relatively higher intensities of fluorescence peaks in RO-S clearly showed that RO-S is predominantly comprised of hydrophilic DOM components (i.e., polysaccharide-like and protein-like substances).
3.3.4. ATR-FTIR Spectroscopy
The ATR-FTIR spectra of the virgin and fouled RO membranes are exhibited in Figure S1, Supplementary information (SI). The identical ATR-FTIR spectra were detected for the virgin and fouled RO membranes. However, the intensities of the IR peaks related to amide functional groups originating from the microbial cell lysis, and alcohol functional groups derived from cell wall polysaccharides of microorganisms, differed considerably from each other [19,23]. After formation of fouling layers onto the RO membrane surfaces, intensities of IR peaks associated with N-H stretching of amides (1700–1630 cm−1, 1630–1595 cm−1, and 1430–1410 cm−1), the CNH band of secondary amides (1570–1515 cm−1), the OH band of alcohols (1350–1260 cm−1), the C-O stretching of alcohols (1075–1000 cm−1), and –CH band of aldehydes (975–780 cm−1) were substantially decreased. Conversely, the intensities of IR peaks indicative of the N-H stretching of amides (1590–1570 cm−1, 1610–1500 cm−1, and 850–750 cm−1), the C-O stretching of carboxylic acids (1250–1050 cm−1), and the C-O stretching of alcohols (1210–1100 cm−1) were significantly increased [20,32]. This may be attributed to deposition of either hydrophobic (i.e., humic-like substances) or hydrophilic DOM components (i.e., polysaccharide-like and protein-like substances) from feed water onto the RO membrane surfaces during operation of the UPW production system.
3.4. Surface Features of Virgin, Fouled and Cleaned RO Membranes
The physicochemical characteristics of the virgin, fouled, and cleaned RO membrane surfaces are summarized in Table 5. After formation of fouling layers on membrane surfaces, the negative surface zeta potential of the virgin RO membranes was considerably decreased (virgin RO membrane = –27.4 mV; fouled RO membrane = 1.7 mV), whereas the contact angle was slightly increased (virgin RO membrane = 58.3°; fouled RO membrane = 65.1°). Decreases in the negative surface zeta potential and increases in the surface hydrophobicity of the fouled RO membrane can be explained by the adsorption of hydrophobic and hydrophilic DOM components onto the RO membrane surfaces [23,30]. All desrobing agents were effective in recovering the negative surface zeta potential and the surface hydrophobicity of the RO membranes, however, their recovery rates were strongly influenced by the type of cleaning agent used. The recovery rates of the negative surface zeta potential on the fouled RO membranes were in the order of cleaned RO-S (–24.6 mV) > cleaned RO-B (–21.8 mV) > cleaned RO-DI (–17.5 mV) > cleaned RO-A (–11.4 mV). Similar trends were observed for changes in the contact angle of the fouled RO membranes after the cleaning procedures. The hydrophobicity of the cleaned RO membrane surfaces decreased from cleaned RO-A (64.3°) > cleaned RO-DI (56.7°) > cleaned RO-B (51.7°) > cleaned RO-S (51.3°). These observations are intimately correlated to the amount of desorbed organic foulants from the RO membrane surfaces using DI, acid, base, and salt solutions (DOC of RO-DI = 25.39 mg C m−2; DOC of RO-A = 15.95 mgC m−2; DOC of RO-B = 46.14 mgC m−2; DOC of RO-S = 65.12 mg C m−2). The lower hydrophobicity of the RO membrane surfaces cleaned using base and salt solutions, and the higher hydrophobicity of the fouled RO membrane surfaces compared to the virgin RO membrane surfaces, are notable. This result illustrates that the reduced negative surface zeta potential (through formation of initial fouling layers by deposition of hydrophilic DOM components onto the RO membrane surfaces) may enhance subsequent fouling formation of the RO membranes by hydrophobic DOM components [25,31].
3.5. Effects of Cleaning Agent Types on the Recovery of Salt Rejection and Permeate Flux
The salt rejection (NaCl = 0.1 M) and permeate flux (feed: DI water) of the virgin, fouled, and cleaned RO membranes under controlled conditions (feed water pressure = 1000 KPa; cross-flow velocity = 8.68 cm sec−1; effective surface area = 96 cm2; channel height = 0.04 cm; temperature = 20 ± 0.7 °C) are compared in Figure 6. The fouled RO membranes exhibited a much lower permeate flux (1.2 L m−2 hr−1) than the virgin RO membrane (6.5 L m−2 hr−1) due to formation of membrane foulants.
Moreover, a significant decrease was observed for the salt rejection rate of the fouled RO membranes (88.2%) compared to the virgin RO membranes (97.5%). There may be two possible reasons; i) The interaction between concentration polarization and formed cake layer is highly depending on the intrinsic properties of the formed cake layer (e.g., porosity, thickness). The formed cake layer can cause cake-enhanced concentration polarized which cause increasement of salt passage through the RO membranes [33]. ii) The increased salt concentrations at the RO membrane surfaces (due to the hindered back diffusion of salts from the RO membrane surfaces by forming colloidal cake layers on those surfaces) can increase the passage of salts through the RO membranes [34].
All the applied desorbing agents were effective in recovering salt rejection and permeate flux. However, the recovery rates varied markedly according to the types of desorbing agents. The recovery rates of the salt rejection through the cleaning using DI water, acid, base, and salt solutions were in the order of cleaned RO-DI (salt rejection = 90.1%) > cleaned RO-A (salt rejection = 92.1%) > cleaned RO-S (salt rejection = 94.8%) > cleaned RO-B (salt rejection = 95.0%). Although cleaned RO-B showed a slightly better salt rejection than cleaned RO-S, the differences were negligible (< 0.2%). Unlike recovery rates of salt rejection, recovery rates of permeate flux were strongly associated with the amount of desorbed organic foulants from the RO membrane surfaces (DOC of RO-DI = 25.39 mgC m−2; DOC of RO-A = 15.95 mgC m−2; DOC of RO-B = 46.14 mgC m−2; DOC of RO-S = 65.12 mgC m−2). The recovery rates of the permeate flux through the cleaning using DI water, acid, base, and salt solutions were in the order of cleaned RO-DI (permeate flux = 3.6 L m−2 hr−1) < cleaned RO-A (permeate flux = 4.1 L m−2 hr−1) < cleaned RO-B (permeate flux = 4.8 L m−2 hr−1) < cleaned RO-S (permeate flux = 5.3 L m−2 hr−1), which is consistent with the recovery rates of the negative surface zeta potential and the contact angle with the exception of RO-A. This is because that acid cleaning is more effective for desorbing inorganic foulants than organic foulants. The recovery rates of surface features more influenced by the amount of desorbed organic foulants on membranes surface [21,23,25,30]. Therefore, permeate flux recovery rate of RO-A can be higher than that of RO-DI, even though the surface features recovery of RO-A is lower than that of RO-DI. These observations suggest that salt cleaning can efficiently recover the salt rejection and the permeate flux of the RO membranes used for UPW production [26].
4. Conclusions
Fouling behaviors of the RO membranes and effects of desorbing agents (i.e., DI water, acid, base, and salt solutions) on the fouled RO membranes were identified through membrane autopsies and characterization of DOM and desorbed membrane foulants to provide deeper insights into the UPW production systems. The salt solution more effectively extracted organic foulants from the RO membrane surfaces (DOC = 65.12 mgC m−2) compared to DI water (DOC = 25.39 mgC m−2), acid (DOC = 15.95 mgC m−2), and base (DOC = 46.14 mgC m−2) solutions. This was attributed to the efficient desorption of hydrophilic organic foulants through structural changes in the cross-linked gel layers during exposure of the RO membrane surfaces to the salt solution. Consequently, the highest negative surface zeta potential (–24.6 mV) and the lowest contact angle (51.3°) were observed for the cleaned RO-S. These results show that recovery of membrane surface features (i.e., surface zeta potential and contact angle) was directly correlated to the amount of desorbed organic foulants from the RO membrane surfaces. Although the salt rejection of cleaned RO-S (94.8%) was slightly lower than that of cleaned RO-B (95.0%), cleaned RO-S exhibited a much higher permeate flux (5.3 L m−2 hr−1) compared to cleaned RO-B (4.8 L m−2 hr−1). These observations show that salt cleaning is a promising option to recover the salt rejection and the permeate flux of the RO membranes fouled dominantly by hydrophilic DOM fractions and used for UPW production. Furthermore, the in-depth mechanism of salt cleaning for fouled membrane and its implication for water treatment process based on membrane technology can be further extended.
Supplementary Materials
The following are available online at https://www.mdpi.com/2073-4441/11/6/1116/s1, Figure S1: The ATR-FTIR spectra of the virgin and fouled RO membranes used in the UPW system.
Author Contributions
H.R. analyzed the water sample and membrane. K.C. and J.C. designed the experiments and drew the conclusions.
Funding
This study was supported by the National Research Foundation of Korea (NRF) Grant funded by the Korean Government (MSIP) (No. NRF-2015R1A5A7037825), by 2017 Research Grant from Kangwon National University (520170030) and by the Korea Institute of Energy Technology Evaluation and Planning (KETEP) through “Human Resources Program in Energy Technology” (No. 20164030201010/No. 20184030202250) funded by the Ministry of Trade, Industry and Energy, Republic of Korea.
Conflicts of Interest
The authors declare no conflict of interest.
References
- Lee, H.; Jin, Y.; Hong, S. Recent transitions in ultrapure water (UPW) technology: Rising role of reverse osmosis. Desalination 2016, 399, 185–197. [Google Scholar] [CrossRef]
- Ganzi, G.C.; Jha, A.D.; DiMascio, E.; Wood, J.H. Electrodeionization—Theory and practice of continuous electrodeionization. Ultrapure Water J. 1997, 14, 64–69. [Google Scholar]
- Wood, J.; Gifford, J.; Arba, J.; Shaw, M. Production of ultrapure water by continuous electrodeionization. Desalination 2010, 250, 973–976. [Google Scholar] [CrossRef]
- GWI. Global Water Market, 2014: Meeting the Word’s Water and Wastewater Need Until 2018; Global Water Intelligence: Oxford, UK, 2013. [Google Scholar]
- Puckorius, P.R. Does cooling water treatment vary between industries? Ind. Water Treat. 2015, 32, 37–42. [Google Scholar]
- Cohen, N.; Sackstein, S. How to bring your high-purity water pretreatment systems into the 21st century. Ultrapure Water J. 2015, 32, 21–25. [Google Scholar]
- Tai, M.S.L.; Chua, I.; Line, K.; Ngh, W.J.; Tea, W.K. Removal of dissolved oxygen in ultrapure water production using microporous membrane modules. J. Membrane Sci. 1994, 87, 99–105. [Google Scholar] [CrossRef]
- Li, K.; Chua, I.; Ng, W.J.; Teo, W.K. Removal of dissolved oxygen in ultrapure water production using a membrane reactor. Chem. Eng. Sci. 1995, 50, 3547–3556. [Google Scholar] [CrossRef]
- Jean-luc, B.; Bruno, D. Contamination monitoring and analysis in semiconductor manufacturing. Semicond. Technol. 1999, 57–78. [Google Scholar] [CrossRef]
- Ohya, H. State of the art ultrapurewater production in Japan. Desalination 1991, 80, 159–165. [Google Scholar] [CrossRef]
- Ohmi, T. Ultraclean Technology Handbook: Ultrapure Water; CRC Press: Boca Raton, FL, USA, 1993; p. 1. [Google Scholar]
- Hutcheson, J. Ultrapurewater: systems formicroelectronics. Filtr. Separat. 2006, 43, 22–25. [Google Scholar] [CrossRef]
- Wang, A. UPW’s membrane technology application trend on semiconductor. Semicon. Man. Tech. Workshop 2002, 294–298. [Google Scholar] [CrossRef]
- Singh, R. Production of high-purity water by membrane processes. Desalin. Water Treat. 2009, 3, 99–110. [Google Scholar] [CrossRef] [Green Version]
- Gagnon, S.R.; Hartman, J. Case history of a water treatment system using EDI in Puerto Rico. Ultrapure Water J. 2010, 27, 12–24. [Google Scholar]
- Pororov, S.A.; Kornilova, N.; Platonov, K. Ultra pure water: intensive water demineralisation through ion exchange. Filtr. Separat. 2011, 48, 36–39. [Google Scholar] [CrossRef]
- Lee, J.H.; Choi, J.H. The production of ultrapure water by membrane capacitive deionization (MCDI) technology. J. Membrane Sci. 2012, 409–410, 251–256. [Google Scholar] [CrossRef]
- Chon, K.; Cho, J.; Shon, H.K.; Chon, K. Advanced characterization of organic foulants of ultrafiltration and reverse osmosis from water reclamation. Desalination 2012, 301, 59–66. [Google Scholar] [CrossRef]
- Chon, K.; Cho, J.; Shon, H.K. Advanced characterization of algogenic organic matter, bacterial organic matter, humic acids and fulvic acids. Water Sci. Technol. 2013, 67, 2228–2235. [Google Scholar] [CrossRef] [Green Version]
- Cho, J.; Amy, G.; Pellagrino, J.; Yoon, Y. Characterization of clean and natural organic matter (NOM) fouled NF and UF membranes, and foulants characterization. Desalination 1998, 118, 101–108. [Google Scholar] [CrossRef]
- Chon, K.; Cho, J.; Shon, H.K. Fouling characteristics of a membrane bioreactor and nanofiltration hybrid system for municipal wastewater reclamation. Bioresource Technol. 2013, 130, 239–247. [Google Scholar] [CrossRef]
- Chon, K.; Lee, K.; Kim, I.S.; Jang, A. Performance assessment of a submerged membrane bioreactor using a novel microbial consortium. Bioresour. Technol. 2016, 210, 2–10. [Google Scholar] [CrossRef]
- Huber, S.A.; Balz, A.; Abert, M.; Pronk, W. Characterisation of aquatic humic and non-humic matter with size-exclusion chromatography-organic carbon detection-organic nitrogen detection (LC-OCD-OND). Water Res. 2011, 45, 879–885. [Google Scholar] [CrossRef]
- Leenheer, J.A.; Croué, J.P. Characterizing dissolved aquatic organic matter. Environ. Sci. Technol. 2003, 37, 18A–26A. [Google Scholar] [CrossRef]
- Chon, K.; Cho, J. Fouling behavior of dissolved organic matter in nanofiltration membranes from a pilot-scale drinking water treatment plant: An autopsy study. Chem. Eng. J. 2016, 295, 268–277. [Google Scholar] [CrossRef]
- Lee, S.; Elimelech, M. Salt cleaning of organic-fouled reverse osmosis membranes. Water. Res. 2007, 41, 1134–1142. [Google Scholar] [CrossRef]
- Lee, H.; Amy, G.; Cho, J.; Yoon, Y.; Moon, S.-H.; Kim, I.S. Cleaning strategies for flux recovery of an ultrafiltration membrane fouled by natural organic matter. Wat. Res. 2001, 35, 3301–3308. [Google Scholar] [CrossRef]
- Stumm, W. Chemistry of the Solid–Water Interface; Wiley Inc.: New York, NY, USA, 1992. [Google Scholar]
- Rho, H.; Chon, K.; Cho, J. Surface charge characterization of nanofiltration membranes by potentimetric titrations and electrophoresis: Functionality vs. zeta potential. Desalination 2018, 427, 19–26. [Google Scholar] [CrossRef]
- Chon, K.; Chon, K.; Cho, J. Characterization of size fractionated dissolved organic matter from river water and wastewater effluent using preparative high performance size exclusion chromatography. Org. Geochem. 2017, 103, 105–112. [Google Scholar] [CrossRef]
- Chon, K.; Kim, S.J.; Moon, J.; Cho, J. Combined coagulation-disk filtration process as a pretreatment of ultrafiltration and reverse osmosis membrane for wastewater reclamation: an autopsy study of a pilot plant. Water Res. 2012, 46, 1803–1806. [Google Scholar] [CrossRef]
- Kanokkantapong, V.; Marhaba, T.F.; Panyapinyophol, B.; Pavasant, P. FTIR evaluation of functional groups involved in the formation of haloacetic acids during the chlorination of raw water. J. Hazard. Mater. 2006, B136, 188–196. [Google Scholar] [CrossRef]
- Hoek, E.M.V.; Elimelech, M. Cake-enhanced concentration polarization: A new fouling mechanism for salt-rejecting membranes. Environ. Sci. Technol. 2003, 37, 5581–5588. [Google Scholar] [CrossRef]
- Lee, S.; Cho, J.; Elimelech, M. Influence of colloidal fouling and feed water recovery on salt rejection of RO and NF membranes. Desalination 2004, 160, 1–12. [Google Scholar] [CrossRef]
Figure 1.
Schematic diagram of the UPW production system comprising a MFC filter, RO membranes, and IER filters.
Figure 1.
Schematic diagram of the UPW production system comprising a MFC filter, RO membranes, and IER filters.

Figure 2.
Fluorescence spectral characteristics of DOM in feed and treated waters of the UPW system: (a) Feed, (b) MFC permeate, (c) RO permeate, and (d) IER permeate.
Figure 2.
Fluorescence spectral characteristics of DOM in feed and treated waters of the UPW system: (a) Feed, (b) MFC permeate, (c) RO permeate, and (d) IER permeate.

Figure 3.
The MW distribution of DOM in the feed and treated waters of the UPW production system: (a) Aromatic substance and (b) protein-like substances.
Figure 3.
The MW distribution of DOM in the feed and treated waters of the UPW production system: (a) Aromatic substance and (b) protein-like substances.


Figure 4.
The 3D FEEM of the desorbed foulants from the RO membranes used for UPW production: (a) RO-DI, (b) RO-A, (c) RO-B, and (d) RO-S.
Figure 4.
The 3D FEEM of the desorbed foulants from the RO membranes used for UPW production: (a) RO-DI, (b) RO-A, (c) RO-B, and (d) RO-S.

Figure 5.
The MW distribution of the desorbed foulants from the RO membranes used for UPW production: (a) Aromatic substance and (b) protein-like substances.
Figure 5.
The MW distribution of the desorbed foulants from the RO membranes used for UPW production: (a) Aromatic substance and (b) protein-like substances.

Figure 6.
The permeate flux (feed water: DI water) and salt rejection (NaCl = 0.1 M) of the virgin, fouled, and cleaned RO membranes under controlled conditions (feed water pressure = 1000 KPa; cross-flow velocity = 8.68 cm sec−1; effective surface area = 96 cm2; channel height = 0.04 cm; temperature = 20 ± 0.7 °C).


Table 1.
Physicochemical properties of the MFC filter and RO membranes.
| Type | MFC Filter | RO Membrane |
|---|---|---|
| Manufacturer | SpectraPure | Toray Chemical Korea |
| Membrane code | SP32410 | RE-1812-50 |
| Materials | Polypropylene | Thin-film composite polyamide |
| Nominal pore size (μm) | 0.5 | < 0.005 |
| Roughness (μm) | N.A. | 0.04 |
| Inner diameter (cm) | 2.8 | N.A. |
| Outer diameter (cm) | 6.5 | N.A. |
| Length (cm) | 23.0 | N.A. |
| Effective surface area (m2) | N.A. | 0.4 |
N.A.: not available.
Table 2.
Specifications of the IER filter.
| Specifications | H+ | OH− |
|---|---|---|
| Materials | Styrene-divinylbenzene | |
| Functional groups | Sulfonic acid and quaternary ammonium | |
| Total exchange capacity (eq L−1) a | 1.9 | 1.0 |
| Water content (%) | 46–53 | 45–53 |
| Averaged particle size (μm) | 360 | 590 |
| Uniformity coefficient (μm) b | 1.1 | 1.1 |
| Particle density (g mL−1) | 1.22 | 1.08 |
| Cationic resin conversion rate to H+ (%) a | 99.7 | - |
| Anionic resin conversion rate to OH− (%) a | - | 95.0 |
a Minimum. b Maximum.
Table 3.
Characteristics of feed and treated waters in the UPW production system (n = 3).
| Header | Conditions | Feed | MFC Permeate | RO Permeate | IER Permeate |
|---|---|---|---|---|---|
| Bulk parameters | pH | 7.3 | 7.3 | 7.5 | 6.3 |
| Conductivity (μS cm−1) | 68.5 | 67.1 | 12.1 | 0.55 | |
| TN (mgN L−1) | 2.15 (±0.10) | 2.08 (±0.06) | 0.98 (±0.47) | 0.05 (±0.01) a | |
| DOC (mgC L−1) | 1.65 (±0.10) | 0.81 (±0.13) | 0.09 (±0.07) | 0.07 (±0.02) a | |
| UVA254 (cm−1) | 0.024 (±0.002) | 0.018 (±0.001) | 0.002 (±0.001) | 0.001 (±0.000) | |
| SUVA (L mg−1 m−1) | 1.45 (±0.03) | 2.22 (±0.20) | 2.22 (±0.78) | 1.37 (±0.28) | |
| Ion species | Na+ (mg L−1) | 6.47 (±0.21) | 6.13 (±0.16) | 0.21 (±0.01) | B.D.L. |
| K+ (mg L−1) | 2.19 (±0.22) | 2.12 (±0.12) | 0.41 (±0.01) | B.D.L. | |
| Mg2+ (mg L−1) | 3.26 (±0.12) | 3.12 (±0.27) | 0.29 (±0.09) | B.D.L. | |
| Ca2+ (mg L−1) | 14.48 (±0.21) | 13.9 (±0.14) | 1.54 (±0.13) | B.D.L. | |
| Cl− (mg L−1) | 17.23 (±0.41) | 15.82 (±0.35) | 0.42 (±0.01) | B.D.L. | |
| NO3− (mg L−1) | 1.71 (±0.18) | 1.64 (±0.25) | 0.38 (±0.01) | B.D.L. | |
| SO42− (mg L−1) | 11.23 (±0.32) | 9.97 (±0.14) | 0.12 (±0.01) | B.D.L. | |
| Metals and metalloids | Al (μg L−1) | 19.17 (±0.13) | 12.25 (±0.16) | 1.98 (±0.09) | 2.7 (±0.12) |
| As (μg L−1) | 0.54 (±0.02) | 0.18 (±0.03) | 0.00 (±0.00) | 0.00 (±0.00) | |
| Cd (μg L−1) | 0.01 (±0.01) | 0.00 (±0.00) | 0.00 (±0.00) | B.D.L. | |
| Co (μg L−1) | 0.02 (±0.01) | 0.00 (±0.00) | 0.00 (±0.00) | 0.00 (±0.00) | |
| Cr (μg L−1) | 0.14 (±0.06) | 0.00 (±0.00) | 0.00 (±0.00) | 0.00 (±0.00) | |
| Cu (μg L−1) | 1.15 (±0.03) | 0.82 (±0.03) | 0.28 (±0.02) | B.D.L. | |
| Fe (μg L−1) | 3.67 (±0.31) | 1.23 (±0.18) | 0.32 (±0.17) | 1.3 (±0.02) | |
| Mn (μg L−1) | 2.16 (±0.02) | 1.98 (±0.02) | 0.35 (±0.02) | 0.1 (±0.00) | |
| Pb (μg L−1) | 0.04 (±0.01) | 0.03 (±0.01) | 0.01 (±0.02) | B.D.L. |
a n = 2. B.D.L.: below the detection limit.
Table 4.
Composition of the desorbed RO membrane foulants from the UPW production system using DI water, acid, base, and salt solutions (n = 3).
Table 4.
Composition of the desorbed RO membrane foulants from the UPW production system using DI water, acid, base, and salt solutions (n = 3).
| Header | Conditions | RO-DI | RO-A | RO-B | RO-S |
|---|---|---|---|---|---|
| Bulk Parameter | DOC (mgC m−2) | 25.39 (±0.35) | 15.95 (±0.38) | 46.14 (±0.94) | 65.12 (±1.51) |
| UVA254 (cm−1) | 0.087 (±0.003) | 0.017 (±0.003) | 0.289 (±0.004) | 0.011 (±0.001) | |
| SUVA (L mg−1 m−1) | 2.71 (±0.09) | 0.81 (±0.14) | 4.96 (±0.05) | 0.13 (±0.04) | |
| TN (mgN m−2) | 1.08 (±0.41) | 2.72 (±0.34) | 2.85 (±0.18) | 3.57 (±1.95) | |
| Metals and metalloids | Al (mg m−2) | 0.24 (±0.02) | 4.89 (±0.09) | 8.19 (±0.06) | 0.01 (±0.01) |
| As (μg m−2) | 0.03 (±0.01) | 0.02 (±0.01) | 8.79 (±0.01) | 0.01 (±0.01) | |
| Ca (mg m−2) | 25.72 (±4.83) | 25.09 (±0.55) | 36.96 (±2.45) | 24.06 (±2.37) | |
| Cd (μg m−2) | B.D.L. | B.D.L. | B.D.L. | B.D.L. | |
| Co (μg m−2) | B.D.L. | B.D.L. | B.D.L. | B.D.L. | |
| Cr (μg m−2) | 0.01 (±0.01) | 0.01 (±0.01) | 0.06 (±0.01) | 0.00 (±0.01) | |
| Cu (μg m−2) | 0.04 (±0.01) | 0.65 (±0.01) | 0.25 (±0.01) | 0.04 (±0.01) | |
| Fe (μg m−2) | 0.62 (±0.02) | 0.38 (±0.04) | 1.92 (±0.01) | 0.01 (±0.01) | |
| Mg (mg m−2) | 12.82 (±2.45) | 10.29 (±0.16) | 9.73 (±0.16) | 9.89 (±0.01) | |
| Mn (μg m−2) | 0.16 (±0.01) | 0.47 (±0.01) | 0.1 (±0.01) | 0.09 (±0.01) | |
| Pb (μg m−2) | 0.02 (±0.01) | 0.47 (±0.06) | 0.23 (±0.01) | N.D. |
B.D.L.: below the detection limit.
Table 5.
Physicochemical properties of the virgin, fouled, and cleaned RO membranes using DI water, acid, base, and salt solutions (n = 3).
Table 5.
Physicochemical properties of the virgin, fouled, and cleaned RO membranes using DI water, acid, base, and salt solutions (n = 3).
| Membranes | Surface Zeta Potential at pH 7 (mV) | Contact Angel (°) |
|---|---|---|
| Virgin RO | −27.4 (±1.6) | 58.3 (±3.8) |
| Fouled RO | 1.7 (±3.1) | 65.1 (±2.5) |
| Cleaned RO-DI | −17.5 (±1.9) | 56.7 (±0.7) |
| Cleaned RO-A | −11.4 (±2.6) | 64.3 (±5.9) |
| Cleaned RO-B | −21.8 (±3.6) | 51.7 (±4.8) |
| Cleaned RO-S | −24.6 (±2.4) | 51.3 (±1.2) |
© 2019 by the authors. Licensee MDPI, Basel, Switzerland. This article is an open access article distributed under the terms and conditions of the Creative Commons Attribution (CC BY) license (http://creativecommons.org/licenses/by/4.0/).
Share and Cite
MDPI and ACS Style
Rho, H.; Chon, K.; Cho, J. An Autopsy Study of a Fouled Reverse Osmosis Membrane Used for Ultrapure Water Production. Water 2019, 11, 1116. https://doi.org/10.3390/w11061116
AMA Style
Rho H, Chon K, Cho J. An Autopsy Study of a Fouled Reverse Osmosis Membrane Used for Ultrapure Water Production. Water. 2019; 11(6):1116. https://doi.org/10.3390/w11061116
Chicago/Turabian StyleRho, Hojung, Kangmin Chon, and Jaeweon Cho. 2019. "An Autopsy Study of a Fouled Reverse Osmosis Membrane Used for Ultrapure Water Production" Water 11, no. 6: 1116. https://doi.org/10.3390/w11061116
Note that from the first issue of 2016, this journal uses article numbers instead of page numbers. See further details here.