A Preliminary Study of the Failure Modes and Process of Landslide Dams Due to Upstream Flow


1
College of Geological Engineering and Surveying of Chang’an University/Key Laboratory of Western China, Mineral Resources and Geological Engineering, Xi’an 710054, China
2
School of Environmental Science and Engineering, Chang’an University, Xi’an 710054, China
3
Shaanxi Institute of Engineering Prospecting Co. Ltd., Xi’an 710068, China
*
Author to whom correspondence should be addressed.
Water 2019, 11(6), 1115; https://doi.org/10.3390/w11061115
Submission received: 5 May 2019
/
Revised: 23 May 2019
/
Accepted: 24 May 2019
/
Published: 28 May 2019
(This article belongs to the Section Hydraulics and Hydrodynamics)
Abstract
:In the process of mineral development, large-scale flash floods (or debris flows) can be induced by the failure of landslide dams formed by the disorganized stacking of mine waste. In this study, the modes and processes of mine waste dam failures were explored using 13 experimental tests based on the field investigation of landslide dams in the Xiaoqinling gold mining area in China. Our 13 mine waste dam experiments exhibited three failure modes: (i) Piping, overtopping, and erosion; (ii) overtopping and soil collapse; and (iii) overtopping and erosion. In addition, the failure processes of the landslide dams included impoundment, seepage, overtopping, and soil erosion. Different experimental conditions would inevitably lead to different failure processes and modes, with the failure modes being primarily determined by the seepage characteristics. Overtopping was the triggering condition for dam failure. The landslide dam failure process was determined based on the particle size of the mine waste and the shape of the dam. These findings will provide a scientific reference for the prevention and mitigation of natural hazards in mining areas.
1. Introduction
The formation and failure of landslide dams include a series of complex processes that occur at the interface between hill slopes and alluvial plain or valley-floor systems. Floods and debris flows caused by the failure of landslide dams constitute a widespread hazard to people and property, in part because of the suddenness and unpredictability of all types of dam failures [1]. Unlike artificial gravity or concrete dams with engineered barriers and filter materials, a landslide dam usually consists of a non-cohesive clast material, which has a broad grain size distribution [2,3] and is in a naturally unstable state [4,5]. Based on historical events, dam failures can generate destructive flash floods and debris flows that cause catastrophic losses [5,6,7,8].
The debris flows in the Xiaoqinling gold mining area in Tongguan County, Shaanxi Province (Figure 1) are examples of large-scale debris flows that occurred in gullies due to the failure of mine waste landslide dams [9,10,11]. The unreasonable stacking of mine waste severely blocked the gullies and formed numerous landslide dams with beaded distribution [10]. When these landslide dams failed, large-scale floods (or debris flows) occurred, such as the catastrophic disaster on 11 July 1994, which occurred when heavy rains in the upper reaches of the basin resulted in a large amount of mine waste being delivered by the flood and finally forming a debris flow with a peak flow rate of 260 m3/s. The debris flow resulted in 51 deaths, more than 2000 missing, and economic losses of more than three million dollars [9,12]. We conducted three field investigations in the basin from 2016 to 2018. Our investigations show that the mine waste is still being randomly stacked and blocking the channel, forming many landslide dams that are more than 20 m high. Eight landslide dams with a beaded distribution were identified in Daxicha Gully—shown in the left panel of Figure 1—which indicated that the gold miners did not learn from past disasters. The average gradient of the gully is greater than 32.5%. Moreover, the average annual precipitation of the basin is 587.4 mm, and the maximum annual precipitation is 958.6 mm. The maximum daily rainfall was 113.4 mm (23 July 2010), and 76.19% of the annual rainfall is concentrated in July, August, and September [10]. Therefore, large-scale debris flows could be triggered by heavy rainfall events in the future.
A considerable number of important research achievements concerning landslide dams have been made in recent years. Several multidisciplinary studies have investigated, simulated, and predicted the occurrence, longevity, breakdown, and subsequent debris flows of landslide dams [1,5,13,14]. Dam breaching is very complicated due to the influence of the physical environment. Accurate knowledge of the dam breach process is essential to help design an early warning system for the evacuation of people and property. Many scholars have carried out model experiments on landslide dam failure [15,16,17,18]. In addition to experimental research, physically-based mathematical models have been established for practical uses [19,20,21,22,23]. The application of these models and methods are useful in disaster prevention, mitigation, and risk assessment of floods caused by the failure of landslide dams. However, because of the limitations for field monitoring, it has been difficult to reproduce the failure process of landslide dams in real time. In addition, the variability of mine waste’s composition results in an unpredictable breach mode and process response when a landslide dam fails.
In this study, we used 13 experimental tests to reproduce the failure process of mine waste landslide dams under different conditions. Three failure modes were summarized by analyzing the failure process of landslide dams. In addition, we compared the characteristics of the dam system during the failure process and found that seepage was the main factor determining the failure modes. This preliminary study provides experimental evidence that can be used for planning, natural hazards prevention, and the mitigation of mine waste landslide dams.
2. Experimental Methods
2.1. Experimental Setup
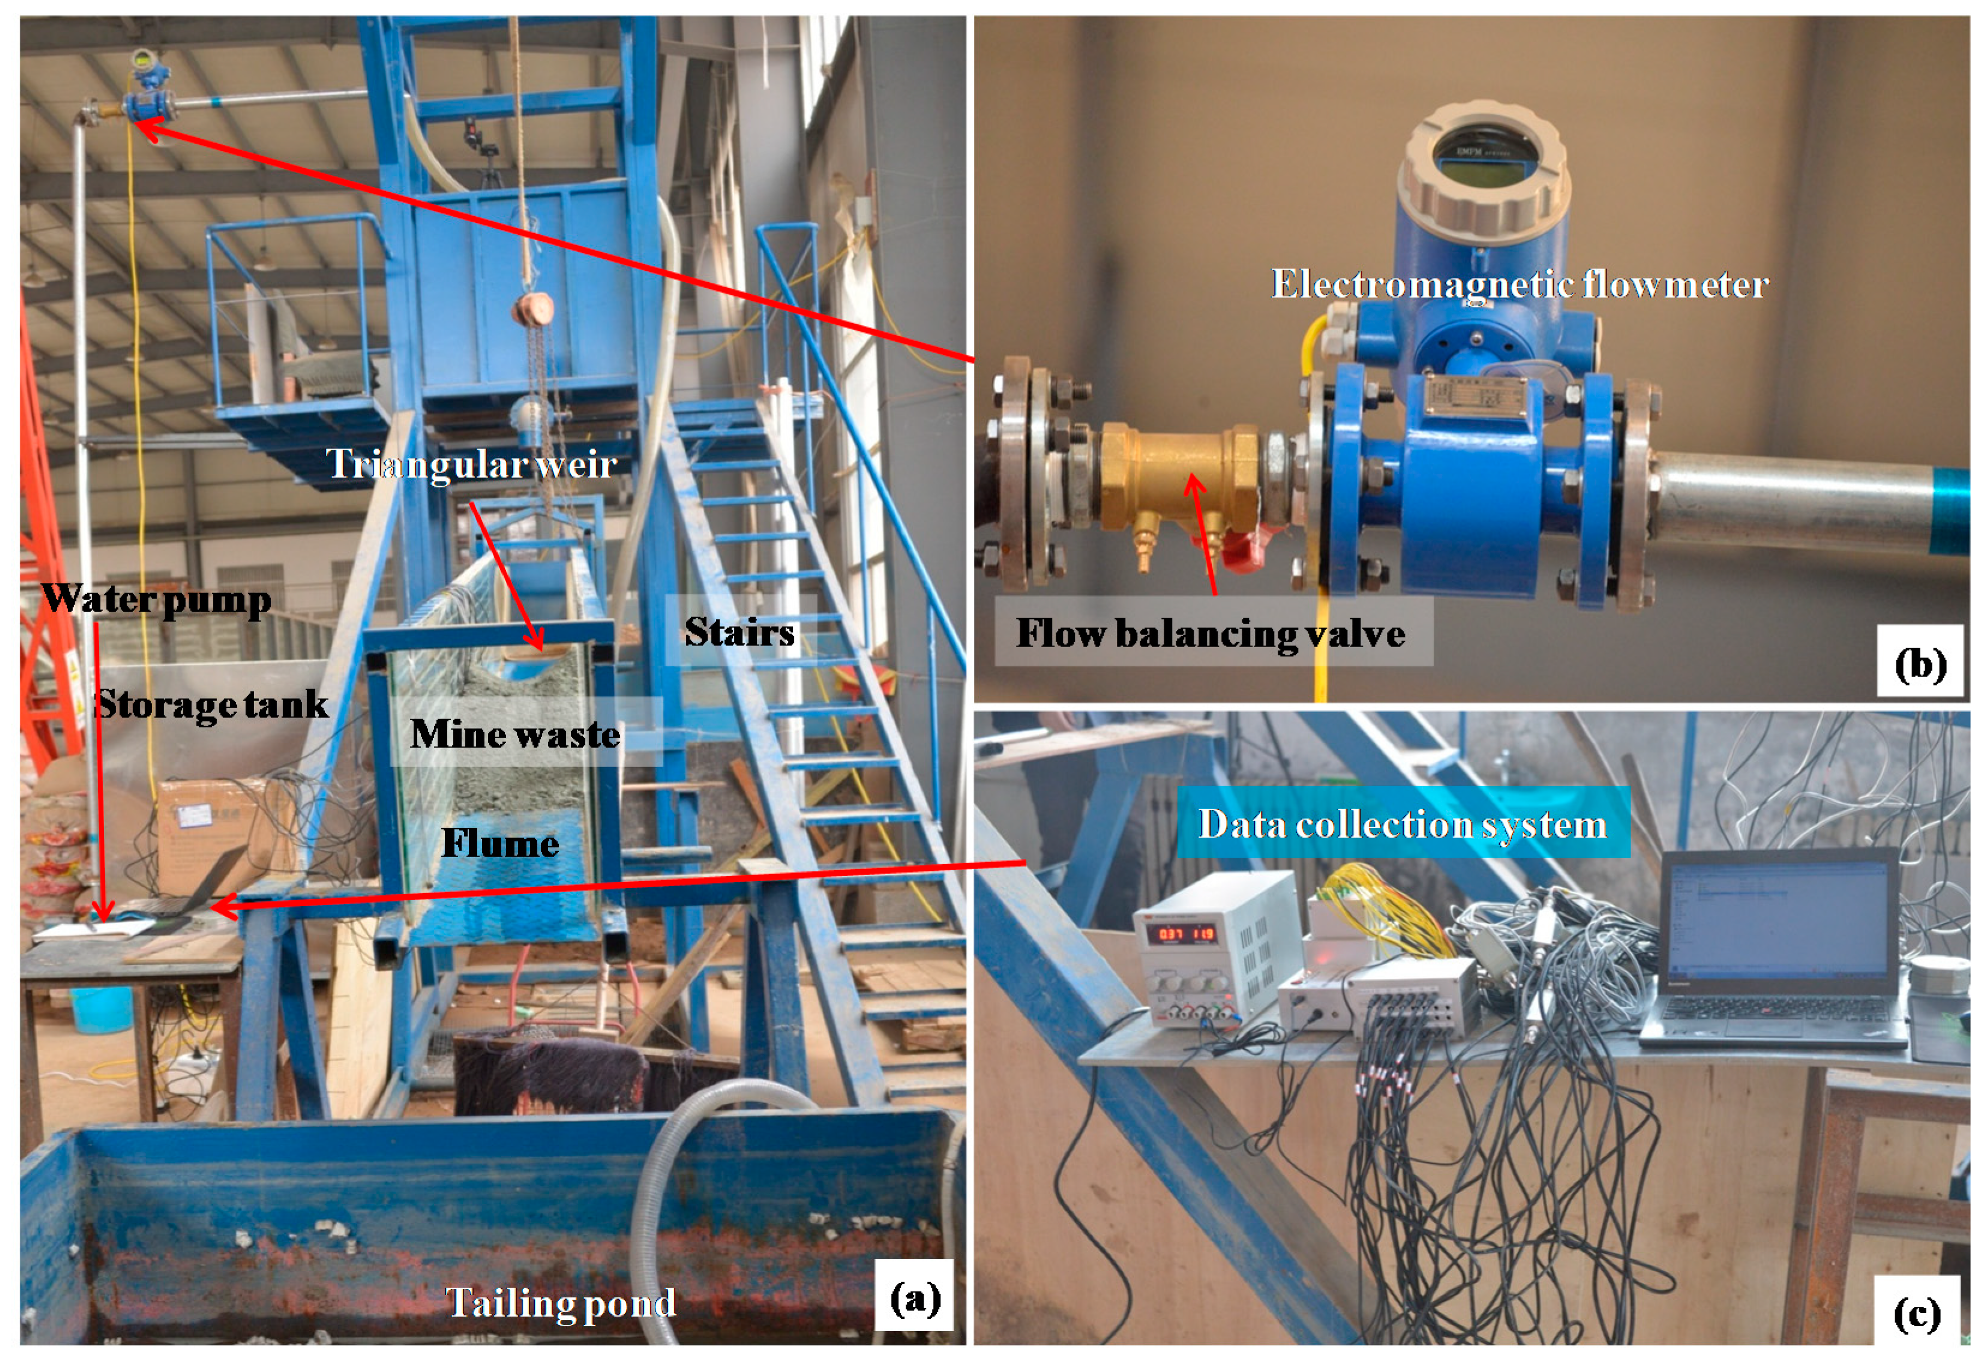
Based on the data obtained from the field investigations, an experimental flume was developed to explore the failure modes and process of the mine waste landslide dams in gullies in the Geological Hazard Simulation Laboratory at Chang’an University [11,24]. Figure 2a presents an overview of the experimental setup. The experimental flume was composed of three sections: A storage tank, a flume, and a tailings pond. The storage tank was 1.3 m in length, 1.3 m in width, and 1.8 m in height. Water was pumped directly into the upper part of the flume using a water pump installed on the left side of the tank. An electromagnetic flowmeter and a flow balancing valve were installed in the middle of the pipeline to control the flow rate of the water with an error rate of less than 5% (Figure 2b). A triangular weir was also installed in the upper part of the flume and was used to adjust flow stability. The flume was 4 m in length, 0.3 m in width, and 0.5 m in height. The bottom of the flume consisted of a rough steel plate with two tempered glass sides, which made it possible to observe the failure process of the dams. The slope of the flume could be adjusted between 6° and 35°.
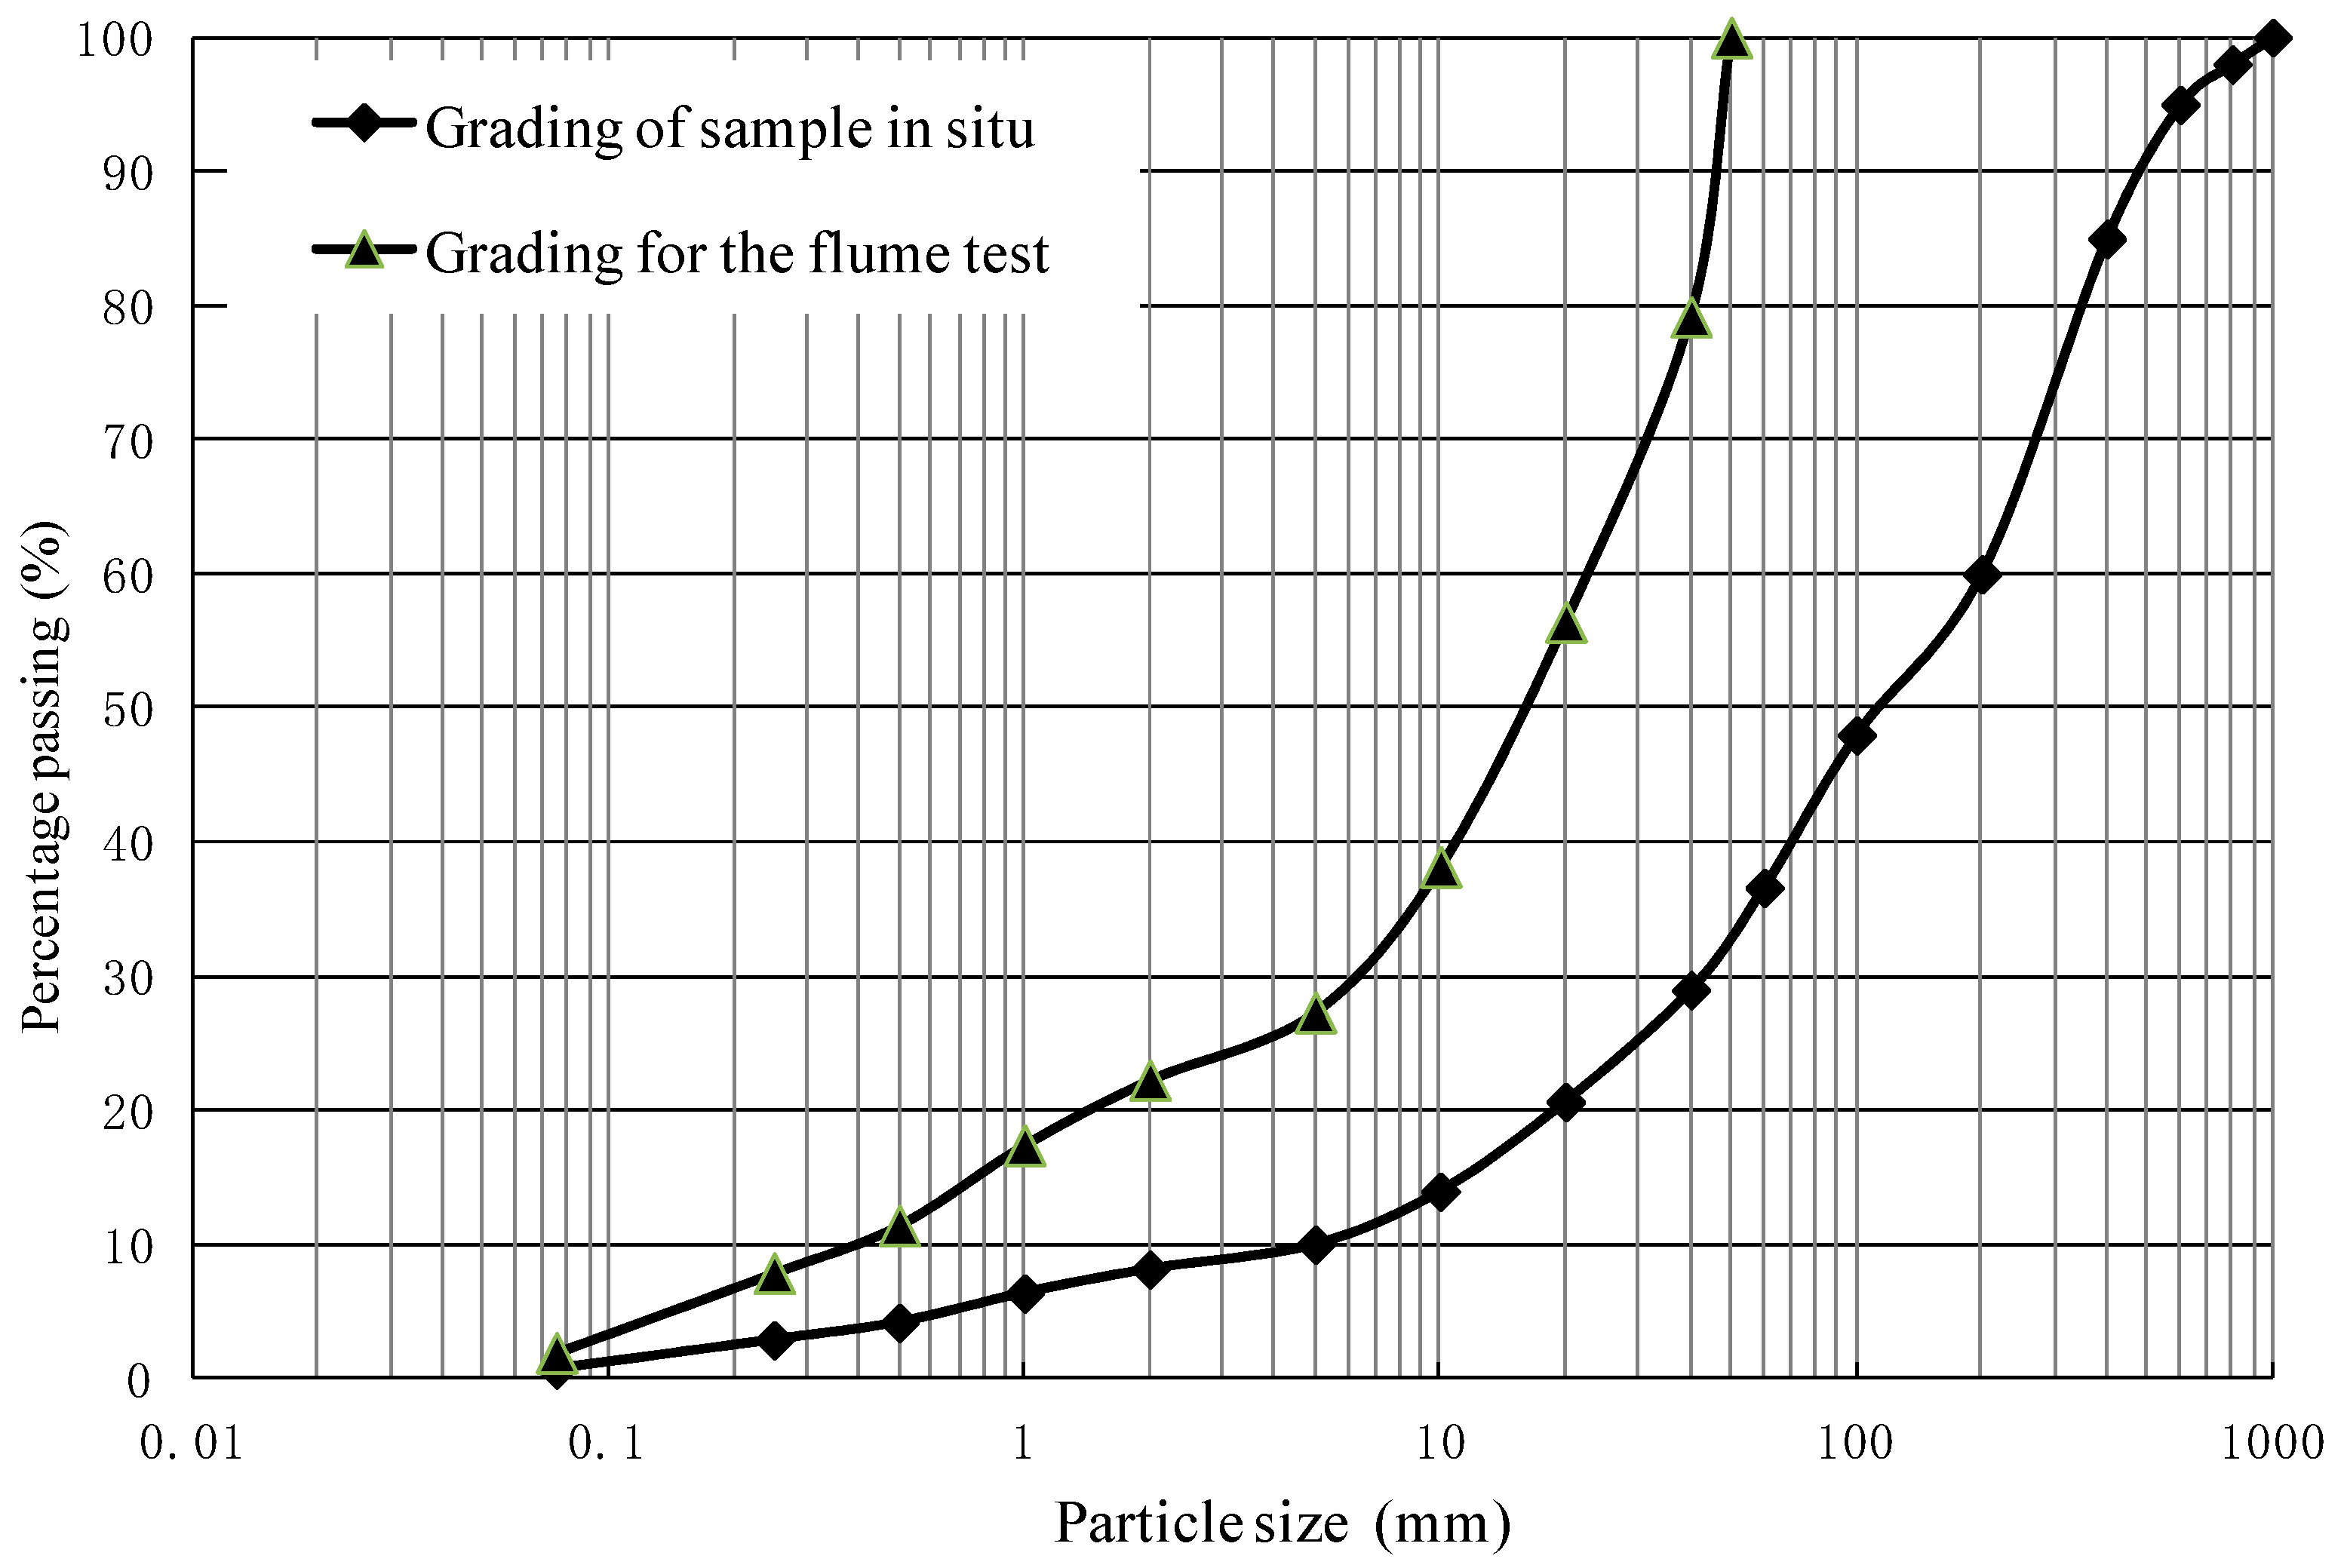
The mine waste material used for our experiments was collected from mine waste dumps in the Daxicha Gully. The grain composition of the in-situ sample is shown in Figure 3. According to the field specific particle size distribution in Figure 3, the maximum particle size was up to 1 m. Obviously, due to the limitations in the hydrodynamic conditions of the experimental setup in our flume tests, larger particles should be excluded. The critical starting velocity for cohesionless sediment is determined by Zhang et al. [25].
where v is the flow velocity (m/s), h is the flow depth (m), γs and γ are the bulk density of the sediment and flow (m3/s), respectively, and D is the particle diameter (m). The velocity of the flow from upstream increases as the flume gradient increases, and the maximum starting particle size of the sediment also increases according to Equation (1). Based on our previous experiments [11,24], the Dmax was around 5 cm when the inflow discharge was 2.5 L/s (which is the maximum inflow discharge in our experiments). Therefore, the >5 cm particles were removed in the material used in the flume test (in Figure 3). The samples were composed of less than 10% fine particles (<2 mm diameter) and more than 65% coarse particles (>50 mm). The particles of mine waste also had low sphericity. Because of these grading characteristics, the mine waste had a high porosity and high permeability.
2.2. Instrumentation and Experimental Testing Procedures
Channel gradient varied significantly along the length of the gullies. In addition, the precipitation in this basin varied seasonally, with heaviest rainfall occurring mainly from July to September (the maximum daily rainfall was 113.4 mm and occurred on 23 July 2010) [10]. Therefore, 13 sets of model experiments with different inflow discharges and rainfall intensities were designed to reproduce the failure processes of the landslide dams in the channel sections. Table 1 lists the parameters for the 13 experiments.
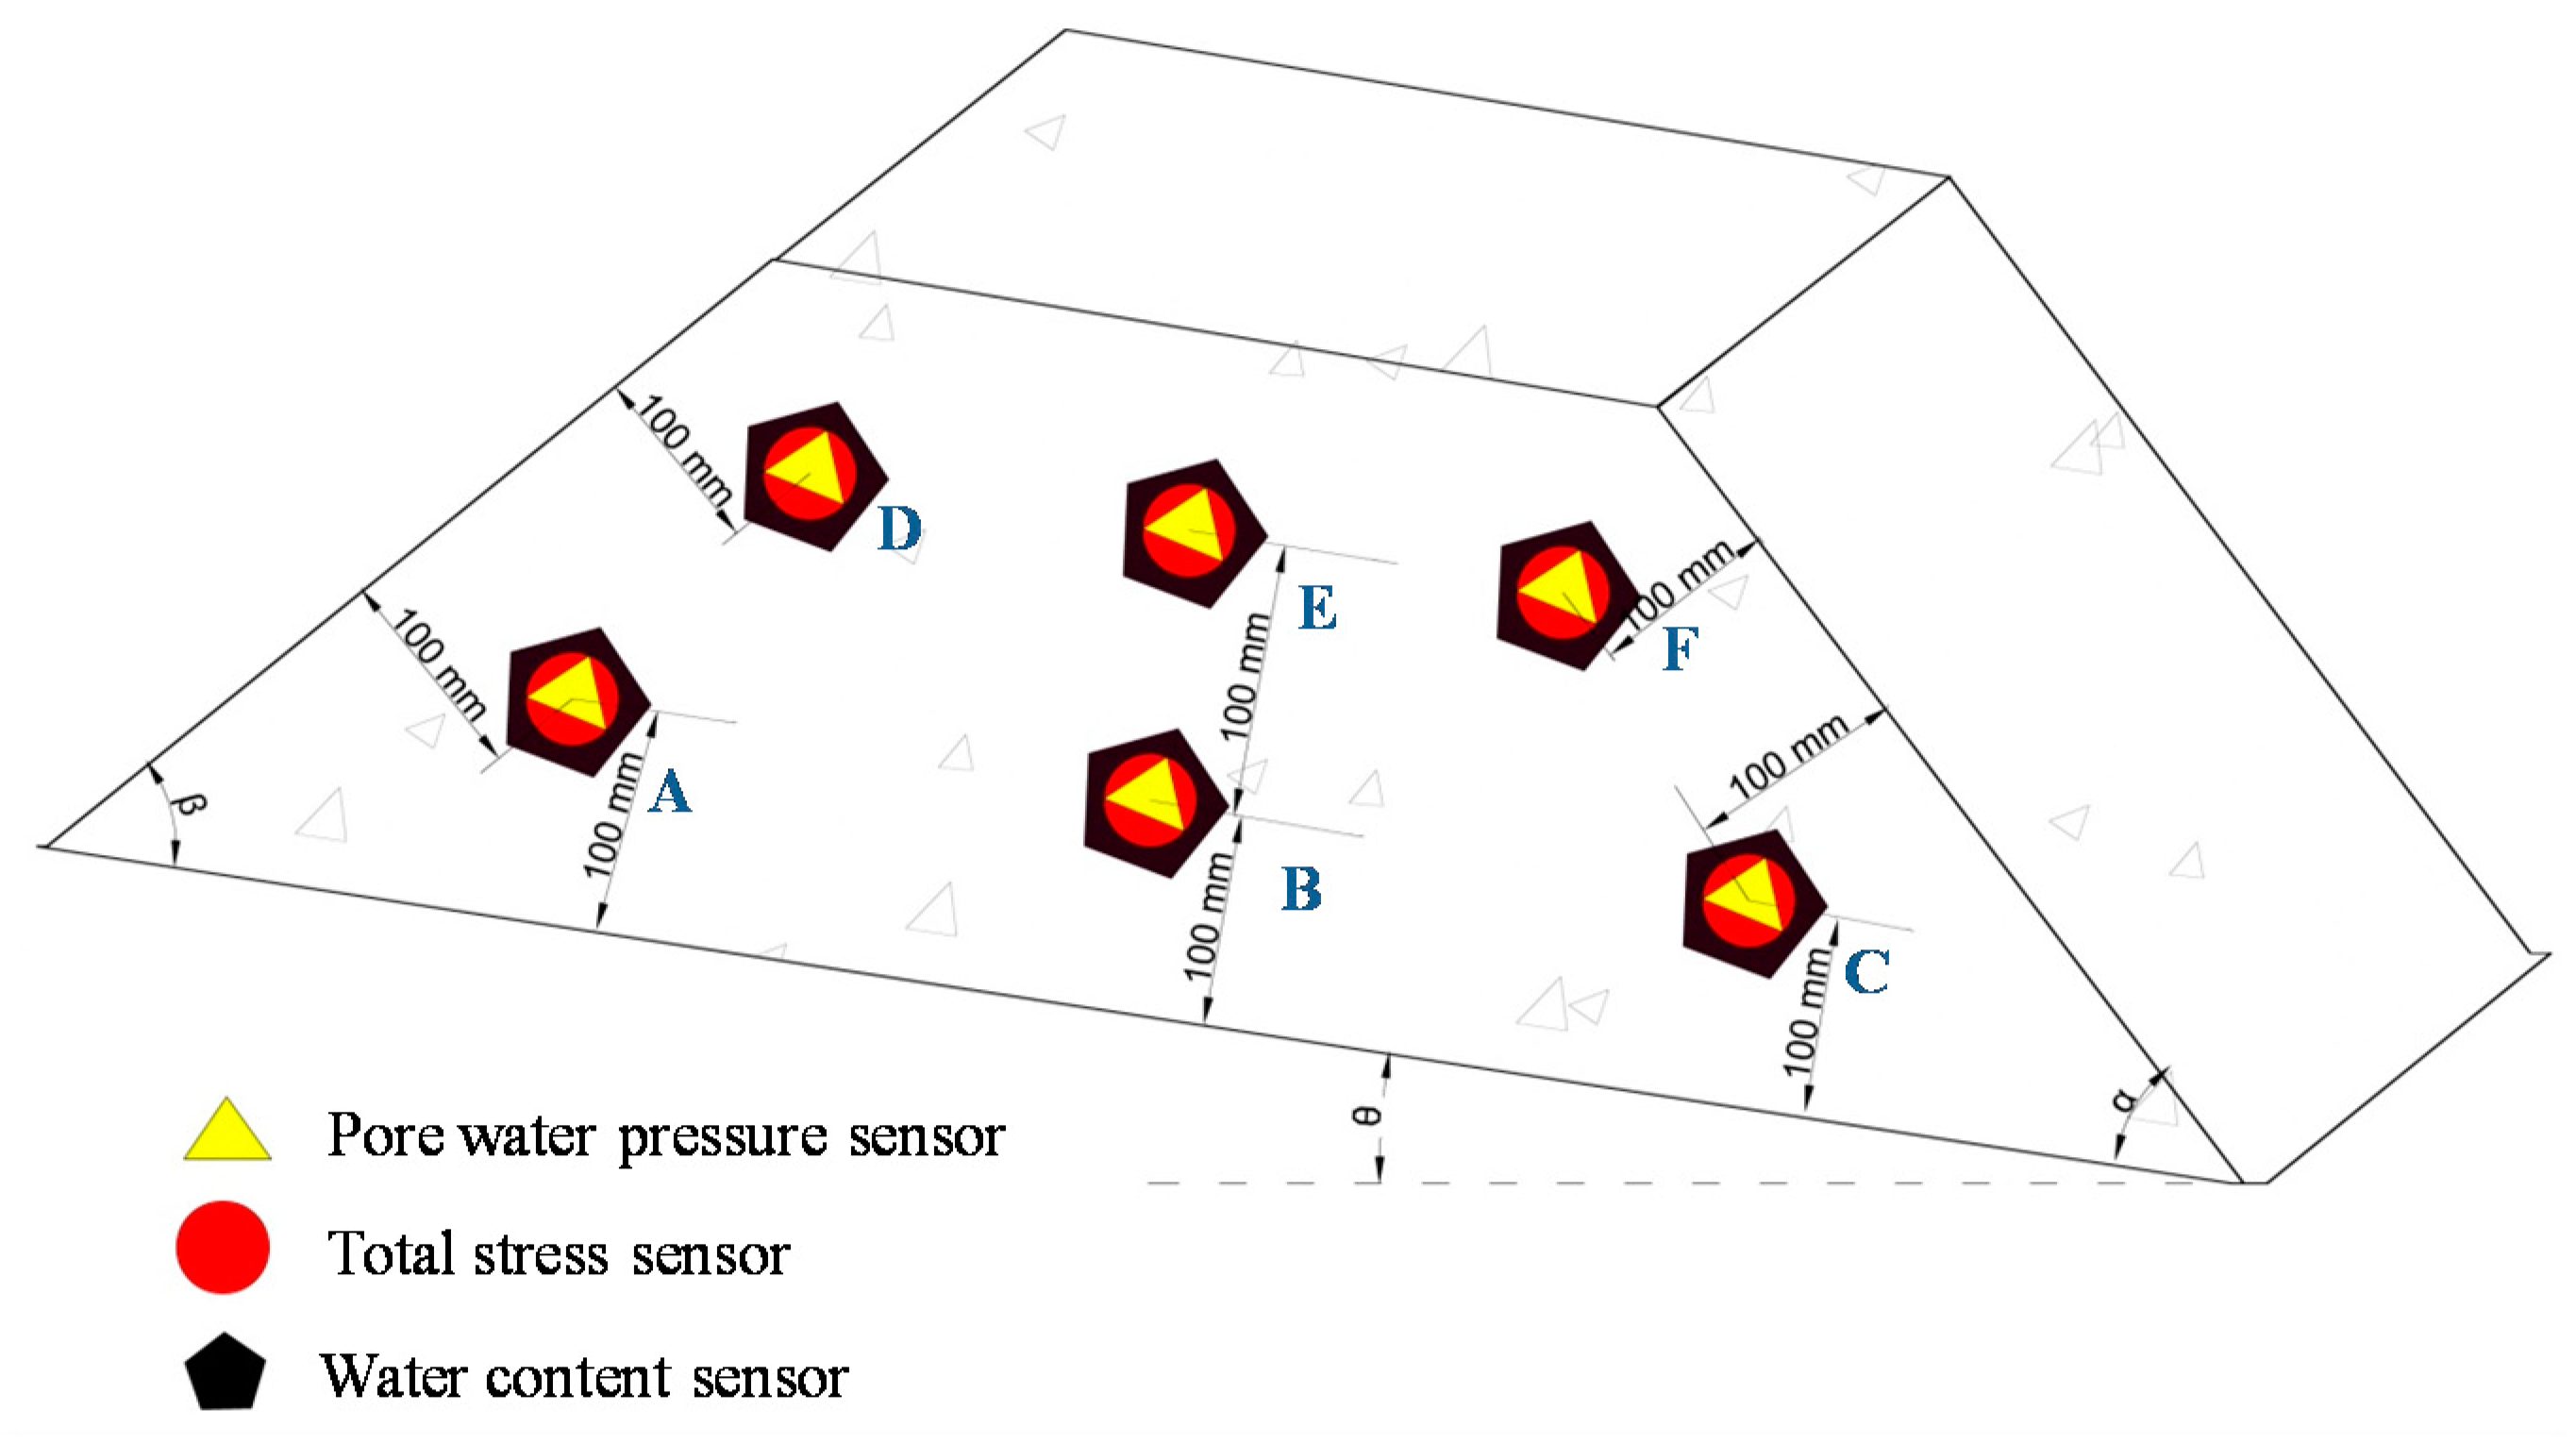
Six monitoring points were arranged inside the landslide dam of each test. Each monitoring point contained one pore water pressure sensor, one total stress sensor, and one water content sensor. The positions and serial numbers of the monitoring points are shown in Figure 4. All sensors have their instructions of factory calibrations, which give us the conversion formula correspondingly. However, the general calibration may not be applicable for our experiments, and we performed laboratory calibration before using them. The soil samples were prepared with soil volumetric moisture contents of 5%, 7%, 10%, 15%, 17%, 27%, and 36%, and then the water content sensor was placed in these samples to calibrate. The pore water pressure sensors were calibrated in a water column, which was 1.5 m in height and marked with graduations. The total stress sensor was loaded and unloaded cyclically on a set of calibration devices to obtain the relationship between the output electrical signal (V) and the surface vertical stress (kPa). Table 1 shows the technical specifications of sensors. Three cameras were used to record the erosion and transport processes of the mine waste from the front side, the right sides, and the top of the setup. The flume gradient and inflow rates were adjusted before each model test according to Table 2. During each test, cameras were used to record the experimental process, and the data acquisition instrumentation was turned on to record the time-varying values from the sensors. In addition, the depth of the outburst flow was recorded by a metric ruler placed downstream from the landslide dam, and the flow velocities were determined using the float method.
3. Experimental Results
Previous studies have shown that three failure mechanisms typically caused the instability and failure of landslide dams: Overtopping, piping, and slope failure [13]. Among them, overtopping is a primary mechanism of landslide dam failure which occurrs after the overfilling of the dammed reservoir [8,13]; piping is a kind of internal erosion caused by the migration of particles to free exits (or into coarse openings) or by the uncontrolled saturation and seepage forces [26]; slope failure can easily occur when a landslide dam has steep upstream and downstream faces, as well as high pore-water [13]. By analyzing the 13 experimental tests, we found that the failure processes of landslide dams were extremely complex. Almost all of the failure processes of the landslide dams in our experiments were the result of multiple failure modes. Three different failure modes were identified (in Table 1) from analyses of the failure processes of the landslide dams in our experiments.
3.1. Dam Failure Due to Piping, Overtopping, and Erosion
The failures in tests 2, 3, and 4 were the result of piping, overtopping, and erosion. An analysis of test Number 3 indicates that landslide dam failure processes occurred with continuous inflow from upstream, and the water level gradually increased, resulting in high pore water pressure and seepage (Figure 5a). The continuous seepage through the landslide dam formed a complete seepage path, causing the piping effect (Figure 5b). Subsequently, a small landslide occurred on the downstream surface of the dam, reducing the overall height of the dam (Figure 5c), which was followed by dam overtopping (Figure 5d). Then, lateral and headward erosion began to occur throughout the dam (Figure 5e). Finally, the dam material was quickly eroded and transported by an outburst flood (or debris flow) (Figure 5f).
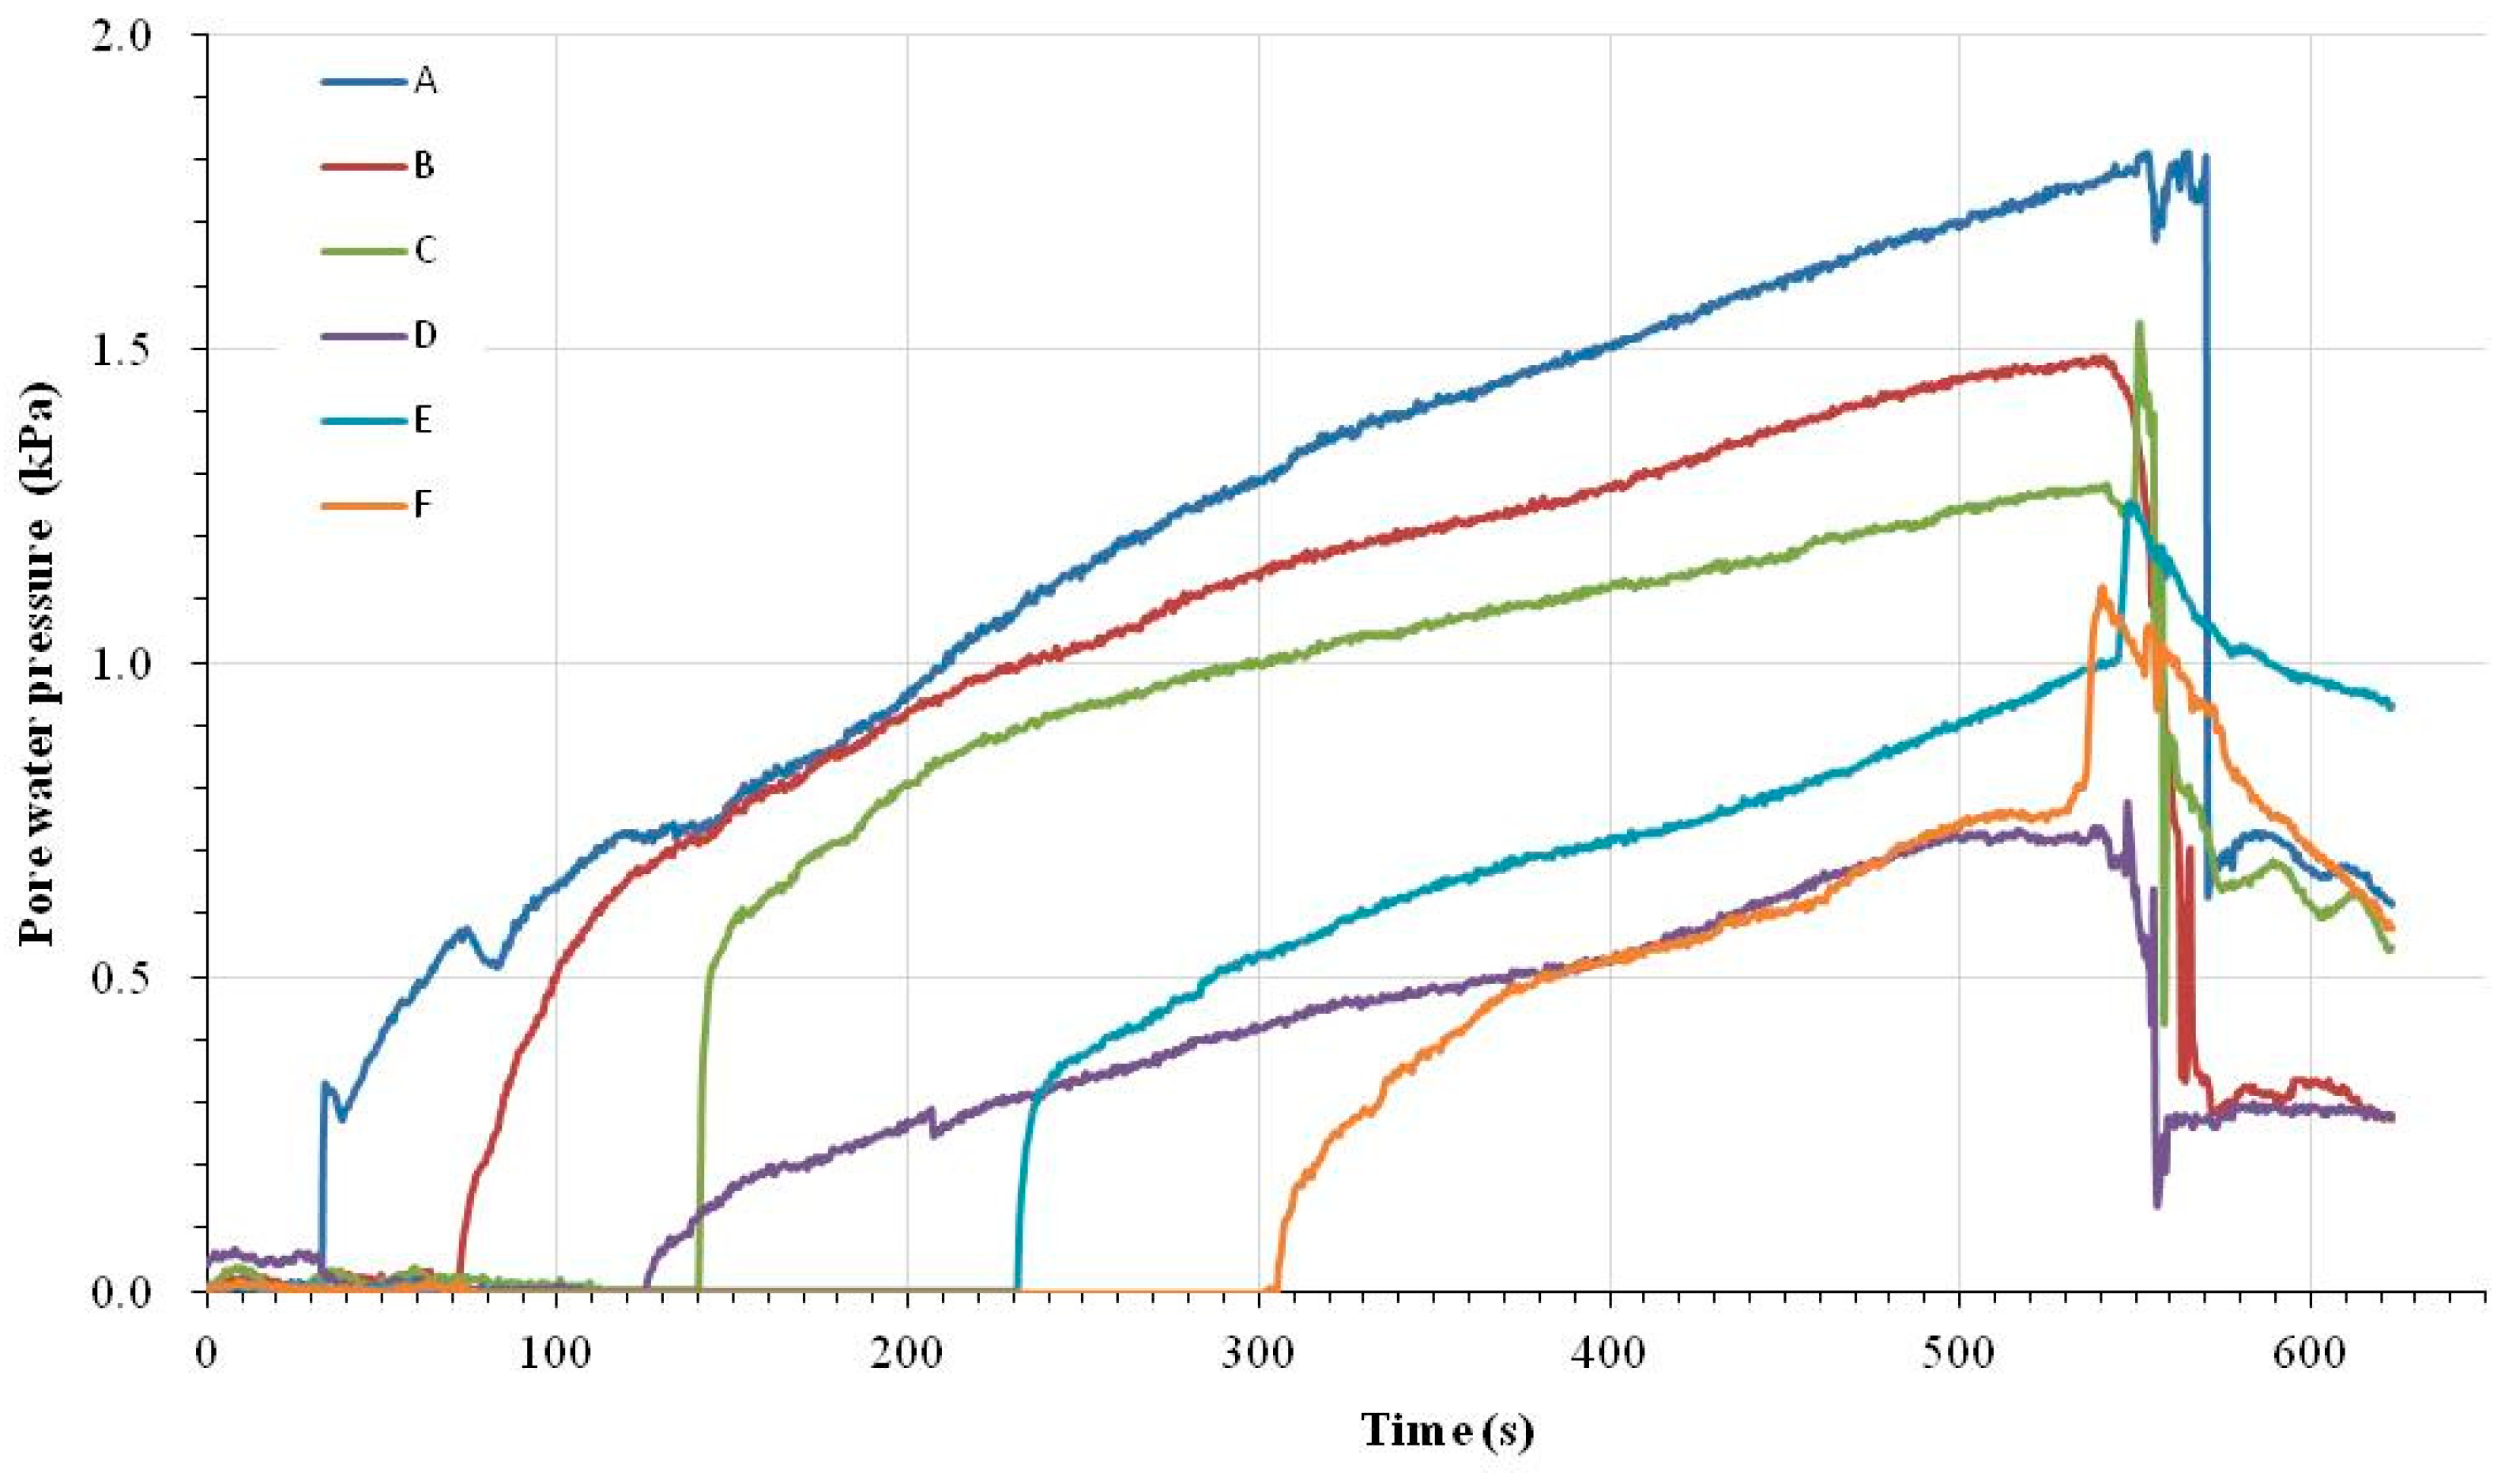
During the experiment, the total stress, pore water pressure, and water content inside the dam were recorded by the sensors. Figure 6 displays the variation in the pore water pressure at the six sensor locations (i.e., observation points). In Figure 6, the pore water pressure at sensors increases in the sequence A-B-D-C-E-F, which indicates that the water level in the dam slowly increased, and the initial water flow and infiltration were mainly horizontal (the pressure increased at sensors A and B first). As the water level gradually increased, the pore water pressure in the upper part of the dam began to increase (the pressure at sensor D increased). Then, the pore water pressure at sensor C began to increase, which indicates that a complete seepage path in the lower layer had formed. Finally, the pore water pressure increased at sensors E and F. In addition, the pore water pressure dramatically changed at about t = 540 s at each of the six sensor locations shown in Figure 6, following a pressure change sequence of F-E-D-C-B-A. The variation in the pore water pressure during the experiment indicates that local failure occurred at t = 540 s, which is consistent with the failure process shown in Figure 5.
The transient variations in the water content, pore water pressure, and total stress at point B when Q0 was 0.3 L/s and θ was 7° are shown in Figure 7. The failure process of the landslide dam can be divided into four stages: In stage I, the water level gradually increased as the inflow discharge filled the dam reservoir. However, the water content and pore water pressure were unchanged because the water did not penetrate to observation point B in this stage. The total stress changed slightly due to the slow deformation of the landslide dam. In stage II, water penetrated observation point B, which indicates that the water content rapidly increased until the pore space of the landslide dam was saturated. The pore water pressure and total stress also increased significantly. In stage III, as the water level in the reservoir gradually increased, a complete seepage path formed, and the pore water pressure continually increased, resulting in a decrease in the total stress. In stage IV, a small landslide occurred on the downstream surface of the dam, and the overall height of the dam was reduced, which was followed by dam overtopping. Finally, when the dam rapidly failed, several sensors were exposed to the upstream flow, and the acquired data had no reference value.
This failure mode had a longer impounding time because of the small inflow discharge, which provided sufficient time for seepage. In addition, the loose, porous mine waste allowed for the formation of a complete seepage path, which determined the failure mode and process.
3.2. Dam Failure Due to Overtopping and Soil Collapse
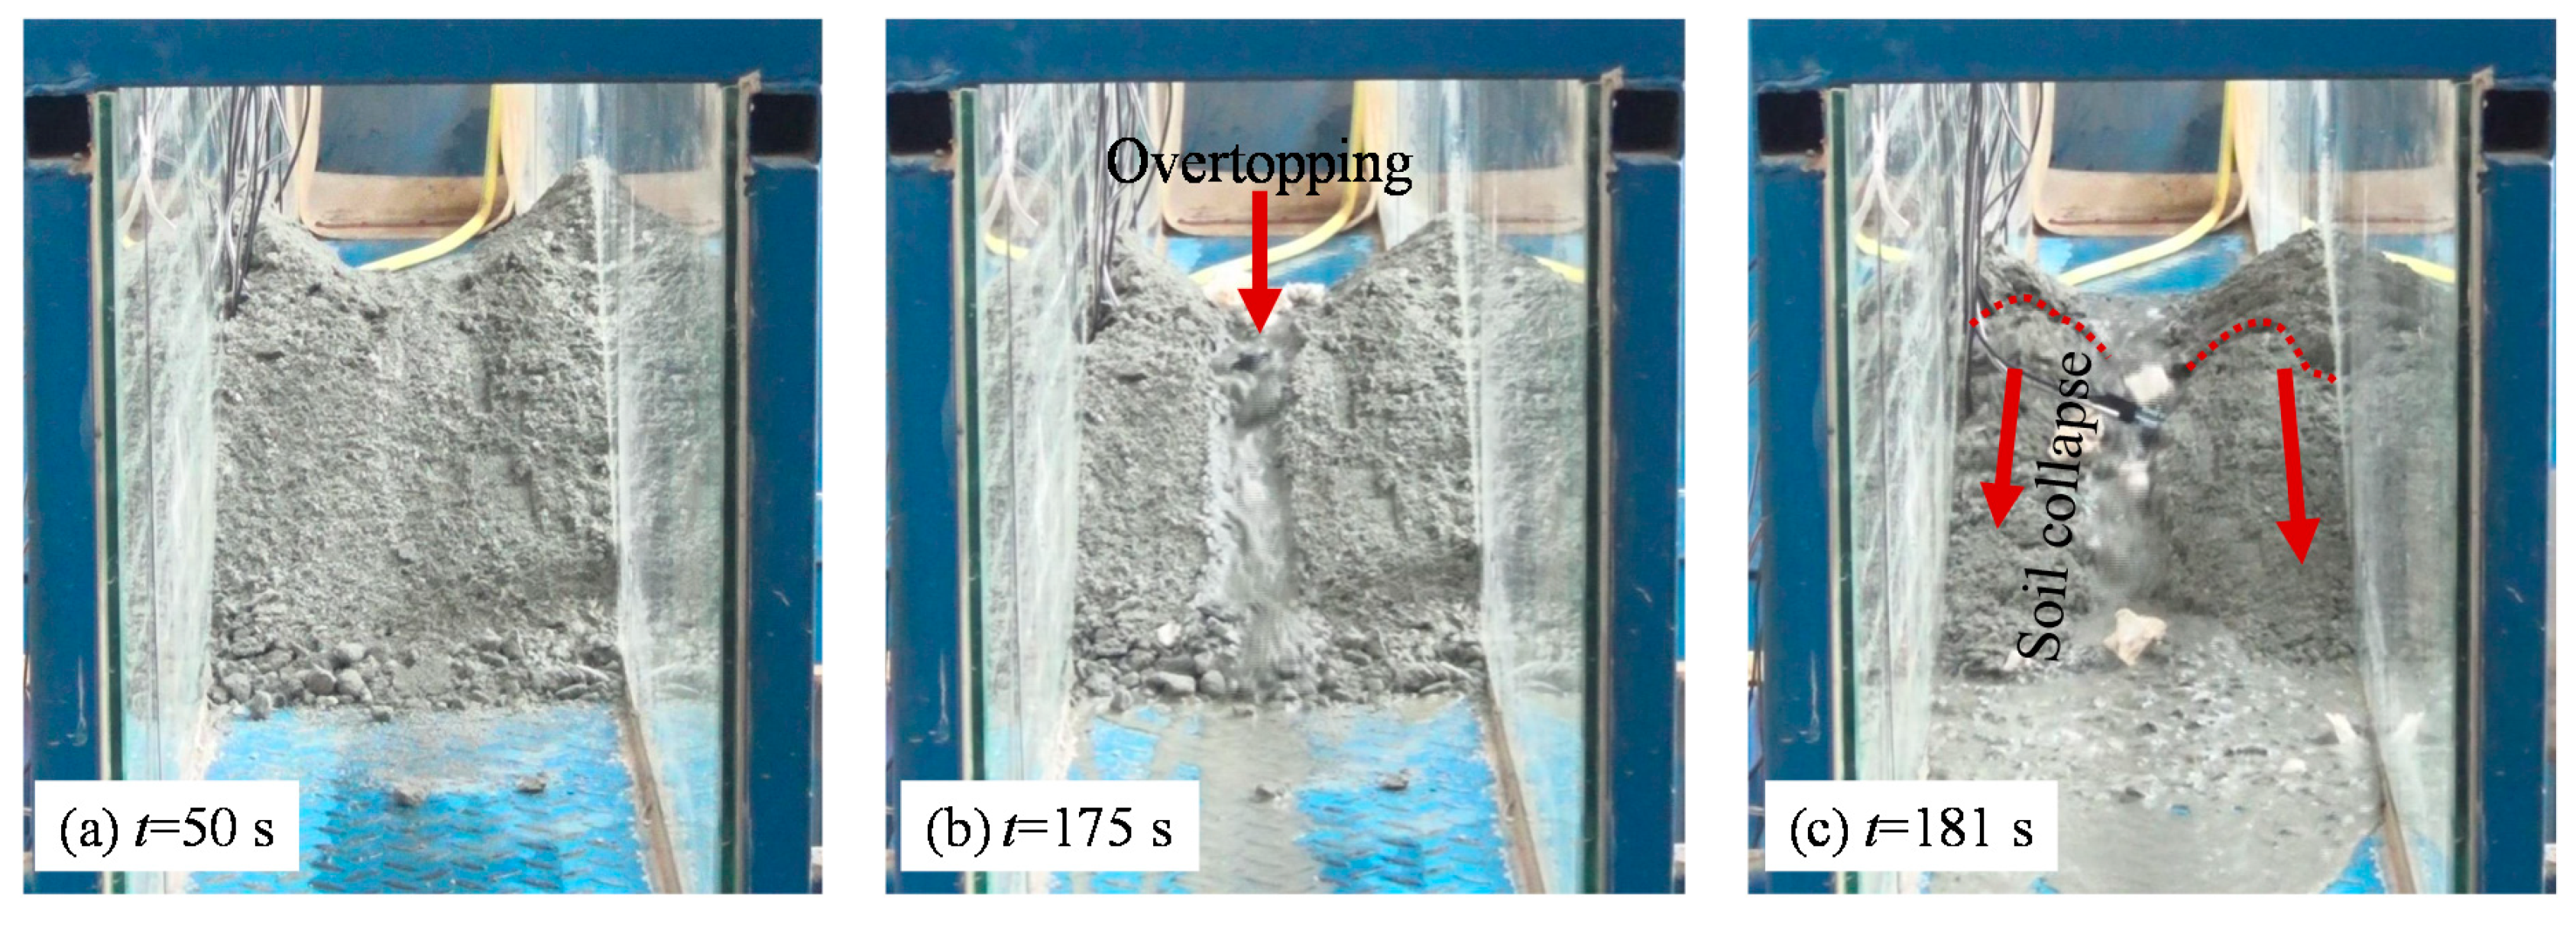
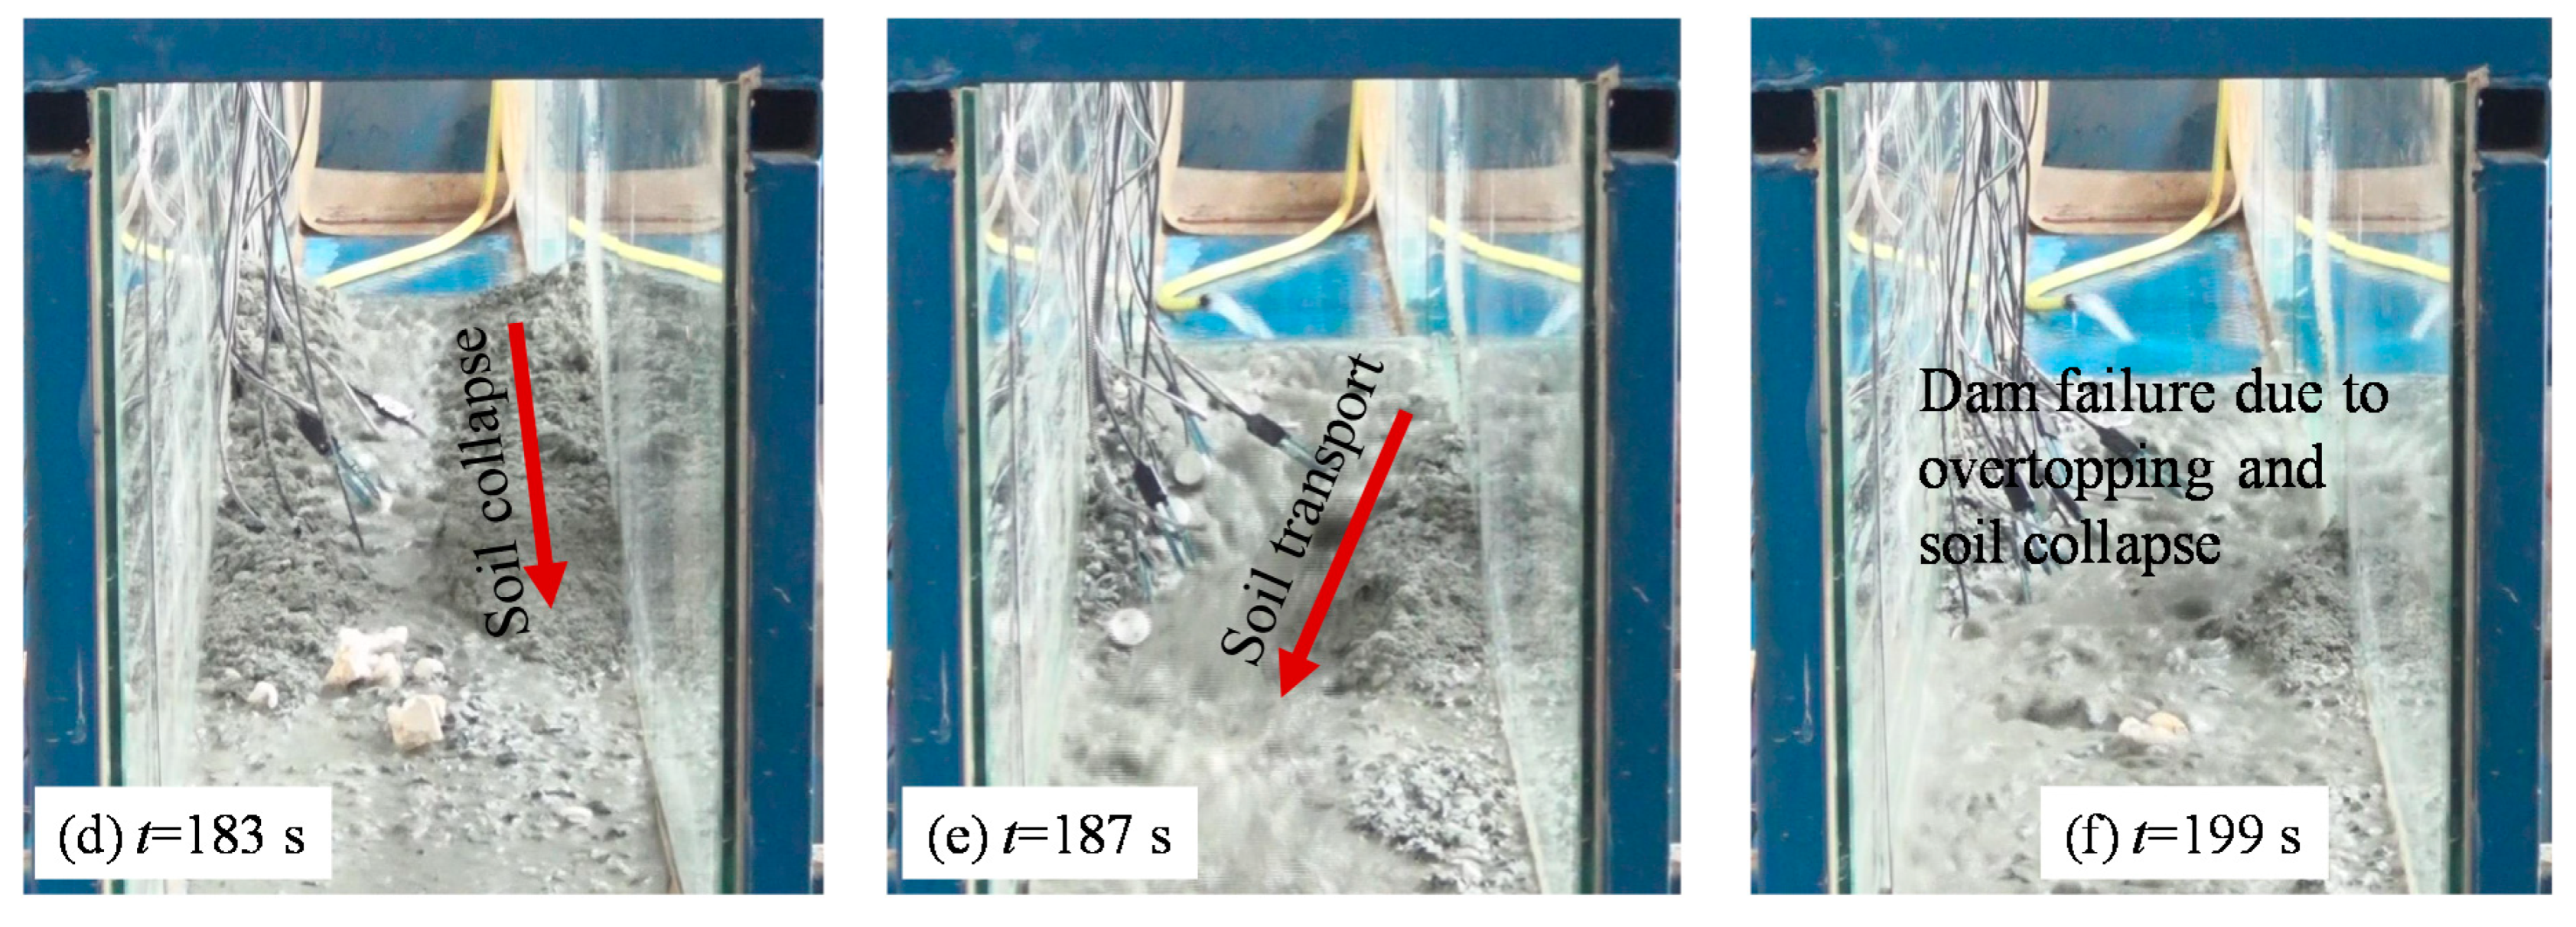
Dam failure due to overtopping and soil collapse occurred in experiment Number 5, and the failure processes involved the following. The water level upstream of the dam gradually increased, and a high water head initially formed, which led to seepage through the landslide dam (Figure 8a). However, a complete seepage channel had not formed due to the impediment caused by the fine particles. The complete seepage channel had still not formed by the time the dam reservoir was filled and began to overtop (Figure 8b). The dam became unstable, resulting in sudden soil collapse (Figure 8c). While the entire dam slid downstream (Figure 8d), the mine waste was eroded and rapidly transported by an outburst flood (or debris flow) (Figure 8e) until the end of the test (Figure 8f).
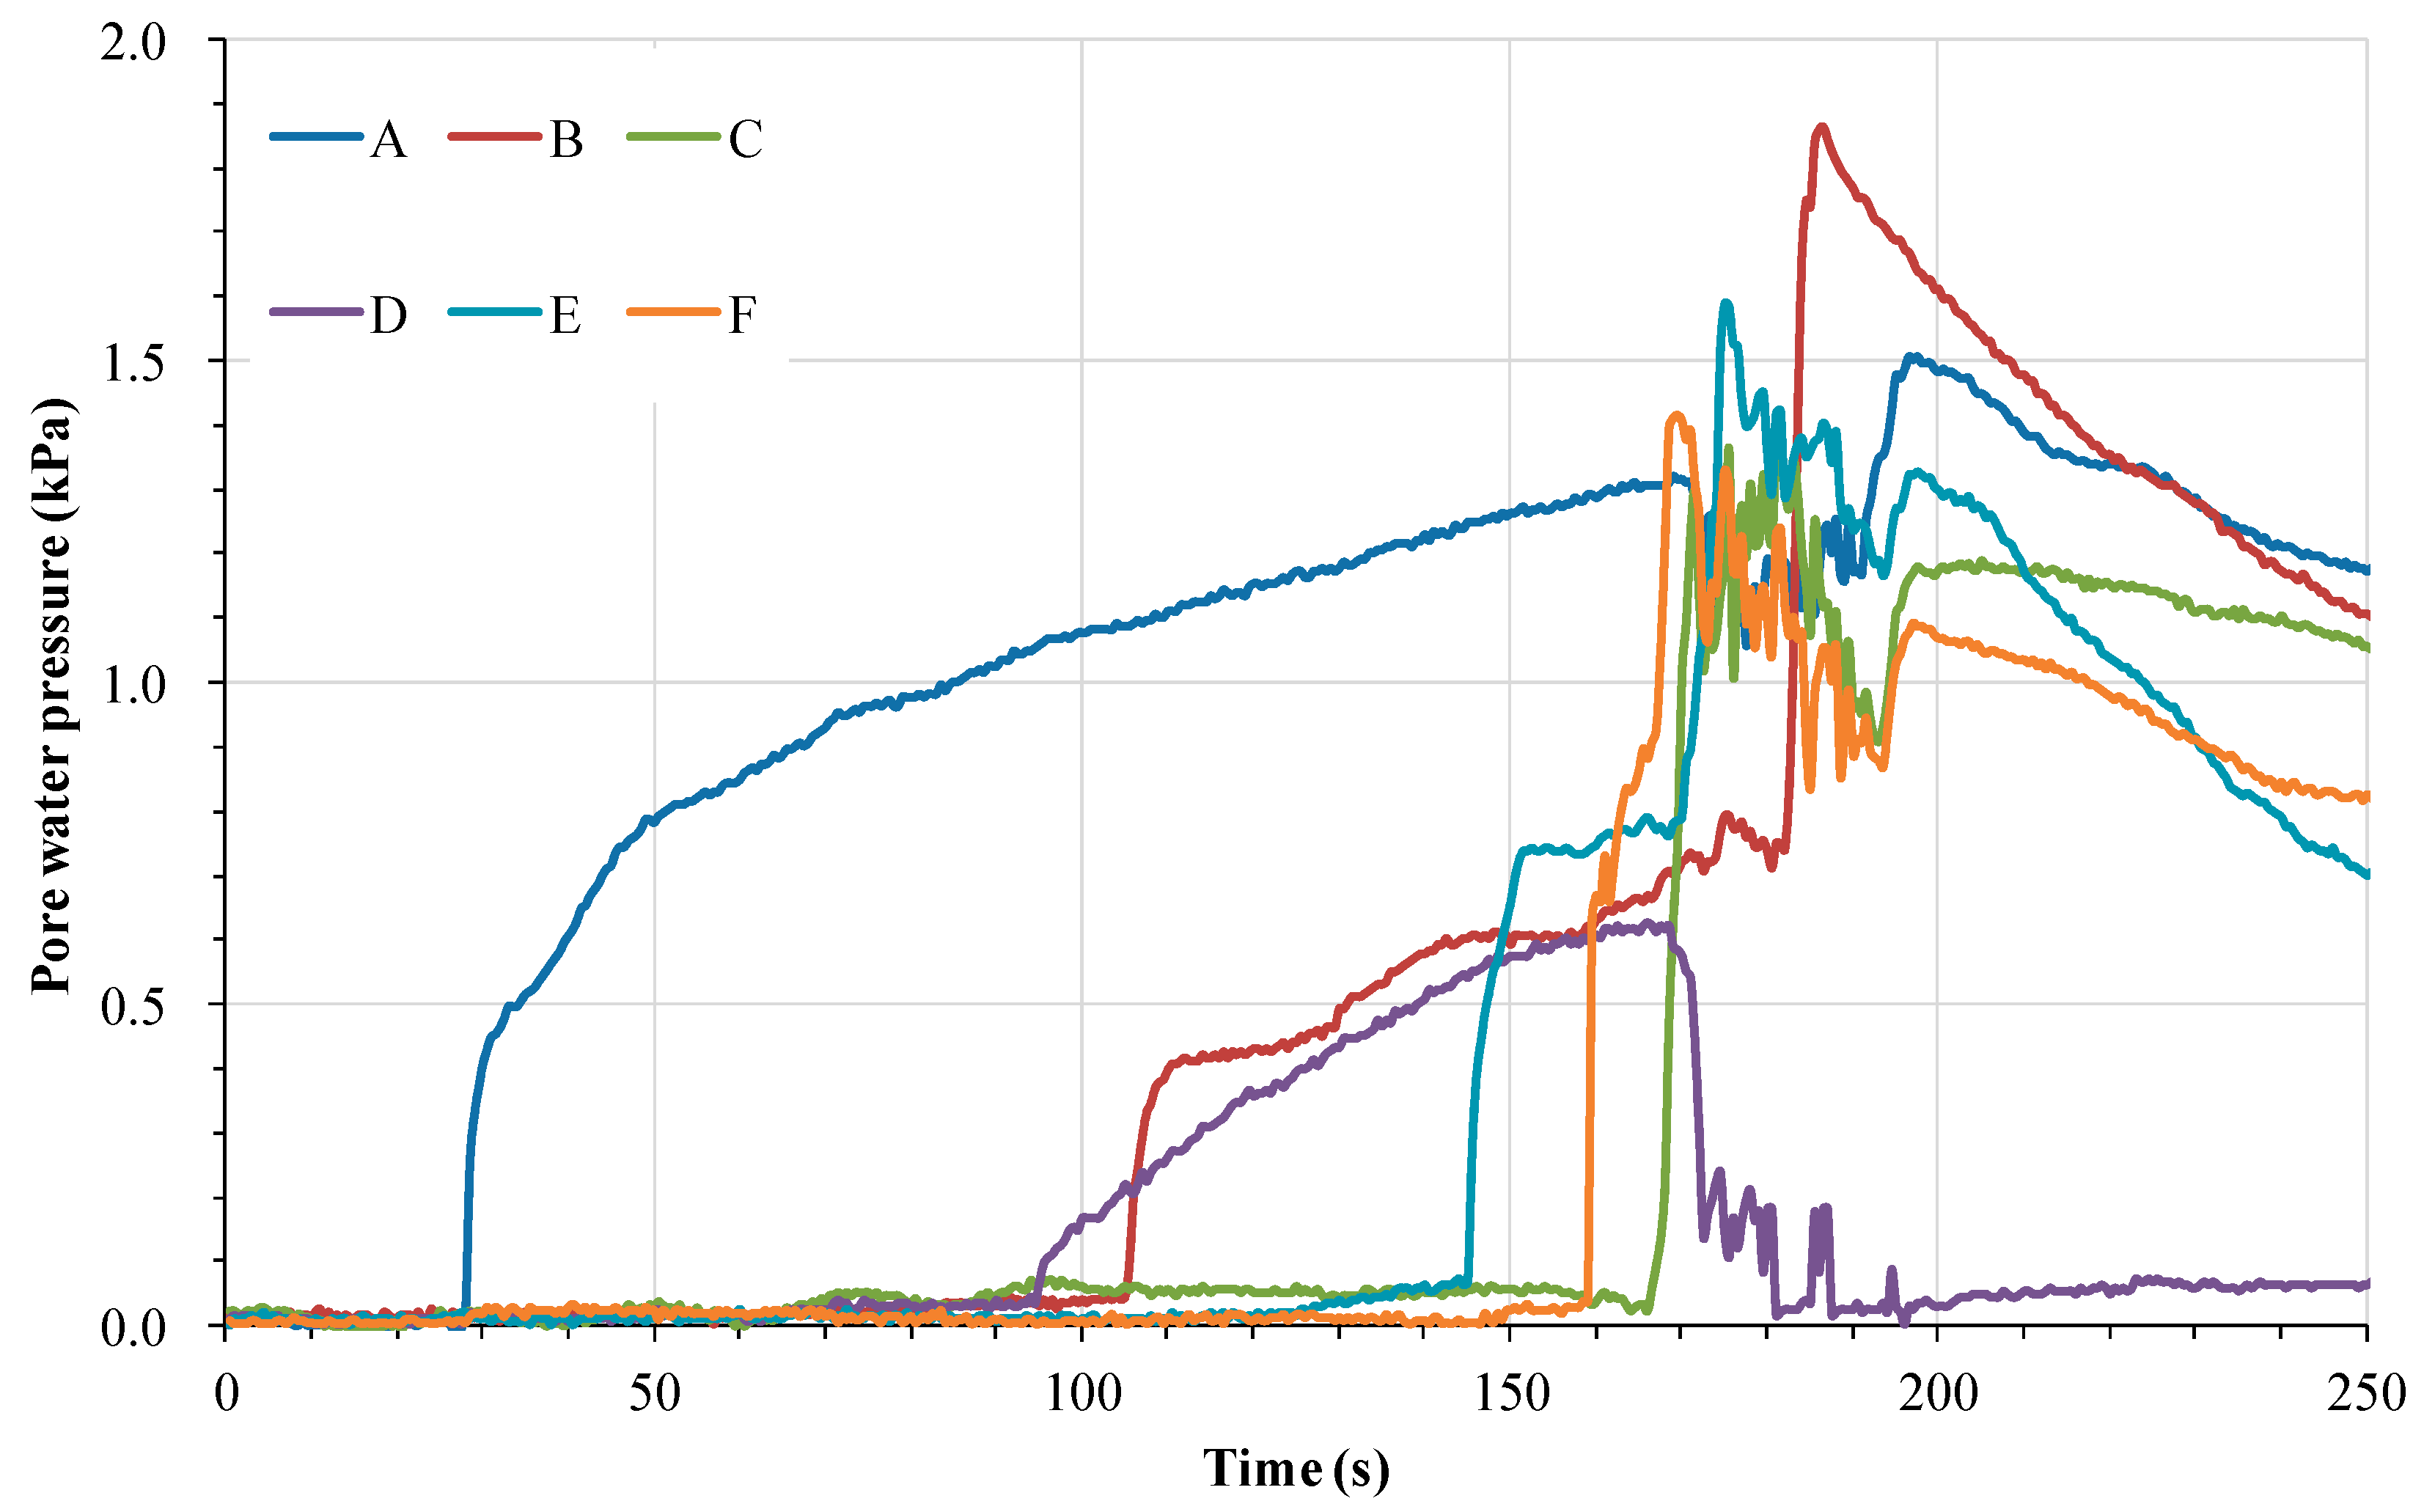
Based on our analysis of the variation in pore water pressure with time during the experiment, the order of the pore water pressure variation was A-D-B-E-F-C. Based on the experimental process shown in Figure 9, we conclude that the pore water pressure at observation point D increased before that at point B because the fine particles blocked the seepage path. Then, the pore water pressure at observation point E substantially increased. The pore water pressure at observation point F increased before the pressure at observation point C, which indicates that a complete seepage channel had not formed when the dam failed.
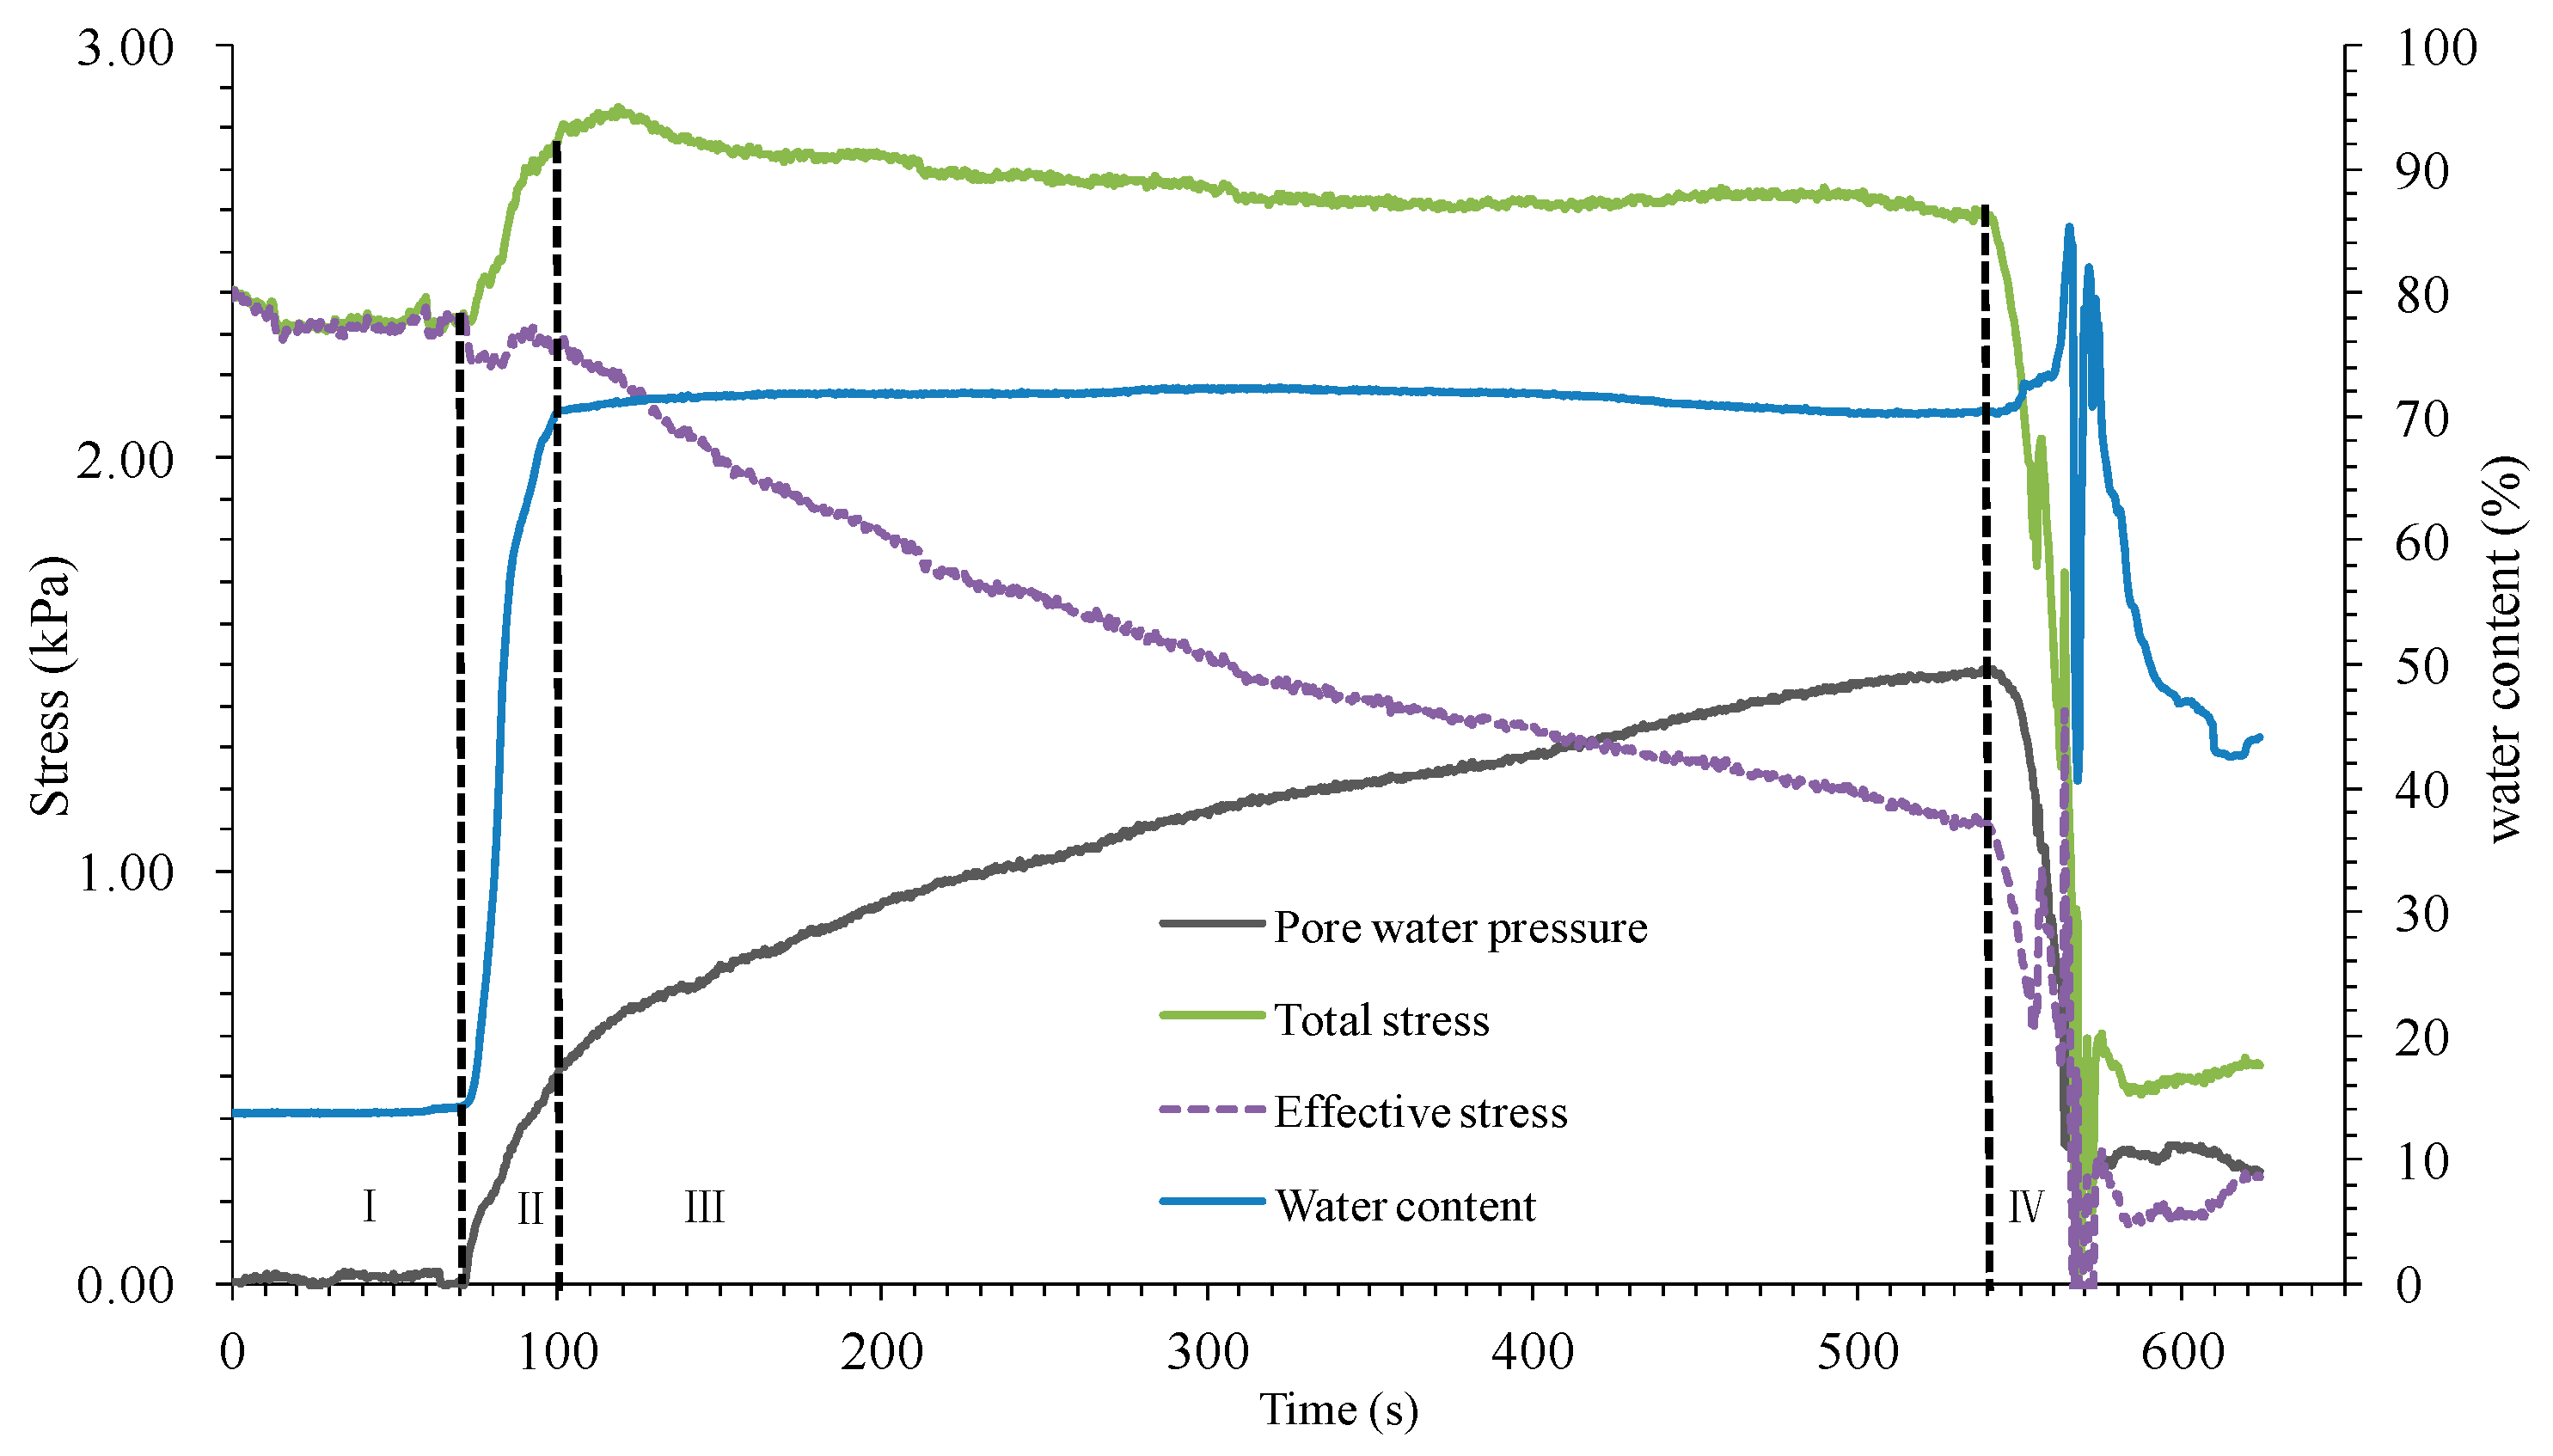
The transient variations in water content, pore water pressure, and total pressure at point B when Q0 was 0.3 L/s and θ was 9° are shown in Figure 10. The failure process of the landslide dam can be divided into four stages. In stage I, the water level gradually increased as the inflow discharge began to fill the dam reservoir. However, the water content and pore water pressure remained unchanged because the water did not penetrate to observation point B in this stage. At the same time, the total stress changed slightly due to the slow deformation of the landslide dam. In stage II, the water penetrated to observation point B, and the pore water pressure and total stress increased. The water content rapidly increased until it was saturated. In stage III, the landslide dam deformed due to overtopping, causing an instantaneous increase in pore water pressure. As the effective stress decreased, the soil collapsed, and the entire dam slid downstream (Figure 8c). In stage IV, the data acquired from the sensors had no reference value because the dam had failed and several of the sensors were exposed to the upstream flow.
The characteristics of this failure mode are as follows: The seepage time was longer due to a small inflow from upstream, so more time was required for impounding. However, during the seepage, the completed seepage path could not be formed because the path was blocked by the migration of fine-grained particles. This resulted in a higher pore water pressure inside the landslide dam and a sharp decrease in the effective stress before overtopping occurred. Finally, because of the additional shear stress generated by the overflow, the soil suddenly collapsed, and the entire dam slid downstream.
3.3. Dam Failure Due to Overtopping and Erosion
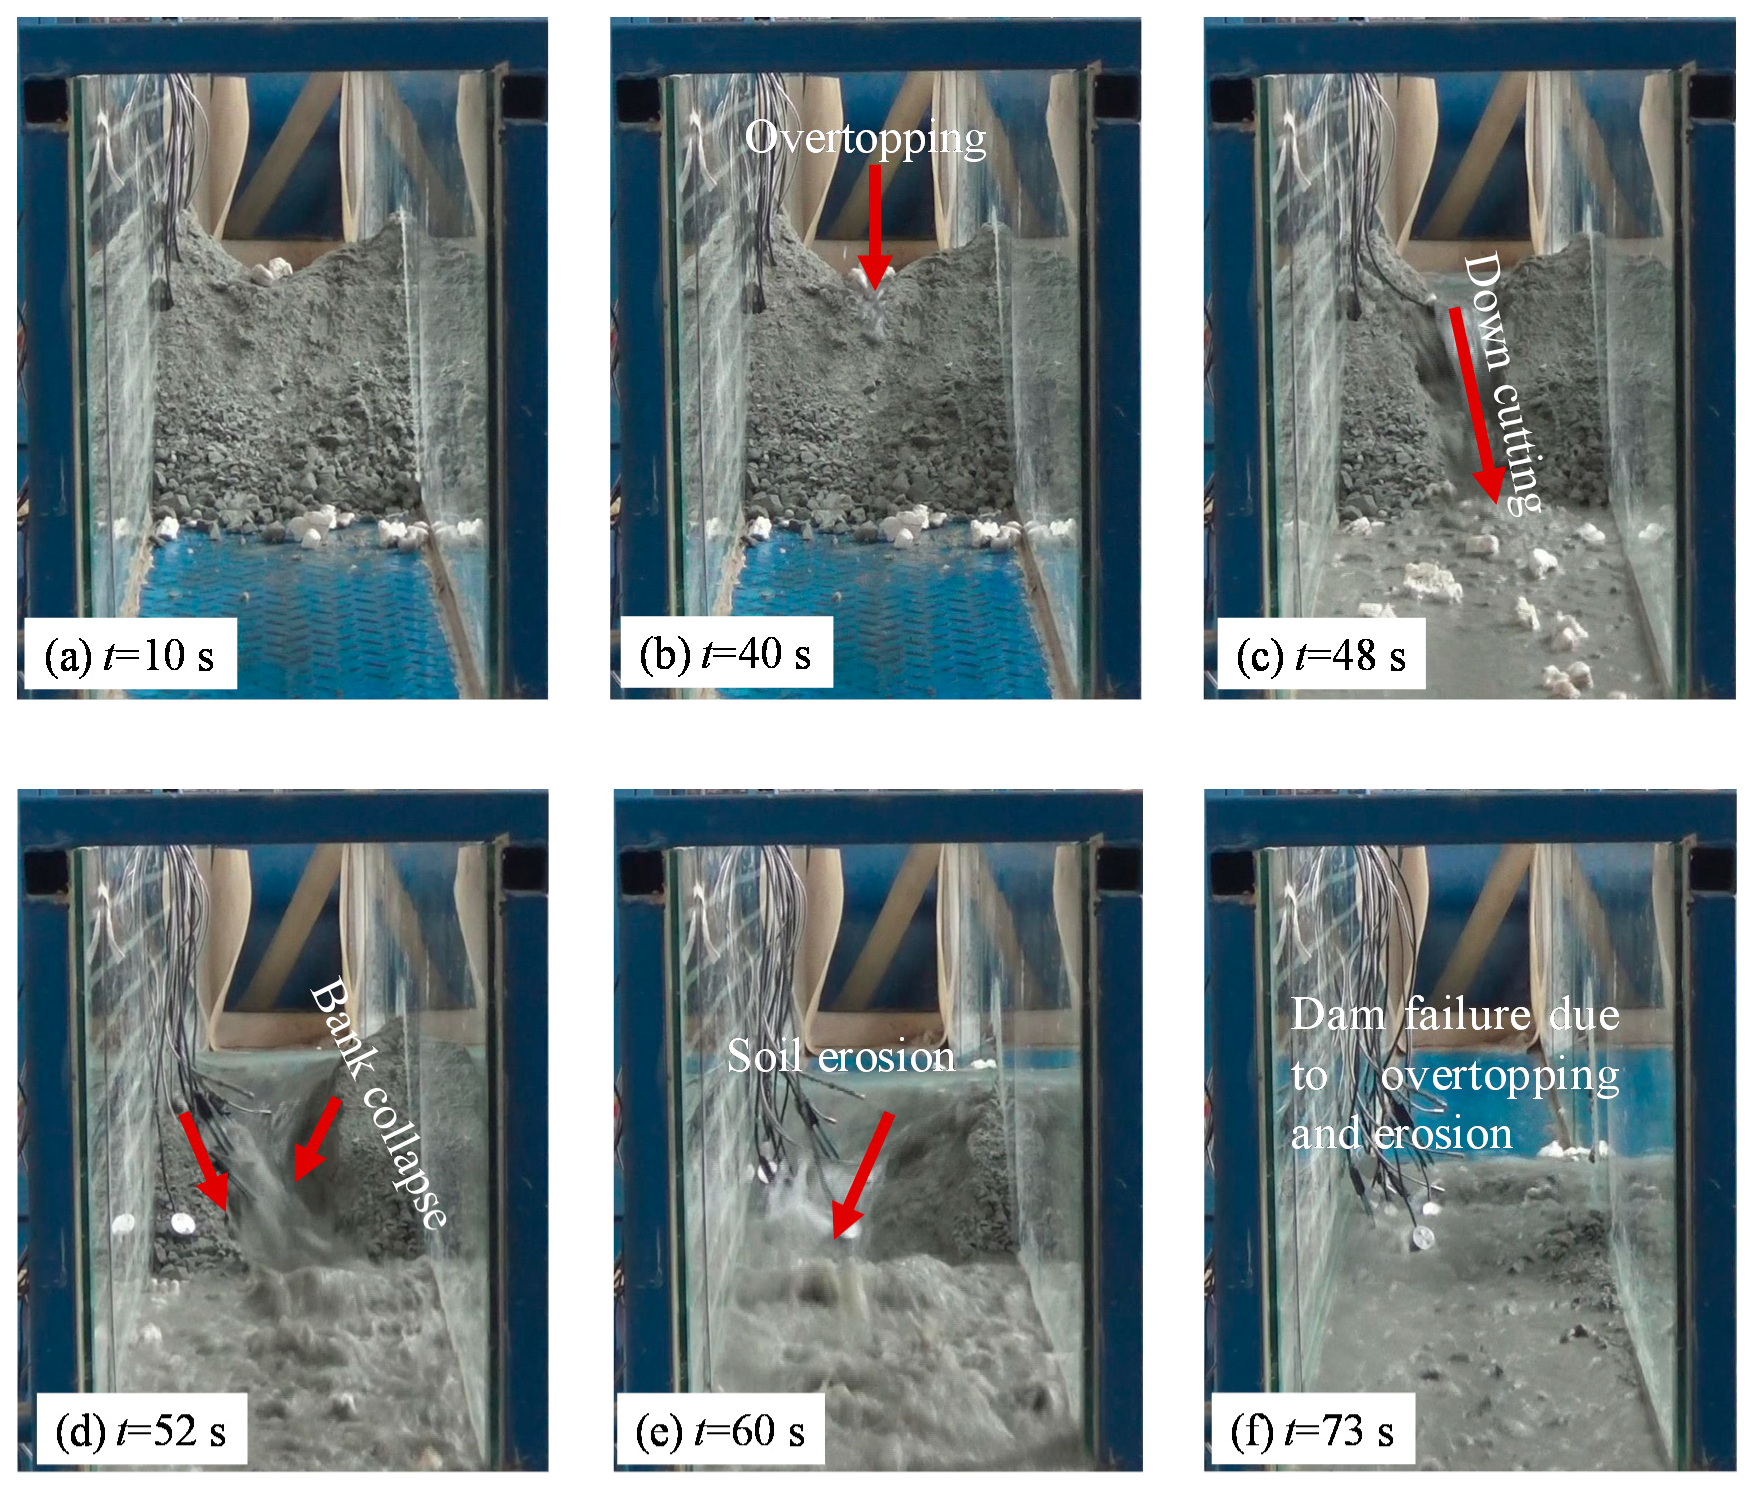
In these experiments, eight tests were conducted (Numbers 6–13 in Table 1), and dam failure was caused by overtopping and erosion. Taking test Number 9 as an example, the reservoir filled up in a short time due to a greater amount of inflow from upstream. Then, the dam was overtopped (Figure 11b). A channel formed and quickly cut down into the dam materials as the overflow continuously eroded the back surface of the dam (Figure 11c). Afterwards, the dam material on both sides of the spillway was unstable and experienced continuous failure (Figure 11d). The spillway rapidly widened, and the mine wastes was rapidly transported (Figure 11e). Finally, the dam material was completely eroded away (Figure 11f).
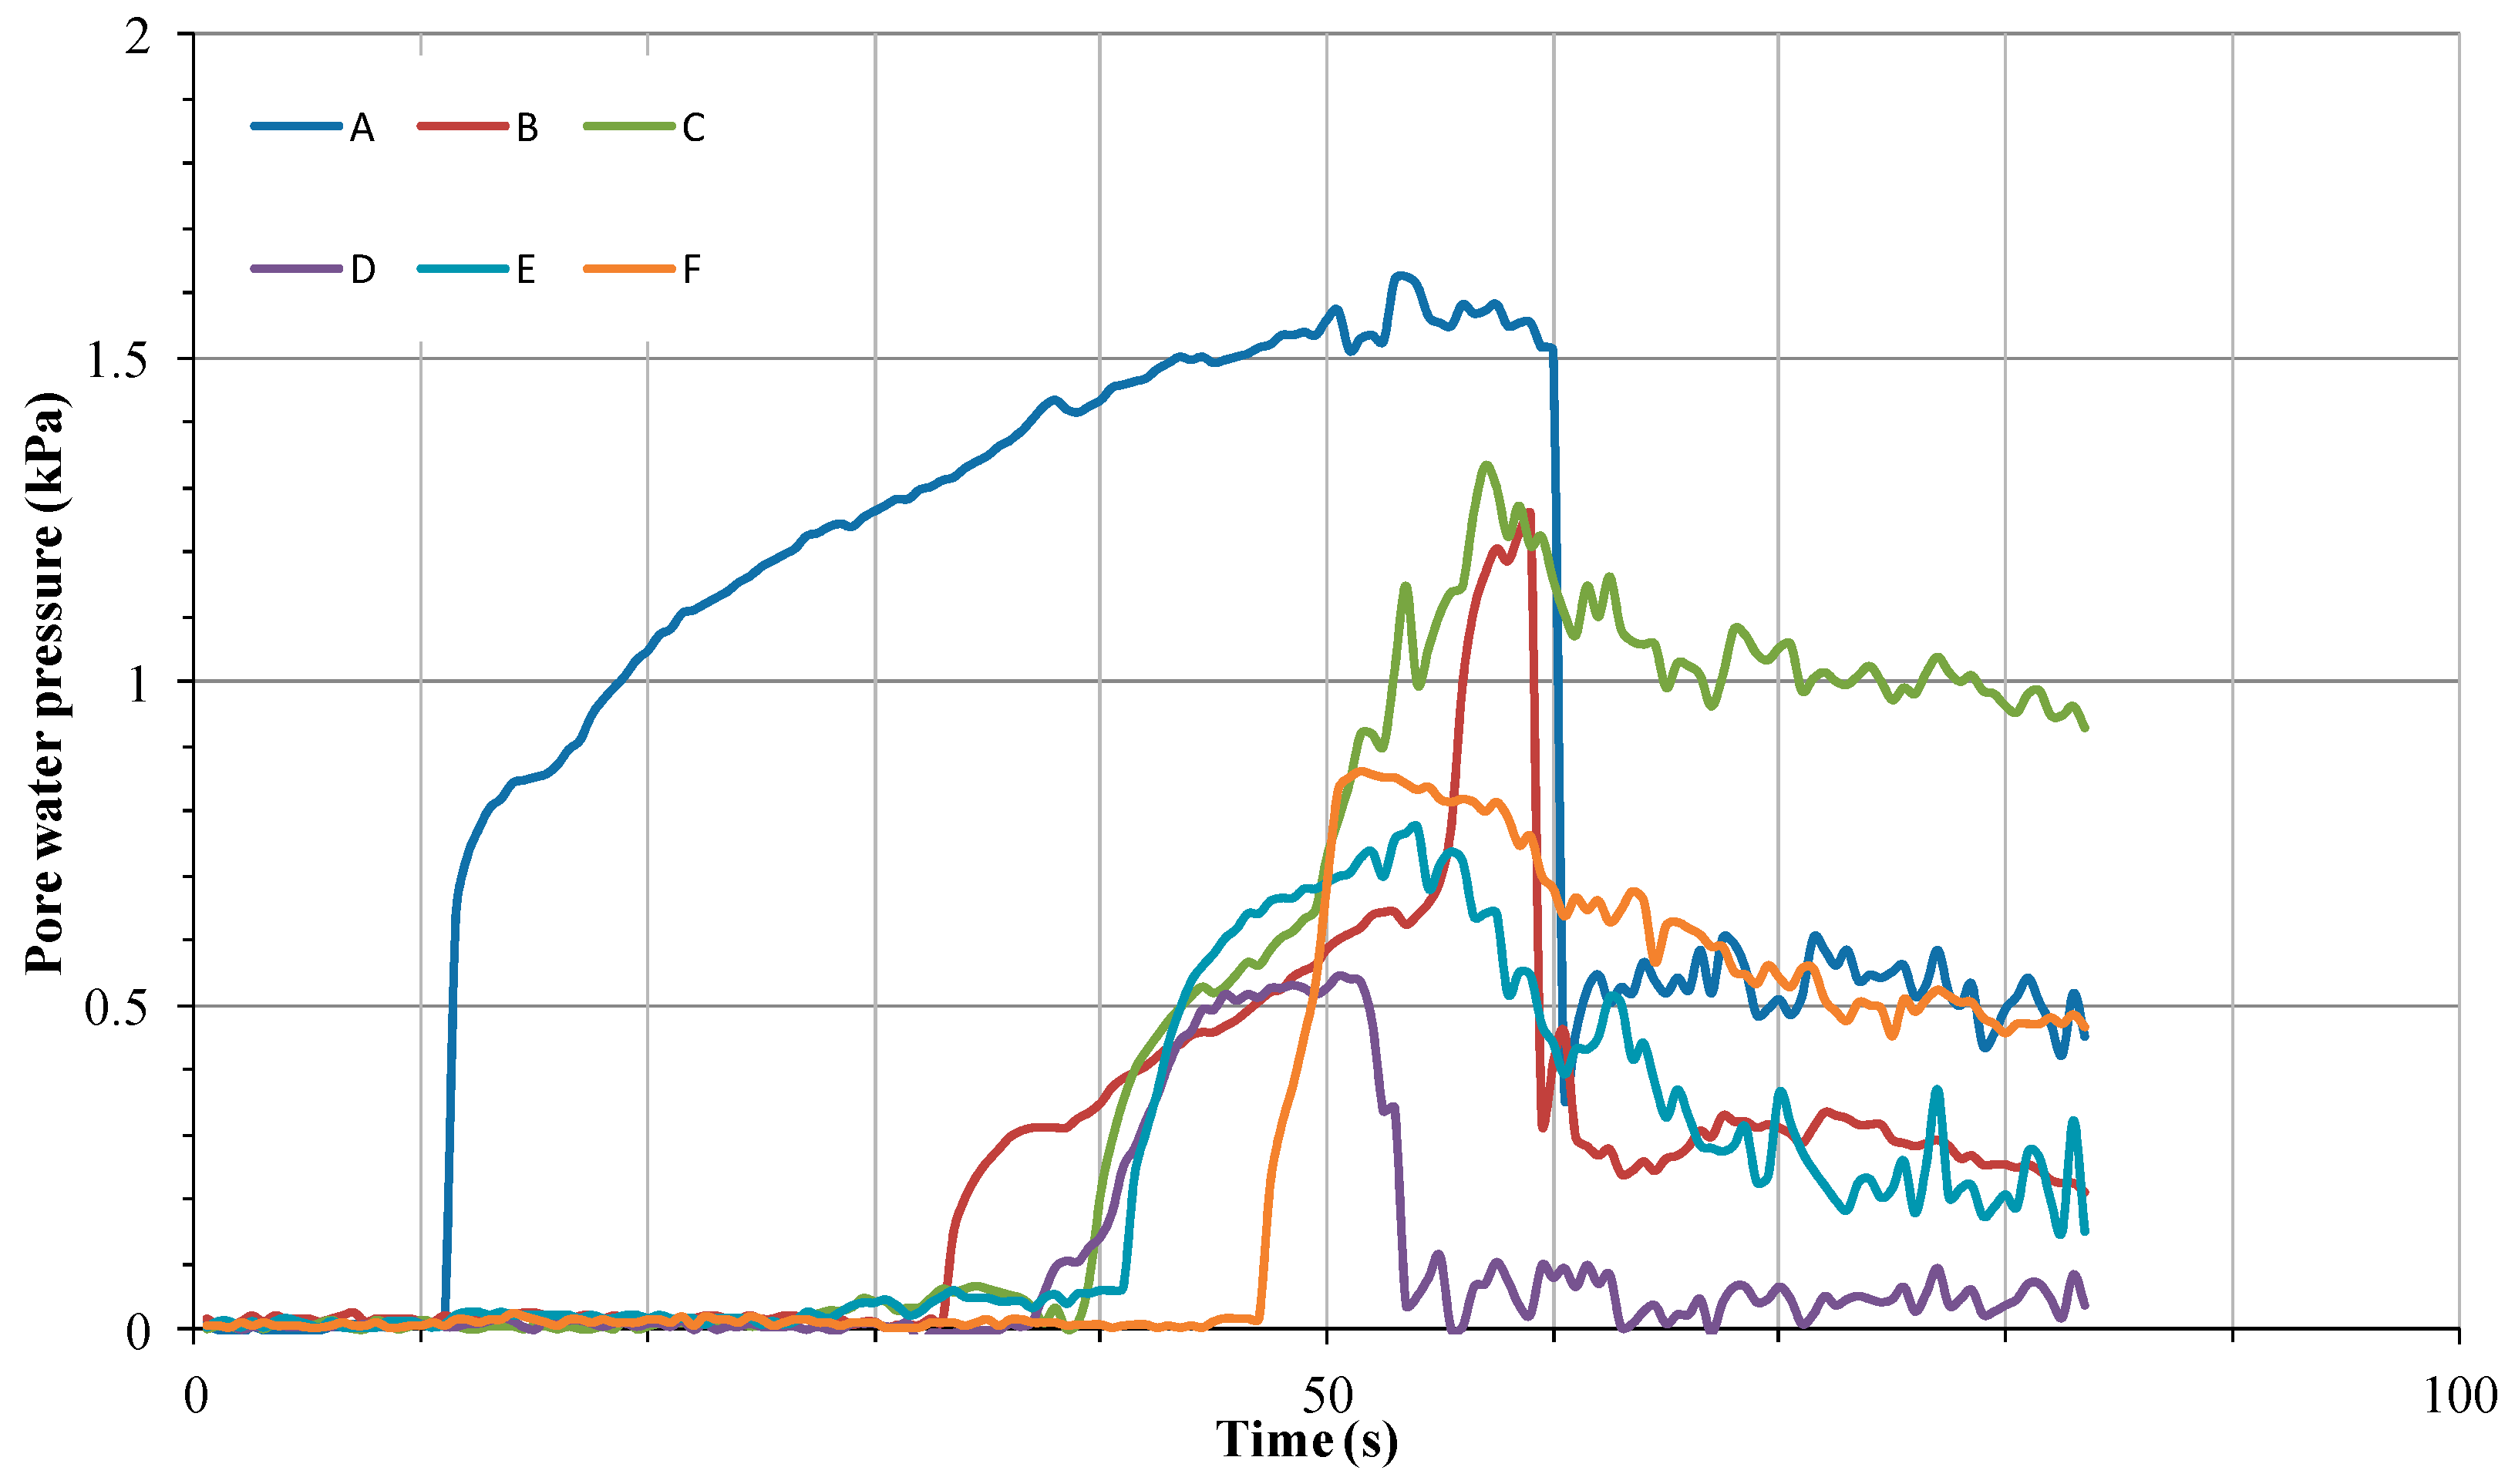
Based on our analysis of the variation in pore water pressure with time during the experiment (Figure 12), the pore water pressure increased in the sequence of A-B-D-C-E-F. Combined with the failure process illustrated in Figure 11, the pore water pressure of the lower layer (A and B) initially increased due to seepage during reservoir filling. However, when there was a greater inflow discharge, the water level in the reservoir and the pore water pressure at observation point D increased rapidly. With continuous seepage, the pore water pressure increased at observation point C, and then a complete seepage path formed. Finally, the pore water pressures of the upper layer (E and F) gradually increased due to overtopping.
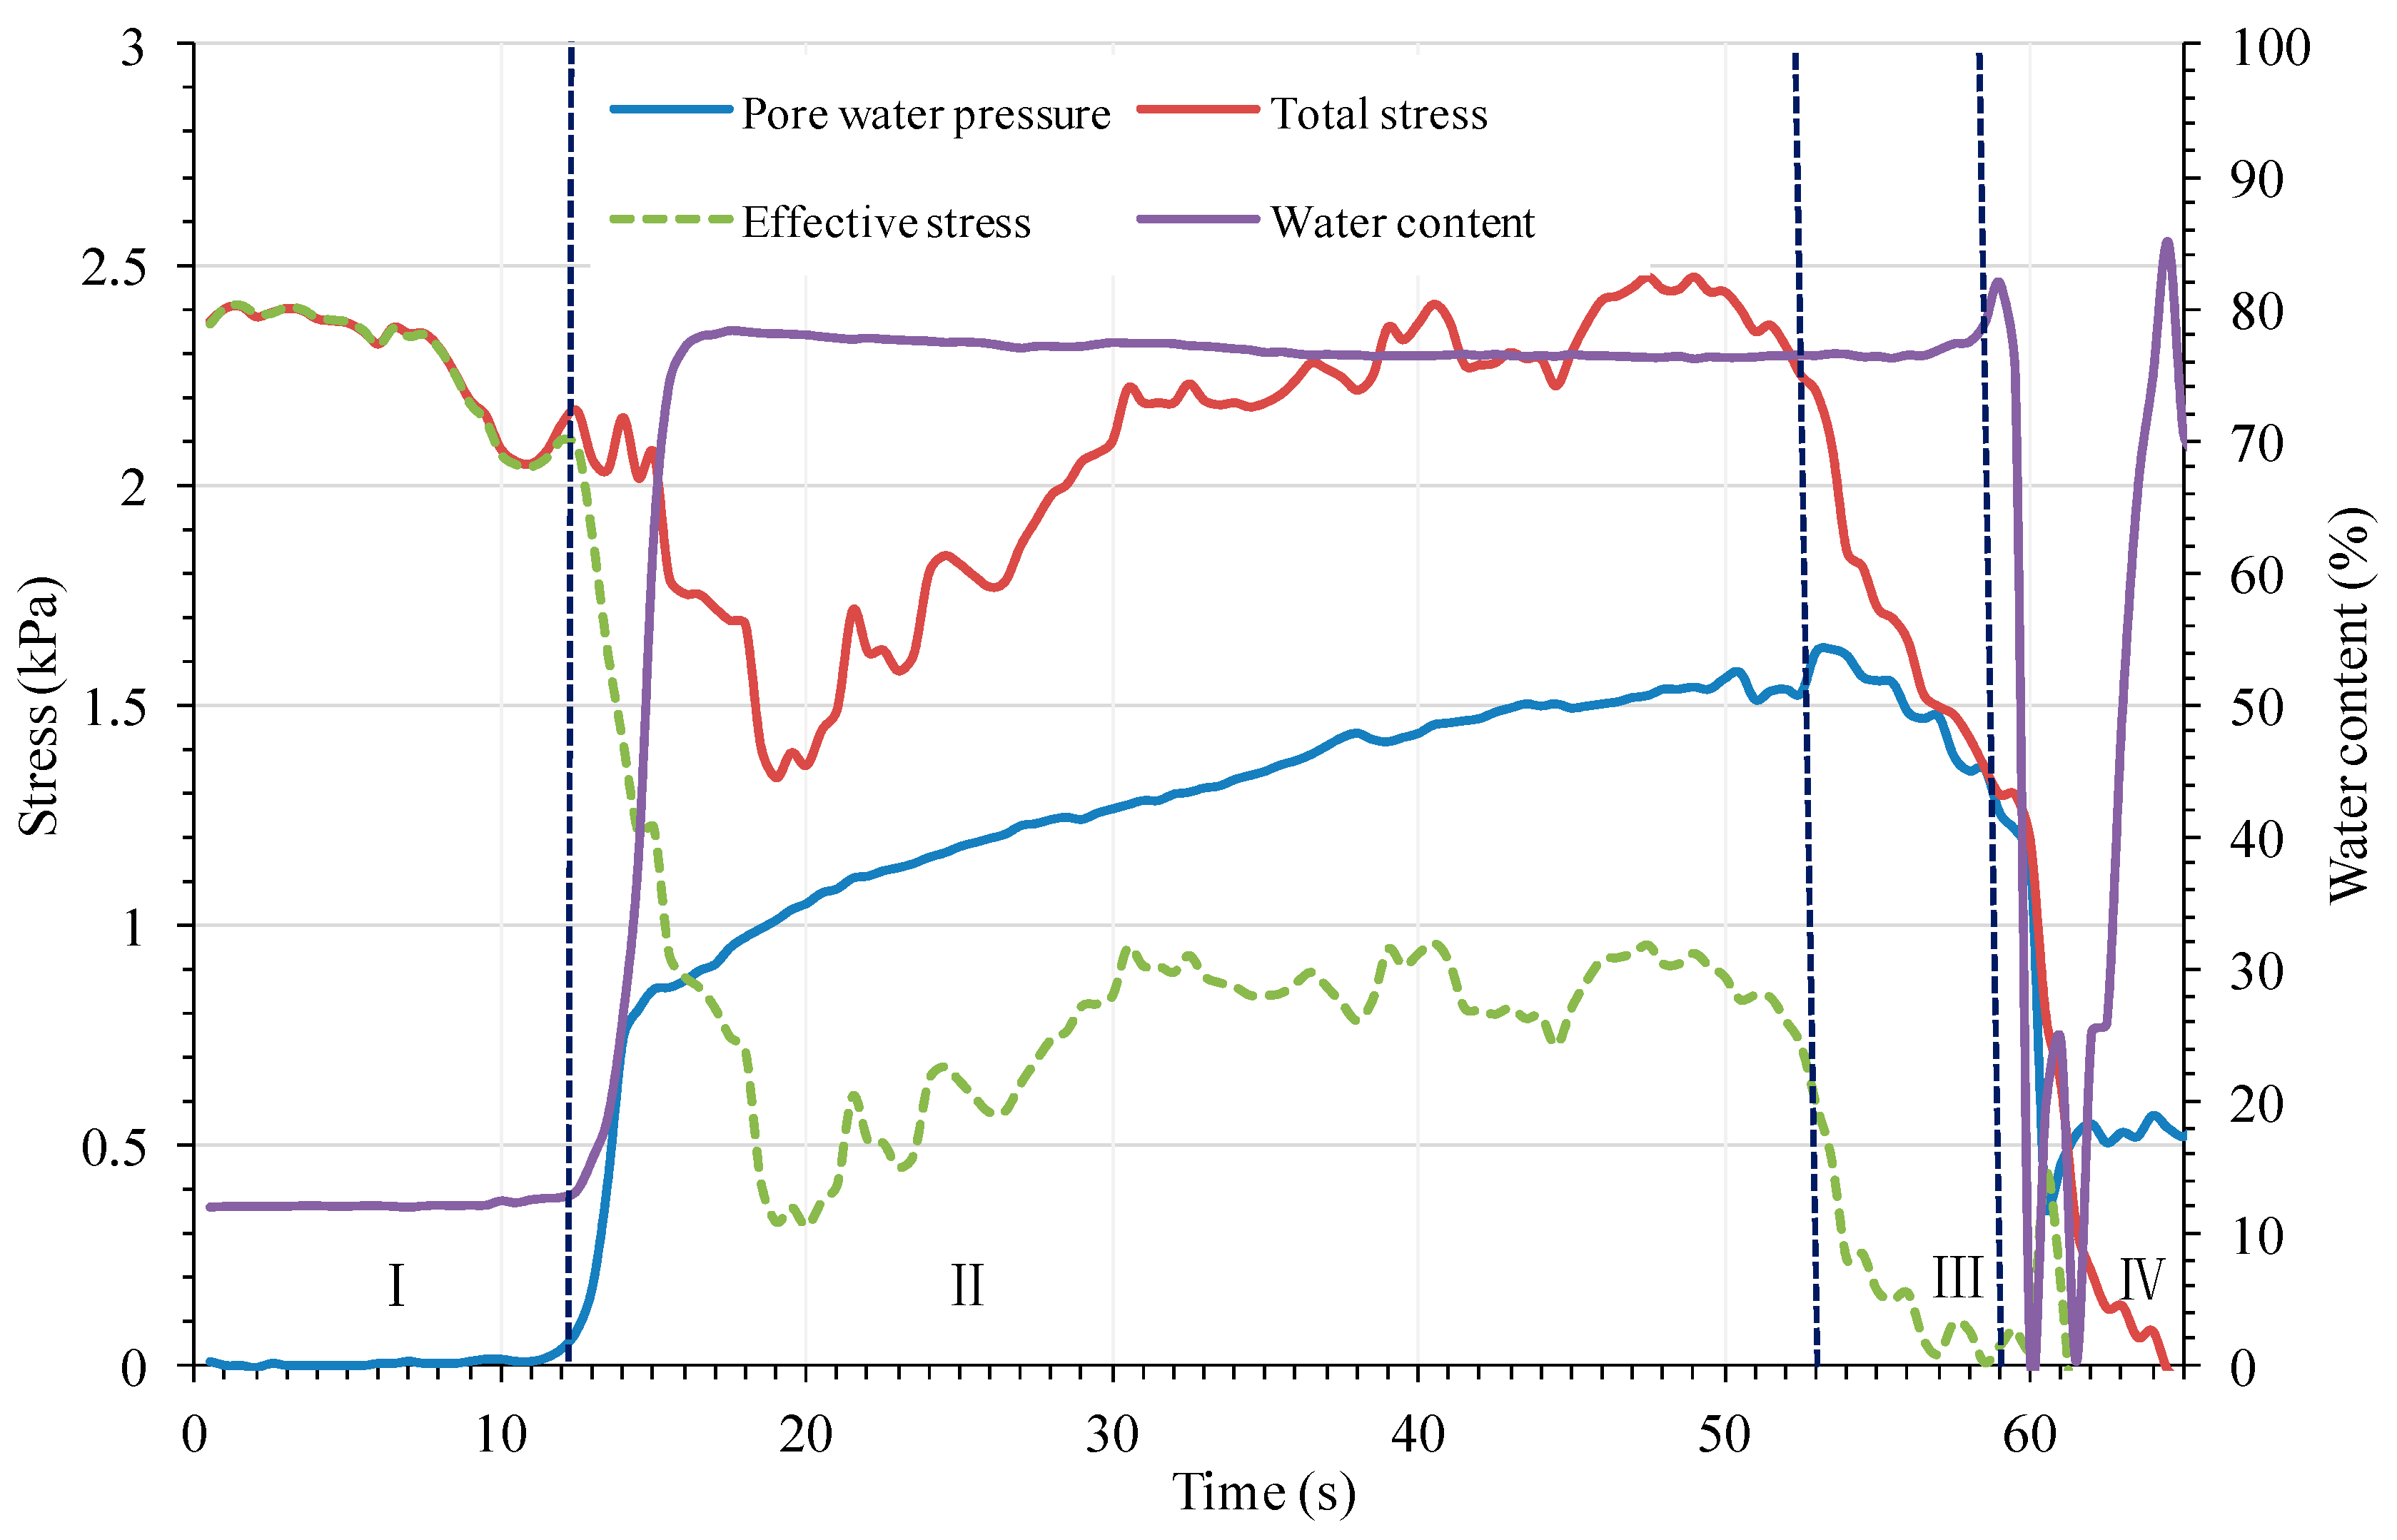
In this failure mode, since the failure process of the landslide dam was extremely short, the data acquired at observation point A constituted the longest portion of the test. Therefore, the sensor data from observation point A were chosen to analyze variations in the parameters with time. The variations in water content, pore water pressure, and total stress with time at point A are shown in Figure 13. The failure process of the dam can be divided into four stages. In stage I, the water level rapidly increased as the inflow filled the dam reservoir. However, the water content and pore water pressure remained unchanged because the water did not penetrate to observation point A in this stage. In stage II, the water penetrated to observation point A, and the water content increased rapidly until the pore space was saturated. At the same time, the pore water pressure and total stress increased significantly. In stage III, as the upper layer of the mine waste dam was rapidly eroded, the total stress decreased rapidly. However, the pore water pressure slowly decreased due to the high rate of outflow over the spillway and the relatively high water level. In stage IV, as the dam failed, several sensors were exposed to the upstream flow, so the acquired data had no reference value.
4. Discussion
4.1. Differences in and Relationship between the Failure Modes
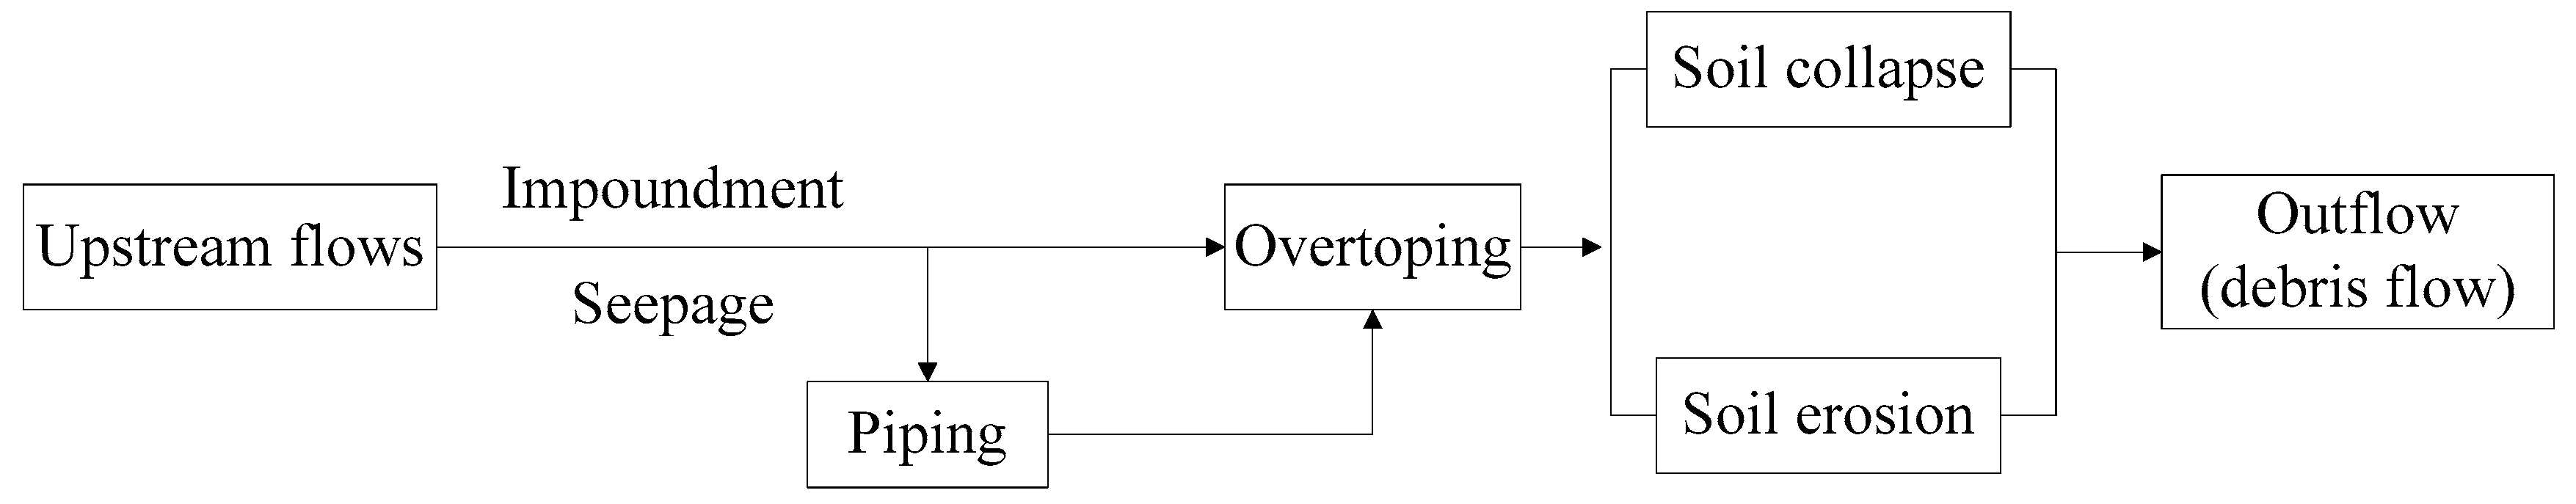
By analyzing the failure modes and processes of the 13 experimental tests under different working conditions, we concluded that the seepage that occurs before overtopping is extremely important. As the inflow discharge continued to fill the reservoir, the water level gradually increased. If the grain composition of the dam was conducive for seepage, piping might be formed. However, Costa et al. [13] reported that there were very few cases of dam failure caused by piping. In our tests, we did not observe dam failure due solely to piping. In test Number 1, the inflow discharge from upstream was equal to the seepage discharge, so the dam remained stable. If the dam remained stable, it would experience overflowing, which was a key factor and triggering dam failure. In this stage, the dam would fail due to soil collapse (as shown in test Number 3) or soil erosion (as shown in tests Number 6–13). As the dam materials were eroded by the outflow, an outburst flood (or debris flow) occurred. The failure process and the relationship between the failure modes is summarized in Figure 14.
4.2. Factors Contributing to Dam Failure Modes
The failure processes of landslide dams include impoundment, seepage, overtopping, and soil erosion. However, a variety of experimental conditions will inevitably lead to different failure processes and modes. Therefore, the influence of the relative factors on the dam failure modes need to be explored in different stages.
(1) Impoundment Stage
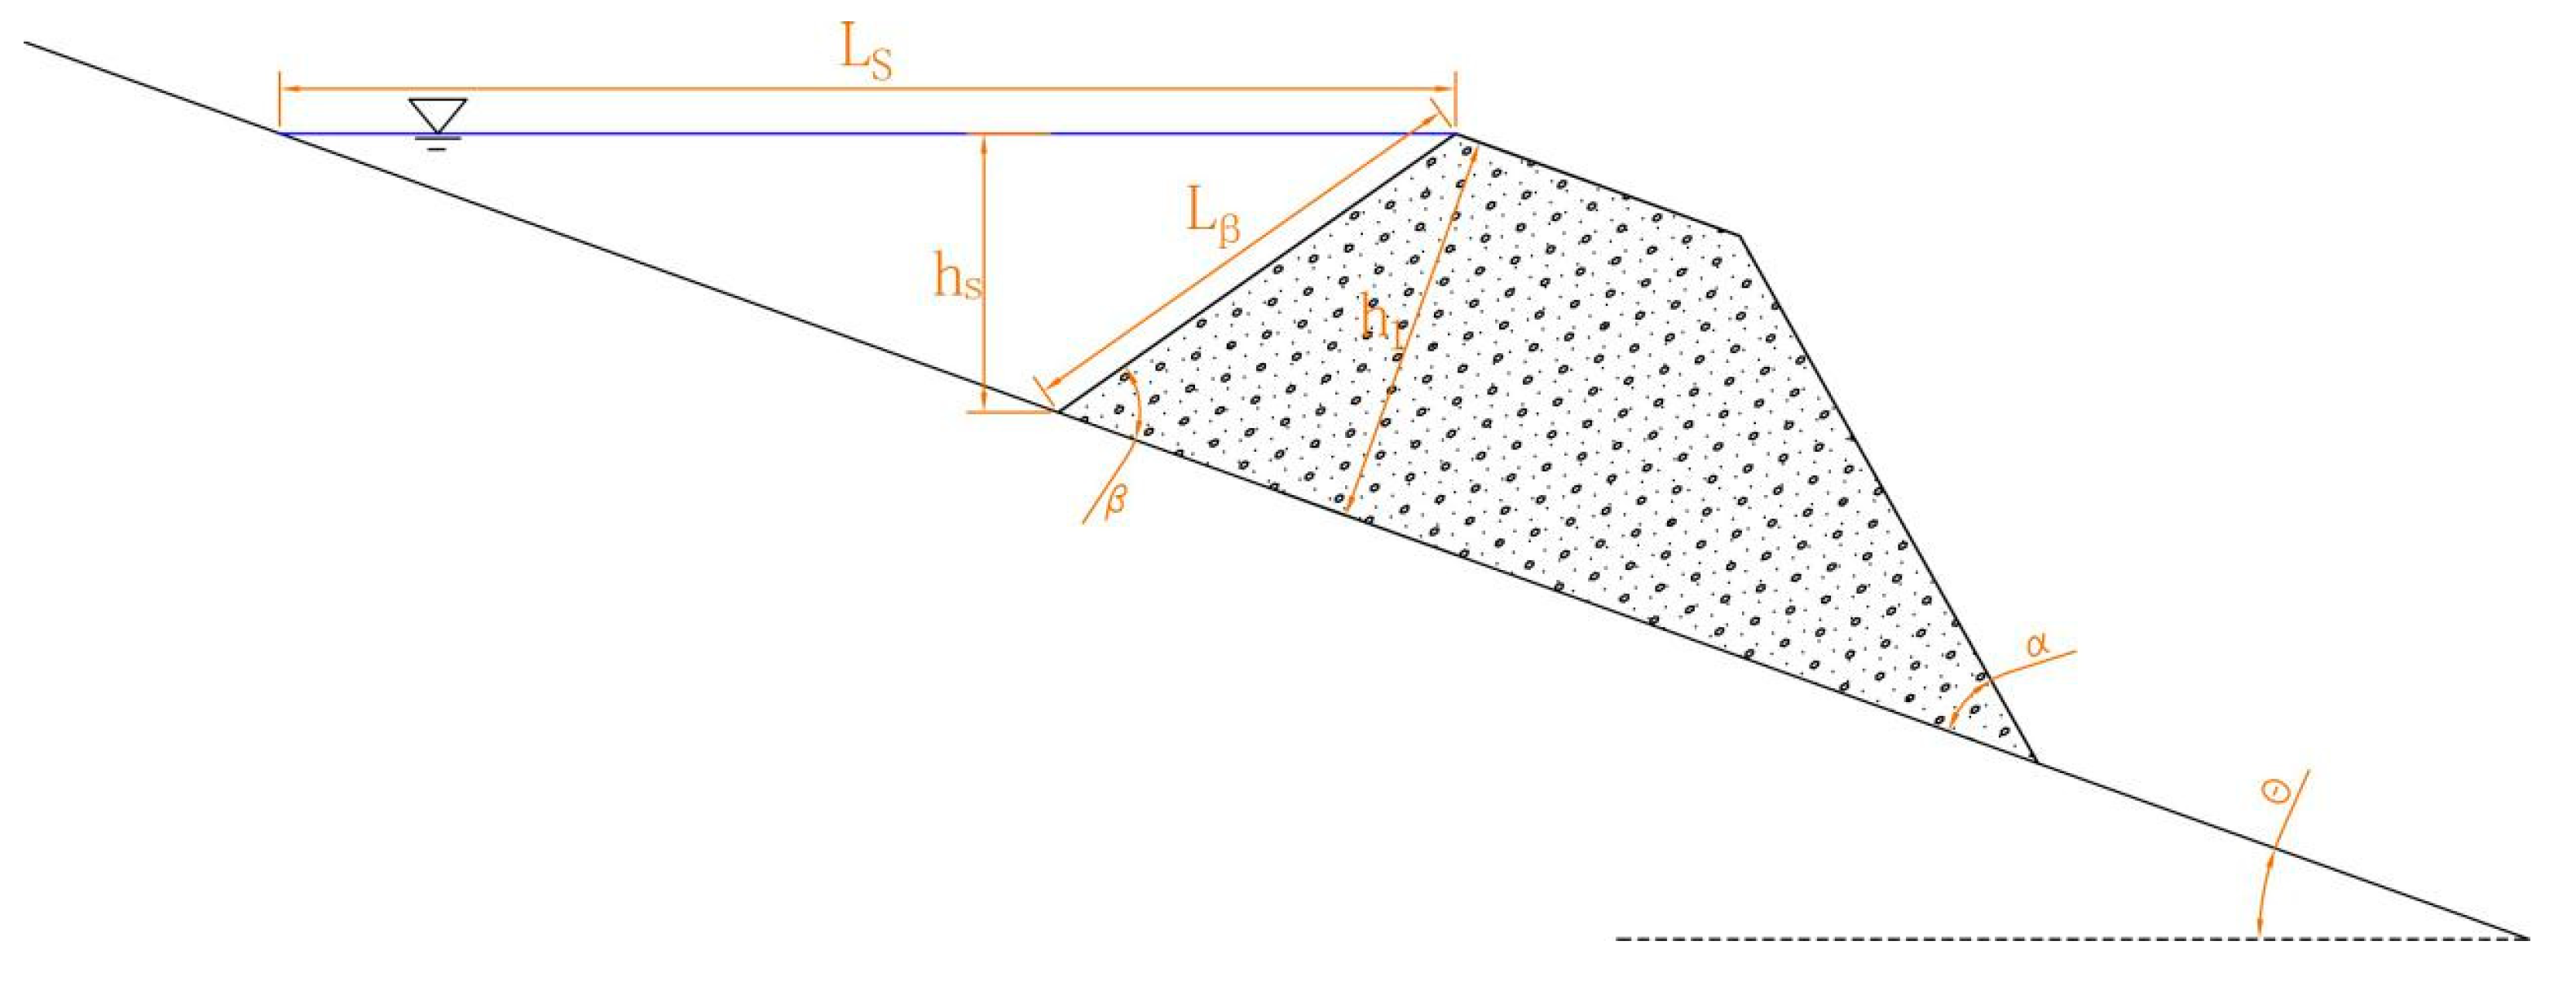
In this stage, the water level rapidly increased as the inflow discharge began to fill the dam’s reservoir. At the same time, the dam was infiltrated and deformed (e.g., piping). Figure 15 shows the physical dimensions of the landslide dam, where Vk is the reservoir storage capacity, hl is the dam’s height, θ is the flume gradient, β is the slope angle of the upstream face of the dam, and B is the dam’s width.
The reservoir storage can be expressed as follows:
According to Equation (1), the reservoir storage Vk will decrease as the flume gradient θ increases when all of the other variables are constant. Based on the principle of water balance, the volume of seepage water is:
where Qin is the inflow discharge, tin is the time of water storage, and Vs is the volume of seepage water. A greater upstream flow and a shorter filling time will result in shorter seepage time before overtopping. Therefore, in the impoundment stage, the process is mainly affected by two factors: Slope gradient and inflow discharge.
(2) Seepage Stage
In this stage, the fine particles were continuously transported by seepage water [27,28]. Because of the randomness of the grain composition and the distribution of dam material, the seepage path is the key factor for controlling the results of the four different experiments: (1) A complete seepage path formed, and the inflow discharge was equal to the seepage flow, so the dam did not fail (Number 1 in Table 1). (2) A complete seepage path formed, and then, piping occurred (Numbers 2–4 in Table 1). (3) The fine particles were transported by seepage water and blocked the seepage path, increasing the partial pore water pressure. Finally, a complete seepage path had not yet formed when overtopping occurred (Number 5 in Table 1). (4) The high rate of inflow rate led to rapid filling of the reservoir. As the seepage time was limited in these tests, most of the mine waste were unsaturated when overtopping occurred (Number 6~13 in Table 1).
Therefore, the factors influencing landslide behavior during this stage are as follows: (1) The seepage time, and (2) the grain size distribution and composition of the dam material, especially the content and distribution of the large particles and fine particles. The large particles played a role in the skeleton and support structures, so their content and distribution determine whether a complete seepage path will formed. The content of the fine particles determines whether the seepage path will be blocked.
(3) Overtopping Stage
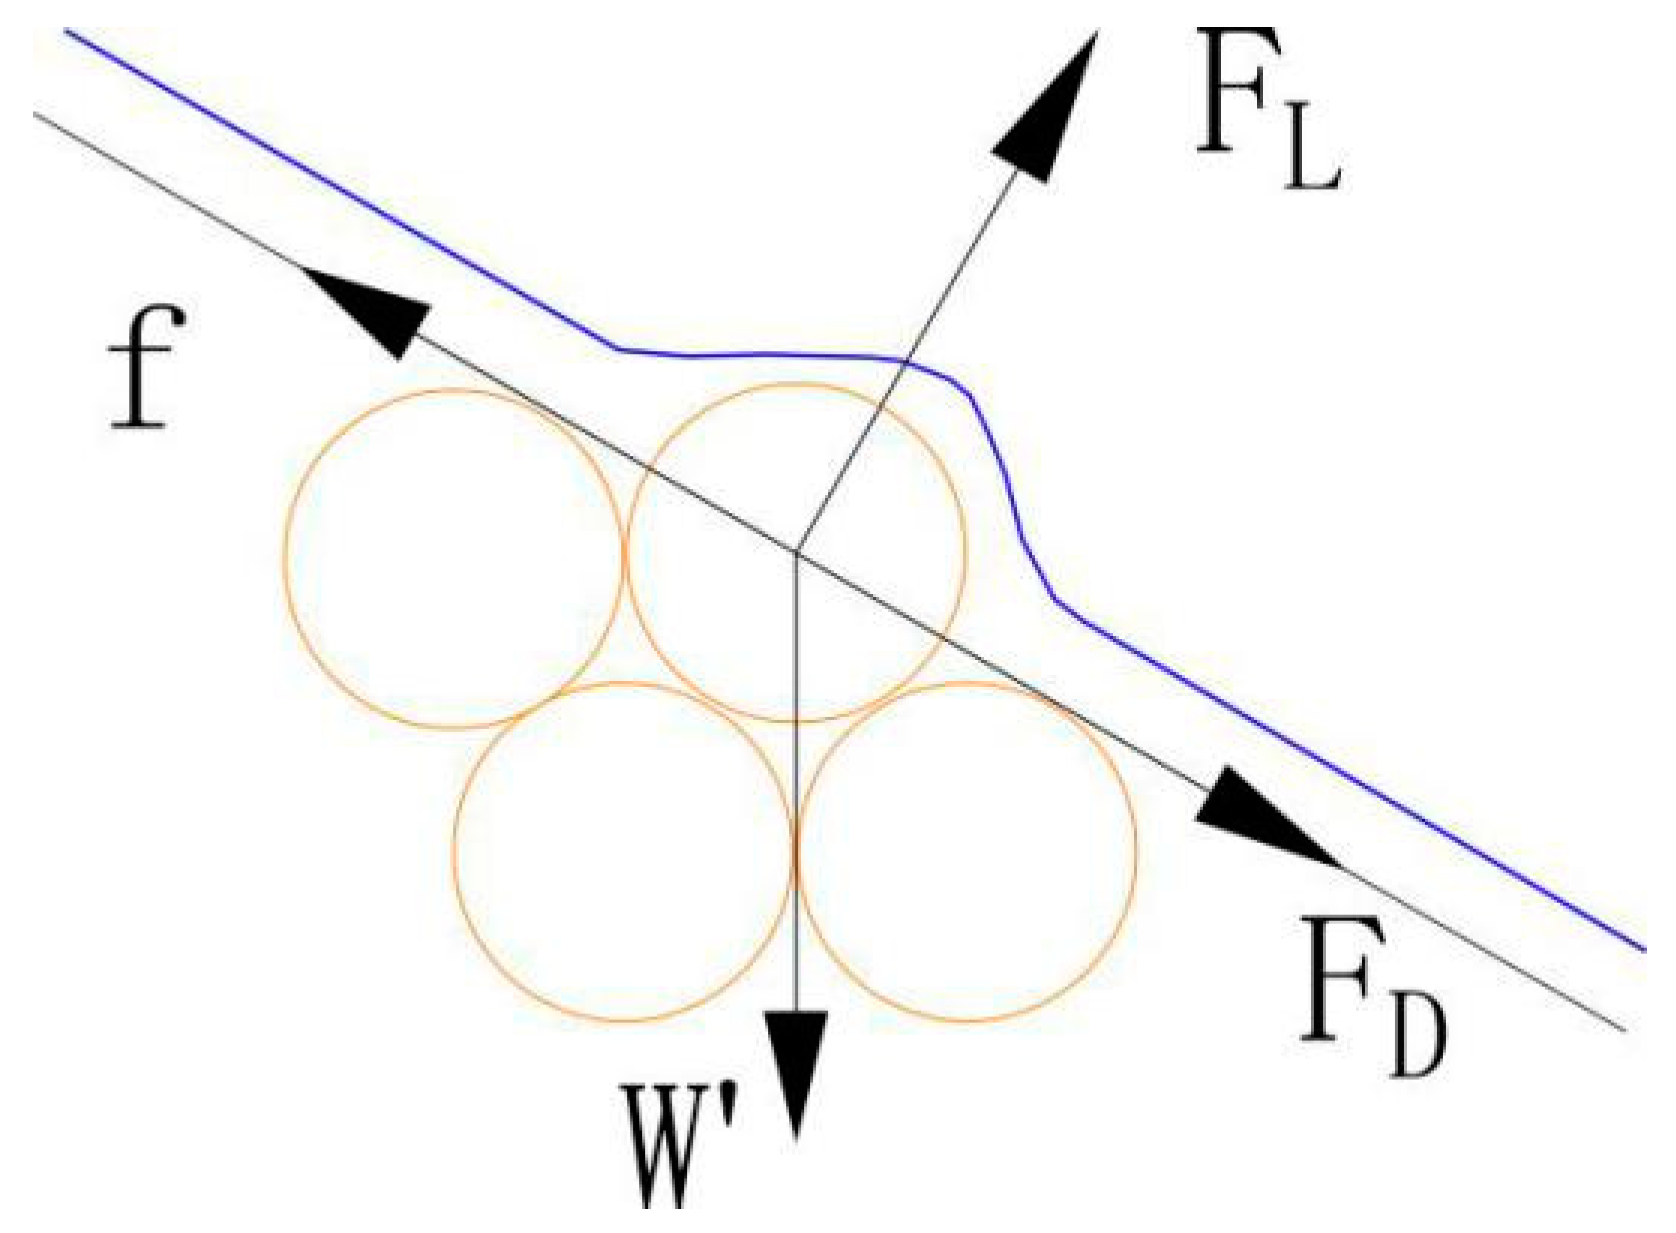
When the dam suffered overtopping, a channel was formed and quickly cut down into the dam material as the overflow continuously eroded the back surface of the dam. Afterwards, the material of the dam on both sides of the spillway was unstable and continuously failed. The spillway was rapidly widened by strong headward erosion. Finally, the entire dam failed and eroded. Quantitative analysis of this stage indicates that overland flow occurred on downstream face when the water overflowed and some of the mine waste started to move (Figure 15). The force analysis of mine waste particles on the downstream face is shown in Figure 16, in which FD is drag force, FL is the uplift force, W′ is gravity, and f is frictional resistance. Because the mine waste was loose and accumulated naturally, the cohesive force was ignored in this analysis.
The gravity W′ can be expressed as:
The frictional resistance of the downstream face f can be expressed as:
The drag force FD can be expressed:
The uplift force FL can be expressed as:
where D is the particle size, γs is the unit weight of particles, γ is the unit weight of water, α is the slope angle of the downstream face of the dam, θ is the flume gradient, φ is the internal friction angle, CD is the drag force coefficient, CL is the uplift force coefficient, v is the flow velocity, A is the maximum cross-sectional area of the particles, and ρ is the water density. In the overtopping stage, the limit of the equilibrium equation for the particles in the downstream face of the dam can be expressed as follows:
By further simplifying Equation (8), we can obtain the relationship between the maximum particle size that can be moved and the overflow velocity:
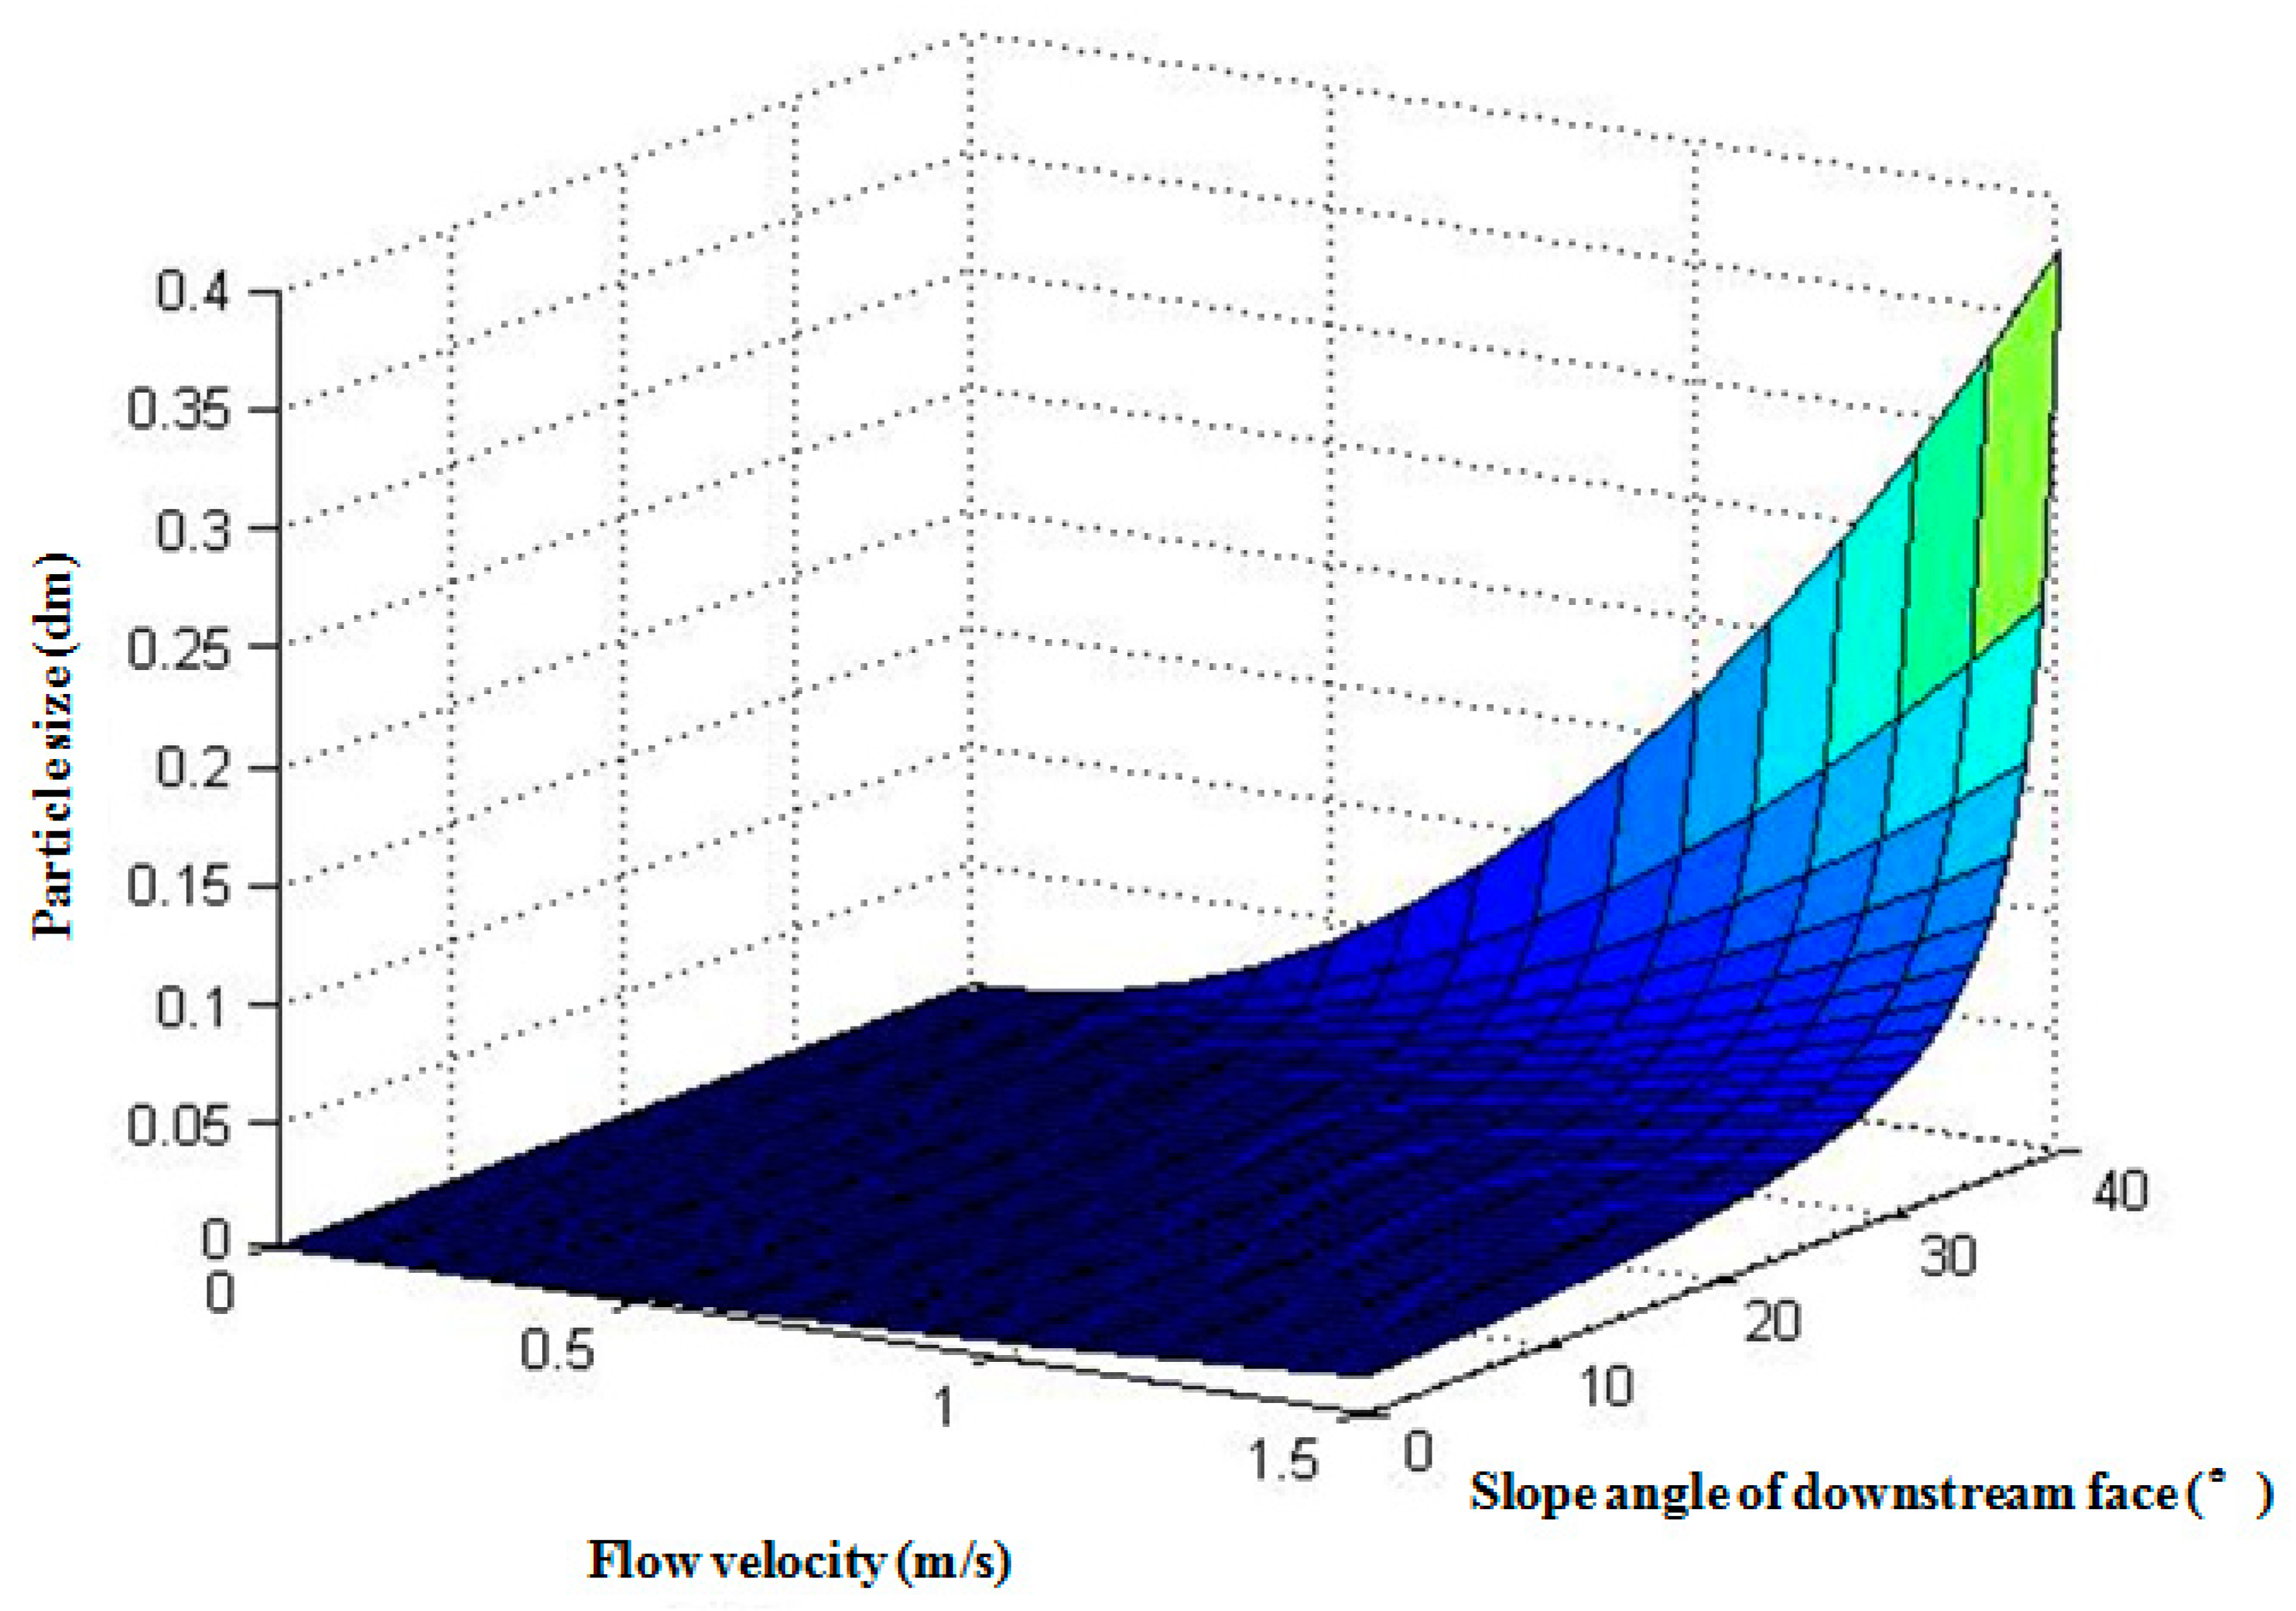
Based on our field investigations, the internal friction (φ) of the mine wastes used in our experiments was 41.6°. The maximum particle size was 5 cm, and the water density was 1 g/cm3. As in the model test conducted by Chepil [29], the value of CL was set as 0.068, and CL/CD was set as 0.53. The outflow velocity measured using the float method was from 0.16 m/s to 1.50 m/s in the experimental tests. The initial 40° slope of the downstream face gradually decreased during the experiments due to the headward erosion. Equation (8) can be solved using Matlab. Figure 17 shows the relationship between the maximum particle size that can be moved (D), the flow velocity (v), and the total slope angle of the downstream face (α + θ). The failure process of the landslide dam was determined based on the particle size of the mine waste and the shape of the dam (dam height, slope angle of the downstream face, outflow velocity, and discharge).
However, the failure of landslide dams is a complicated process. Because of the limitations of the developed model, our research is a preliminarily study of the failure modes of landslide dams, and, thus, it has two obvious shortcomings:
- (1)
- Dams formed by the stacking of mine exhibit differences due to the randomness of stacking. This also occurred in our experiments because it was difficult to artificially control. Finally, the differences and randomness in stacking led to different experimental results between tests Number 2–5 (Table 1), even though there was little difference in the working conditions.
- (2)
- During the tests, we observed differences of in the dam failure modes and processes due to changes in the inflow discharge and the slope gradient of the experimental flume. However, it was found that the particle composition and distribution of dam material played an important role in the failure process, which will need to be investigated further in future research. In addition, the flume was only 0.3 m in width, and the experimental data were inevitably affected by side wall boundary effects. Therefore, in future studies, these research results still need to be verified using a larger experimental model to collect the data.
5. Conclusions
Based on field investigations of landslide dams in the Xiaoqinling gold mining area, we determined failure modes and process of landslide dams by 13 flume experiments under different working conditions. The conclusions of this study are as follows:
- (1)
- There were three failure modes of the 13 mine waste dams in our experiments: (i) Piping, overtopping, and erosion; (ii) overtopping and soil collapse; and (iii) overtopping and erosion.
- (2)
- The occurrence of the seepage before overtopping was extremely important. If the grain composition of the dam was conductive to seepage, piping occurred. However, if the dam remained stable, it would experience overtopping, which was a key factor triggering the conditions for dam failure. In this stage, the dam failed due to soil collapse or soil erosion.
- (3)
- The inflow and slope gradient of the flume had significant impacts on the failure modes and processes of the landslide dams. The reservoir storage was determined using the slope gradient of the upstream face of the dam, the dam height, and the slope gradient of the flume. The seepage time before overtopping occurred was determined using the inflow discharge and the reservoir storage. In addition, the failure process for the landslide dam was determined using the particle size of the mine waste and the shape of the dam (dam height, slope angle of the downstream face, outflow velocity, and discharge), which determine the discharge of the outburst flood (or debris flow).
Author Contributions
Conceptualization, J.P. and X.Z.; methodology, J.P.; software, W.G.; validation, X.Z., W.G. and C.J.; formal analysis, C.J.; investigation, C.J. and W.G.; resources, X.Z.; data curation, X.Z.; writing—original draft preparation, X.Z.; writing—review and editing, X.Z.; visualization, X.Z.; supervision, J.P.; project administration, J.P.; funding acquisition, J.P. and X.Z.
Funding
This research was funded by the National Natural Science Foundation of China (Grant No. 41790441, 41877249 and 41402255) and Fundamental Research Foundation of the Central Universities (300102269211).
Acknowledgments
We also thank Penghui Ma for his kind assistance with the flume experiments.
Conflicts of Interest
The authors declare no conflict of interest.
References
- Walder, J.S.; O’Connor, J.E. Methods for predicting peak discharge of floods caused by failure of natural and constructed earthen dams. Water Resour. Res. 1997, 33, 2337–2348. [Google Scholar] [CrossRef]
- Liu, N.; Zhang, J.; Lin, W.; Cheng, W.; Chen, Z. Draining Tangjiashan Barrier Lake after Wenchuan Earthquake and the flood propagation after the dam-break. Sci. China Ser. Technol. Sci. 2009, 52, 801–809. [Google Scholar] [CrossRef]
- Cui, P.; Zhu, Y.Y.; Han, Y.S.; Chen, X.Q.; Zhuang, J.Q. The 12 May Wenchuan Earthquake-induced landslide lakes: Distribution and preliminary risk evaluation. Landslides 2009, 6, 209–223. [Google Scholar] [CrossRef]
- Costa, J.E. Floods from Dam Failures; United States Geological Survey Open File Report; United States Department of the Interior Geological Survey: Reston, VA, USA, 1985; pp. 85–560.
- Li, M.H.; Sung, R.T.; Dong, J.J.; Lee, C.T.; Chen, C.C. The formation and breaching of a short-lived landslide dam at Hsiaolin Village, Taiwan–part II: Simulation of debris flow with landslide dam breach. Eng. Geol. 2011, 123, 60–71. [Google Scholar] [CrossRef]
- King, J.; Loveday, I.; Schuster, R.L. The 1985 Bairaman landslide dam and resulting debris flow. Q. J. Eng. Geol. 1989, 22, 257–270. [Google Scholar] [CrossRef]
- Chen, C.Y.; Chen, T.C.; Yu, F.C.; Hung, F.Y. A landslide dam breach induced debris flow-a case study on downstream hazard areas delineation. Environ. Geol. 2004, 47, 91–101. [Google Scholar] [CrossRef]
- Dong, J.J.; Li, Y.S.; Kuo, C.Y.; Sung, R.T.; Li, M.H.; Lee, C.T.; Lee, W.R. The formation and breach of a short-lived landslide dam at Hsiaolin village, Taiwan-part I: Post-event reconstruction of dam geometry. Eng. Geol. 2011, 123, 40–59. [Google Scholar] [CrossRef]
- Li, Z.S. A study on the mud rock flow disaster in 1994 in the gold mine area of Tongguan, Shaanxi. J. Catastr. 1995, 10, 51–56. (In Chinese) [Google Scholar]
- Xu, Y.N.; Cao, Y.B.; Zhang, J.H.; Chen, H.Q.; Yang, M.; Wang, X.W. Research on starting of mine debris flow based on artificial simulation experiment in Xiaoqinling Gold Ore area. Chin. J. Rock Mech. Eng. 2009, 28, 1389–1395. (In Chinese) [Google Scholar]
- Zhu, X.H.; Peng, J.B.; Jiang, C.; Guo, W.L. Formation conditions of landslide dams triggered by incision of mine waste accumulations. J. Mt. Sci. 2019, 16, 108–121. [Google Scholar] [CrossRef]
- Liu, S.J.; Xie, H.; Wei, F.Q. A man-caused debris flow in Xiaoqinling Gold Mining region. Mt. Res. 1996, 14, 259–263. (In Chinese) [Google Scholar]
- Costa, J.E.; Schuster, R.L. Formation and failure of natural dams. Bull. Geol. Soc. Am. 1988, 100, 1054–1068. [Google Scholar] [CrossRef]
- Korup, O. Geomorphometric characteristics of New Zealand landslide dams. Eng. Geol. 2004, 73, 13–35. [Google Scholar] [CrossRef]
- Chen, H.Y.; Cui, P.; Zhou, G.D.; Zhu, X.-H.; Tang, J.-B. Experimental study of debris flow caused by domino failure of landslide dams. Int. J. Sedim. Res. 2014, 29, 414–422. [Google Scholar] [CrossRef]
- Hu, W.; Xu, Q.; Rui, C.; Huang, R.Q.; van Asch, T.W.J.; Zhu, X.; Xu, Q.Q. An instrumented flume to investigate the initiation mechanism of the post-earthquake huge debris flow in southwest of China. Bull. Eng. Geol. Environ. 2015, 74, 393–404. [Google Scholar] [CrossRef]
- Zhou, G.G.; Cui, P.; Zhu, X.; Tang, J.; Chen, H.; Sun, Q. A preliminary study of the failure mechanisms of cascading landslide dams. Int. J. Sedim. Res. 2015, 30, 223–234. [Google Scholar] [CrossRef]
- Jiang, X.; Peng, C.; Chen, H.; Guo, Y. Formation conditions of outburst debris flow triggered by overtopped natural dam failure. Landslides 2017, 14, 821–831. [Google Scholar]
- Fread, D.L. Breach: An Erosion Model for Earthen Dam Failures; Senior Research Hydrologist with the Hydrologic Research Laboratory; National Weather Service, NOAA: Silver Spring, MD, USA, 1988; pp. 1–35. [Google Scholar]
- Singh, V.P.; Scarlatos, P.D.; Collins, J.G.; Jourdan, M.R. Breach erosion of earth fill dams (BEED) model. Nat. Hazard. 1988, 1, 161–180. [Google Scholar] [CrossRef]
- Peng, M.; Zhang, L.M. Breaching parameters of landslide dams. Landslides 2012, 9, 13–31. [Google Scholar] [CrossRef]
- Shi, Z.M.; Guan, S.G.; Peng, M.; Zhang, L.M.; Zhu, Y.; Cai, Q.P. Cascading breaching of the Tangjiashan landslide dam and two smaller downstream landslide dams. Eng. Geol. 2015, 193, 445–458. [Google Scholar] [CrossRef]
- Wang, W.; Chen, G.; Zhang, Y.; Zheng, L.; Zhang, H. Dynamic simulation of the landslide dam behavior considering kinematic characteristics using a coupled DDA-SPH method. Eng. Anal. Bound. Elem. 2017, 80, 172–183. [Google Scholar] [CrossRef]
- Zhu, X.H.; Cui, Y.F.; Peng, J.B.; Jiang, C.; Guo, W.L. Erosion and transport mechanisms of mine waste along gullies. J. Mt. Sci. 2019, 16, 402–413. [Google Scholar] [CrossRef]
- Zhang, R.J.; Xie, J.H.; Chen, W.B. River Dynamics; Wuhan University Press: Wuhan, China, 2007; pp. 46–60. (In Chinese) [Google Scholar]
- Richards, K.S.; Reddy, K.R. Critical appraisal of piping phenomena in earth dams. Bull. Eng. Geol. Environ. 2007, 66, 381–402. [Google Scholar] [CrossRef]
- Cui, P. Study on condition and mechanisms of debris flow initiation by means of experiment. Chin. Sci. Bull. 1992, 37, 759–763. [Google Scholar]
- Iverson, R.M.; Reid, M.E.; LaHusen, R.G. Debris flow Mobilization from landslides. Ann. Rev. Earth Planet. Sci. 1997, 25, 85–138. [Google Scholar] [CrossRef]
- Chepil, W.S. The use of evenly spaced Hemispheres to evaluate aerodynamic forces on a soil surface. Transact. Am. Geophys. Union 1958, 39, 397–404. [Google Scholar] [CrossRef]
Figure 1.
Location of the Xiaoqingling gold mining area.

Figure 2.
The experimental setup. (a) An overview of the experimental setup; (b) The electromagnetic flowmeter and flow balancing valve; (c) The data collection system of the experimental setup.
Figure 2.
The experimental setup. (a) An overview of the experimental setup; (b) The electromagnetic flowmeter and flow balancing valve; (c) The data collection system of the experimental setup.

Figure 3.
Particle size distribution of the modeled mine waste and the in-situ particle size.

Figure 4.
Distribution and serial number of the monitoring points in the landslide dam.

Figure 5.
Failure process of a landslide dam (Q0 = 0.3 L/s, θ = 7°). (a) t = 300 s; (b) t = 540 s; (c) t = 544 s; (d) t = 551 s; (e) t = 573 s; (f) t = 616 s.
Figure 5.
Failure process of a landslide dam (Q0 = 0.3 L/s, θ = 7°). (a) t = 300 s; (b) t = 540 s; (c) t = 544 s; (d) t = 551 s; (e) t = 573 s; (f) t = 616 s.

Figure 6.
Variation in pore water pressure with time for observation points (i.e., sensor locations) in the landslide dam (Q0 = 0.3 L/s, θ = 7°).
Figure 6.
Variation in pore water pressure with time for observation points (i.e., sensor locations) in the landslide dam (Q0 = 0.3 L/s, θ = 7°).

Figure 7.
Transient variations in the pore water pressure, water content, and total stress at point B in the experiments (Q0 = 0.3 L/s, θ = 7°).
Figure 7.
Transient variations in the pore water pressure, water content, and total stress at point B in the experiments (Q0 = 0.3 L/s, θ = 7°).

Figure 8.
Failure process of a landslide dam (Q0 = 0.3 L/s, θ = 9°). (a) t = 50 s; (b) t = 175 s; (c) t = 181 s; (d) t = 183 s; (e) t = 187 s; (f) t = 199 s.
Figure 8.
Failure process of a landslide dam (Q0 = 0.3 L/s, θ = 9°). (a) t = 50 s; (b) t = 175 s; (c) t = 181 s; (d) t = 183 s; (e) t = 187 s; (f) t = 199 s.


Figure 9.
Variation in water pressure with time at different points in the landslide dam (Q0 = 0.3 L/s, θ = 9°).
Figure 9.
Variation in water pressure with time at different points in the landslide dam (Q0 = 0.3 L/s, θ = 9°).

Figure 10.
Variations in pore-water pressure, water content, and total stress with time at point B in the experiment (Q0 = 0.3 L/S, θ = 9°).
Figure 10.
Variations in pore-water pressure, water content, and total stress with time at point B in the experiment (Q0 = 0.3 L/S, θ = 9°).

Figure 11.
Failure process of a landslide dam (Q0 = 1.5 L/S, θ = 6°). (a) t = 10 s; (b) t = 40 s; (c) t = 48 s; (d) t = 52 s; (e) t = 60 s; (f) t = 73 s.
Figure 11.
Failure process of a landslide dam (Q0 = 1.5 L/S, θ = 6°). (a) t = 10 s; (b) t = 40 s; (c) t = 48 s; (d) t = 52 s; (e) t = 60 s; (f) t = 73 s.

Figure 12.
Variation in pore water pressure with time at different points in a landslide dam (Q0 = 1.5 L/S, θ = 6°).
Figure 12.
Variation in pore water pressure with time at different points in a landslide dam (Q0 = 1.5 L/S, θ = 6°).

Figure 13.
Transient variations in pore-water pressures, water content, and total stress at point A in experiments (Q0 = 1.5 L/s, θ = 6°).
Figure 13.
Transient variations in pore-water pressures, water content, and total stress at point A in experiments (Q0 = 1.5 L/s, θ = 6°).

Figure 14.
Failure process and the relationship between the failure modes.

Figure 15.
Physical dimensions of the landslide dam.

Figure 16.
Force analysis of the mine waste particles in the downstream face.

Figure 17.
Relationship between the maximum particle size that can be moved (D), the flow velocity (v), and the total slope angle of the downstream face (α + θ).
Figure 17.
Relationship between the maximum particle size that can be moved (D), the flow velocity (v), and the total slope angle of the downstream face (α + θ).


Table 1.
The technical specifications of sensors.
| Sensor Types | Product Model | Manufacturers | Range of Measurement | Accuracy | Measurement Time |
|---|---|---|---|---|---|
| Pore water pressure | Model 6007 | TSS | 0 to 50 kPa | ±0.5% | 10 ms |
| Total stress | Model 7002 | TSS | 0 to 50 kPa | ±2% | 10 ms |
| Water content | EC-5 | Decagon | 0 to 100% | ±2% | 10 ms |
Table 2.
Summary of the parameters for the 13 experiments.
| Number | H (cm) | α (°) | β (°) | θ (°) | Q0 (L/S) | Failure Modes |
|---|---|---|---|---|---|---|
| 1 | 25 | 32.7 | 41.6 | 5 | 0.3 | Stable |
| 2 | 25 | 34.1 | 43.2 | 6 | 0.3 | Piping, overtopping and erosion |
| 3 | 25 | 34.5 | 42.3 | 7 | 0.3 | Piping, overtopping and erosion |
| 4 | 25 | 32.3 | 45.1 | 8 | 0.3 | Piping, overtopping and erosion |
| 5 | 25 | 33.8 | 42.7 | 9 | 0.3 | Overtopping and soil collapse |
| 6 | 25 | 34.3 | 43.5 | 5 | 1.0 | Overtopping and erosion |
| 7 | 25 | 33.8 | 42.3 | 6 | 1.0 | Overtopping and erosion |
| 8 | 25 | 32.5 | 43.6 | 5 | 1.5 | Overtopping and erosion |
| 9 | 25 | 33.1 | 43.3 | 6 | 1.5 | Overtopping and erosion |
| 10 | 25 | 34.6 | 44.3 | 5 | 2.0 | Overtopping and erosion |
| 11 | 25 | 33.5 | 43.8 | 6 | 2.0 | Overtopping and erosion |
| 12 | 25 | 31.8 | 42.7 | 5 | 2.5 | Overtopping and erosion |
| 13 | 25 | 32.6 | 43.2 | 6 | 2.5 | Overtopping and erosion |
H, α, and β are the height, the angle of the upstream face, and the angle of the downstream face of the landslide dam, respectively, and θ is slope angle of the flume.
© 2019 by the authors. Licensee MDPI, Basel, Switzerland. This article is an open access article distributed under the terms and conditions of the Creative Commons Attribution (CC BY) license (http://creativecommons.org/licenses/by/4.0/).
Share and Cite
MDPI and ACS Style
Zhu, X.; Peng, J.; Jiang, C.; Guo, W. A Preliminary Study of the Failure Modes and Process of Landslide Dams Due to Upstream Flow. Water 2019, 11, 1115. https://doi.org/10.3390/w11061115
AMA Style
Zhu X, Peng J, Jiang C, Guo W. A Preliminary Study of the Failure Modes and Process of Landslide Dams Due to Upstream Flow. Water. 2019; 11(6):1115. https://doi.org/10.3390/w11061115
Chicago/Turabian StyleZhu, Xinghua, Jianbing Peng, Cheng Jiang, and Weilong Guo. 2019. "A Preliminary Study of the Failure Modes and Process of Landslide Dams Due to Upstream Flow" Water 11, no. 6: 1115. https://doi.org/10.3390/w11061115
Note that from the first issue of 2016, this journal uses article numbers instead of page numbers. See further details here.