A Simple Approach to Predicting the Reliability of Small Wastewater Treatment Plants


School of Engineering, Newcastle University, Newcastle Upon Tyne NE1 7RU, UK
*
Author to whom correspondence should be addressed.
Water 2019, 11(11), 2397; https://doi.org/10.3390/w11112397
Submission received: 14 October 2019
/
Revised: 3 November 2019
/
Accepted: 8 November 2019
/
Published: 15 November 2019
(This article belongs to the Special Issue Decentralized Domestic Wastewater and Stormwater Treatment Systems)
Abstract
:The treatment performance of small wastewater treatment plants (WWTPs) is not well understood, and their ecological impact may be underestimated. Growing evidence suggests they play a critical role in ensuring sustainable wastewater management, meaning they can no longer be neglected. The aim of this study was to provide new data, understanding, and analytical approaches to improve the management of existing small WWTPs. A one-year sampling campaign was performed in the rural UK, and we found the effluent quality from twelve small versus three larger WWTPs was significantly poorer (p < 0.05) across a range of performance parameters. Specifically, mean removal rates at the small plants were 67.3 ± 20.4%, 80 ± 33.9%, and 55.5 ± 30.4% for soluble chemical oxygen demand (sCOD), total suspended solids (TSS), and NH4-N (± standard deviation), respectively, whereas equivalent rates for larger plants were 73.3 ± 17.6%, 91.7 ± 4.6%, and 92.9 ± 3.7%. A random forest classification model was found to accurately predict the likelihood of smaller WWTPs becoming unreliable. Importantly, when condensed to the three most ‘important’ predictors, the classifier retained accuracy, which may reduce the data requirements for effective WWTP management. Among the important predictors was population equivalence, suggesting the smallest WWTPs may require particularly stringent management. Growing awareness of the need for sustainable wastewater and water resources management makes this new approach both timely and widely relevant.
1. Introduction
Economies of scale have traditionally been the main argument for centralizing wastewater treatment plants (WWTPs) [1]. Therefore, research has mainly focused on large-scale systems, resulting in a wealth of available operating data and a firm understanding of their overall performance. By contrast, smaller WWTPs are typically overlooked. This may be because they are often only used where there is no other economically viable option [2], their perceived environmental impact is localized, and/or they may be exempt from regulatory conditions [3]. The latter point is of particular importance because regulatory compliance requires monitoring and more effective management. Without mandated monitoring, limited performance data have historically been collected, which now restricts our ability to predict performance and estimate potential discharge impacts. Crites and Tchobanaglous [4] identified protecting receiving environments as one of the key objectives of decentralized WWTPs. However, a huge data gap exists, which is a major barrier to predicting the performance of such systems and is addressed here.
In the UK, small WWTPs typically serve rural or remote communities and often discharge into sensitive water courses. Although limited data exist, it has long been recognized that the ecological impact of such discharges may be underestimated [5,6]. When considering the mechanism by which a waterbody status is determined under the Water Framework Directive (WFD) [7], such underestimation is not surprising. The WFD status of a natural surface waterbody for a particular parameter could be calculated from the median value of all sample points within the waterbody [8]. Therefore, the water quality at a sample point downstream of a small, poorly managed discharge may be sufficiently bad to influence the ecological or overall waterbody status.
Despite substantial investment from the UK water industry (and elsewhere), the number of waterbodies in England achieving “good” or better ecological status under WFD decreased from 26% to 17% between 2009 and 2015 [9]. We suspect that inadequate investment in the management, monitoring, and construction of small WWTPs may be one reason for this, and therefore greater attention and understanding may be critical to achieving the aims of WFD or other environmental regulatory drivers. However, a lack of evidence on system performance, especially operating stability and net environmental impact, hinders managers and policy decision makers addressing declining ecological quality [10]. Therefore, we present here new data from twelve rural WWTPs in Northeast (NE) England and contrast them with equivalent data from three larger, regional WWTPs.
This study specifically sought to assess the effects of size, influent characteristics, and technology type on the performance, stability and reliability of small WWTPs in the UK. Performance over time (bi-monthly sampling over one year) was assessed by different measures of effluent quality and also removal rates of a range of physical–chemical parameters. Here, a small WWTP is defined as receiving less than 50 m3 mean flow per day, which is the low-end boundary for the numerical regulation of continuous discharges in the UK [3]. This flow roughly equates to a population equivalent (PE) of 250, which is typically used as a proxy measure of size where no flow data are available. Throughout, we use the word ‘limit’ in reference to the legally binding standard placed on a continuous final effluent discharge, which is more often referred to as ‘consent’ in the UK.
2. Materials and Methods
2.1. Identification of Study Sites and Experimental Design
A list of registered WWTPs in NE England was obtained from the Annual Return made to the Water Services Regulation Authority (OFWAT) in 2016. The database contained information on 412 treatment plants, of which 274 (66.5%) have a PE of 250 or less. More specifically, 82 are between 50 and 250 PE. For the purposes of this study, the lower limit of investigation was 50 PE. Typically, WWTPs below this size are subject to highly intermittent flows and, within the study region, 55% are only primary treatment systems (i.e., septic tanks), from which obtaining consistent influent samples is difficult.
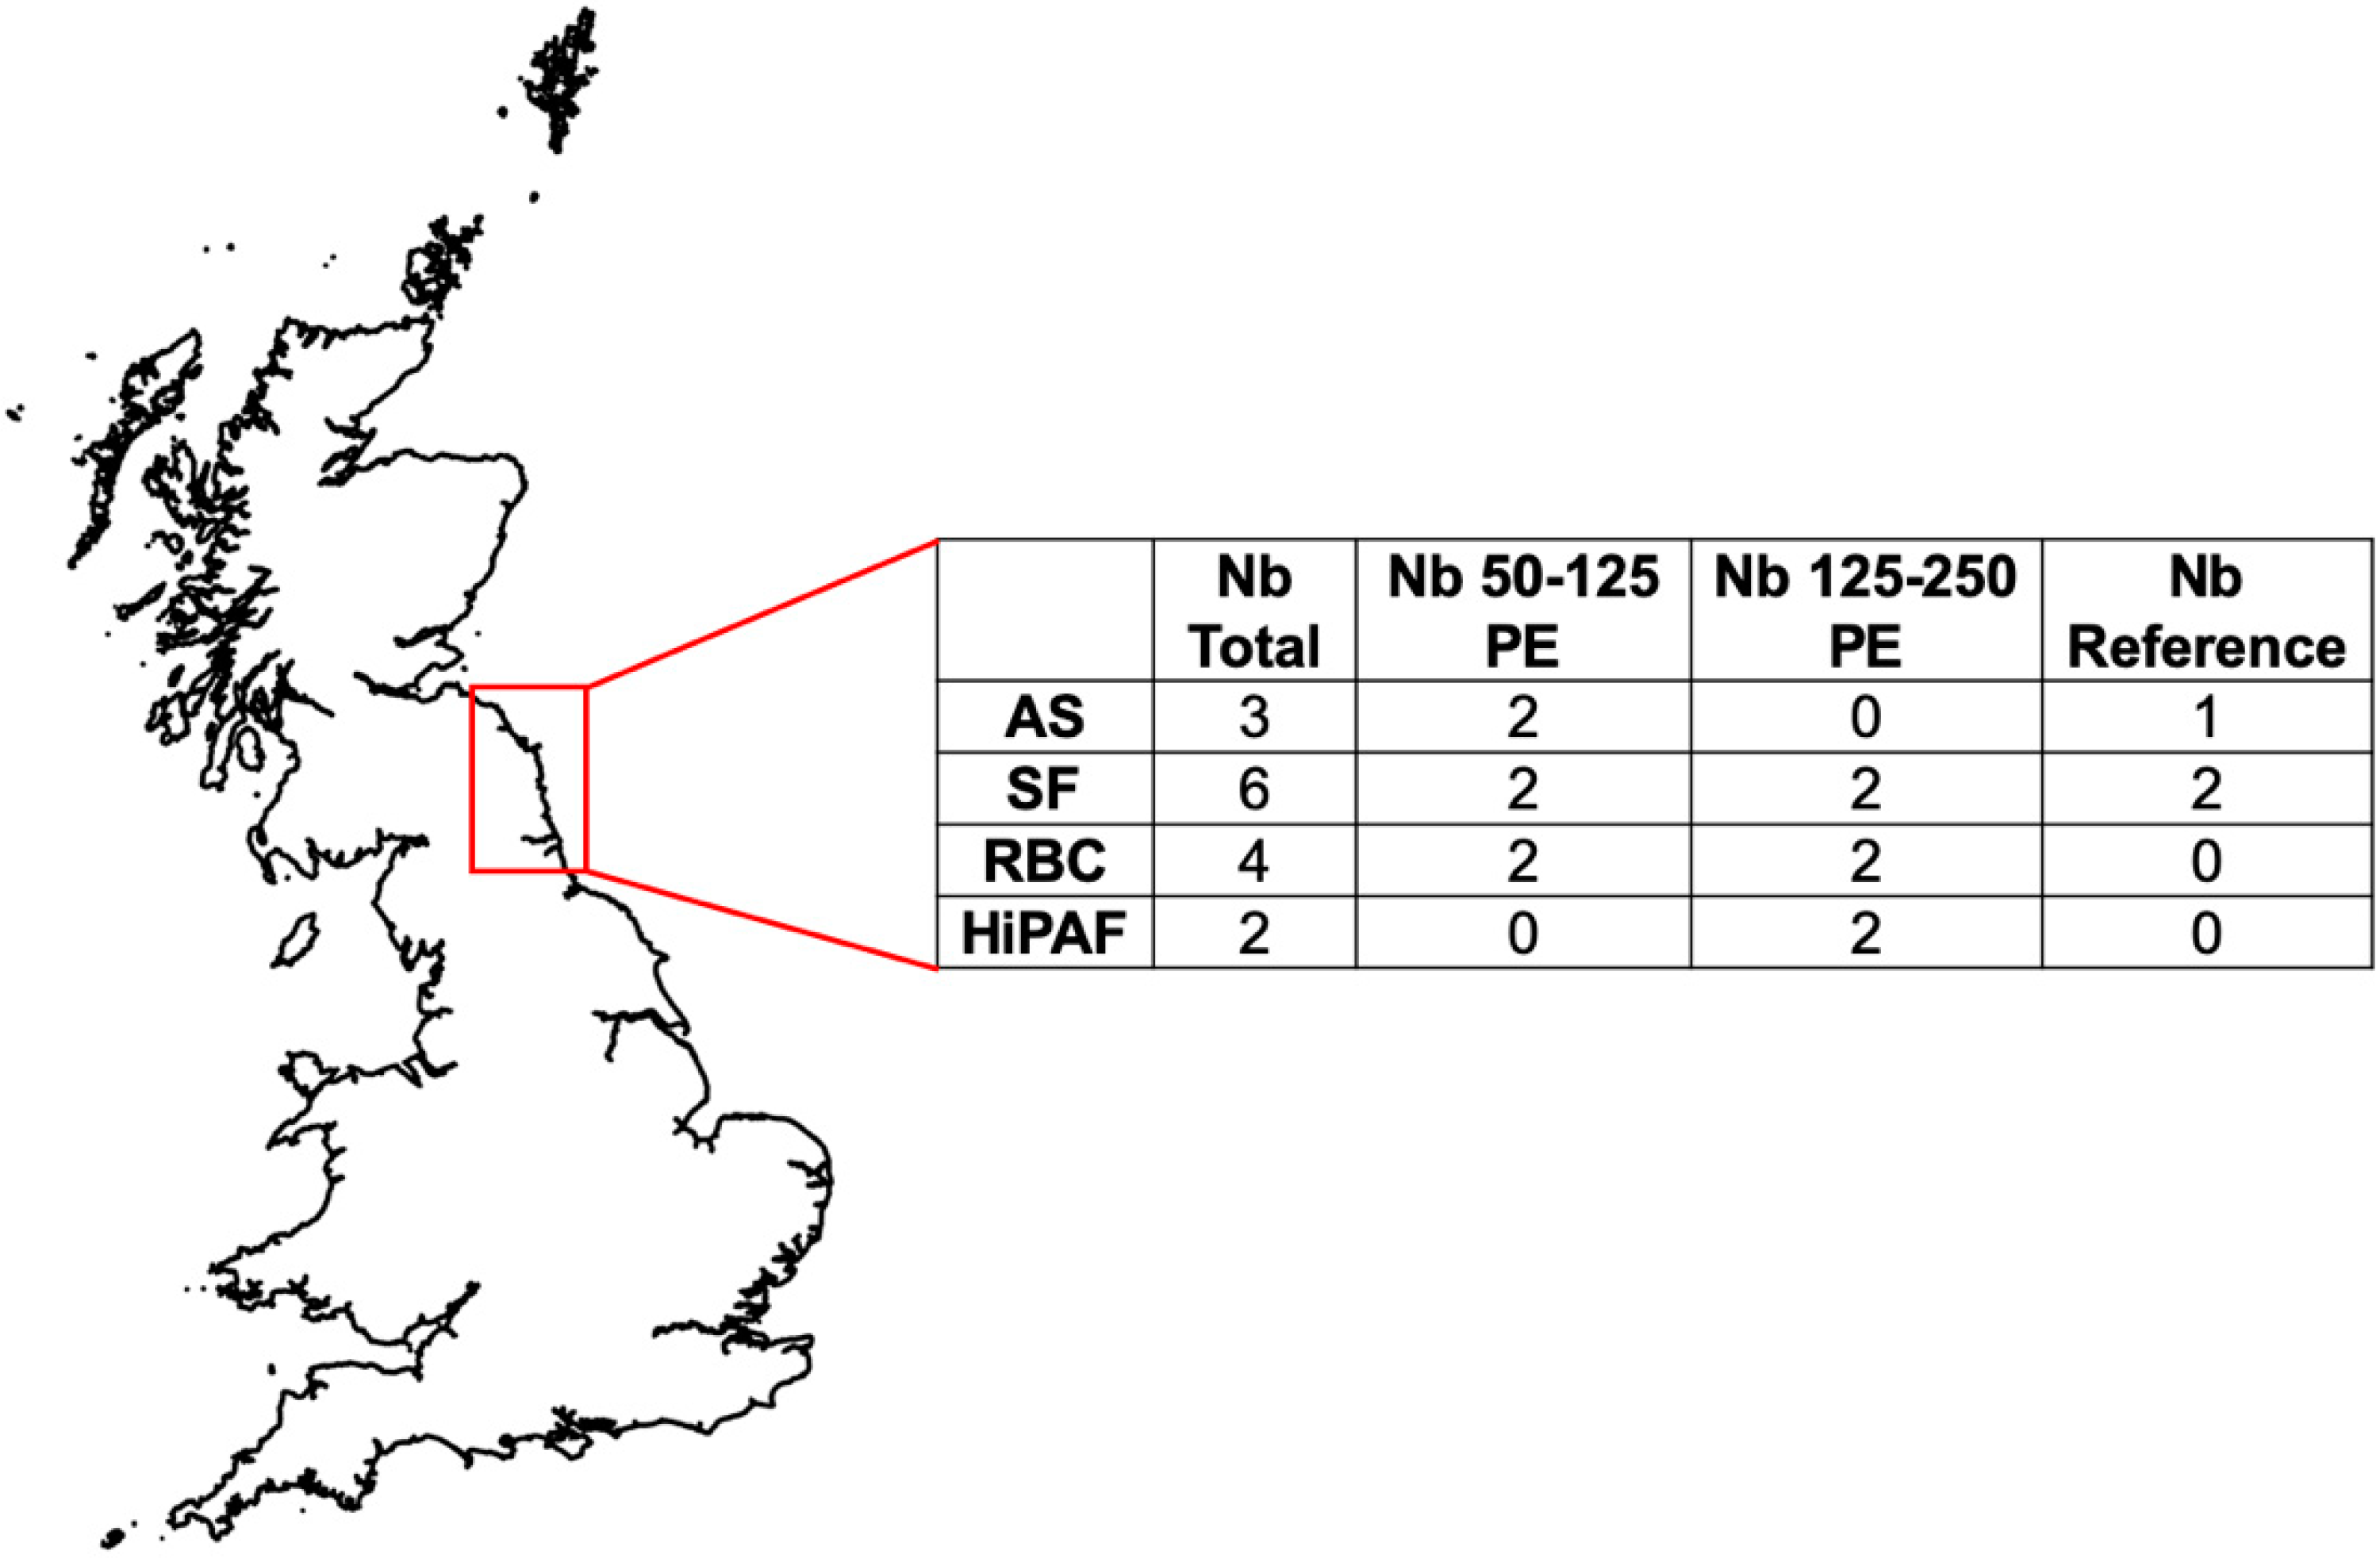
Four main treatment technologies dominated the list of small WWTPs in NE England, including rotating biological contactors (RBC), secondary filtration, which were trickling filters (SF), activated sludge (AS), and high-performance aerated filters (HiPAF). Two size categories (50–125 PE and 125–250 PE) were used for comparative assessment of size, which created six experimental classes: 50–125 RBC, 125–250 RBC, 50–125 AS, 125–250 HiPAF, 50–125 SF, and 125–250 SF, where the number ranges refer to the PE and the letters refer to the technology type. These groupings proportionately represent small WWTPs in the region. A longlist of 36 WWTPs was initially generated by stratified random sampling with consideration of proportional allocations to the above six categories. Twelve WWTPs were then chosen for monitoring, following site visits to determine accessibility and logistical feasibility. Two plants were chosen in each experimental category (Figure 1; see Figure A1 for map of the spatial extent of the study). There were no suitable AS plants between 125 and 250 PE in the study area and no HiPAF plants between 50 and 125 PE. Of the 12 small WWTPs, 4 had flow monitoring. None of the small sites had discharge limits for either ammonia or phosphorus.
Three larger reference WWTPs were chosen to benchmark the performance of the small systems (Figure 1). Specifically, two SF plants and one AS plant were chosen with PE of 7140, 5280, and 9650, respectively. All three reference sites are subject to regulation under the Urban Wastewater Treatment Directive (UWWTD) [11] and have final effluent discharge limits for ammonia. These specific plants were chosen because they predominantly treat domestic wastewater, and the variance of their removal rates of ammonium (NH4-N) and soluble chemical oxygen demand (sCOD) did not exceed 0.1 between August 2013 and July 2016. This suggests they were comparatively “stable” in terms of routine performance and would be suitable for benchmarking. No tertiary treatment was present at any site and there were no known operational issues. Tertiary treatment is an ambiguous term but typically refers to treatment steps additional to the biological degradation of organic matter and nutrients [12]. Thus, it is commonly used for the removal of specific pollutants prior to discharge to sensitive receiving waters.
The statistical power of the sampling program was determined a priori by two-sided and balanced analysis of variance (ANOVA) power calculations using the pwr package in R [13,14]. Sensitivity, as Cohen’s D, was set to ‘moderate’ (0.5), as the effect on performance of a treatment plant being in a designated experimental category was unknown at the start of the study [15]. The significance level was set to 0.05; i.e., 95% confidence. Based on logistical feasibility during the field sampling program, 90 samples were collected across sites for influent and effluent quality and removal rate analyses. Using this sample number, the overall statistical power of the sampling plan was 0.92, implying the sampling regime would produce a dataset suitable for performing statistically significant comparisons across the WWTPs. For each experimental category, 12 influent and 12 effluent samples were collected symmetrically over one year, except for the reference AS plant category, which only had six influent and effluent samples collected over the year. This experimental design provided a statistical power of 0.9 for any inter-category comparisons.
2.2. Sampling Approach and Collection
Manual, time-apportioned, composite samples of raw influent and final effluent were collected at each site, every two months between December 2016 and October 2017. This provided 90 influent and 90 final effluent samples for analysis. Typical peak and daytime base flowrates were determined by calculating the mean time at which these flows occurred at selected WWTPs in the region. Flow data for 2013–2016 were obtained, from the asset owners, for the Monitoring Certification Scheme (MCERTS) flow monitors installed at 25 decentralized WWTPs. Thus, peak flowrate samples were collected between 08:00 and 09:00 and base flowrate samples were collected between 14:30 and 15:30 on the same day of the month for each site. This was important to negate any effect of sample collection time on wastewater content.
Influent and effluent samples always were collected in 1 L bottles (Nalgene, Rochester, USA), both at estimated peak and base flows, and samples were combined at the time of collection to create composite influent and effluent samples. The bottles were transferred on ice to Newcastle University and stored at 4 °C until analysis. On-site measurements of dissolved oxygen (DO) were made using a DO600 meter (Extech, Nashua, USA) and ambient temperature, wastewater temperature, and pH were measured using an EC500 meter (Extech, Nashua, USA).
2.3. Physical and Chemical Analysis
All analyses were carried out in duplicate within 24 h of sample collection. The wastewater in each bottle was homogenized by gentle upending. Analysis of total and soluble COD (tCOD; sCOD), ammonium (NH4-N), and total phosphorus (TP) was carried out using colorimetric kits (Merck, Germany) in accordance with the Standard Methods for the Examination of Water and Wastewater [16]. For the analysis of bioavailable fractions of COD and NH4-N, samples were filtered using a 0.2 µm nylon syringe filter (VWR, Lutterworth, UK). Analysis of secondary nutrients was carried out using acid washed plastic to minimize procedural losses. Total suspended solids (TSS) levels were determined by concentrating suspended matter onto a GM6 glass filter membrane (Sartorius, Geottingen, Germany) and incineration at 105 °C until consistent weight at five significant figures. Determination of anions of nitrogen (NO2-N; NO3-N) was performed by ion chromatography using an ICS-1000 system (Dionex, Sunnyvale, USA) fitted with an AS40 auto sampler (Thermo Scientific, Whaltham, USA).
2.4. Data Analysis and Statistical Observation
All statistical analysis was carried out using the statistical programming language R [14] and significance was defined by 95% confidence limits (p < 0.05), unless otherwise stated. Two DO concentration data points were missing in the raw data set. Prior to statistical analysis, the missing data were inferred using weighted average K-nearest neighbor imputation with K set to 10, using a pre-scaled dataset. To assess the performance differences between experimental categories, one-way ANOVA was used on effluent concentration parameters and removal rates.
2.5. Reliability Analysis
To assess the stability of the effluent quality from the 12 small WWTPs against the larger benchmark sites, covariance of key parameters was calculated and represented graphically using the ggplot2 package [17]. To further assess differences in performance stability between small treatment plants, reliability analysis [18] was carried out using tCOD effluent concentration data. A coefficient of reliability (COR) was derived (Equation (1)) from the covariance of the parameter over the sample time-series and the probability of compliance (Equation (2)), where y is the coefficient of variance; Z1-a is the standardized normal variate obtained from Tables generated by Niku [18]; Xs is the required discharge standard; and mx is the mean measured effluent concentration for tCOD:
The COR was multiplied by the Urban Wastewater Treatment Directive (UWWTD) limit to define the “acceptable” final effluent tCOD concentration, which is currently 125 mg-COD/L for England and Wales (Equation (3)), where ms is the design concentration:
The design concentration is defined as the effluent quality that is needed to comply with the required discharge standard at a pre-determined confidence, which was 99% confidence here. Note that this is different to a statistical confidence and derived from lookup tables included by [18].
2.6. Prediction of Treatment Plant Reliability
The exceedance of the tCOD effluent concentrations over the calculated design concentration at each small-scale WWTP was predicted using random forest (RF) classification. RF is a powerful machine learning classifier which has key advantages, including being robust to outliers and dataset noise, and the ability to identify parameter importance [19,20]. Modeling was done using the caret package [21] in R with a 70/30 randomly determined train/test data split, which was chosen because of the ratio of sample numbers to the number of unique sample sites. Cross-validation was carried out 10 times by comparing the area under the receiver operating characteristics (ROC) curve as the metric for model performance [22]. The optimized model was built using 59 trees, which was identified as the point at which the minimum mean standard error (MSE) occurred in model training.
Cross-correlations between predictor variables were determined using Spearman’s rank correlations. The variables used were influent concentrations of tCOD, TSS, NH4-N, and DO; influent pH and temperature; atmospheric temperature; season; PE; treatment technology type; and the number of times that the site was visited by an operator each week. The correlation between concentrations of TSS and tCOD in the influent samples had an r2 of greater than 0.75, therefore TSS was removed from the model dataset to reduce the chance of false positive predictions. The importance of each predictor variable was calculated by comparing the cross-validated MSE of the model performance with the performance when withholding each predictor in turn. The resulting differences were averaged and normalized by the standard error, and the parameter causing the greatest difference in normalized MSE was determined to be the most important.
3. Results and Discussion
3.1. Analysis of Experimental Categories
A summary of effluent concentrations and removal rates for the smaller and larger WWTPs is presented in Table 1. Final effluent sCOD concentrations for the 12 smaller WWTPs ranged from 21 mg/L to 317.5 mg/L, with a mean value of 64.1 mg/L. The range of tCOD concentrations in smaller systems was 22.0 to 727 mg/L, which is strongly correlated with TSS. The mean effluent tCOD was 114.6 mg/L. By contrast, at the larger benchmark plants, maximum effluent tCOD levels were an order of magnitude lower than smaller plants, with mean effluent concentrations for sCOD and tCOD of 64.0 mg/L and 77.5 mg/L, respectively. Effluent NH4-N concentrations at the smaller WWTPs ranged from 1.75 mg/L to 49.2 mg/L, with a mean value of 16.5 mg/L, whereas NH4-N concentrations in the final effluent of the larger WWTPs were on average 2.2 mg/L (never exceeding 5.2 mg/L).
The effluent quality for the smaller WWTPs was much more variable than the larger plants for all parameters, except pH and DO. The largest observed standard deviation (SD) among effluent parameters was for tCOD at the smaller WWTPs and NO3-N for the larger plants. No tCOD regulation typically exists on discharge concentrations for the smaller WWTPs, therefore they are not routinely controlled. This is evident in the measured highest effluent concentration of 727 mg/L, which was six times higher than the mean. The lowest SD was observed in pH and DO effluent values.
In terms of removal rates, the parameter with the highest mean rate of removal at smaller WWTPs was TSS (80.0%), whereas mean removal rates were highest for NH4-N at the larger WWTPs (92.9%). The SD of removal rates across larger plants was lowest for NH4-N, which is probably a result of explicit discharge regulations. The lowest SD amongst removal rates at smaller WWTPs was for sCOD, but this was still >20 mg/L and suggests a high level of variance in effluent quality. In fact, one small WWTP had effluent quality poorer than influent quality. The lowest SD at the larger WWTPs was for NH4-N (3.7 mg/L).
There was a significant difference between the mean effluent values of the design categories across all parameters except NO3-N at 95% confidence (ANOVA, 4 × 10⁻¹⁰ < p < 3.9 × 10⁻³; p = 0.06 for NO3-N). The similarity between NO3-N effluent values may be because most small WWTPs serve rural communities. This presumably means more farms, which might lead to an increased load of NO3-N entering the wastewater collection system, which would probably not be removed and would thus be present in effluent discharges. However, without being able to determine load fluxes or specific process mechanisms, it is not possible to confirm this speculation. Other than NO3-N, the least confidence in significance was between pH among final effluent samples, which is not surprising when considering the SD of values for both small and larger plants (Table 1). For removal rates, there was also a significant difference between the removal rates at the different WWTP sizes and technologies, across all parameters (ANOVA, 2.5 × 10⁻⁹ < p < 2.5 × 10⁻⁴).
3.2. Covariance of Effluent Parameters
Covariance data on final effluent parameters from the 12 small WWTPs are summarized in Figure 2. The correlation between the mean effluent concentration and the SD was strongest for tCOD (r2 = 0.93). This demonstrates a strong relationship between the treatment performance and operational stability across treatment systems. A similarly strong trend was seen for sCOD and TSS (r2 = 0.75 for both), and also for NH4-N (r2 = 0.84), which is surprising because none of the small WWTPs had a discharge limit for NH4-N at the time of the study. This is interesting, because the smaller WWTPs are unlikely to have been designed for or operated in order to achieve nitrification, and yet some small treatment systems are consistently sustaining some nitrification. This suggests that observed trends of covariance are probably a ‘natural’ phenomenon rather than a result of operational practices or engineered design. In other words, conditions promoting nitrification have occurred by ‘chance’ and have developed to be relatively stable over time.
In terms of TP, while there was a significant difference in removal rates between the large and small WWTPs (ANOVA, p < 0.05), covariance trends between performance and stability were relatively weak (r2 = 0.45). None of the monitored WWTPs have phosphorus removal technologies. It is much less likely that TP removal, especially by enhanced biological removal, will occur by chance, compared with nitrification. The three larger treatment systems are clustered to the lower left-hand corner of the plot (i.e., higher quality effluent and greater stability) for all parameters except for TP. After this, the next most obvious observation on performance versus stability covariance trends is differences among technology types. The package plants tend to discharge higher quality effluent on average and do so more consistently. For example, the SD of NH4-N ranged between about 3 and 8 mg/L for RBC and HiPAF treatment types (Figure 2e). It was, however, not possible from this covariance analysis to exactly determine the role treatment type (or any other factor) played in the stability of effluent quality.
3.3. Reliability of Small Wastewater Treatment Plants
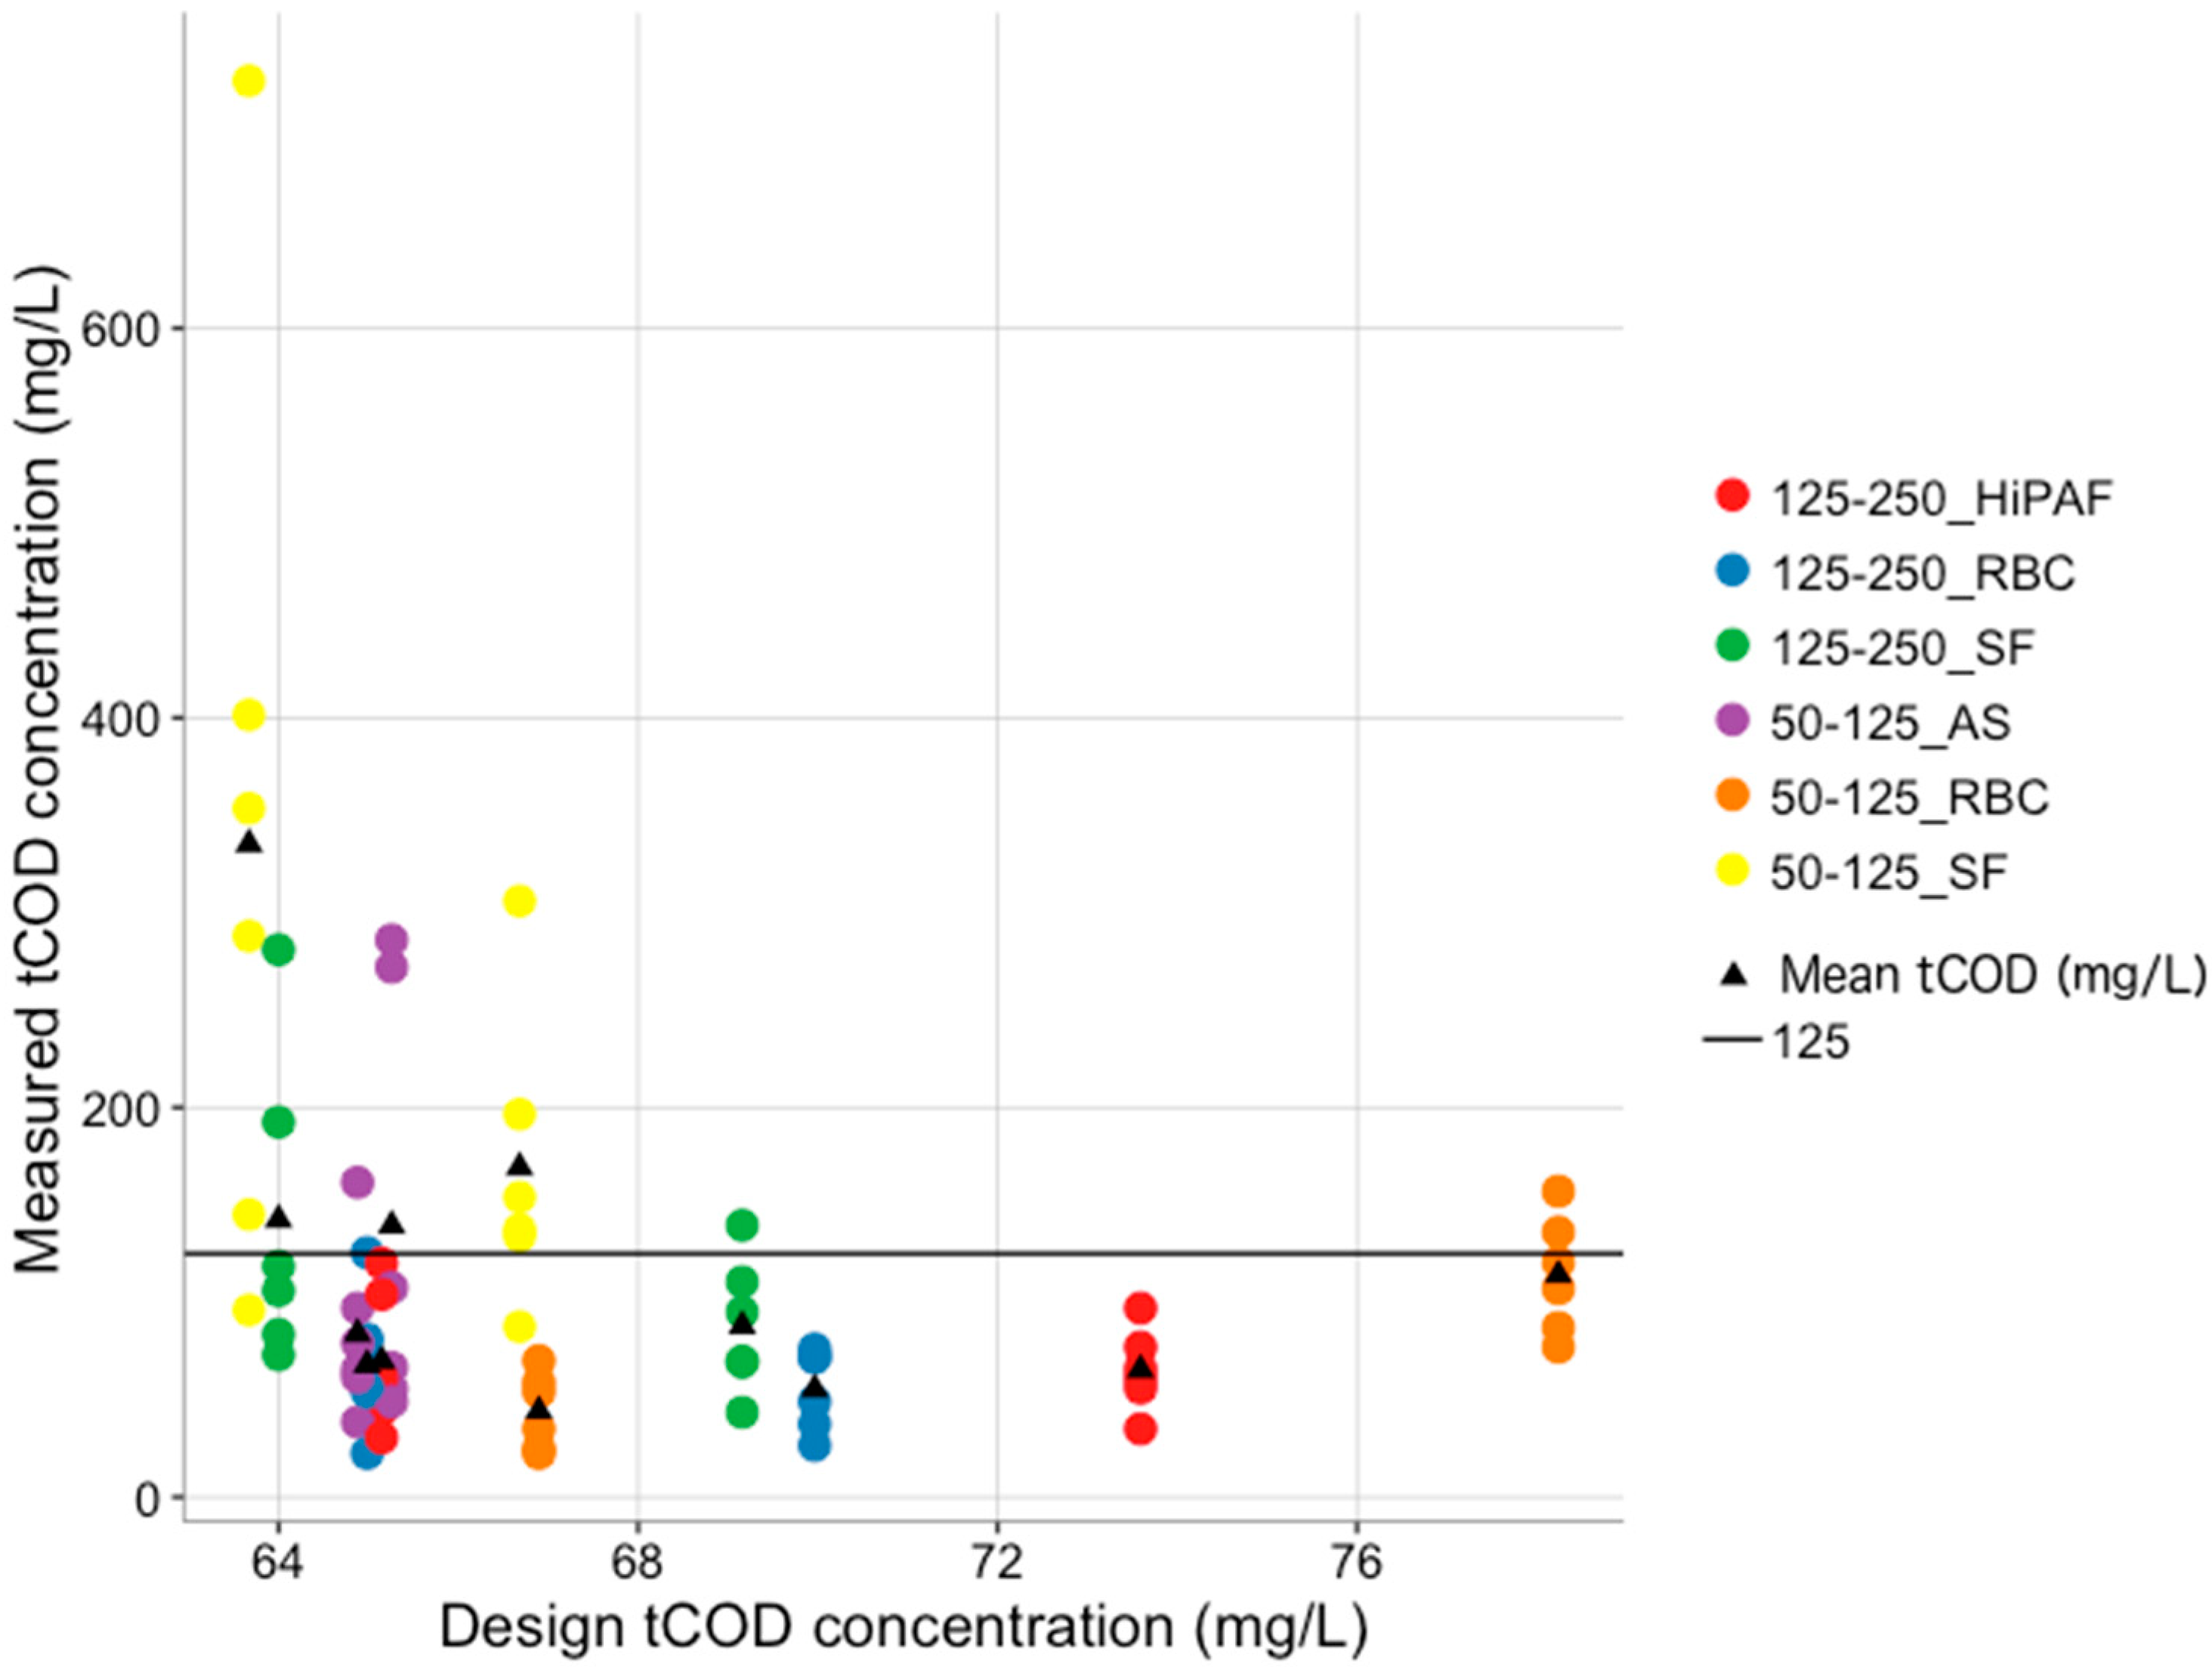
Design concentrations for tCOD for each small WWTP are summarized in Figure 3, grouped by the WWTP size and technology type. The lowest effluent concentration required to maintain compliance with the UWWTD tCOD discharge standards at 99% confidence is 63.7 mg/L. Given this criterion, it is not surprising that one of the 50–125 PE trickling filters had the highest mean tCOD effluent concentration, well beyond discharge standards (727 mg/L). The highest design concentration was 78.2 mg/L, which was calculated for the RBC with a PE of between 50 and 125.
Whilst the range of design concentrations was relatively small (14.5 mg/L), there was a clear inverse relationship between the measured and design concentrations (Figure 3). However, two WWTPs that had mean effluent concentrations of >125 mg/L had design concentrations higher than three of the treatment systems with mean concentrations >125 mg/L. This confirms that calculations driven by covariance and probability analysis are not simply the average of measured values or numerical distance from the mean (i.e., SD). Means and SDs are both useful at times, but are ultimately limited measures of performance because of the underlying assumptions upon which their implications depend. Specifically, the assumption of a Gaussian or additive normal distribution [23], which may not summarize the characteristics of every parameter of interest. Therefore, other methods are needed to better understand performance trends, which may allow deeper insights into risks of WWTP compliance failure, ideally also aimed at ecological improvement in catchments. While we do not endorse neglecting sites that appear to provide stable performance naturally, increased awareness of a WWTP’s reliability means that operational practices and allocation of resources can be optimized, including more accurately allocating suitable levels of maintenance to achieve optimal performance.
The experimental groups with the most similar design concentrations, and therefore the most similar effluent quality (measured as tCOD concentration, only), were small AS WWTPs with a PE between 50 and 125 (50–125_SAS). Considering the position of these two systems in the covariance plots (Figure 2), it is apparent the observation is also relevant for other treatment performance parameters.
3.4. Prediction of Small Wastewater Treatment Plant Reliability
Whilst it is useful to observe the evident similarity of effluent quality that was discharged from small AS plants, it is perhaps more important to understand what drives or influences such trends. The adage, “no two WWTPs are the same” may be true, but there also may be enough similarity between the performance of different systems to identify dominant predictors. Thus, we applied a simple machine learning algorithm to predict the reliability of the small WWTPs assessed in this study, which determined the likelihood of tCOD effluent concentrations exceeding site-specific design concentrations (Figure 3).
An optimized RF classification model was used to predict the exceedance of the effluent concentration over the design concentration, with an accuracy of 64.2% and, therefore, a mean standard error of 0.358. This model was chosen after comparison with the performance of a gradient boosting machine and a generalized linear model (see Appendix A for further details on the performance of different models). The RF model correctly predicted the effluent tCOD concentration exceeding the design concentration for 71.4% of the samples. In contrast, the model correctly predicted the effluent tCOD concentration not exceeding the design concentration for 57.1% of the samples (Table 2). This suggests the model is conservative, which may appeal to risk managers responsible for prioritizing asset investment against regulatory compliance or environmental targets. Such an approach might be useful for forecasting the performance reliability of multiple small WWTPs, simultaneously. The implication of the data is that there may be enough similarity between different sites to establish underlying trends and drivers of performance.
Considering the performance of the model for each of the six small WWTP categories, it is clear that the reliability of the package plants (especially RBCs) was harder to predict than the more traditional technologies (Table 3). For example, the model correctly predicted the likelihood of the effluent concentration exceeding the design concentration for all samples collected at trickling filter sites. This is likely because the stability of effluent quality discharged from the RBCs is generally higher than other plants, which makes the difference between the measured effluent concentration and the design concentration small and therefore, harder to predict.
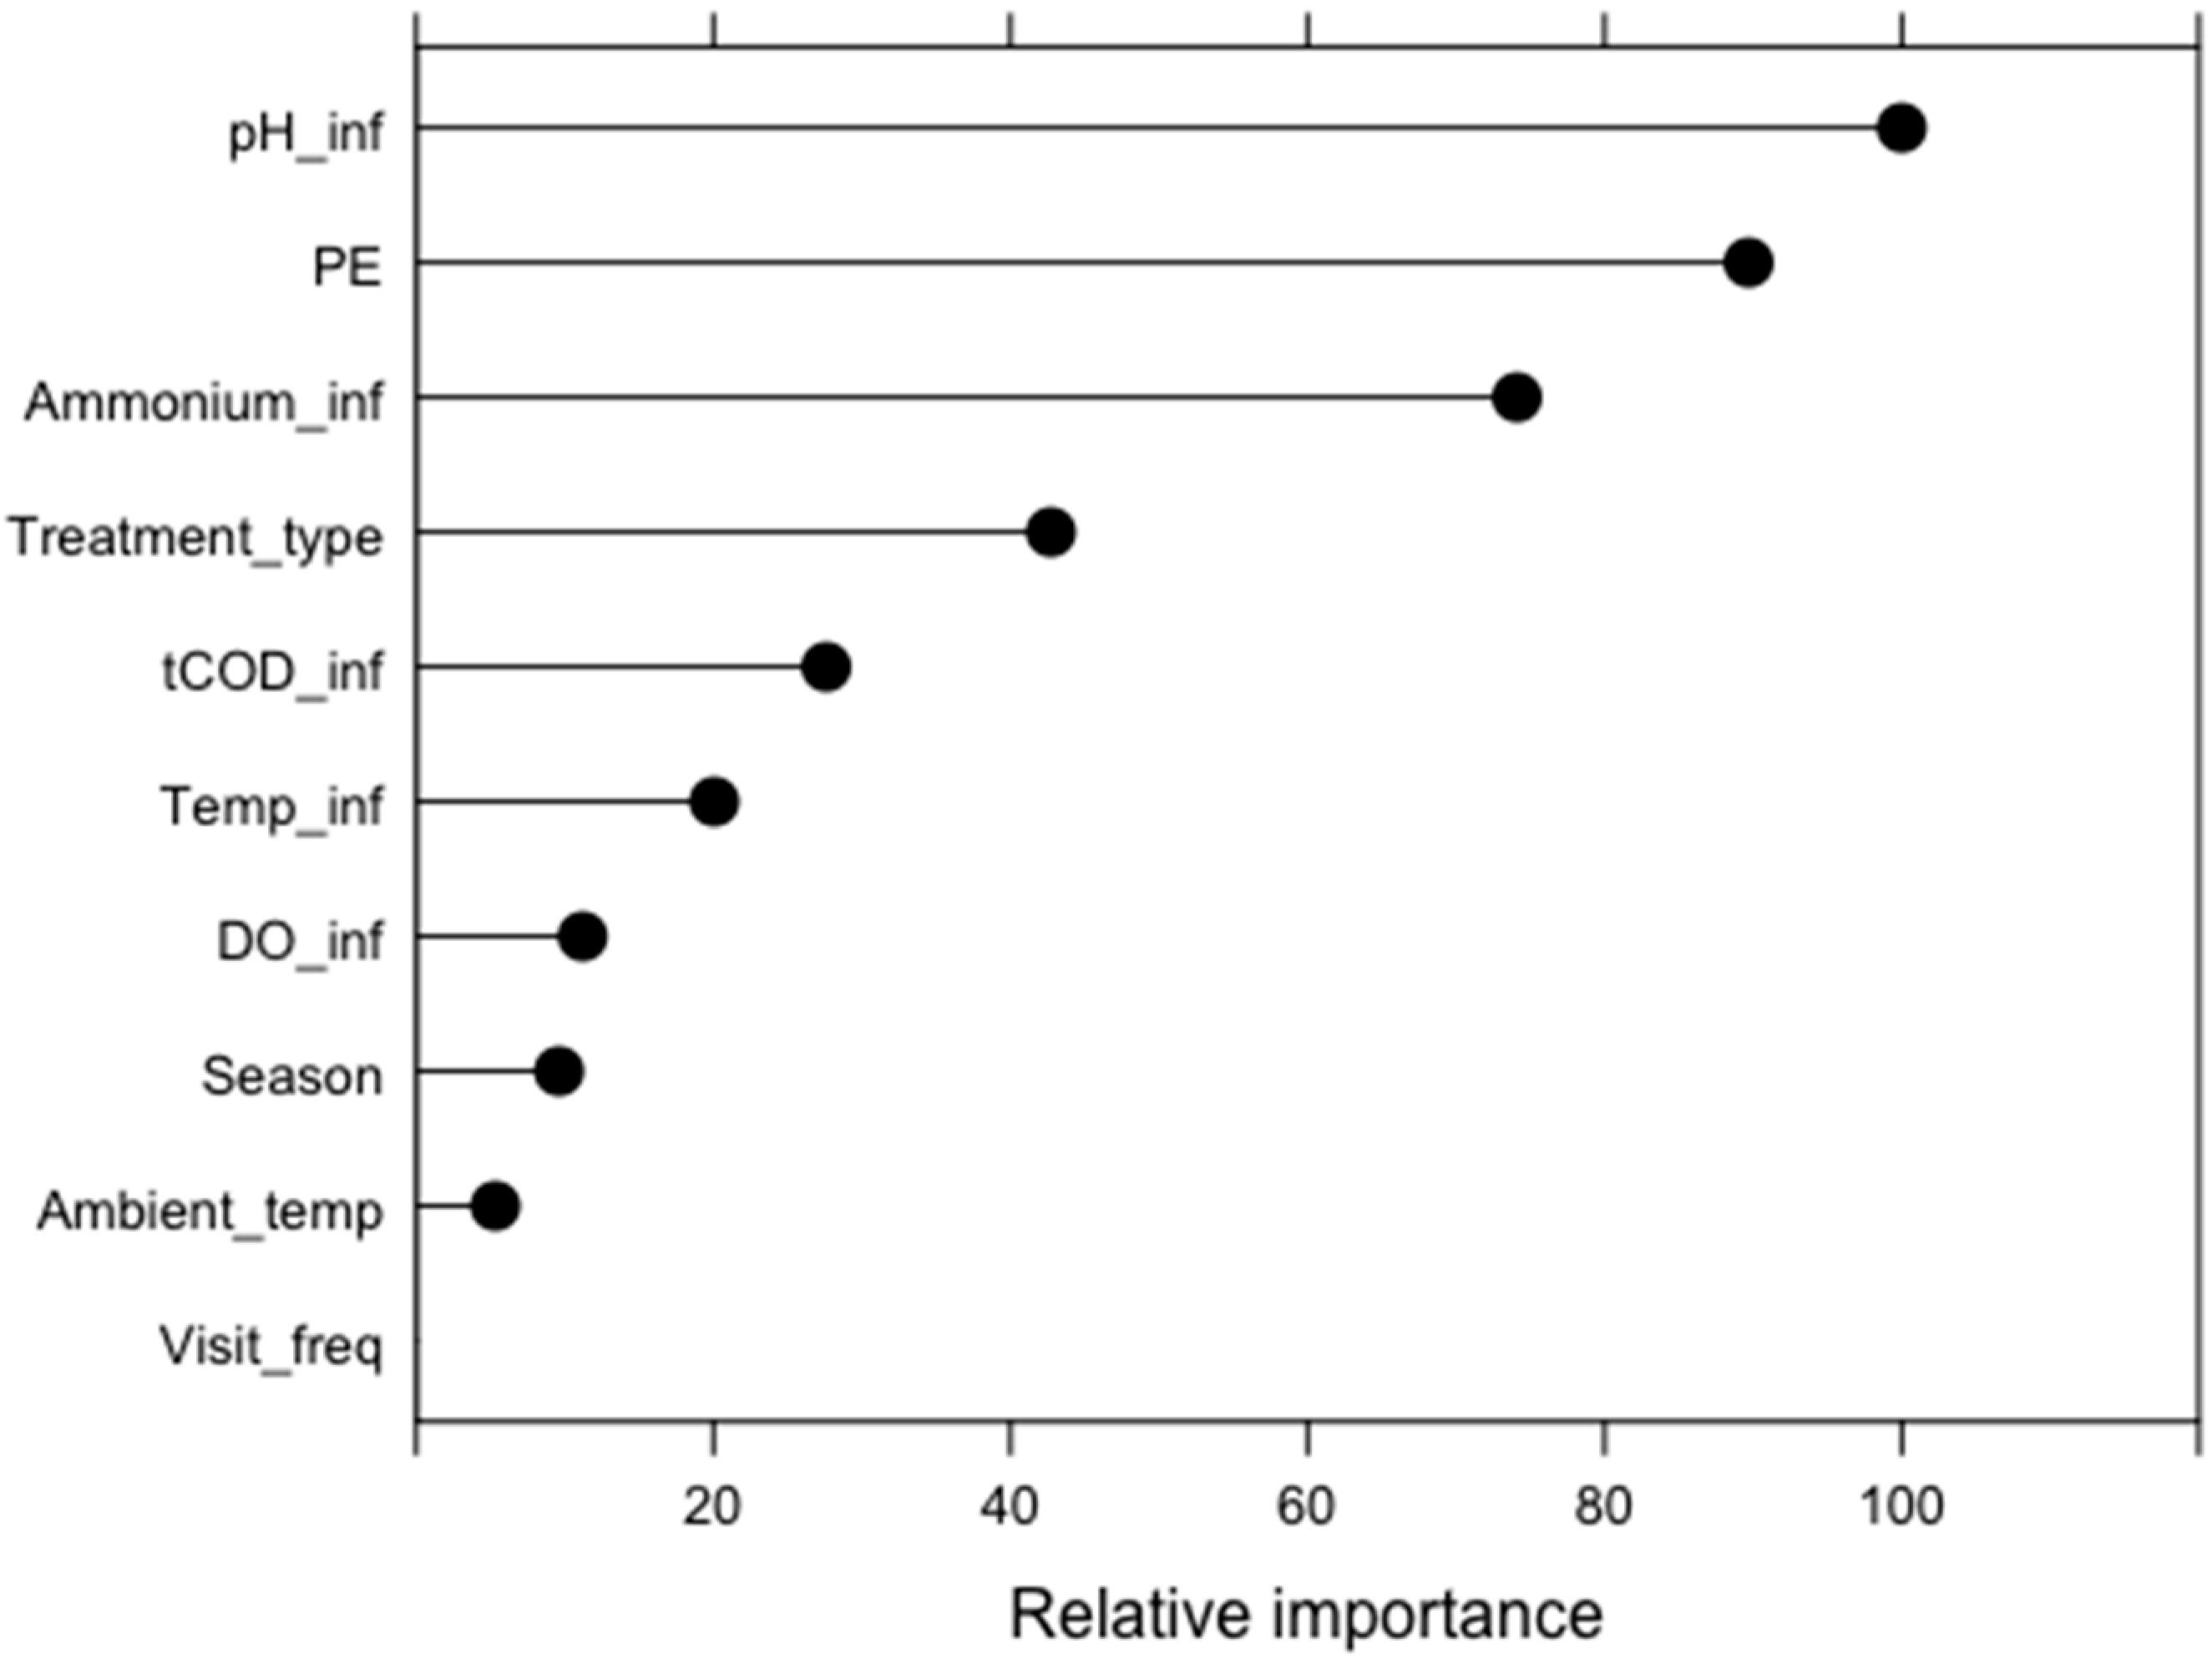
The relative value of different model predictors is shown in Figure 4, which shows that influent wastewater characteristics and PE were the most important. Interestingly, the size of a treatment system appears to be more important to effluent quality than the treatment technology itself. This is supported, at least in part, by the variance observed between treatment plants within the same experimental category and differences among categories (Figure 2 and Figure 3). Furthermore, the smallest WWTPs (50–125 PE) appear to be consistently less stable (i.e., greater variability in effluent quality) than the sites with a PE between 125 and 250. It may not be appropriate to categorize all WWTPs according to these PE bands, but the model outputs combined with the analysis of the experimental categories suggest that these groupings may be sufficient and useful for assessing the influence of different parameters on treatment performance.
In contrast to system size and influent characteristics, most other predictors had relatively little importance in predicting effluent stability (<60, Figure 4). The significant difference (unpaired t-test, p < 0.05) between wastewater and ambient air temperatures implies a buffering effect against the latter. This explains why seasonal changes were relatively unimportant as a predictor of resilience. However, while the temperature of the liquid influent was somewhat important, it did not appear to be a dominant predictor in this model. Interestingly, the DO concentration of the influent also had relatively little importance. This is likely because the effects of aeration capacity or hydraulic retention time, which were not considered here, both influence performance regardless of the influent DO concentration.
The final parameter of note relative to system performance is the frequency of visits to sites by operators. This parameter was included here as an indicator of the effect of operational practice. In the UK and elsewhere, the frequency at which small WWTPs are visited by operators can vary from several times per week to once every couple of months. The frequency of operator visits appears relatively unimportant and a poor predictor of WWTP stability (Figure 4). This might be because the actual activity during each site visit can vary, both between sites and through time. Activities might range from checking pumps and plumbing to assessing controls, cleaning lines, and other incidental activities. However, implicitly, this suggests the original design and sizing of the processes are more important to day-to-day treatment performance. This seems to be especially true of smaller WWTPs that do not appear to be improved by simply increasing operational maintenance (e.g., cleaning).
3.5. Model Simplification
In an attempt to simplify the predictive model, all input parameters with a relative importance below 75 (Figure 4) were removed. This meant the independent variables in the simplified model were pH of the influent, NH4-N concentration of the influent, and the PE. The presence of influent pH and NH4-N concentration in this list may be because they act as indicator metrics for the overall wastewater ‘strength’, rather than because the pH or NH4-N themselves control the reliability of tCOD effluent concentration. RF classification using the same input conditions and training dataset as previously described generated an accuracy of 66.1%, which is an increase of approximately 2% compared to modeling with all parameters. Whilst such a marginal improvement might be attributed to chance, it is encouraging that the prediction of small WWTP reliability can be condensed to just three parameters without any great loss of accuracy. This is important because it reduces the data requirements at small sites (making some monitoring more feasible), and still allows wastewater managers to predict whether or not these systems might become unreliable.
4. Conclusions
Limited understanding of small WWTPs is driven largely by a lack of available operational performance and impact data. Here, we showed that the stability and effluent quality of smaller systems is significantly poorer than their larger counterparts. However, the influence of size extends beyond what has been previously recognized, especially how system size relates to consistent compliance with possible limits. Specifically, the smallest WWTPs (50–125 PE) appeared less stable than the slightly larger WWTPs (125–250 PE), across all technology types. Package plants, especially RBCs, provided more stable treatment performance and better effluent quality overall. These trends were also reflected in the reliability of the different systems. A simple model showed that the reliability of the effluent quality discharged from small WWTPs can be predicted using just three parameters (influent pH, PE, and influent NH4-N concentration) to a reasonable degree of accuracy.
More generally, the work shows how comparatively simple mathematical techniques can be used to provide insight into the performance and reliability of smaller WWTPs, which might improve operational efficiency. Such analysis can inform a more strategic approach to managing effluent releases in rural and remote catchments, particularly to achieve regulatory compliance, reduce environmental impact, or prioritize operational and capital investment. Prioritizing interventions across a system of small WWTPs is essential if environmental aspirations are to be achieved cost-effectively. This analysis provided a demonstration of how that might be possible, suggesting also that monitoring just three parameters may provide sufficient data to allow accurate failure prediction. There is a growing recognition of the benefits of decentralized wastewater infrastructure. Using the methods here, we provide new data and models for wastewater and asset managers that help realize the potential of smaller systems, including the role they can play in achieving ecological goals in more remote locations.
Author Contributions
Conceptualization, J.T.B. and D.W.G.; formal analysis, J.T.B.; data curation, J.T.B.; writing—original draft preparation, J.T.B.; writing—review and editing, D.W.G.; supervision, D.W.G.; funding acquisition, D.W.G.
Funding
This research was funded by the Engineering and Physical Sciences Research Council, grant number EP/M50791X/1) and Northumbrian Water Ltd.
Acknowledgments
The authors wish to thank Luke Dennis for his assistance in obtaining operational data.
Conflicts of Interest
The authors declare no conflict of interest.
Appendix A
Figure A1.
Location of WWTPs sampled by treatment plant type. AS is activated sludge, SF is secondary filtration, HiPAF is high performance aerated filter, and RBC is rotating biological contactor.
Figure A1.
Location of WWTPs sampled by treatment plant type. AS is activated sludge, SF is secondary filtration, HiPAF is high performance aerated filter, and RBC is rotating biological contactor.


Table A1.
Performance criteria of three models tested to predict the reliability of small WWTPs. MSE is the mean standard error.
Table A1.
Performance criteria of three models tested to predict the reliability of small WWTPs. MSE is the mean standard error.
| Model | Accuracy | Sensitivity | MSE |
|---|---|---|---|
| Random Forest | 64.2% | 0.92 | 0.36 |
| Gradient Boosting Machine | 47.6% | 0.42 | 0.52 |
| Generalized Linear Model | 52.4% | 0.67 | 0.48 |
Table A2.
Confusion matrix for gradient boosting machine when predicting the reliability of small WWTPs.
Table A2.
Confusion matrix for gradient boosting machine when predicting the reliability of small WWTPs.
| Reference | |||
|---|---|---|---|
| Actual > Design | Actual < Design | ||
| Prediction | Actual > Design | 41.67% | 44.44% |
| Actual < Design | 58.33% | 55.56% | |
Table A3.
Confusion matrix for gradient boosting machine when predicting the reliability of small WWTPs.
Table A3.
Confusion matrix for gradient boosting machine when predicting the reliability of small WWTPs.
| Reference | |||
|---|---|---|---|
| Actual > Design | Actual < Design | ||
| Prediction | Actual > Design | 66.67% | 66.67% |
| Actual < Design | 33.33% | 33.33% | |
References
- McCarty, P.L.; Bae, J.; Kim, J. Domestic wastewater treatment as a net energy producer—Can this be achieved? Environ. Sci. Technol. 2011, 45, 7100–7106. [Google Scholar] [CrossRef] [PubMed]
- Larsen, T.A.; Alder, A.C.; Eggen, R.I.L.; Maurer, M.; Lienert, J. A new planning and design paradigm to achieve sustainable resource recovery from wastewater. Environ. Sci. Technol. 2009, 43, 6126–6130. [Google Scholar]
- DEFRA. Environmental Permitting (England and Wales) Regulations 2010; Statutory Instrument No. 675 Environmental Permitting (England and Wales) Regulations 2010, Statutory Instrument No. 675; DEFRA: London, UK, 2010.
- Crites, R.; Tchobanoglous, G. Chapter 7: Biological treatment and nutrent removal. In Small and Decentralised Wastewater Management Systems; KT, K., Munson, E., Haag, G., Tchobanoglous, G., Eds.; WCB McGraw Hill: New York, NY, USA, 1998; pp. 397–526. [Google Scholar]
- Pujol, R.; Lienard, A. Qualitative and quantitative characterization of waste water for small communities. In Proceedings of the International Specialized Conference on Design and Operation of Small Wastewater Treatment Plants, Trondheim, Norway, 26–28 June 1989; Odegaard, H., Ed.; 1989; pp. 267–274. [Google Scholar]
- May, L.; Place, C.; OMalley, M.; Spears, B.M. The Impact of Phosphorus Inputs from Small Discharges on Designated Freshwater Sites; Natural England Commissioned Reports, Number 170; Natural England: London, UK, 2015. [Google Scholar]
- EC. Directive 2000/60/EC of the European Parliament and of the Council of 23 October 2000 establishing a framework for Community action in the field of water policy. Off. J. Eur. Parliam. 2000, L327, 1–82. [Google Scholar]
- UK Technical Advisory Group on the Water Framework Directive. Recommendations on Surface Water Classification Schemes for the Purposes of the Water Framework Directive; UK Technical Advisory Group on the Water Framework Directive: London, UK, 2009. [Google Scholar]
- Environment Agency. Update to the River Basin Management Plans in England; National Evidence and Data Report; Environment Agency: Bristol, UK, 2015. [Google Scholar]
- Chong, M.N.; Ho, A.N.M.; Gardner, T.; Sharma, A.K.; Hood, B. Assessing decentralised wastewater treatment technologies: Correlating technology selection to system robustness, energy consumption and GHG emission. In Proceedings of the International Conference on Integrated Water Management, Perth, Western Australia, 2–5 February 2011. [Google Scholar]
- EC. Council Directive concerning urban waste water treatment. Off. J. Eur. Communities 1991, 135, 40–52. [Google Scholar]
- Tchobanoglous, G.; Burton, F.; Stensel, D. Wastewater Engineering: Treatment and Reuse (4th Edition), 4th ed.; McGraw Hill: New York, NY, USA, 2003. [Google Scholar]
- Champely, S. Pwr: Basic Functions for Power Analysis; R Package Version 1.2-2; R Foundation for Statistical Computing: Vienna, Austria, 2018. [Google Scholar]
- R Foundation for Statistical Computing. R Core R: A Language and Environment for Statistical Computing; R Foundation for Statistical Computing: Vienna, Austria, 2018. [Google Scholar]
- Cohen, J. Statistical Power Analysis for the Behavioural Sciences, 2nd ed.; Routledge: Abingdon, UK, 1988. [Google Scholar]
- APHA. Standard Methods for the Examination of Water and Wastewater; American Public Health Association: Washington, DC, USA, 2009. [Google Scholar]
- Wickham, H. Ggplot2: Elegant Graphics for Data Analysis; Springer: New York, NY, USA, 2016. [Google Scholar]
- Niku, S.; Schroeder, E.D.; Samaniego, F.J. Performance of activated sludge processes and reliability-based design. J. Water Pollut. Control 1979, 51, 2841–2857. [Google Scholar]
- Brieman, L. Random Forestst. Mach. Learn. 2001, 45, 5–32. [Google Scholar]
- Ho, T.K. Random decision forests. Proc. Int. Conf. Doc. Anal. Recognit. ICDAR 1995, 1, 278–282. [Google Scholar]
- Kuhn, M. Caret: Classification and Regression Training; R Package Version 6.0-80; R Foundation for Statistical Computing: Vienna, Austria, 2018. [Google Scholar]
- Metz, C.E. Basic principles of ROC analysis. Semin. Nucl. Med. 1978, 8, 283–298. [Google Scholar] [CrossRef]
- Limpert, E.; Stahel, W.A.; Abbt, M. Log-normal distributions across the sciences: Keys and clues. Bioscience 2001, 51, 341–352. [Google Scholar] [CrossRef]
Figure 1.
The number of study sites in each experimental design category and the region of study in Northeast (NE) England. Nb is the number of sites; AS is activated sludge; SF is secondary filtration (trickling filters); RBC is rotating biological contactor; HiPAF is high-performance aerated filter. Nb Reference is the number of larger, reference WWTPs (PE = 5000–10,000). Contains OS Data © Crown copyright and database right (2019).

Figure 2.
Covariance plots for final effluent values by experimental category as population equivalents and technology type. Colors identify treatment technology type and shape identifies the population equivalence. Error bars show standard error. Shading shows confidence in the linear regression smoothing at the 99th percentile. All correlations (reported as r2) are significant (p < 0.01). Plot (a) is soluble COD; (b) is total COD; (c) is total suspended solids; (d) is total phosphorus; (e) is ammonium; and (f) is nitrate.

Figure 3.
Mean design and mean measured final effluent concentrations of tCOD for each study site and each experimental design category for small WWTP only. Black line denotes the UWWTD regulatory discharge limit of 125 mg/L COD. Black triangles denote mean measured effluent tCOD values for each site. N = 90.

Figure 4.
Relative importance of predictors as determined by random forest. pH_inf is the pH of the influent wastewater; Ammonium_inf is the concentration of ammonia in the influent wastewater; PE is the population equivalence; Treatment_type is the treatment plant technology; Temp_inf is the temperature of the influent wastewater; tCOD_inf is the concentration (mg/L) of tCOD in the influent wastewater; Visit_freq is the number of times an operator visits the site per week; DO_inf is the concentration of dissolved oxygen in the influent wastewater; Season is UK season; Ambient_temp is the atmospheric temperature at the time of sample collection.

Table 1.
Statistical observations of final effluent and removal rate parameters for smaller and larger reference WWTPs. LOD = limit of detection; WW = wastewater.
Table 1.
Statistical observations of final effluent and removal rate parameters for smaller and larger reference WWTPs. LOD = limit of detection; WW = wastewater.
| (a) Effluent Concentration | ||||||||
|---|---|---|---|---|---|---|---|---|
| Smaller WWTPs (n = 72) | Larger WWTPs (n = 18) | |||||||
| Parameter | Min | Max | Mean | SD | Min | Max | Mean | SD |
| sCOD (mg/L) | 21 | 317.5 | 64.1 | 44.8 | 17 | 64 | 35.6 | 14.8 |
| tCOD (mg/L) | 22.5 | 727 | 114.6 | 108.2 | 28.5 | 77.5 | 48.3 | 15.3 |
| TSS (mg/L) | 2.3 | 161 | 31.6 | 35.3 | 5.5 | 19.3 | 12.1 | 4.1 |
| TP (mg/L) | 1 | 11.6 | 4.9 | 2.5 | 1 | 5.1 | 3.6 | 1 |
| NH4-N (mg/L) | 1.75 | 49.2 | 16.5 | 12.1 | 1 | 5.2 | 2.2 | 0.8 |
| NO3-N (mg/L) | LOD | 129.5 | 13.4 | 21.7 | LOD | 104.1 | 22.8 | 27.5 |
| pH | 5.73 | 8.03 | 7.2 | 0.4 | 5.9 | 7.7 | 7.2 | 0.4 |
| DO (mg/L) | 1.1 | 7.7 | 3.2 | 1.2 | 1.6 | 6.4 | 4.1 | 1.5 |
| Ambient temp (°C) | −1.4 | 24.3 | 11.5 | 5.5 | 4 | 20.9 | 13 | 4.6 |
| WW temp (°C) | 4 | 19.1 | 12.2 | 4.6 | 6 | 17.3 | 12.6 | 3.4 |
| (b) Removal Rates | ||||||||
| Smaller WWTPs (n = 72) | Larger WWTPs (n = 18) | |||||||
| Parameter | Min | Max | Mean | SD | Min | Max | Mean | SD |
| sCOD (%) | −18.4 | 95.1 | 67.3 | 20.4 | 33.5 | 94.3 | 73.2 | 17.6 |
| tCOD (%) | −13.1 | 98.5 | 78 | 20.6 | 74.1 | 96.6 | 88.5 | 7.03 |
| TSS (%) | −13.6 | 98 | 80 | 33.9 | 80.3 | 97.6 | 91.7 | 4.6 |
| NH4-N (%) | −15.4 | 95.4 | 55.5 | 30.4 | 81.6 | 96.6 | 92.9 | 3.7 |
Table 2.
Confusion matrix for random forest model prediction showing the percentage of correctly predicted tCOD concentration values.
Table 2.
Confusion matrix for random forest model prediction showing the percentage of correctly predicted tCOD concentration values.
| Reference | |||
|---|---|---|---|
| Actual > Design | Actual < Design | ||
| Prediction | Actual > Design | 71.40% | 42.90% |
| Actual < Design | 28.60% | 57.10% | |
Table 3.
Random Forest model accuracy by experimental category.
| WWTP Category | % Correct Predictions |
|---|---|
| 125–250_HiPAF | 67 |
| 125–250_RBC | 17 |
| 125–250_SF | 100 |
| 50–125_AS | 50 |
| 50–125_RBC | 67 |
| 50–125_SF | 100 |
© 2019 by the authors. Licensee MDPI, Basel, Switzerland. This article is an open access article distributed under the terms and conditions of the Creative Commons Attribution (CC BY) license (http://creativecommons.org/licenses/by/4.0/).
Share and Cite
MDPI and ACS Style
Bunce, J.T.; Graham, D.W. A Simple Approach to Predicting the Reliability of Small Wastewater Treatment Plants. Water 2019, 11, 2397. https://doi.org/10.3390/w11112397
AMA Style
Bunce JT, Graham DW. A Simple Approach to Predicting the Reliability of Small Wastewater Treatment Plants. Water. 2019; 11(11):2397. https://doi.org/10.3390/w11112397
Chicago/Turabian StyleBunce, Joshua T., and David W. Graham. 2019. "A Simple Approach to Predicting the Reliability of Small Wastewater Treatment Plants" Water 11, no. 11: 2397. https://doi.org/10.3390/w11112397
Note that from the first issue of 2016, this journal uses article numbers instead of page numbers. See further details here.