1. Introduction
Water pollution is increasing at an alarming pace due to industrialization as its prime reason. A quarter of children born in developing countries die before the age of five due to pollution-related diseases. Overall, about 30,000 people die from water-related diseases each day [
1]. Rapid increase in population growth demands the establishment of new industries demanding the use of freshwater. This phenomenon has been associated with problems such as the overexploitation of natural resources, water pollution and a shortage of fresh water. One of the main industries utilizing huge amounts of water, natural resources and the consequent generation of considerable amounts of polluted water from various unit processes, is the pulp and paper industry [
2].
This pulp and paper industry is an energy intensive manufacturing process because the energy cost was almost 13% of its total production costs [
3]. The paper industry consumed 6% and 5% of the global industrial energy consumption in 2006 and 2007, respectively [
4]. This industry utilizes a high quantity of fresh water (between 60 and 230 m
3 per ton of paper production), resulting in the generation of large amounts of wastewater [
5]. It is the sixth largest polluter (after oil, cement, leather, textile and steel industries), discharging a variety of wastes into the environment [
6]. The high consumption of fresh water and generation of a huge volume of toxic wastewater are the most important environmental concerns related to the pulp and paper industry. Even with the most modern and efficient operational techniques, about 60 m
3 of water is required to produce a ton of paper, resulting in the generation of at least 50 m
3 of wastewater [
7]. Most of Pakistani paper and pulp mills discharge their effluents, containing bleach and black liquor, directly into the receiving water bodies, and thus cause serious environmental concerns [
8]. PBMWW (Pulp and Board Mill Wastewater) contains high concentrations of recalcitrant dissolved organic matter, and when aquatic systems are overloaded it can induce high biochemical oxygen demand [
9].
Many countries are facing severe water shortage during summers, resulting in reduced industrial production dependent on water, particularly the papermaking industry. In recent times, water recycling and reuse has gained momentum in the Pakistani industry for the same reason and to do with competition against other users. Experiments are being conducted to obtain techno-economically viable treatment options for the recycling and reuse of industrial effluents. It is possible to reduce the fresh water consumption per ton of paper produced. For example, a mill in Finland achieved up to 75% reduction in freshwater consumption by simply changing feedstock, recycling white water from the paper machine and cooling water by adopting the latest techniques of screening (the first step in wastewater treatment is to remove suspended solids, e.g., using a bar screen or membrane-based micro filtration), clarification and evaporation [
10].
The pulp and paper production generates a significantly large amount of pollutants characterized by this high concentration of suspended solids (SS), COD, toxicity and biochemical oxygen demand (BOD) [
11]. The volume and pollution load of the generated wastewater depends upon different combinations of unit processes involved in the production, type of raw materials and chemicals consumed, types of paper products and the degree of water recovery [
12]. The pollutants discharged from the paper industry affect aquatic and land ecosystems. Many research studies reported toxic effects on various fish species due to the exposure of pulp and paper industrial wastewater, including liver damage, mixed function oxygenase activity, physiological changes, respiratory stress, toxicity and lethal effects on the fish exposed to this wastewater [
13,
14,
15].
There are many existing treatment processes for pulp and paper industrial effluents, including aerobic, anaerobic, photo-catalysis, electrochemical, ozonation, coagulation–flocculation and adsorption treatment processes [
16,
17,
18]. The type, amount and characteristics of wastewaters are important to devise the best treatment technology. According to Thompson et al. [
7], sedimentation is the predominant primary treatment to treat paper and pulp mill wastewater in the United Kingdom, and it contributed to more than 80% suspended solids removal on an average, but there was little BOD removal.
Junna and Ruonala [
19] reported 40–60% adsorbable organic halides (AOX, were organic sum parameters containing bromine, chlorine, or iodine atoms and are adsorbable to activated carbon), removal, 70% COD and 90% BOD removal by the activated sludge process. Activated sludge plants treating the pulp and paper industry effluent seem to be particularly prone to bulking, which caused operational problems. Peerbhoi [
20] investigated the anaerobic treatability of black liquor by an up-flow anaerobic sludge blanket reactor, and concluded that the anaerobic biological treatment of black liquor is not feasible, as the pollutants were not readily biodegradable. Pokhrel and Viraraghavan in [
11] expressed certain reservations on the utility of anaerobic processes for AOX degradation in pulp and paper mill effluents, and hence recommended the use of physicochemical processes. Numerous paper and pulp mills with an average water consumption of 50 m
3/tons use only physicochemical treatment processes for optimal operation [
21].
Excellent polishing of biologically-treated effluent from the paper and board industry was obtained with respect to color by treating with activated carbon [
2]. A combination of wet oxidation and coagulation removed 75% of lignin, 83% of color and 51% of COD from pulp and paper mill wastewater [
5]. Afzal et al. reported biological treatment of pulp and board effluent by fed batch reactor (FBR) followed by coagulation and sand filtration. The hybrid treatment system reduced BOD up to 16 mg/L (96.5% removal) and COD to 136 mg/L (93% removal), respectively, which were below the National Environmental Quality Standards of Pakistan, and the effluent could then be discharged into the water bodies without any risks [
8].
Chemical coagulation has been greatly recommended for the treatment of paper machine filtrate, bleaching filtrate and toxic pulping wastewater [
6]. The most commonly used coagulants for the treatment of industrial wastewater are, lime, aluminum chloride, alum (Al
2(SO
4)
3·18H
2O), ferrous sulfate (FeSO
4), polyelectrolytes, calcium hydroxide Ca(OH)
2 and magnesium sulfate (MgSO
4). The choice of a specific coagulation reagent is primarily governed by its effectiveness and then by its cost, relative to alternative reagents [
22]. Field observations showed that many pulp and paper mills were facing a shortage of available water sources due to the water scarcity and limitations of ground water use in Pakistan. Thus, both the consumption of fresh water and the production of wastewater must be reduced. For this purpose, there is a need to recycle wastewater after treatment in order to reduce the fresh water consumption and to lower the wastewater impacts on effluent-receiving water bodies. Therefore, a suitable treatment technology is required that will treat the wastewater of the pulp and paper mill to such an extent that it can be reused in the production processes. In view of the above-mentioned facts, the objective of the current research was to explore a suitable combination of various physico-chemical methods for the treatment of pulp and paper industrial effluents. At present there are few specific studies on the above topic for the South Asian environment, and this work can provide theoretical reference for the practical application.
2. Materials and Methods
The combined raw wastewater samples of pulp and board mill were collected from the Olympia Paper and Board Mill Hayatabad Peshawar, Pakistan. Peshawar, the capital of the Khyber Pakhtunkhwa province, is situated between the latitudes of 34°0′53.91″ N and 71°34′49.76″ E. The grabs wastewater samples used in this study were collected from the overflow drain (main outlet) of equalization tank (containing the combined effluent of the whole process, while the overflow from the outlet represents the near average daily flow of the mill). There were three primary clarifiers in the mill, one of them was operating during the sampling period, whereas the other two were on standby for 24 h. Eight grab samples having a volume of 1.5 liters were collected, at uniform time intervals over the sampling period (e.g., after one hour per day). These specimens were mixed together in a 20-liter plastic container to give an 8-hour composite sample (12 liters) and then immediately stored in refrigerator until it was used for further analysis. This sampling procedure was repeated for eight days (two samples per week), and average results are reported herein. The wastewater samples were analyzed according to the Standard Methods for the Examination of Water and Wastewater, as shown in
Table 1.
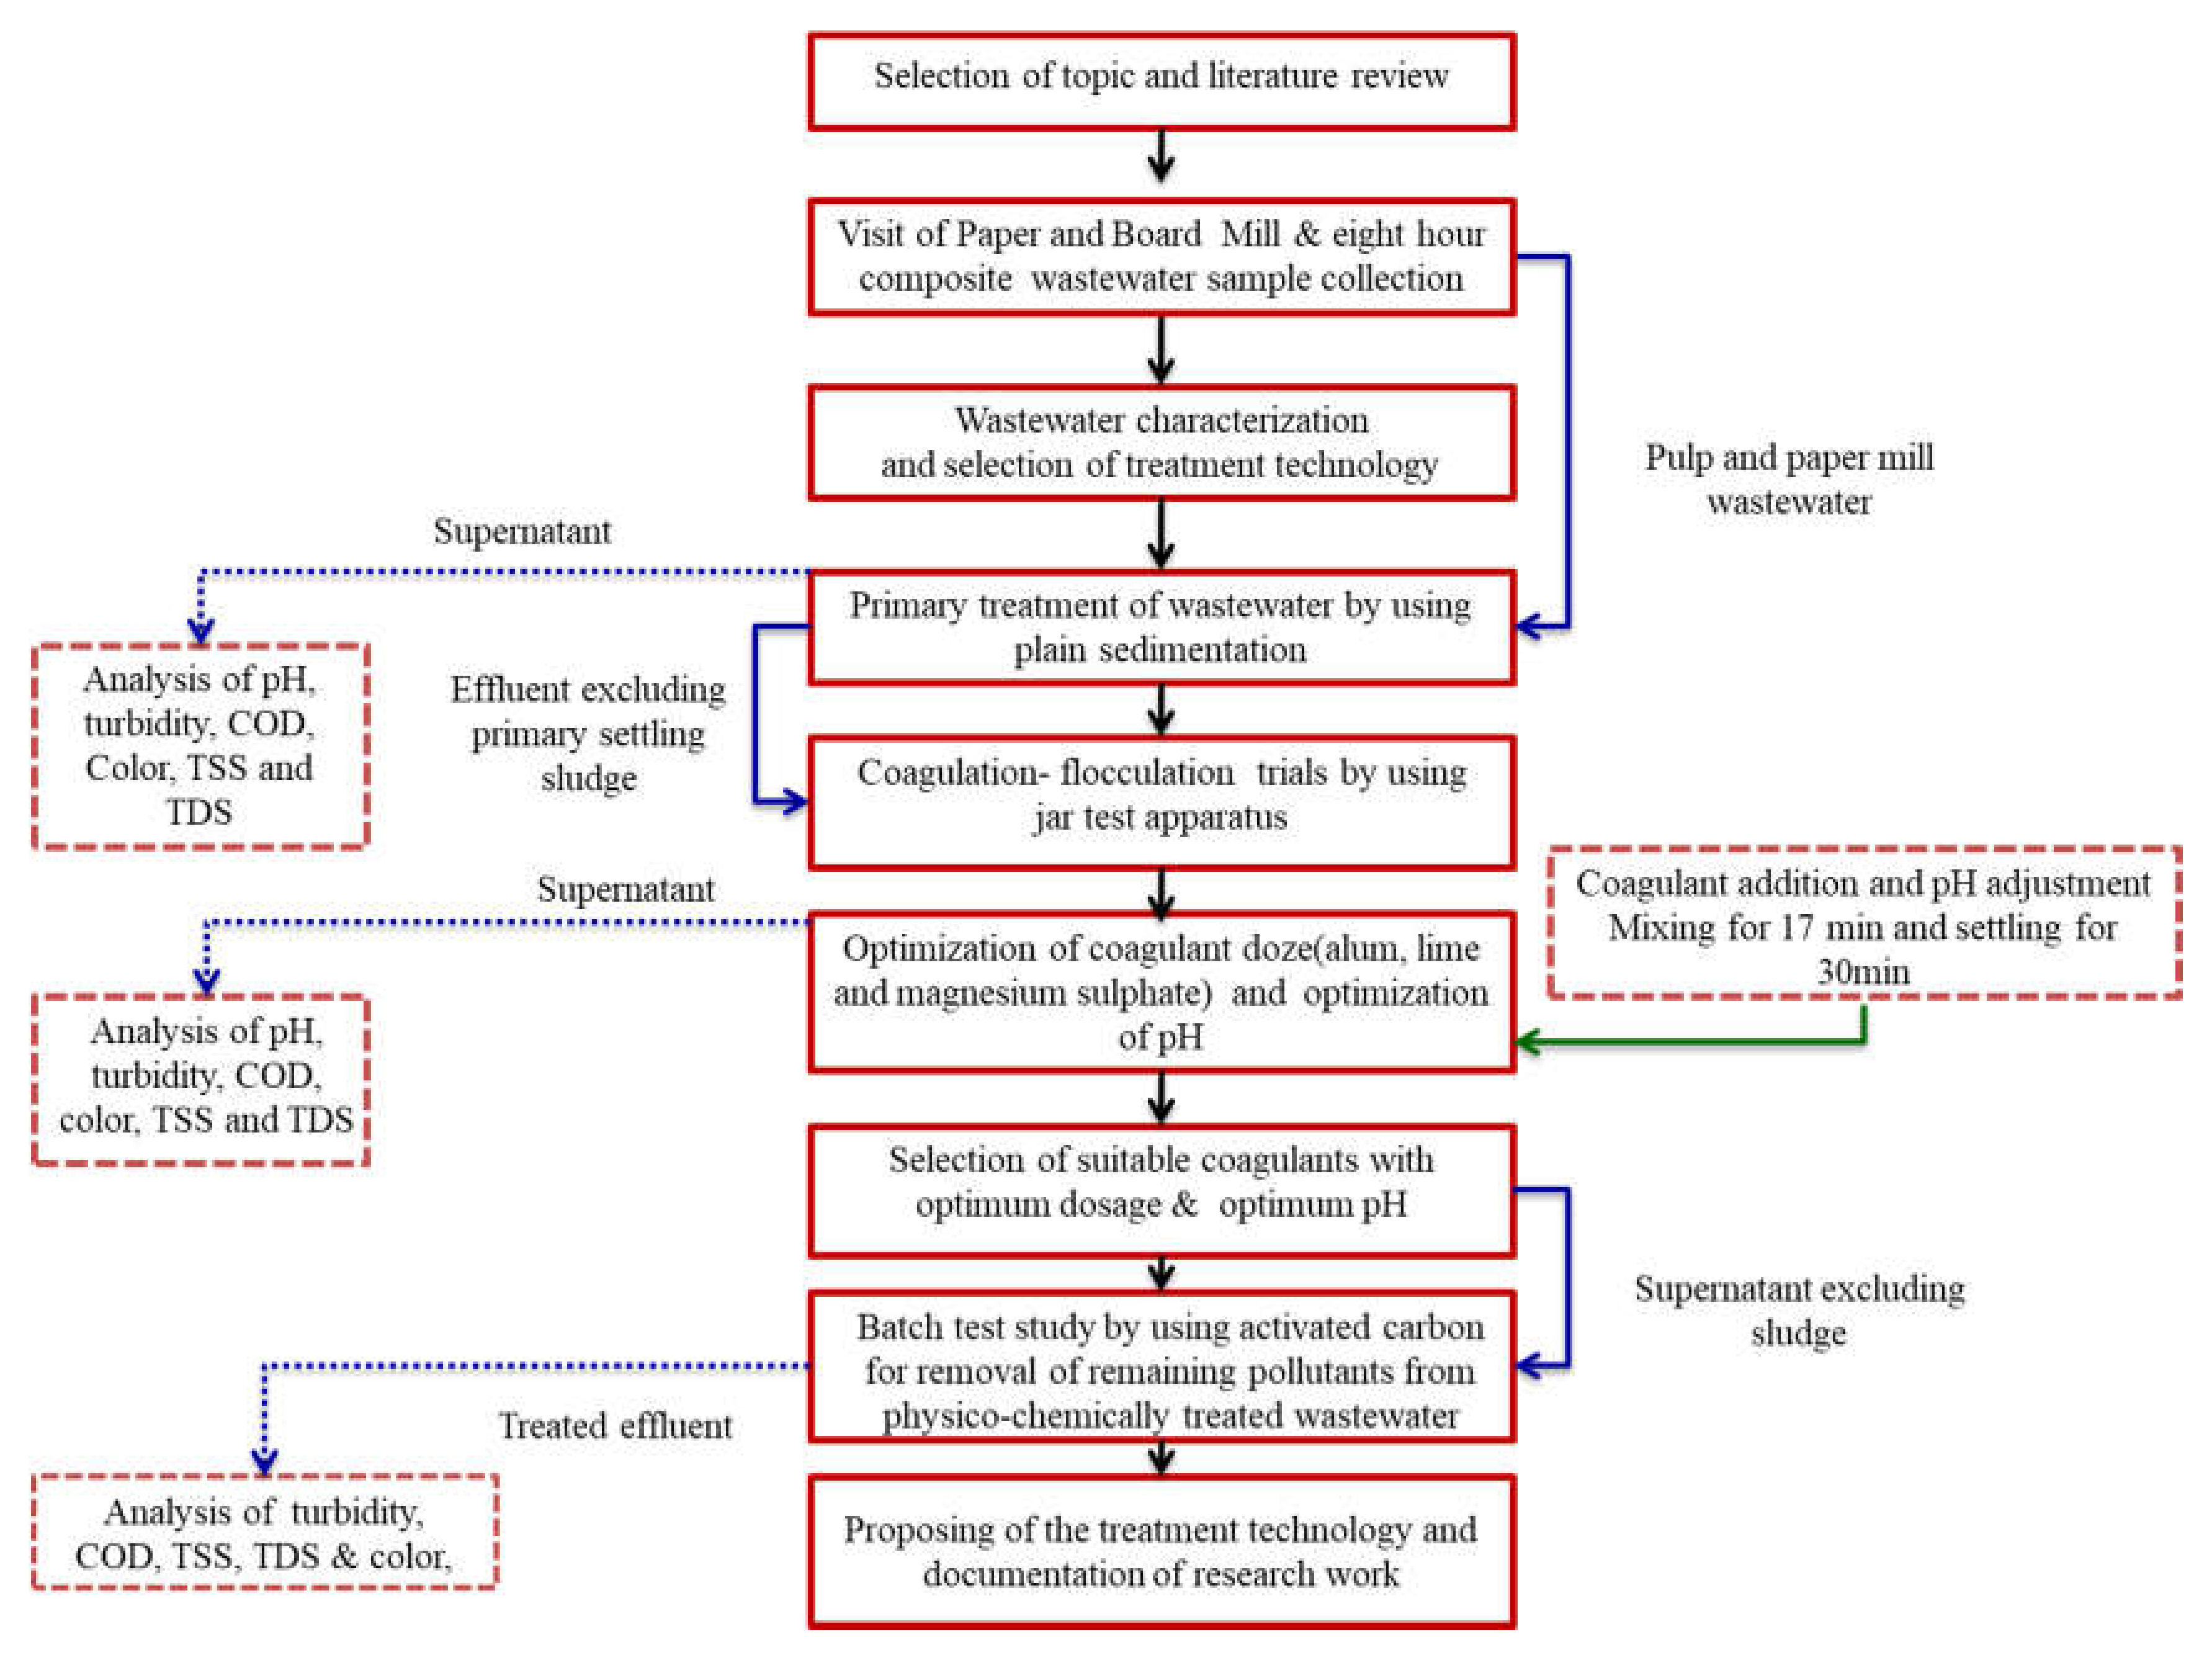
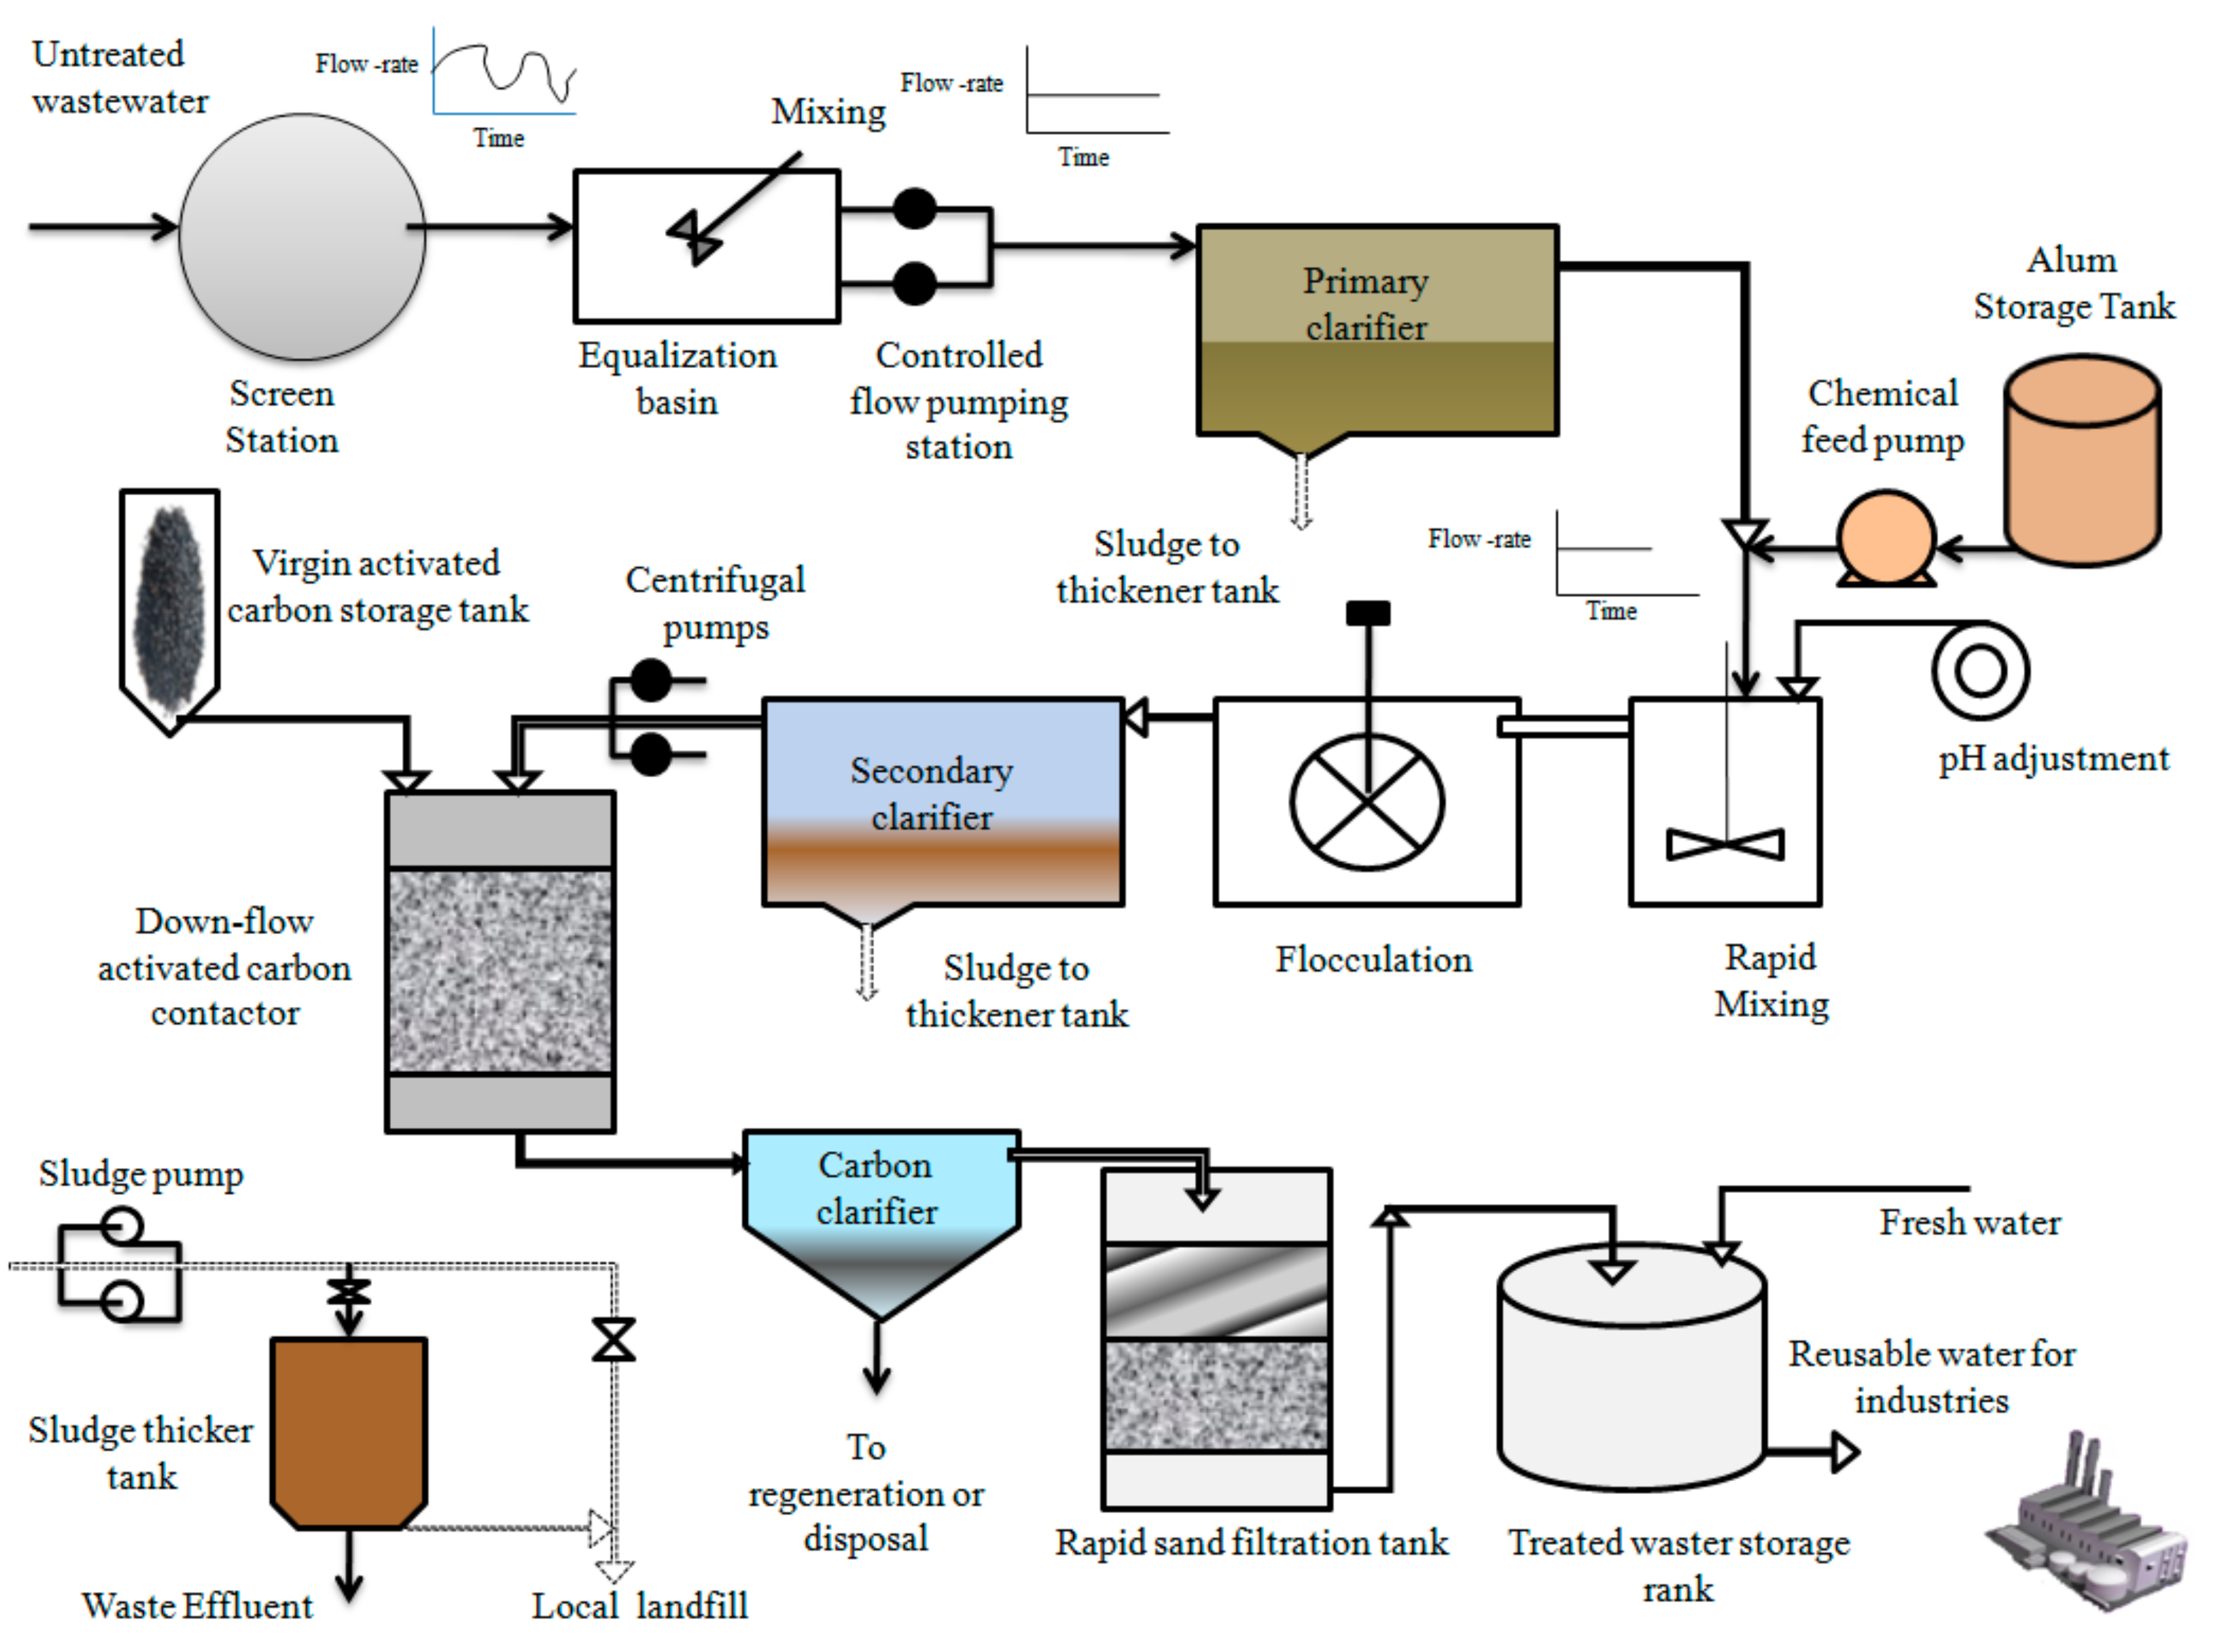
Based on the literature review, a hybrid physico-chemical treatment process, plain settling followed by coagulation/flocculation and activated carbon adsorption, was used in this research [
8,
10,
28,
29], as shown in
Figure 1. Sedimentation was accomplished in a glass rectangular tank with the hopper bottom. After four hours, the wastewater from the sedimentation tank was collected and used for coagulation–flocculation trials. The coagulation–flocculation tests were conducted with a series of standard jar test apparatus (Hach Floc Tester) by using 500 mL wastewater samples. If deemed necessary, the initial pH values were adjusted with aqueous NaOH or concentrated sulfuric acid (H
2SO
4), and different combinations of pH and coagulant dosage were tested.
The designated dosages of alum at different pH (5, 6 and 7.5) combinations were tested first. Then the jar test experiment for lime dosage and MgSO
4 dosage were conducted at pH 11. After adding fixed coagulant doses in six jars, the admixtures were subjected to flash mixing at 200 rpm for 2 min to guarantee thorough mixing. It was followed by a slow mixing by magnetic stirrers at 60 rpm for 15 min. The agitated solution was allowed to settle for 30 min. After settling, 200 mL of supernatant fluid was taken out at a fixed distance of 3 cm below the liquid surface with a pipette for turbidity, TS, TDS, TSS, color, BOD and COD measurements. The sludge volume index (SVI) was calculated and the remaining portion of the treated wastewater samples was used in adsorption experiments. This is measured by the wet volume (mL/L) of the settled sludge under interface of solid and liquid after allowing sedimentation for 30 min in a graduated cylinder measuring 1000 mL, divided by the initial amount of TSS in mg/L (dry weight), as shown in Equation (1).
The batch experiments were used to optimize the parameters for an adsorption process. The adsorption experiments were conducted by adding different amounts of granular-activated carbon (GAC), into the 500 mL beaker containing 500 mL of chemically-treated wastewater. After this, the admixture was mixed by using magnetic stirrers for fifteen minutes.
After a certain amount of time for contact (four hours from a study in [
30,
31]), the activated carbon is allowed to settle to the bottom of beaker, and treated water is then allowed to enter into the filtration beaker. Four hours contact time with the activated carbon is selected on the basis of experimental results. In a filtration beaker the supernatant was passed through the freshly prepared sand bed (10 cm depth) under an acceleration due to gravity to remove the residual impurities. The filtrate was then measured for the COD, TSS, turbidity and color concentration. At the end, down flow column experiments in a glass column (height 30 cm, internal diameter 5 cm, detention times of 92 min, flow rate 200 mL/hour) filled with granular-activated carbon (apparent density 0.48 g/cm
3, surface area 625 m
2/g, effective size 0.85 mm) was also performed. Before filling the column, the granular-activated carbon was saturated with drinking water and evacuated after one hour by using a pump.
3. Results and Discussion
The initial characterization of the PBMWW was carried out by using various analytical procedures already described. The average parameters are given in
Table 2, along with the Pakistan NEQS (National Environmental Quality Standards) and NSDWQ (National Standards for Drinking Water Quality).
From the above
Table 2, it is cleared that the PBMWW contains high turbidity, which is confirmed by the higher value of TSS. Color of the wastewater is dark brown because of presence of lignin and its derivatives. Biodegradability indices (BOD/COD ratio) of the collected wastewater is 0.346, which was less than the typical value of 0.4 [
32,
33]. Wastewater is considered readily biodegradable if it has a BOD to COD ratio greater than 0.4 [
34,
35]. If the BOD/COD is less than 0.4, biodegradation will proceed very slowly, then it is not possible to treat biologically. So, the wastewater of this Mill is not highly biodegradable due to the presence of non-biodegradable compounds like lignin, which create a challenge for treatment.
According to keerthi, Muthukrishnaraj and Balasubramanian in [
36] lignin and its derivatives degrade very slowly with conventional biological processes because of its larger molecular size. Therefore, a hybrid physico-chemical treatment process, plain settling followed by chemical coagulation and an activated carbon adsorption process, is used in this research study to purify the wastewater of the Paper and Board Mill.
3.1. Effects of Plain Sedimentation on the Effluent Characteristics
Plain sedimentation is used as a pre-treatment before this physico-chemical treatment process.
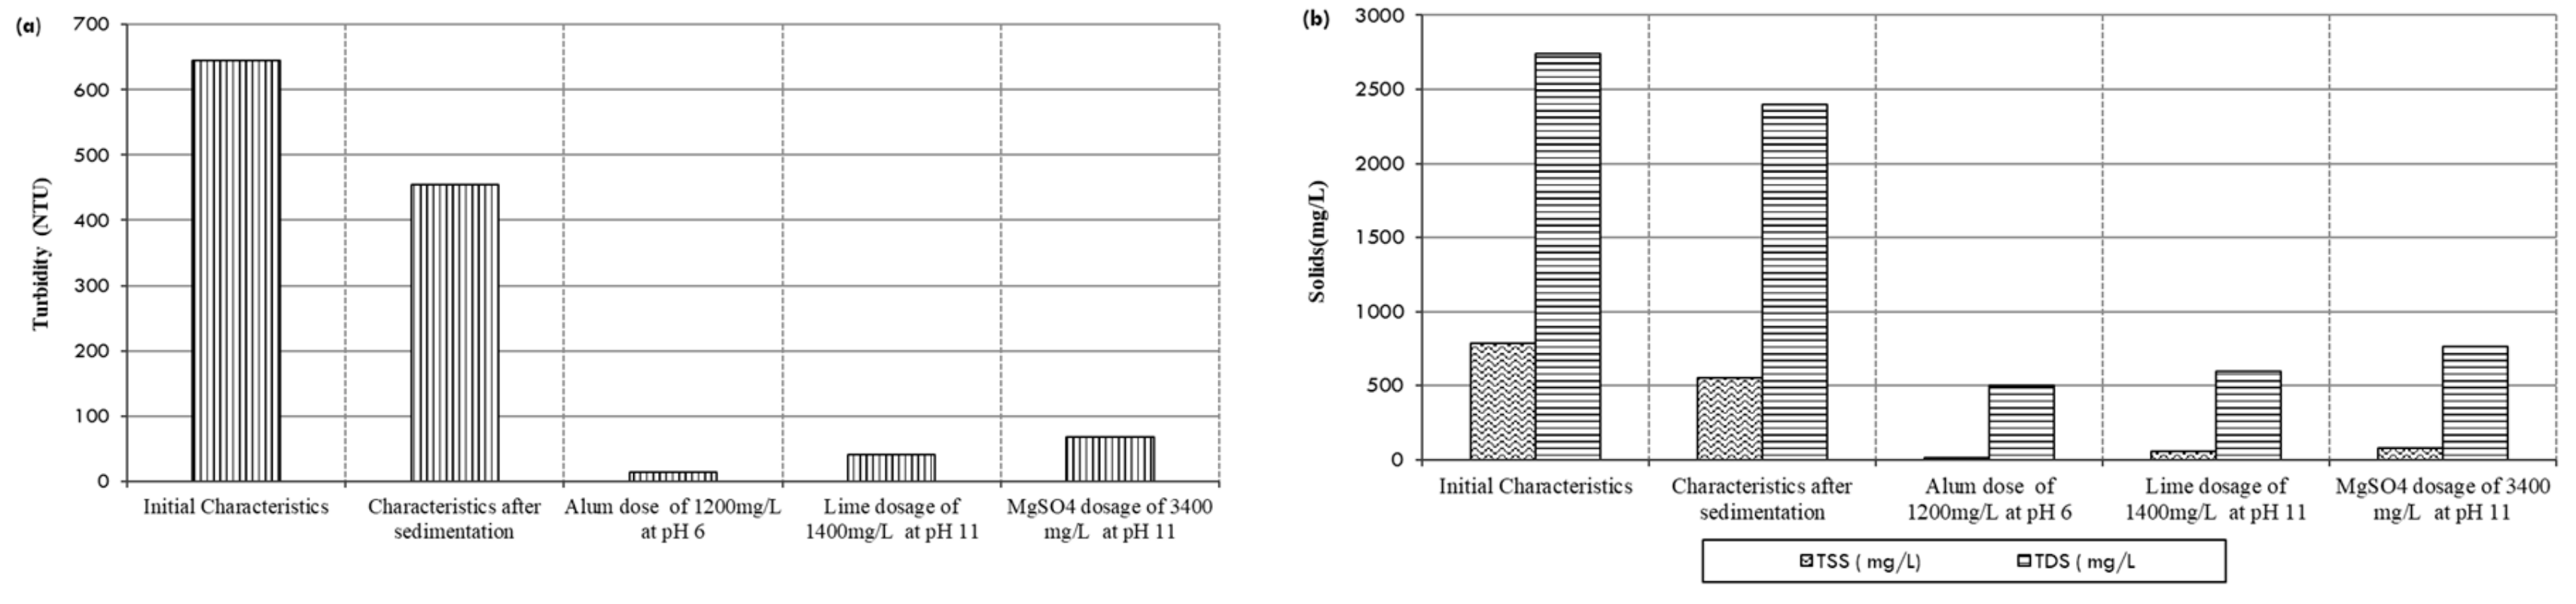
Table 3 below shows the effect of sedimentation on wastewater characteristics. It describes that the primary settling removes more than 29% of the total suspended solids (TSS) and 13% of TDS.
Table 3 also describes that the achievable percentage removals of COD, turbidity and color after four hours of sedimentation are 14.5%, 29.46% and 23.4%, respectively.
3.2. Coagulation–Flocculation Process
The laboratory treatability studies for the further reduction of TSS, TDS, COD, BOD, turbidity and color COD, was extended to the coagulation–flocculation process by using primary clarifier effluents. As already described, three different coagulants, i.e., magnesium sulfate, lime and alum, were tested for their individual pollution removal efficiencies on the wastewater, and their optimum dosages were calculated. The results after two steps of treatment are used to optimize the primary settling time, suitable coagulant type, coagulant dosage and optimum pH of the wastewater for treatment. The results at the optimum conditions (sedimentation time, coagulant dose, initial pH) for the maximum removal of toxic impurities are graphically presented in
Figure 2 below.
The results of
Figure 2 above and
Table 4 below indicate the maximum reduction in turbidity (89%), COD (84%), TSS (90%), TDS (72%) and color (89%) by MgSO
4 occur at the mass loading of 3400 mg/L, when four hours of primary-treated effluent is further treated by the coagulation–flocculation process.
Similarly, the combination of primary settling and lime coagulation (optimum dosage of 1400 mg/L) resulted in an effluent turbidity removal of 94%, COD reduction of 86%, TSS removal of 93%, TDS removal of 78% and color removal of 91.6% at pH 11, as shown in
Table 5. Karthik et al. [
10] got almost similar results by using lime as the coagulant at the rate of 100–600 mg/L.
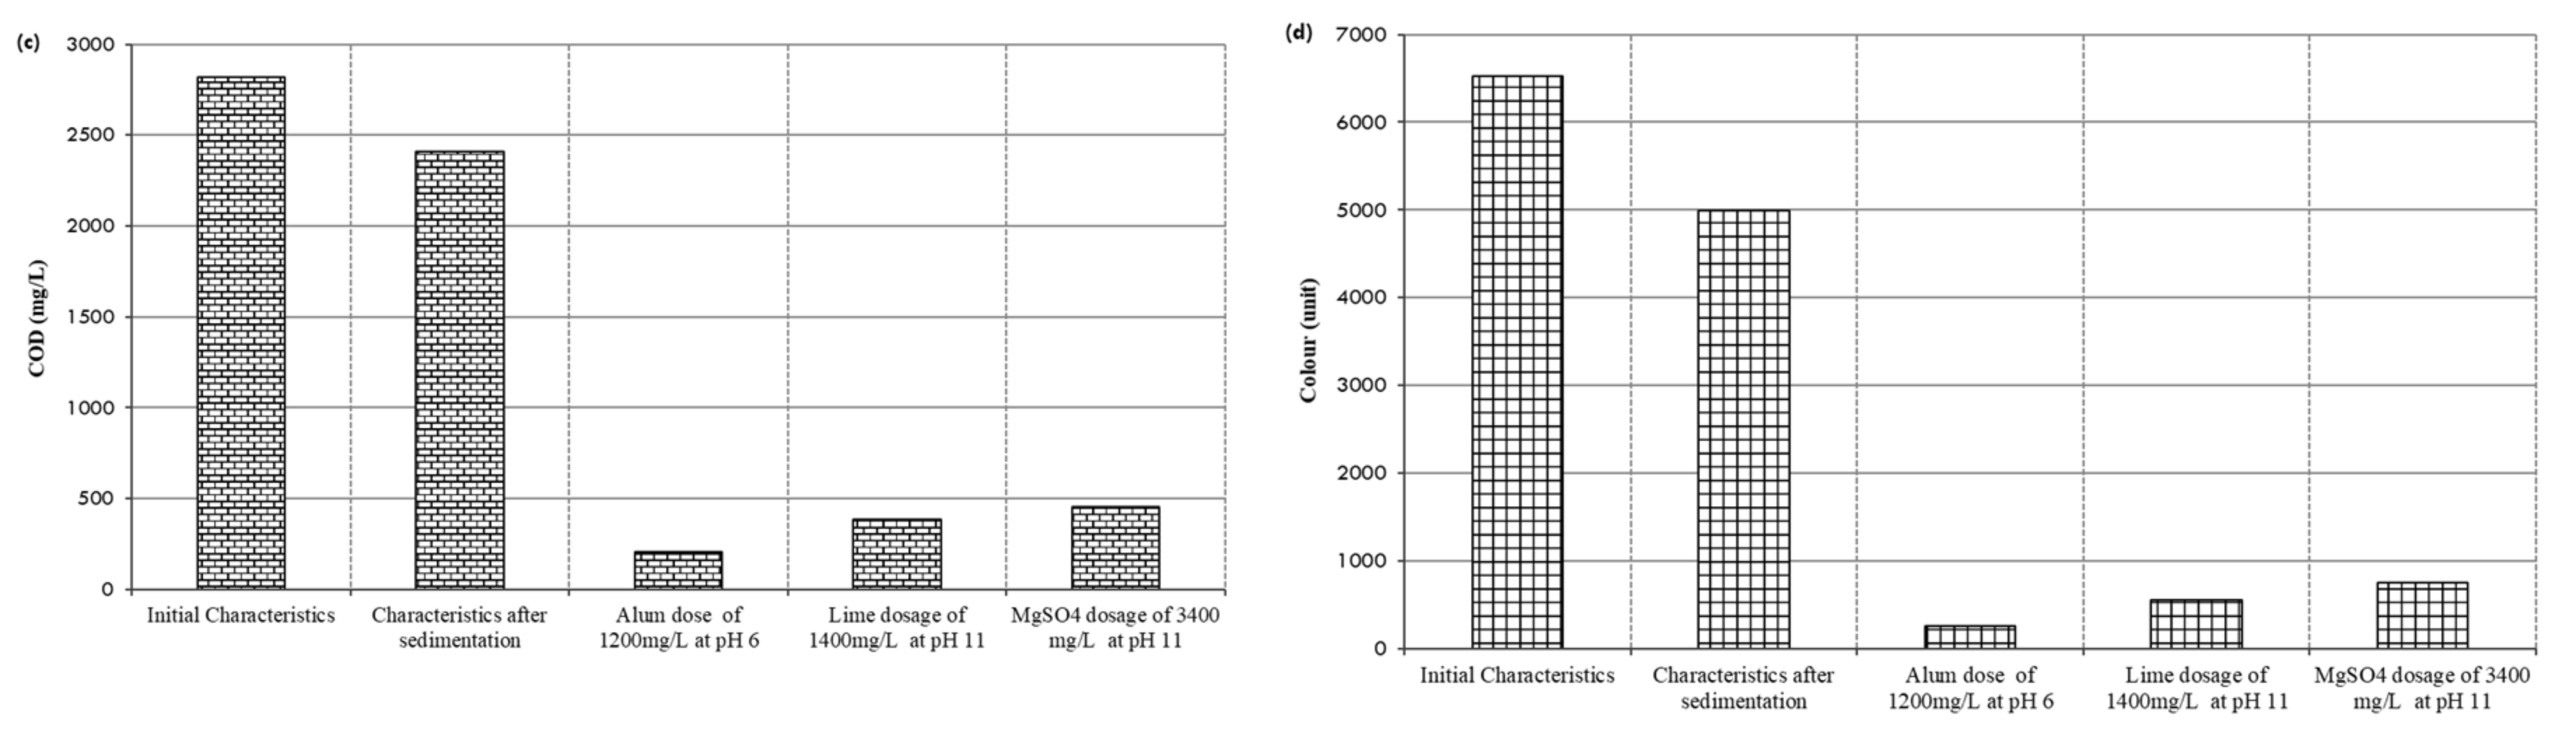
The primary clarified effluent was separately treated with alum at a different pH (7.5, 6 and 5, as shown in
Figure 3a–d. The order of variation in the turbidity reduction was found to be similar to the order of COD, TSS and color reduction (
Figure 3). For the coagulation by alum, the maximum turbidity reduction (98%) is noted at pH 6. After increasing or decreasing the pH from 6, the turbidity reduction was found to decrease in both the cases. So, the optimum pH for alum is 6, which is in the range (5.5 to 6) found by Chen and Horann [
37]. For this combination the optimum dose of alum was 1200 mg/L. It can be observed from
Figure 2a–d above that at this dose of alum the residual concentration of turbidity, COD, TSS, TDS and color are; 13 NTU, 205 mg/L, 16 mg/L, 503 mg/L, 519 mg/L and 255.7 units, respectively. Initial pH of the wastewater is slightly reduced to 5.59 after the addition of alum.
Figure 3 also revealed that the optimum pH was in the acidic range, and thus it may be concluded that the initial pH value has a tremendous effect on pollutants reduction.
Above results indicate that the impurities removal efficiency of alum is better than MgSO
4 and lime for the paper mill effluent. It can be seen in
Figure 2 and
Figure 3 that the maximum percentage turbidity reduction of 98%, COD of 93%, 98% for TSS, 82 % for TDS and 96% for color, occurred at an alum dose of 1200 mg/L. No further appreciable reduction in turbidity and COD could be observed at a higher dose of alum, lime or MgSO
4. Thus it can be concluded from the jar test that the suitable coagulant is alum with the optimum dose of 1200 mg/L at pH 6.0. Ahmad et al. in [
38] has also reported a 99.8% turbidity reduction, 91% COD reduction and 99.7% TSS reduction with the optimum dosage of 1000 mg/L of alum at pH 6.0. According to the National Environmental Quality Standards for municipal and industrial effluent of Pakistan, COD, TDS, TSS and pH of the effluent must be less than 150 mg/L, 3500 mg/L, 200 mg/L and 6–9, respectively. Thus, chemically-enhanced treatment at the optimum doses of alum is successful in meeting wastewater standards for TDS, TSS and pH. But reusing of this chemically-treated water required a tertiary treatment, like the activated carbon adsorption, to meet the mill water quality standards.
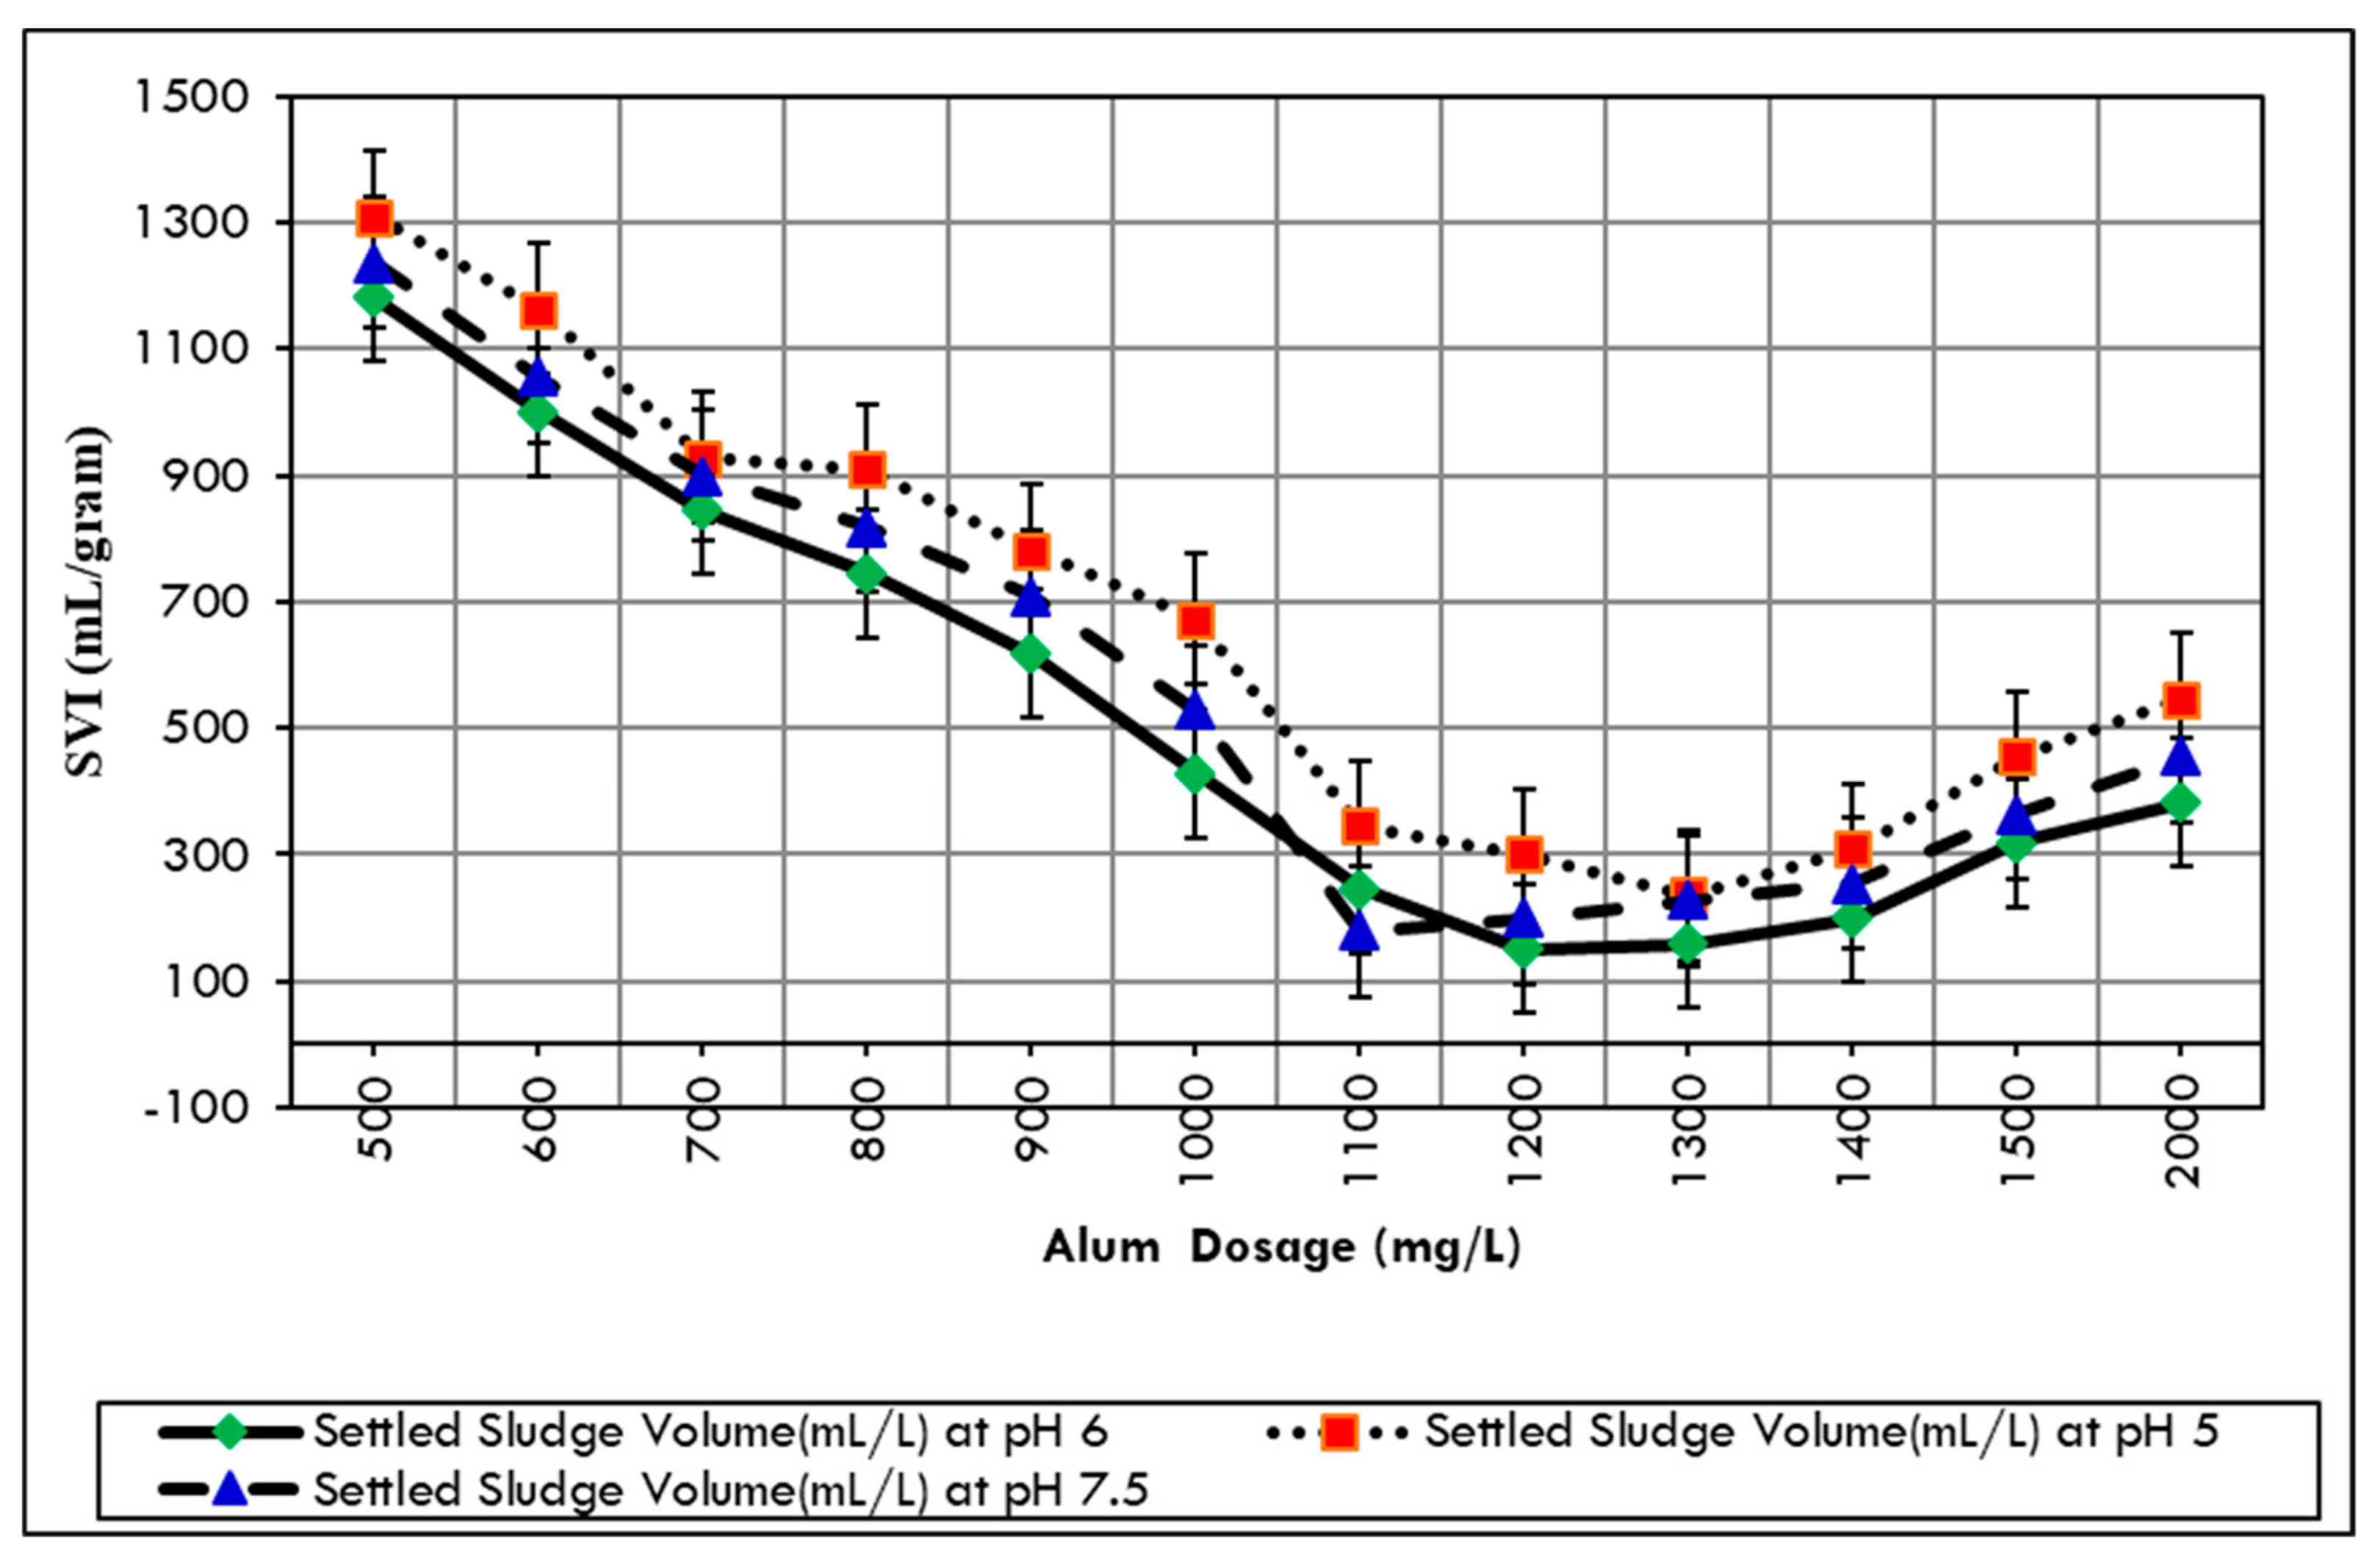
3.3. Effect of alum dose on Sludge Volume Index
The sludge volume index is employed to find the volume of sludge in mL/g. The treatment of paper mill wastewater after four hours of settling using alum at pH value of 06 produces a lower volume of sludge in contrast to the results obtained at pH of 5 and 7.5, as shown in
Figure 4 below. So, the optimum conditions are obtained with 1200 mg/L alum at the pH value of 6.0, exhibiting 92% of COD removal, an SVI of 156 mL/g and turbidity removal approaching 97%. Birjandi at al. also reported an approximate SVI of 150 mL/g by using alum (1100 to 1500 mg/L) under intensive acidic conditions [
39].
3.4. Tertiary Treatment with Activated Carbon by Adsorption Process
Feasibility of activated carbon post-treatment of (chemically-treated) wastewater from the pulp and paper mill was also investigated, the goal being to remove remaining organic impurities and produce water that can be reused in the paper manufacturing process. According to Zhang and Chuang in [
40], the maximum adsorption capacity of activated carbon occurred at a pH near 5.0. Thus, there is no need to adjust the pH for the adsorption process because the pH of the chemically-treated effluent at optimum conditions is already between 5 and 6.
Adsorption test results indicate that total percentage turbidity removal is increased from 97% to 99.50% at an activated concentration of 5 g/L, whereas the absolute amount of residual turbidity is 3.1 NTU at the same adsorbent concentration range, as shown in
Table 6 below.
The results of
Figure 5 below reveal that the activated carbon adsorption with four hours of contact time resulted in a reduction of COD to 26.6 mg/L. The total percentage COD removal is increased from 92.7% to 99.1% at an activated concentration of 5 g/L, whereas after this highest reduction efficiency, there is no significant difference in COD reduction efficiency with further increase in activated carbon concentration.
Figure 5 also shows that the percentage color removal increased from 96.1% to 99.5%, and the amount of color decreased from 254.7 to 30.6 units at the activated carbon concentration of 5 g/L. As chemically-treated water is further treated by activated carbon, similar results were reported by Shawwa, Smith and Sego in [
41] by using activated petroleum coke in the adsorption process.
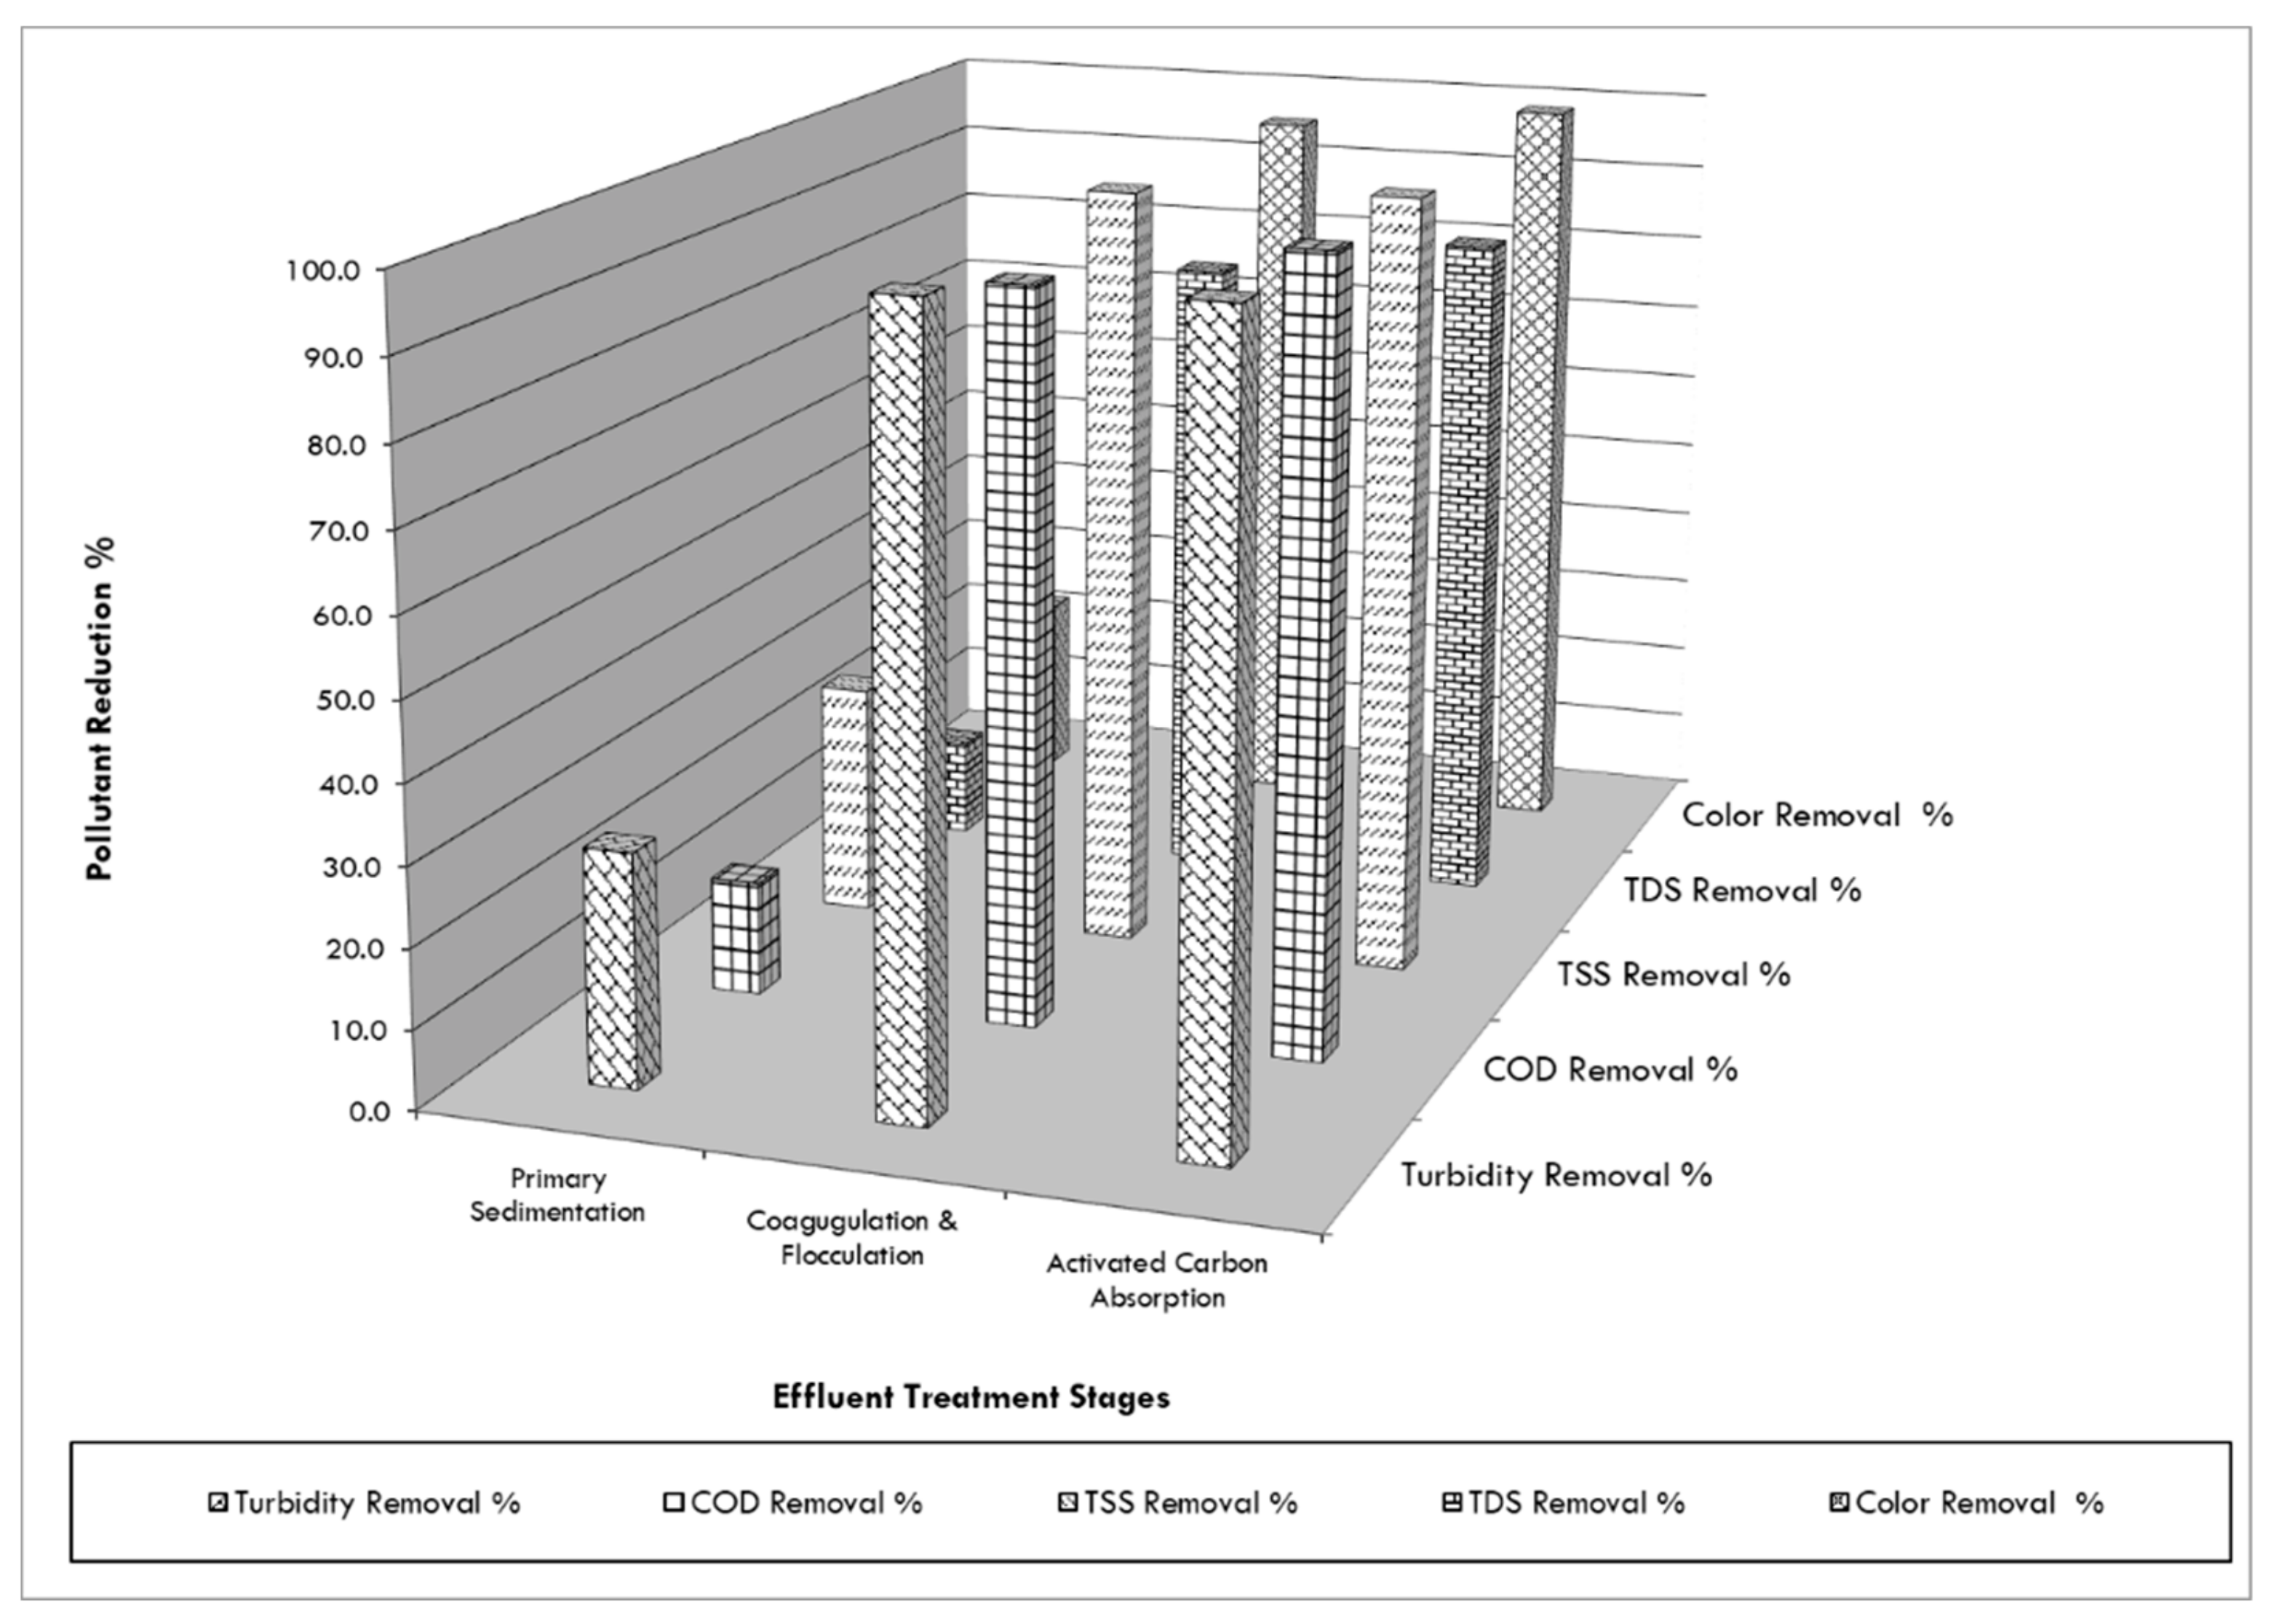
Figure 6 below contains the removal data of all the processes and for all parameters. The most important result is that the combination of sedimentation, coagulation and adsorption resulted in water quality where the color was no longer visible (i.e., <37 units). Based on the laboratory scale study and extensive literature review, a treatment technology in
Figure 7 is suggested for wastewater recovery and reuse. The above results show that the consumption of alum and activated carbon is not large. The quantities of alum and activated carbon required to treat one liter of wastewater were 1.2 g and 5.0 g, respectively, at optimum controlled conditions.
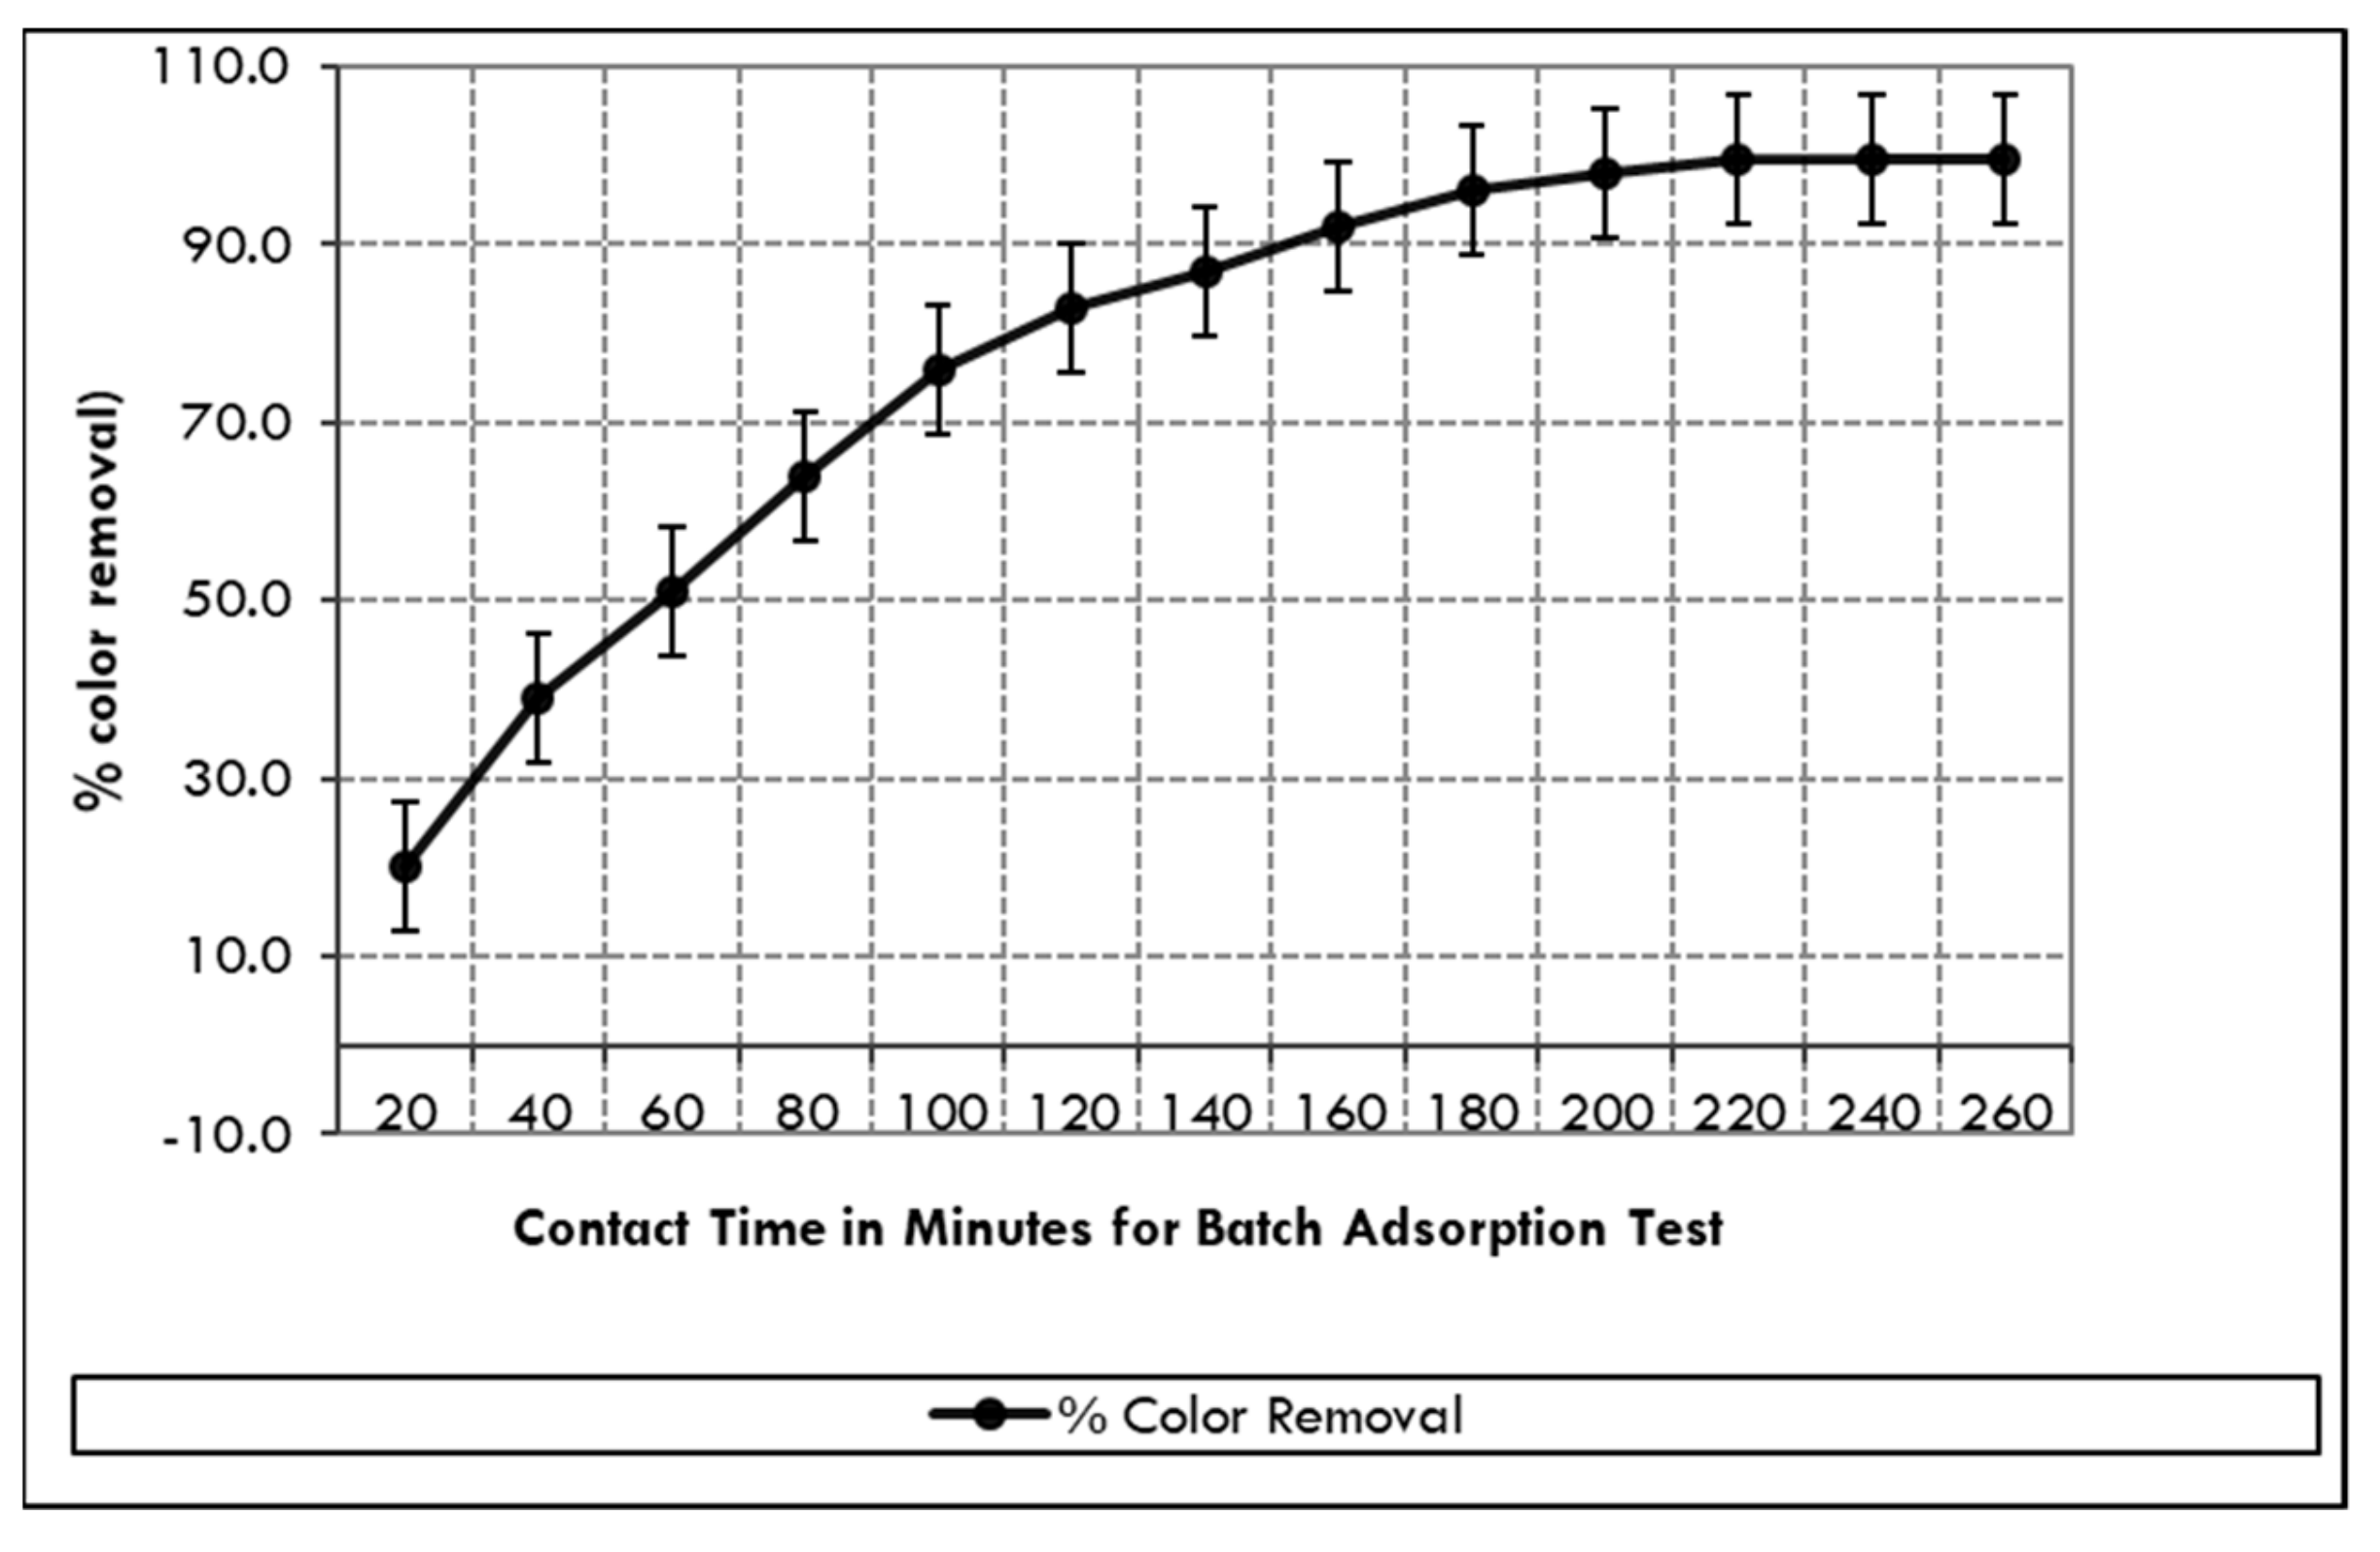
3.5. Effect of Contact Time on Color Reduction
Figure 8 showed the rate of color reduction (83%) is very high for the first two hours, and that this rate decreases constantly for next two hours until the equilibrium point. Further increase in contact time does not significantly increase the color reduction, so the equilibrium time for the adsorption process is almost four hours. A similar observation was reported previously by using activated carbon for the removal of color from a paper mill effluent [
42], because as the treatment time progressed, the activated carbon sites had the affinity towards saturation.
The down flow column experiments in glass columns filled with granular-activated carbon show similar results as shown in
Table 6 above. These results indicate that the wastewater quality was significantly improved by removing organic/inorganic materials by primary settling followed by the coagulation and activated carbon adsorption. Activated carbon adsorption of organic pollutants from the pulp and paper mill wastewater gives an alternate technique for the treatment of these wastewaters.
3.6. Cost of Chemicals for Proposed Treatment Technology
Based on the suggested optimum dose of alum and the amount of activated carbon which was required, very rough cost estimates of chemicals for the treatment of one cubic meter of pulp and paper mill wastewater were also evaluated. The wastewater produced by the Olympia Paper and Board Mill Hayatabad was 6000 m3/day, and this discharge rate is used for the measurement of chemical cost.
Table 7 shows that the proposed treatment technology is an expensive treatment option with a chemical cost of
$2.09 per cubic meter of wastewater treated. In a similar study [
37] (alum + activated carbon), operating costs were
$2.31/m
3 for the treatment of pulp and paper mill wastewater, approximately very close to the study-proposed operational cost. Tertiary-activated carbon treatment cost reported in [
43] is between
$1.10 and
$3.30. The activated carbon treatment cost was determined by its quantity that would be required to maintain the concentration of activated carbon in the carbon contactor. Initially an amount of 5 kg/m
3 of wastewater should be added into the carbon contactor, but the concentration of activated carbon and its adsorption capacity will be decreased during the treatment process. The activated carbon dosage of 0.5 kg/m
3 of wastewater is required to maintain the 5 kg/m
3 concentration in this carbon contactor. Thus, it is found that the physico-chemical treatment is an expensive treatment option for reclaiming the paper industry’s effluent. Clearly, there is a need for much cheaper types of activated carbon. One of the possibilities would be to produce activated carbon from waste products, or biological treatment should be preferred over a physico-chemical treatment process. A hybrid end-of-pipe physico-chemical treatment process is effective but expensive, and needs a proper design of the treatment plant, based on the effluent characteristics. The cost to benefit ratio of the different treatment alternatives should be assessed before implementing the proposed physico-chemical treatment. A pilot scale study and further investigation is required before the implementation of proposed treatment technology.
4. Conclusions
The present study aimed to reclaim a high amount of wastewater by the physico-chemical treatment method. The first step of treatment was four hours plain settling. It was concluded that the plain settling would lower the pollution load for further secondary wastewater treatment plant. Secondary treatment indicated significant reduction in turbidity (89%), COD (84%), TSS (90%), TDS (72%) and color (89%) was obtained at the mass loading of 3400 mg/L of MgSO4, when four hours primary effluent was further treated by the coagulation–flocculation process.
The results indicated that the pollutant removal efficiency of alum (with the optimum dose of 1200 mg/L at pH 6.0) was better than the other coagulants (MgSO4 and lime).
Greater than 90% reduction of ecological parameters (Turbidity, COD, TSS, TDS and color) was obtained by a combination of primary settling and coagulation–flocculation-aided clarification (alum clarification). This reduction can be improved further after the treatment with granular-activated carbon at the finishing steps. Integrated physico-chemical treatments produced the water which then met the production process quality standards. The treated water could be recycled back into this production process as reclaimed water. Chemical consumption and sludge production were also minimum under optimum conditions.
A hybrid end-of-pipe physicochemical treatment process is effective but expensive, and it also needs a proper design of the treatment plant, based on the characteristics of the effluent. The cost to benefit ratio of the different treatment alternatives should be assessed before implementing the proposed physicochemical treatment. A pilot scale study and further investigation is required before any implementation of this proposed treatment technology.

 ,
, 


