Evolution Pattern of Tailings Flow from Dam Failure and the Buffering Effect of Debris Blocking Dams


1
State Key Laboratory of Geomechanics and Geotechnical Engineering, Institute of Rock and Soil Mechanics, Chinese Academy of Sciences, Wuhan 430071, China
2
Yunnan Key Laboratory of Sino-German Blue Mining and Utilization of Special Underground Space, Faculty of Land Resources Engineeirng, Kunming University of Science and Technology, Kunming 650093, China
3
State Key Laboratory of Coal Mine Disaster Dynamics and Control, School of Resources and Safety Engineering, Chongqing University, Chongqing 400044, China
4
School of Resources and Environmental Engineering, Wuhan University of Science and Technology, Wuhan 430081, China
5
Guangxi Branch of CSCEC Strait Construction and Development Co., Ltd., Nanning 530000, China
*
Authors to whom correspondence should be addressed.
Water 2019, 11(11), 2388; https://doi.org/10.3390/w11112388
Submission received: 31 August 2019
/
Revised: 8 November 2019
/
Accepted: 10 November 2019
/
Published: 14 November 2019
(This article belongs to the Special Issue Modeling of Soil Erosion and Sediment Transport)
Abstract
:Tailings ponds are the indispensable facilities in the mine production and operation. Once the dam is destabilized and damaged, it will pose a serious threat on the life and property of the downstream population and could also potentially cause an environmental disaster. With an engineering background, this paper dynamically and numerically simulates the evolution process of tailings flow from dam failure and the influence scope of any resulting disaster in context. The evolution characteristics of leaked tailings flow are analyzed at various downstream riverbed slopes and debris blocking dam settings. In addition, parameters such as flow rate, impact force and deposition range of leaked tailings flow at downstream arrival are studied, as well as their correlations. The results indicate that the flat terrains upstream and downstream of passage zone show a relatively larger area of inundation by tailings flow. Both the maximum and final downstream inundated ranges increase with the elevating slope of downstream riverbed, and the leaked tailings are deposited mainly in the nearby villages in front of the dam and the flat terrains of the downstream passage zone. Additionally, rational establishment of debris blocking dams on the downstream side is effective in diminishing the damage of tailings flow to the downstream section. This study can also provide an important basis for the quantitative evaluation of post-disaster influence scope for tailings pond as well as for the design of dam body.
1. Introduction
Tailings ponds are the artificial hazard sources with high potential energy. In the event of an accident, the resulting tailings flow might bring huge losses to the life and property of downstream populations while also polluting the ecological environment severely [1,2,3]. Tailings are the kinds of solid wastes generated from mineral separation. Tailings are also a special kind of soil, generally structured with single granule and beehive. Due to the poor comprehensive utilization of tailings, the majority of them are stored in the tailings ponds aside from the cases of beneficiation, mine filling and building material recovery [4,5,6]. With the continuous exploration by mine companies as well as the growing demand for mineral products, the dam height and storage volume of tailings ponds have been gradually increasing [7]. Meanwhile, the risk of dam failure in the tailings ponds also heightens greatly in the face of extreme conditions such as earthquakes, rainstorms and failure of flood drainage systems. Cases of severe accidents caused by tailings ponds project failure are not uncommon [8,9,10,11]. For example, two dam burst accidents occurred in Minas Gerais, Brazil, in January 2019 and November 2015, leading to at least 232 deaths and 19 deaths, respectively [7,12]. In September 2010, a tin tailings pond in China’s Guangdonge collapsed, causing at least 18 deaths and direct economic losses of approximately 460 million yuan [13].
Evolution of tailings flow resulting from tailings pond leakage is a complex mechanical process, which involves multiple interdisciplinary fields including fluid mechanics, geological hazards and sediment transport mechanics [14,15,16]. So far, numerous scholars have estimated the flow characteristics of tailings pond dam failure such as total tailings leakage, dam breach width and maximum tailings flux through theoretical derivation, statistical analysis and other approaches and also formed relevant theoretical formulas [17,18,19,20,21]. With the rise of computer simulation software, plentiful fluid dynamics software has been applied to the evolution pattern research of tailings flow resulting from tailings pond leakage [22,23,24,25]. The fluid rheological equation embedded in FLO-2D, a US Federal Emergency Management Agency (FEMA)-approved flood and mudflow hazard simulation software [26,27], can be used for the simulation of the rheological state during evolution of leaked tailings flow.
This study explores the evolution of leaked tailings flow following dam failure and its effects on the downstream structures and personnel during evolution. Using the FLO-2D simulation software (FLO-2D Software Inc, Nutrioso, AZ, USA), the evolution process of tailings flow is studied under different downstream riverbed slopes and debris blocking dam construction parameters. At the same time, the evolution pattern, sedimentary characteristics and energy loss of tailings flow during evolution are analyzed. In addition, the effects of downstream riverbed slope and debris blocking dam construction parameters on the tailings flow characteristics are also investigated.
2. Model and Computational Method
2.1. Simulation Model and Boundary Conditions
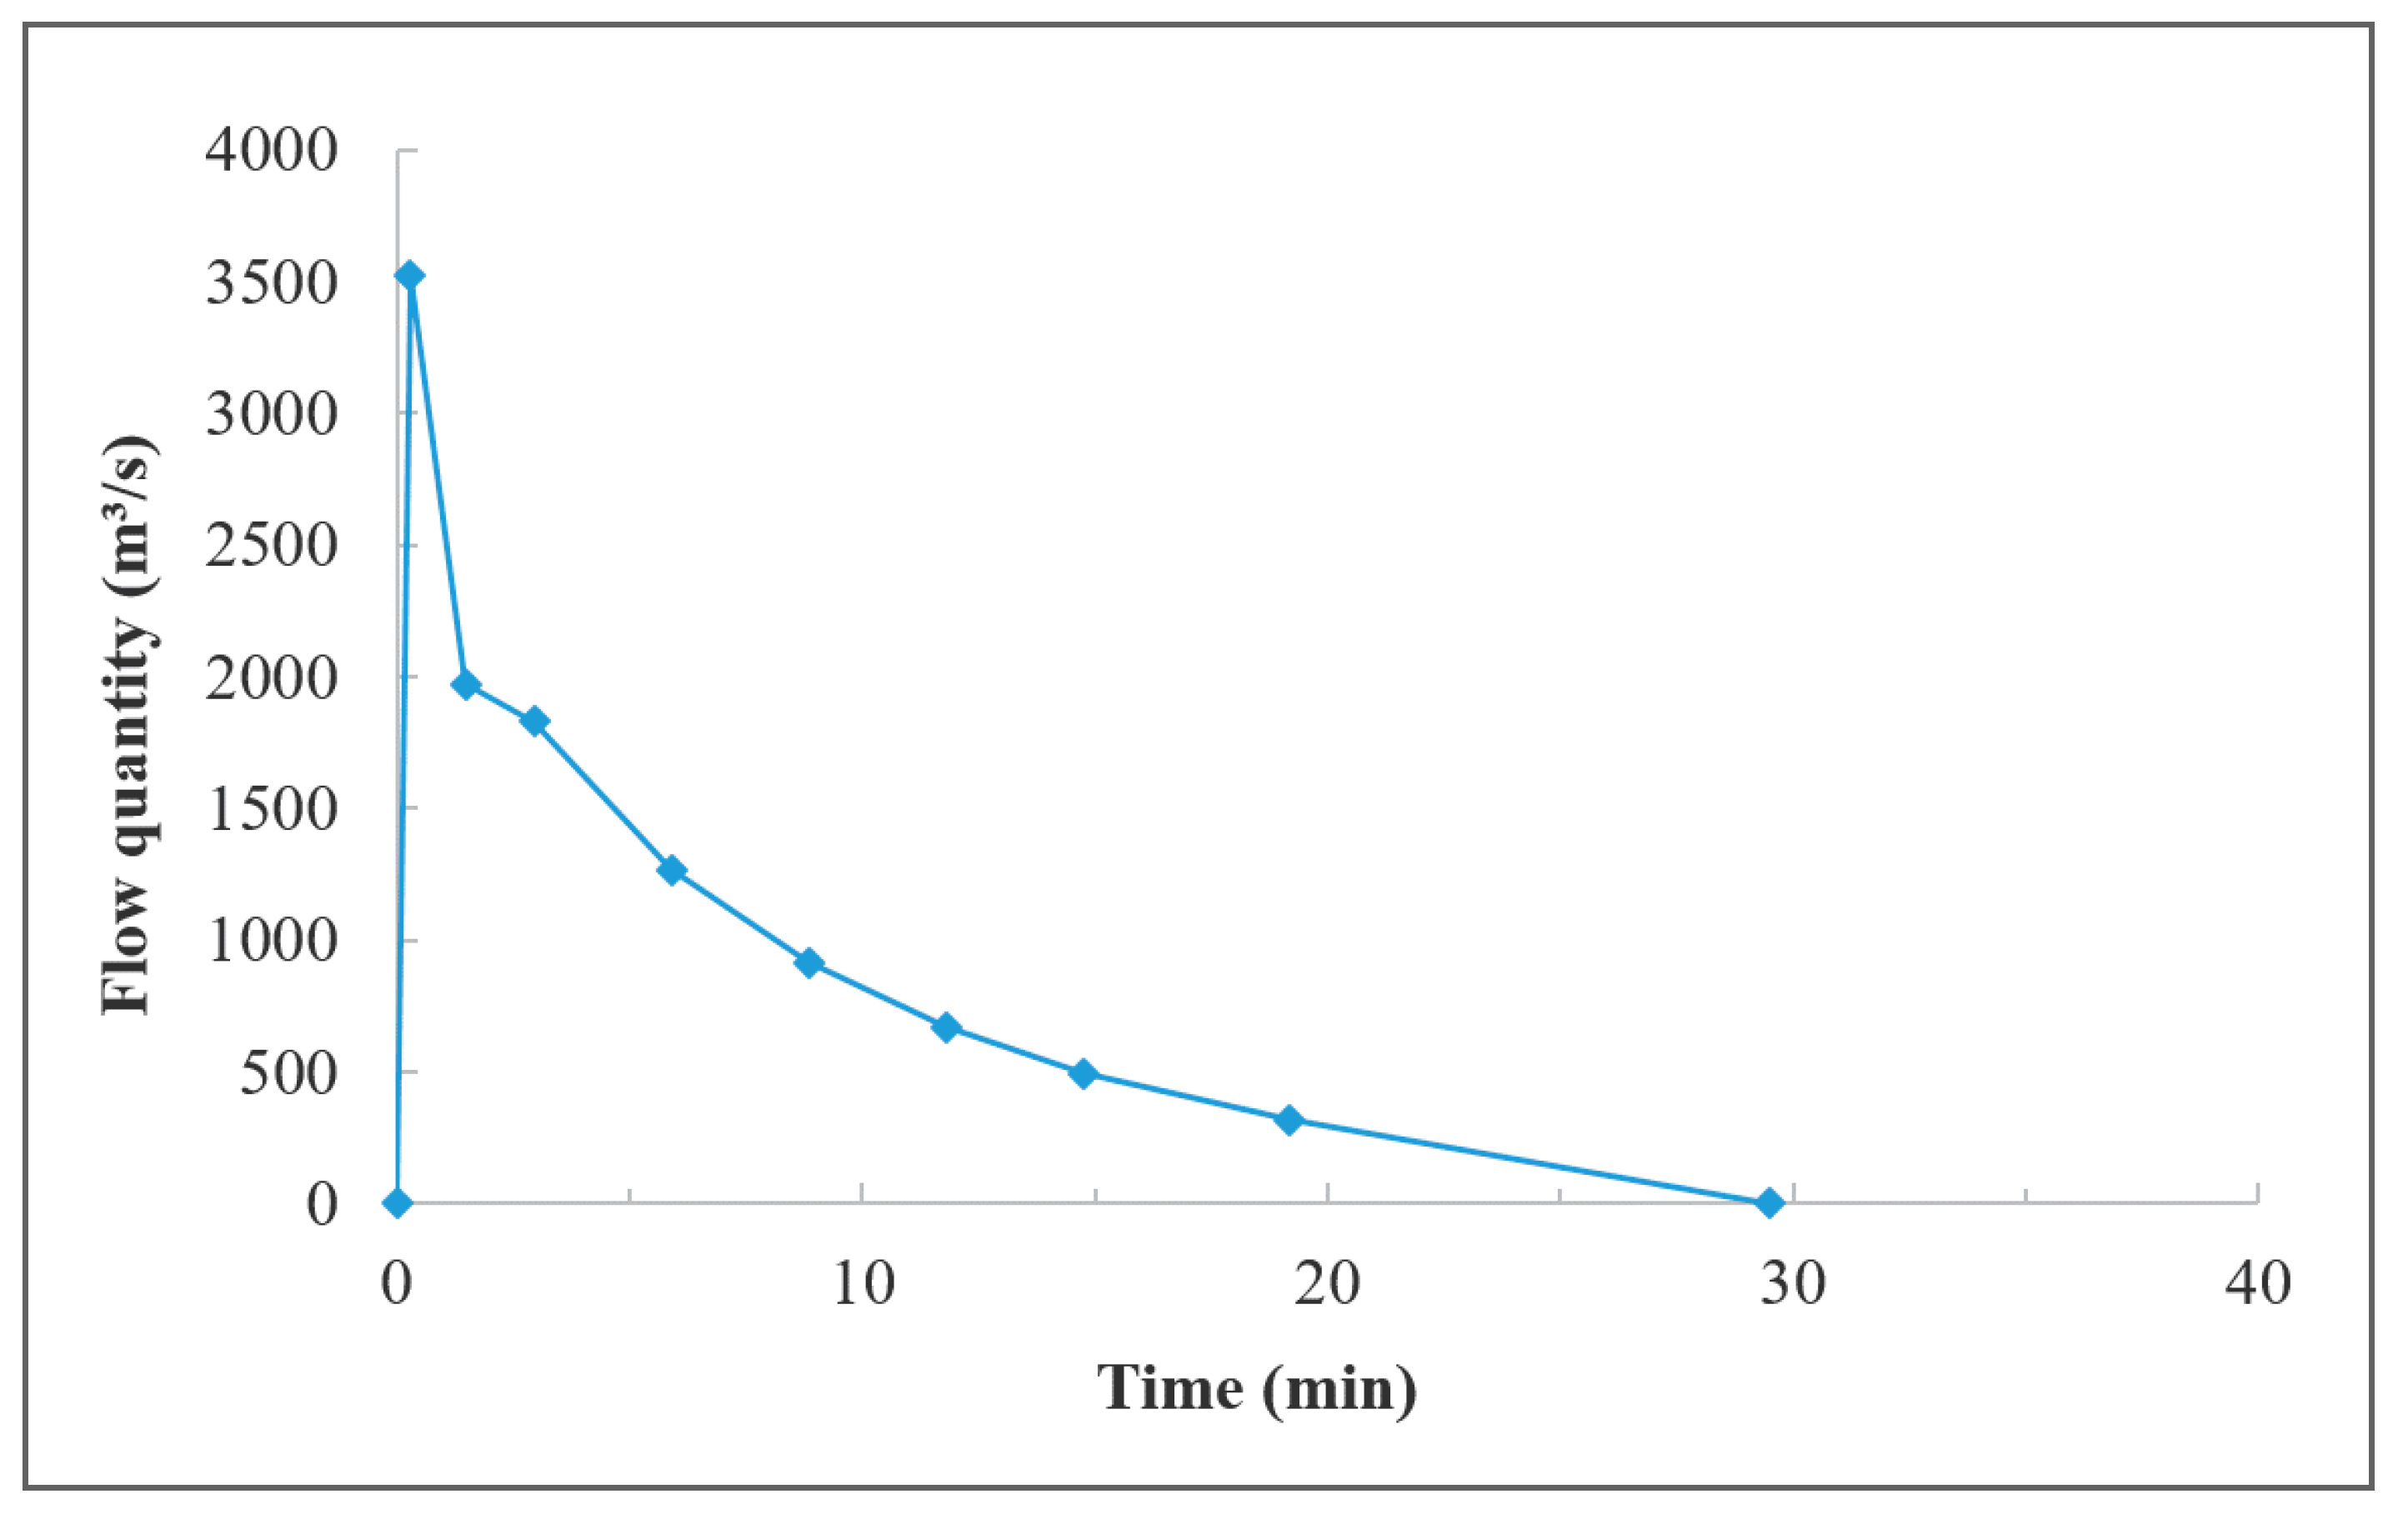
Digital Elevation Model (DEM) is created by collecting the digital elevation data within the scope of studied tailings pond combined with in situ investigation. The studied tailings pond dam has a crest elevation of 2005 m (the height above sea level), a fill dam height of 30 m, an initial dam height of 32 m, a total dam height of 62 m, a whole storage capacity of 3.996 million m3, and an effective storage capacity of 3.197 million m3, and it is located in Huili Country of Liangshan, Sichuan Province of China. The tailings pond adopts upstream damming, in which the height of each sub-dam is 5 m, the ratio of sub-dam to outer slope is 1:3.5, and the total slope ratio is 1:4.233. The objective of the sub-dams located upstream of the main dam is the deposition of tailings upstream of the sub-dams and, consequently, the increase of the storage capacity of the tailings ponds and the decrease of the streambed slope. Besides the storage capacity, maximum pond water level at overtopping, basic mechanical parameters of dam tailings and flow hydrograph range (Figure 1) of the tailings pond are determined based on the data collected in situ and the information provided by mining companies.
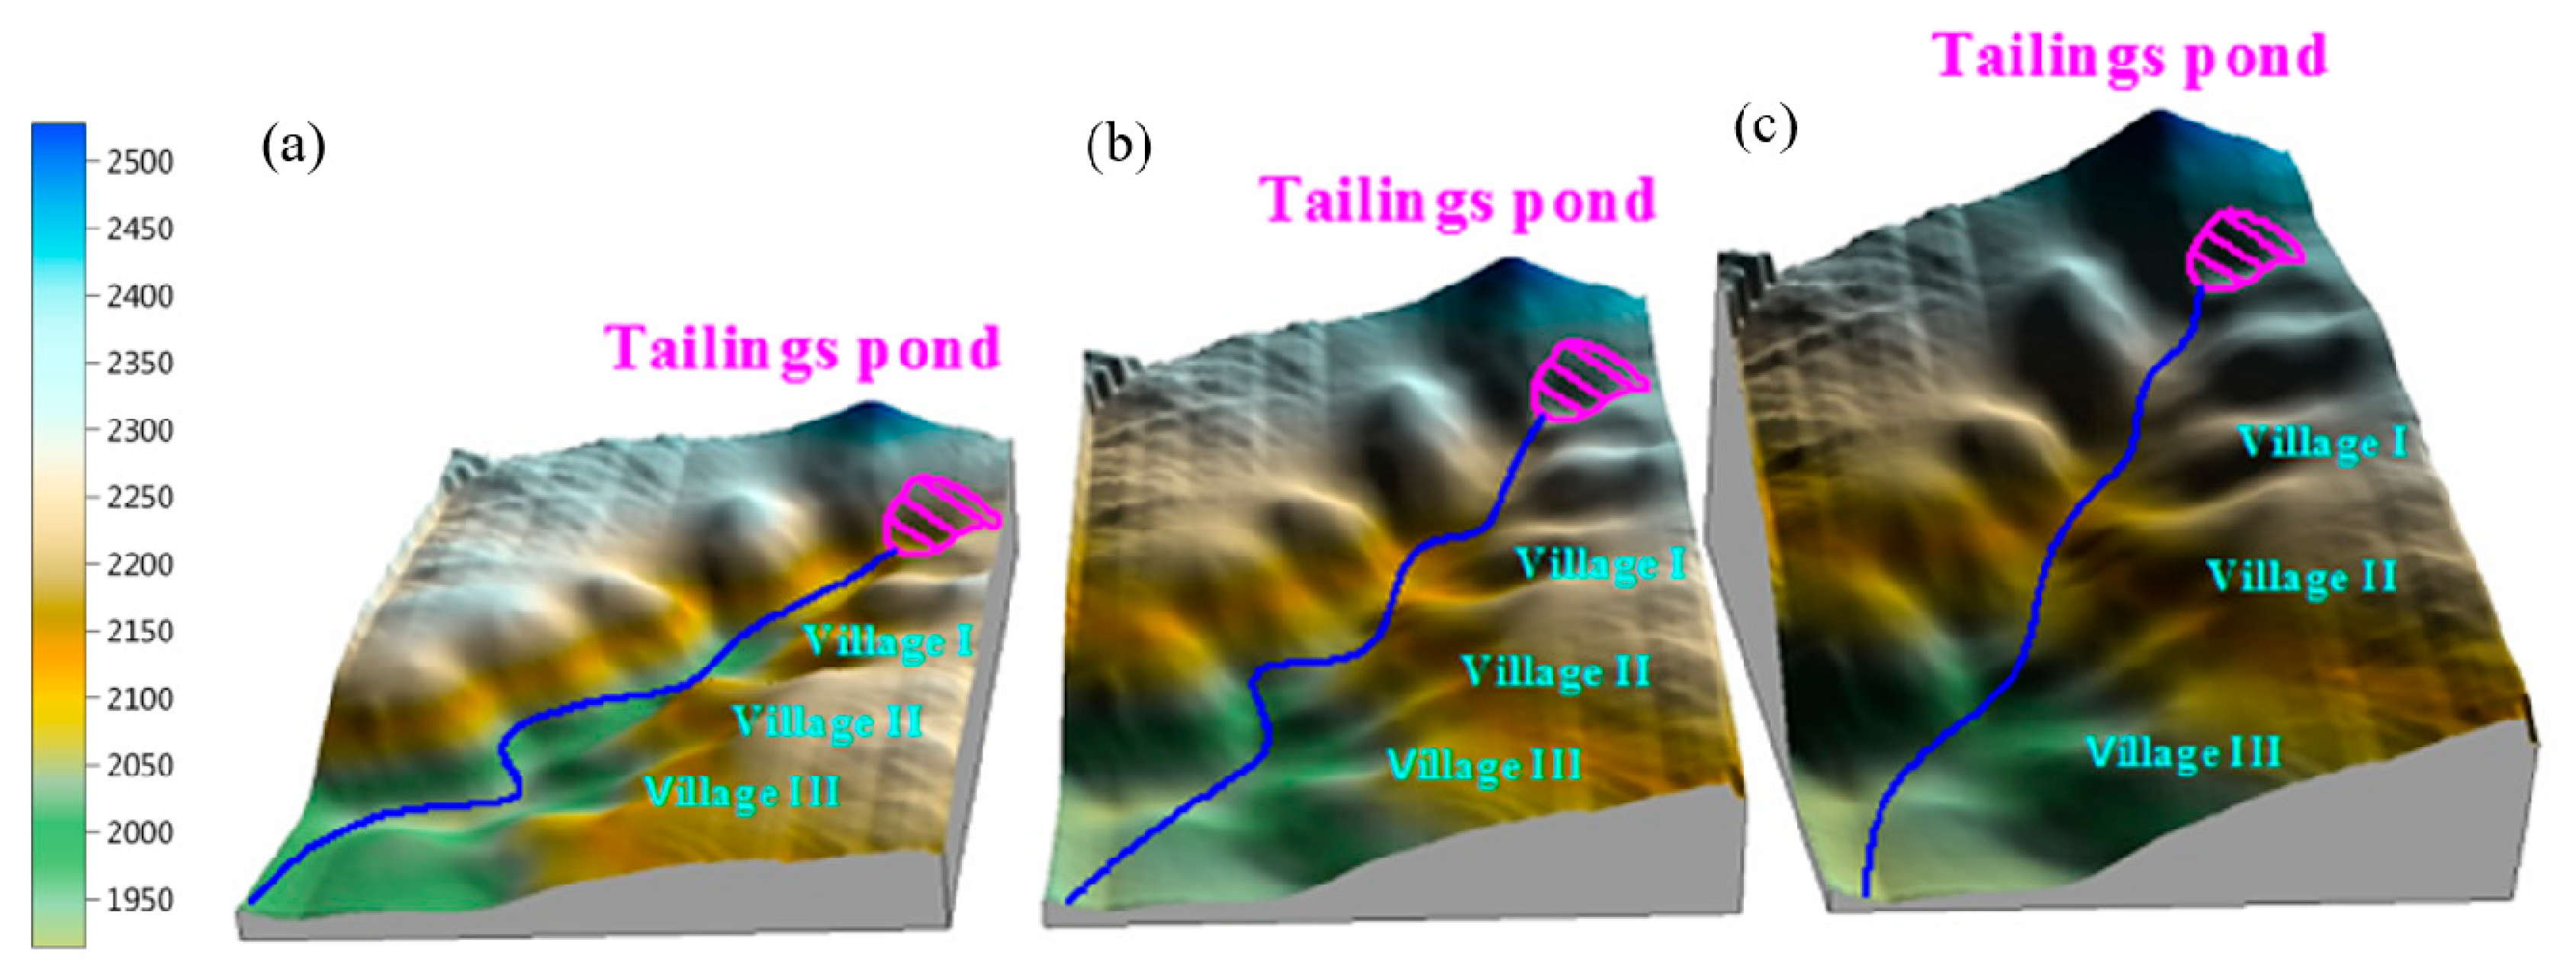
Dam failure computation models are built through in situ investigation at three downstream riverbed slopes, i.e., original terrain slope (average slope ratio of 4.2% along the valley bottom), elevation by 5% (average slope ratio of 9.2% along the valley bottom) and elevation by 10% (average slope ratio of 14.2% along the valley bottom), which can be found in Figure 2.
2.2. Computational Parameters
After vertical integration, the controlling equations can be reduced to a 2D format [28], which is described by the Navier-Stokes equations. The simplified controlling equations are shown below.
The continuity equation:
The equations of motion:
where h denotes the draining tailing flow depth (m), I is the drop in the water surface per unit distance within the simulated range and is called the hydraulic gradient (%), u and v refer to the flow rate in the horizontal and vertical directions (m/s), respectively; and are the differences in the unit distance of the frictional resistance in the x and y directions, respectively, and are called the frictional slope (%), and are the differences in elevation within a unit distance in the x and y directions, respectively, and are called the riverbed slope (%).
When the flood or tailings flow is simulated by the FLO-2D, it can be performed in the dynamic wave mode or the diffused wave mode. According to the similarity criterion, Equation (1) is a mass conservation equation, while Equation (2) and Equation (3) are the momentum conservation equations.
Additionally, the evolution process of leaked tailings flow can be described by the rheological equation for high sediment concentration, which is proposed by O’Brien [29], as shown below.
where Sf, Sy, Sv and Std represent frictional slope, yield slope, viscous slope and turbulence-distribution slope, respectively. denotes the yield stress of the fluid during the flow, denotes the fluid specific gravity, is the viscous coefficient of fluid, is the laminar flow resistance coefficient, and n refers to the Manning coefficient representing the roughness of ground surface.
Yield stress in the current study refers to the Bingham yield stress, which is reflected primarily as the internal stress pattern of viscous tailings flow and present in the form of viscous force [30,31,32]. The viscous force is a resistance produced by the interaction between shear and tensile stresses of fluid [33,34]. As a result, the Bingham viscosity coefficient and viscous force are closely correlated in the present work, and the increase in fluid volume concentration leads to exponential increases in the Bingham yield stress and Bingham viscosity coefficient [35,36].
The relationship between the yield stress and the volume concentration is shown in Equation (5).
and the relational expression between the Bingham viscous coefficient and the volume concentration is presented in Equation (6).
where volume concentration (CV) indicates the percentage of soil and debris like aggregate and gravel in the leaked tailings flow over the entire tailings flow volume. and are the empirical coefficients of the yield stress and viscous force, which can be derived experimentally. On this basis, Table 1 provides the relevant parameters used in the present numerical simulation.
3. Results and Discussion
3.1. Various Downstream Riverbed Slope Conditions
3.1.1. Flow Depth of Leaked Tailings
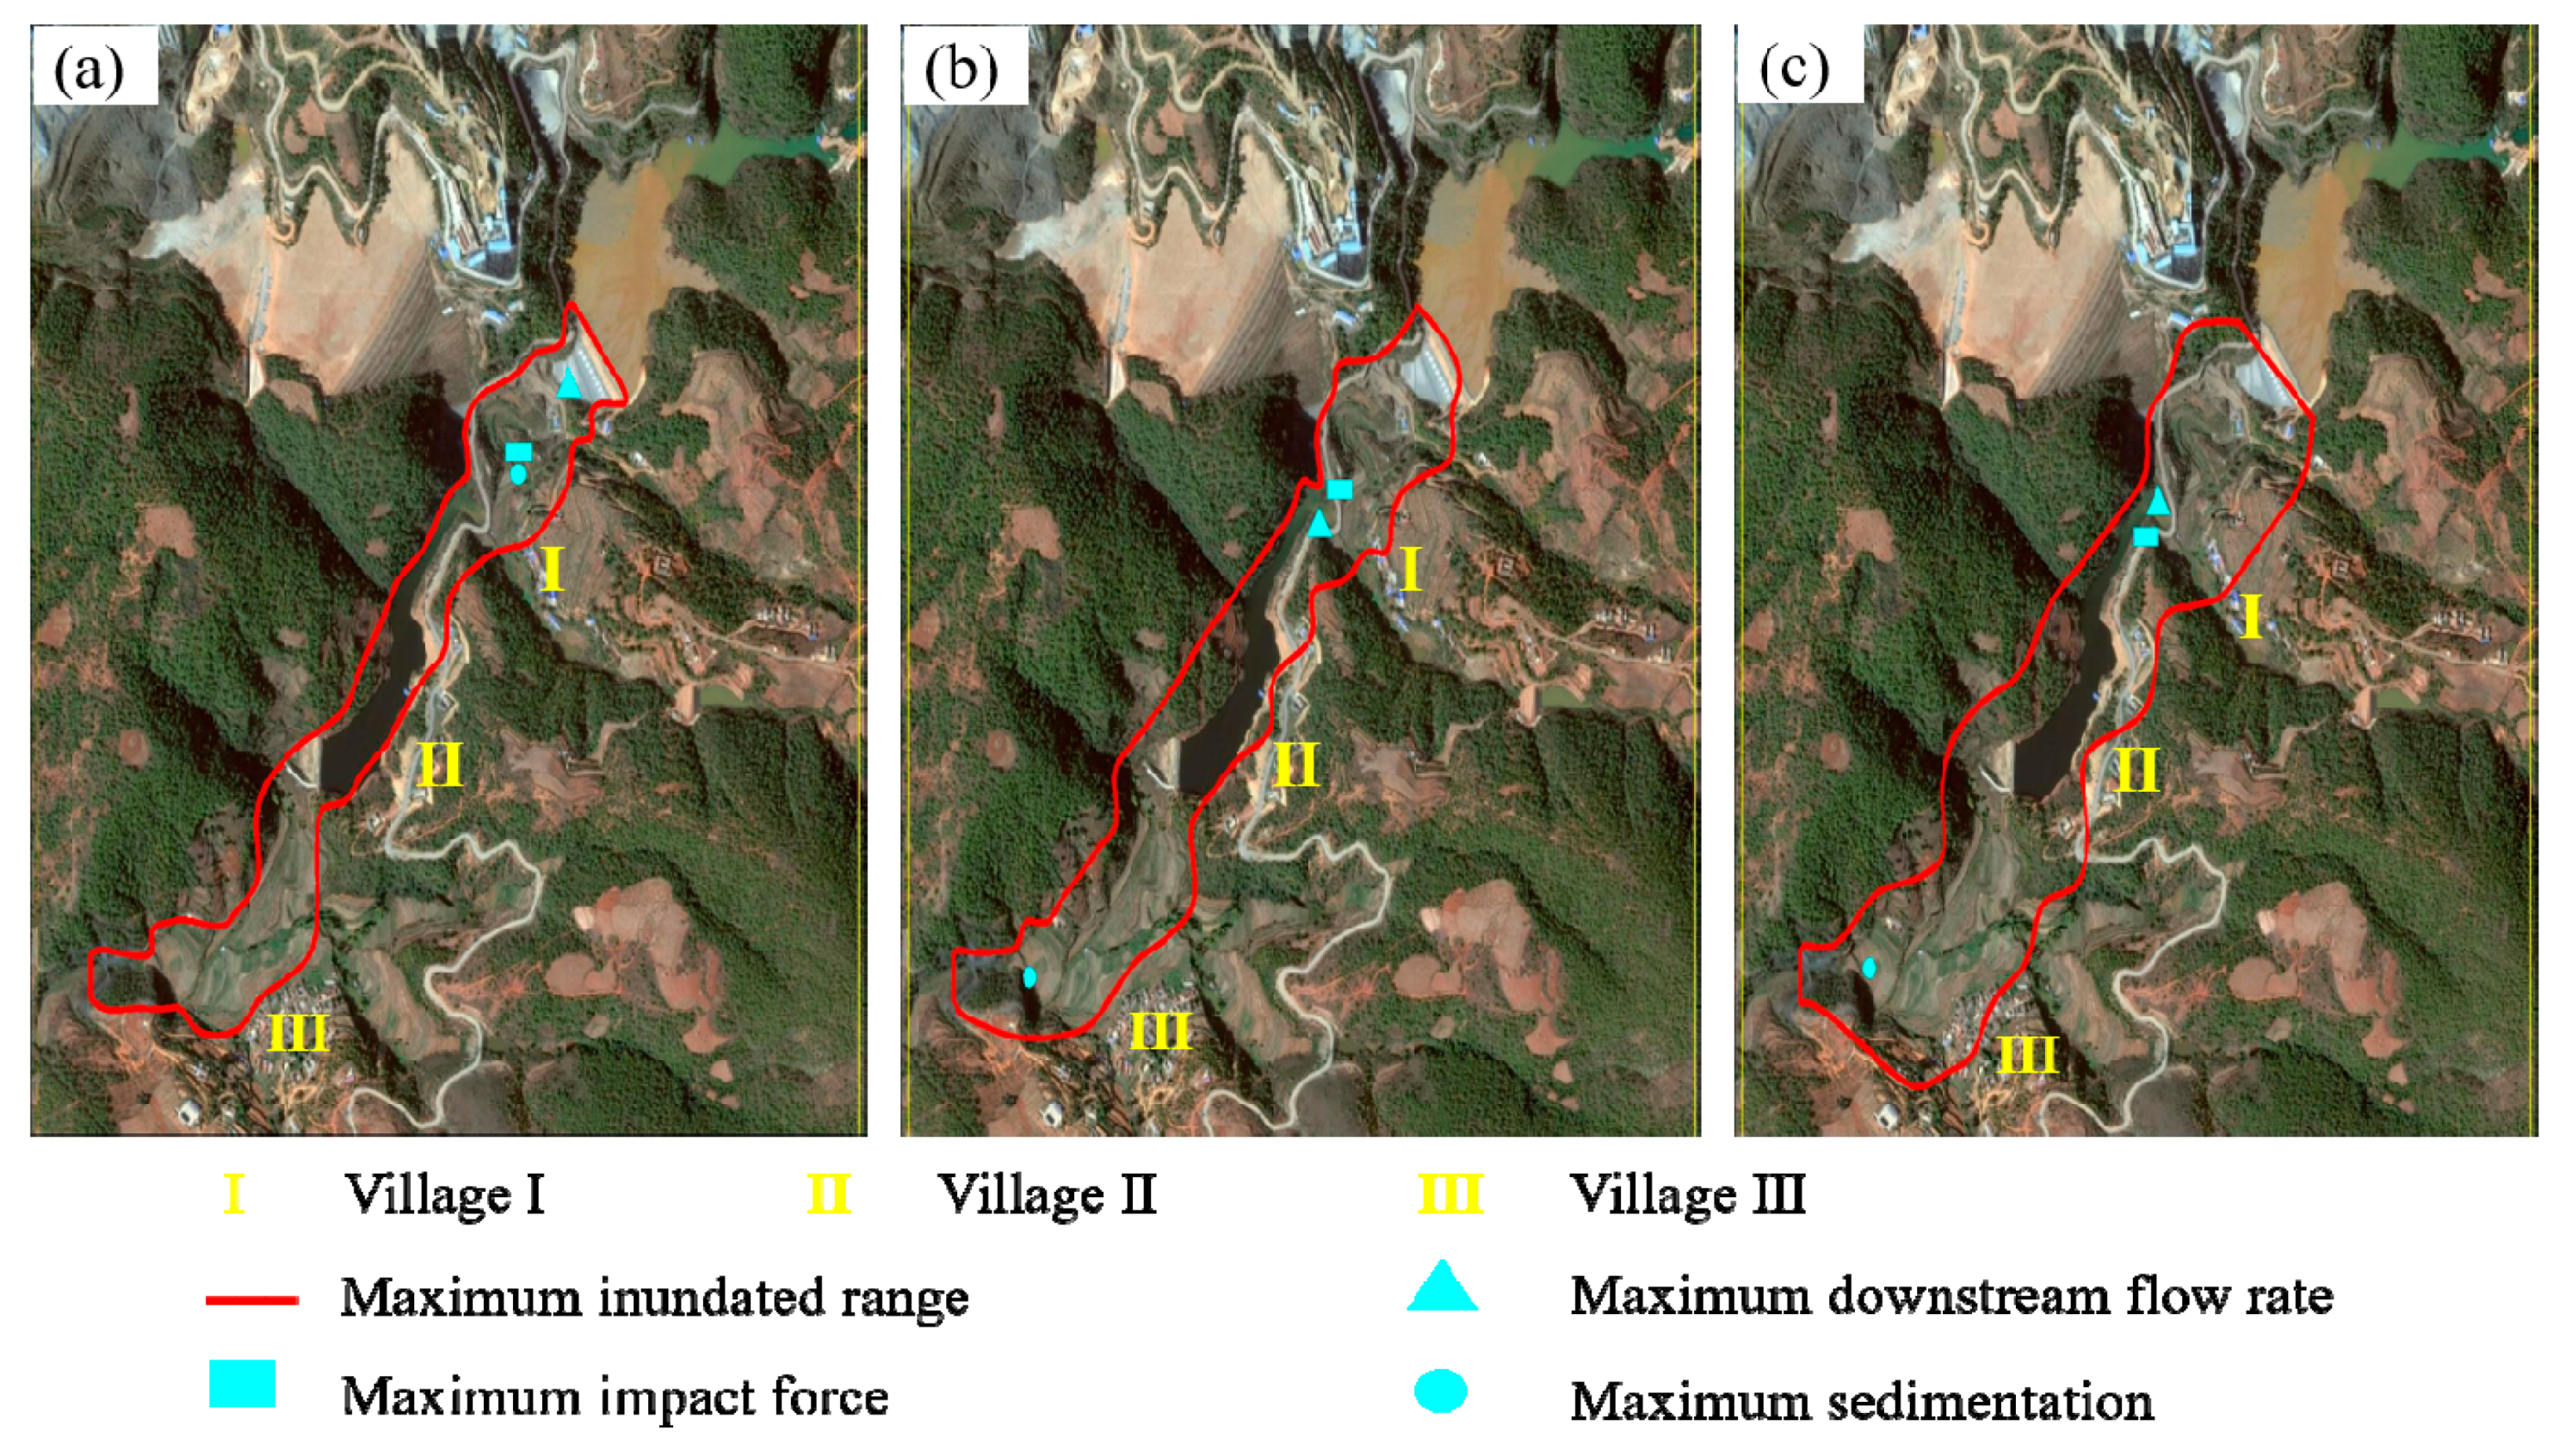
This study chooses the passage zone downstream of the tailings pond as the simulation target. As presented in Figure 3, the leaked tailings all flow downstream along the valley bottom (lowest point) within the passage zone after collapse of tailings pond in three different slope conditions.
Due to the presence of fluted or relatively flat terrains upstream and downstream of the passage zone, the inundated areas by leaked tailings flow are larger on the upstream and downstream sections than the midstream section, where the terrain changes more drastically. The inundated ranges increase with the increasing slope of downstream riverbed, which maximize at 2.8 × 10⁵ m2, 3.7 × 10⁵ m2 and 4.9 × 10⁵ m2, respectively. In the earlier stage of dam failure, the volume of water in the leaked tailings flow is considerably higher than the volume of tailings. As the dam breach opening develops further, the content of tailings increases. In the meanwhile, the impact height increases gradually with the descending terrain, and the influence scope on downstream section accordingly increases. The elevated content of tailings in the leaked tailings flow leads to a corresponding increase in the fluid viscosity. In the later stage of dam failure, the water content in leaked tailings flow declines gradually, and the drag force of tailings flow decreases. By contrast, the frictional resistance increases to ultimately attain equilibrium of forces and maximization of flow rate. With further increase in the frictional resistance, the flow rate of leaked tailings flow declines to zero to achieve the maximum inundated area. This result is consistent with the energy storage-dissipation-deposition process during physical motion [37].
Figure 4 presents a diagram of maximum impact height of leaked tailings flow along the valley bottom downstream of dam in the earlier stage. In the original terrain scenario, the tailings in leaked tailings flow are deposited substantially within the valleys or flat terrains on the upstream 150–650 m section and the downstream 1200–1800 m section after the failure of tailings pond, while deposited slightly within the areas with sharp slope changes on the midstream section. After terrain elevation by 5% and 10% separately on the basis of original topography, significant reduction of tailings storage capacity is noted for both the upstream and downstream sections with the rising terrain, as well as substantial decline in the amount and depth of deposition.
Maximum depth of tailings deposition decreases gradually with the elevating slope of downstream riverbed. Maximum impact height is found near Village I for the original terrain (14.43 m). After terrain elevation by 5% (4.97 m), the maximum impact height is found at the valley downstream of Village III; and after terrain elevation by 10% (3.30 m), the maximum impact height is found also at the valley downstream of Village III. Deepest sedimentation point of tailings is developed downstream, and the deposition thickness also decreases accordingly.
3.1.2. Flow Rate of Leaked Tailings
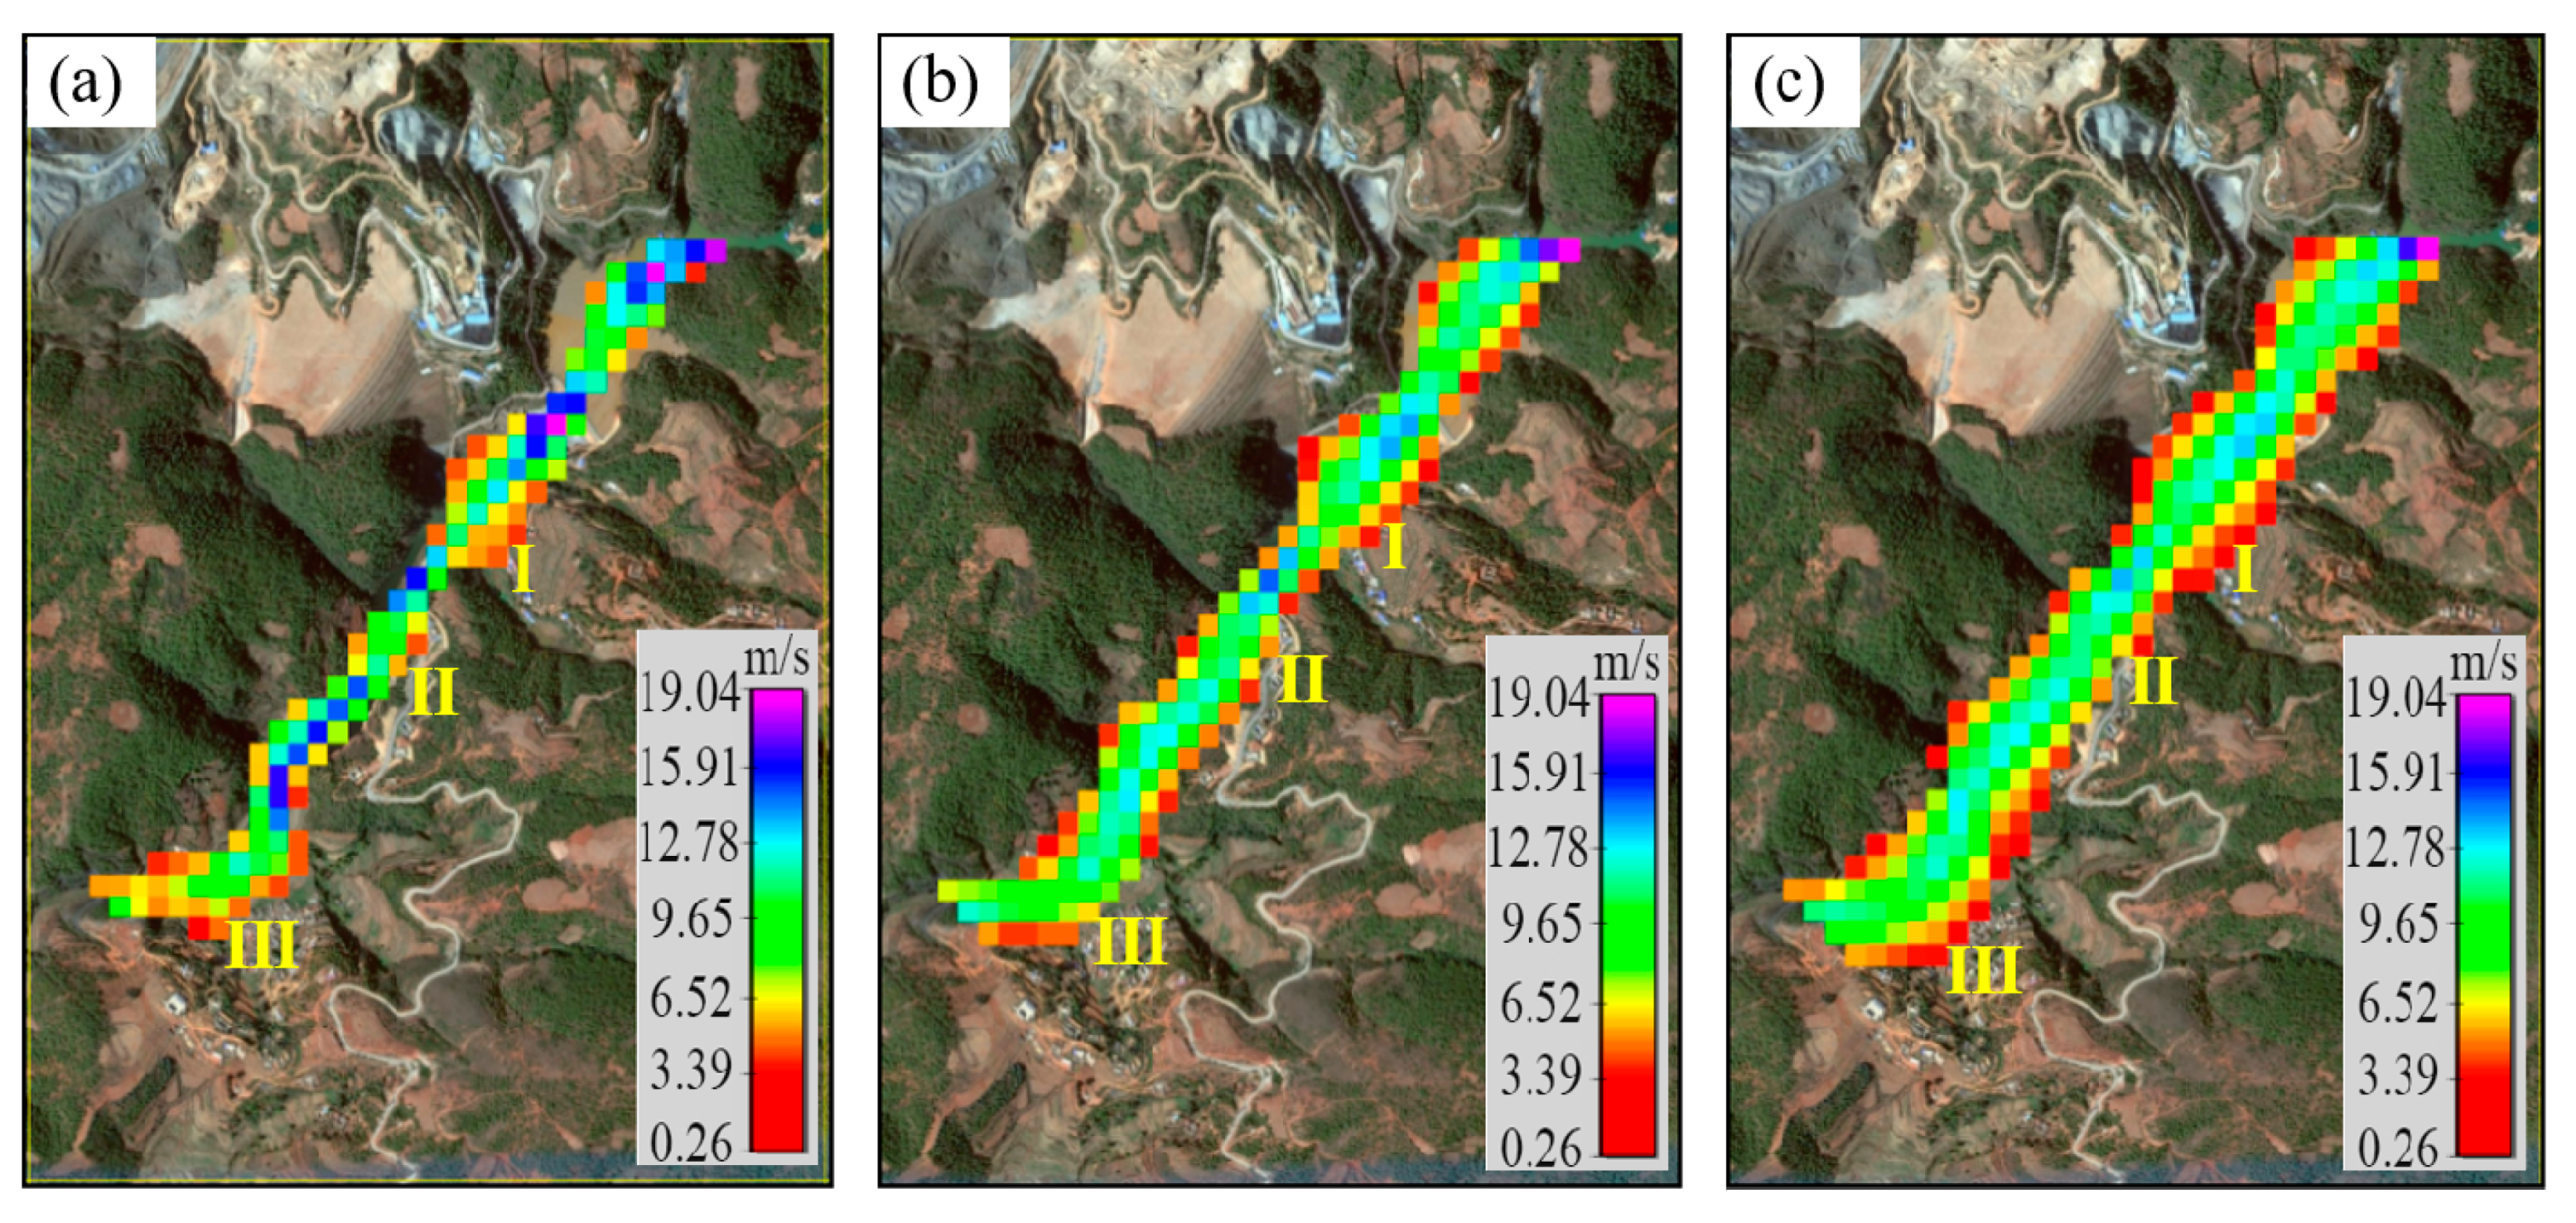
As shown in Figure 5, the maximum velocities of tailings flow are all located downstream of initial dam, and the maximum evolution velocities of tailings flow increase with the elevating terrain, which are 10 m/s, 10.9 m/s and 13.5 m/s, respectively. In the original terrain scenario, the terrain and altitude difference decrease sharply within the areas downstream of initial dam and upstream of Village III after dam failure, thus enabling fast evolution of the leaked tailings flow. At the downstream section of Village III, however, the altitude difference changes little and the evolution distance is long. Therefore, a gradual decline of flow rate is noted with the increasing evolution distance. According to Figure 5, after elevating terrain by 5% and 10%, the altitude difference changes rather greatly for a scope from the initial dam to the 1000 m downstream section, and the flow rate of leaked tailings continues to heighten. The velocity tends to stabilize when the downstream altitude difference narrows down.
3.1.3. Impact Force of Leaked Tailings Flow
This study investigated the effect of the impact during the evolution process of leaked tailings flow on its downstream constructs, and the exerting range of impact force is the region that the discharged sediments flow through. The impact force of leaked tailings flow on the downstream constructs is calculated using Equation (7) through Equation (9) [27,37,38,39,40]. Multiple factors, including the impact angle, flow rate and density of tailings flow, can affect the computational results by varying degrees [38,39,40].
where denotes the impact pressure imposed by leaked tailings flow on other objects within the flow region; refers to the fluid density of leaked tailings flow; denotes the maximum depth of leaked tailings flow; is the impact coefficient, and its value range from 1.261 to 3.427 [26,27]; is the flow rate of leaked tailings at arbitrary time; Cw represents the weight concentration; e is a constant; and is the impact force per unit width.
According to Equation (9), increases in the flow rate and depth lead to enhanced impact force per unit area.
From Figure 3 and Figure 6, it can be seen that the locations of maximum impact forces in three different conditions are all adjacent to the maximum evolution velocity location. In the original terrain condition, the maximum impact force is located downstream from the initial dam with the value of 706 kN/m. With the elevation of slope, the maximum impact force increases first and then decreases, which is 883 kN/m at an elevation by 5% and is 495 kN/m at an elevation by 10%, showing a value approximately 70% of the original terrain scenario.
3.2. Effects of Debris Blocking Dam on Tailings Flow
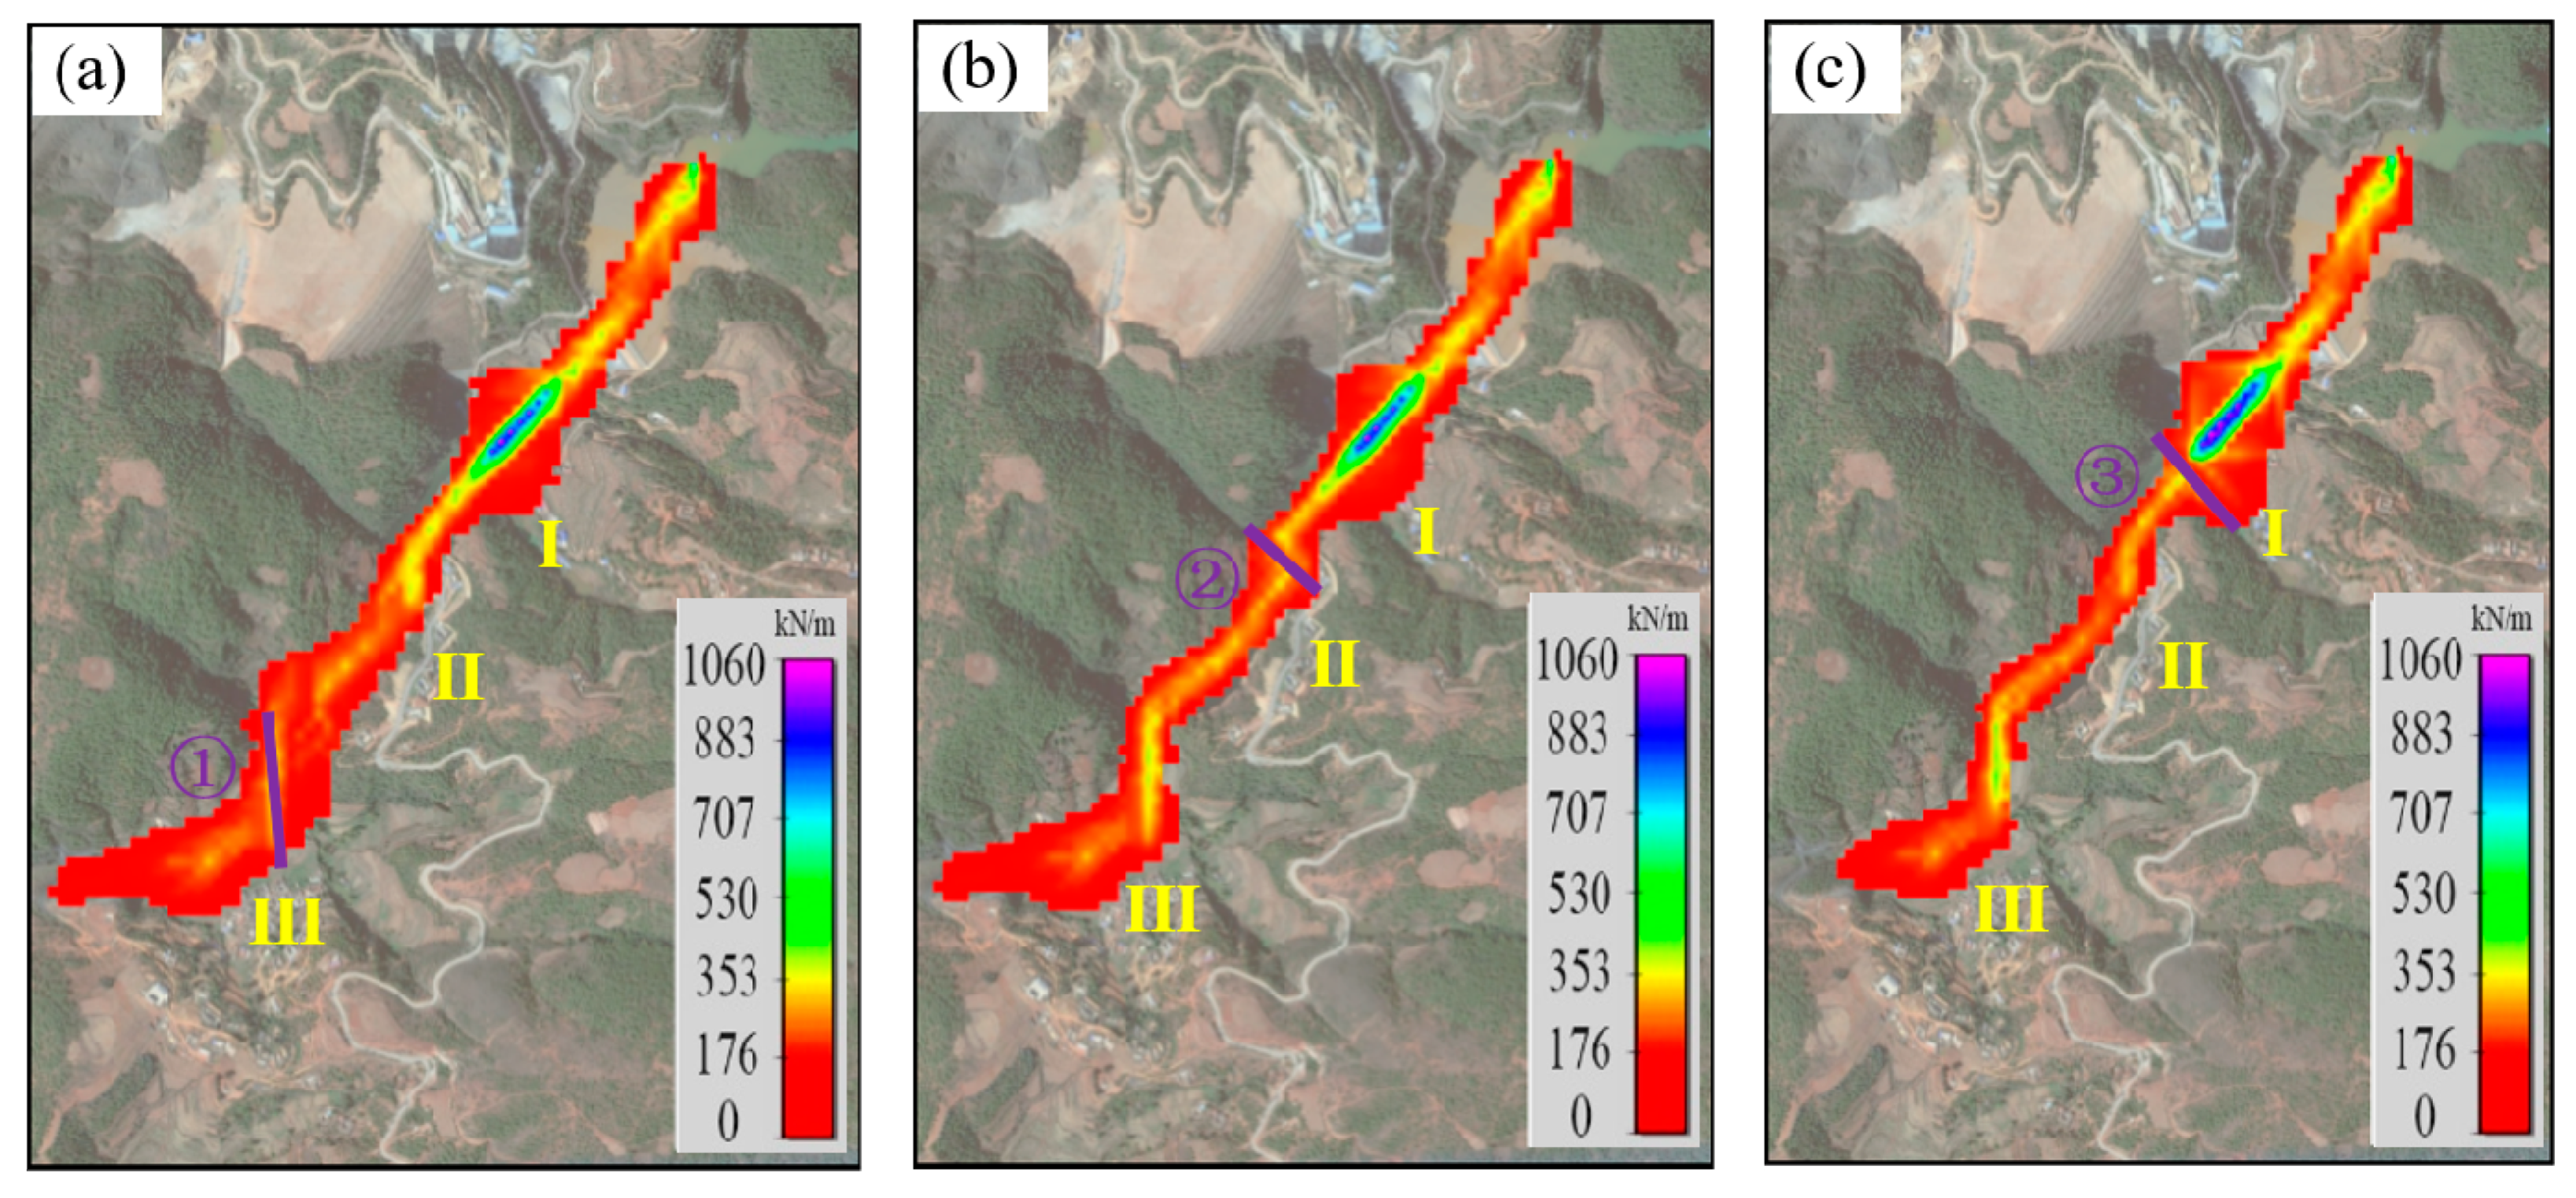
Debris blocking dams are set up at three characteristic locations downstream of initial dam in this study (Dam 1: valley mouth upstream of Village III, 1000 m away from the initial dam; Dam 2: valley mouth upstream of Village II, 600 m away from the initial dam; and Dam 3: valley mouth downstream of Village I, 400 m away from the initial dam). The height of these dams is 10 m.
According to the data collected in situ and the information provided by mining companies, there are villages downstream of these three locations, where the constructions of the debris blocking dams at these characteristic locations downstream are more conducive to reducing losses. Additionally, these three places are located at the top of the valley, the terrain on both sides is higher and the cost of dam constructions is relatively low.
3.2.1. Flow Depth of Leaked Tailings
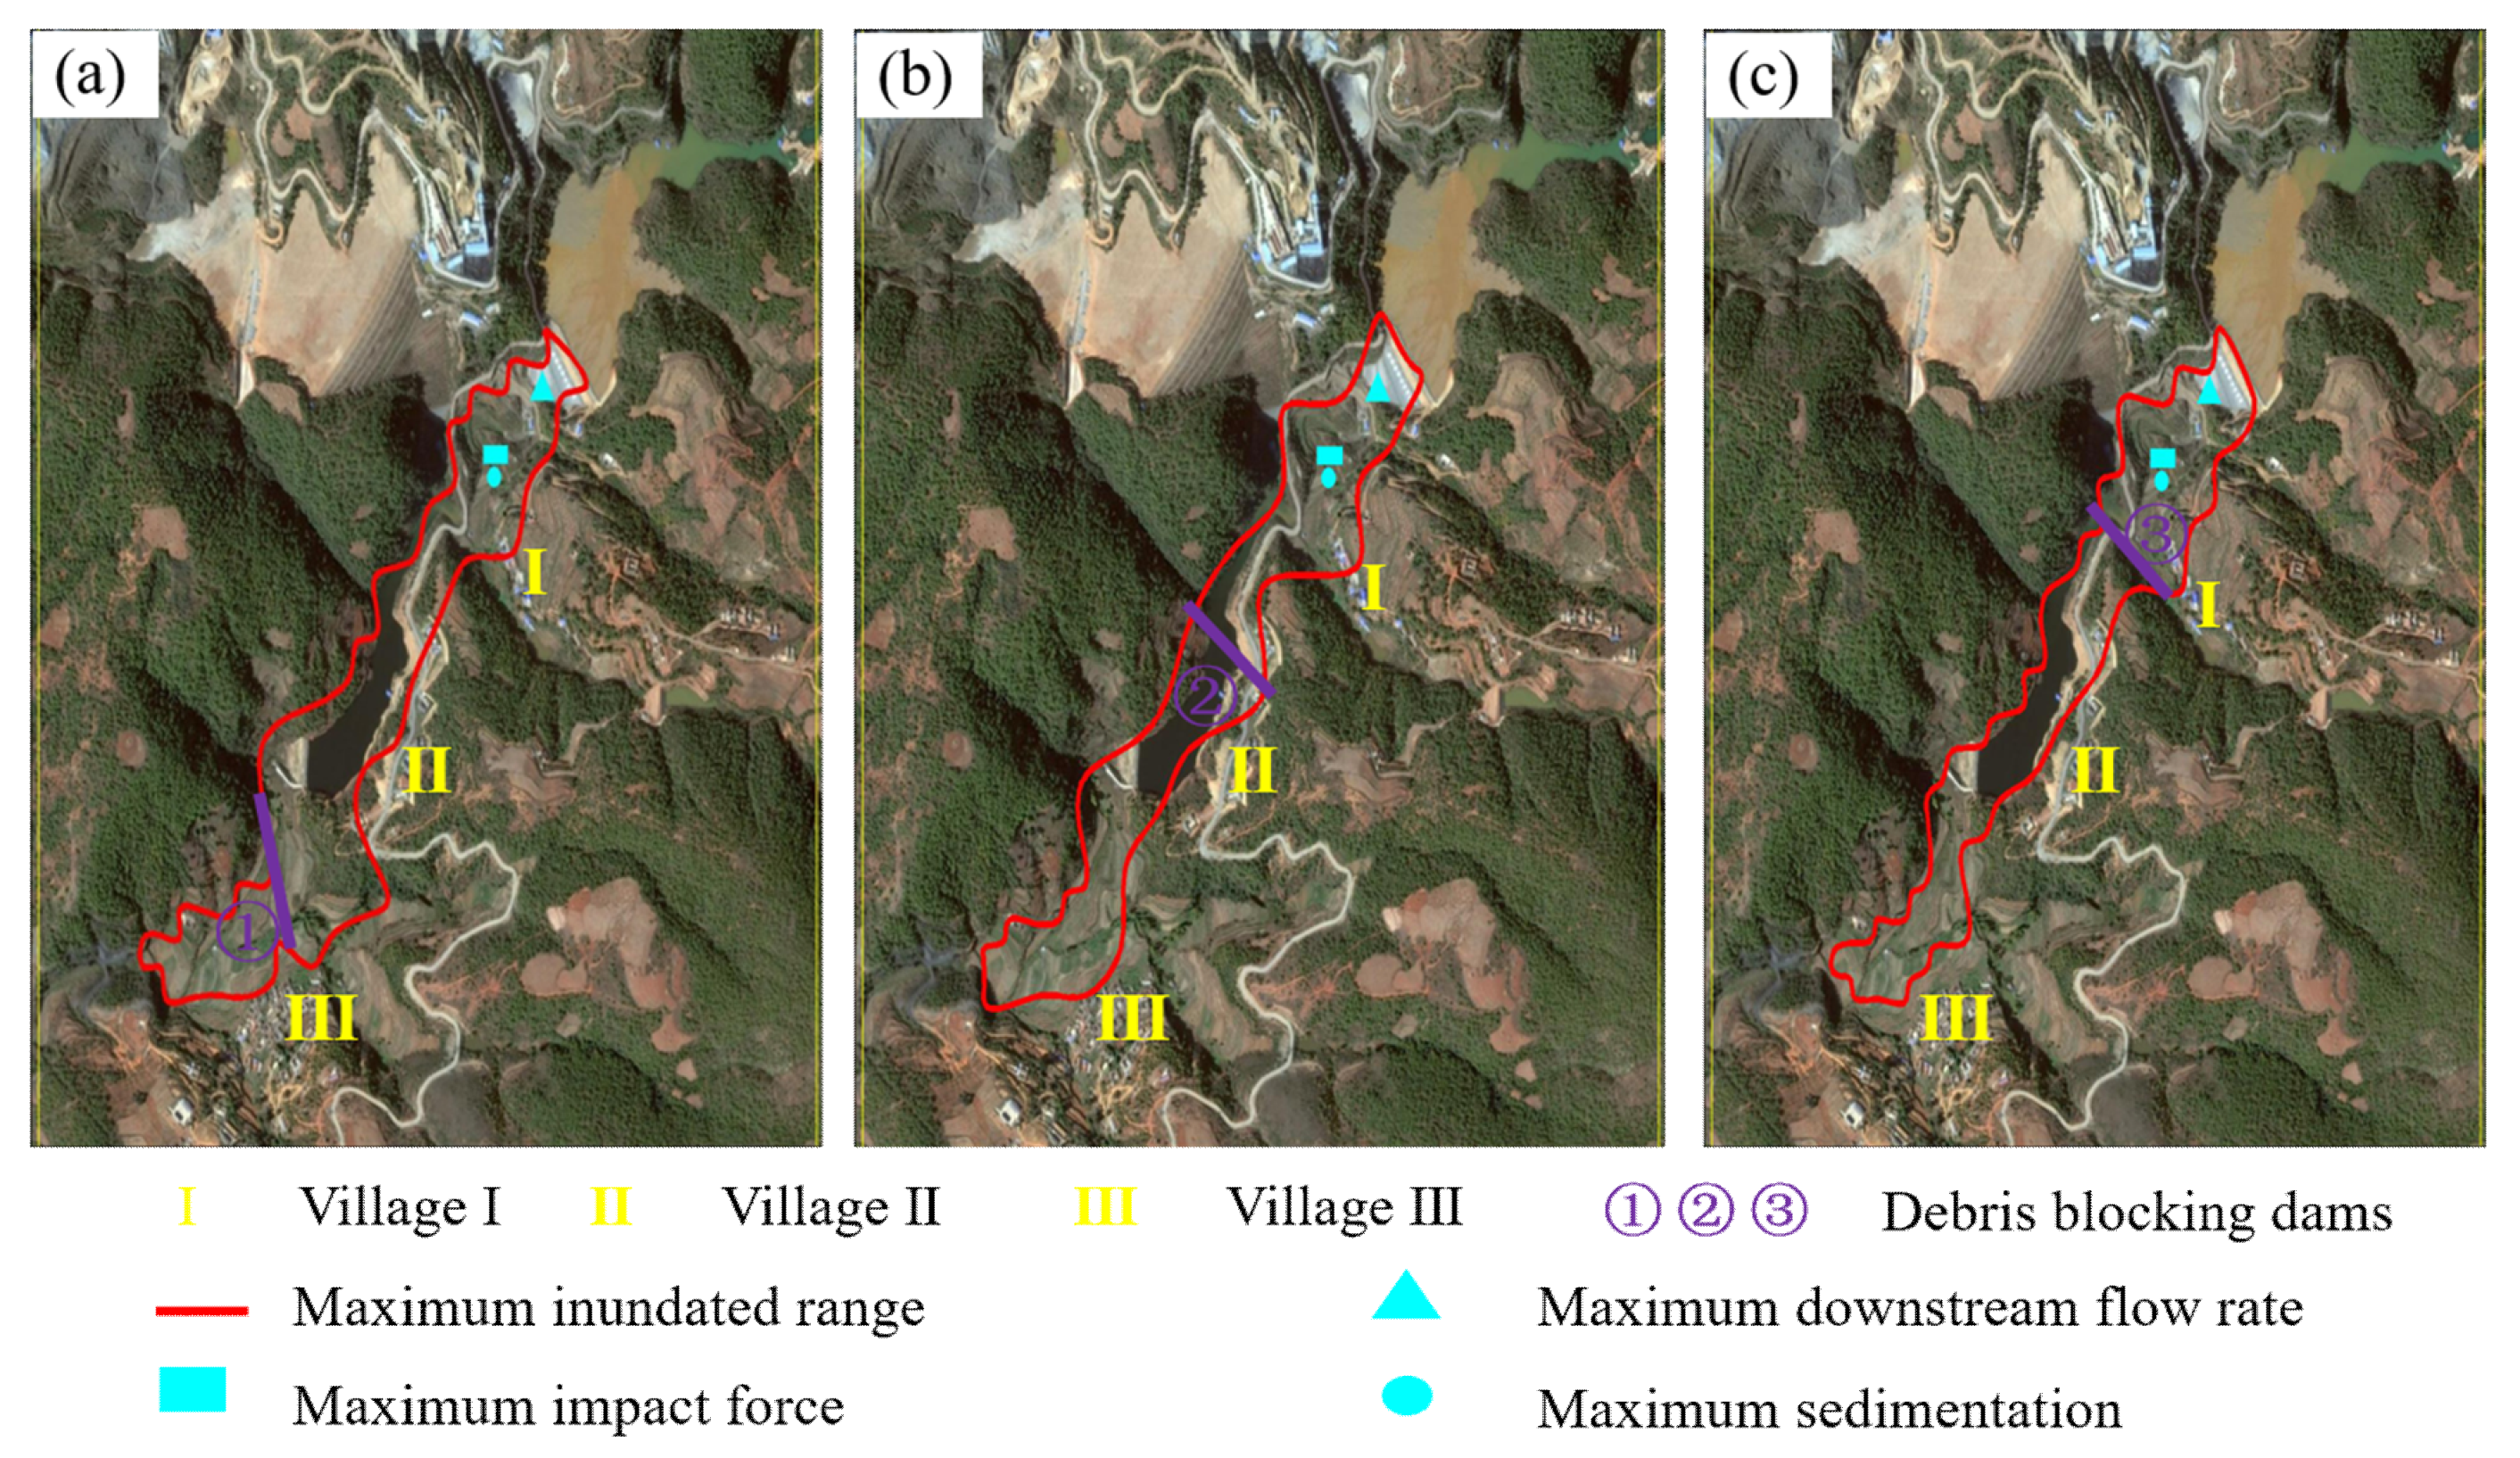
As presented in Figure 7, the leaked tailings flow evolves downstream along the topographically lowest point in the passage zone in all three different conditions. The tailings inundated area is larger for the upstream and downstream sections of passage zone than for the midstream section. Under three dam distance conditions, the maximum inundated ranges are 2.7 × 10⁵ m2, 2.5 × 10⁵ m2 and 2.37 × 10⁵ m2, respectively. Consequently, the downstream inundated area shrinks with the narrowing distance between debris blocking and initial dams.
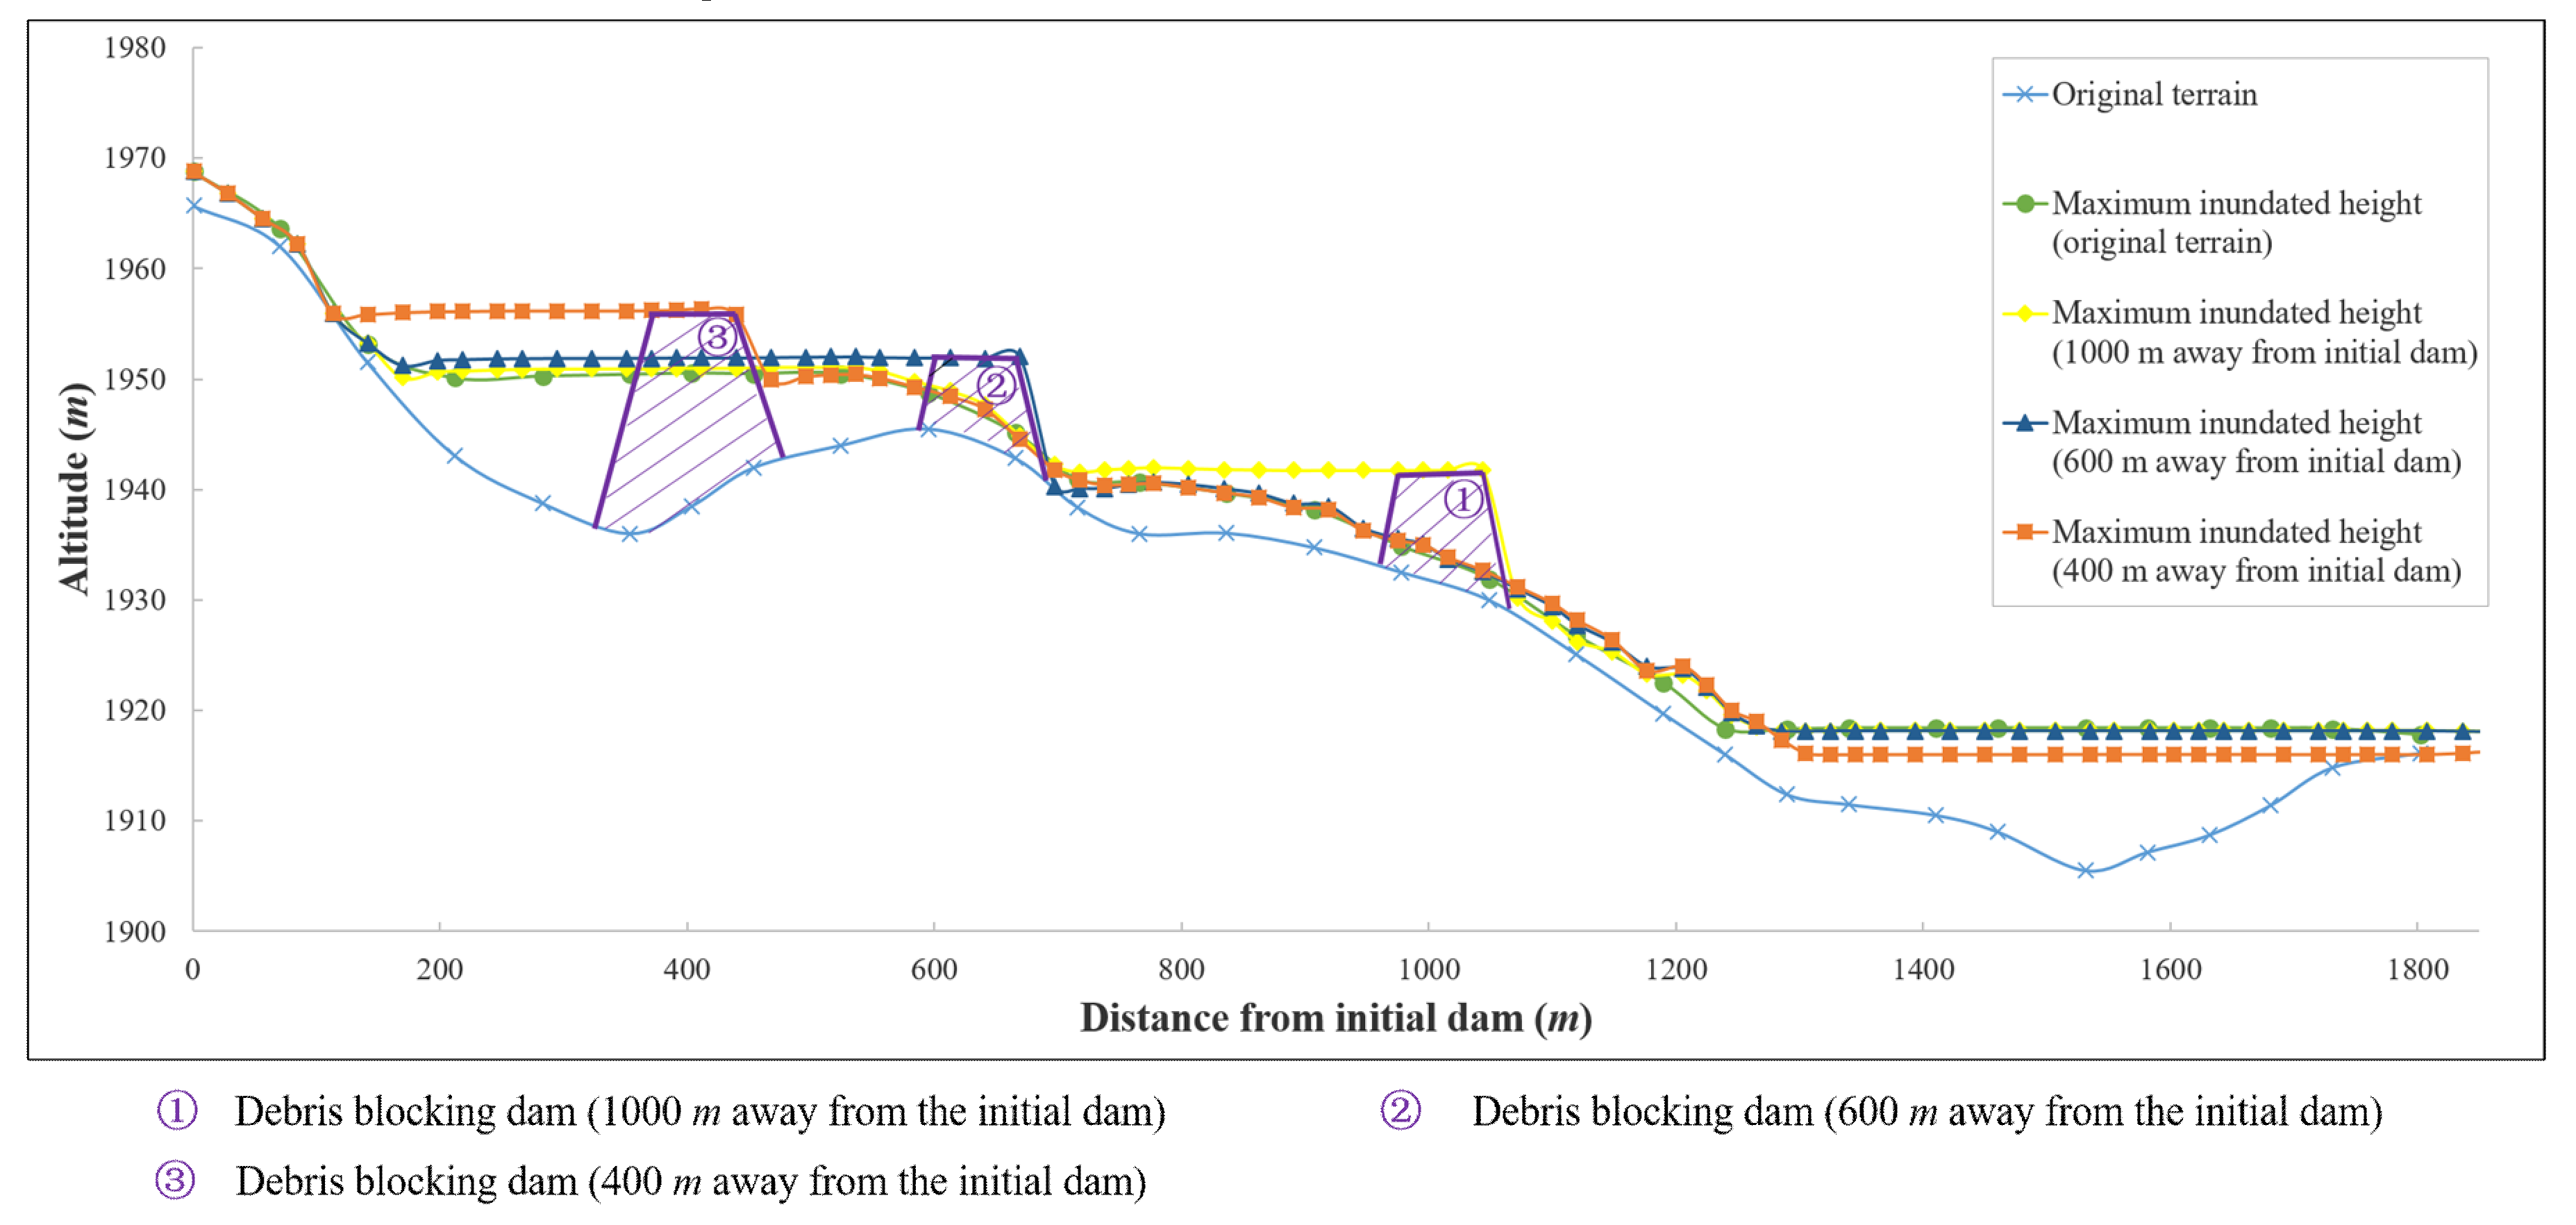
From Figure 8, it can be found that the deposition thicknesses of tailings crossing over the debris blocking dams decrease slightly compared with the case without such dams. The maximum sedimentation thicknesses are all found in front of the debris blocking dams, which increase with the shortening distance between initial and debris blocking dams and are all located in the valley near Village I. After flowing over the debris blocking dams, the tailings are deposited primarily in the valley near Village III, and the inundated height increases with the increasing of the distance between the debris blocking dam and the initial dam.
3.2.2. Flow Rate of Leaked Tailings
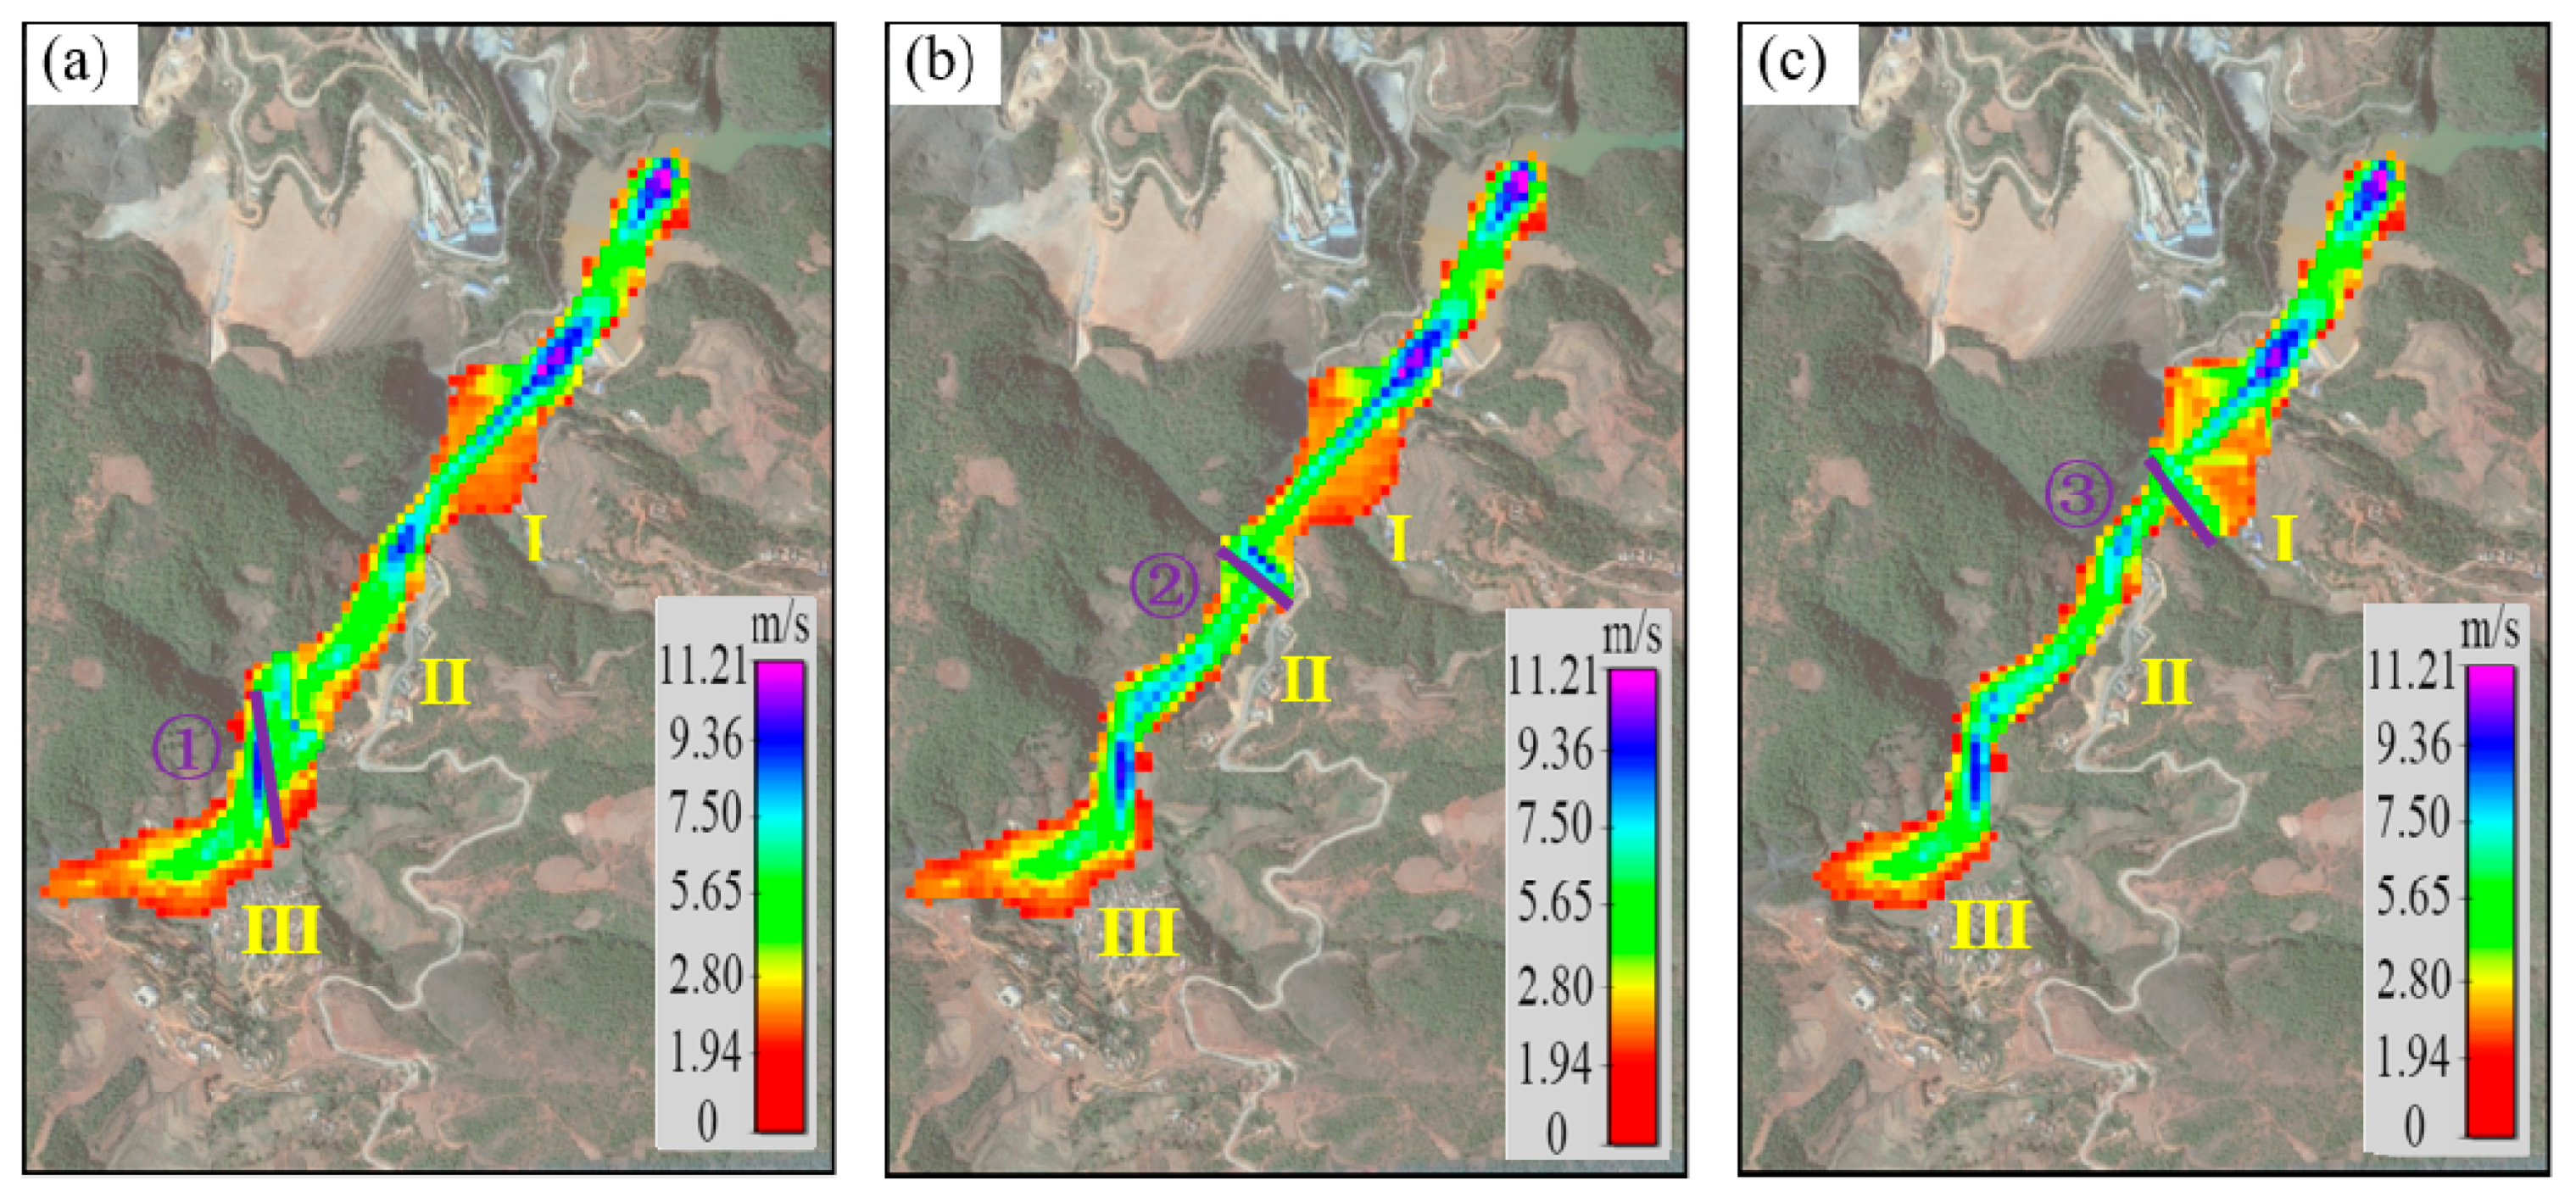
Figure 9 depicts the flow rate distribution of leaked tailings after establishment of debris blocking dams at different distances downstream of initial dam. The flow rates are 10.3 m/s in all three cases before crossing the dams, and the maximum flow rates are all located at the valley near Village I. Meanwhile, the maximum flow rates downstream of the debris blocking dams are all found at the valley mouth near the upstream side of Village III. After setting up the debris blocking dams, the maximum downstream flow rates also decrease accordingly.
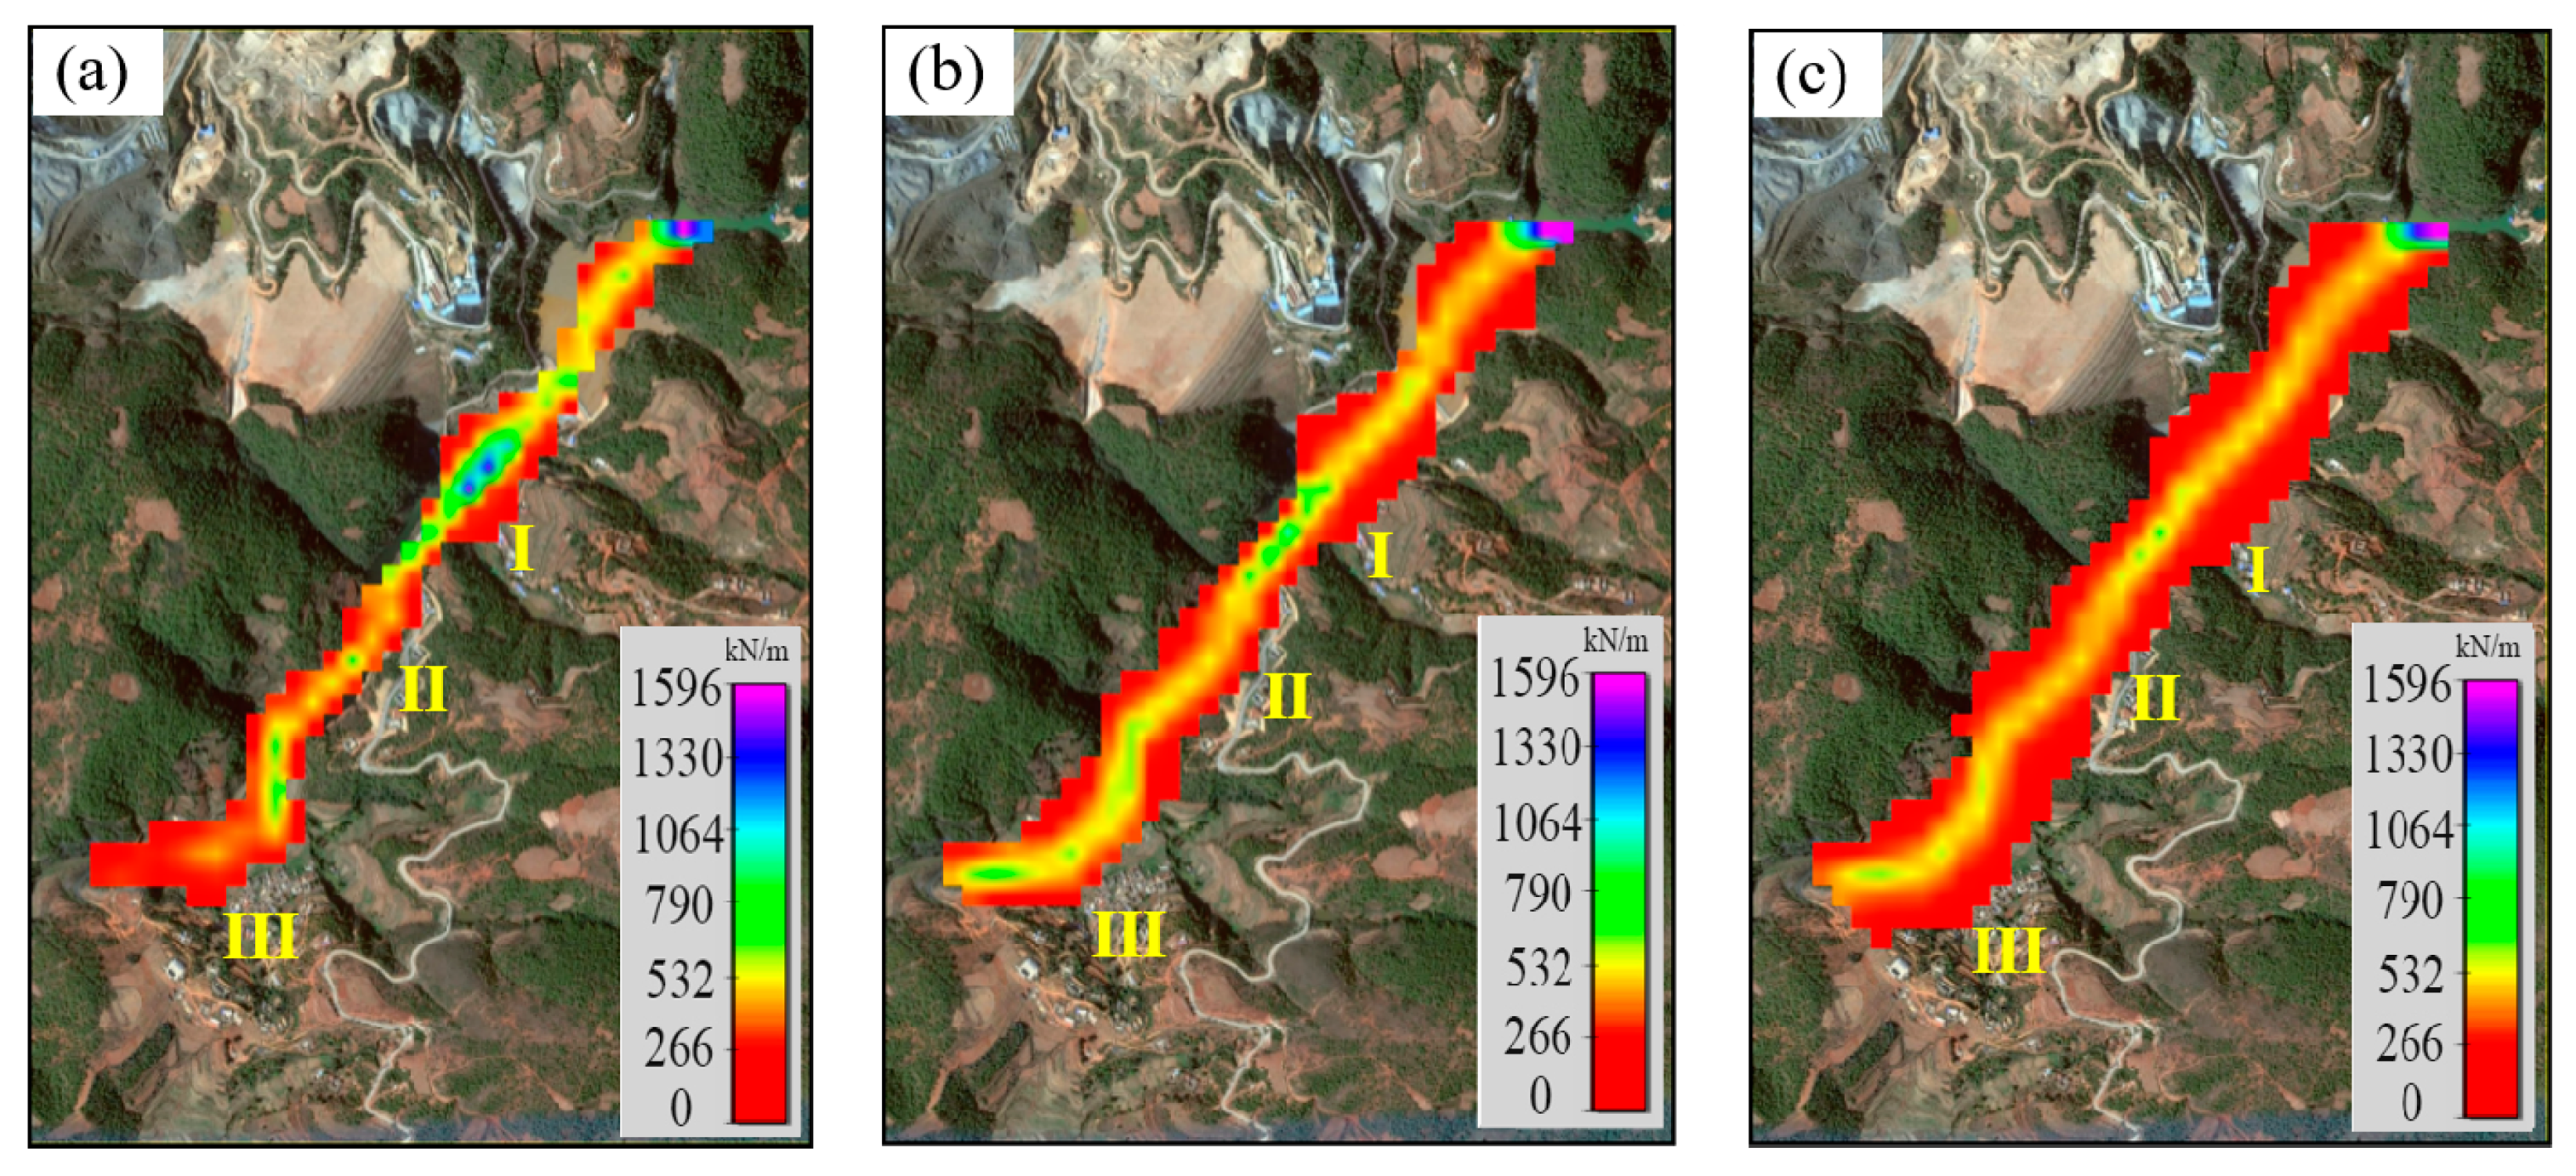
3.2.3. Impact Force of Leaked Tailings Flow
As shown in Figure 7 and Figure 10, the locations of maximum impact forces after dam failure are all at the valley near Village I, whose values are all 1000 kN/m. Moreover, marked enhancement of impact force is observed in the vicinities of debris blocking dams. After crossing these dams, the impact forces of tailings flow decrease due to the decline in flow rate and depth. The locations of maximum impact forces are all at the valley mouth near the upstream side of Village III, which are adjacent to the maximum downstream flow rate locations.
4. Conclusions
In this study, different conditions of downstream riverbed slopes and debris blocking dam construction are analyzed for the tailings pond. The evolution characteristics and deposition laws of leaked tailings flow after dam failure are studied through simulation. During the evolution process, the overtopping flows carry the tailing particles towards the downstream, among the drag forces on the tailing particles, the friction is greater than the resistance, the tailing particles therefore migrate downstream rapidly. When the friction of the drag forces is equal to its resistance, the flow rate of tailing particles reaches a maximum. With the decrease in water content in the discharged sediments, the uplift force is gradually reduced, the resistance is increased, and the flow rate of tailing particles is decreased. The tailing particles gradually deposit until the flow rate reaches the isolation rate, and they finally deposit completely.
The results demonstrate larger inundated area of tailings flow on the upstream and downstream sections than the midstream, where there are drastic terrain changes. With the elevation of downstream riverbed slope, the inundated area increases, while the maximum depth of tailings deposition decreases gradually. In addition, the deepest sedimentation point of tailings is developed downstream, and the deposition thickness also decreases accordingly. The maximum evolution velocity increases with the elevating terrain, and the maximum impact forces are all located adjacent to the locations of maximum evolution velocity or maximum flow depth.
Setting up debris blocking dams at different distances (characteristic locations) downstream of the initial dam leads to a decline in the maximum inundated range of leaked tailings flow with the shortening distance of these dams from the initial dam. After blockage by the dams, the energy storage-dissipation-deposition process needs to be repeated again. Both the flow rate and depth decrease after crossing the debris blocking dams, and the downstream inundated area is accordingly reduced. Thus, the downstream inundated area ultimately decreases with the shortening distance between initial and debris blocking dams.
Author Contributions
G.W. and S.T. designed the study, participated in data collection and analysis, carried out the statistical analyses, wrote the graph of the data and drafted the manuscript. Z.X. and X.K. participated in data collection, statistical analysis and drafted the manuscript. J.C. and B.H. participated in statistical analyses, and helped to interpret the data and draft the manuscript. All authors gave final approval for publication.
Funding
This research is supported by the Program for the National Key Research and Development Plan (2017YFC0804600), Open Research Fund of State Key Laboratory of Geomechanics and Geotechnical Engineering, Institute of Rock and Soil Mechanics, Chinese Academy of Sciences (Z018017), Changjiang Scholars and Innovative Research Team in University (IRT_17R112), National Natural Science Foundation of China (41602307; U1802243; 51904040), Open Issue with Key Laboratory of Mine Geological Hazards Mechanism and Control and Department of Natural Resources of Shaanxi Province (KF2018-09).
Acknowledgments
The authors would like to acknowledge the colleagues from the State Key Laboratory of Coal Mine Disaster Dynamics and Control for their perspectives and suggestions related to data collection and statistical analysis.
Conflicts of Interest
The authors declare no competing interests.
References
- Yin, G.; Li, G.; Wei, Z.; Wan, L.; Shui, G.; Jing, X. Stability analysis of a copper tailings dam via laboratory model tests: A Chinese case study. Miner. Eng. 2011, 24, 122–130. [Google Scholar] [CrossRef]
- Mura, J.C.; Gama, F.F.; Paradella, W.R.; Negrão, P.; Carneiro, S.; De Oliveira, C.G.; Brandão, W.S. Monitoring the Vulnerability of the Dam and Dikes in Germano Iron Mining Area after the Collapse of the Tailings Dam of Fundão (Mariana-MG, Brazil) Using DInSAR Techniques with TerraSAR-X Data. Remote Sens. 2018, 10, 1507. [Google Scholar] [CrossRef]
- Sun, E.; Zhang, X.; Li, Z. The internet of things (IOT) and cloud computing (CC) based tailings dam monitoring and pre-alarm system in mines. Saf. Sci. 2012, 50, 811–815. [Google Scholar] [CrossRef]
- Azam, S. Tailings dam failure: A review of the last one hundred years. Geotech. News 2010, 28, 50–53. [Google Scholar]
- Zhou, X.; Cheng, H. Stability analysis of three-dimensional seismic landslides using the rigorous limit equilibrium method. Eng. Geol. 2014, 174, 87–102. [Google Scholar] [CrossRef]
- Parbhakar-Fox, A.; Glen, J.; Raimondo, B. A Geometallurgical Approach to Tailings Management: An Example from the Savage River Fe-Ore Mine, Western Tasmania. Minerals 2018, 8, 454. [Google Scholar] [CrossRef]
- Wang, K.; Yang, P.; Hudson-Edwards, K.A.; Lyu, W.; Yang, C.; Jing, X. Integration of DSM and SPH to Model Tailings Dam Failure Run-Out Slurry Routing Across 3D Real Terrain. Water 2018, 10, 1087. [Google Scholar] [CrossRef]
- Jia, T.; Wang, R.; Fan, X.; Chai, B. A Comparative Study of Fungal Community Structure, Diversity and Richness between the Soil and the Phyllosphere of Native Grass Species in a Copper Tailings Dam in Shanxi Province, China. Appl. Sci. 2018, 8, 1297. [Google Scholar] [CrossRef]
- Wang, X.; Zhan, H.; Wang, J.; Li, P. The Stability of Tailings Dams under Dry-Wet Cycles: A Case Study in Luonan, China. Water 2018, 10, 1048. [Google Scholar] [CrossRef]
- Ismet, C. Guest editorial-Special issue on dynamic failures in underground mines. Int. J. Min. Sci. Technol. 2018, 28, 719–720. [Google Scholar] [CrossRef]
- Aly, A.; Keizo, U.; Yang, Q. Assessment of 3D Slope Stability Analysis Methods Based on 3D Simplified Janbu and Hovland Methods. Int. J. Geomech. 2012, 12, 81–89. [Google Scholar]
- Santamarina, C.J.; Torres-Cruz, L.A.; Bachus, R.C. Why coal ash and tailings dam disasters occur. Science 2019, 364, 526–528. [Google Scholar] [CrossRef] [PubMed]
- Wu, Z.; Mei, G. Statistical analysis of tailings pond accidents and cause analysis of dam failure. China Saf. Sci. J. 2014, 24, 70–76. (In Chinese) [Google Scholar]
- Wei, Z.; Yin, G.; Wang, J.; Wan, L.; Li, G. Design, construction and management of tailings storage facilities for surface disposal in China: case studies of failures. Waste Manage Res. 2013, 31, 106–112. [Google Scholar] [CrossRef] [PubMed]
- Rico, M.; Benito, G.; Díez-Herrero, A. Floods from tailings dam failures. J. Hazard. Mater. 2008, 154, 79–87. [Google Scholar] [CrossRef]
- Peng, K.; Zhou, J.; Zou, Q.; Zhang, J.; Wu, F. Effects of stress lower limit during cyclic loading and unloading on deformation characteristics of sandstones. Constr. Build. Mater. 2019, 217, 202–215. [Google Scholar] [CrossRef]
- Roussel, N.; Stefani, C.; Leroy, R. From mini-cone test to Abrams cone test: Measurement of cement-based materials yield stress using slump tests. Cem. Concr. Res. 2005, 35, 817–822. [Google Scholar] [CrossRef]
- Hu, J.; Liu, C.; Li, Q.; Shi, X. Molecular simulation of thermal energy storage of mixed CO2/IRMOF-1 nanoparticle nanofluid. Int. J. Heat Mass Tran. 2018, 125, 1345–1348. [Google Scholar] [CrossRef]
- Tian, S.; Chen, J. Multi-hierarchical fuzzy judgment and nested dominance relation of the rough set theory-based environmental risk evaluation for tailings reservoirs. J. Cent. South Univ. 2015, 22, 4797–4806. [Google Scholar] [CrossRef]
- Deng, D.; Li, L.; Wang, J.; Zhao, L. Limit equilibrium method for rock slope stability analysis by using the Generalized Hoek–Brown criterion. Int. J. Rock Mech. Min. 2016, 89, 176–184. [Google Scholar]
- Jing, X.; Chen, Y.; Xie, D.; Williams, D.J.; Wu, S.; Wang, W.; Yin, T. The Effect of Grain Size on the Hydrodynamics of Mudflow Surge from a Tailings Dam-Break. Appl. Sci. 2019, 9, 2474. [Google Scholar] [CrossRef]
- Zheng, B.; Zhang, D.; Liu, W.; Yang, Y.; Yang, H. Use of Basalt Fiber-Reinforced Tailings for Improving the Stability of Tailings Dam. Materials 2019, 12, 1306. [Google Scholar] [CrossRef] [PubMed]
- Dutto, P.; Stickle, M.M.; Pastor, M.; Manzanal, D.; Yague, A.; Moussavi Tayyebi, S.; Lin, C.; Elizalde, M.D. Modelling of fluidised geomaterials: The case of the Aberfan and the Gypsum tailings impoundment flowslides. Materials 2017, 10, 562. [Google Scholar] [CrossRef] [PubMed]
- Marsooli, R.; Wu, W. 3-D finite-volume model of dam-break flow over uneven beds based on VOF method. Adv. Water Resour. 2014, 70, 104–117. [Google Scholar] [CrossRef]
- Zhang, L.; Tian, S.; Peng, T. Molecular Simulations of Sputtering Preparation and Transformation of Surface Properties of Au/Cu Alloy Coatings Under Different Incident Energies. Metals 2019, 9, 259. [Google Scholar] [CrossRef]
- Federal Emergency Management Agency. Numerical Models Meeting Minimum Requirement of National Flood Insurance Program 2010. Available online: http://www.fema.gov (accessed on 10 January 2019).
- FLO-2D Software Inc. FLO-2D Users Manual; Version 2018, 06; FLO-2D Software Inc.: Nutrioso, AZ, USA, 2018. [Google Scholar]
- Hübl, J.; Steinwendtner, H. Two-dimensional simulation of two viscous debris flows in Austria. Phys. Chem. Earth 2001, 26, 639–644. [Google Scholar] [CrossRef]
- Du, X.; Sun, S.; Zhao, Z.; Qin, L. Research on Engineering Control Effect on Hongchun Gully Debris Based on FLO-2D Model. Earth Environ. 2016, 44, 376–381. (In Chinese) [Google Scholar]
- Pashias, N. A fifty cent rheometer for yield stress measurement. J. Rheol. 1996, 40, 1179. [Google Scholar] [CrossRef]
- Alhasan, Z.; Jandora, J.; Riha, J. Comparison of specific sediment transport rates obtained from empirical formulae and dam breaching experiments. Environ. Fluid Mech. 2016, 16, 1–23. [Google Scholar] [CrossRef]
- Gawu, S.K.; Fourie, A.B. Assessment of the modified slump test as a measure of the yield stress. Can. Geotech. J. 2004, 41, 39–47. [Google Scholar] [CrossRef]
- Hu, L.; Zhang, Z.; Li, Q.; Guo, X. Sequential dam break simulation and risk analysis of earth-rock dams of cascade reservoirs. J. Hydroelectr. Eng. 2018, 37, 65–73. [Google Scholar]
- Tian, S.; Chen, J.; Dong, L. Rock strength interval analysis using theory of testing blind data and interval estimation. J. Cent. South Univ. 2017, 24, 168–177. [Google Scholar] [CrossRef]
- Mizani, S. Rheology of Thickened Gold Tailings for Surface Deposition. Ph.D. Thesis, Carleton University, Ottawa, ON, Canada, 2010. [Google Scholar]
- Zhou, Y.; Li, Q.; Wang, Q. Energy Storage Analysis of UIO-66 and Water Mixed Nanofluids: An Experimental and Theoretical Study. Energies 2019, 12, 2521. [Google Scholar] [CrossRef]
- Zhang, P.; Ma, J.; Shu, H.; Wang, G. Numerical simulation of erosion and deposition debris flow based on FLO-2D model. J. Lanzhou Univ. Nat. Sci. 2014, 50, 363–368. (In Chinese) [Google Scholar]
- Okuda, S.; Okunishi, K.; Suwa, H. Observation of Debris Flow at Kamikamihori Valley of Mt. Yakedake. In Proceedings of the 3rd Meeting of IGU Commission on Field Experiment in Geomorphology, Kyoto, Japan, 24–30 August 1980; pp. 116–139. [Google Scholar]
- Li, J.; Luo, D. The Formation and Characteristics of Mudflow and Flood in the Mountain Area of the Dachao River and Its Prevention. Z. Geomorphol. N.F. 1981, 25, 470–484. [Google Scholar]
- Nam, D.H.; Kim, M.I.; Kang, D.H.; Kim, B.S. Debris Flow Damage Assessment by Considering Debris Flow Direction and Direction Angle of Structure in South Korea. Water 2019, 11, 328. [Google Scholar] [CrossRef] [Green Version]
Figure 1.
The flow hydrograph for FLO-2D model.

Figure 2.
The 3D computation models for dam failure. (a) Original terrain slope; (b) elevation by 5%; (c) elevation by 10%.
Figure 2.
The 3D computation models for dam failure. (a) Original terrain slope; (b) elevation by 5%; (c) elevation by 10%.

Figure 3.
The maximum influence scope of leaked tailings flow under different slope conditions. (a) Original terrain slope; (b) elevation by 5%; (c) elevation by 10%.
Figure 3.
The maximum influence scope of leaked tailings flow under different slope conditions. (a) Original terrain slope; (b) elevation by 5%; (c) elevation by 10%.

Figure 4.
The maximum impact height of leaked tailings flow along the valley bottom.

Figure 5.
The maximum velocity distribution of leaked tailings flow under different slope conditions. (a) Original terrain slope; (b) elevation by 5%; (c) elevation by 10%.
Figure 5.
The maximum velocity distribution of leaked tailings flow under different slope conditions. (a) Original terrain slope; (b) elevation by 5%; (c) elevation by 10%.

Figure 6.
The maximum impact force of leaked tailings flow downstream under different slope conditions. (a) Original terrain slope; (b) elevation by 5%; (c) elevation by 10%.
Figure 6.
The maximum impact force of leaked tailings flow downstream under different slope conditions. (a) Original terrain slope; (b) elevation by 5%; (c) elevation by 10%.

Figure 7.
The maximum influence scope of leaked tailings flow with debris blocking dams at different distances. (a) 1000 m away from initial dam; (b) 600 m away from initial dam; (c) 400 m away from initial dam.
Figure 7.
The maximum influence scope of leaked tailings flow with debris blocking dams at different distances. (a) 1000 m away from initial dam; (b) 600 m away from initial dam; (c) 400 m away from initial dam.

Figure 8.
Schematic diagram of the maximum impact height along the valley bottom.

Figure 9.
The maximum flow velocity distribution of leaked tailings flow with debris blocking dams at different distances. (a) 1000 m away from initial dam; (b) 600 m away from initial dam; (c) 400 m away from initial dam.
Figure 9.
The maximum flow velocity distribution of leaked tailings flow with debris blocking dams at different distances. (a) 1000 m away from initial dam; (b) 600 m away from initial dam; (c) 400 m away from initial dam.

Figure 10.
The maximum impact force of leaked tailings flow downstream with debris blocking dams at different distances. (a) 1000 m away from initial dam; (b) 600 m away from initial dam; (c) 400 m away from initial dam.
Figure 10.
The maximum impact force of leaked tailings flow downstream with debris blocking dams at different distances. (a) 1000 m away from initial dam; (b) 600 m away from initial dam; (c) 400 m away from initial dam.


Table 1.
The FLO-2D simulation parameters.
| Simulation Parameters | Values | |
|---|---|---|
| Fluid relative density (g/cm3) | 1.8 | |
| Retardation coefficient of laminar flow | 2285 | |
| Manning coefficient in passage zone | 0.05 | |
| Parameters of yield stress coefficients | 0.128 | |
| 12 | ||
| Parameters of viscous force coefficients | 0.0473 | |
| 21 | ||
© 2019 by the authors. Licensee MDPI, Basel, Switzerland. This article is an open access article distributed under the terms and conditions of the Creative Commons Attribution (CC BY) license (http://creativecommons.org/licenses/by/4.0/).
Share and Cite
MDPI and ACS Style
Wang, G.; Tian, S.; Hu, B.; Xu, Z.; Chen, J.; Kong, X. Evolution Pattern of Tailings Flow from Dam Failure and the Buffering Effect of Debris Blocking Dams. Water 2019, 11, 2388. https://doi.org/10.3390/w11112388
AMA Style
Wang G, Tian S, Hu B, Xu Z, Chen J, Kong X. Evolution Pattern of Tailings Flow from Dam Failure and the Buffering Effect of Debris Blocking Dams. Water. 2019; 11(11):2388. https://doi.org/10.3390/w11112388
Chicago/Turabian StyleWang, Guangjin, Sen Tian, Bin Hu, Zhifa Xu, Jie Chen, and Xiangyun Kong. 2019. "Evolution Pattern of Tailings Flow from Dam Failure and the Buffering Effect of Debris Blocking Dams" Water 11, no. 11: 2388. https://doi.org/10.3390/w11112388
Note that from the first issue of 2016, this journal uses article numbers instead of page numbers. See further details here.