Climate Change Impact Assessment on Freshwater Inflow into the Small Aral Sea


1
Institute for Environmental Sciences and Geography, University of Potsdam, 14476 Potsdam, Germany
2
State Hydrological Institute, 199004 Saint Petersburg, Russia
3
Water Problems Institute of Russian Academy of Sciences, 119333 Moscow, Russia
4
Shirshov Institute of Oceanology, Russian Academy of Sciences, 117997 Moscow, Russia
*
Author to whom correspondence should be addressed.
Water 2019, 11(11), 2377; https://doi.org/10.3390/w11112377
Submission received: 19 September 2019
/
Revised: 7 November 2019
/
Accepted: 8 November 2019
/
Published: 13 November 2019
(This article belongs to the Special Issue Evaluating Hydrological Responses to Climate Change)
Abstract
:During the last few decades, the rapid separation of the Small Aral Sea from the isolated basin has changed its hydrological and ecological conditions tremendously. In the present study, we developed and validated the hybrid model for the Syr Darya River basin based on a combination of state-of-the-art hydrological and machine learning models. Climate change impact on freshwater inflow into the Small Aral Sea for the projection period 2007–2099 has been quantified based on the developed hybrid model and bias corrected and downscaled meteorological projections simulated by four General Circulation Models (GCM) for each of three Representative Concentration Pathway scenarios (RCP). The developed hybrid model reliably simulates freshwater inflow for the historical period with a Nash–Sutcliffe efficiency of 0.72 and a Kling–Gupta efficiency of 0.77. Results of the climate change impact assessment showed that the freshwater inflow projections produced by different GCMs are misleading by providing contradictory results for the projection period. However, we identified that the relative runoff changes are expected to be more pronounced in the case of more aggressive RCP scenarios. The simulated projections of freshwater inflow provide a basis for further assessment of climate change impacts on hydrological and ecological conditions of the Small Aral Sea in the 21st Century.
1. Introduction
During the last few decades, the Aral Sea basin has attracted the particular attention of the scientific community as a clear example of human induced ecological disasters [1,2]. Not only the rapid drying of the Aral Sea, but also considerable changes of the physical and biological characteristics of its residual basins [3,4] have converted the Aral Sea basin into a natural laboratory where irreversible ecosystem and water balance shifts have been detected [5,6]. Therefore, keeping the hand of the scientific community on the pulse of current and projected changes in the Aral Sea basin remains crucial to mitigating possible environmental risks in this region [7].
The separation of the northern part of the former Aral Sea from the isolated basin, the Small Aral Sea, was triggered by drying processes in the late 1980s and has been intensified by Kokaral Dike’s construction in 2005. Kokaral Dike aims to limit water exchange between the Small Aral Sea and other residual basins. Therefore, its main purpose is to accumulate runoff from the Syr Darya River, which is the primary source of the freshwater inflow into the sea. As a result, during the period from 2005 to 2017, the volume of the Small Aral Sea has raised to 27.5 km, and the salinity has decreased to 8–11 g/kg on average [8]. This confirms the partial success of the Small Aral Sea restoration project; but also deteriorates the situation of other residual basins, which lost the natural connection with the additional freshwater source coming from the Syr Darya River [3]. Therefore, the reliable assessment of the Syr Darya River runoff as the closest approximation of the total freshwater inflow into the Small Aral Sea plays a crucial role in understanding current and projected changes in the Aral Sea basin hydrology.
The Syr Darya River is among the largest and highly vulnerable river basins in Central Asia. Advanced water management and irrigation systems, as well as thirteen large reservoirs control the utilization of freshwater resources for agricultural, industrial, recreational, and social needs. This complex structure of the Syr Darya River basin coupled with observational data scarcity develops a challenge for any approach aimed at the accurate assessment of the Small Aral Sea freshwater budget formation [5,9,10,11]. Therefore, the majority of studies assessing the climate change impact on the hydrological regime focus on individual regions or river basins within the Syr Darya River basin, e.g., the mountainous zone and Ferghana Valley [12,13,14,15,16,17]. To our knowledge, only a few modeling studies have considered the entire basin of the Syr Darya River to quantify the effects of climate change on runoff. Aus der Beek et al. [9] within their study analyzed global change impacts on the Syr Darya River runoff for the period 1958–2002. Lutz et al. [10] within their report described the impact of climate change on runoff generation based on five Global Circulation Model (GCM) projections for the period 2021–2030 and 2041–2050. A simplified approach for assessing annual freshwater inflow based on hypothetical and general circulation model-based scenarios of future climate temperature and precipitation has been applied by Shibuo et al. [18] and Jarsjö et al. [19] using the Porflow model without any parameter calibration. Thus, the literature review underlines the lack of studies devoted to climate change impact assessment on freshwater inflow into the Small Aral Sea.
The objective of this study is to assess the current and projected changes in freshwater inflow into the Small Aral Sea. For this purpose, we developed and extensively validated the hybrid model for the entire basin of the Syr Darya River based on a combination of state-of-the-art conceptual hydrological and machine learning models. Then, projected changes in the runoff to the Small Aral Sea for the period 2007–2099 were quantified based on the developed hybrid model and meteorological projections simulated by four GCMs for each of three Representative Concentration Pathway (RCP) scenarios (RCP2.6, RCP6.0, and RCP8.5). The present study tries to answer the following pertinent research questions:
- How well does the state-of-the-art machine learning model simulate freshwater inflow into the Small Aral Sea?
- What are the main drivers that affect freshwater inflow simulation?
- How well do different runoff projections represent the historical period (2007–2016)? What are the most reliable runoff projections for climate change impact assessment (2017–2099)?
- To what extent will the intra-annual regime of freshwater inflow transform due to projected climate change?
- What are the projected changes in climatic annual freshwater inflow?
- To what extent will the key driver of freshwater inflow formation transform due to projected climate change?
2. Study Area
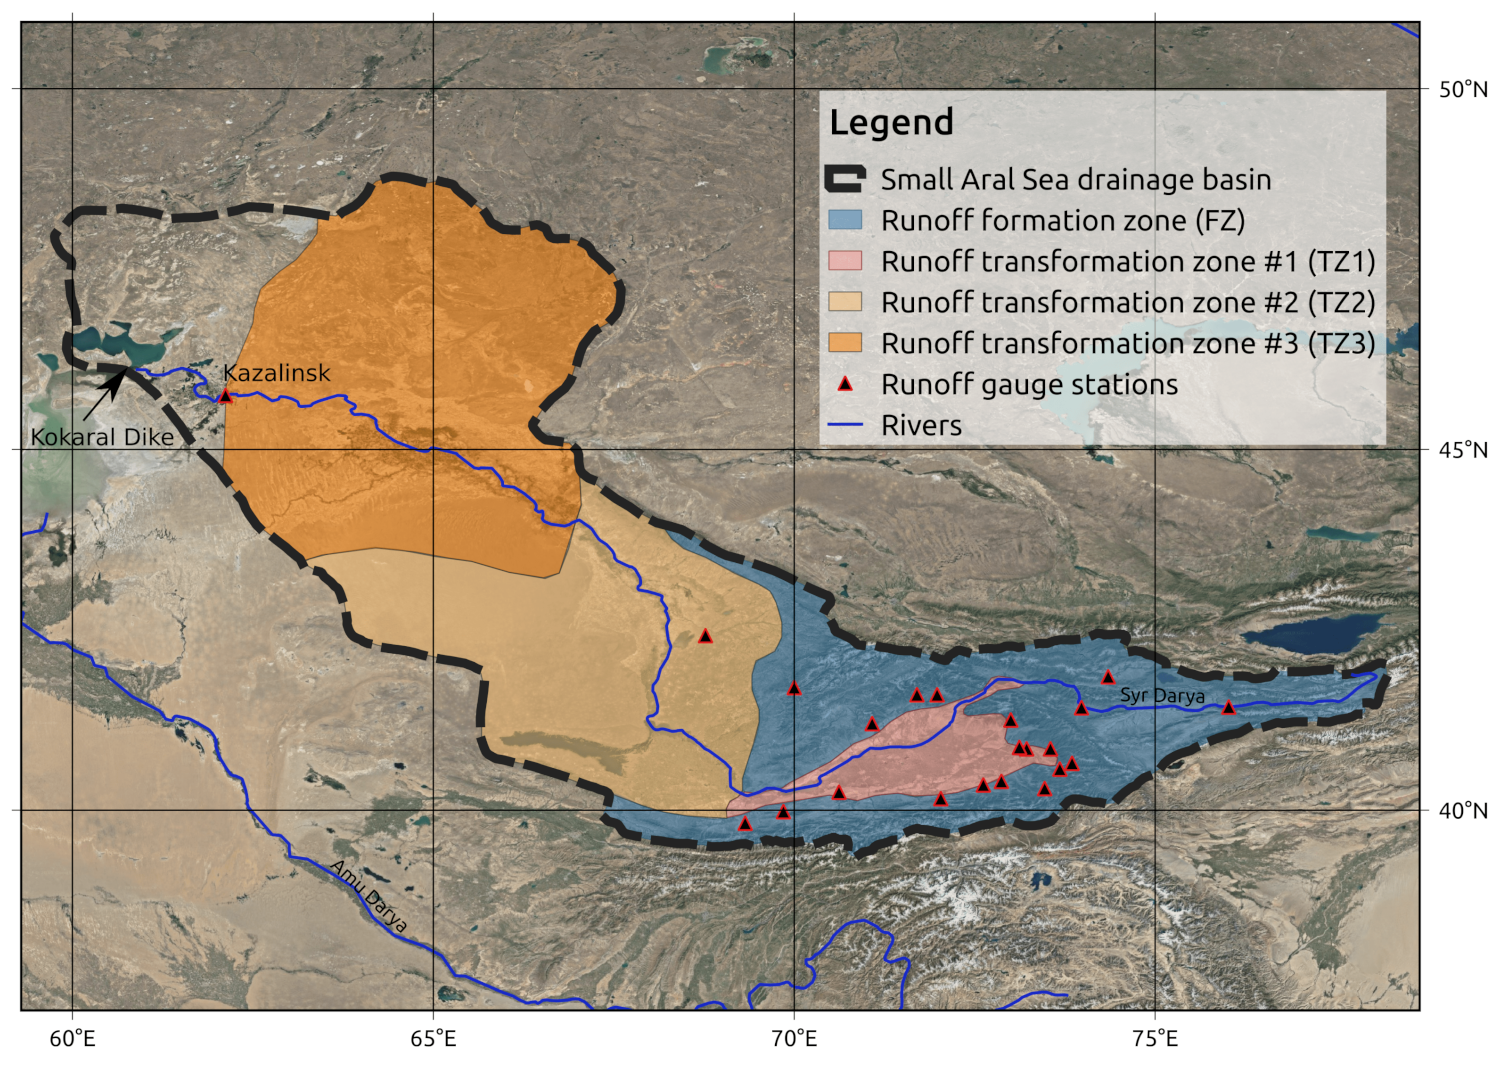
The main part of the Small Aral Sea basin (Figure 1) is occupied by the Syr Darya River and its tributaries. Based on different estimates, the Syr Darya River at Kazalinsk contributes from 7.4 km [10] to 30 km [18], or around 40 km [16] of freshwater inflow into the Small Aral Sea annually. About 70% of the annual runoff of the Syr Darya River originates in Kyrgyzstan’s mountain ranges, and the main contribution of this volume corresponds to the Ferghana Valley river basins [16]; about 80% of this volume occurs between March and September [20].
3. Materials and Methods
3.1. Modeling Chain Overview
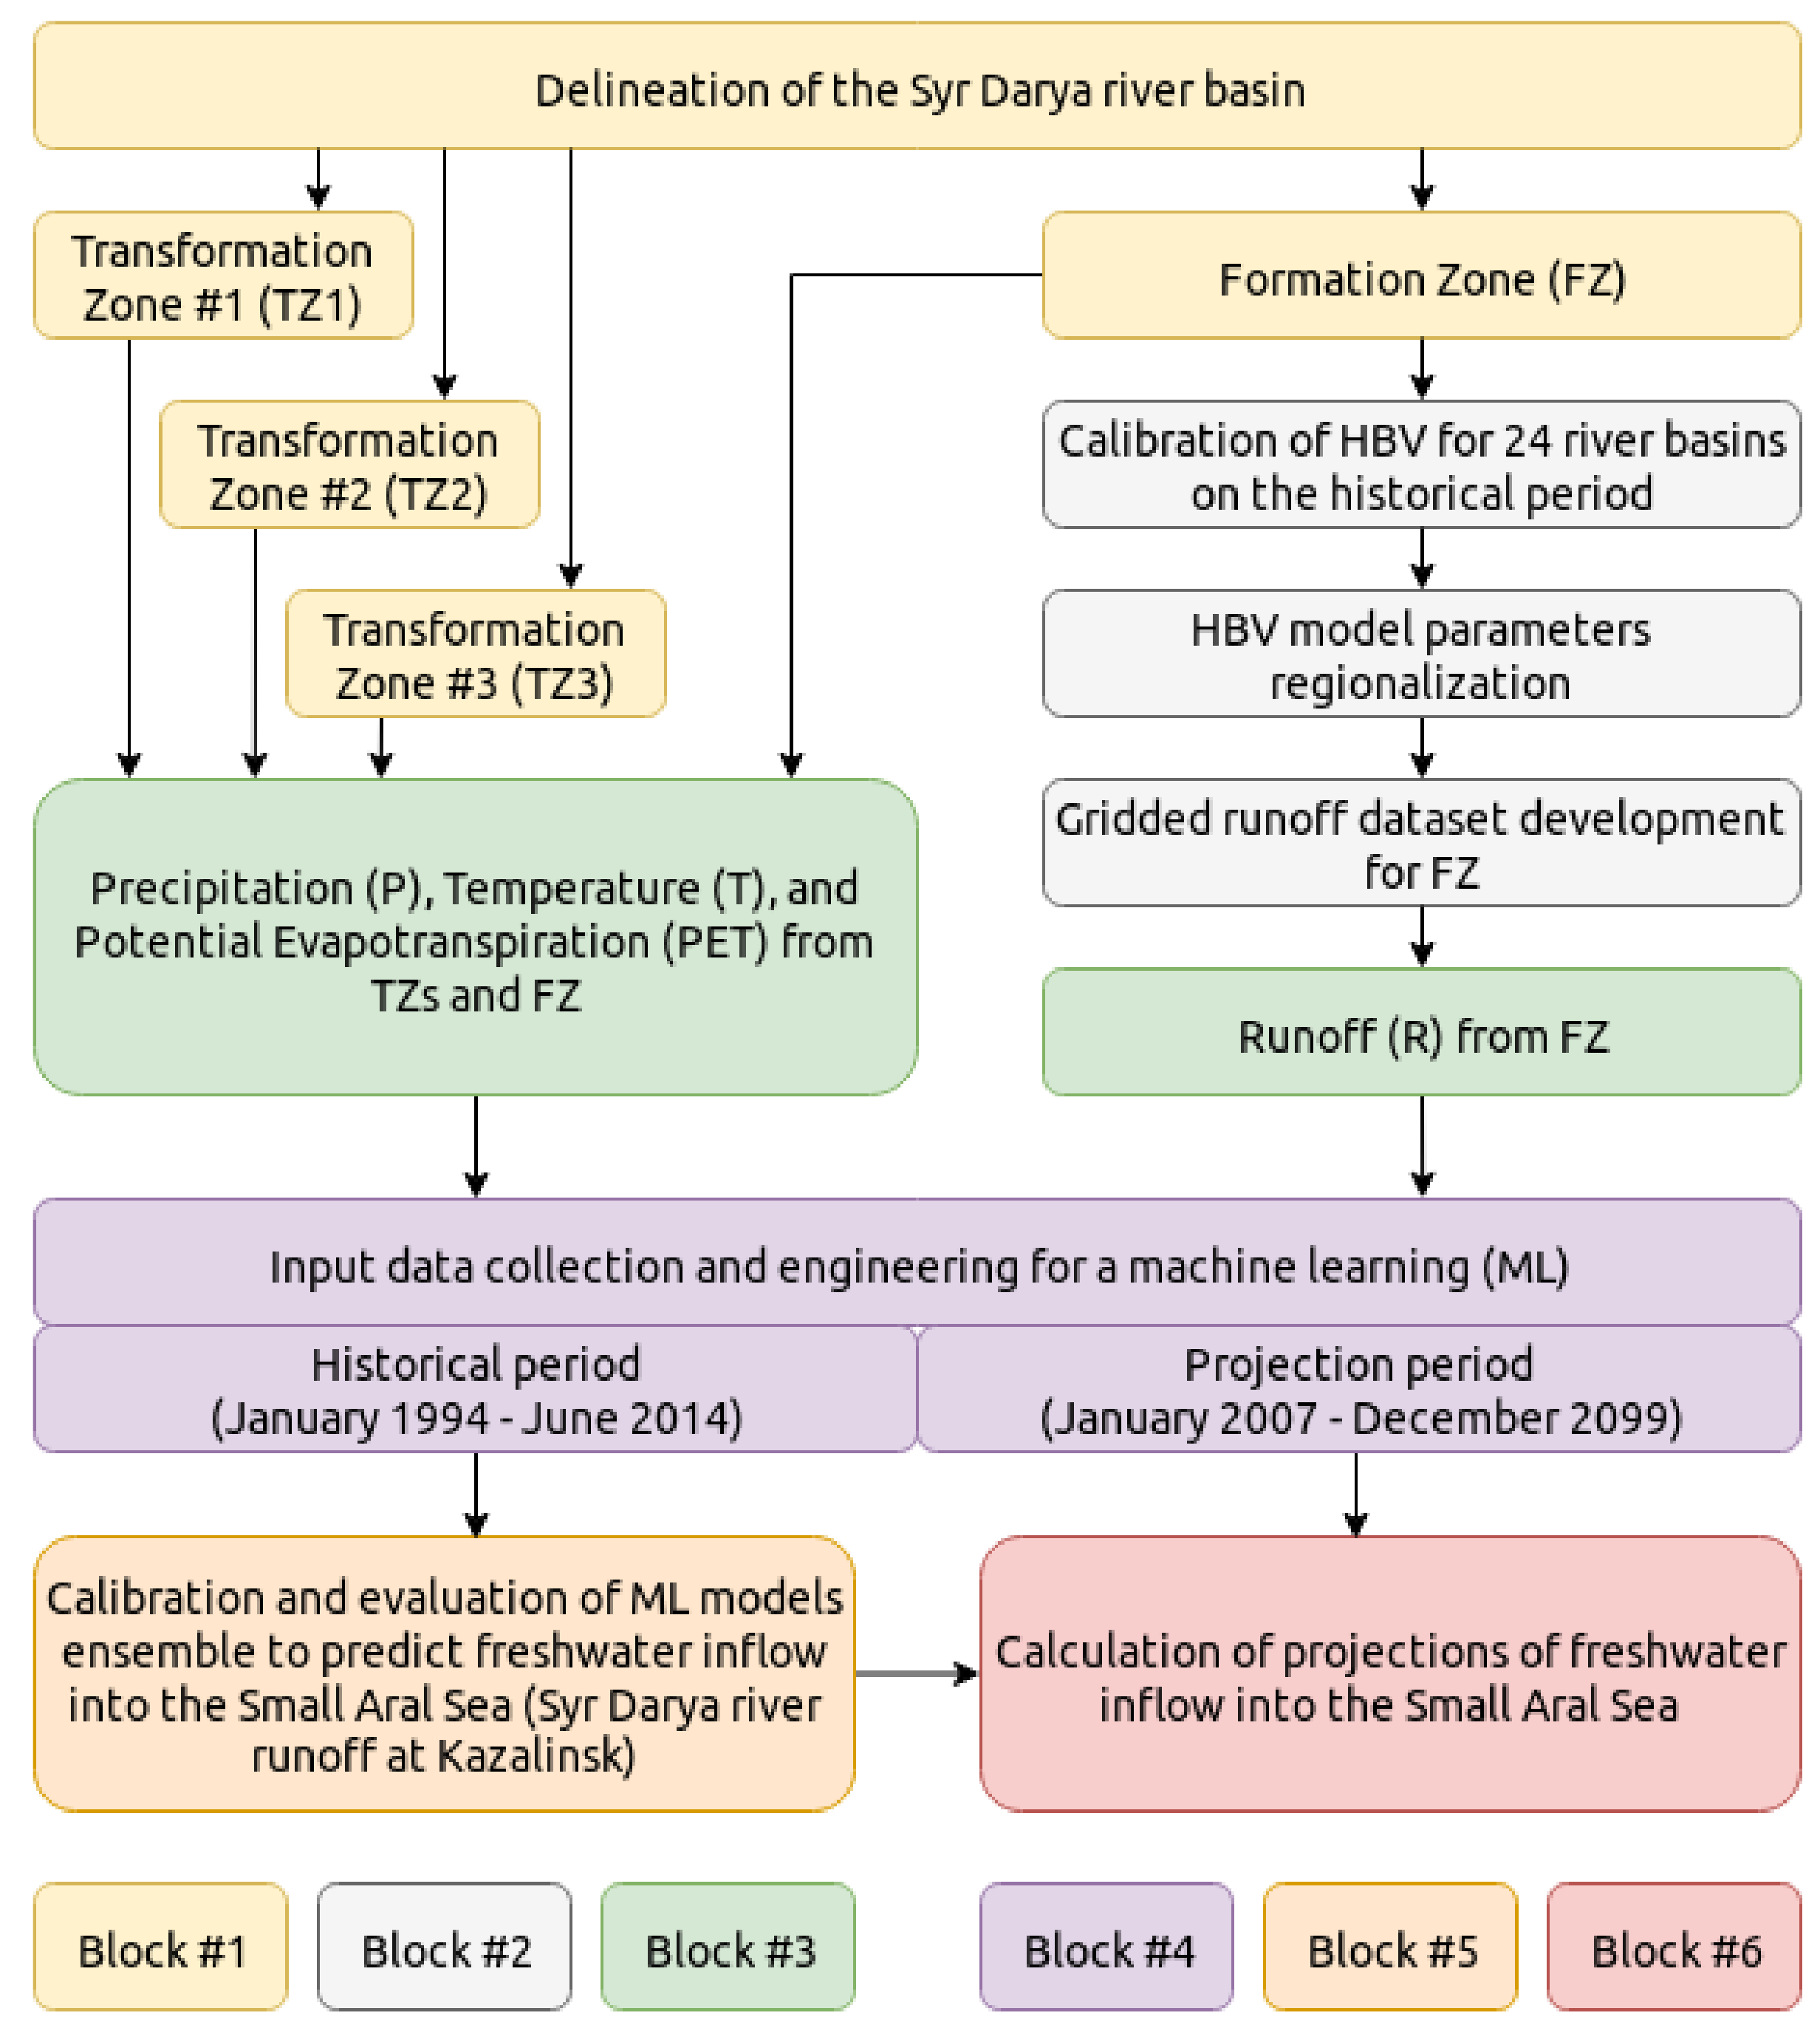
To develop the hydrological model for the entire basin of the Syr Darya River, in the present study, we elaborated the modeling chain, which consists of six interconnected blocks (Figure 2).
First, we delineated the Syr Darya River basin into four zones (Figure 1): the single Zone of runoff Formation (FZ) and three Zones of runoff Transformation (TZ1, TZ2, TZ3). The rationale behind the Syr Darya River basin delineation is to represent individual parts of the basin that significantly differ by hydrological conditions, water management, and irrigation use. We followed the same delineation scheme, which was proposed in our previous study [21]. FZ delineation strategy follows [10,15] and maps the upstream area of Syr Darya River and its tributaries where most of the freshwater coming to the Syr Darya River basin forms. TZ1 delineation maps mainly the Ferghana Valley, while the proposed delineation strategy of the remaining part into two individual zones of runoff transformation (TZ2 and TZ3) is highly subjective. TZ2 was delineated as the Syr Darya River subbasin between the Karaozek (downstream) and Bekabad (upstream) runoff gauges, and TZ3 maps the remaining part between the Karaozek (upstream) and Kazalinsk (downstream, outlet) runoff gauges. In summary, FZ serves as the main source of the freshwater coming to the Small Aral Sea; TZ1 represents the zone of the most intensive water use in the basin, and TZ2 and TZ3 act as additional (mainly) water loss regulators. As was shown in our previous study [21], the proposed delineation strategy helps to represent the Syr Darya River basin as a complex system that consists of many parts, the accounting of which makes the representation of basin functioning more diverse. This high diversity in basin representation then helps us to produce the diverse input data for machine learning models, which is crucial for their efficient application.
In the second block, we developed a gridded runoff dataset for FZ both for historical and projection periods based on the results of the HBV (Hydrologiska Byråns Vattenbalansavdelning model) hydrological model calibration and its parameters’ regionalization (Section 3.3). The rationale for this was to develop the homogeneous source of runoff data that covers the entire FZ with both gauged and ungauged areas.
Then, we extracted runoff from the FZ alongside precipitation and temperature time series from FZ and three TZs in the third block. In the fourth block, the extracted time series were used to prepare input data for a machine learning model both for historical and projection periods (Section 3.4). Then, in the fifth block, we extensively calibrated and validated the efficiency of machine learning models to simulate freshwater inflow into the Small Aral Sea for the historical period. In the last (sixth) block of the proposed workflow, we simulated the projections of freshwater inflow using the developed machine learning model.
3.2. Runoff and Meteorological Forcing Data
Observed monthly runoff data for selected basins were provided by the Global Runoff Data Centre (GRDC). Runoff data availability was the main limit for the developing and validation of our methodology because of the majority of available observations provided by GRDC lie in the interval from 1975 to 1985. Observed monthly runoff data (daily data averaged by months) for the Syr Darya River at Kazalinsk, which serves as a proxy for freshwater inflow estimation, were provided by Yasavi International Kazakh-Turkish University (2018, personal communication) for the period from January 1993 to June 2014. Unfortunately, these data have not been published anywhere before and could be a matter of questionable quality. However, to our knowledge, the runoff measurement methodology at Kazalinsk gauge station has not been changed for the last few decades (i.e., the measured water level is transformed into runoff using an established rating curve), which provides us some level of confidence in observational data.
For modern studies related to contemporary water resources’ assessment on vast territories, it is essential to use global gridded data products as the only spatial and temporal continuous source [21,22]. For this reason, all models for the historical period were driven by precipitation and temperature data from the EWEMBI (EartH2Observe, WFDEI and ERA-Interim data Merged and Bias-corrected for ISIMIP) reanalysis [23,24]. EWEMBI reanalysis has global coverage for the period 1979–2016 with daily temporal resolution and 0.5 spatial resolution. Model simulations for the projection period were driven by climate simulation data taken from the fifth phase of the Coupled Model Intercomparison Project (CMIP5; [25]). In our study, we used data produced by four GCMs (GFDL-ESM2M, HadGEM2-ES, IPSL-CM5A-LR, MIROC5) for each of three RCP scenarios (RCP2.6, RCP6.0, and RCP8.5). The same dataset was also used in the ISIMIP2b (Inter-Sectoral Impact Model Intercomparison Project, stage 2b) project [26]. This dataset was bias corrected and statistically downscaled with EWEMBI as a reference dataset [27] and will be further referred to as EWEMBI RCP. The coverage, spatial, and temporal resolution of EWEMBI RCP were the same as EWEMBI, but it covered the period from 2006 to 2099.
Potential evapotranspiration was another required forcing variable for all models, and it was derived based on the temperature based equation proposed by Oudin et al. [28] for both historical and projection periods based on EWEMBI and EWEMBI RCP data, respectively.
3.3. Runoff Reanalysis Development
To develop gridded runoff reanalysis data for FZ of the Syr Darya River basin (Figure 1), we adopted the same two-step methodology as was presented in Ayzel and Izhitskiy [21], but using the EWEMBI dataset as the forcing data for the historical period. For the first step, we calibrated the parameters of the HBV hydrological model (Hydrologiska Byråns Vattenbalansavdelning, in [29]) against the entire period of runoff observations [30] for each of the 24 available river basins. In the present study, we used the version of the HBV hydrological model with 14 parameters, as was proposed in Beck et al. [31]. The calibration range for each parameter was also set according to the study by Beck et al. [31]. The calibration was performed in an automated manner using the algorithm of differential evolution [32] and the Nash–Sutcliffe Efficiency (NSE; Section 3.5), as an objective function algorithm tries to maximize. As a result, for each basin, we had an optimal set of model parameters.
Second, to transfer the optimal set of HBV model parameters to (meteorological forcing) grid cells’ centroids, we implemented a common regionalization technique based on spatial proximity [33]. For each corresponding EWEMBI grid cell in FZ, we transferred the entire set of optimal model parameters (except the single one related to runoff routing) from the nearest (by distance) basin, which also showed positive NSE for a calibration period [21]. Then, we ran the HBV model forced by both EWEMBI and EWEMBI RCP datasets in a grid cell-wise mode. That allowed us to simulate runoff in every grid cell in FZ. As a result, we developed gridded runoff reanalysis for the FZ of the Syr Darya River basin. The developed reanalysis had daily temporal and 0.5 spatial resolution and covered the periods 1979–2016 and 2006–2099, which were consistent with EWEMBI and EWEMBI RCP, respectively.
3.4. Machine Learning
The main difficulty in the assessment of the freshwater inflow into the Small Aral Sea was to account for its transformation through advanced water management and irrigation systems. Therefore, our hypothesis was that an appropriate machine learning model could reproduce runoff transformation complexity within the Syr Darya River basin developing robust input-output mapping. To confirm this hypothesis successfully, we needed two critical components: (1) appropriate input data, (2) a machine learning model with a high generalization capacity to map input data to the output (which was freshwater inflow into the Small Aral Sea).
Feature engineering is an essential part of any routine machine learning model development, which aims to prepare appropriate (for a particular problem) input data [21]. In the present study, we used two classical implementations of feature engineering techniques to enrich the representativeness of input data: (1) adding features that were shifted in time (e.g., temperature for the last month; as in [34]); (2) adding the features that aggregate the temporal information by a moving window (e.g., moving average of the temperature for the last two months). To develop appropriate input data, we first collected non-transformed monthly time series of runoff from FZ and precipitation and temperature from FZ and three TZs. Then, we independently shifted each time series from 1 to 12 months back and independently calculated the moving window time series with window sizes from 2 to 12 also for each of the non-transformed time series. Therefore, we imply that monthly freshwater inflow into the Small Aral Sea was estimated based on the runoff from TZ and precipitation, temperature, and potential evapotranspiration from FZ and three TZs’ evolution of the preceding year. The resulting dimension of input data for the historical period was , where 246 is the length of the monthly time series from January 1994 to June 2014 and 312 is the total number of input features (thirteen non-transformed and 299 transformed ()). For the projection period, the same procedure was independently implemented for each GCM and RCP scenario data in the EWEMBI RCP dataset, resulting in the dimensions of , where 1116 is the length of monthly time series from January 2007 to December 2099.
In the present study, we used the eXtreme Gradient Boosting machine on decision trees (XGB; [35]) as a machine learning model for freshwater inflow prediction. XGB is a robust and high performance machine learning technique usually showing a better prediction performance in comparison with conventional linear models [21,36]. The core idea behind the XGB model is to combine simple decision tree models [37] with gradient boosting [38] in a way that the next decision tree is trying to minimize an error of the previous decision tree. This approach became the “Swiss-knife” for modeling complex relationships in multidimensional nonparametric data because of its parsimony, high robustness to overfitting, and computational efficiency without presuming any a priori knowledge of the system behavior we tried to model [39]. To determine which input data features contributed to the XGB’s ability to predict freshwater inflow into the Small Aral Sea, we ranked input data features according to their corresponding feature importance for prediction. Feature importance calculation was based both on the number of times a particular variable was selected for splitting during base learners’ construction and the measure of corresponding splits’ homogeneity (Gini index or mean decrease in impurity; [35]). Namely, the importance of a single feature was estimated for a single decision tree by progressively calculating the improvement in the Gini index (i.e., reduction in node purity) achieved by using the particular feature to perform the corresponding split, weighted by the number of observations in the corresponding node. Then, the calculated feature importance was averaged across all of the decision trees used in the XGB model.
To obtain predictions in an ensemble manner and extensively validate the model setting, we used a Leave-One-Out cross-validation technique (LOO; [40]). The idea behind LOO is to validate independently the performance of the machine learning model on every observational point. This way, LOO involves using a single observation as the validation set and the remaining observations as the training set. As a side result, we obtained 246 calibrated XGB models (according to the number of runoff observations we used). That allowed us to simulate the projections of freshwater inflow into the Small Aral Sea in an ensemble manner: first, we independently simulated 246 realizations of freshwater inflow using a particular combination of the GCM and RCP scenario and then calculated the ensemble mean.
3.5. Metrics
In the present study, we used two community-approved metrics for the efficiency assessment of runoff simulations: Nash–Sutcliffe Efficiency (NSE; Equation (1); [41]) and Kling–Gupta Efficiency (KGE; Equation (2); [42]). Both metrics are optimal with a value of one; higher values show better efficiency of runoff simulations.
where , , , and are the period of evaluation, simulated, observed, and mean observed runoff; r, , , , and are the linear correlation between observations and simulations, standard deviation in observations, standard deviation in simulations, simulation mean, and observation mean.
4. Results and Discussion
4.1. Simulation of Freshwater Inflow into the Small Aral Sea for the Historical Period
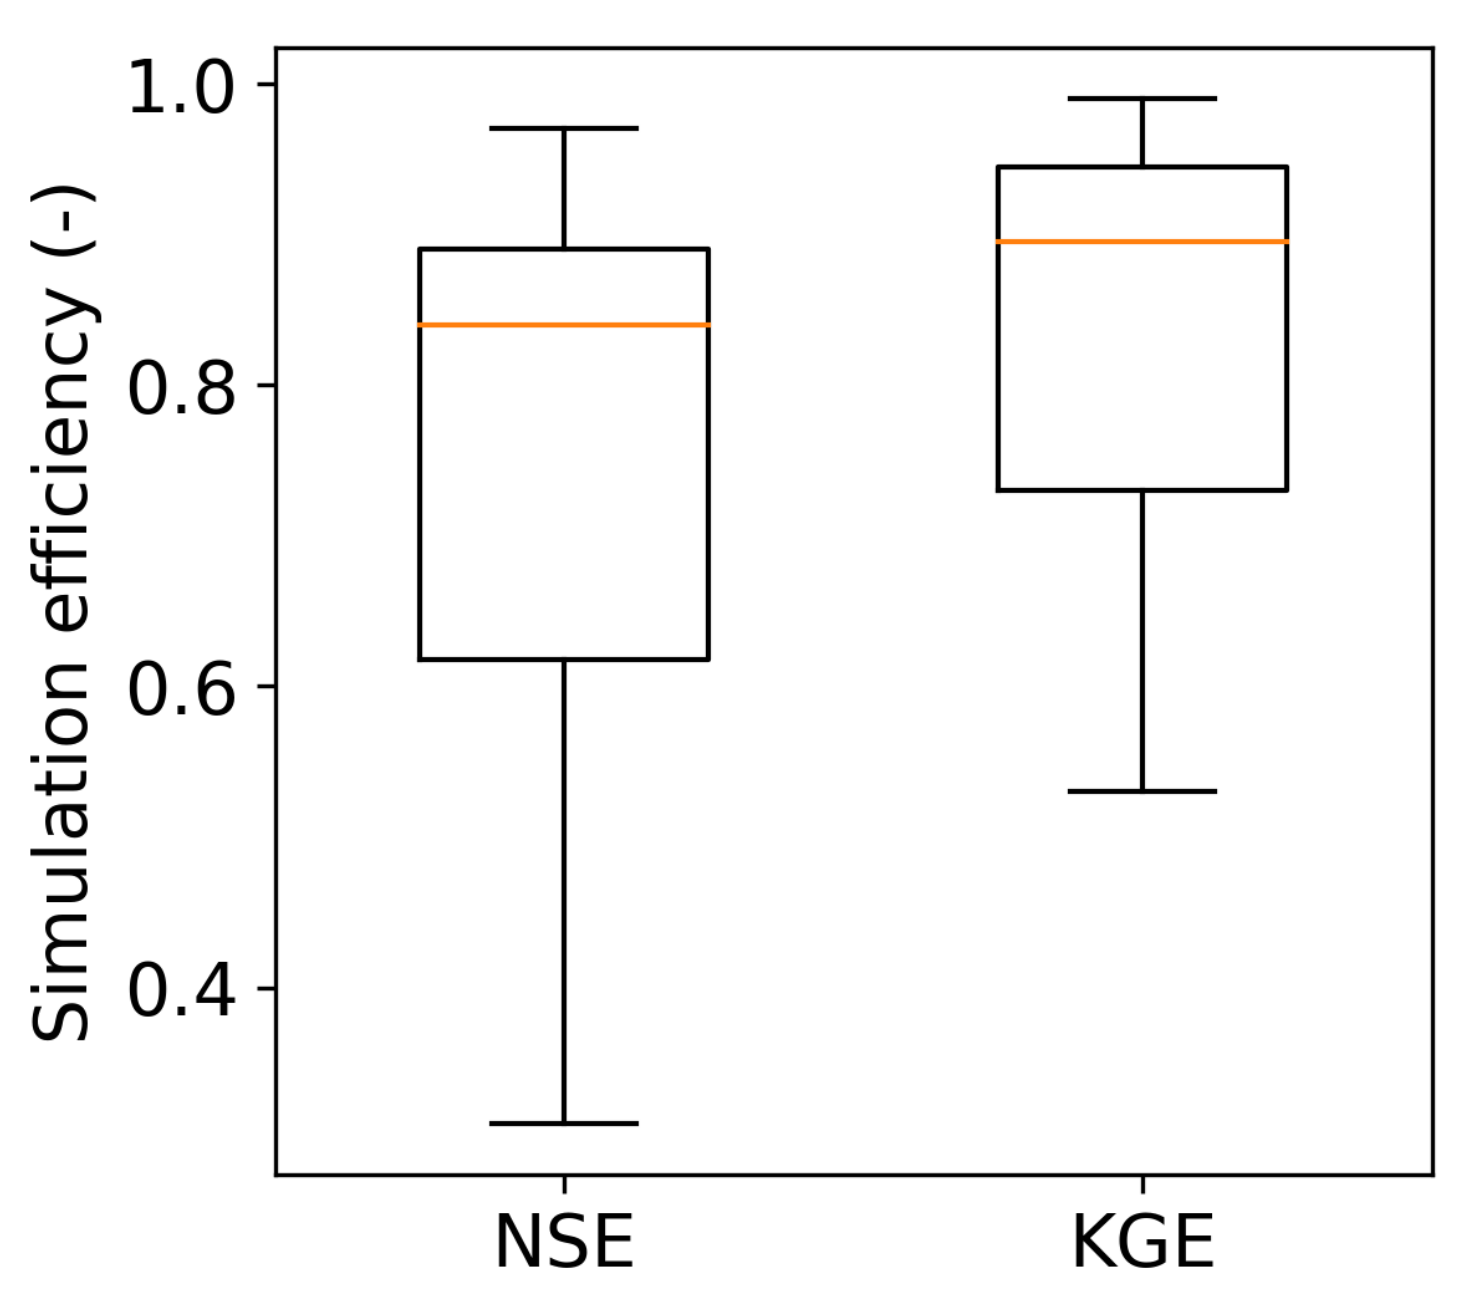
We began our study having GRDC’s observational runoff data with a monthly temporal resolution for 24 basins located in the runoff Formation Zone (FZ) of the Syr Darya River basin. However, the results of the HBV model calibration for two of 24 basins showed negative NSE values. Thus, these basins were not considered for further performance evaluation, nor the development of the gridded runoff dataset for FZ. Figure 3 shows the results of HBV model calibration for 22 basins located in the runoff Formation Zone (FZ) of the Syr Darya River basin. The mean NSE and KGE were 0.75 and 0.84, respectively. Inter-comparison of calibration results with different studies showed high consistency among different approaches for runoff modeling in the mountainous part of the Syr Darya River [15,16,17,20]. Moreover, there was a distinct improvement in the HBV model calibration results compared to the results we obtained in our previous study, where the mean NSE was about 0.58 [21]. This improvement goes mainly to the considerable improvement of precipitation estimation in EWEMBI reanalysis over ERA-40 reanalysis, which we used previously.
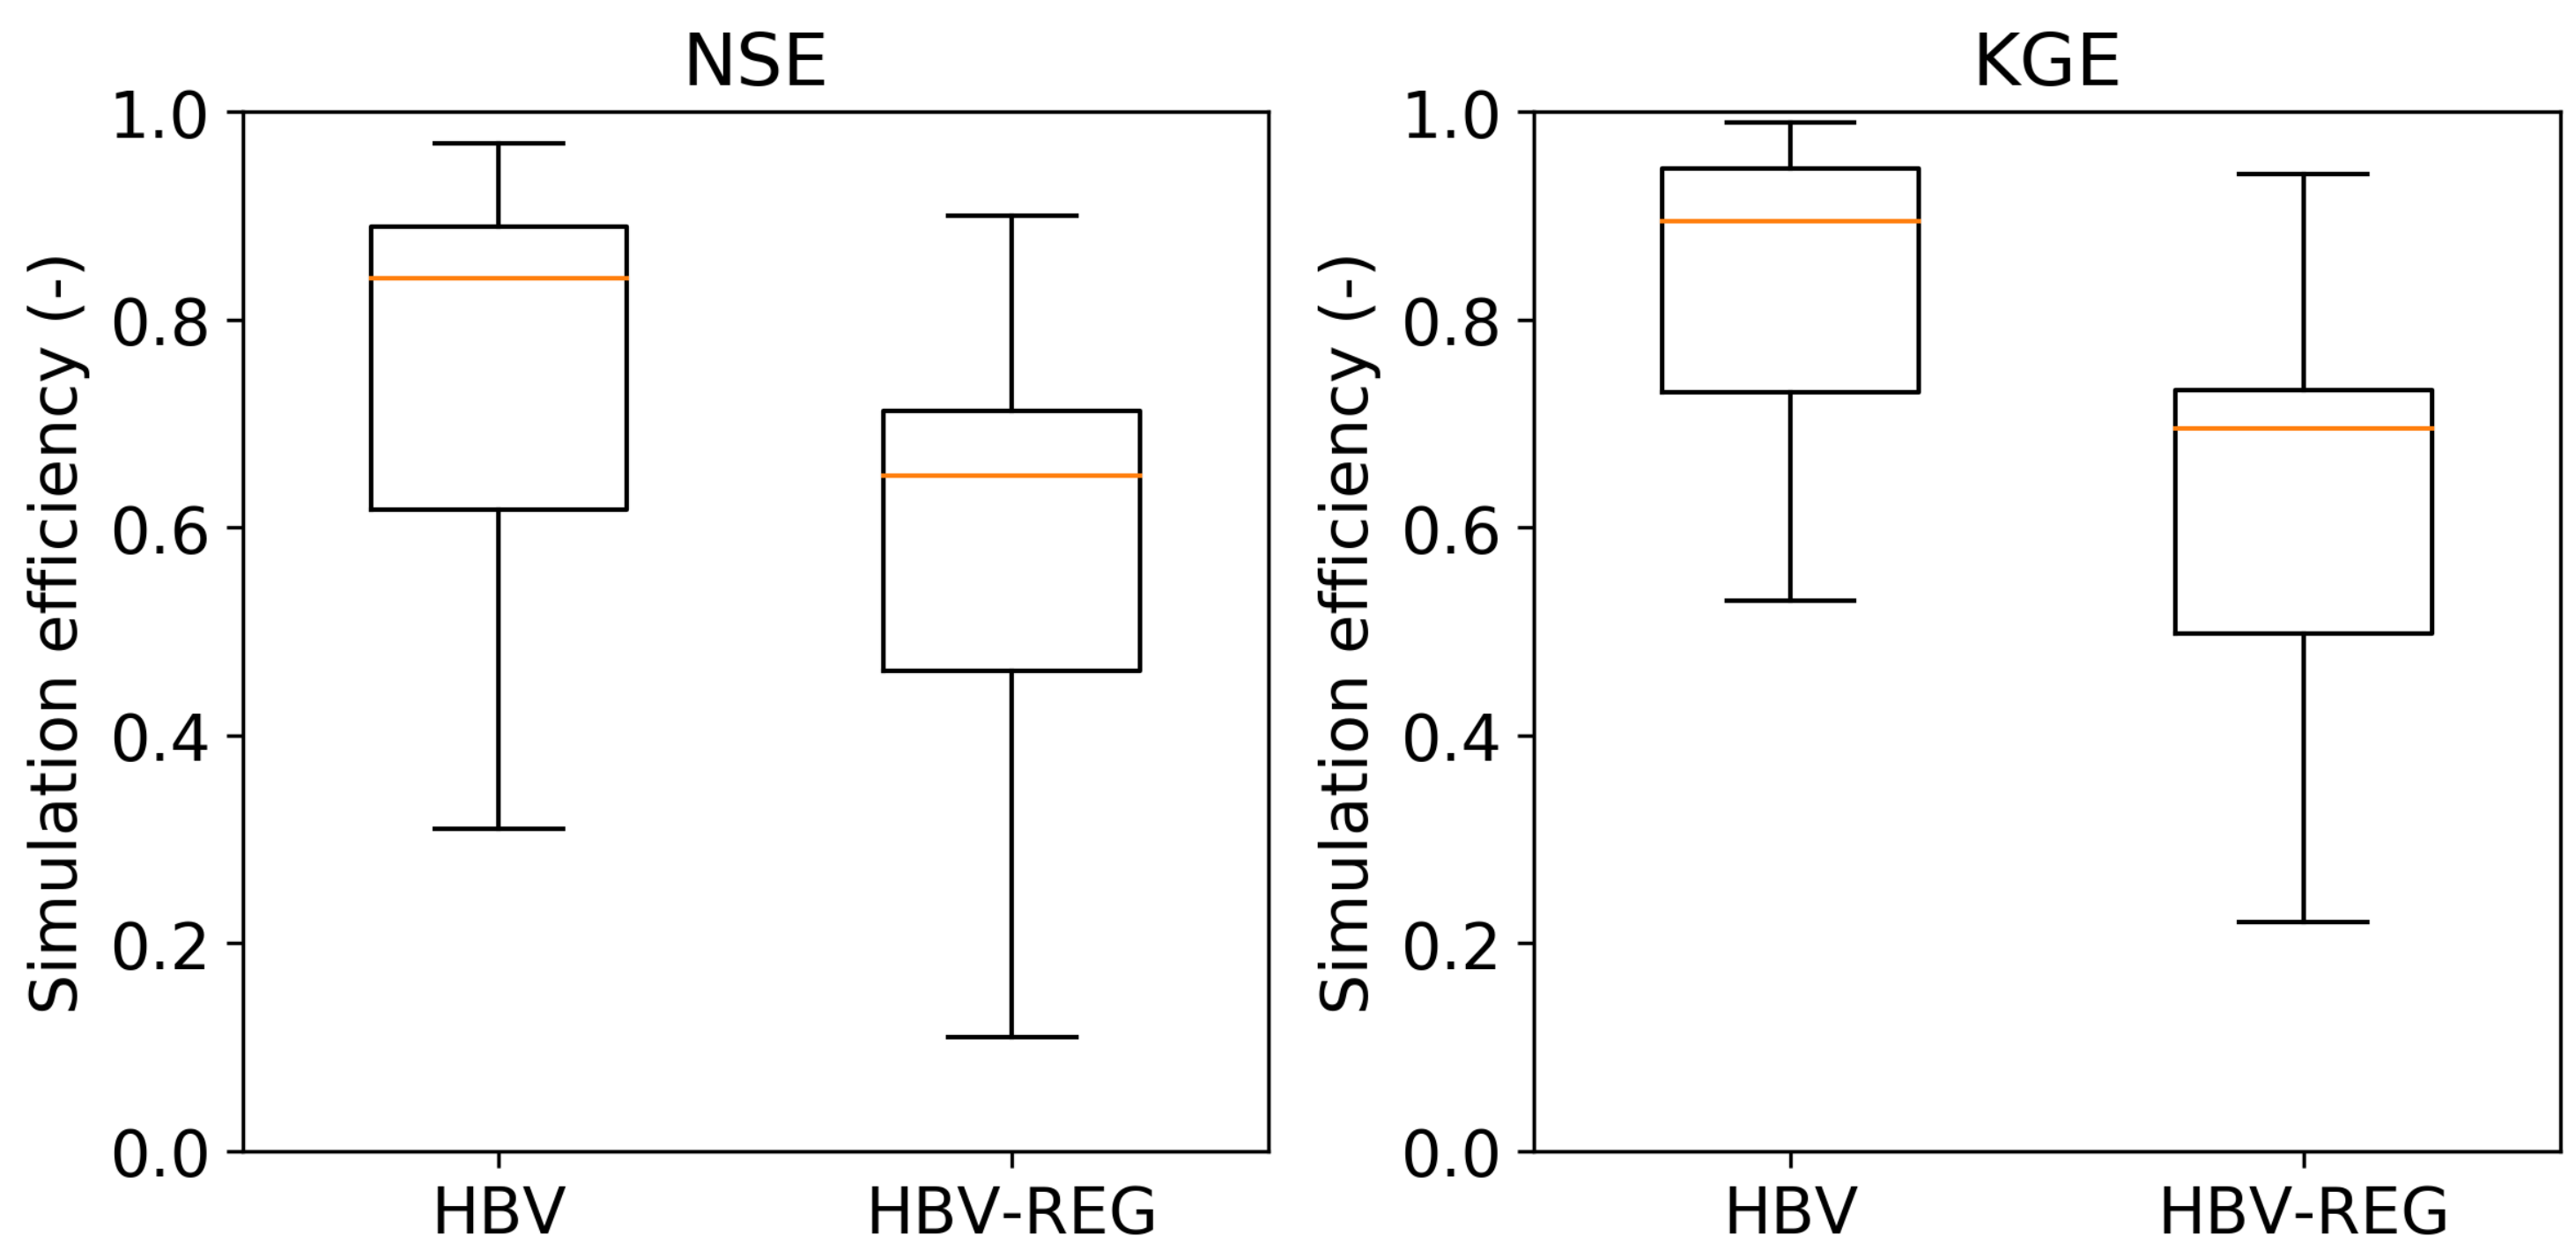
Additionally, we validated the developed gridded runoff dataset for FZ of the Syr Darya River basin (Section 3.3) in terms of the comparison of simulation efficiency (both in NSE and KGE) of modeled monthly runoff time series that were calculated based on the calibrated HBV model (HBV), on the one hand, and extracted from the developed gridded runoff reanalysis (will be further referred to as HBV-REG ), on the other hand, for 22 basins located in FZ (Figure 4). Results showed good consistency between simulation efficiencies calculated using a lumped model setting with optimal parameters (HBV) and the developed gridded runoff reanalysis (HBV-REG). However, there was a distinct decrease in both NSE and KGE for the reanalysis product, especially for the basins with the smallest (under 500 km) and biggest (over 12,000 km) catchment areas. It underlines the limitations of the proposed parsimonious regionalization technique based on spatial proximity being used for runoff reanalysis development. In particular, the obtained runoff estimates based on the use of the corresponding runoff reanalysis dataset should be carefully diagnosed both for the small basins where local factors affect runoff formation the most and for large basins where the spatial heterogeneity of runoff formation processes should be explicitly considered, as well as runoff routing mechanisms cannot be neglected [31].
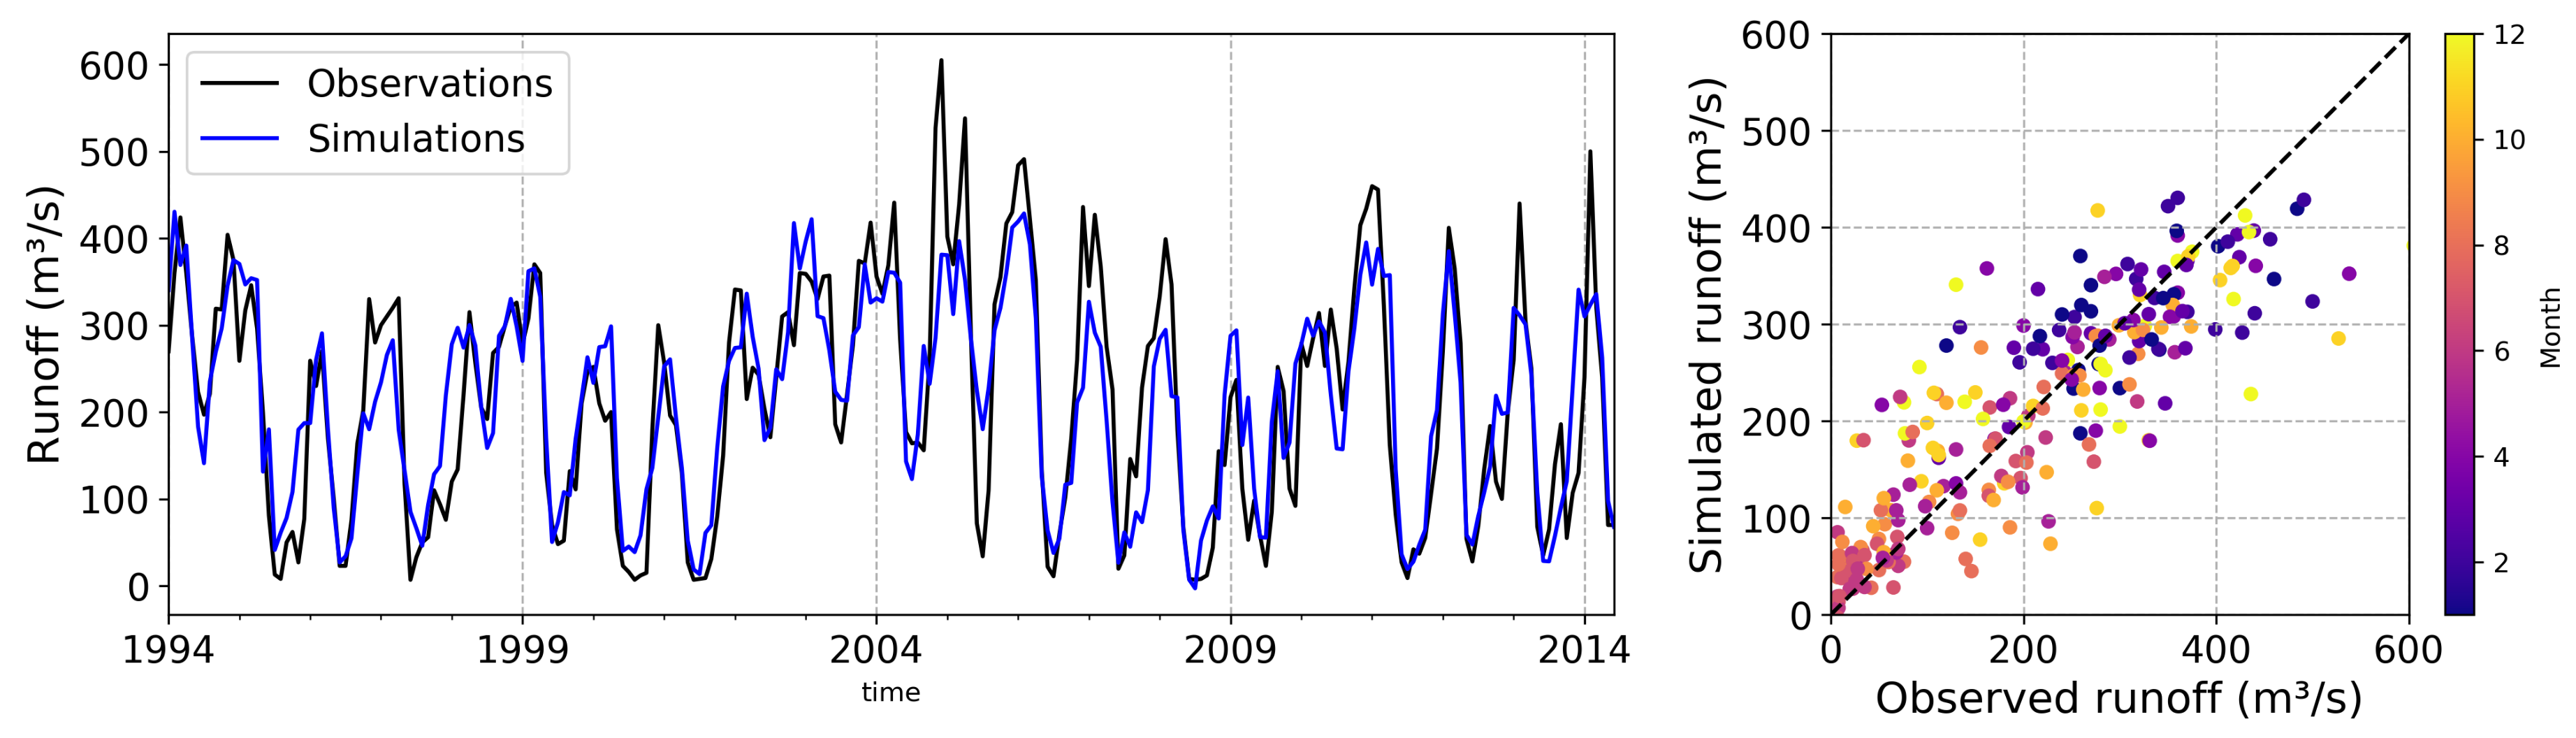
The obtained results of XGB model calibration and validation for the historical period (January 1994–June 2014) were also promising (Figure 5). Calculated NSE and KGE reached 0.72 and 0.77, respectively. To our knowledge, the use of the proposed machine learning workflow with extensive feature engineering technique and advanced XGB model outperformed every approach that has been used previously for freshwater inflow simulation into the Small Aral Sea. Therefore, Ayzel and Izhitskiy [21] reached NSE of 0.56 for modeling the Syr Darya runoff at Kazalinsk for the period 1975–1985 and Aus der Beek et al. [9] reached NSE of 0.58 for the Syr Darya at Tyumenaryk. The obtained efficiency of the XGB model for freshwater inflow simulation also refers to the upper part of NSE range as in Gudmundsson and Seneviratne [34], who provided monthly runoff predictions for a set of European basins using a similar machine learning technique. That underlines the crucial importance and high value of using state-of-the-art machine learning techniques for runoff modeling in (semi-)arid river basins with complex water management and irrigation systems.
However, it should be mentioned that an extensive model intercomparison project is needed to separate the effects of model structure (e.g., data driven or process based) or different forcing data on runoff prediction efficiency. Unless we do so, we cannot say for sure if the higher performance of the proposed XGB model was due to its advanced hybrid structure or just due to the considerable improvement of precipitation estimation in the newest reanalysis products.
The results of feature importance analysis revealed which input data features contributed the most to XGB’s ability to predict freshwater inflow into the Small Aral Sea (Figure 6). Thus, runoff-related features of FZ were the most influencing factors, followed by temperature, precipitation, and potential evapotranspiration related features of FZ as well. This result underlines the significant value of the gridded runoff reanalysis development for FZ and, moreover, the importance of involving physically based models in the research workflow, as they contribute valuable information for machine learning models. The results of feature importance analysis also showed that information from FZ had a dominant influence on XGB’s performance, followed by information from TZs. This result underlines the importance of keeping future research focus on FZ as the zone that influences freshwater formation in the Syr Darya River basin the most [10,13,15,16,17,45]. Furthermore, for every delineation zone, temperature related features were ranked higher than precipitation and potential evaporation ones. This finding confirms the results of Aus der Beek et al. [9] and Shibuo et al. [18] who reported the influence of rising temperatures on the increase of water demands by irrigation sector.
4.2. Reliability of Freshwater Inflow Projections on the Historical Period
Before the assessment of climate change impact on freshwater inflow into the Small Aral Sea for the projection period (2007–2099), it is critical to evaluate if there is a bias in GCM driven projections for the historical period [13]. Climatological annual hydrographs for the Syr Darya River at Kazalinsk using EWEMBI data and historical GCM projections (EWEMBI RCP) for 2007–2016 are shown in Figure 7. There was a large bias between the EWEMBI and EWEMBI RCP driven climatological annual hydrographs for the historical period.
The notable differences between different GCMs used in the ISIMIP2b project in projecting changes of temperature and precipitation were been diagnosed and extensively discussed by Frieler et al. [26]. In this study, the authors pointed out that while at a global scale, different GCMs can behave nearly similarly, regional differences may be substantial and further lead to contradictory results in trend assessment [26]. Among the possible causes of contradictory GCM behavior could be the differences in model structure, spatial resolution, physical processes representation, and accounting for regional climate features [46].
Additionally, the contribution of different GCMs to the uncertainty of the projected runoff for the historical period was more significant than the contribution of RCP scenarios. This finding confirms the results of Nasonova et al. [47] who found the same discrepancies in EWEMBI RCP driven runoff projections for eleven large scale basins located on different continents. This result also calls into question the wide spread practice of using the ensemble mean of different GCM driven projections for assessing the impact of climate change on runoff [19]. Based on this, we decided not to average the results of runoff projections provided by different GCMs and RCP scenarios, but took into account all available single runoff projections.
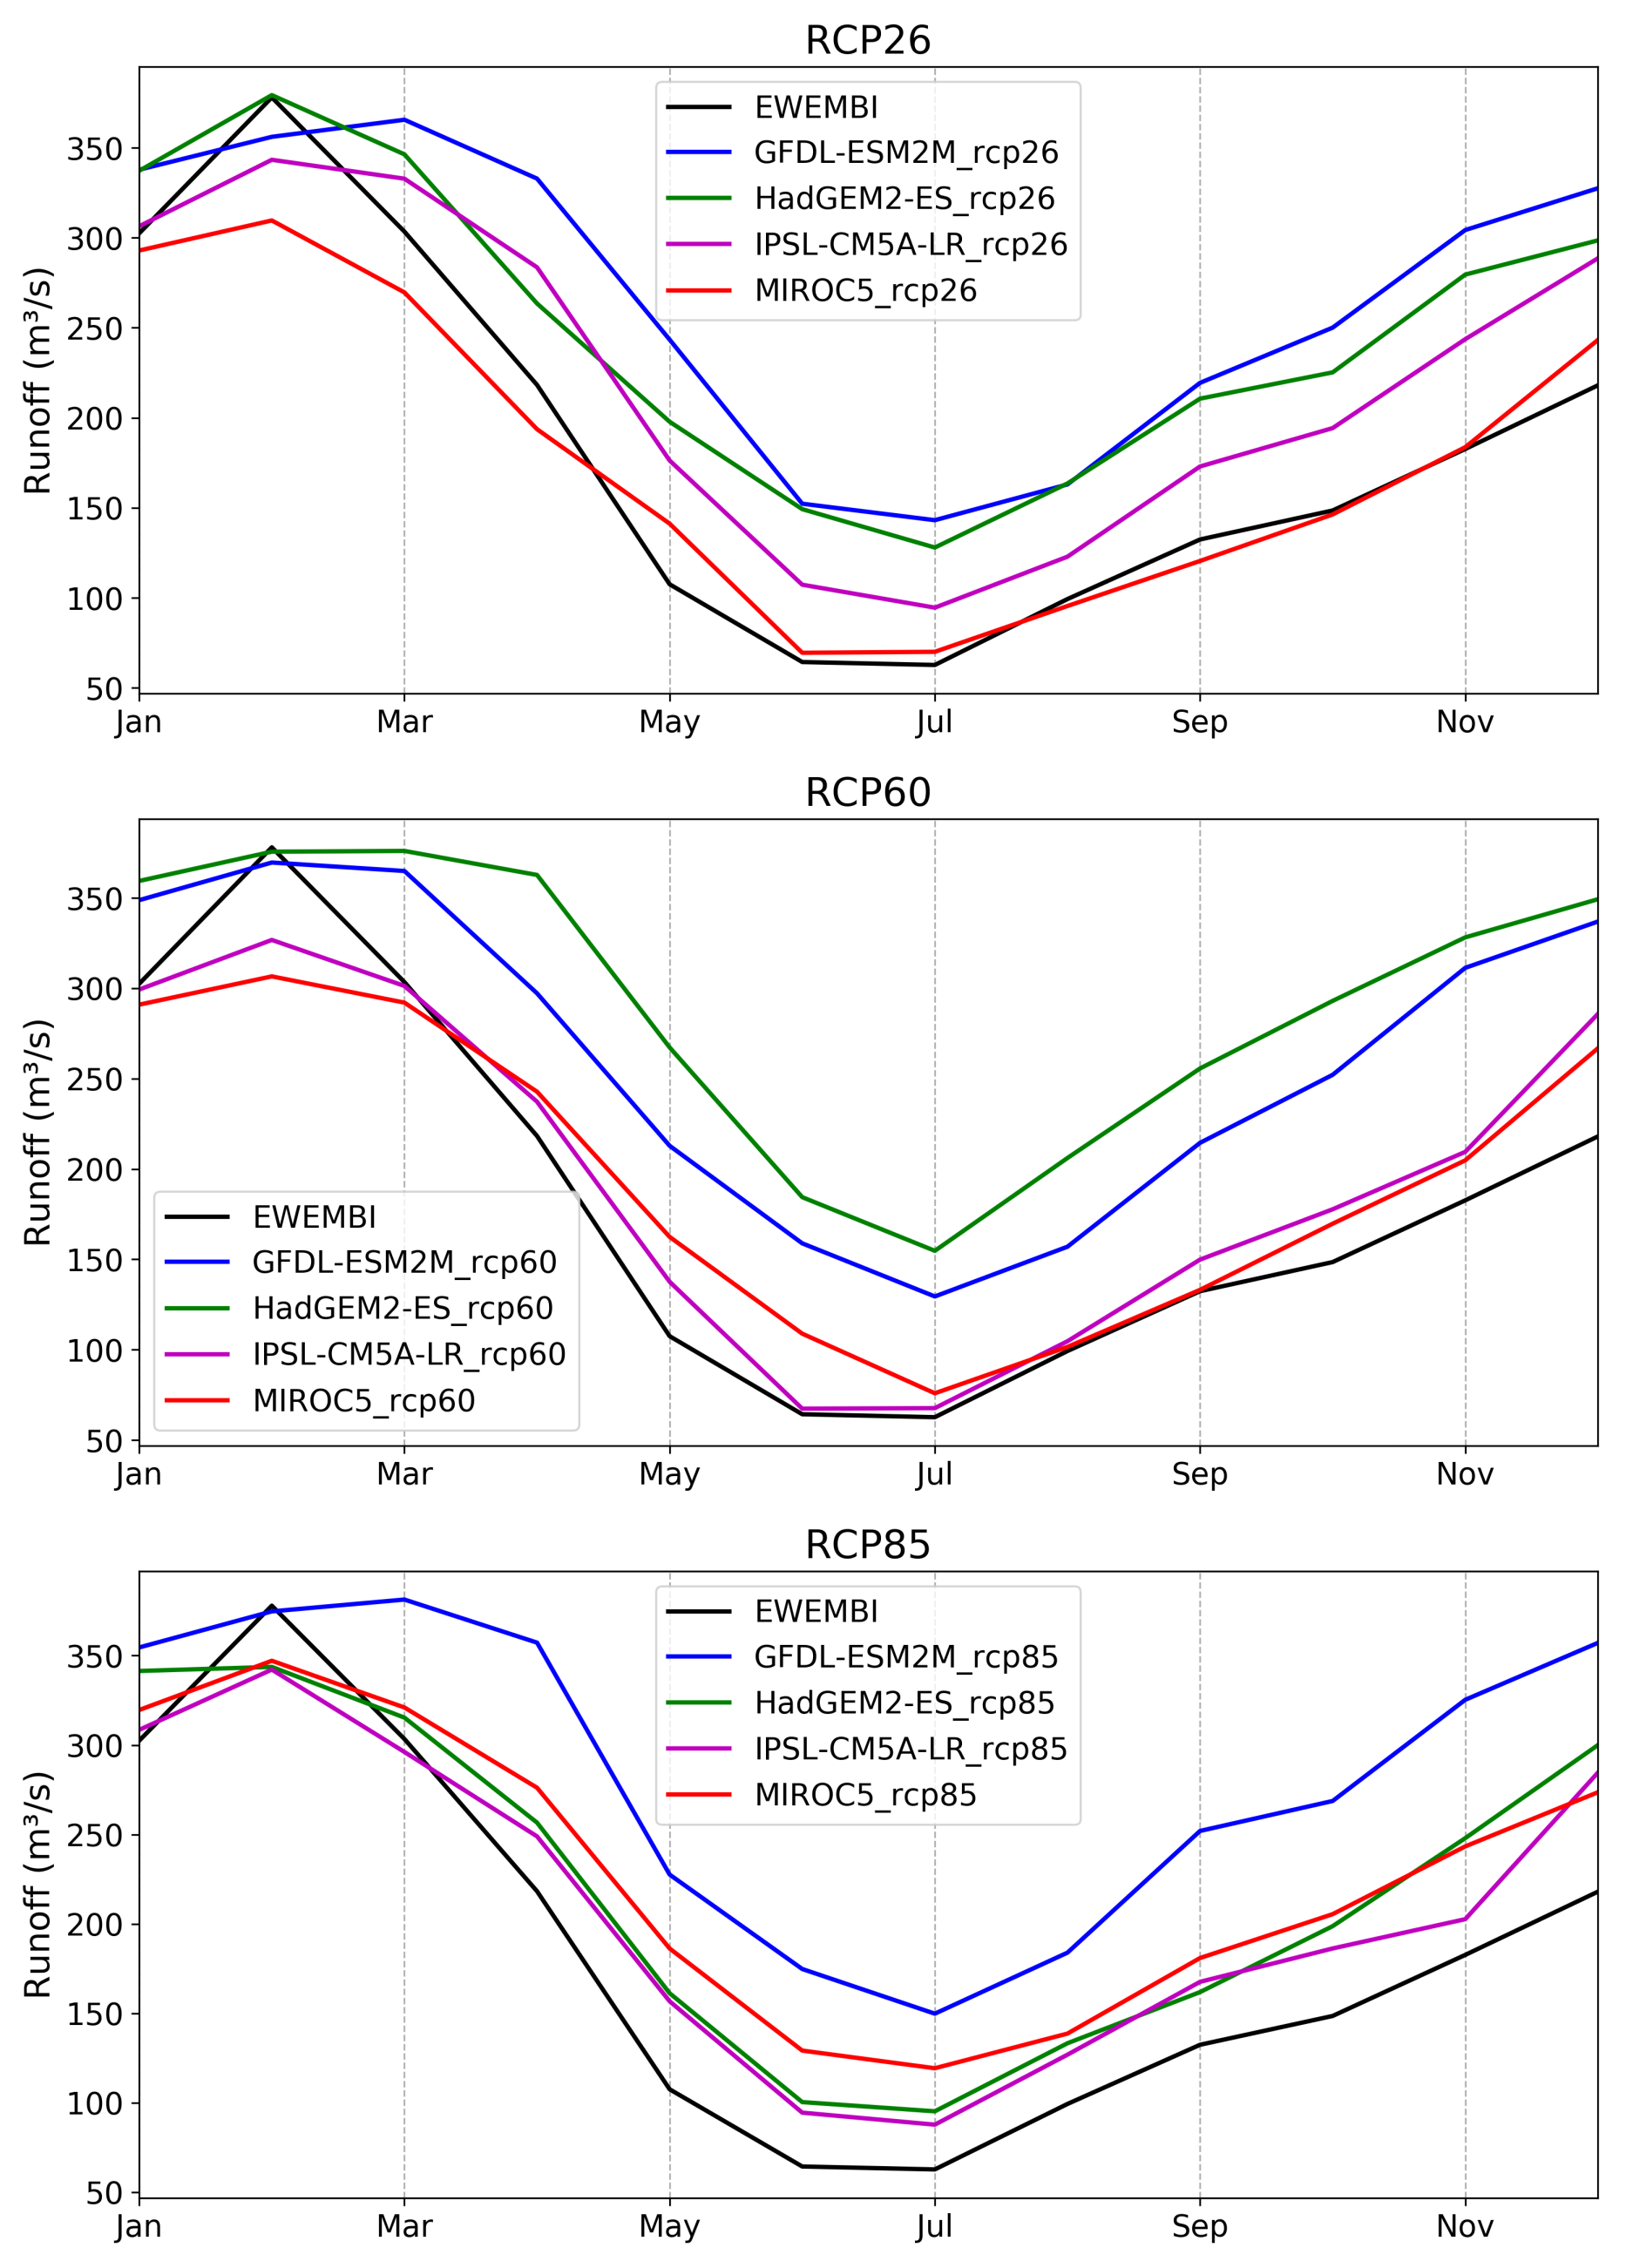
Based on the analysis of the NSE and KGE metrics calculated between the climatological annual hydrographs (Table 1) of different GCM driven runoff projections to simulation based on the historical reference forcing (EWEMBI), we considered MIROC5 simulations under the assumption of the RCP2.6 scenario as the most reliable projection that mimicked seasonal runoff dynamics for the historical period (Figure 8). Calculated NSE and KGE reached 0.93 and 0.89, respectively. Additionally, MIROC5 and IPSL-CMSA-LR simulations under the assumption of the RCP6.0 scenario could also be considered as reliable options for further climate impact assessment. Calculated NSE and KGE reached 0.87 and 0.79 for MIROC5 under RCP6.0; 0.91 and 0.89 for IPSL-CMSA-LR under RCP6.0, respectively. The possible reasons why MIROC5 and IPSL-CMSA-LR showed more reliable results among other GCMs regarding the runoff changes for the historical period (2007–2016) were their finer resolution, a lower equilibrium climate sensitivity, a smaller temperature drift in the pre-industrial control run, and more realistic representations of ENSO, the Asian summer monsoon, and North Atlantic extratropical cyclones during the historical period [26,46].
4.3. Climate Change Impact Assessment on Freshwater Inflow into the Small Aral Sea
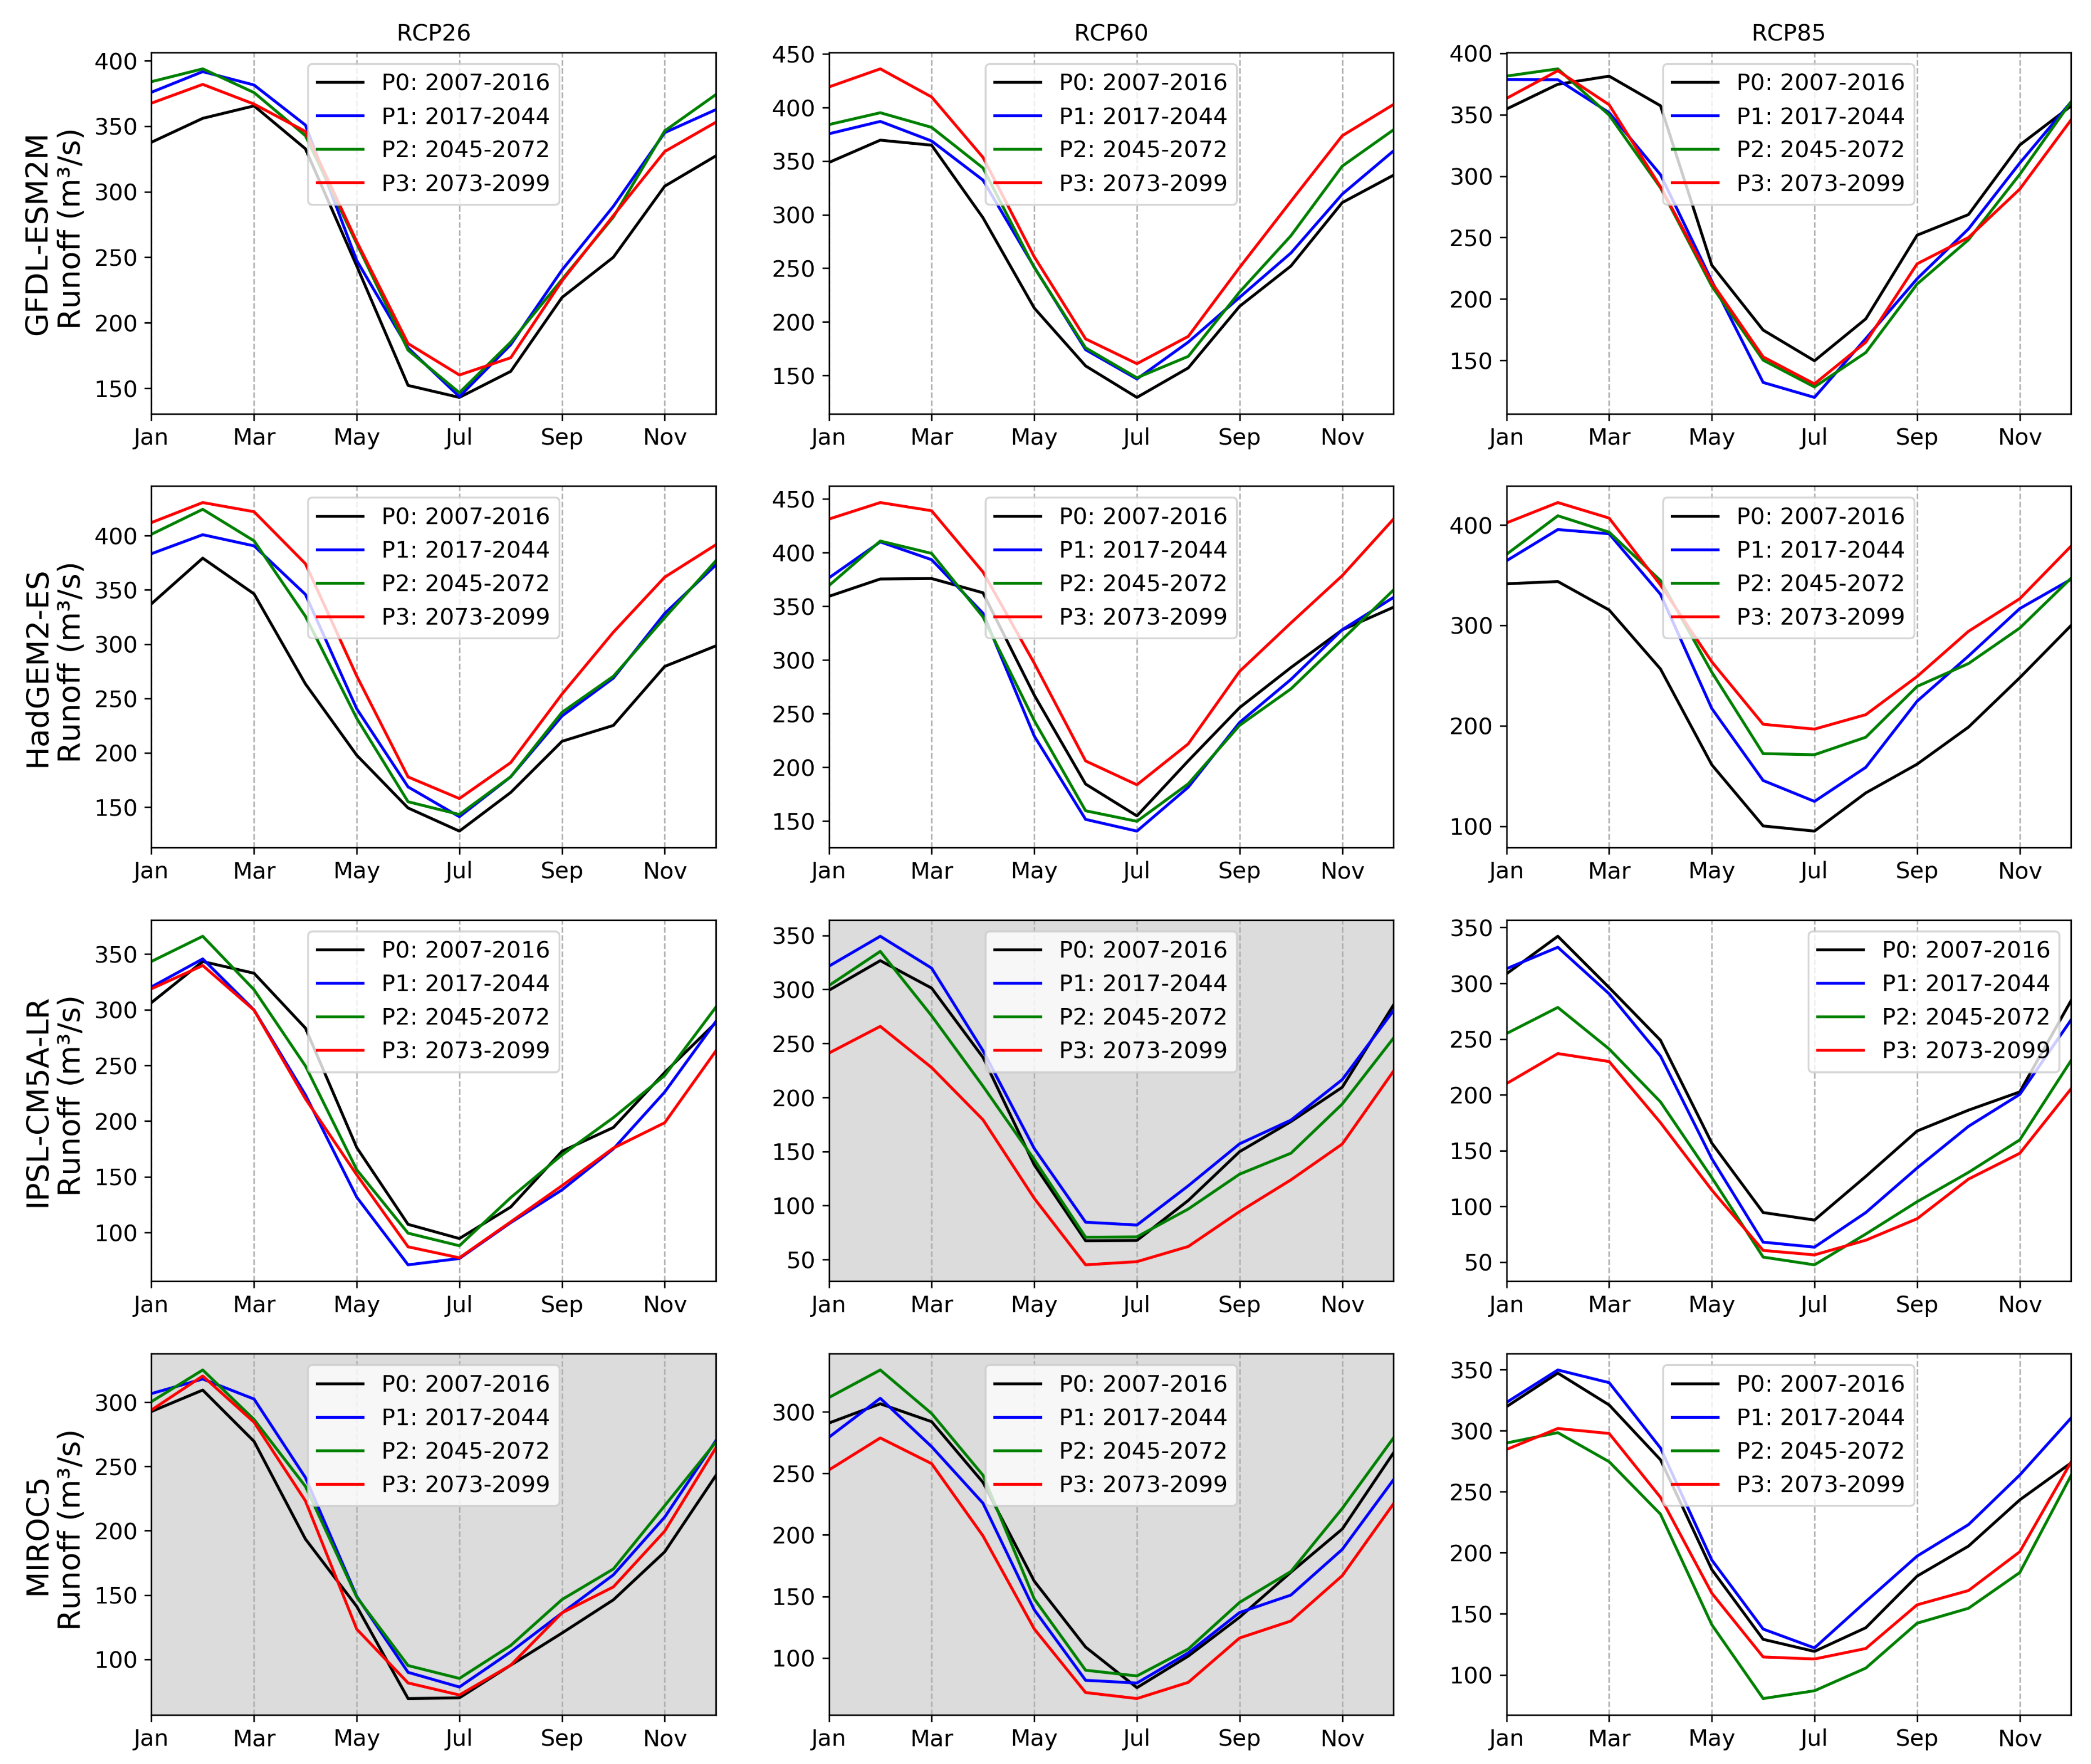
The impact of potential climate change on freshwater inflow into the Small Aral Sea derived using the GCMs for the projection period (2007–2099) was analyzed in regard to two aspects: (1) the potential change in the mean monthly runoff and (2) the potential change in the mean annual runoff. For the consistent assessment of the potential change in climatological annual hydrographs, we divided the projection period into four periods: one baseline period (P0; 2007–2016) and three prognostic periods: P1 (2017–2044), P2 (2045–2072), and P3 (2073–2099). For these periods, the freshwater inflow was simulated based on the EWEMBI RCP dataset of four GCMs and three climate scenarios of the RCP family. The simulation results are shown in Figure 9. The runoff simulations based on MIROC5 under RCP2.6 as the most reliable projection for the historical period (Figure 9, first column, bottom row) showed a slight increase (up to 10%) in the monthly runoff for each month. However, if we hypothesize that the runoff for the historical period follows the track of changes projected by MIROC5 and IPSL-CM5A-LR under the more aggressive RCP6.0 scenario, then the estimated changes in climatological annual hydrograph were more pronounced (Figure 9, second column, last two bottom rows). Therefore, the two models agree that the projected monthly runoff at the end of the 21st Century (period P3) significantly decreased (down to 17% on average) for each month. However, the runoff projections for the beginning (period P1) and the middle (period P2) of the 21st Century showed the disagreement between the two models: e.g., MIROC5 based runoff projections showed a decrease in monthly runoff for P1, especially for the March–June and September–December period (down to 8% on average), and an increase in monthly runoff for P2, especially for the winter period (up to 5% on average with maximum at February), while IPSL-CM5A-LR based runoff projections showed, on the contrary, an increase in monthly runoff for P1 and a decrease for P2. Moreover, if at some point the Small Aral Sea basin would turn to following the most aggressive RCP8.5 scenario (Figure 9, third column), the two respective models—MIROC5 and IPSL-CM5A-LR—showed disagreement regarding the period of the most substantial change in monthly runoff decrease, i.e., it could be for P2 or P3, respectively.
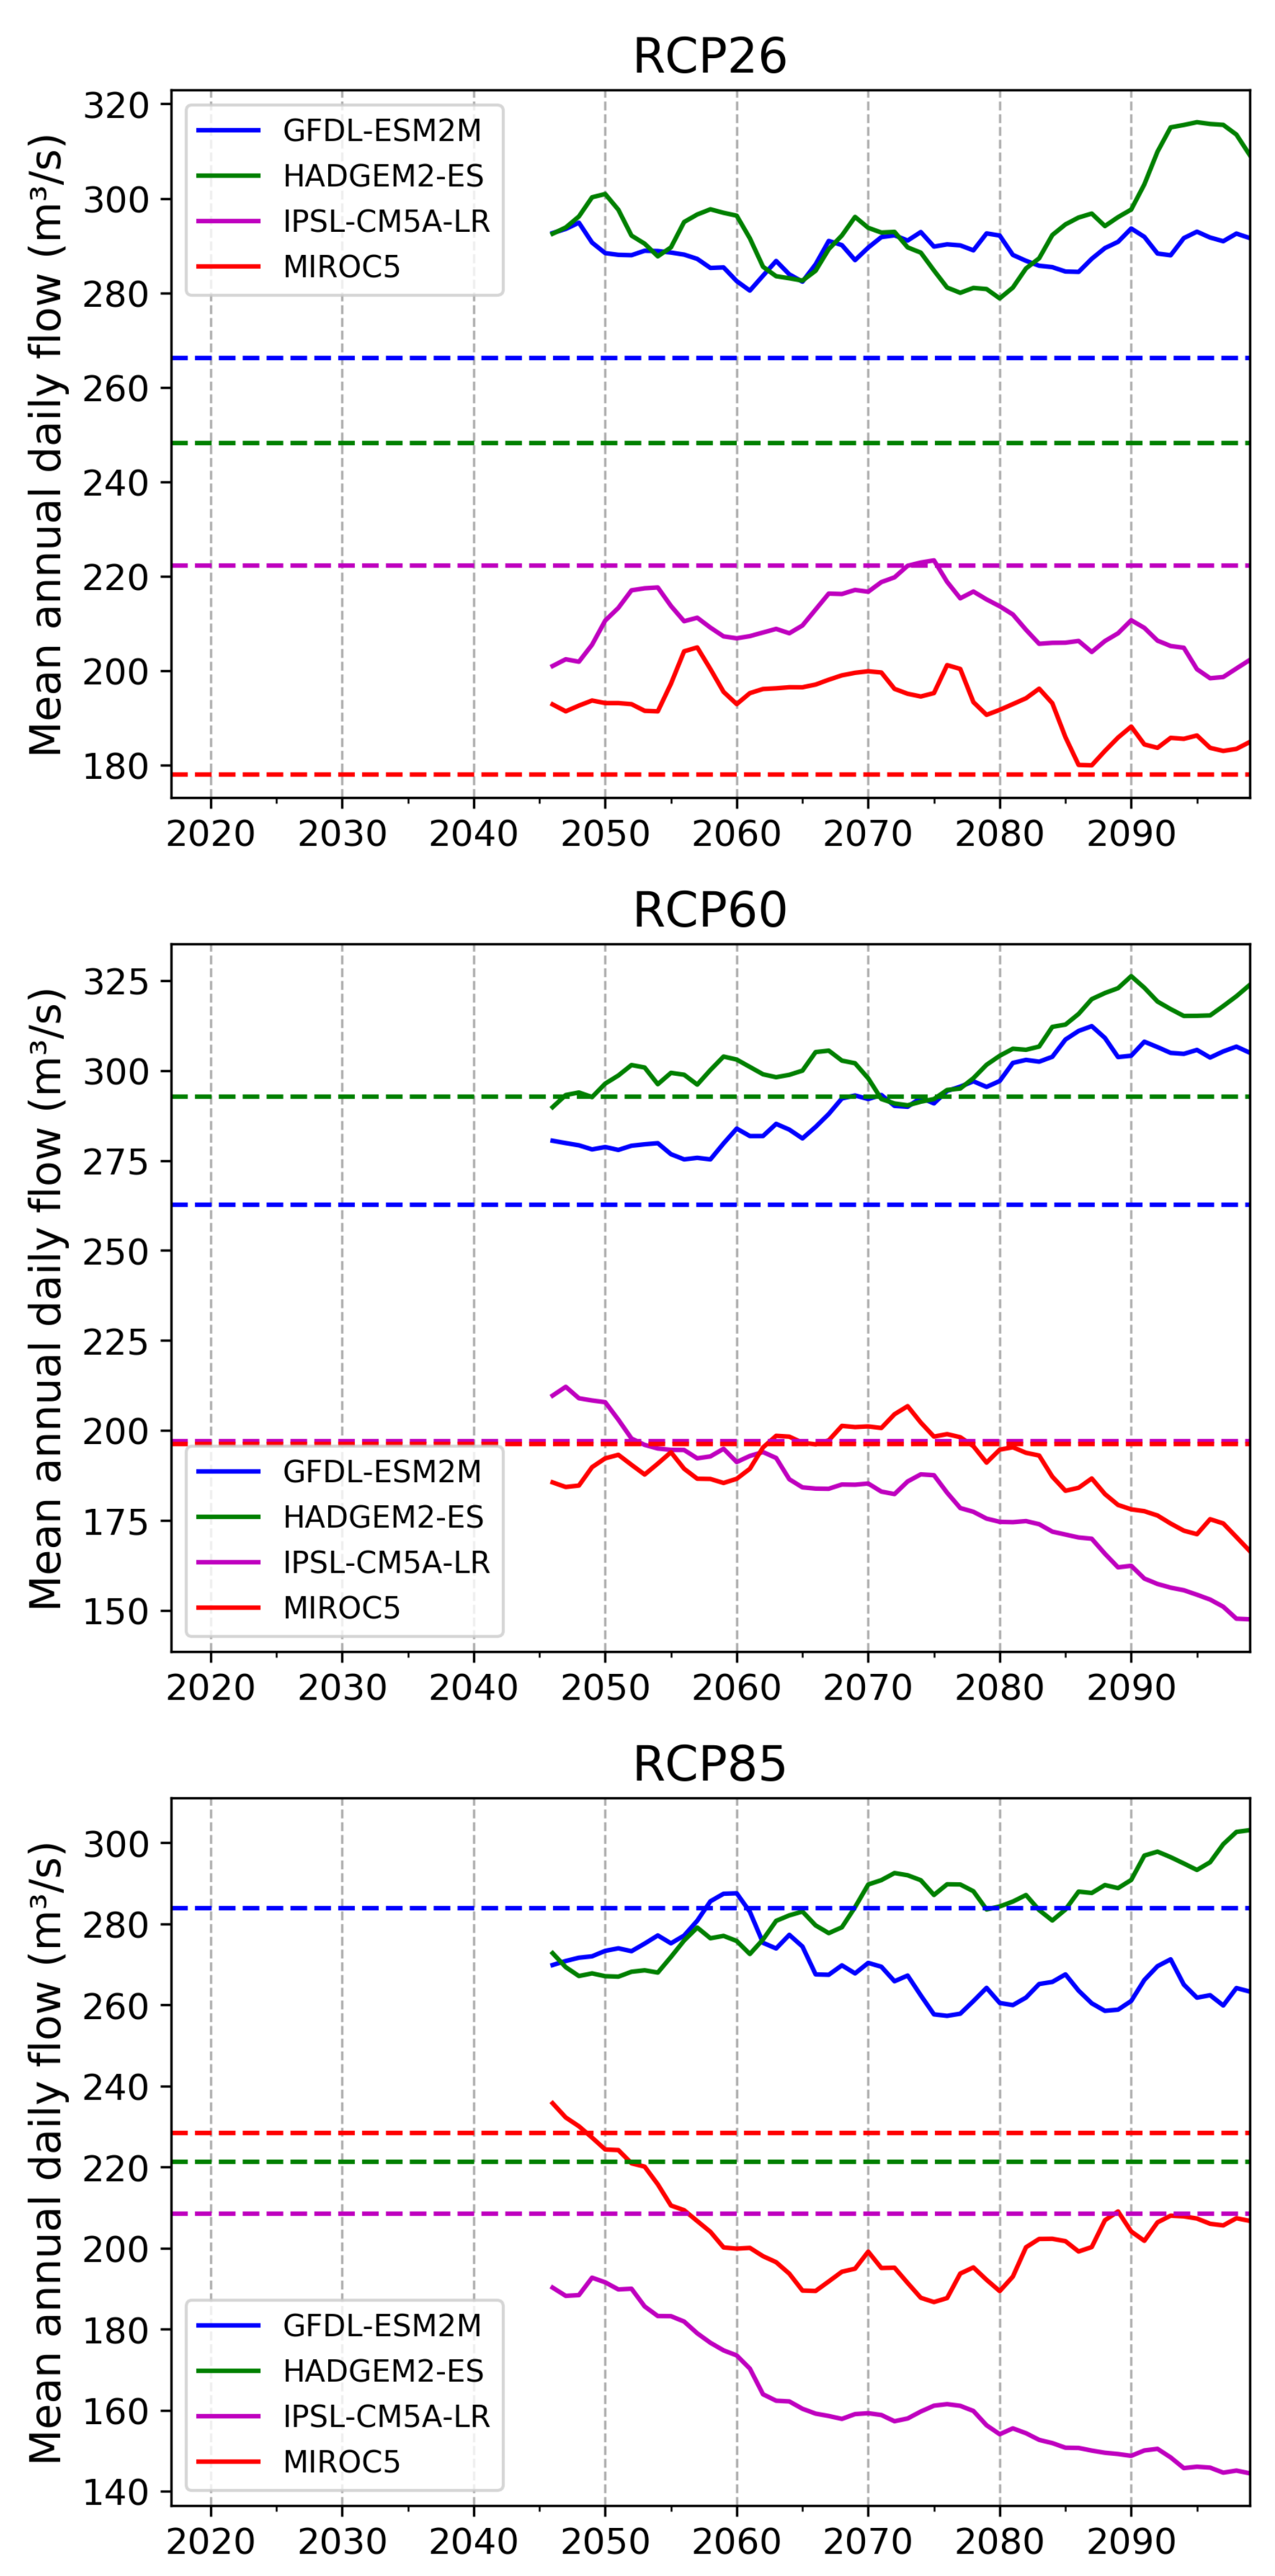
For the assessment of the potential change in climatological Mean Annual Runoff (MAR), while we simply averaged runoff simulations for P0 (2007–2016), we calculated the 30-year moving average to obtain an evolution of climatic runoff altogether for the projection period P1–P3 (2017–2099) [48]. The corresponding results are shown in Figure 10. There were significant differences between different GCMs, both in expected quantitative changes in climatological MAR and their directions (Figure 10). Thus, under the RCP 2.6 scenario, while three GCMs— GFDL-ESM2M, HadGEM2-ES, and MIROC—agreed on the increase in MAR of 9–15% for the projection period in comparison with the historical period, IPSL-CM5A-LR projected a decrease of 5%. Therefore, only simulation results based on IPSL-CM5A-LR agreed with the results obtained by Lutz et al. [10] who showed that the outflow for the Syr Darya River into the Aral Sea decreased 10.8% until 2041–2050. Moreover, GFDL-ESM2M and IPSL-CM5A-LR showed no trend in projected MAR, while MIROC5 showed a slight decrease of MAR on P3, but HadGEM2-ES showed a slight increase of MAR on P3. Simulation results under the most aggressive RCP 8.5 scenario were also misleading. Thus, three GCMs—GFDL-ESM2M, IPSL-CM5A-LR, and MIROC5—showed a substantial decrease in MAR of 7–15% for the projection period in comparison with the historical period; but HadGEM2-ES showed an increase in MAR up to 25%. The direction of projected changes in MAR under RCP 8.5 also differed significantly. Thus, HadGEM2-ES and IPSL-CM5A-LR represented consistent increasing and decreasing trends, respectively. Both GFDL-ESM2M and MIROC5 showed a significant decrease in MAR by 2070; there was no trend for GFDL-ESM2M, but the increasing trend for MIROC5 for the period 2007–2099. The most reliable GCMs for the historical period—IPSL-CM5A-LR and MIROC5—also showed contrary results for projected MAR under each RCP scenario. In summary, the obtained results of freshwater inflow simulations produced by different GCMs using different RCP scenarios underlined a considerable uncertainty in climate impact assessment results for this region [19].
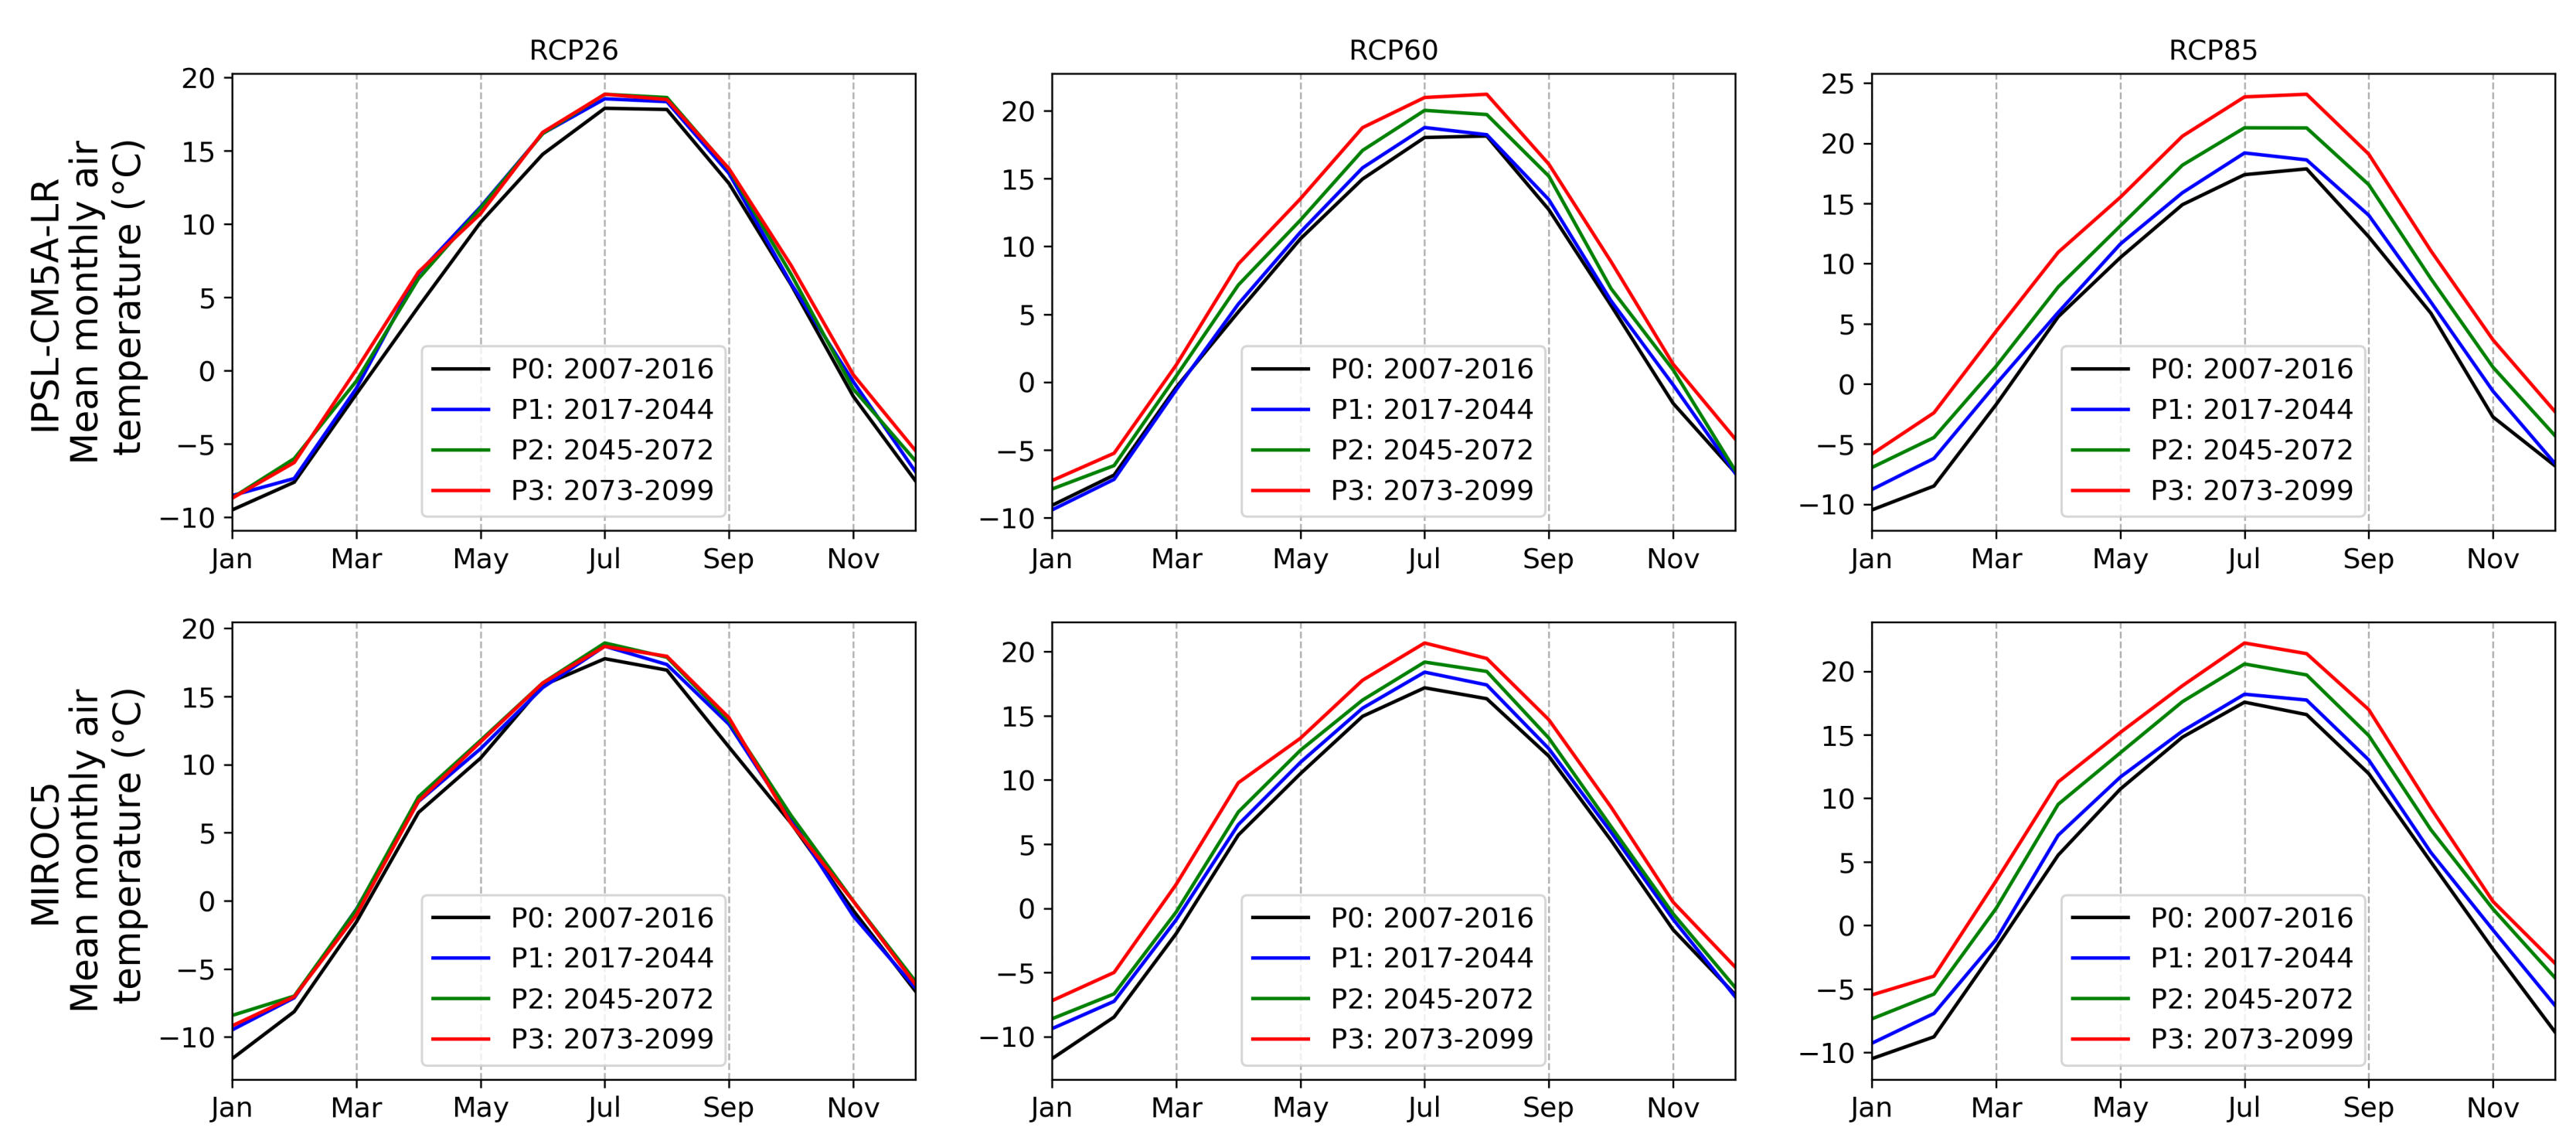
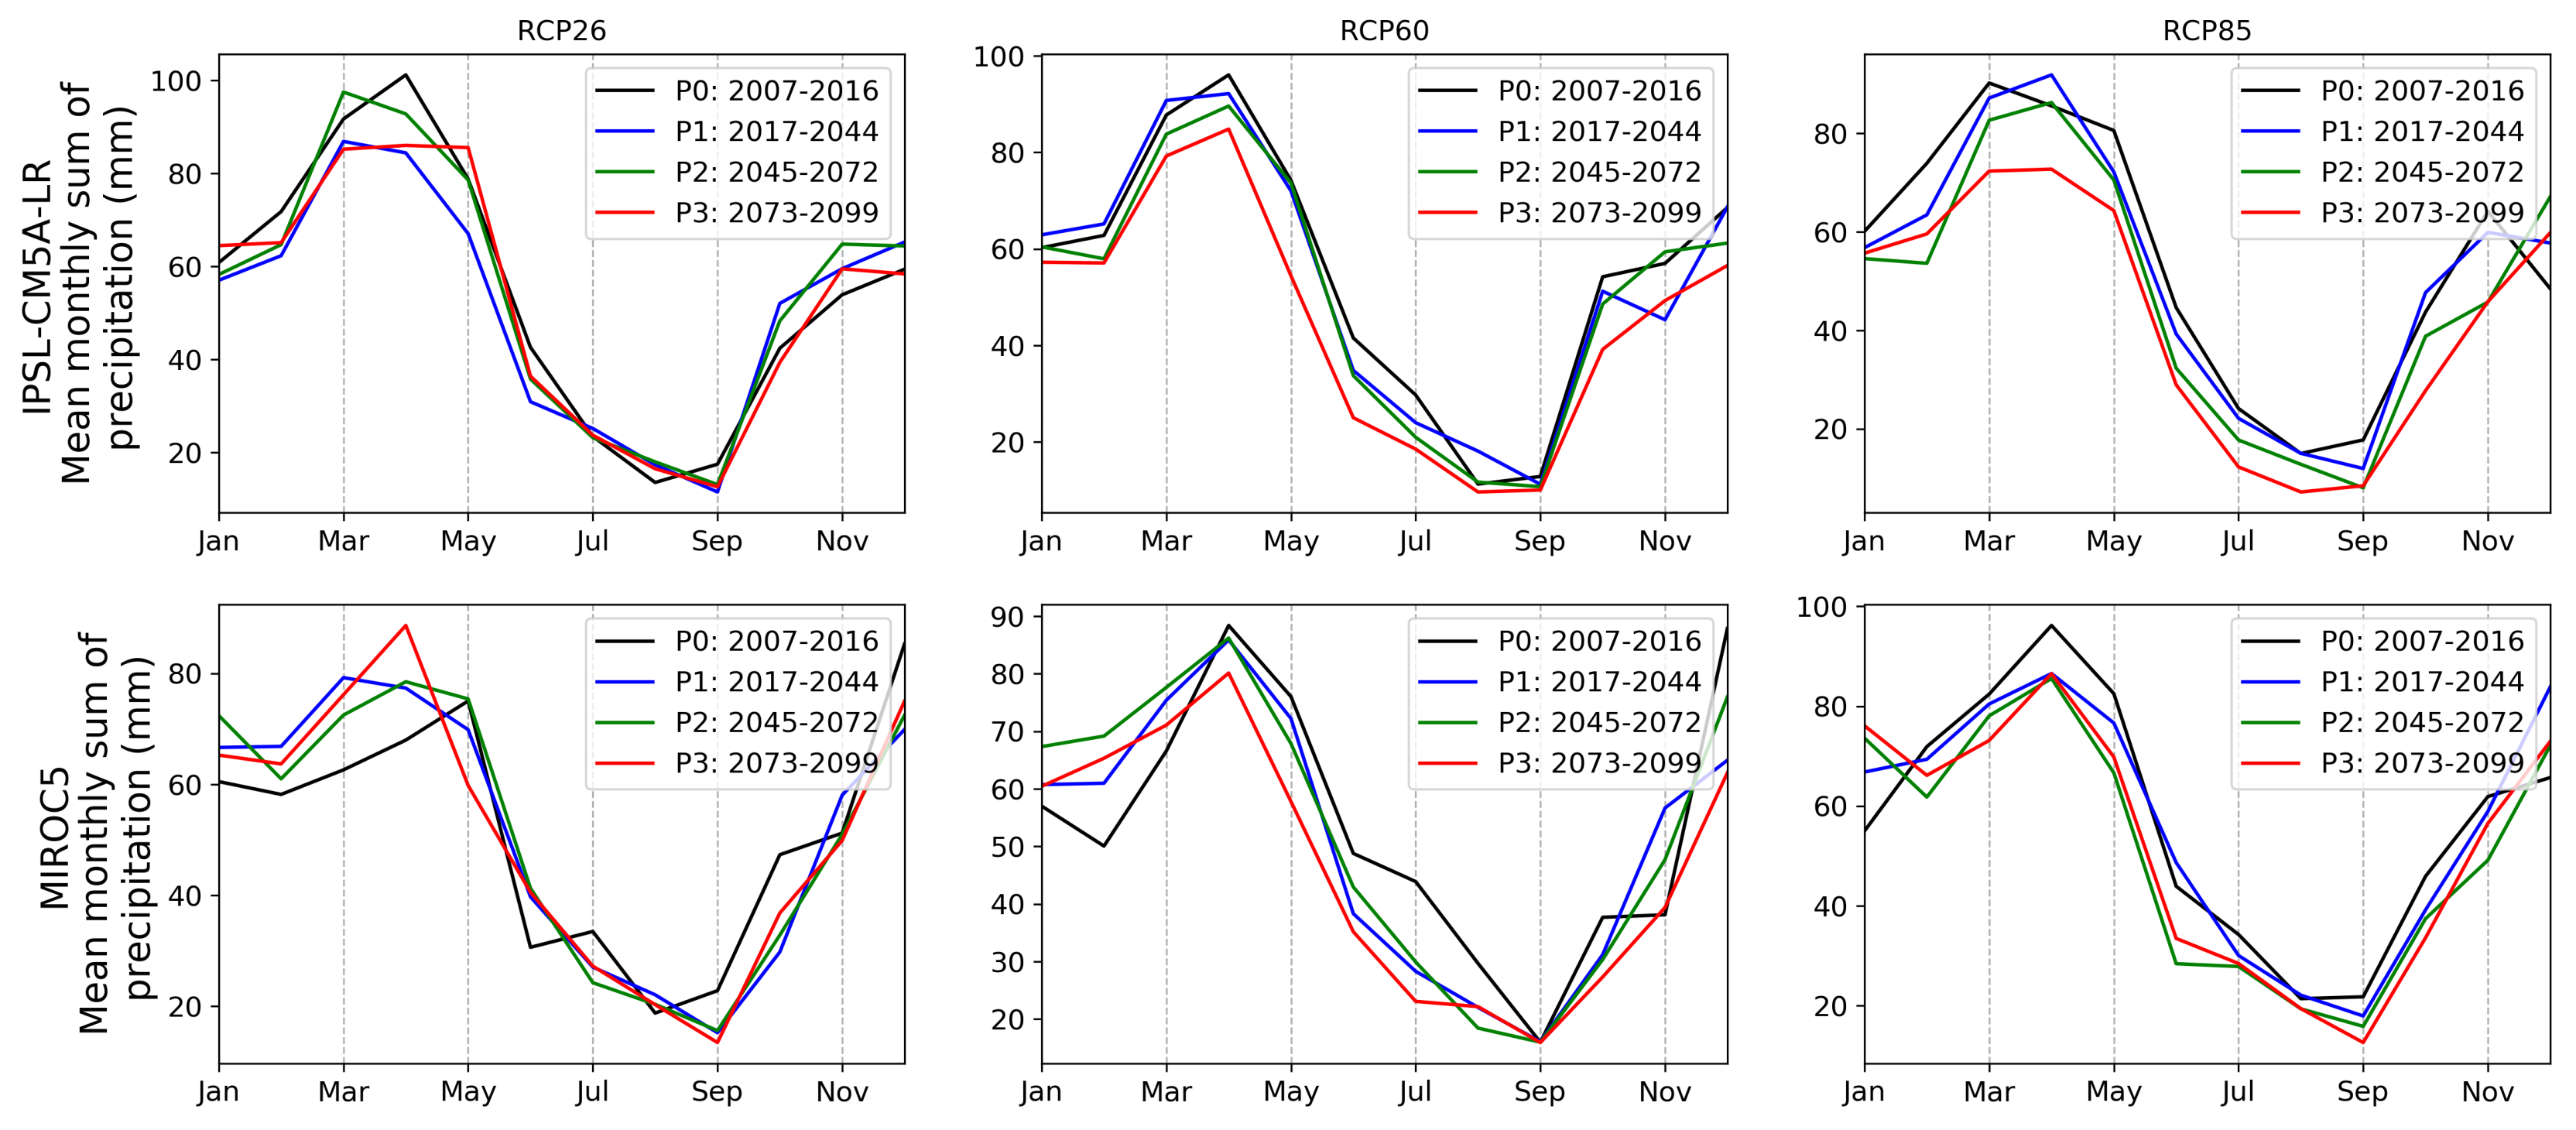
The compound effects of the projected changes of different drivers that influence the dynamics of the freshwater inflow into the Small Aral Sea (Figure 6) complicated the identification of the primary source of expected changes in freshwater inflow for the projection period. However, as our modeling results for the historical period agreed on the leading role of FZ for freshwater formation in the Syr Darya River basin with previous studies [10,13,15,16,17,45], we hypothesized that the projected changes in temperature, precipitation, and runoff in FZ would have a dominant impact on total freshwater inflow into the Small Aral Sea in the future. To reinforce our hypothesis, we analyzed the potential change in intra-annual variation of the mean monthly air temperature in FZ (Figure 11), the potential change in intra-annual variation of the monthly sum of precipitation in FZ (Figure 12), and the potential change in climatological annual hydrographs of mean cumulative runoff from FZ (Figure 13).
The results showed that the future projections of air temperature agreed on two aspects: the projected changes were expected to be more pronounced in the case of, first, more aggressive RCP scenarios and, second, for later time horizons (Figure 11). While there was no indicated shift in seasonality, there was a distinct systematic increase in mean monthly temperature for each month, which was more pronounced for more aggressive RCPs and more distant periods. As a result, rising winter temperatures can intensify snowmelt or increase the proportion of liquid precipitation [7,15]; at the same time, rising summer temperatures can intensify evapotranspiration losses or indirectly lead to more severe rainstorms [49,50]. The obtained results were in line with the previous studies conducted for this region [15,16].
The expected changes in precipitation for the projection period were more uncertain than the changes in temperature and significantly differed between the analyzed GCMs (Figure 12). Thus, under the RCP 2.6 scenario, while IPSL-CM5A-LR projected a decrease of 15–20% in precipitation amount from February to July and an increase of 5–10% in precipitation amount from October to December, MIROC5, on the contrary, projected precipitation changes in opposite directions, but following similar rates. However, both models agreed on the significant systematic decrease in precipitation amount of 10–50% under the RCP6.0 and RCP8.5 scenarios for the projection period in comparison with the historical period. This way, as precipitation determines the potential availability of freshwater resources, its projected changes will substantially affect the expected changes in runoff [49].
The obtained results of the potential change in climatological annual hydrographs of mean cumulative runoff from FZ (Figure 13) confirmed the findings of Gan et al. [13], Radchenko et al. [16], and Siegfried et al. [17] who found a strong shift in runoff seasonality, as well as a reduction of peaks’ magnitude for the basins located in the mountainous part of the Syr Darya River. This way, runoff from FZ, as a cumulative variable, reflected the compound effects of both changes in precipitation and temperature in FZ.
However, while indicated changes in runoff from FZ strongly affected freshwater availability for the downstream part of the Syr Darya River basin, they did not lead to the seasonal shifts in freshwater inflow into the Small Aral Sea basin (Figure 9), but only developed a systematic bias of projected changes in annual hydrographs of freshwater inflow. Thus, identified changes in freshwater availability may have substantial implications on the transformation of water demands by the irrigation sector in the future.
While the results of the projected changes in freshwater inflow into the Small Aral Sea were contradictory between different GCMs and RCP scenarios, it is hard to speculate about the potential outcomes of the projected changes for the Small Aral Sea and the hydrology of the region with high confidence. However, if we used the freshwater inflow projection that was driven by MIROC5 GCM under the RCP2.6 scenario as a proxy of the projected changes that are close to the ongoing changes (business-as-usual scenario), we could expect an increase in mean annual freshwater inflow into the Small Aral Sea of 10% for the next few decades in comparison with the historical period. This way, the increasing amount of freshwater coming to the Small Aral Sea will eventually decrease its salinity to a level even lower than it was during the pre-industrial period (around 10 g/kg for the late 1950s). Additionally, the surplus of freshwater can be diverted to the residual basins of the former Aral Sea through Kokaral Dike. However, this surplus is negligible to support residual basins’ recovery. Unfortunately, under scenarios of rising greenhouse emissions (RCP6.0, RCP8.5), there will be no positive impact, neither on the Small Aral Sea hydrology, nor on the economy or environment of the region. The decrease in the projected freshwater inflow into the Small Aral Sea of 7–15% in comparison with the historical period will trigger significant changes in water management on a regional scale that we have to be ready to mitigate.
5. Conclusions
The objective of this study was to assess the current and projected changes in freshwater inflow into the Small Aral Sea. To this aim, we developed and extensively validated the hybrid model for the entire basin of the Syr Darya River based on a combination of state-of-the-art conceptual hydrological and machine learning models. Then, projected changes in freshwater inflow to the Small Aral Sea for the period 2007–2099 were quantified based on the developed hybrid model and meteorological projections simulated by four GCMs for each of three RCP scenarios.
As a result, at first, in our study, we demonstrated the high efficiency of the developed machine learning model to simulate freshwater inflow into the Small Aral Sea for the historical period. That underlined the high potential of rapidly emerging machine learning methods to be adapted for hydrological modeling of complex hydrological phenomena in the presence of substantial data scarcity. Moreover, we showed the critical importance of coupling the machine learning model with a conceptual hydrological model as the latter can provide highly valuable information to be assimilated as input data for the former.
Second, we estimated the reliability of freshwater inflow projections for the historical period (2007–2016) produced by machine learning models based on different GCM and each RCP scenarios. The obtained results showed the significant disagreement between freshwater inflow projections produced by different GCMs, i.e., single GCM projections can entirely contradict each other. Additionally, we found that the contribution of different GCMs to the uncertainty of the projected runoff for the historical period was more significant than the contribution of RCP scenarios. As this result calls into question the practice of using the ensemble mean of different GCM-driven projections for assessing the impact of climate change on runoff, we underlined the importance of accounting for all available single runoff projections separately with the focus on GCMs, which was shown to be the most reliable.
Third, we assessed climate change impacts on freshwater inflow into the Small Aral Sea for the projection period (2007–2099). Similar to the historical period, we showed that the freshwater inflow projections produced by different GCMs were misleading by providing contradictory results for the projection period. However, we identified that the relative runoff changes were expected to be more pronounced for more aggressive RCP scenarios. This result underlines the importance of accounting for the high uncertainty of projected freshwater inflow scenarios for further mitigation of their impact on regional hydrology and water management.
Fourth, we demonstrated that identified seasonal changes of projected runoff in the runoff formation zone of the Syr Darya River basin, namely the shift in peak runoff from summer to spring and the reduction of peak magnitude, were not reflected in the corresponding changes of freshwater inflow into the Small Aral Sea, but only developed a systematic bias of projected changes in annual hydrographs of freshwater inflow. However, these systematic shifts in annual hydrographs may have substantial implications on the transformation (mostly reduction) of water demands by the irrigation sector in the future.
In summary, our study provided a robust framework for climate change impact assessment on freshwater inflow into the Small Aral Sea, developing a state-of-the-art hybrid model and communicating the high uncertainty related to climate change projections produced by different GCMs under various RCP scenarios. The developed scenarios of projected changes in freshwater inflow into the Small Aral Sea in the 21st Century can be further utilized by many parties, e.g., for the assessment of climate change impact on physical and biological characteristics of the Small Aral Sea or for the development of practical measures to mitigate the environmental and social impact of projected changes in regional hydrology.
Author Contributions
G.A. conducted the modeling, analyzed the results, and wrote the paper. A.I. gave comments and revised the manuscript.
Funding
This work was undertaken within the frame of the SMASHI (Small Aral Sea Hydrological Investigation) project (http://smashiproject.github.io) and was funded by the Russian Foundation for Basic Research (RFBR), Project Number 17-05-01175. The part of the presented study related to the preprocessing of climate simulation data was financially supported by RFBR, Project Number 19-35-60005. The part of the presented study related to the development, calibration, and implementation of the HBV hydrological model was financially supported by the Russian Science Foundation (Grant Number 16-17-10039). The analysis of direct observations was supported by the Ministry of Science and Education of Russia (theme No. 0149-2019-0003).
Acknowledgments
The Global Runoff Data Centre (GRDC) and Yasavi International Kazakh-Turkish University are gratefully acknowledged for providing observed runoff data.
Conflicts of Interest
The authors declare no conflict of interest.
References
- Lioubimtseva, E.; Henebry, G. Climate and environmental change in arid Central Asia: Impacts, vulnerability, and adaptations. J. Arid Environ. 2009, 73, 963–977. [Google Scholar] [CrossRef]
- Micklin, P. The Aral Sea Disaster. Annu. Rev. Earth Planet. Sci. 2007, 35, 47–72. [Google Scholar] [CrossRef]
- Izhitskiy, A.S.; Zavialov, P.O.; Sapozhnikov, P.V.; Kirillin, G.B.; Grossart, H.P.; Kalinina, O.Y.; Zalota, A.K.; Goncharenko, I.V.; Kurbaniyazov, A.K. Present state of the Aral Sea: Diverging physical and biological characteristics of the residual basins. Sci. Rep. 2016, 6, 23906. [Google Scholar] [CrossRef] [PubMed]
- Zavialov, P.O.; Kostianoy, A.G.; Emelianov, S.V.; Ni, A.A.; Ishniyazov, D.; Khan, V.M.; Kudyshkin, T.V. Hydrographic survey in the dying Aral Sea. Geophys. Res. Lett. 2003, 30. [Google Scholar] [CrossRef]
- Raskin, P.; Hansen, E.; Zhu, Z.; Stavisky, D. Simulation of Water Supply and Demand in the Aral Sea Region. Water Int. 1992, 17, 55–67. [Google Scholar] [CrossRef]
- Zmijewski, K.; Becker, R. Estimating the Effects of Anthropogenic Modification on Water Balance in the Aral Sea Watershed Using GRACE: 2003–12. Earth Interact. 2014, 18, 1–16. [Google Scholar] [CrossRef]
- Immerzeel, W.W.; Bierkens, M.F.P. Asia’s water balance. Nat. Geosci. 2012, 5, 841–842. [Google Scholar] [CrossRef]
- Ayzel, G.; Izhitskiy, A. The Small Aral Sea Water Balance App. 2019. Available online: https://smashiproject.github.io/WB/ (accessed on 18 September 2019).
- Aus der Beek, T.; Voß, F.; Flörke, M. Modelling the impact of Global Change on the hydrological system of the Aral Sea basin. Phys. Chem. Earth Parts A/B/C 2011, 36, 684–695. [Google Scholar] [CrossRef]
- Lutz, A.; Droogers, P.; Immerzeel, W. Climate Change Impact and Adaptation on the Water Resources in the Amu Darya and Syr Darya River Basins; Report FutureWater; FutureWater: Wageningen, The Netherlands, 2012; Volume 31. [Google Scholar]
- Sorg, A.; Mosello, B.; Shalpykova, G.; Allan, A.; Hill Clarvis, M.; Stoffel, M. Coping with changing water resources: The case of the Syr Darya river basin in Central Asia. Environ. Sci. Policy 2014, 43, 68–77. [Google Scholar] [CrossRef]
- Chen, Y.; Li, W.; Fang, G.; Li, Z. Review article: Hydrological modeling in glacierized catchments of central Asia—Status and challenges. Hydrol. Earth Syst. Sci. 2017, 21, 669–684. [Google Scholar] [CrossRef]
- Gan, R.; Luo, Y.; Zuo, Q.; Sun, L. Effects of projected climate change on the glacier and runoff generation in the Naryn River Basin, Central Asia. J. Hydrol. 2015, 523, 240–251. [Google Scholar] [CrossRef]
- Hagg, W.; Braun, L.N.; Kuhn, M.; Nesgaard, T.I. Modelling of hydrological response to climate change in glacierized Central Asian catchments. J. Hydrol. 2007, 332, 40–53. [Google Scholar] [CrossRef]
- Lutz, A.; Droogers, P.; Immerzeel, W. Climate Change Impacts on the Upstream Water Resources of the Amu and Syr Darya River Basins; Report FutureWater; FutureWater: Wageningen, The Netherlands, 2012; Volume 31. [Google Scholar]
- Radchenko, I.; Dernedde, Y.; Mannig, B.; Frede, H.G.; Breuer, L. Climate change impacts on runoff in the Ferghana Valley (Central Asia). Water Resour. 2017, 44, 707–730. [Google Scholar] [CrossRef]
- Siegfried, T.; Bernauer, T.; Guiennet, R.; Sellars, S.; Robertson, A.W.; Mankin, J.; Bauer-Gottwein, P.; Yakovlev, A. Will climate change exacerbate water stress in Central Asia? Clim. Chang. 2012, 112, 881–899. [Google Scholar] [CrossRef]
- Shibuo, Y.; Jarsjö, J.; Destouni, G. Hydrological responses to climate change and irrigation in the Aral Sea drainage basin. Geophys. Res. Lett. 2007, 34, L21406. [Google Scholar] [CrossRef]
- Jarsjö, J.; Asokan, S.M.; Prieto, C.; Bring, A.; Destouni, G. Hydrological responses to climate change conditioned by historic alterations of land-use and water-use. Hydrol. Earth Syst. Sci. 2012, 16, 1335–1347. [Google Scholar] [CrossRef]
- Pereira-Cardenal, S.J.; Riegels, N.D.; Berry, P.A.M.; Smith, R.G.; Yakovlev, A.; Siegfried, T.U.; Bauer-Gottwein, P. Real-time remote sensing driven river basin modeling using radar altimetry. Hydrol. Earth Syst. Sci. 2011, 15, 241–254. [Google Scholar] [CrossRef]
- Ayzel, G.; Izhitskiy, A. Coupling physically based and data-driven models for assessing freshwater inflow into the Small Aral Sea. Proc. Int. Assoc. Hydrol. Sci. 2018, 379, 151–158. [Google Scholar] [CrossRef]
- Ayzel, G.V. Runoff Predictions in Ungauged Arctic Basins Using Conceptual Models Forced by Reanalysis Data. Water Resour. 2018, 45, 1–7. [Google Scholar] [CrossRef]
- Lange, S. Bias correction of surface downwelling longwave and shortwave radiation for the EWEMBI dataset. Earth Syst. Dyn. 2018, 9, 627–645. [Google Scholar] [CrossRef]
- Lange, S. EartH2Observe, WFDEI and ERA-Interim Data Merged and Bias-Corrected for ISIMIP (EWEMBI). V. 1.1. GFZ Data Services. 2019. Available online: http://dataservices.gfz-potsdam.de/pik/showshort.php?id=escidoc:3928916 (accessed on 18 September 2019). [CrossRef]
- Taylor, K.E.; Stouffer, R.J.; Meehl, G.A.; Taylor, K.E.; Stouffer, R.J.; Meehl, G.A. An Overview of CMIP5 and the Experiment Design. Bull. Am. Meteorol. Soc. 2012, 93, 485–498. [Google Scholar] [CrossRef]
- Frieler, K.; Lange, S.; Piontek, F.; Reyer, C.P.O.; Schewe, J.; Warszawski, L.; Zhao, F.; Chini, L.; Denvil, S.; Emanuel, K.; et al. Assessing the impacts of 1.5 °C global warming – simulation protocol of the Inter-Sectoral Impact Model Intercomparison Project (ISIMIP2b). Geosci. Model Dev. 2017, 10, 4321–4345. [Google Scholar] [CrossRef]
- Lange, S. Trend-preserving bias adjustment and statistical downscaling with ISIMIP3BASD (v1.0). Geosci. Model Dev. 2019, 12, 3055–3070. [Google Scholar] [CrossRef]
- Oudin, L.; Hervieu, F.; Michel, C.; Perrin, C.; Andréassian, V.; Anctil, F.; Loumagne, C. Which potential evapotranspiration input for a lumped rainfall-runoff model? Part 2—Towards a simple and efficient potential evapotranspiration model for rainfall-runoff modelling. J. Hydrol. 2005, 303, 290–306. [Google Scholar] [CrossRef]
- Lindström, G.; Johansson, B.; Persson, M.; Gardelin, M.; Bergström, S. Development and test of the distributed HBV-96 hydrological model. J. Hydrol. 1997, 201, 272–288. [Google Scholar] [CrossRef]
- Arsenault, R.; Brissette, F.; Martel, J.L. The hazards of split-sample validation in hydrological model calibration. J. Hydrol. 2018, 566, 346–362. [Google Scholar] [CrossRef]
- Beck, H.E.; van Dijk, A.I.J.M.; de Roo, A.; Miralles, D.G.; McVicar, T.R.; Schellekens, J.; Bruijnzeel, L.A. Global-scale regionalization of hydrologic model parameters. Water Resour. Res. 2016. [Google Scholar] [CrossRef]
- Storn, R.; Price, K. Differential Evolution—A Simple and Efficient Heuristic for global Optimization over Continuous Spaces. J. Glob. Optim. 1997, 11, 341–359. [Google Scholar] [CrossRef]
- Oudin, L.; Andréassian, V.; Perrin, C.; Michel, C.; Le Moine, N. Spatial proximity, physical similarity, regression and ungaged catchments: A comparison of regionalization approaches based on 913 French catchments. Water Resour. Res. 2008, 44. [Google Scholar] [CrossRef]
- Gudmundsson, L.; Seneviratne, S.I. Observation-based gridded runoff estimates for Europe (E-RUN version 1.1). Earth Syst. Sci. Data 2016, 8, 279–295. [Google Scholar] [CrossRef] [Green Version]
- Chen, T.; Guestrin, C. Xgboost: A scalable tree boosting system. In Proceedings of the 22nd ACM SIGKDD International Conference on Knowledge Discovery and Data Mining, San Francisco, CA, USA, 13–17 August 2016; Krishnapuram, B., Shah, M., Smola, A.J., Aggarwal, C.C., Shen, D., Rastogi, R., Eds.; ACM: New York, NY, USA, 2016; pp. 785–794. [Google Scholar] [CrossRef] [Green Version]
- Bogner, K.; Pappenberger, F.; Zappa, M. Machine Learning Techniques for Predicting the Energy Consumption/Production and Its Uncertainties Driven by Meteorological Observations and Forecasts. Sustainability 2019, 11, 3328. [Google Scholar] [CrossRef] [Green Version]
- Breiman, L. Classification and Regression Trees; Routledge: London, UK, 2017. [Google Scholar]
- Friedman, J.H. Greedy function approximation: A gradient boosting machine. Ann. Stat. 2001, 29, 1189–1232. [Google Scholar] [CrossRef]
- Natekin, A.; Knoll, A. Gradient boosting machines, a tutorial. Front. Neurorobot. 2013, 7, 21. [Google Scholar] [CrossRef] [PubMed] [Green Version]
- Hastie, T.; Tibshirani, R.; Friedman, J.; Franklin, J. The elements of statistical learning: Data mining, inference and prediction. Math. Intell. 2005, 27, 83–85. [Google Scholar]
- Nash, J.E.; Sutcliffe, J.V. River flow forecasting through conceptual models part I—A discussion of principles. J. Hydrol. 1970, 10, 282–290. [Google Scholar] [CrossRef]
- Gupta, H.V.; Kling, H.; Yilmaz, K.K.; Martinez, G.F. Decomposition of the mean squared error and NSE performance criteria: Implications for improving hydrological modelling. J. Hydrol. 2009, 377, 80–91. [Google Scholar] [CrossRef] [Green Version]
- Moriasi, D.N.; Arnold, J.G.; Van Liew, M.W.; Bingner, R.L.; Harmel, R.D.; Veith, T.L. Model evaluation guidelines for systematic quantification of accuracy in watershed simulations. Trans. ASABE 2007, 50, 885–900. [Google Scholar] [CrossRef]
- Kling, H.; Fuchs, M.; Paulin, M. Runoff conditions in the upper Danube basin under an ensemble of climate change scenarios. J. Hydrol. 2012, 424–425, 264–277. [Google Scholar] [CrossRef]
- Nezlin, N.P.; Kostianoy, A.G.; Lebedev, S.A. Interannual variations of the discharge of Amu Darya and Syr Darya estimated from global atmospheric precipitation. J. Mar. Syst. 2004, 47, 67–75. [Google Scholar] [CrossRef]
- Flato, G.; Marotzke, J.; Abiodun, B.; Braconnot, P.; Chou, S.C.; Collins, W.; Cox, P.; Driouech, F.; Emori, S.; Eyring, V.; et al. Evaluation of climate models. In Climate Change 2013: The Physical Science Basis. Contribution of Working Group I to the Fifth Assessment Report of the Intergovernmental Panel on Climate Change; Cambridge University Press: Cambridge, UK, 2013; pp. 741–866. [Google Scholar]
- Nasonova, O.N.; Gusev, Y.M.; Kovalev, E.E.; Ayzel, G.V. Climate change impact on streamflow in large-scale river basins: Projections and their uncertainties sourced from GCMs and RCP scenarios. Proc. Int. Assoc. Hydrol. Sci. 2018, 379, 139–144. [Google Scholar] [CrossRef]
- Gusev, Y.M.; Nasonova, O.N.; Kovalev, E.E.; Ayzel, G.V. Impact of possible climate changes on river runoff under different natural conditions. Proc. Int. Assoc. Hydrol. Sci. 2018, 379, 293–300. [Google Scholar] [CrossRef] [Green Version]
- Christensen, J.H.; Kanikicharla, K.K.; Marshall, G.; Turner, J. Climate phenomena and their relevance for future regional climate change. In Climate Change 2013: The Physical Science Basis. Contribution of Working Group I to the Fifth Assessment Report of the Intergovernmental Panel on Climate Change; Cambridge University Press: Cambridge, UK, 2013; pp. 1217–1308. [Google Scholar]
- Collins, M.; Knutti, R.; Arblaster, J.; Dufresne, J.L.; Fichefet, T.; Friedlingstein, P.; Gao, X.; Gutowski, W.J.; Johns, T.; Krinner, G.; et al. Long-term climate change: projections, commitments and irreversibility. In Climate Change 2013: The Physical Science Basis. Contribution of Working Group I to the Fifth Assessment Report of the Intergovernmental Panel on Climate Change; Cambridge University Press: Cambridge, UK, 2013; pp. 1029–1136. [Google Scholar]
Figure 1.
Study area. The Syr Darya River basin has been delineated into four zones to support the proposed modeling chain (Section 3.1): the single Zone of runoff Formation (FZ) and three Zones of runoff Transformation (TZ1, TZ2, TZ3).
Figure 1.
Study area. The Syr Darya River basin has been delineated into four zones to support the proposed modeling chain (Section 3.1): the single Zone of runoff Formation (FZ) and three Zones of runoff Transformation (TZ1, TZ2, TZ3).

Figure 2.
Flowchart of the modeling chain. The colored boxes in the bottom row of the figure represent the corresponding color code for the six blocks of the proposed modeling chain described in Section 3.1.
Figure 2.
Flowchart of the modeling chain. The colored boxes in the bottom row of the figure represent the corresponding color code for the six blocks of the proposed modeling chain described in Section 3.1.

Figure 3.
Results of HBV model calibration for 22 basins located in the runoff formation zone of the Syr Darya River basin. The boxplot box represents the Interquartile Range (, the difference between the the 25th and 75th quantiles); the whiskers represent from the 25th and 75th quantiles, respectively; the yellow line denotes the median value. KGE, Kling–Gupta Efficiency.

Figure 4.
Results of HBV model calibration for 22 basins located in the runoff formation zone of the Syr Darya River basin (HBV) in comparison with results of runoff estimates extracted from the developed gridded runoff reanalysis for the same basins (HBV-REG, Section 3.3). The boxplot box represents Interquartile Range (, the difference between the 25th and 75th quantiles); the whiskers represent from the 25th and 75th quantiles, respectively; the yellow line denotes the median value.

Figure 5.
Results of XGB model calibration and validation for the historical period (January 1994–June 2014).
Figure 5.
Results of XGB model calibration and validation for the historical period (January 1994–June 2014).

Figure 6.
Feature importance of input data variables showing their relative contribution to the XGB ability to predict freshwater inflow into the Small Aral Sea.
Figure 6.
Feature importance of input data variables showing their relative contribution to the XGB ability to predict freshwater inflow into the Small Aral Sea.

Figure 7.
Climatological annual hydrographs for the Syr Darya River at Kazalinsk for the period from 2007 to 2016.
Figure 7.
Climatological annual hydrographs for the Syr Darya River at Kazalinsk for the period from 2007 to 2016.

Figure 8.
Monthly runoff time series of the Syr Darya River at Kazalinsk calculated based on reference reanalysis data (EWEMBI) and GCM projection by MIROC5 under RCP2.6 scenario.
Figure 8.
Monthly runoff time series of the Syr Darya River at Kazalinsk calculated based on reference reanalysis data (EWEMBI) and GCM projection by MIROC5 under RCP2.6 scenario.

Figure 9.
Projected changes in annual hydrographs of the Syr Darya River at Kazalinsk. The simulations results of MIROC5 under RCP2.6 and RCP6.0, as well as IPSL-CM5A-LR under RCP6.0 are highlighted in grey as they reproduce the runoff changes for the historical Period (P0) (2007–2016) most reliably.

Figure 10.
The climatological mean of Mean Annual Runoff (MAR) of the Syr Darya River at Kazalinsk for the projection period P1–P3 (2017–2099). Dashed lines represent the mean annual runoff for the baseline period (P0; 2007–2016) calculated based on GCM projections under different RCP scenarios.
Figure 10.
The climatological mean of Mean Annual Runoff (MAR) of the Syr Darya River at Kazalinsk for the projection period P1–P3 (2017–2099). Dashed lines represent the mean annual runoff for the baseline period (P0; 2007–2016) calculated based on GCM projections under different RCP scenarios.

Figure 11.
Projected changes in intra-annual variation of the mean monthly air temperature in the runoff formation zone of the Syr Darya River basin.
Figure 11.
Projected changes in intra-annual variation of the mean monthly air temperature in the runoff formation zone of the Syr Darya River basin.

Figure 12.
Projected changes in intra-annual variation of the monthly sum of precipitation in the runoff formation zone of the Syr Darya River basin.
Figure 12.
Projected changes in intra-annual variation of the monthly sum of precipitation in the runoff formation zone of the Syr Darya River basin.

Figure 13.
Projected changes in annual hydrographs of the mean cumulative runoff from the runoff formation zone of the Syr Darya River basin. Only the simulation results based on MIROC5 and IPSL-CM5A-LR GCMs are shown as they are the most reliable for reproducing the runoff changes for the historical period (2007–2016).


Table 1.
NSE and KGE metrics calculated between the climatological annual hydrographs of different GCM driven runoff projections and the simulation based on the reference forcing (EWEMBI).
Table 1.
NSE and KGE metrics calculated between the climatological annual hydrographs of different GCM driven runoff projections and the simulation based on the reference forcing (EWEMBI).
| GCM and RCP | NSE | KGE |
|---|---|---|
| GFDL-ESM2M RCP2.6 | 0.12 | 0.51 |
| HadGEM2-ES RCP2.6 | 0.5 | 0.61 |
| IPSL-CM5A-LR RCP2.6 | 0.76 | 0.76 |
| MIROC5 RCP2.6 | 0.93 | 0.89 |
| GFDL-ESM2M RCP6.0 | 0.23 | 0.55 |
| HadGEM2-ES RCP6.0 | −0.43 | 0.36 |
| IPSL-CM5A-LR RCP6.0 | 0.91 | 0.89 |
| MIROC5 RCP6.0 | 0.87 | 0.79 |
| GFDL-ESM2M RCP8.5 | −0.21 | 0.43 |
| HadGEM2-ES RCP8.5 | 0.78 | 0.77 |
| IPSL-CM5A-LR RCP8.5 | 0.87 | 0.8 |
| MIROC5 RCP8.5 | 0.72 | 0.68 |
© 2019 by the authors. Licensee MDPI, Basel, Switzerland. This article is an open access article distributed under the terms and conditions of the Creative Commons Attribution (CC BY) license (http://creativecommons.org/licenses/by/4.0/).
Share and Cite
MDPI and ACS Style
Ayzel, G.; Izhitskiy, A. Climate Change Impact Assessment on Freshwater Inflow into the Small Aral Sea. Water 2019, 11, 2377. https://doi.org/10.3390/w11112377
AMA Style
Ayzel G, Izhitskiy A. Climate Change Impact Assessment on Freshwater Inflow into the Small Aral Sea. Water. 2019; 11(11):2377. https://doi.org/10.3390/w11112377
Chicago/Turabian StyleAyzel, Georgy, and Alexander Izhitskiy. 2019. "Climate Change Impact Assessment on Freshwater Inflow into the Small Aral Sea" Water 11, no. 11: 2377. https://doi.org/10.3390/w11112377
Note that from the first issue of 2016, this journal uses article numbers instead of page numbers. See further details here.