Urban Flood Hazard Modeling Using Self-Organizing Map Neural Network
by
 , , , ,
Omid Rahmati
1 ,
,
Hamid Darabi
2 ,
,
Ali Torabi Haghighi
2,
Stefanos Stefanidis
3,
Aiding Kornejady
4,
Omid Asadi Nalivan
4 and
Dieu Tien Bui
5,6,* 1
Soil Conservation and Watershed Management Research Department, Kurdistan Agricultural and Natural Resources Research and Education Center, AREEO, 6616936311 Sanandaj, Iran
2
Water, Energy and Environmental Engineering Research Unit, University of Oulu, 90570 Oulu, Finland
3
Laboratory of Mountainous Water Management and Control, Faculty of Forestry and Natural Environment, Aristotle University of Thessaloniki, 54124 Thessaloniki, Greece
4
Department of Watershed Management, Gorgan University of Agricultural Sciences and Natural Resources, 4918943464 Gorgan, Iran
5
Geographic Information Science Research Group, Ton Duc Thang University, 70000 Ho Chi Minh City, Vietnam
6
Faculty of Environment and Labour Safety, Ton Duc Thang University, 70000 Ho Chi Minh City, Vietnam
*
Author to whom correspondence should be addressed.
Water 2019, 11(11), 2370; https://doi.org/10.3390/w11112370
Submission received: 20 August 2019
/
Revised: 21 October 2019
/
Accepted: 8 November 2019
/
Published: 12 November 2019
(This article belongs to the Special Issue Flash Floods in Urban Areas)
Abstract
:Floods are the most common natural disaster globally and lead to severe damage, especially in urban environments. This study evaluated the efficiency of a self-organizing map neural network (SOMN) algorithm for urban flood hazard mapping in the case of Amol city, Iran. First, a flood inventory database was prepared using field survey data covering 118 flooded points. A 70:30 data ratio was applied for training and validation purposes. Six factors (elevation, slope percent, distance from river, distance from channel, curve number, and precipitation) were selected as predictor variables. After building the model, the odds ratio skill score (ORSS), efficiency (E), true skill statistic (TSS), and the area under the receiver operating characteristic curve (AUC-ROC) were used as evaluation metrics to scrutinize the goodness-of-fit and predictive performance of the model. The results indicated that the SOMN model performed excellently in modeling flood hazard in both the training (AUC = 0.946, E = 0.849, TSS = 0.716, ORSS = 0.954) and validation (AUC = 0.924, E = 0.857, TSS = 0.714, ORSS = 0.945) steps. The model identified around 23% of the Amol city area as being in high or very high flood risk classes that need to be carefully managed. Overall, the results demonstrate that the SOMN model can be used for flood hazard mapping in urban environments and can provide valuable insights about flood risk management.
Keywords:
environmental modeling; urban flood; self-organizing map; neural network; GIS; Amol city; Iran
1. Introduction
Urban environments are vulnerable to flood damages due to the density of economic and social assets and amount of infrastructure, and there is increasing attention to implementing flood risk reduction measures. Flood impacts can be mitigated by improved prediction, awareness (early warning), and mapping. In flood studies, it has been widely accepted that absolute flood protection is impossible. Instead, growing attention has been given to the spatial prediction of flood risk. Future flood consequences can be limited through risk assessment and flood management measures such as changes in building codes and land uses, improved flood defenses, selective relocation of vulnerable assets, insurance policies, and emergency preparedness [1,2]. Importantly, flood inundation models play a central role in prediction planning and the implementation of these measures in high-risk zones [3]. However, complexities in the urban areas and their drainage infrastructures have an inherent influence on surface runoff and flood inundation, which poses challenges for modeling urban flood risk [2,4].
Since ancient times, many settlements have been established along rivers and lake banks, exploiting the advantages of these locations for agriculture, livestock, farming, and transport. However, the proximity of these sites to rivers increases the probability of damage due to extreme flood events. Floods are the most common and widespread weather-related natural hazard, e.g., affecting approximately 1.5 billion people worldwide in the last decade of the 20th century [5]. Floods have both environmental and economic consequences since they can cause damage to urban areas and agricultural land and can even result in loss of life [3,6].
The global urban population has increased rapidly in recent decades. In parallel, the rate of urbanization is increasing, and it is predicted that by the end of the 21st century, two-thirds of the world’s population will live in urban areas [7,8]. This global rapid urban population growth trend is associated with accelerating urban sprawl, which is associated with some adverse effects on the environment and natural resources. These effects include land-use changes that increase the runoff coefficient and peak discharge [9,10,11], and inappropriate artificial activities can escalate the frequency, intensity, and magnitude of flood events in city centers and aggravate their aftermath [12,13,14]. Furthermore, the Fifth Assessment Report of the Intergovernmental Panel on Climate Change (IPCC) predicts that more severe extreme rainfall events will lead to more frequent flooding in the future [15]. Therefore, stakeholders and policymakers have to introduce appropriate infrastructure projects for flood mitigation, especially in urban areas to protect crucial infrastructures such as schools and hospitals. The development of early warning systems and hazard zonation is essential for sustainable development and city planning. However, due to the complexities of urban environments, urban flood modeling and the prediction of flood-prone areas face many challenges [16].
During recent years, several different types of models have been used for flood hazard mapping in urban areas. Geographic information system (GIS)-based multi-criteria decision analysis tools, such as analytic hierarchy process, have been used for flood hazard zonation in Tucumán Province, Argentina [17], Eldoret Municipality, Kenya [2], and Palilula municipality, Serbia [18]. A combination of hydraulic and hydrological models, e.g., HEC-RAS and the Watershed Modeling System (WMS), has been used for flood mapping in Volos City, Greece [19] and Tabuk City, Saudi Arabia [20]. The latest research is using machine learning models to predict urban flood inundation. Darabi et al. (2019) [21] used two state-of-the-art machine learning models (GARP and QUEST) for flood risk mapping in Sari city, Iran. Weakly labeled support vector machine (WELLSVM) has been used to assess urban flood susceptibility in Beijing, China [22,23,24]. One of the challenges in urban flood studies is that the number of predictors is limited, and there is no hydrometric station to record runoff and discharge [25,26]. Therefore, most models cannot be used directly in data-scarce environments, such as in developing countries where data availability is still a major challenge [27]. Machine learning models help researchers to cope with this problem and predict urban flood inundation, which is the why the use of machine learning algorithms has been increasing in recent years.
Self-organizing map neural network (SOMN) is a popular neural network algorithm that has been widely used in different hydrological and environmental subfields [28,29,30]. It can preserve the intrinsic topology of the data. The SOMN projections offer a valuable computational tool that can facilitate information extraction from multidimensional data and the identification of relationships between variables by the topological ordering of representation of input space. They are useful for visualization by creating low-dimensional views of high-dimensional data, akin to multidimensional scaling. However, the SOMN approach has not yet been applied in urban flood hazard assessment. This study evaluated the performance of the SOMN algorithm for urban flood hazard mapping. Two statistical evaluation metrics, namely true skills statistics (TSS) and area under the receiver operating characteristic curve (AUC-ROC) were used to determine the goodness-of-fit and predictive performance of the SOMN algorithm.
2. Materials and Methods
2.1. Description of the Study Area
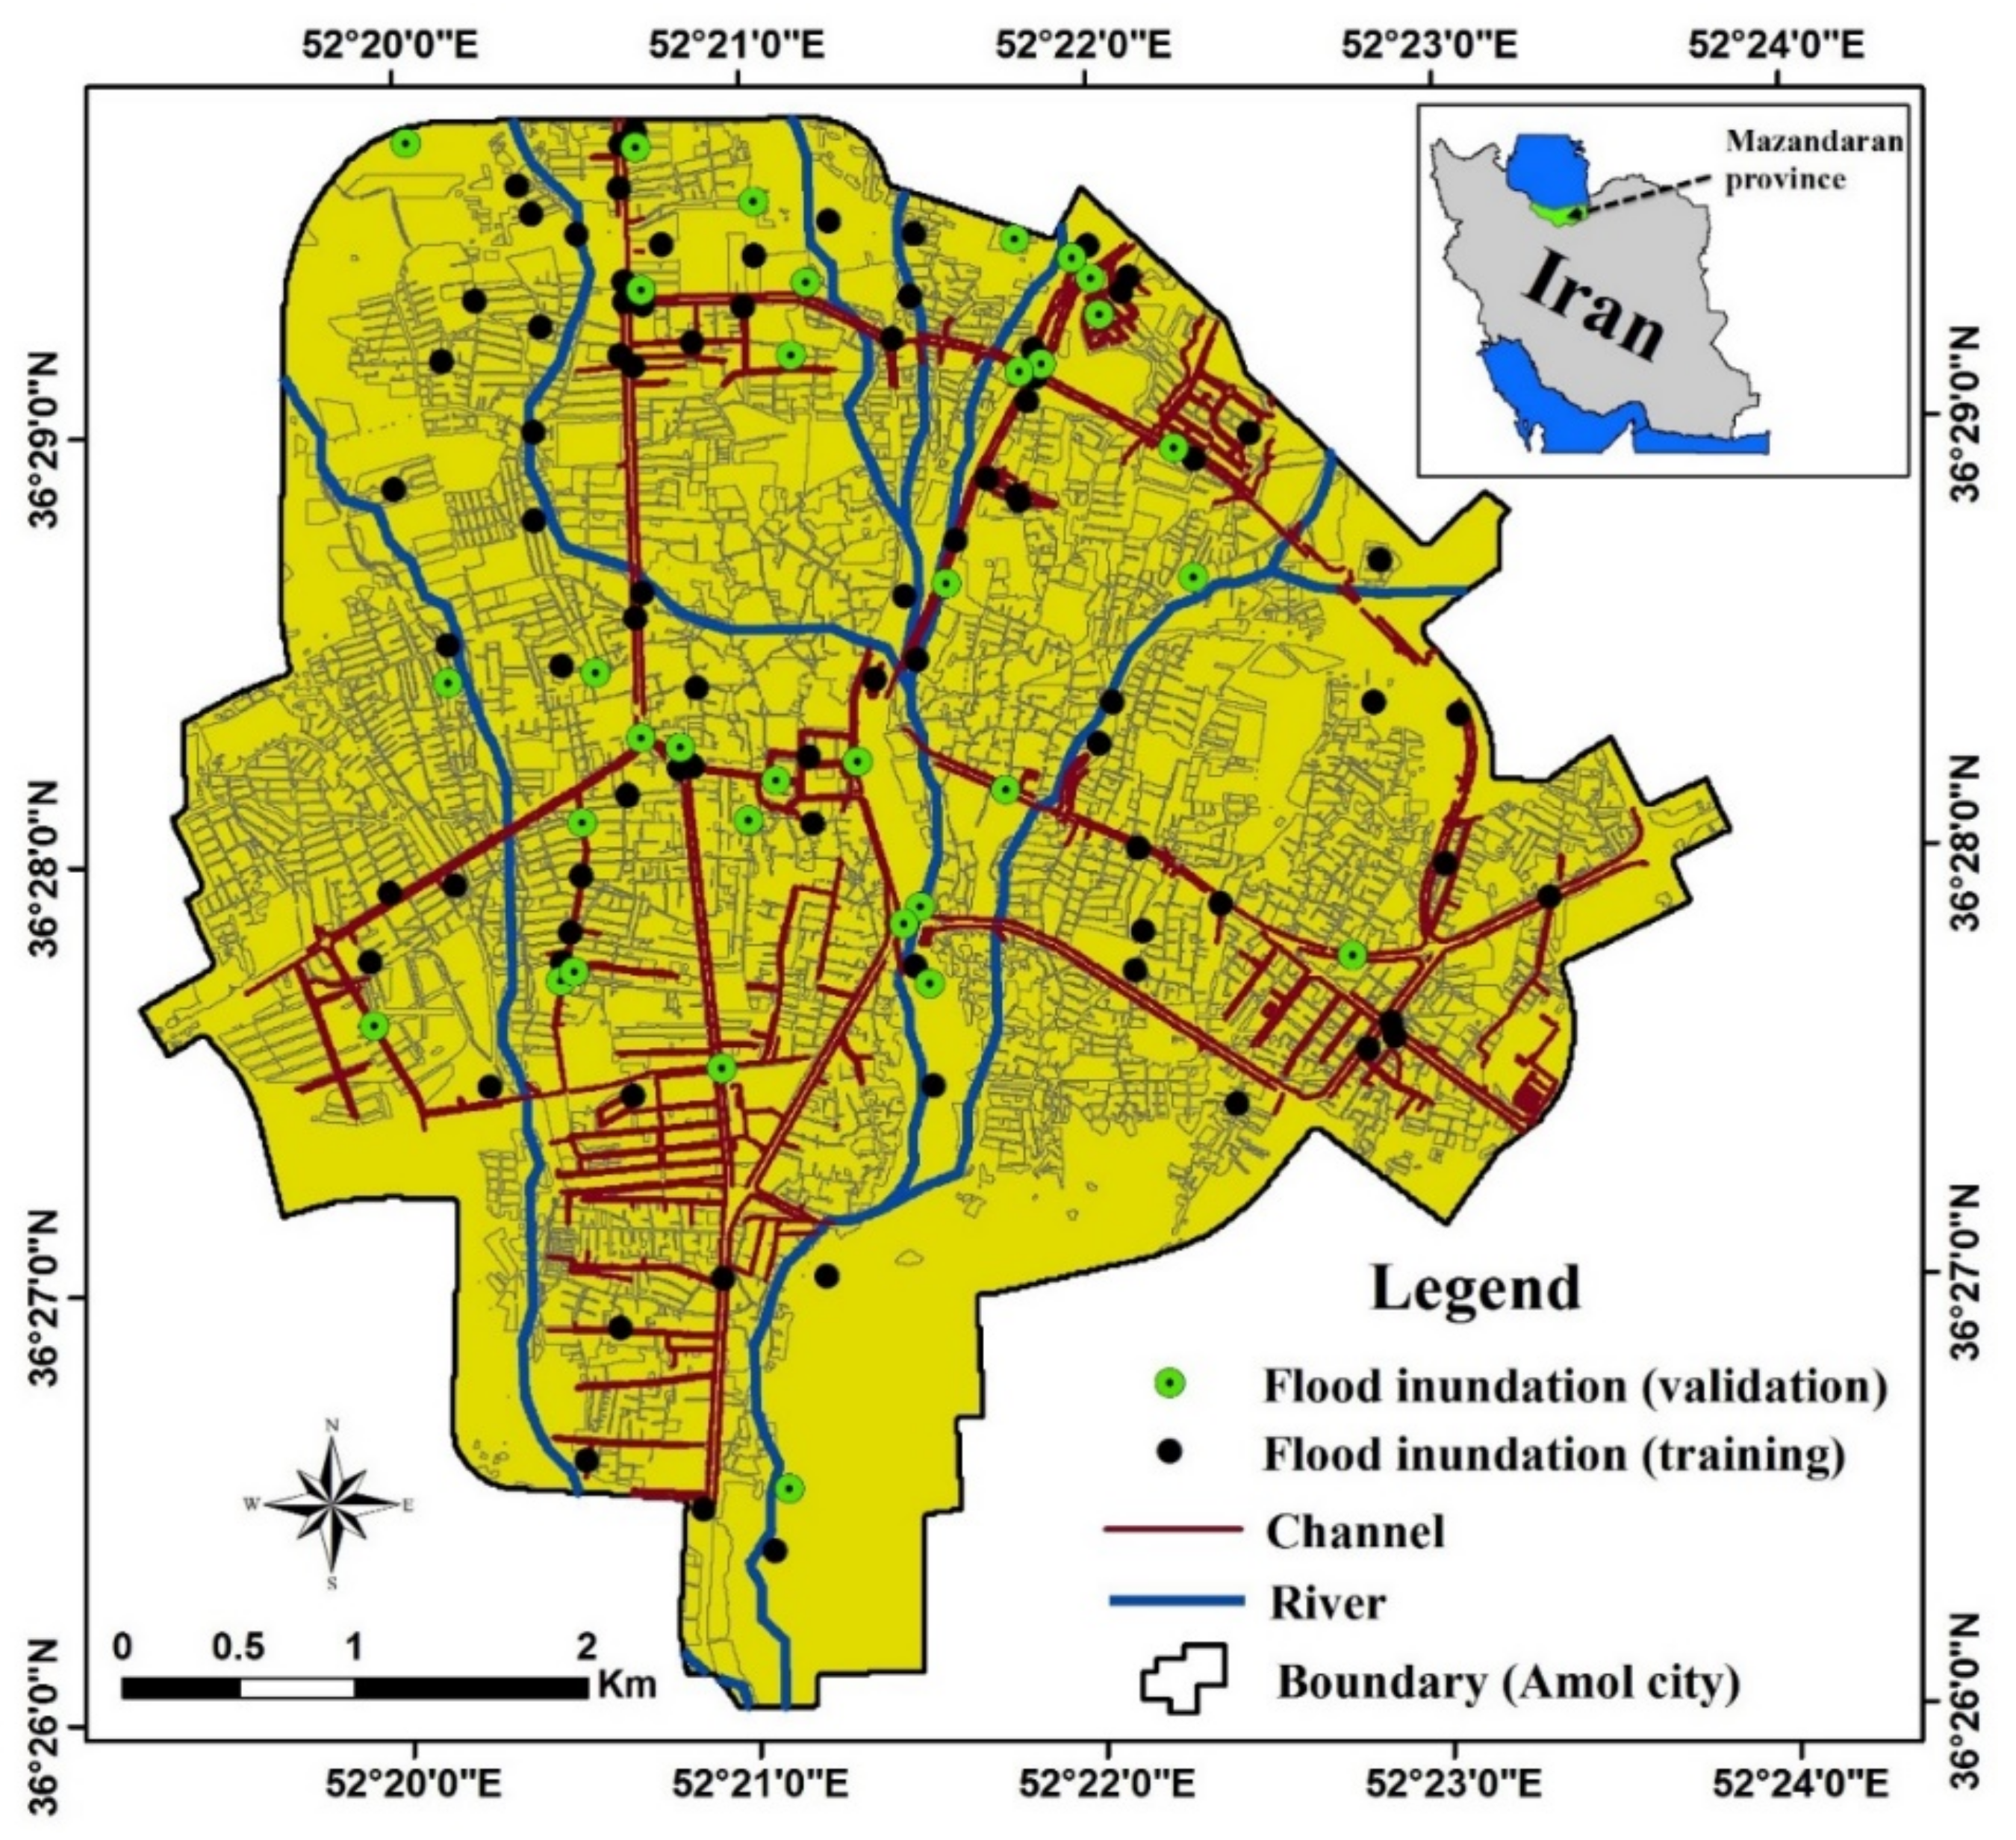
The city of Amol in Mazandaran province in northern Iran (36°26′–36°29′ N; 52°19′–53°23′ E) was selected as the study site (Figure 1). Amol is an old city with a population of 237,528 in 2017, making it the third-largest city in Mazandaran province [31]. It is located at an altitude of 59–137 m above sea level (a.s.l.), and it occupies an area of 27 km2, based on Landsat data for 2017. Amol lies on the Mazandaran plain, along the banks of the river Haraz, and it is surrounded mainly by agricultural land to the north, east, and west of the city and high mountains covered by forest to the south. The mean annual precipitation in Amol city is 680 mm. Over recent decades, there has been considerable urbanization in the region, and the changes in land use associated with this urbanization are affecting the risk of flooding in the city. The degradation of vegetation increases in impervious surface, and inadequate drainage networks are increasing surface runoff from precipitation, leading to extensive changes in hydrological processes affecting Amol city [32].
2.2. Methodology
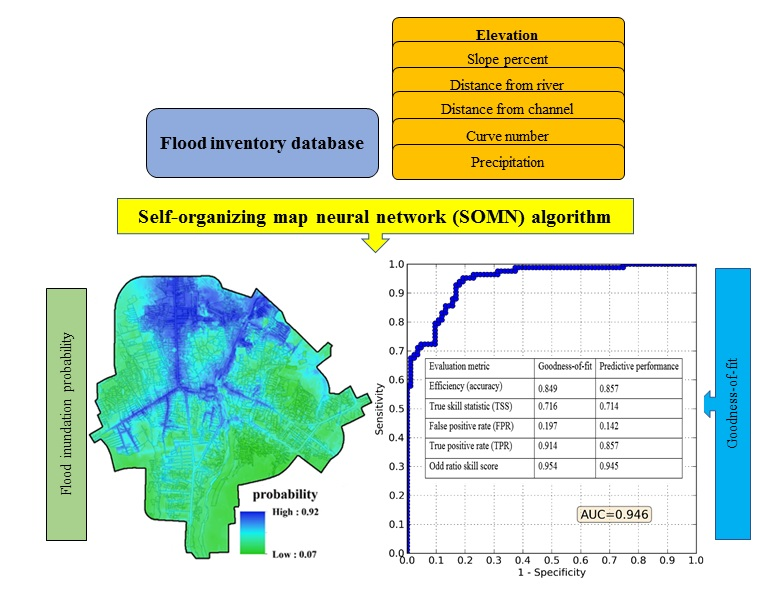
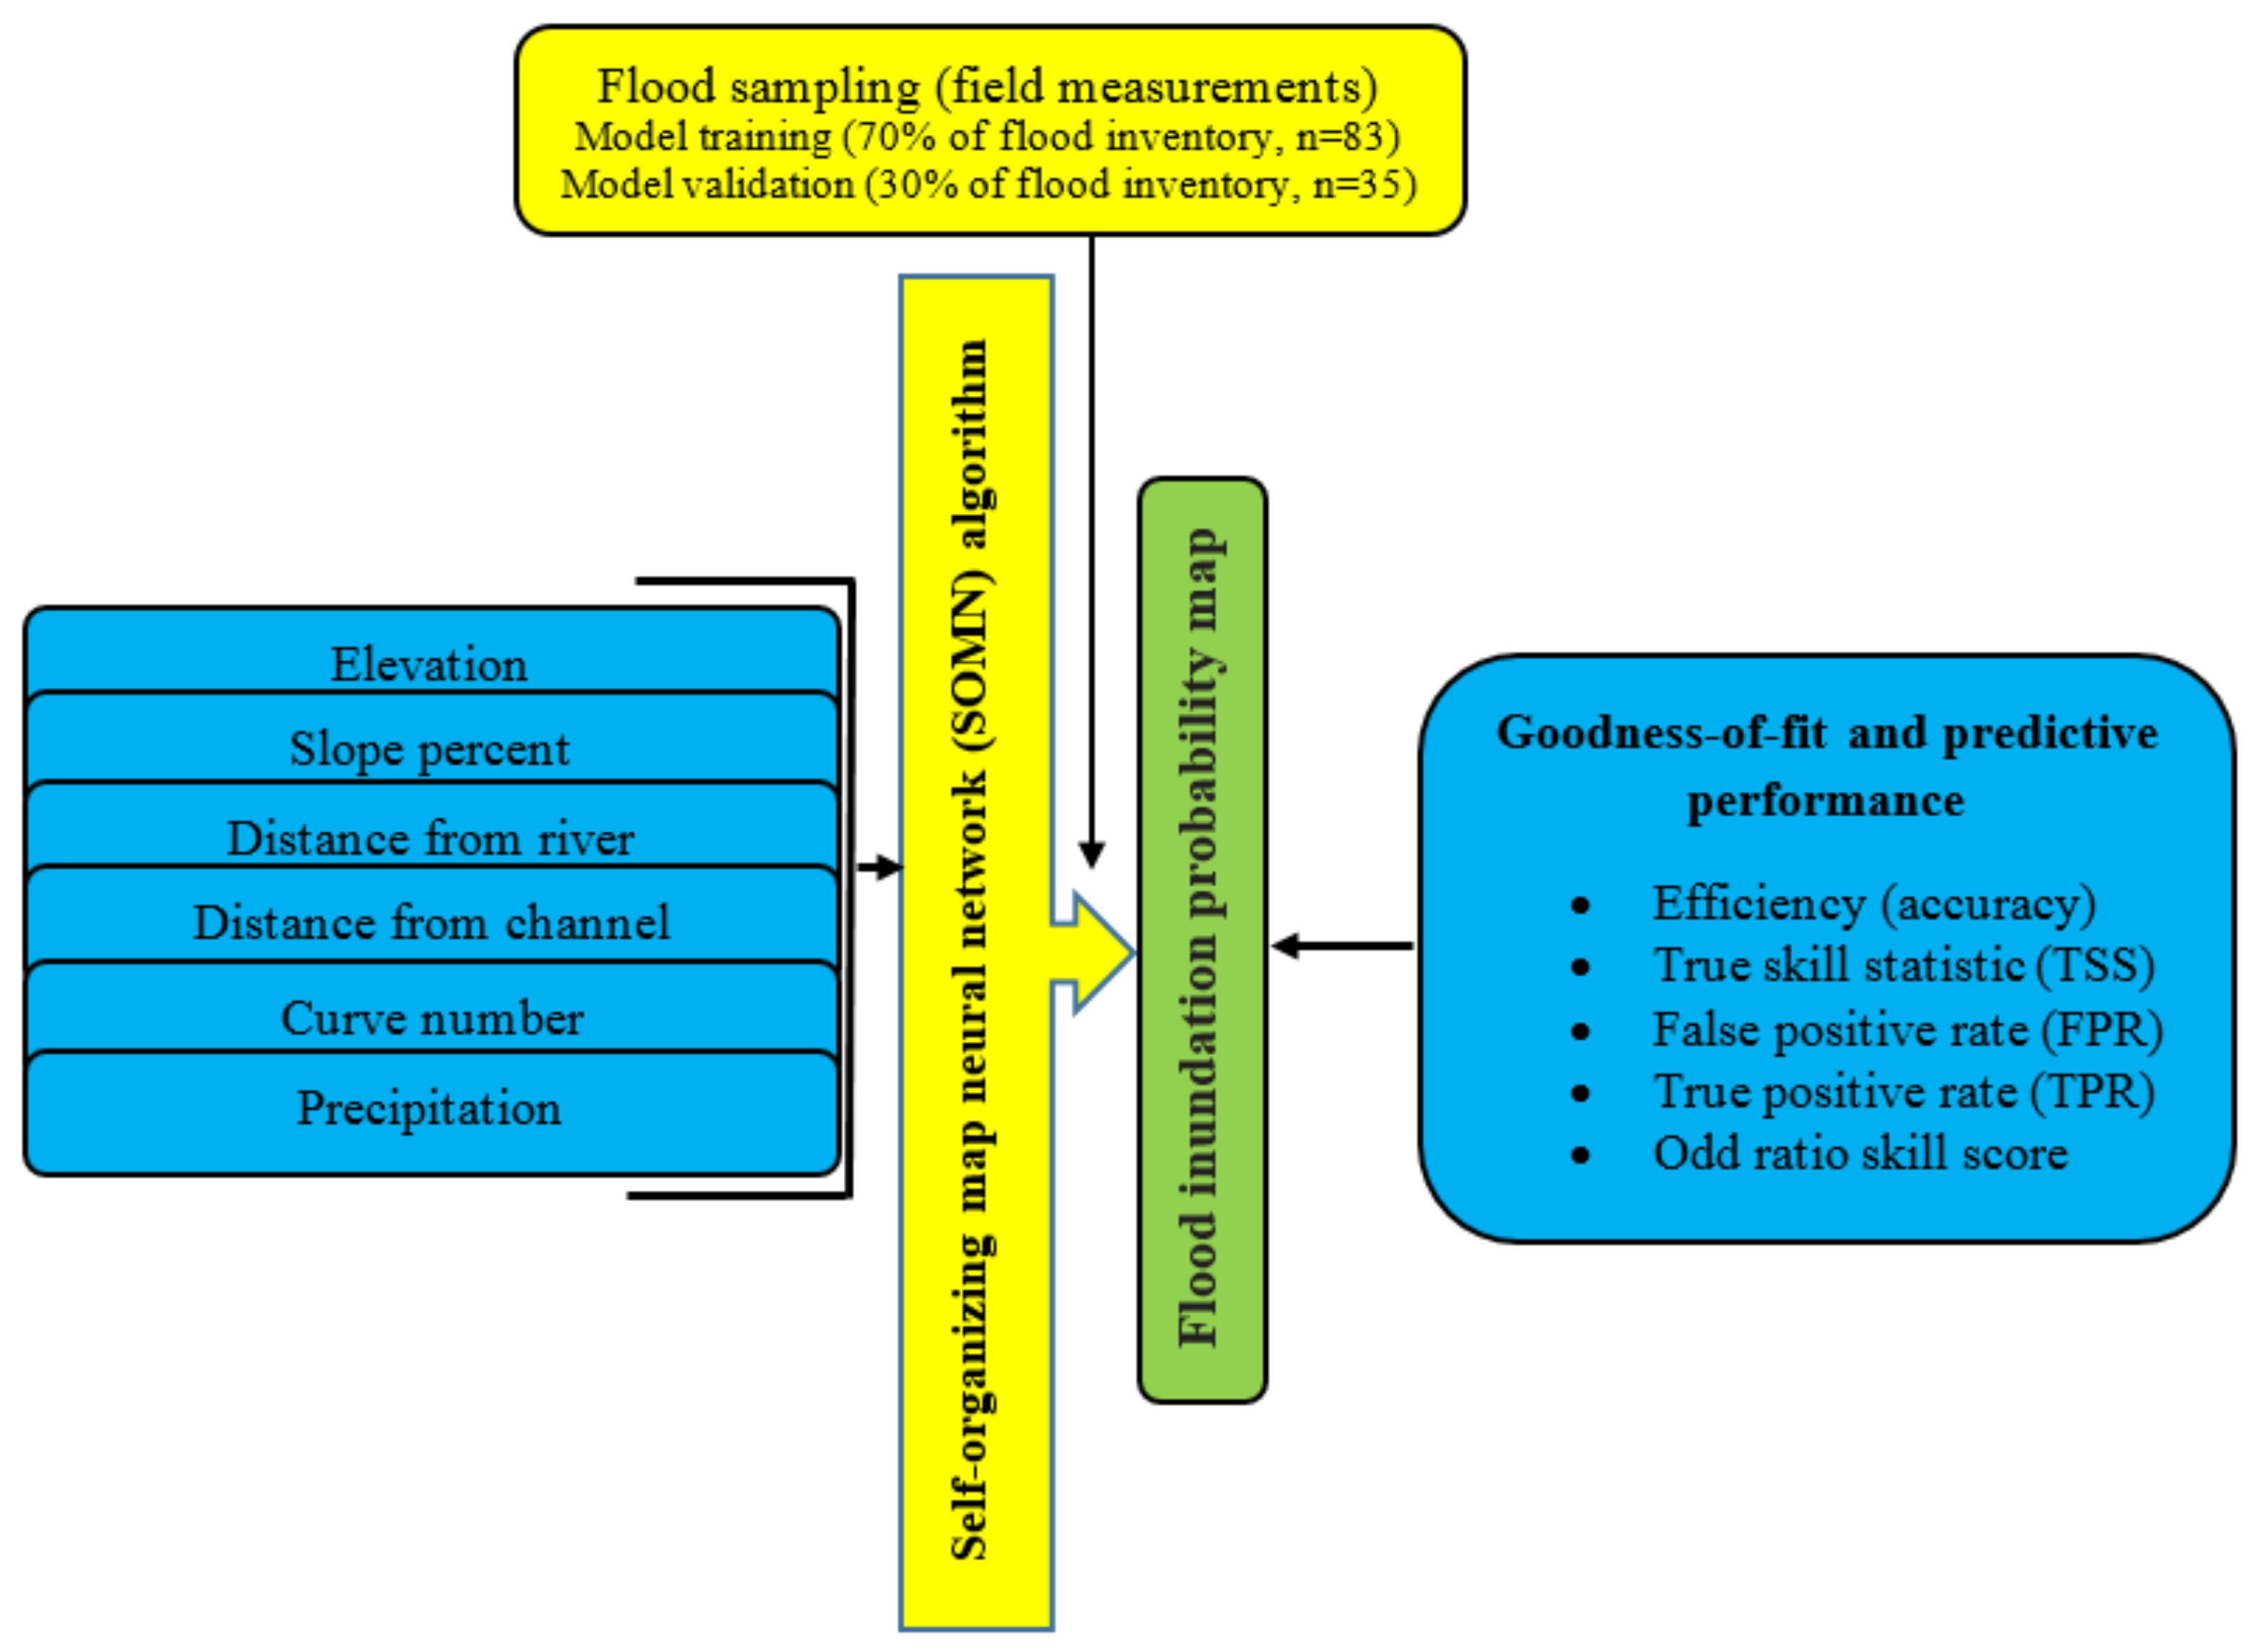
A flowchart of the work is presented in Figure 2.
2.2.1. Urban Flood Inventory
The main reason for flood inundation is related to rainfall over the city. Water flows from the areas with higher elevation and joins in lower terrain in the rivers and channels. However, rivers and channels that are across the city have limited capacity for flood. Consequently, areas near rivers and channels are at risk of flooding. Flooded locations in Amol city were identified based on an inventory of inundated areas during the heavy rainfall in 2018–2019, a field survey using GPS (Garmin 76cx; Garmin, Olathe, Kansas, USA), and historical flood inundation data (Figure 1). These points served as dependent variables for prediction models. Since the input data included an inventory showing areas under flooding during flood events, a flood inventory with a point base map as the dependent variable was considered in the analysis, with each point referring to an actual previously inundated area in Amol city. Only one point was mapped per each flooded area to reduce the effect of spatial autocorrelation between observations (especially when some points are considered for a flooded area), and to avoid uncertainties in mapping flooded boundaries. In preparation of the flood hazard map, we selected 118 flooded points (i.e., flood inundation inventory), which were divided into two groups: model training data (70% of flood inventory, n = 83) and model validation data (30% of flood inventory, n = 35). According to the literature, a 1:1 sampling strategy of presence to absence of floods was applied. Therefore, 118 non-flooded locations were randomly selected in flood-free areas [21,25]. Similar to the flood inundation inventory, non-flooded locations were randomly split into two groups: model training data (70% of non-flooded locations, n = 83) and model validation data (30% of non-flooded locations, n = 35).
2.2.2. Factors Influencing Urban Flood Inundation
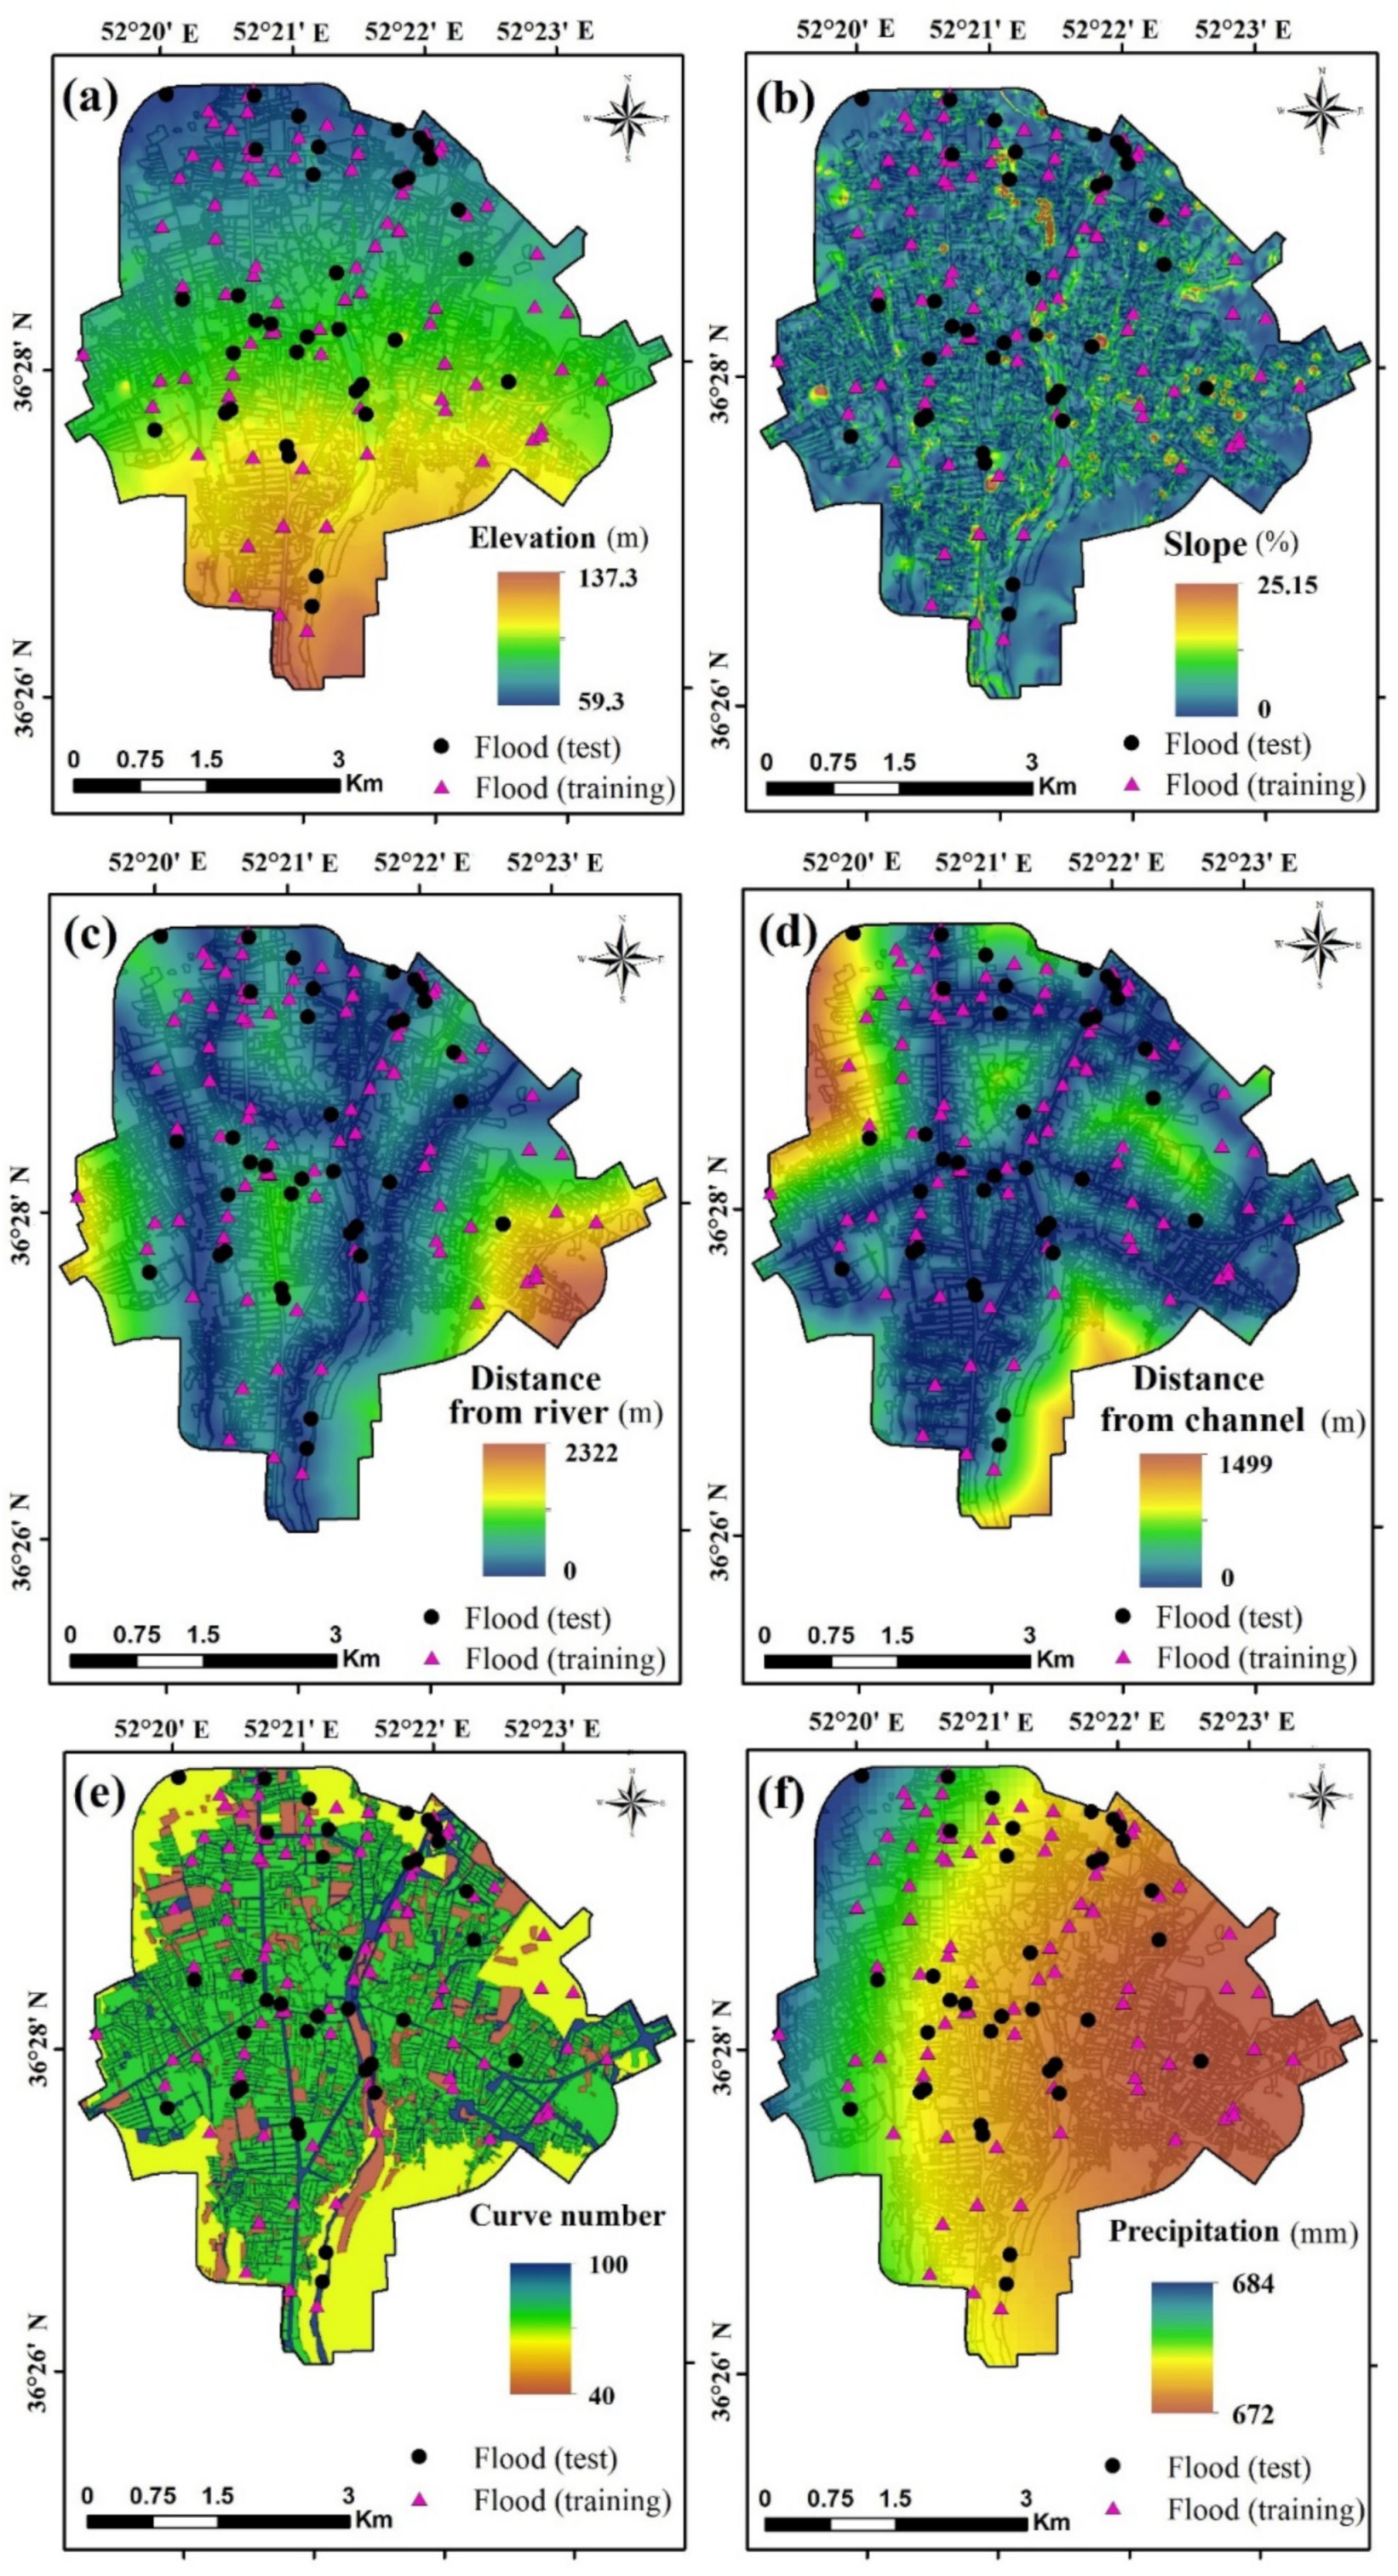
There are no universal guidelines for selecting flood conditioning factors in urban areas. In this study, six factors were used as input to the model in order to map urban flood susceptibility, with factor selection based on the literature [14,21,33]. These factors were elevation, slope percent, distance from river, and distance from channel, curve number, and precipitation.
A digital elevation model (DEM) with a resolution of 5 m was obtained from Amol city authority (Figure 3a). It confirmed that the study area could be characterized as lowland, with elevation ranging from 59.3 to 137.3 m a.s.l.
The slope percent factor plays a major role in flooding, as it affects the water velocity. In addition, flatlands or lowlands have gentle slopes that represent a constant threat of flooding [4,34,35,36]. The slope map was extracted from the DEM of the study area in ArcGIS 10.3 (ESRI, Redlands, California, USA) to quantify topographical controls on hydrological processes. It was found that the slope varies from more than 25% in the north to <1% in the south and west of the study area (Figure 3b). The distance to the river (Figure 3c) plays an important role in urban flood mapping as nearby areas are more affected by flooding. Distance from a channel (Figure 3d) strongly influences runoff conditions, as channels or drainage systems in urban environments collect surface water. Distance from a river and distance from a channel were calculated using the Euclidean Distance module in ArcGIS 10.3 and were estimated to range from 0 to 2322 m and from 0 to 1499 m, respectively. Curve number (CN), a parameter developed by the United States Soil Conservation Service (USCS), is a function of land-use treatments and hydrological conditions, antecedent soil moisture, and soil type. Land-use and hydrologic soil group (HSG) maps were used here to estimate the contribution of rainfall to runoff. The CN map for the study area (Figure 3e) was extracted based on the land-use map, the HSG map, and a lumped CN value, using the ArcCN-runoff tool in ArcGIS software [15]. As shown in Figure 3e, CN takes values from 40 to 100. Different CN classes were given corresponding codes, with larger values indicating stronger runoff generation capability. The annual rainfall data of 15 rainfall gauges (including Alasht, Amol, Babolsar, Baladeh, Bandar-E-Amirabad, Galugah, Gharakhil, Kiyasar, Kajur, Noshahr, Polsefid, Ramsar, Sari, Dashte-E-Naz, and Siahbisheh) were obtained from the Iranian Meteorological Organization (IRIMO) to produce a mean annual precipitation map. The recorded annual precipitation varies from 672 mm in the east of the study area to 674 mm in the west (Figure 3f).
2.2.3. Application of the SOMN Algorithm
The SOMN algorithm was first developed by Kohonen (1997) [37] and has been employed in diverse areas of research such as hydrological studies and the definition of hydrological homogenous regions [38,39]. With the SOMN method, it is not necessary to have knowledge about the relationships that exist among input and target variables. This fact helps the modeler to predict target variables in sets of data with unknown relationships. The model applies a topology-preserving transform from input variables with numerous dimensions and a sophisticated nature to a plain output layer [40]. Since SOMN is capable of mapping highly nonlinear high-dimensional input space in lower-dimensional spaces (i.e., usually one or two dimensions), it is commonly also used to visualize a high-dimensional space. For large-scale datasets, it is necessary to reduce dimensionality to the point where further analysis and exploration seems impossible or does not result in new insights. Therefore, since ‘‘dimension reduction of a multivariate dataset’’ is one of the advantages of SOMN, it can be highly effective at providing a reduced-dimension representation for spatial modeling of flood inundation. The Euclidean Distance (ED) module is used to specify the weight of the variables [39]. SOMN calculates the ED among the input cells, f, and neurons, M, and looks for the winning neuron (WN) through application of the nearest neighbor rule. The ED is calculated as:
where , , = the ith component of the pth input vector xp, and wjk,i = the weight link of and the neuron located at (j,k) of the Kohonen layer.
The WN (M) is calculated as:
The SOMN updates the weight vector of the unit i using the so-called “self-organization” learning rule as:
where t denotes time, a(t) is the learning rate and ranges between [0,1], and hci(rjk(t)) is the neighborhood kernel around the winner unit c with a neighborhood distance rjk(t). If a small learning rate is taken, the model will take a very long time to converge. On the other hand, if the learning rate is large, the model may oscillate and result in unstable learning, because it may step over a minimum. In this study, a constant value of 0.6 was selected for a(t) based on a trade-off between speed and accuracy. The process of modeling is repeated until the maximum number of iterations (tmax) is reached or the change in the weight magnitudes is less than the specified threshold.
SOMN selects accidental amounts for the initial weights. Then, it looks for the WN by employing the ED. The neuron that has the highest similarity to the input is chosen as the WN in this stage. Finally, SOMN tunes the weights of the WN considering the input vector [25]. This variation diminishes with the distance of the weights to the WN. The procedure is continued for a huge number of cycles to achieve a condition where the layer is unfolded.
The SOMN includes two phases, coarse-tuning (also termed rough-tuning) and fine-tuning [39]. The former is an unsupervised clustering learning process, while the latter is ‘‘learning vector quantization (LVQ)’’ based on the former phase. LVQ can be categorized as a supervised learning process [40]. LVQ implements information for the input set to tune the weight of the output maps. The main stages of the SOMN are explained below. In this study, the SOMN model was run for 20,000 training iterations (i.e., 10,000 iterations each in the rough-tuning and fine-training phases).
2.2.4. Accuracy Assessment
Performance assessment of the models is based on a confusion matrix, from which a variety of performance metrics can be derived. True positive (TP), true negative (TN), false positive (FP), and false negative (FN) are the main four elements of the confusion matrix. True positive and true negative indicate, respectively, the probability of correctly predicting presences (i.e., flooded areas) and absences (i.e., non-flooded areas) as observed in nature. Conversely, false positive and false negative indicate, respectively, the probability of incorrectly predicting true absences as presences (i.e., incorrectly predicting a non-flooded location as flooded) and true presences as absences. Formulating these four elements in different conjunction modes produces two main categories of performance metrics: cutoff-dependent and cutoff-independent [41]. The former relies on a predefined threshold value, based on which the final susceptibility map is categorized into two parts: high susceptibility and low susceptibility. By doing so, a variety of cutoff-dependent metrics can be calculated, each addressing different aspects of model behavior. From the different cutoff-dependent metrics, we selected five, namely the true positive rate (TPR), false positive rate (FPR), odds ratio skill score (ORSS), efficiency, and true skill statistic (TSS). Cutoff-independent metrics, as their name implies, are cutoff-invariant and are able to indicate the overall performance of a model. Among these, the receiver operating characteristic (ROC) is a widely used informative curve under which an area (AUC), ranging from 0.5 to 1, is calculated. The closer the AUC value is to 1, the better the performance of the model. The methodological details of the metrics used here are described below.
TPR (also known as recall or sensitivity) and FPR (also known as fall out or 1–specificity) are calculated as:
Efficiency, also termed as overall accuracy, represents the overall success of the predictive model [11], and is calculated as:
The ORSS metric is the odds ratio rescaled into −1 and +1. The odds ratio describes the odds of true prediction to the odds of false prediction [42] and is considered a useful metric for rare events [41]. Higher values of ORSS indicate that the model is inclined toward true predictions. The ORSS metric is calculated as:
The TSS metric indicates the ability of a model to distinguish between the presence and absence localities [43] and is calculated as:
The ROC curve, as the overall performance indicator of a model, is drawn by plotting 1–specificity on the x-axis against sensitivity on the y-axis [44]. An AUC value of 0.5 indicates randomly driven results, while a value of 1 represents a perfect model. In this study, all the metrics listed above were calculated in two steps: training and validation. The performance results in the training stage represent the goodness-of-fit of the models, whereas those in the validation stage indicate the prediction power of the models. All performance assessments were carried out using the PMT (Performance Measure Tool) tool in ArcGIS 10.3 [11].
3. Results and Discussion
3.1. Urban Flood Hazard Map
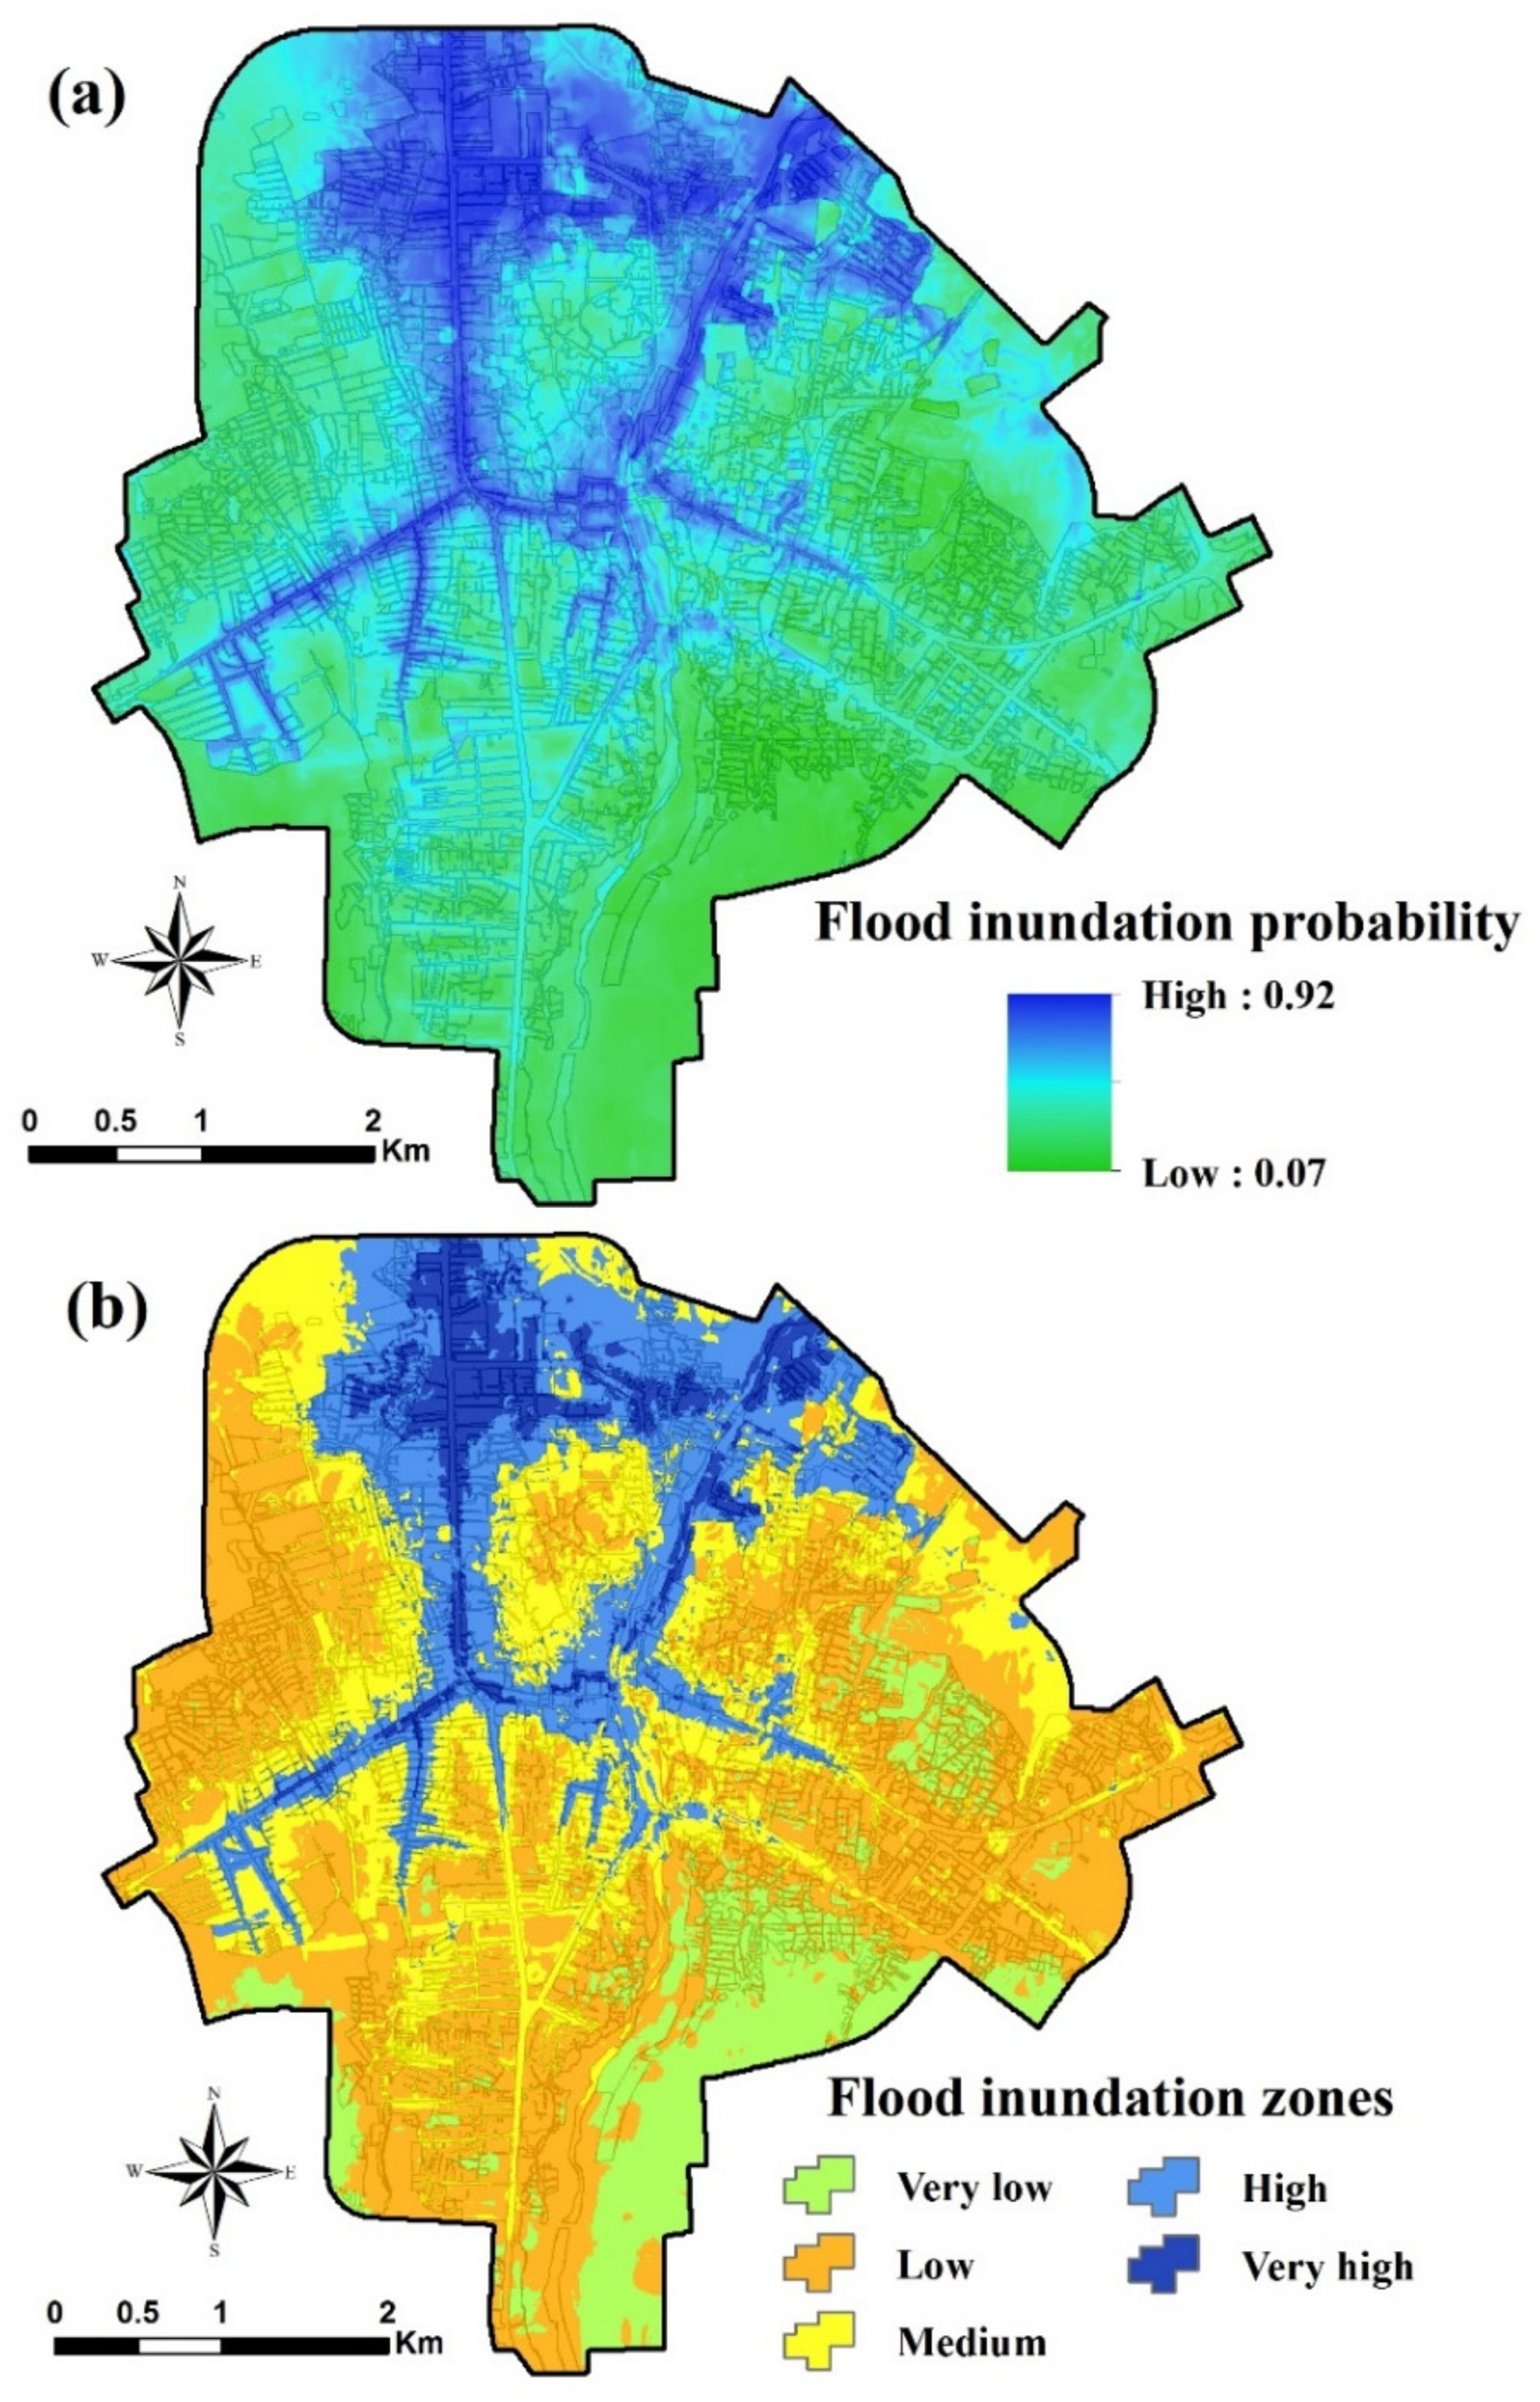
The SOMN model produced a flood hazard map for Amol city by considering the point base data and independent variables that show flood inundation probability (Figure 4a). In fact, flood inundation probability refers to the probability of the flood occurrence of each pixel over the city which is extracted based on observation flood data and conditioning factors using the SOMN model in the current study. In order to simplify the interpretation of the results, the flood hazard map was reclassified into five classes: very low (0–0.2), low (0.2–0.4), medium (0.4–0.6), high (0.6–0.8), and very high (0.8–1) (Figure 4b). This flood hazard zonation map demonstrated the high spatial heterogeneity of the city’s urban areas and described more precise details, based on the accuracy results. It indicated regions with high and low flood inundation probability. The areas with high flood inundation probability were located in the north, and some were located in the center of Amol city, with low flood inundation probability areas mostly located in the east, south, and also west of the study area. Based on the flood inventory and field survey, zones with the highest (0.92) and lowest (0.07) flood inundation probability were successfully identified by the SOMN model.
The flood inundation probability map as a flood hazard map was classified into the following five classes, using the equal interval classification method in ArcGIS 10.5: very low, low, moderate, high, and very high zones, occupying 11.2%, 39.7%, 25.9%, 17.4%, and 5.8% of the study area, respectively. Due to extreme rainfall intensity in Amol city, in addition to the flooding and demolition of some houses, primary schools in the city were damaged during recent flood events, and children were put at risk. The SOMN model successfully identified the high flood inundation probability and confirmed the urban flooding records. The results showed that Navid, Mustafa, and Forooghdanesh primary schools, Ahmadi high school, and the Technical Training Center of Shahid Madani are at high probability of flood inundation.
With increasing intensity and frequency of floods in recent decades, accompanied by high urban densities and loss of soil infiltration areas, flooding is causing high economic losses in Iran, and flood management has become a severe urban challenge. Sustainable development for urban flood planning involves managing drainage systems, sewer networks, and permeable surfaces, and also land use. It could give economic and social benefits, prevent environmental damage to cities, and enhance economic, social, and environment sustainable development, working toward a higher quality of urban future.
3.2. Goodness-of-Fit and Predictive Performance
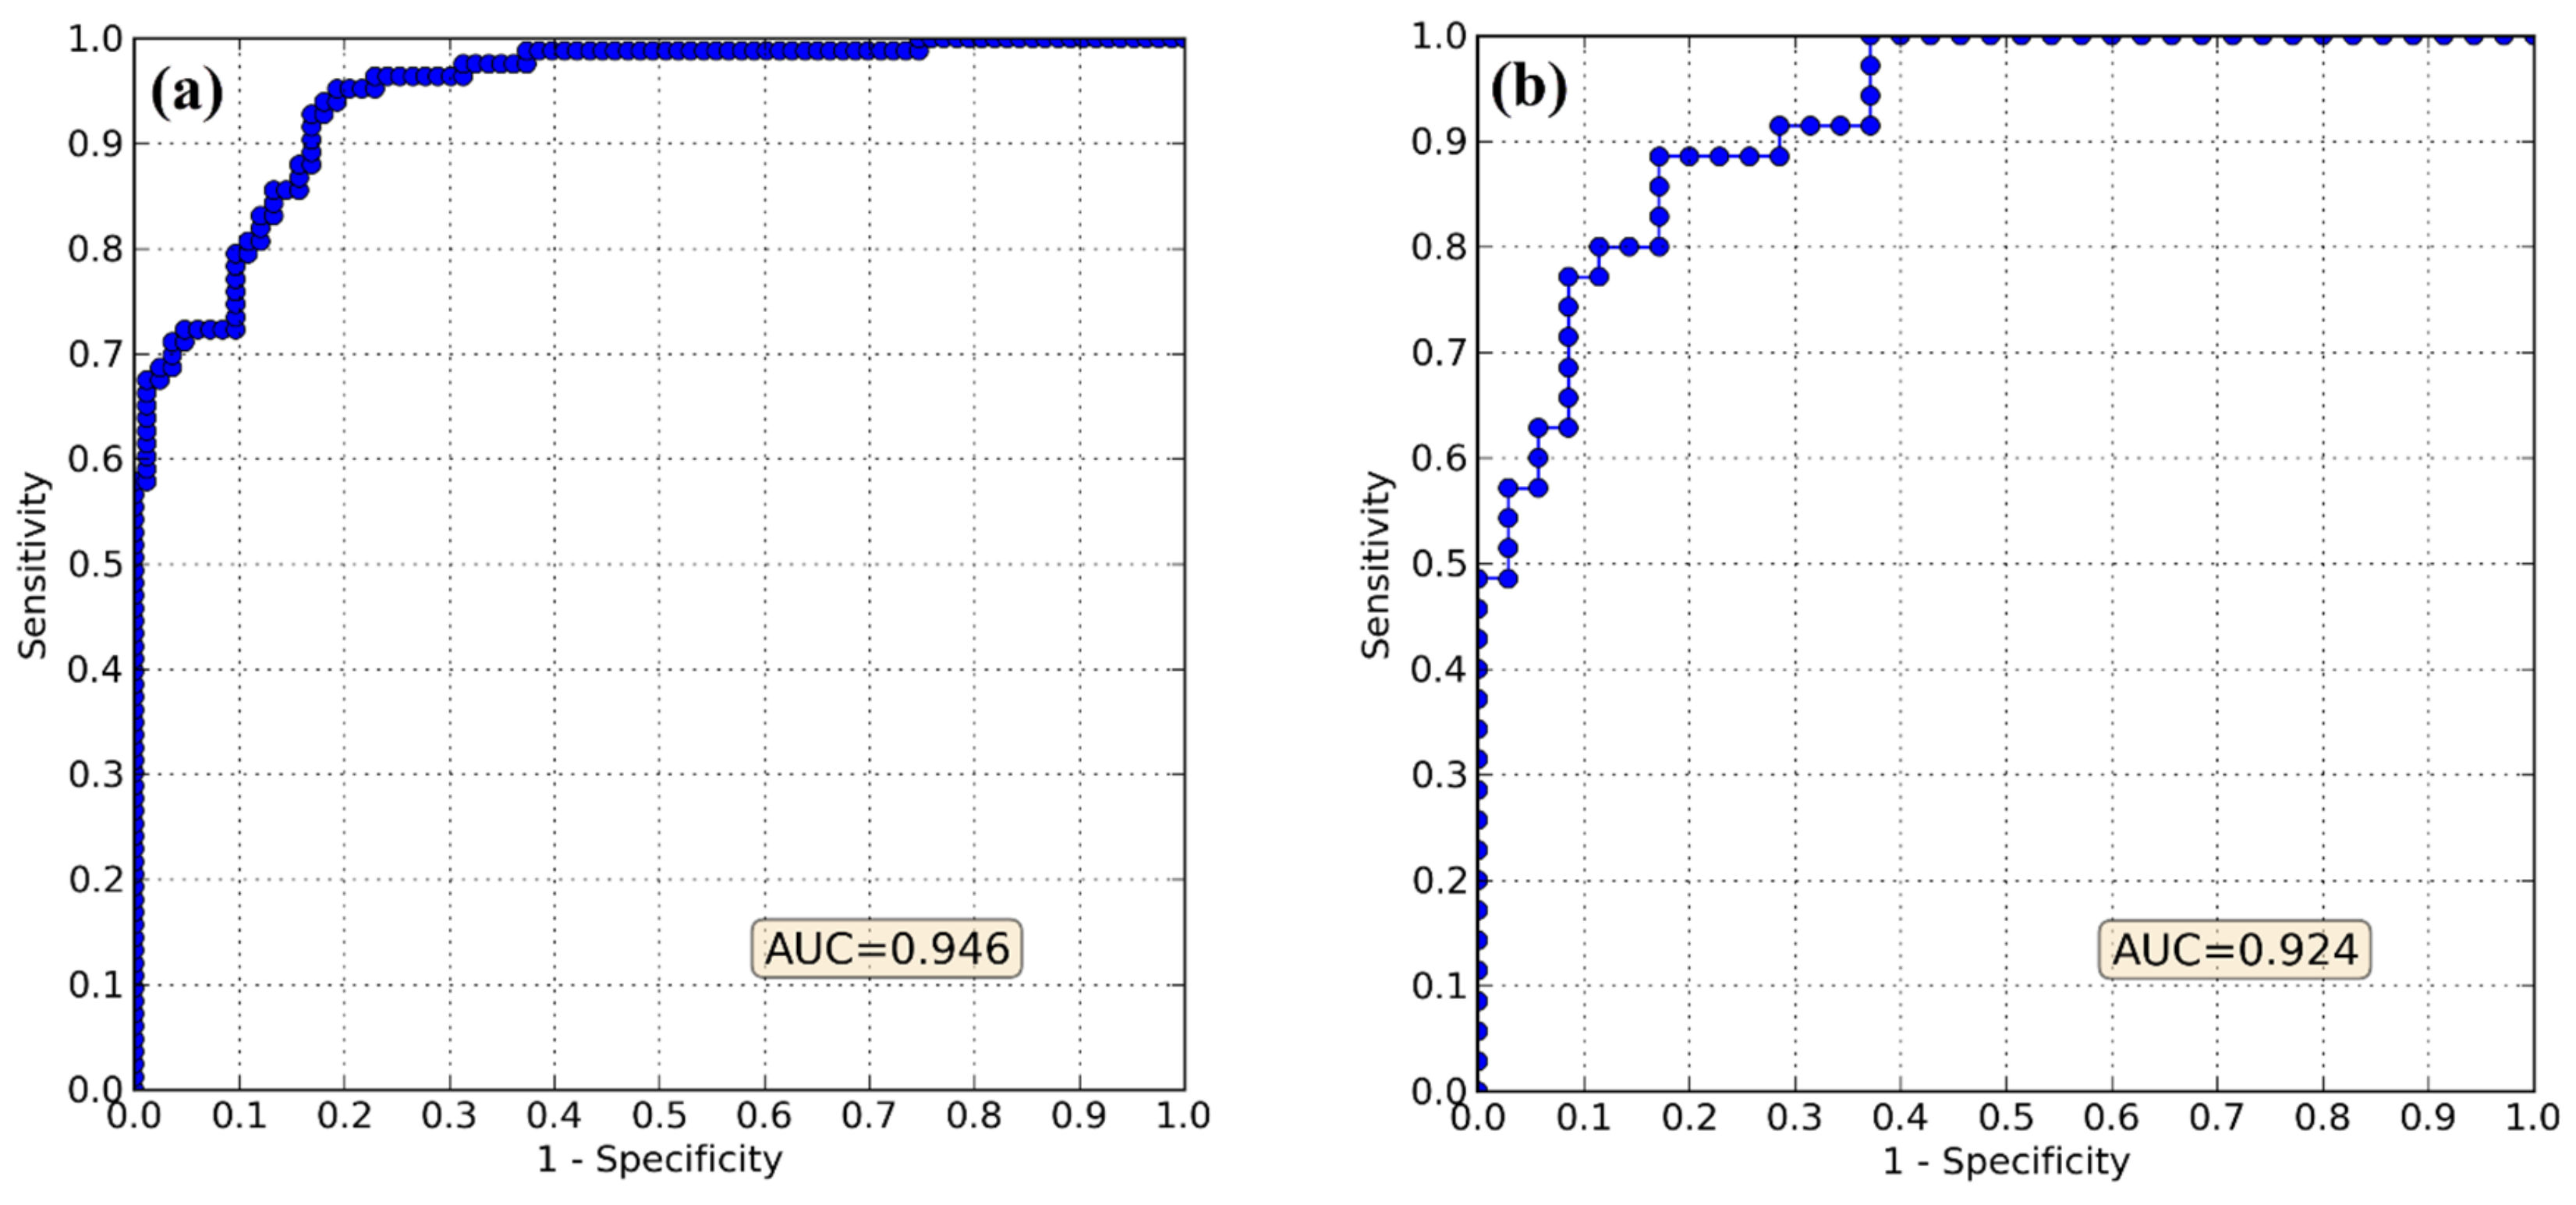
Figure 5 shows the ROC of the SOMN model in the training and validation steps. The AUC values indicate that the model achieved outstanding performance in terms of high goodness-of-fit and prediction power. The AUC value was higher in the training stage (Figure 5a) than in the validation stage (Figure 5b), which was expected given that the model was already accustomed to the training data during the modeling process. While the AUC values indicate the good overall performance of the model in correctly predicting the presence of the flooded locations, their usefulness in predicting the absence of the flooded locations (non-flooded points) is not clear, and the results may have been driven by random chance. This feature, together with some other aspects of the SOMN model’s performance, was examined using cutoff-dependent metrics.
As shown in Table 1, the efficiency values showed the great success of the model inaccurately training and predicting the presence and absence locations, respectively, in the training and validation steps. Low values of FPR and high values of TPR confirmed the results of the efficiency metric, where evidently the model successfully trained and predicted the positive locations. However, based on the equations in Section 2.2.4, FPR and TPR are unable to provide information regarding model performance in predicting the absence locations. Additionally, although the efficiency metric can highlight the performance of the model in correctly predicting absences (i.e., true negatives), an incorrect prediction of positives as negatives (i.e., false negatives) is not anticipated in its equation.
In contrast, TSS provides an overall value of the model’s success by using all the elements of the confusion matrix. In this regard, the SOMN model showed an overall acceptable performance (0.7–0.8), according to the ranges proposed by Hosmer and Lemeshow (2000) [45] and Hosmer et al. (2013) [46]. The lower values of TSS in the training and validation steps compared with those of efficiency, FPR, and TPR are because its equation (Equation (7)) includes both FN and FP elements, which both concurrently penalize model performance and therefore result in a lower, yet true and representative, performance value. The ORSS values are quite transparent (Table 1). The values are in line with the other metrics, as ORSS values close to 1 infer that SOMN has a high potential to produce true predictions and can be considered highly desirable or nearly perfect.
4. Conclusions
Flood hazard mapping in urban environments is challenging because of a lack of hydraulic and hydrological data, but accurate flood hazard prediction is necessary for urban planning and management. This study applied the self-organizing map neural network (SOMN) algorithm as a machine learning technique for urban flood hazard mapping based on observations of flooded data over Amol city and conditioning factors. The results obtained indicated how the neural network (SOMN) algorithm can be applied to urban flood hazard mapping when there are no detailed hydrologic and hydraulic datasets. In a policy term, the results highlighted that the distance to channels and population density are important factors in flood hazard mapping. Furthermore, the validation results demonstrated that both SOMN models represented reliable results without complex hydrodynamic information. Different evaluation metrics were used to scrutinize the goodness-of-fit and predictive performance of the model. The following conclusions were drawn: The SOMN model showed excellent performance in modeling flood hazard in the both training (AUC = 0.946, E = 0.849, TSS = 0.716, ORSS = 0.954) and validation (AUC = 0.924, E = 0.857, TSS = 0.714, ORSS = 0.945) steps. Therefore, it had an outstanding learning rate and predictive performance. SOMN is an accurate and robust model that can help urban policymakers formulate more efficient plans for controlling flood hazards. Approximately 23% of the study area of Amol city fell into high or very high flood hazard classes. Some primary schools (Navid, Mustafa, and Forooghdanesh), Ahmadi high school, and the Technical Training Center of Shahid Madani were shown to lie in high or very high flood hazard zones. Therefore, these parts of Amol city should be carefully managed. Due to a lack of hydrological and hydraulic data, we used just six predictive factors that influence flood inundation in urban areas. This was a major limitation of the study, and further studies focusing on the role of other factors, such as rainfall intensity, are required.
Author Contributions
Conceptualization, O.R., H.D., A.T.H.; methodology, O.R., H.D., S.S., A.K., O.A.N., A.T.H. and D.T.B.; software, O.R., H.D., A.K.; validation, O.A.N., S.S., H.D., and D.T.B.; formal analysis, O.R., H.D., S.S., D.T.B.; investigation, O.R., H.D., A.T.H.; writing—original draft preparation, O.R. and H.D.; writing—review and editing, S.S., O.A.N., and D.T.B.
Acknowledgments
The authors would like to thank the Amol city authority for supplying required data (flooded locations and thematic layers).
Conflicts of Interest
The authors declare no conflict of interest.
References
- Mansur, A.V.; Brondizio, E.S.; Roy, S.; de Miranda Araújo Soares, P.P.; Newton, A. Adapting to urban challenges in the Amazon: Flood risk and infrastructure deficiencies in Belém, Brazil. Reg. Environ. Chang. 2017, 18, 1411–1426. [Google Scholar] [CrossRef]
- Otto, A.; Hornberg, A.; Thieken, A. Local controversies of flood risk reduction measures in Germany. An explorative overview and recent insights. J. Flood Risk Manag. 2016, 11, S382–S394. [Google Scholar] [CrossRef]
- Merz, B.; Kreibich, H.; Schwarze, R.; Thieken, A. Review article “Assessment of economic flood damage”. Nat. Hazards Earth Syst. Sci. 2010, 10, 1697–1724. [Google Scholar] [CrossRef]
- Papaioannou, G.; Efstratiadis, A.; Vasiliades, L.; Loukas, A.; Papalexiou, S.; Koukouvinos, A.; Tsoukalas, I.; Kossieris, P. An Operational Method for Flood Directive Implementation in Ungauged Urban Areas. Hydrology 2018, 5, 24. [Google Scholar] [CrossRef]
- Craik, W. Weather, climate, water and sustainable development. World Meteorol. Day Address 2005, 23, 05. [Google Scholar]
- Dottori, F.; Szewczyk, W.; Ciscar, J.-C.; Zhao, F.; Alfieri, L.; Hirabayashi, Y.; Bianchi, A.; Mongelli, I.; Frieler, K.; Betts, R.A.; et al. Increased human and economic losses from river flooding with anthropogenic warming. Nat. Clim. Chang. 2018, 8, 781–786. [Google Scholar] [CrossRef]
- Bongaarts, J. United Nations department of economic and social affairs, population division world mortality report 2005. Popul. Dev. Rev. 2006, 32, 594–596. [Google Scholar]
- Pontius, R.G.; Schneider, L.C. Land-cover change model validation by an ROC method for the Ipswich watershed, Massachusetts, USA. Agric. Ecosyst. Environ. 2001, 85, 239–248. [Google Scholar] [CrossRef]
- Dammalage, T.; Jayasinghe, N. Land-Use Change and Its Impact on Urban Flooding: A Case Study on Colombo District Flood on May 2016. Eng. Technol. Appl. Sci. Res. 2019, 9, 3887–3891. [Google Scholar]
- Gyamfi, C.; Ndambuki, J.; Salim, R. Hydrological Responses to Land Use/Cover Changes in the Olifants Basin, South Africa. Water 2016, 8, 588. [Google Scholar] [CrossRef]
- Rahmati, O.; Kornejady, A.; Samadi, M.; Deo, R.C.; Conoscenti, C.; Lombardo, L.; Dayal, K.; Taghizadeh-Mehrjardi, R.; Pourghasemi, H.R.; Kumar, S.; et al. PMT: New analytical framework for automated evaluation of geo-environmental modelling approaches. Sci. Total Environ. 2019, 664, 296–311. [Google Scholar] [CrossRef] [PubMed]
- Khosravi, H.; Moradi, E.; Darabi, H. Identification of homogeneous groundwater quality regions using factor and cluster analysys: A case study Ghir Plain of Fars province. J. Irrig. Water Eng. 2015, 6, 119–133. [Google Scholar]
- Myronidis, D.; Ioannou, K. Forecasting the urban expansion effects on the design storm hydrograph and sediment yield using artificial neural networks. Water 2019, 11, 31. [Google Scholar] [CrossRef]
- Myronidis, D.; Stathis, D.; Sapountzis, M. Post-Evaluation of Flood Hazards Induced by Former Artificial Interventions along a Coastal Mediterranean Settlement. J. Hydrol. Eng. 2016, 21, 05016022. [Google Scholar] [CrossRef]
- Change, I.C. The physical science basis. In Contribution of Working Group I to the Fourth Assessment Report of the Intergovernmental Panel on Climate Change; Manning, M., Chen, Z., Marquis, M., Averyt, K.B., Tignor, M., Miller, H.L., Eds.; Cambridge University Press: Cambridge, UK; New York, NY, USA, 2007; Volume 996, p. 2007. [Google Scholar]
- Chen, J.; Hill, A.A.; Urbano, L.D. A GIS-based model for urban flood inundation. J. Hydrol. 2009, 373, 184–192. [Google Scholar] [CrossRef]
- Fernández, D.S.; Lutz, M.A. Urban flood hazard zoning in Tucumán Province, Argentina, using GIS and multicriteria decision analysis. Eng. Geol. 2010, 111, 90–98. [Google Scholar] [CrossRef]
- Gigović, L.; Pamučar, D.; Bajić, Z.; Drobnjak, S. Application of GIS-Interval Rough AHP Methodology for Flood Hazard Mapping in Urban Areas. Water 2017, 9, 360. [Google Scholar] [CrossRef]
- Ouma, Y.; Tateishi, R. Urban Flood Vulnerability and Risk Mapping Using Integrated Multi-Parametric AHP and GIS: Methodological Overview and Case Study Assessment. Water 2014, 6, 1515–1545. [Google Scholar] [CrossRef]
- Abdelkarim, A.; Gaber, A.; Youssef, A.; Pradhan, B. Flood Hazard Assessment of the Urban Area of Tabuk City, Kingdom of Saudi Arabia by Integrating Spatial-Based Hydrologic and Hydrodynamic Modeling. Sensors 2019, 19, 1024. [Google Scholar] [CrossRef] [PubMed]
- Darabi, H.; Choubin, B.; Rahmati, O.; Torabi Haghighi, A.; Pradhan, B.; Kløve, B. Urban flood risk mapping using the GARP and QUEST models: A comparative study of machine learning techniques. J. Hydrol. 2019, 569, 142–154. [Google Scholar] [CrossRef]
- Torabi Haghighi, A.; Darabi, H.; Shahedi, K.; Solaimani, K.; Kløve, B. A Scenario-Based Approach for Assessing the Hydrological Impacts of Land Use and Climate Change in the Marboreh Watershed, Iran. Environ. Model. Assess. 2019, 1–17. [Google Scholar] [CrossRef]
- Torabi Haghighi, A.; Menberu, M.W.; Darabi, H.; Akanegbu, J.; Kløve, B. Use of remote sensing to analyse peatland changes after drainage for peat extraction. Land Degrad. Dev. 2018, 29, 3479–3488. [Google Scholar] [CrossRef]
- Zhao, G.; Pang, B.; Xu, Z.; Peng, D.; Xu, L. Assessment of urban flood susceptibility using semi-supervised machine learning model. Sci. Total Environ. 2019, 659, 940–949. [Google Scholar] [CrossRef] [PubMed]
- Chapi, K.; Singh, V.P.; Shirzadi, A.; Shahabi, H.; Bui, D.T.; Pham, B.T.; Khosravi, K. A novel hybrid artificial intelligence approach for flood susceptibility assessment. Environ. Model. Softw. 2017, 95, 229–245. [Google Scholar] [CrossRef]
- Cherqui, F.; Belmeziti, A.; Granger, D.; Sourdril, A.; Le Gauffre, P. Assessing urban potential flooding risk and identifying effective risk-reduction measures. Sci. Total Environ. 2015, 514, 418–425. [Google Scholar] [CrossRef] [PubMed]
- Pirnia, A.; Golshan, M.; Darabi, H.; Adamowski, J.; Rozbeh, S. Using the Mann–Kendall test and double mass curve method to explore stream flow changes in response to climate and human activities. J. Water Clim. Chang. 2018. [Google Scholar] [CrossRef]
- Céréghino, R.; Park, Y.S. Review of the Self-Organizing Map (SOM) approach in water resources: Commentary. Environ. Model. Softw. 2009, 24, 945–947. [Google Scholar] [CrossRef]
- Chang, F.J.; Chang, L.C.; Wang, Y.S. Enforced self-organizing map neural networks for river flood forecasting. Hydrol. Process. Int. J. 2007, 21, 741–749. [Google Scholar] [CrossRef]
- Chang, F.-J.; Chang, L.-C.; Kao, H.-S.; Wu, G.-R. Assessing the effort of meteorological variables for evaporation estimation by self-organizing map neural network. J. Hydrol. 2010, 384, 118–129. [Google Scholar] [CrossRef]
- Lotfi, S.; Shahabi, S.; Nikbakht, E. The Feasibility Study of Applying Creative Multicenter Network Metropolitan Approach in the Metropolitan Area of the Central Mazandaran. Geogr. Dev. Iran. J. 2016, 14, 1–17. [Google Scholar]
- Sedaghat, M.; Solaimani, K.; Rashidpour, M. Assessment of flood susceptibility in Amol city using GIS technique. In Proceedings of the 3th National Conference on Advanced Studies and Research in Geography, Architecture and Urban Science of Iran (NICONF03_250), Teheran, Iran, 21 June 2009; p. 11. [Google Scholar]
- Choubin, B.; Darabi, H.; Rahmati, O.; Sajedi-Hosseini, F.; Kløve, B. River suspended sediment modelling using the CART model: A comparative study of machine learning techniques. Sci. Total Environ. 2018, 615, 272–281. [Google Scholar] [CrossRef] [PubMed]
- Darabi, H.; Shahedi, K.; Solaimani, K.; Kløve, B. Hydrological Indices Variability Based on Land Use Change Scenarios. Iran. J. Watershed Manag. Sci. 2018, 12, 81–95. [Google Scholar]
- Stathis, D.; Sapountzis, M.; Myronidis, D. Assessment of land-use change effect on a design storm hydrograph using the SCS curve number method. Fresenius Environ. Bull. 2010, 19, 1928–1934. [Google Scholar]
- Tien Bui, D.; Hoang, N.-D.; Martínez-Álvarez, F.; Ngo, P.-T.T.; Hoa, P.V.; Pham, T.D.; Samui, P.; Costache, R. A novel deep learning neural network approach for predicting flash flood susceptibility: A case study at a high frequency tropical storm area. Sci. Total Environ. 2019. [Google Scholar] [CrossRef] [PubMed]
- Termini, S.T. Kohonen, self-organizing maps. Rendiconti Circolo Mat. Palermo 1995, 44, 506. [Google Scholar] [CrossRef]
- Lin, G.-F.; Chen, L.-H. Identification of homogeneous regions for regional frequency analysis using the self-organizing map. J. Hydrol. 2006, 324, 1–9. [Google Scholar] [CrossRef]
- Liong, S.-Y.; Lim, W.-H.; Kojiri, T.; Hori, T. Advance flood forecasting for flood stricken Bangladesh with a fuzzy reasoning method. Hydrol. Process. 2000, 14, 431–448. [Google Scholar] [CrossRef]
- Ji, C. Land-use classification of remotely sensed data using Kohonen self-organizing feature map neural networks. Photogramm. Eng. Remote Sens. 2000, 66, 1451–1460. [Google Scholar]
- Frattini, P.; Crosta, G.; Carrara, A. Techniques for evaluating the performance of landslide susceptibility models. Eng. Geol. 2010, 111, 62–72. [Google Scholar] [CrossRef]
- Stephenson, D.B. Use of the “Odds Ratio” for Diagnosing Forecast Skill. Weather Forecast. 2000, 15, 221–232. [Google Scholar] [CrossRef]
- Allouche, O.; Tsoar, A.; Kadmon, R. Assessing the accuracy of species distribution models: Prevalence, kappa and the true skill statistic (TSS). J. Appl. Ecol. 2006, 43, 1223–1232. [Google Scholar] [CrossRef]
- Pirnia, A.; Darabi, H.; Choubin, B.; Omidvar, E.; Onyutha, C.; Haghighi, A.T. Contribution of climatic variability and human activities to stream flow changes in the Haraz River basin, northern Iran. J. Hydro-Environ. Res. 2019, 25, 12–24. [Google Scholar] [CrossRef]
- Hosmer, D.W.; Lemeshow, S. Applied Logistic Regression; John Wiley & Sons, Inc.: Hoboken, NJ, USA, 2000. [Google Scholar] [CrossRef]
- Hosmer, D.W., Jr.; Lemeshow, S.; Sturdivant, R.X. Applied Logistic Regression. In Wiley Series in Probability and Statistics; John Wiley & Sons, Inc.: Hoboken, NJ, USA, 2013. [Google Scholar] [CrossRef]
Figure 1.
Location of flood-prone points in Amol city, Mazandaran province, Iran.

Figure 2.
Schematic diagram of the research procedure.

Figure 3.
Factors affecting flood inundation risk in Amol city.

Figure 4.
Flood inundation results from the self-organizing map neural network (SOMN) model: (a) flood inundation probability map of Amol city, and (b) the city divided into five flood inundation zones.
Figure 4.
Flood inundation results from the self-organizing map neural network (SOMN) model: (a) flood inundation probability map of Amol city, and (b) the city divided into five flood inundation zones.

Figure 5.
The receiver operating characteristic (ROC) curve for the training and validation steps: (a) goodness-of-fit, and (b) predictive performance of the model.
Figure 5.
The receiver operating characteristic (ROC) curve for the training and validation steps: (a) goodness-of-fit, and (b) predictive performance of the model.


Table 1.
Goodness-of-fit and predictive performance of SOMN models based on threshold-dependent criteria.
Table 1.
Goodness-of-fit and predictive performance of SOMN models based on threshold-dependent criteria.
| Evaluation Metric | Goodness-of-Fit | Predictive Performance |
|---|---|---|
| Efficiency (accuracy) | 0.849 | 0.857 |
| True skill statistic (TSS) | 0.716 | 0.714 |
| False positive rate (FPR) | 0.197 | 0.142 |
| True positive rate (TPR) | 0.914 | 0.857 |
| Odd ratio skill score | 0.954 | 0.945 |
© 2019 by the authors. Licensee MDPI, Basel, Switzerland. This article is an open access article distributed under the terms and conditions of the Creative Commons Attribution (CC BY) license (http://creativecommons.org/licenses/by/4.0/).
Share and Cite
MDPI and ACS Style
Rahmati, O.; Darabi, H.; Haghighi, A.T.; Stefanidis, S.; Kornejady, A.; Nalivan, O.A.; Tien Bui, D. Urban Flood Hazard Modeling Using Self-Organizing Map Neural Network. Water 2019, 11, 2370. https://doi.org/10.3390/w11112370
AMA Style
Rahmati O, Darabi H, Haghighi AT, Stefanidis S, Kornejady A, Nalivan OA, Tien Bui D. Urban Flood Hazard Modeling Using Self-Organizing Map Neural Network. Water. 2019; 11(11):2370. https://doi.org/10.3390/w11112370
Chicago/Turabian StyleRahmati, Omid, Hamid Darabi, Ali Torabi Haghighi, Stefanos Stefanidis, Aiding Kornejady, Omid Asadi Nalivan, and Dieu Tien Bui. 2019. "Urban Flood Hazard Modeling Using Self-Organizing Map Neural Network" Water 11, no. 11: 2370. https://doi.org/10.3390/w11112370
Note that from the first issue of 2016, this journal uses article numbers instead of page numbers. See further details here.