Synergies within the Water-Energy-Food Nexus to Support the Integrated Urban Resources Governance


1
School of Management Science and Engineering, Central University of Finance and Economics, Beijing 100081, China
2
Center for Global Economy and Sustainable Development (CGESD), Central University of Finance and Economics, Beijing 100081, China
*
Author to whom correspondence should be addressed.
Water 2019, 11(11), 2365; https://doi.org/10.3390/w11112365
Submission received: 30 August 2019
/
Revised: 26 October 2019
/
Accepted: 5 November 2019
/
Published: 12 November 2019
(This article belongs to the Special Issue Insights on the Water–Energy–Food Nexus)
Abstract
:Rapid urbanization poses great challenges to water-energy-food nexus (WEF-Nexus) system, calling for integrative resources governance to improve the synergies between subsystems that constitute the Nexus. This paper explores the synergies within the WEF-Nexus in Shenzhen city while using the synergetic model. We first identify the order parameters and their causal paths in three subsystems and set several eigenvectors under each parameter. Secondly, a synergetic model is developed to calculate the synergy degree among parameters, and the synergetic networks are then further constructed. Centrality analysis on the synergetic networks reveals that the centralities of food subsystem perform the highest level while the water subsystem at the lowest level. Finally, we put forward some policy implications for cross-sectoral resources governance by embedding the synergy degree into causal paths. The results show that the synergies of the Nexus system in Shenzhen can be maximized by stabilizing water supply, coordinating the energy imports and exports, and reducing the crops sown areas.
1. Introduction
Water, energy, and food (WEF) are the most important elements for human wellbeing and sustainable development [1]. The rapid urbanization [2,3], accompanied by population growth and economic transitions, puts an ever-growing pressure on the security of three sectors [4,5], especially in developing countries [6]. More importantly, WEF are inextricably interlinked and any sectoral policies without considering their interconnections may lead to acute negative consequences [7,8]. For example, to meet the food demands from growing population, some Asian countries given energy subsidies for irrigation areas expansion, while significantly increasing the scarcity of underground water [9,10]. The biofuel development policies that are popular in energy shortage area have great adverse impacts on water and food supply through land use change and competition between food and non-food cultivation [11]. The concept of WEF-Nexus has gained significant attention in recently years, to improve the tradeoff and synergies between WEF, as it is an integrated governance tool or framework to guide the cross-sectoral cooperation [12].
The Nexus thinking emerged in the late 2000s, when the World Economic Forum first identified the WEF-Nexus as a key solution to global challenges, calling for a better understanding of their interlinkages [13,14]. The Bonn Conference, held in 2011, further propelled the WEF-Nexus approach into international discussions and provided a new governance perspective on problems of unsustainable development [15]. Since then, the Nexus has gained popularity both within academia and among policy makers [16], notably in relation to the agendas of Sustainable Development Goals (SDGs 2,6 and 7) [17]. At the core of Nexus debates are the WEF securities that are threatened by increased demands [18] and fierce sectoral competition [19], thus urgently requiring identifying the Nexus complexity, where the resources supply and demand are highly interdependent at all scales [20,21,22]. As a result of these interdependencies, decision-makers from different sectors encounter the complex governance challenges of accounting for synergies, tensions, and potential trade-offs among Nexus [12].
Until now, many Nexus modeling have been developed to promote the synergies for cross-sectoral governance. They can be generally classified into two categories, that is, specialized models for Nexus and generic approaches applied to Nexus. Models that are special for Nexus include Nexus Tool 2.0, NTP (Nexus Tools Platform), NexSym (Nexus Simulation System) and WEFO (WEF security nexus Optimization model) [14,23,24,25]. These models often incorporate water, energy, and food into an integrated framework for the better assessment and simulation of synergies within Nexus system. The generic approaches that are most frequently employed are environmental footprint assessment, life cycle assessment (LCA), and input-output analysis (IOA), which aim to identify the synergies and critical causal paths within Nexus [17,26,27]. Besides, the scenario analysis and indicator-based assessment have also been adopted to highlight synergies and conflicts amongst and within the subsystems of Nexus [6,28]. By reviewing the literature, we find that most of the modeling tools just emphasize the fact of poor governance practices, but seldom to quantify the extent of non-synergies existing in Nexus. In other words, when the demand of one kind of resource increases, it is still not clear that to what extent it puts pressure on other resources. For a better understanding of the complex interconnections of WEF Nexus, an integrated model that provides the synergetic view and further quantifies the network features among the critical elements within the Nexus needs to be developed.
When it comes to the research scales, the prevailing opinions largely see Nexus as the local scale that often proved to be unsustainable, owing to inadequate cross-sectoral synergies. In recent times, more scholars turn to the study of Nexus system at city level [29,30,31,32]. As is well known, urbanization is prevalent worldwide, with the global urbanization rate reaching 54% in 2017. That figure will increase by 28% in the next 15 years, and the demand for WEF in urban areas will simultaneously increase [33]. It is worthy to note that much attention is usually paid to the cities in developed countries, while less to the cities in developing countries. In the context of growing population and climate change, the stress on WEF will increase the vulnerability of urban Nexus [34], and these challenges are more likely to hit less developed countries [35].
As the largest developing country in the world, China has entered a phase when its cities, particularly those cities that are located in east coasts, have been growing at a breakneck speed since the reform and opening in the late 1970s. Shenzhen, as China’s first Special Economic Zone, had a large population of 12.53 million at the end of 2017, about 37.5 times that of 1979 [36,37]. The rapid urbanization has not only made the demand for urban resources far exceed its own supply capacity, but has also posed challenges in transferring a great number of resources from outside. In 2017, the Chinese central government approved Shenzhen to build the National Sustainable Development Agenda Innovation Demonstration Zone, which required the improvement of resource use efficiency and ecological environment management. This indicates that the solutions toward the resource and environmental problems for megacities that are represented by Shenzhen and its demonstration effects on other cities are highly valued at the national level. Therefore, exploring the synergies of WEF-Nexus in Shenzhen will provide useful policy implications for developing countries during rapid urbanization, and valuable practices for megacities to seek sustainable resources governance and the implementations of the 2030 Agenda for Sustainable Development.
Based on the above, this paper takes Shenzhen city as the case, in order to quantify the synergies of WEF from the perspective of nexus governance. We first select some order parameters and identify their causal paths that exist in Nexus system. Subsequently, we develop the synergetic model to calculate the synergy degree among order parameters. By doing this, the synergetic networks can be constructed and centralities analysis on these networks is subsequently conducted. Finally, this paper proposes some policy implications that aim to guide the integrative urban WEF integrated governance by embedding the synergy degree into causal paths.
2. Subsystems, Order Parameters and Eigenvectors
2.1. Subsystems and its Order Parameters
Order parameters are generally used to reflect the ordered structure of systems. WEF-Nexus is a typical complex system and it is necessary to select some suitable order parameters to help understand the synergies and trade-offs within the Nexus system. The fluctuation of order parameters within Nexus will change the stability of the system and increase the complexity of urban resource governance. Nexus is first divided into three subsystems, including water, energy, and food, to more clearly identify the order parameters. Secondly, each subsystem can be further divided into two attributes, according to the resources supply and demand. Thirdly, based on the attributes of each subsystem, the corresponding order parameters can be set. Finally, 23 order parameters are eventually selected within Nexus, among which the water, energy, and food subsystems include 7, 8, and 8, respectively (see Table 1).
2.2. Causal Paths in Order Parameters
After reviewing the literature in WEF-Nexus domain, we find that most types of causal paths that exist among order parameters have been scientifically tested (see Table 2). Taking the causal path ① as an example, the literature [38] mainly discussed the dam building generating the hydropower to increase the energy supply, while reducing the water availability for agriculture (food production). Subsequently, we can conclude this causal path as “water conservation→power generation→electricity (for food production as well)”. Other causal paths are summarized in the same way. Furthermore, we visualize these causal paths and integrate them into a loop diagram, as shown in Figure 1.
2.3. Eigenvectors under Order Parameters
The causal loop just qualitatively draws out the interconnections among order parameters, but it is insufficient to evaluate the synergetic effects within the Nexus system. 23 order parameters are decomposed into 72 eigenvectors, each order parameter containing at least two eigenvectors, in order to quantify the synergies among order parameters (see Table 3). A number of eigenvectors combined together form a multi-dimensional vector space to calculate the synergy degree among order parameters.
3. Synergetic Model
The core of the synergetic model is to calculate the variations of multi-eigenvectors at different time, and then obtain the synergy degree among all order parameters. The value of synergy degree represents the relationship intensity between two connected order parameters, so the elements that occupied the dominate position could be identified for more effective policy making. The synergetic network of order parameters can be constructed by the synergy degree between every two parameters. According to the network centralities, the status and significance of the order parameters and their corresponding subsystem in Nexus system can be demonstrated.
3.1. Synergetic Model Construction
How to handle the multi-dimensional vector space is the first step towards synergy degree calculation. We use the value change of eigenvectors at two time points to represent the variation of order parameters due to each multi-dimensional vector space (order parameter) consisting of two or more eigenvectors [53]. Many authors have proved that the vector space model performs effectively in information retrieval when processing large amounts of text files [54]. Similarly, a large number of eigenvectors can also be processed together by using a vector space model.
3.1.1. The Definition of Eigenvector
According to Table 1 and Table 3, and can be defined as the eigenvector in ith order parameter in current and next year, respectively. Where and are the value of the eigenvector, = 1, 2, …,. Similarly, the eigenvector in jth order parameter in current and next year are and , respectively.
There are direct or indirect causal correlations between any two order parameters. If the changes of eigenvectors within two order parameters are highly consistent, it means that these two have high synergy degree. Standardization processing is needed, as the eigenvectors in each order parameter have different dimensions and properties. According to the definition of and mentioned above, the and can be further defined as the vectors of the ith and jth order parameter. Where and represents the variation of lth eigenvector in ith order parameter and the variation of the kth eigenvector in jth order parameter. and ( = 1, 2, …,; = 1, 2, ; and refers to the number of eigenvectors that are included in the corresponding order parameter).
3.1.2. The Definition of Order Parameters Synergetic Matrix
Based on the theory of single factor coupling degree in vector space [55], combining the definition of and , the influence degree of the lth and kth eigenvector is defined as:
where If the change rate of lth and kth eigenvector are close, then the will close to 1, and there will be high synergetic effect between these two eigenvalues. The larger the variation of the eigenvectors, the smaller the will be, which means that the synergy degree between two order parameters is lower. As one order parameter contains several eigenvectors, the synergetic matrix of the ith and jth order parameter can be constructed, as below.
where n and m are the number of eigenvectors in ith and jth order parameter, respectively.
3.1.3. Synergetic Model of Order Parameters
On the basis of the eigenvector variations and synergetic matrix, the formula of the synergy degree between ith and jth order parameter is as follows:
where . and refers to the normal vector of ith and jth order parameter, respectively. means the absolute value, while the means the two-norm (L2) of . The number of synergy degree will be calculated if we select order parameters to reveal the synergetic effects of the system.
3.2. Centrality Analysis of Synergetic Networks
This paper develops the synergetic network model to illustrate the synergy degree variations between every two order parameters. After the synergetic networks are constructed, we can analyze the network features from the perspective of centralities, i.e., degree centrality, betweenness centrality, and closeness centrality [56].
3.2.1. Degree Centrality
The degree centrality is used to measure the number of connections that one order parameter directly connects others in synergetic network, and that means this order parameter has influence on the synergies of the Nexus system. Standardized degree centrality refers to the ratio of the degree centrality of one order parameter to the maximum degree centrality of the network. The formula is as follows:
where represents the relative degree centrality of ith order parameter, represents the number of connections that ith order parameter connects others, and represents the number of order parameters in the network.
3.2.2. Betweenness Centrality
The betweenness centrality characterizes the transition connections of order parameters in the network. For example, if there is no direct connection between two order parameters, but they are directly connected with the third order parameter. In this condition, we can regard the third order parameter as the “bridge”. The greater one order parameter act as “bridge”, the higher its betweenness centrality. Suppose that represents the number of shortcuts between two order parameters and , represents to what extent the third order parameter can control the connections of and , that is, the probability that locates in the shortcut between and . The number of the shortcuts between and that pass are represented by , where . The absolute betweenness centrality of one order parameter is as follows:
where and standardized betweenness centrality is the ratio of the betweenness centrality to the maximum possible betweenness centrality in network. The formula is as follows:
3.2.3. Closeness Centrality
Closeness centrality is the degree of one order parameter that is not indirectly affected by others in the synergetic network, or the independence of synergies between one order parameter and others. Here, we define the distance as the number of edges of the shortest path between two order parameters. If the closeness centrality of an order parameter is greater, the average path of this order parameter is shorter when it directly or indirectly correlates with others. The absolute closeness centrality is defined, as follows:
where represents the maximum distance in network, that is, the maximum observation distance plus 1. represents the distance between and . To compare the closeness centrality of different networks, the standardized closeness centrality can be calculated, as follows:
4. Synergetic Analysis: Case of Shenzhen City
This part will take Shenzhen city as an example to quantify the synergy degree of order parameters within WEF-Nexus system from 2010 to 2016. Based on this, we then construct synergetic networks among all the order parameters and further conduct some centrality analysis on these networks. The data used were mainly collected from Shenzhen Statistical Yearbook and Shenzhen Water Resources Bulletin and from the China City Statistical Yearbook. All of the eigenvectors under WEF-Nexus order parameters are measured with data from within city borders, except for F8 (food imports).
4.1. Synergy Degree of Order Parameters
In six periods, each order parameter in the Nexus system shows different synergy degree. If one order parameter has strong synergetic correlations with others, then it can be regarded as dominant in the whole system and it can easily influence others or be affected by others. Figure 2 shows the mean value of synergy degree for each order parameter from 2010 to 2016. The higher the mean value is, the higher the synergy degree between the corresponding order parameter and whole Nexus system.
The average synergy degree of order parameter in food subsystem is the highest (0.36), followed by energy subsystem (0.31) and water subsystem (0.28). In the food subsystem, the order parameters with the highest synergy degree are F1 and F2. F1 is the gross value of agriculture and its change depends on the yield of all kinds of agricultural products (F4–F7), while F2 is the sown areas of crops. The change of F2 will directly affect crop yield (F4) and F1 indirectly through F4, and even affect order parameters from other subsystem, such as water demand (W4). The order parameter with the lowest synergies are F3 and F7, which indicates that aquaculture is a relatively independent the agricultural sector. In addition, the synergy degree of F8 is also low with small fluctuation, because the change of food import is mainly influenced by food policy and market price; hence, it is not directly connected to most of the other order parameters in Nexus.
In the energy subsystem, the highest average synergy degree is E5, which can be regarded as a “bridge”. It is determined by the energy storage (E3) and energy production (E4), but meet the energy demand from the related sectors (E6–E8). E3 and E7 are in the second place, both with the synergy degree of 0.38. E3 is regulated by energy allocation from outside (E1) and over outside (E2). At the same time, it also determines the energy production (E4) and it affects the energy demand from related sectors (E6–E8). As an energy-related sector, E7 needs to consume a certain amount of energy (E5) and increase the energy supply (E4) to provide secondary energy for other sectors. Like F8, E1 and E2 largely depend on urban energy policies and market price, so their synergy degree is relatively low.
The average synergy degree of order parameters in the water subsystem is the lowest. When compared with other two subsystems, water occupies a fundamental status in Nexus system and determines energy and food production to a large extent. As an independent subsystem, the water subsystem inclines to affect other subsystems, rather than being affected by order parameters from other subsystems. Shenzhen is located in monsoon climate area, so the water supply largely depends on precipitation. The variation of inter-annual precipitation makes the water supply (W1) irregularly fluctuate. However, after the regulation by water storage facilities, the synergy degree of actual water supply (W3) is improved to a certain extent, so as to meet the water demand from related sectors. As agricultural sectors consume a large amount of water, the synergies of W4, W6, and W7 are all less than 0.3, which indicates that there is a lack of water governance for these demand sides.
4.2. Synergetic Network between Order Parameters
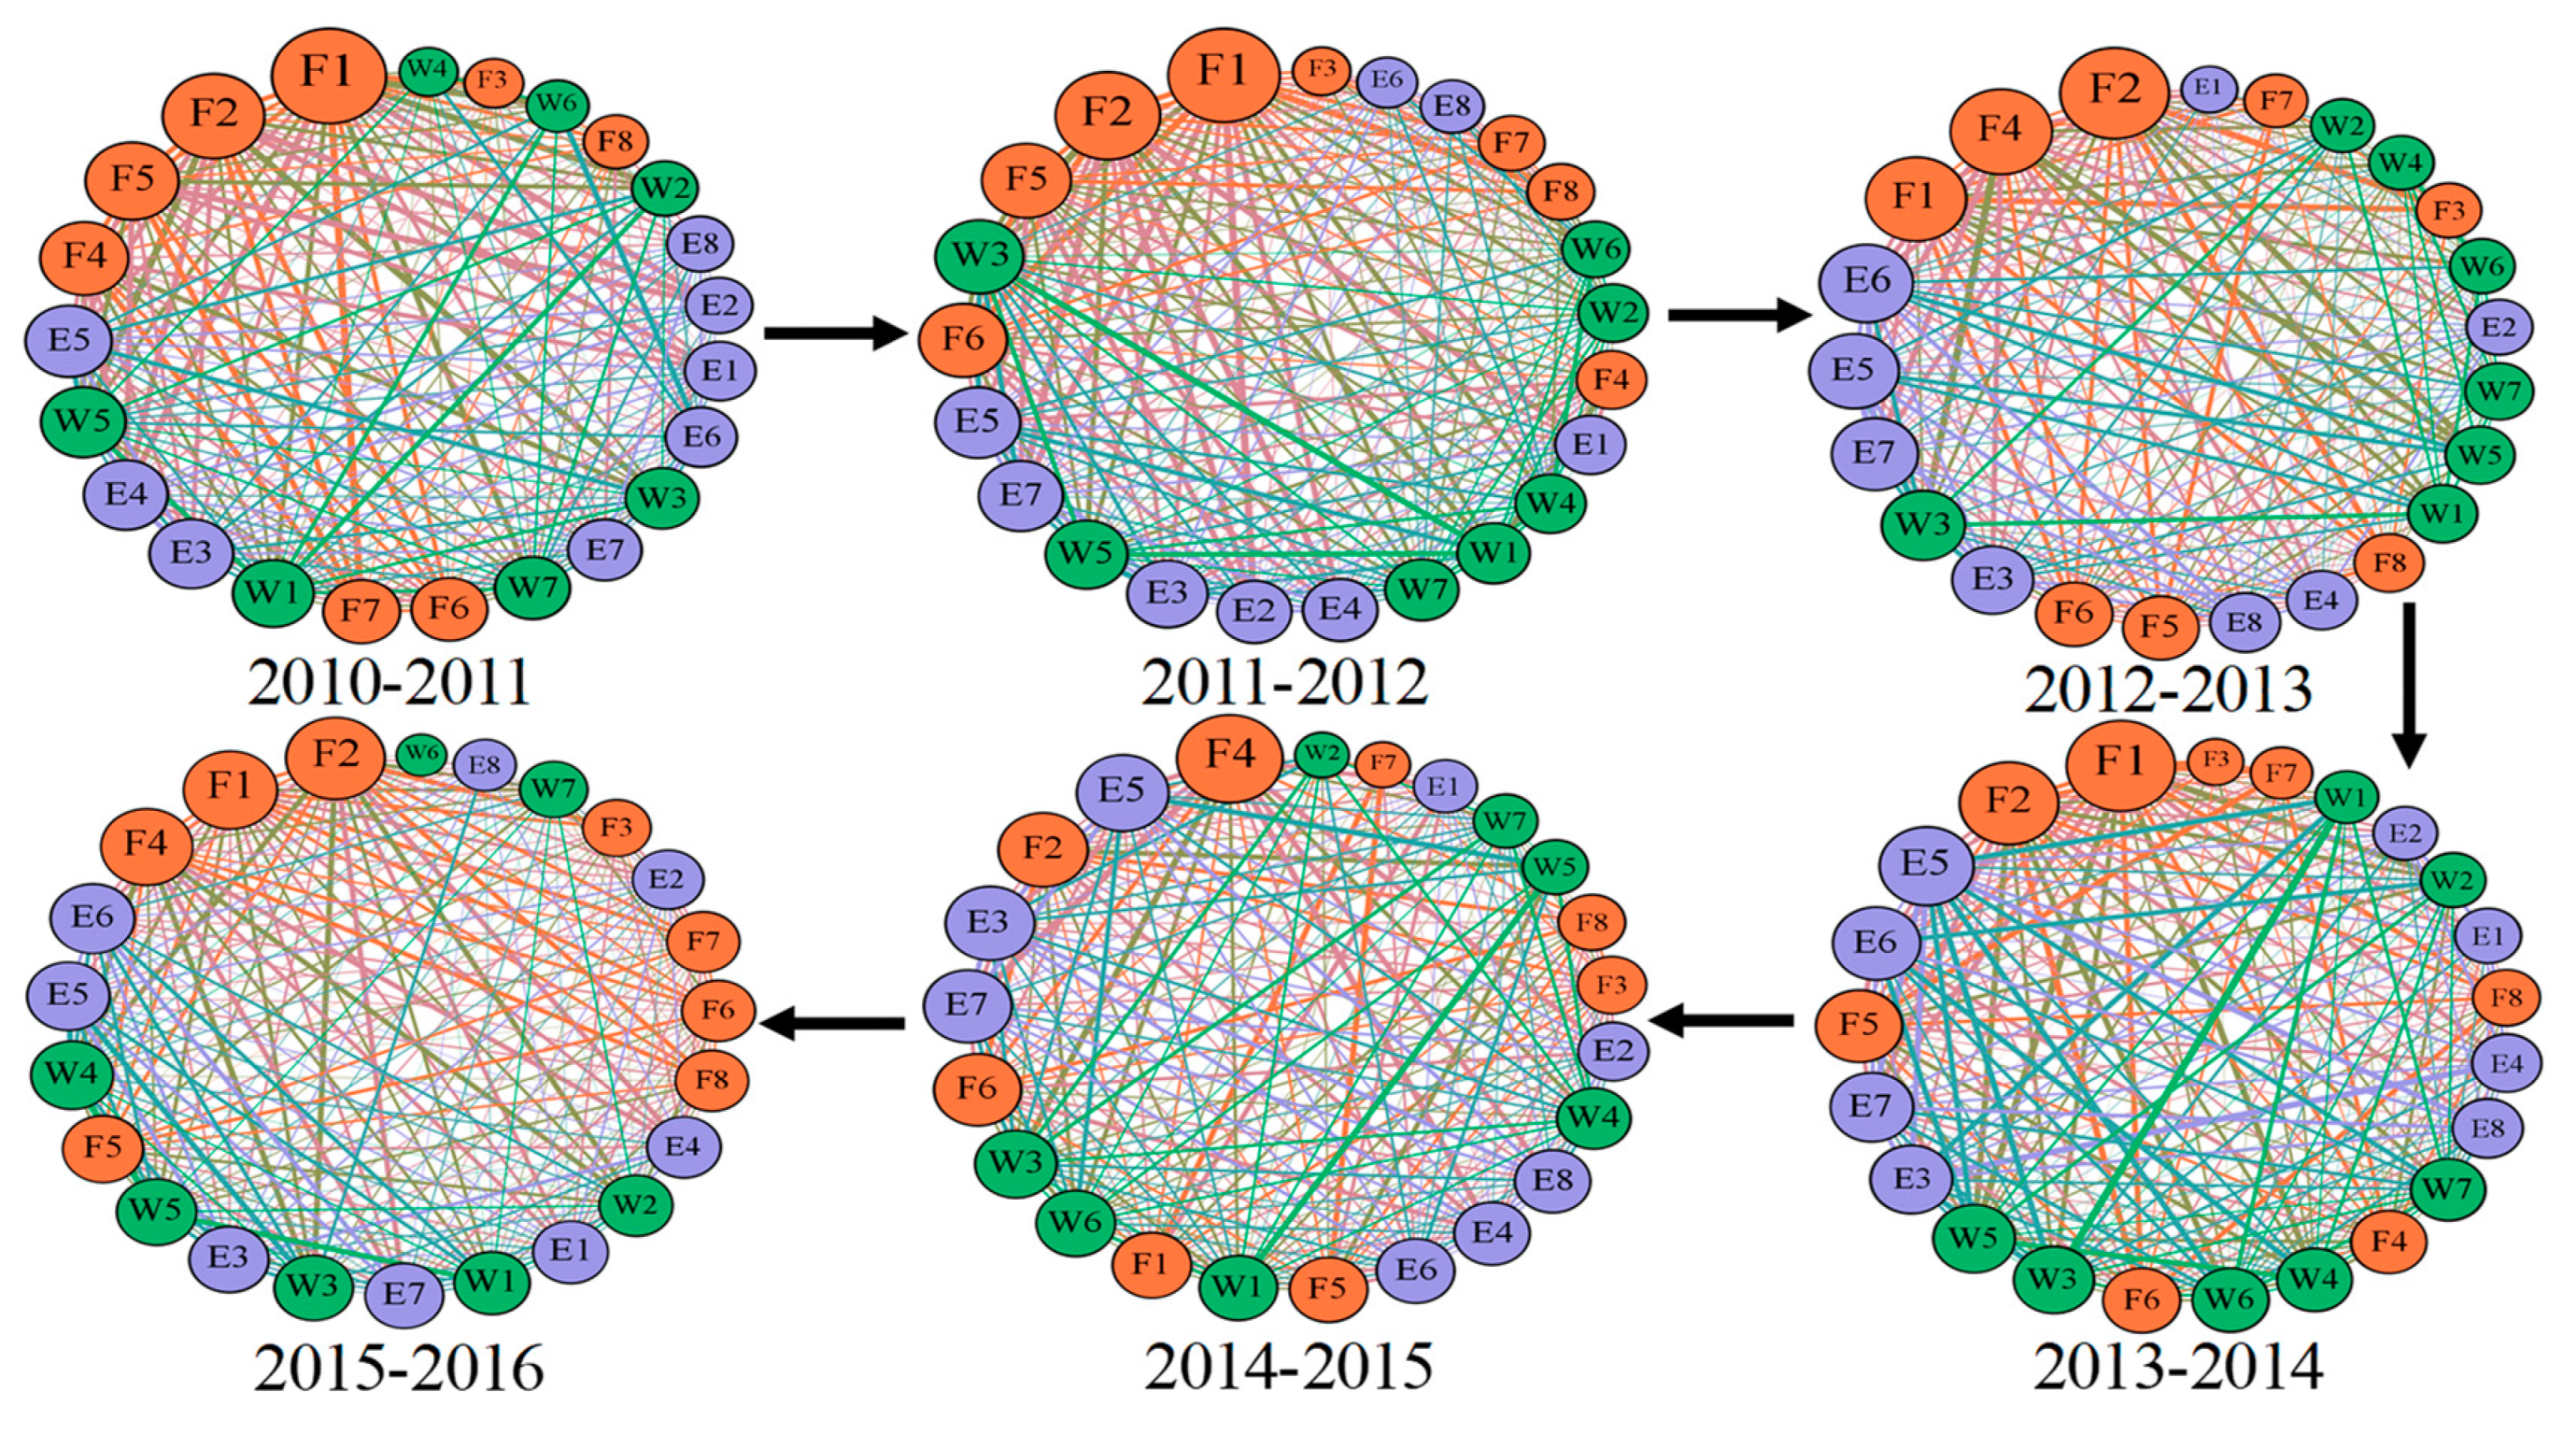
We use Gephi to visualize the synergetic networks among order parameters based on the synergy degree of every two order parameters. Figure 3 shows the synergetic networks of the Nexus system in Shenzhen from 2010 to 2016. The size of node in the network represents the weighted average of synergies between each order parameter and all others. The node positions are sequentially arranged according to the synergy degree of order parameters. The thickness of the nodes ligature represents the synergy degree between two order parameters that are connected by the nodes.
The size of nodes in each circle is various, which means that each order parameter participates in the synergy dynamics of Nexus system to a different extent. The order parameter with the largest weighted average, that is, the node occupies the dominate position in the network, mainly comes from the food subsystem, especially related to food production (F1, F2). It means that changes of other order parameters are more likely to affect food production activities, thus ensuring a stable supply of water and energy is critical to food security. Node position regarding water-related order parameters are relatively backward and greatly varies, which indicates that most order parameters (W1, W2) in the water subsystem are more independent and changes of other subsystems have little driving effect on them. As for energy subsystem, the node position about energy supply is backward, while the node position of energy demand is forward. When compared with other energy demand sectors (E7, E8), the node of energy for food manufacture (F6) is larger, for it not only maintains high synergy degree with food production, but also as one of the most energy-intensive sectors [49].
4.3. Centrality Analysis of Synergetic Networks
By using the Ucinet, Table 4 shows the centralities of synergetic networks of Nexus system in Shenzhen from 2010 to 2016.
4.3.1. Degree Centrality
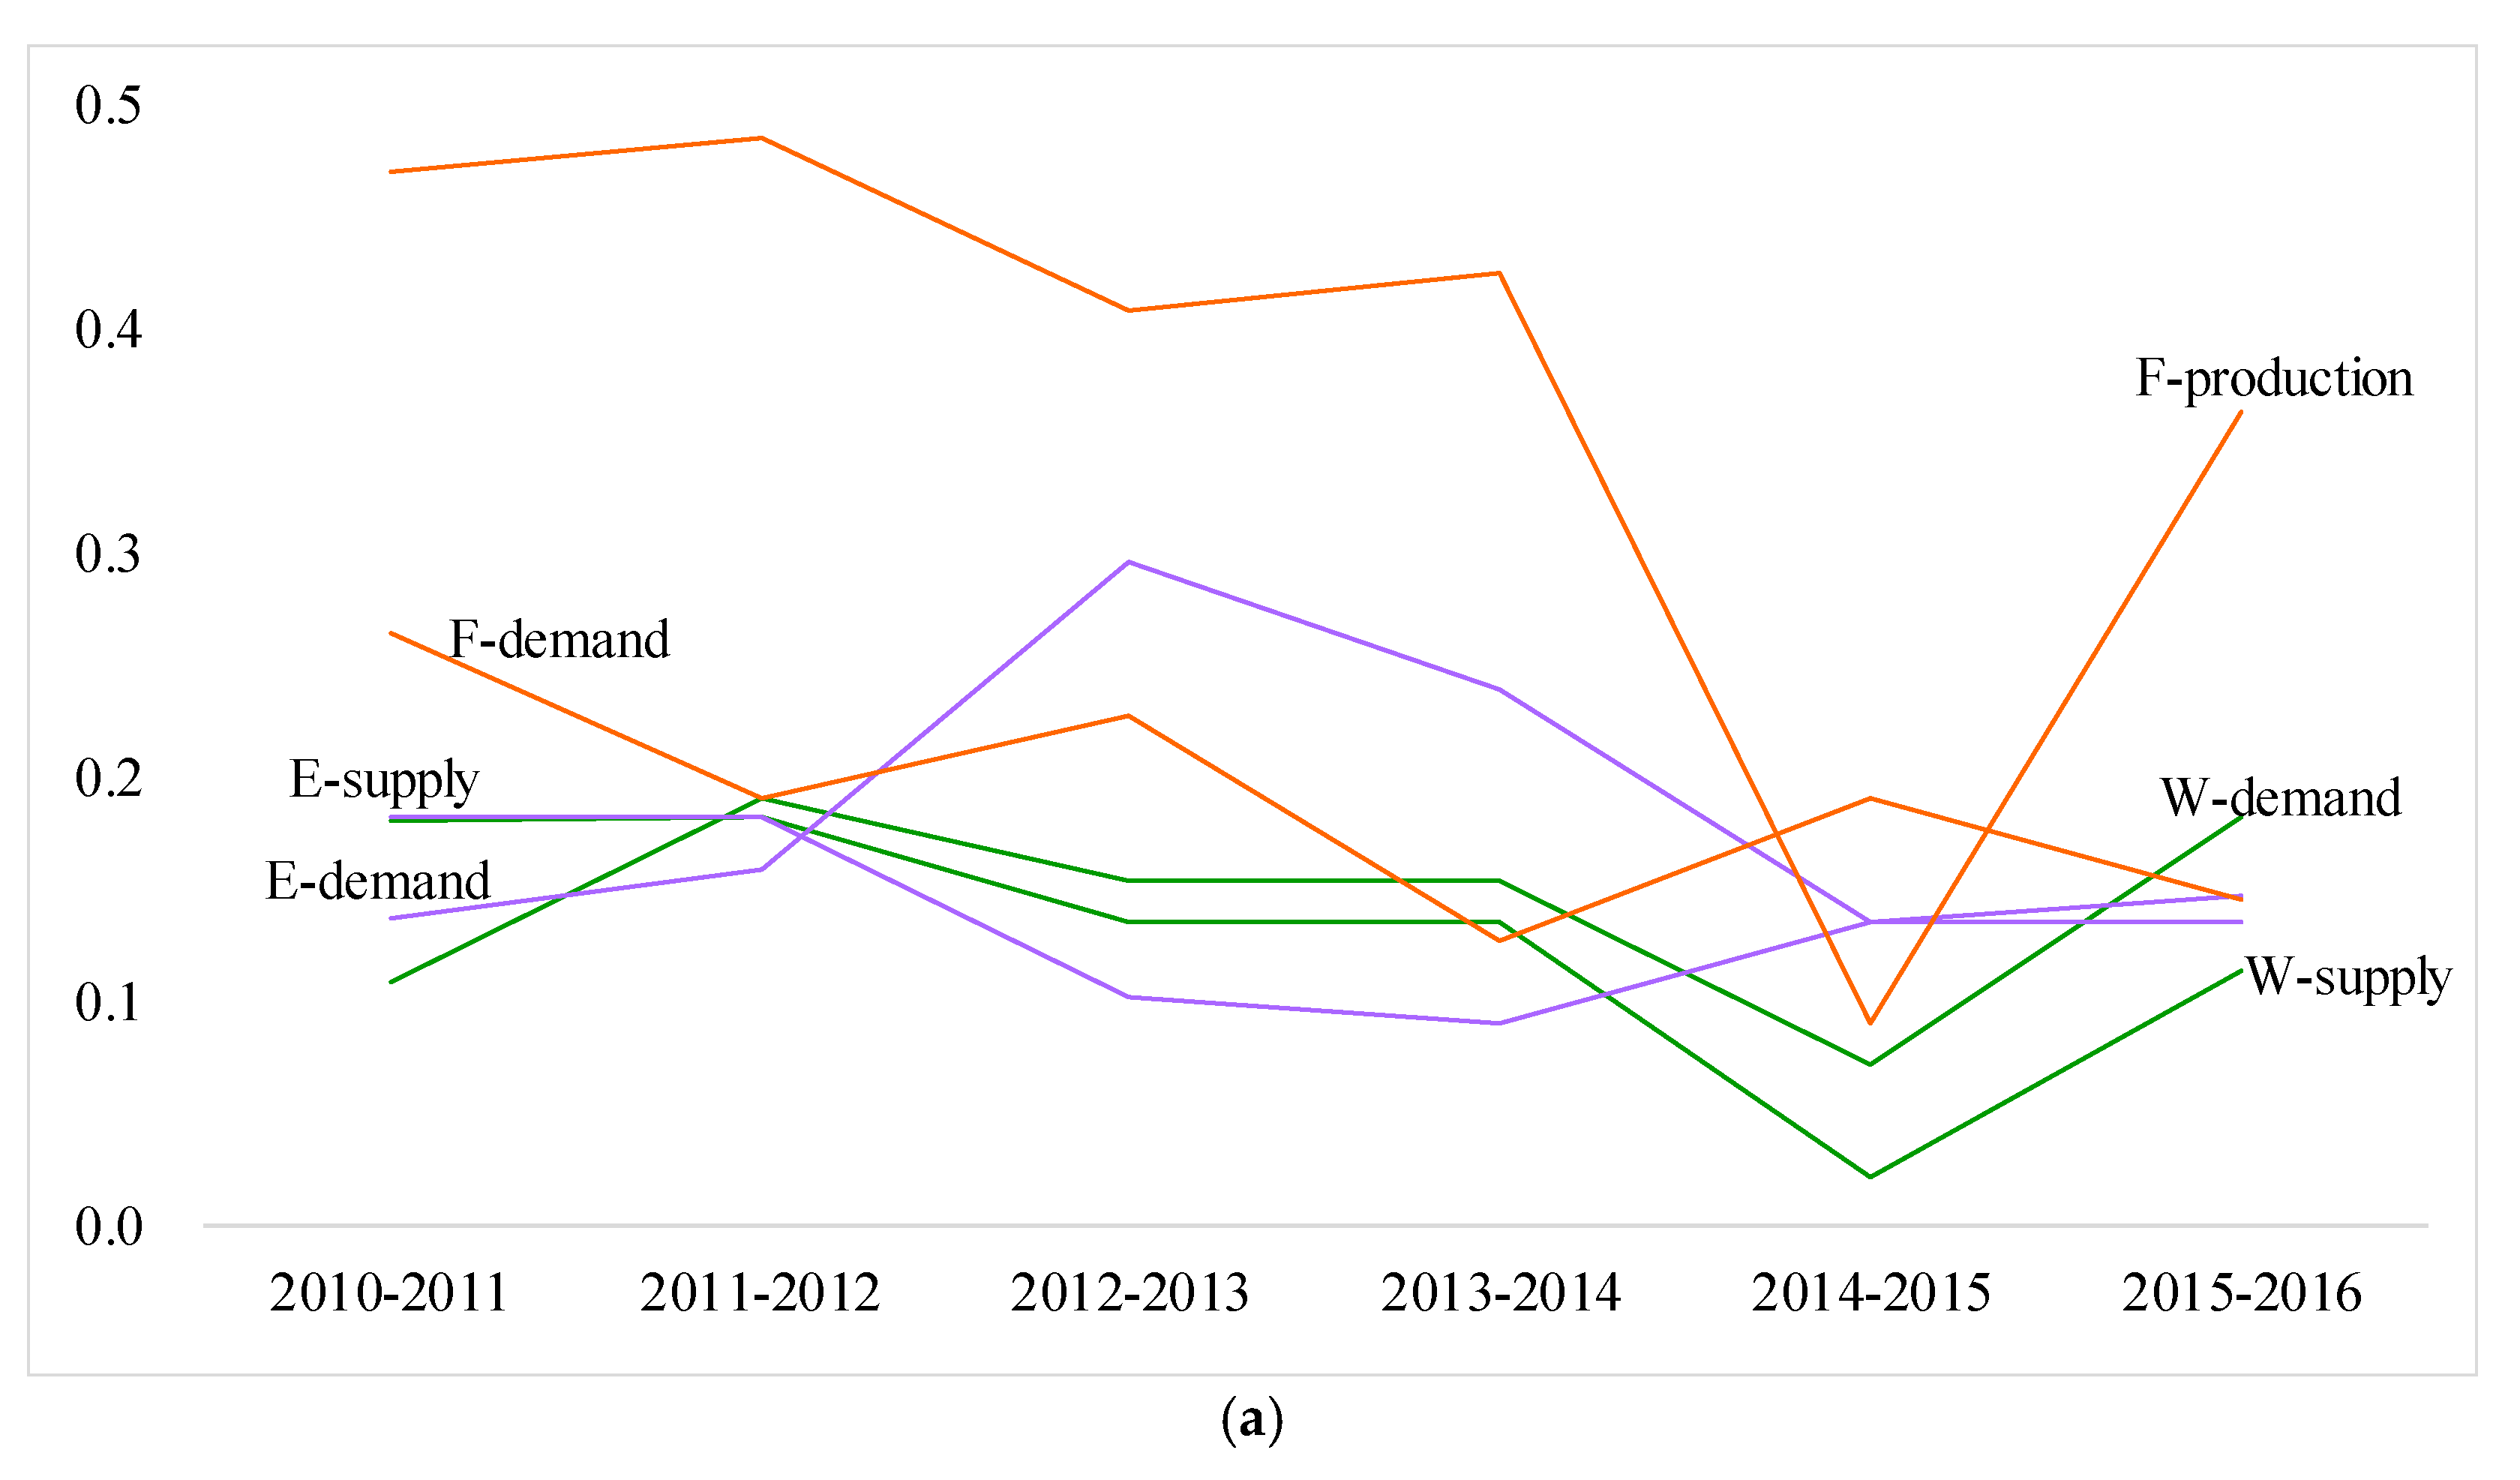
The degree centrality of synergetic network reached the highest in 2011–2012 by 22.13%, reflecting that the overall synergies of the Nexus system is the best. In this period, the degree centrality of the F-supply subsystem reached the peak value, while other subsystems were relatively low, but close to each other. The degree centrality reached the lowest in 2014–2015 by 11.86%. In addition to the sharp decrease of F-production subsystem, the water subsystem also significantly decreased. The change of water related order parameters will cause the fluctuation of the order parameters in F-production in larger amplitude since W-supply and W-demand directly affect F-production, which is shown in Figure 4a where the lines of W-demand, W-supply, and F-production change in the same direction. Given the food security threatened by the instability of food production, Shenzhen has adjusted its food supply through food import, so the F-supply line is relatively stable and opposite to that of F-production.
4.3.2. Betweenness Centrality
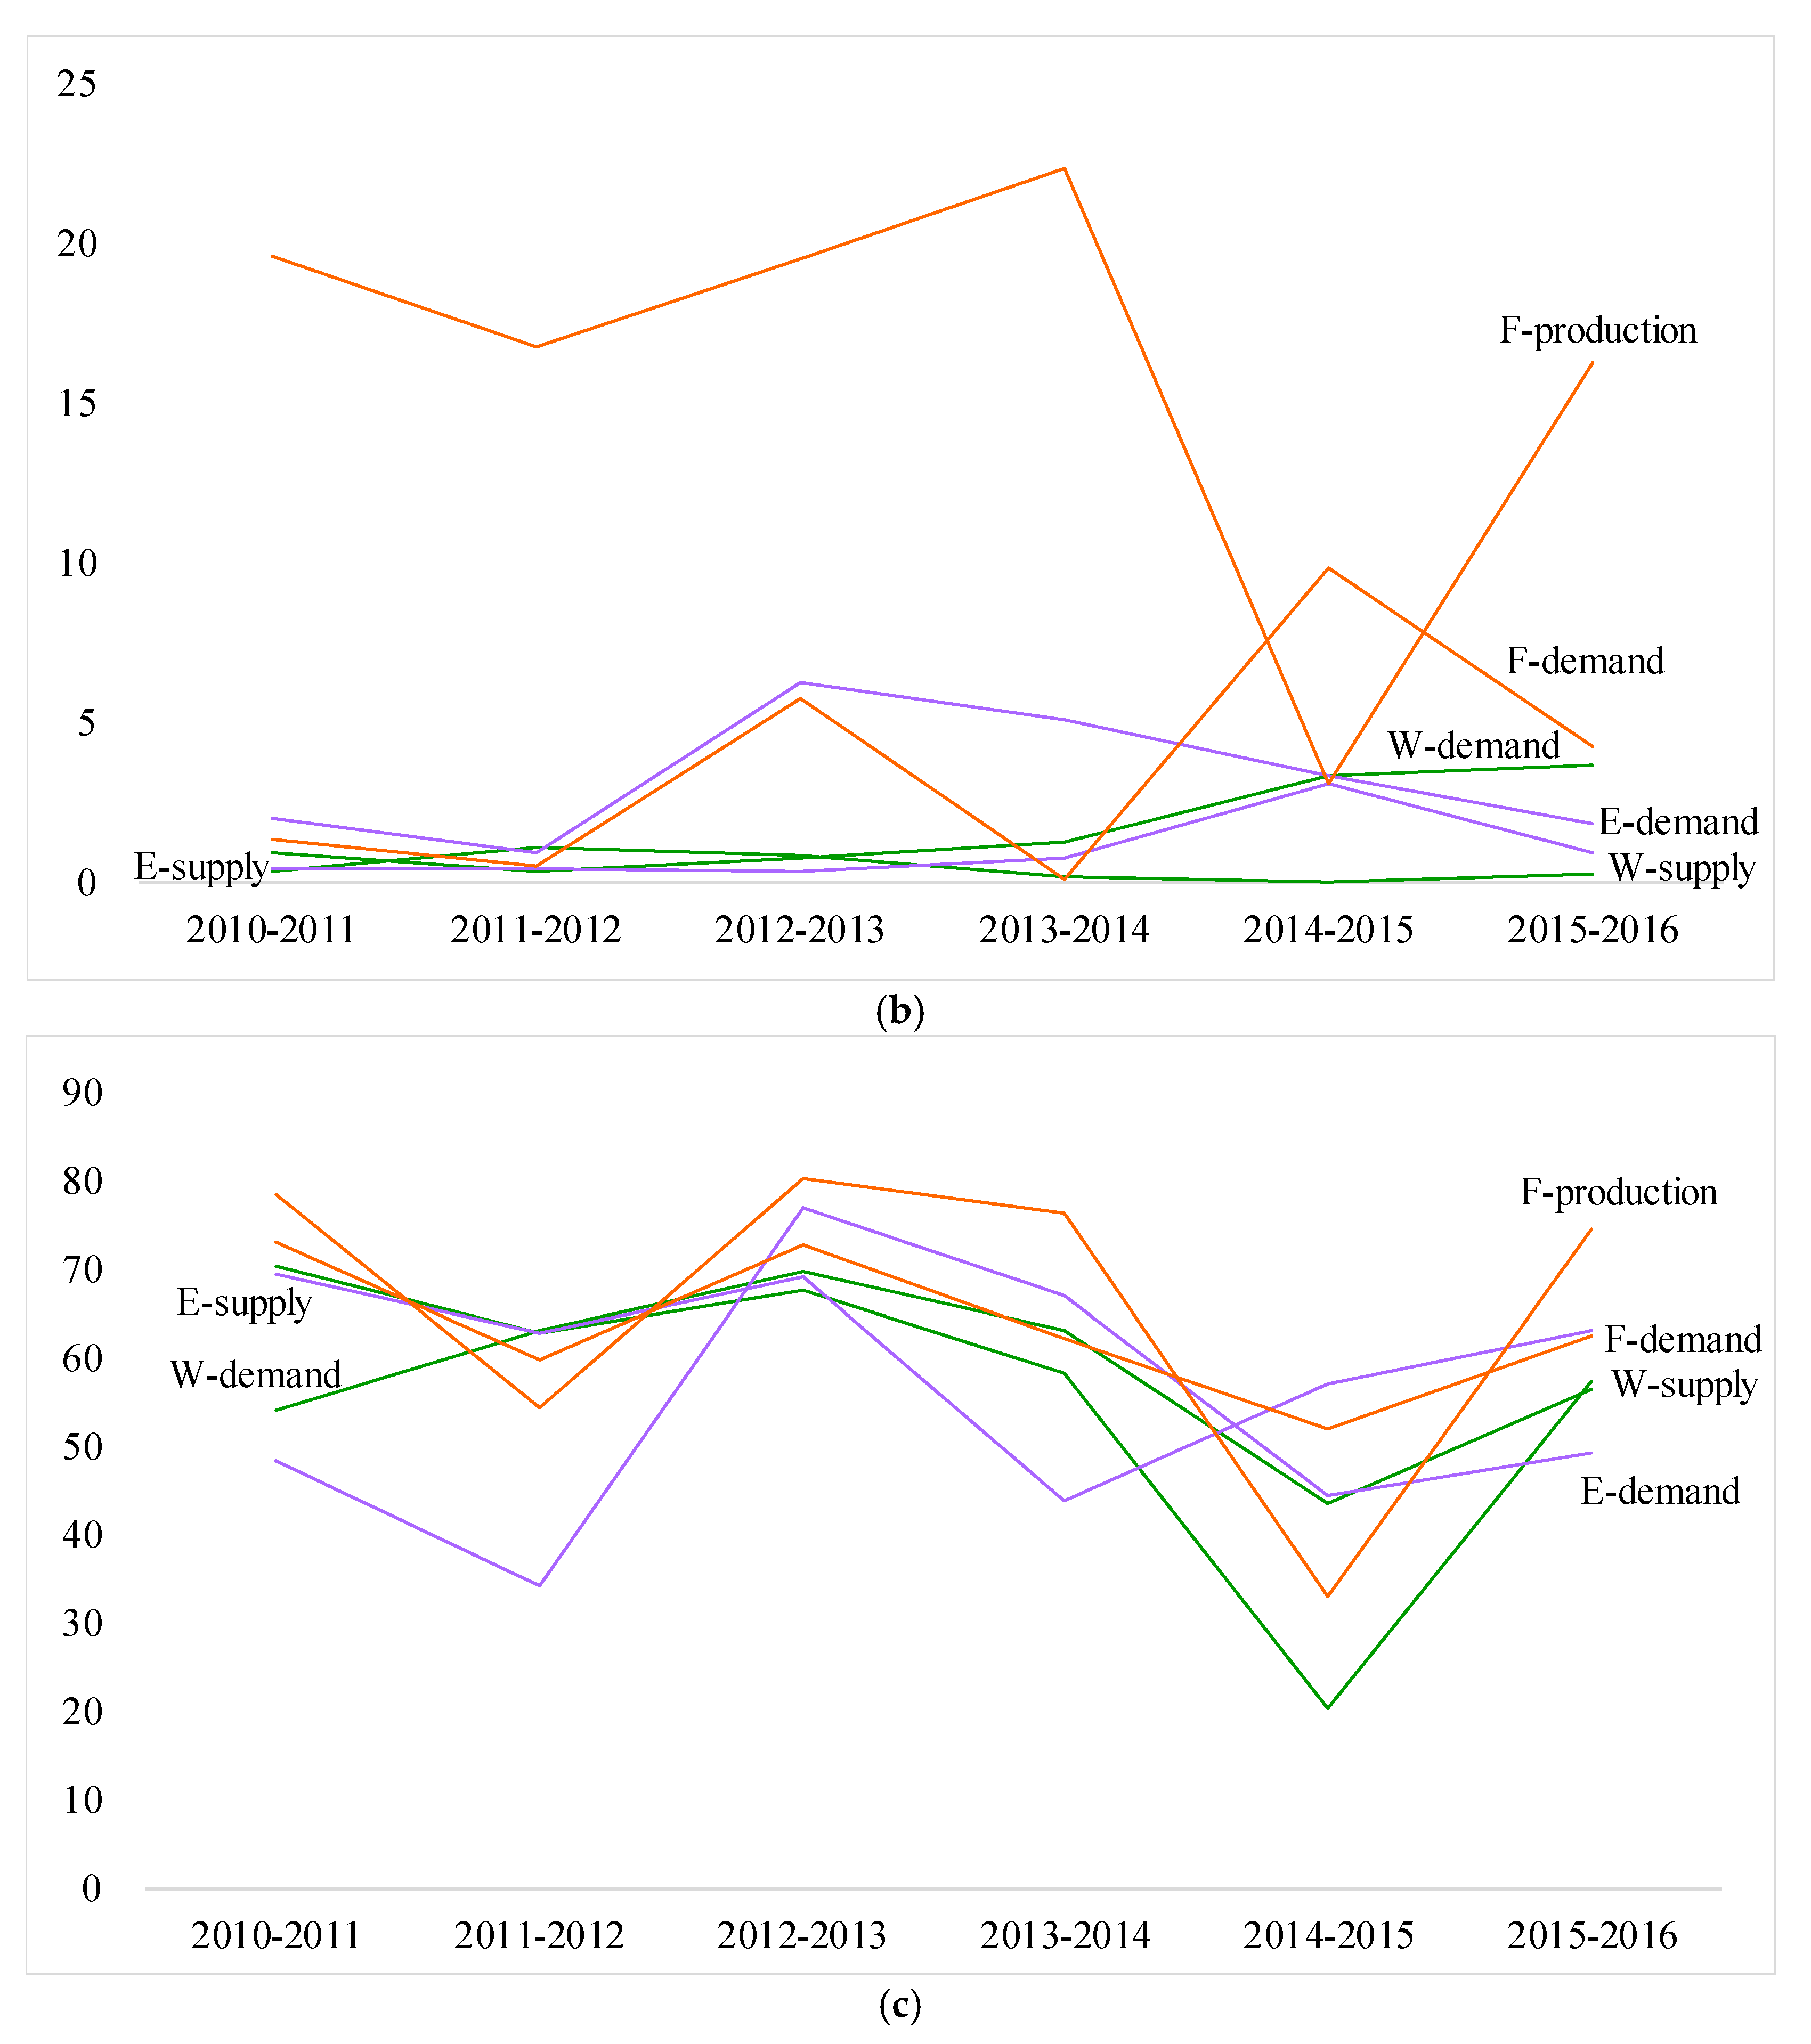
The betweenness centrality of the synergetic network fell to the lowest at 2.71 in 2011–2012 and rose to 5.2 in 2012–2013, and then kept stable between 4.2 and 4.4. In Figure 4b, the order parameters related to F-production still occupy a high position. These order parameters heavily depend on the input of irrigation water and energy and affect the output of agricultural products, so they act as the “bridge”. In 2014–2015, as the agricultural water supply and agricultural production declined, the ability of F-production to control the network declined accordingly. In the whole system, the betweenness centrality of water subsystem is the lowest, especially for the W-supply. With regard to surface water, underground water and transferred water, the factors that affect W-supply mainly come from outside the Nexus; hence, the order parameters within the water subsystem rarely play the role of “bridge”.
4.3.3. Closeness Centrality
From 2010 to 2016, the closeness centrality of the Nexus system repeatedly fluctuated, but the direction of all subsystems was shown to be consistent. In Figure 4c, the closeness centrality of system reached the maximum in 2012–2013, especially for E-demand and F-production. It means that there are relatively short pathways when the order parameters in these two subsystems connected with others. In 2014–2015, except for F-supply, the closeness centrality in other subsystems all reached the minimum, which means that the great instabilities within the Nexus happened in 2015. While taking the W-demand as the example, the total water demand increased by only 0.5% every year from 2010 to 2014, while it grew to around 3% from 2014 to 2015, which was mainly caused by the water used for the expansion of cash crops.
5. Governance Implications
This paper combines the synergy degree with causal path within WEF-Nexus in order to reveal the governance implications of the synergies (see Figure 5). Nexus-governance can be improved according to the synergy degree in causal path to effectively achieve cross-sectoral cooperation. More importantly, the priority of governance policies can be determined by weighing the synergy degree among different causal paths.
In the water subsystem, the synergy degree among water supply, water conservation, and water demand is not relatively high. This is because the water supply is more likely to be affected by natural factors, while the water demand significantly depends on the human activities. From 2013 to 2014, water supply in Shenzhen increased by 2.3%, while water demand increased by 2.9%, which resulted in a decline of water conservation. In the next period, the water supply increased by 7.6%, while the water demand just increased by 4.4%, leading to the recovery of water storage. The inconsistent changes between water supply and demand increase the instability of water subsystem and order parameters in the energy and food subsystem that highly rely on water resources. As the Shenzhen is located in monsoon-dominated river delta, high temporal variability in water use and availability will aggravate the water crisis [57]. Therefore, for water supply with the greatest uncertainty, the water governance sector needs to carefully plan the amount of water for consumption according to the supply capacity of the year. If water supply is insufficient, then water demand needs to be reduced accordingly and water stored in reservoirs or groundwater can be appropriately extracted. In general, these three order parameters should synchronously increase or decrease, and the current situation in which one is increased while the other is decreased should be avoid.
In the energy subsystem, the synergy degree among energy stock, energy allocation from outside, and over outside is not high as well, in that the amount of energy imports and exports depend on human activities, and it is no easy job to coordinate the two because of the diversity of energy and dispersion of energy users. Therefore, managing the amount of energy imports and exports in an integrative way is essential. If energy demand increases in a given year, the transmission through energy production might lead to a reduction of energy stock. In this case, city needs to increase energy from outside and reduce over outside. As the energy sector not only consumes energy, but also produces secondary energy, it keeps a high synergy degree with the energy demand (0.58). In the case of energy supply crisis, priority should be given to guarantee the energy demand from energy sectors. Afterwards, when considering the energy supply for water sectors (0.43) that connected many order parameters in water subsystem and cross-sector coordination is of great importance here.
Food production mainly relies on the water supply, whether planting, dairy farming, or fisheries. The degree of dependence on water resources shown in different agricultural types varies greatly, which leads to the variation of synergy degree between them and water supply. For example, there is a high synergy degree between water demand, sown areas, and crops yield, but the fishery and dairy sectors consume less water. Even if the water supply changes greatly, the effect on egg, milk, and meat products will be relatively small. In terms of the impact on total food output, the output of aquatic products, egg, and milk products is greater than that of grain and meat. This reflects the characteristic of coastal city with high urbanization rate, but it is also affected by the sharp reduction in crops planting areas and meat production in recent years. In this case, the food production pattern should be reconsidered in response to the changes of urban food consumption structure. In addition, the relative benefits of the food sectors should be weighed and alternative strategies of food imports adopted in due course. Food production requires large amounts of water that may crowd out the water demand from other sectors. Meanwhile, the economic benefits that are generated by agricultural sectors are much lower than the industrial sectors, so local agricultural should be reduced to increase the water supply for industries, and the treated industrial wastewater can also be re-deployed in food production and processing. In fact, Shenzhen has already taken some actions. In the past 20 years, the crop planting area in Shenzhen has shrunk by 63.8%.
6. Discussion and Conclusions
This paper developed an integrated approach by combining the synergetic model with network analysis to reveal the synergies of urban WEF-Nexus. When compared with the traditional Nexus modeling, the biggest difference of synergetic model is that all kinds of synergies between the elements of Nexus could be measured. Besides, the network analysis can further filter out the dominant factors with a high synergy degree. Until now, many debates on Nexus just take it as guidance for cross-sectoral or multi-stakeholder tradeoffs [16,58], with little attention being paid to the Nexus quantification. Although some other researches assessed the influence of one resource fluctuation on the other two resources, they largely concerned about the Nexus interlinkages from different point of departure separately. For example, from the point of water, Karimi et al. estimated that extracting 1 m3 groundwater for agricultural requires 0.826 kWh of energy in Iran, which is three times larger than India, as the groundwater tables in Iran are dropping rapidly [59]. Jalilov et al. started from energy and found that the dam building on Vakhsh River will expand more than the double energy capacity for upstream country, while having a negative impact on downstream irrigated agriculture by 37% decline [38]. El Gafy et al. applied the Nexus approach to food production in Egypt. They calculated that 11 million USD could be gained if the proposed cropping pattern is implemented; meanwhile, the water and energy savings would be about 1.9 km3 and 1006TJ respectively [60]. However, the Nexus complexity will varies greatly depending on the regional features, and any type of current Nexus was hardly extended to other situations. To a great extent, the regional Nexus should be considered as a holistic system, which consist of as many Nexus forms as possible. The significance of this paper is to construct a comprehensive framework for better resolving the Nexus, not only for megacities in developing countries, also for the sustainable resource governance at the regional and cross-regional scales.
The synergies and trade-offs among order parameters within the Nexus system are always in the process of dynamic changes in the context of urban resources governance. There are many other approaches to facilitate the cross-sectoral cooperation outside the current Nexus. For example, resources supply channels can be expanded by adopting incentive policies. Shenzhen makes great efforts to develop clean energy, like solar energy, wind energy, and tidal energy, under the background of building low-carbon city, which not only raises the energy supply, but also optimizes the structure of energy consumption. In 2018, the proportion of clean energy use in Shenzhen reached 85%, while the importance of fossil fuels in energy system dramatically dropped. Shenzhen also increased its water supply through desalination, with the amount of seawater utilization reaching 12.164 billion cubic meters in 2017. However, desalination consumes large amounts of energy and it requires cross-sectoral trade-offs. Moreover, sustainable governance can be achieved by efficiency promotion and waste reduction. For example, the price of resources can be regulated to guide citizens to form the habit of saving resources. Besides, improving urban infrastructures to increase the capacity of resource transportation and reduce the loss in transportation [61], optimizing industrial processes and waste recycling are all beneficial to sustainable governance.
This study also has some limitations. Firstly, the selection of order parameters in this paper significantly rely on the availability of data and some important order parameters in WEF-Nexus are omitted. For example, the resources waste and treatment have been the focus of the WEF-Nexus domain, while the order parameters that are related to WEF waste are not considered in this paper. In addition, the dietary behavior of city inhabitants is also essential for urban WEF-Nexus end-of-supply-chain solution [31,32]. Secondly, as an open system, the external factors, such as population, economy, technology, and environment, largely affect the changes of the WEF-Nexus. In recent years, the growths of population and resident income have both increased the demand for meat (F5) and aquatic products (F7), resulting in a high synergetic degree between these two parameters (0.59). Finally, the synergetic degree that u provided in this paper is only relative value and there is still a lack of baseline for scenarios comparation. Future work will apply the synergetic model to other cities in China and even around the world.
In conclusion, this paper has some valuable findings.
(1) Water subsystem has the lowest centralities but it dominates the Nexus system
The water subsystem shows low centralities in the synergetic network, which indicates that it has strong independence and great influence on other subsystems, so it dominates the synergy dynamics of Nexus system to a larger extent. Shenzhen should actively expand the water supply and increase the water storage in reservoirs to alleviate the potential water shortage according to the grow demand of water resources due to climate change and uneven inter-annual precipitation. Meanwhile, the energy sectors of water-intensive should pay attention to improving the production efficiency and reducing water consumption; the agricultural sectors can reduce sown areas and appropriately lower water consumption.
(2) Energy system is stable and critical to maintaining the orderly operation of Nexus system
The variation of synergetic degree of order parameters in the energy subsystem is the least obvious, especially for energy stock and energy demand. This means that stable energy supply can be guaranteed in Shenzhen. It is worth noting that the energy imports and exports in Shenzhen has a low synergetic degree with the energy stock, so it is necessary to balance the energy trade and local energy stock in the future. When compared to the food sector, there is greater synergies between the water sectors and energy subsystem, which suggests that the water order parameters are more sensitive to fluctuations of energy supply. Therefore, energy supply for water subsystem should be given priority when the city encounters energy shortage.
(3) Food subsystem has the highest centralities and has been dominated in Nexus system
The centralities of the food subsystem are significantly higher than that of the other two subsystems. This is because changes of order parameters of other subsystems are more likely to affect food production activities, and the stable supply of water and energy is crucial to urban food security. At the same time, the synergetic degree of order parameters in the food subsystem fluctuates greatly, mainly because of the reduction of sown areas and turning to the expansion of dairy farming and aquaculture in recent years. Currently, the output of local foods has been unable to meet the growing urban demand, which can be alleviated by expanding food imports, as well as helping to reduce the pressure from agricultural sectors on water and energy.
Author Contributions
The manuscript was produced through contributions of all authors. G.L. put forward the research idea and designed the research framework; Y.W. wrote the introduction and results analysis; Y.L. designed the indicator system and done the rest of the works.
Funding
This research was funded by National Natural Science Foundation of China (Grant No. 71473285, 71301175, 71401191), China Scholarship Council (Grant No. 201606495019), and the Graduate Research and Innovation Fund Project of Central University of Finance and Economics (Grant No.201715).
Conflicts of Interest
The authors declare no conflict of interest.
References
- Nhamo, L.; Ndlela, B.; Nhemachena, C.; Mabhaudhi, T.; Mpandeli, S.; Matchaya, G. The Water-Energy-Food Nexus: Climate Risks and Opportunities in Southern Africa. Water 2018, 10, 567. [Google Scholar] [CrossRef]
- Heard, B.R.; Miller, S.A.; Liang, S.; Xu, M. Emerging challenges and opportunities for the food–energy–water nexus in urban systems. Curr. Opin. Chem. Eng. 2017, 17, 48–53. [Google Scholar] [CrossRef]
- Uen, T.S.; Chang, F.J.; Zhou, Y.; Tsai, W.P. Exploring synergistic benefits of Water-Food-Energy Nexus through multi-objective reservoir optimization schemes. Sci. Total Environ. 2018, 633, 341–351. [Google Scholar] [CrossRef] [PubMed]
- Olsson, G. Water, energy and food interactions—Challenges and opportunities. Front. Environ. Sci. Eng. 2013, 5, 787–793. [Google Scholar] [CrossRef]
- Topi, C.; Esposto, E.; Govigli, V.M. The economics of green transition strategies for cities: Can low carbon, energy efficient development approaches be adapted to demand side urban water efficiency. Environ. Sci. Policy 2016, 58, 74–82. [Google Scholar] [CrossRef]
- Giupponi, C.; Gain, A.K. Integrated spatial assessment of the water, energy and food dimensions of the sustainable development goals. Reg. Environ. Chang. 2017, 17, 1881–1893. [Google Scholar] [CrossRef]
- Hoff, H. Understanding the Nexus, Background Paper for the Bonn 2011 Conference: The Water, Energy and Food Security Nexus; Stockholm Environment Institute: Stockholm, Sweden, 2011. [Google Scholar]
- Muller, M. The ‘Nexus’ as a step back towards a more coherent water resource management paradigm. Water Altern. 2015, 8, 675–694. [Google Scholar]
- Fishman, R.; Devineni, N.; Raman, S. Can improved agricultural water use efficiency save India’s groundwater. Environ. Res. Lett. 2015, 10, 084022. [Google Scholar] [CrossRef]
- Sishodia, R.P.; Shukla, S.; Wani, S.P.; Graham, W.D.; Jones, J.W. Future irrigation expansion outweigh groundwater recharge gains from climate change in semi-arid India. Sci. Total Environ. 2018, 635, 725–740. [Google Scholar] [CrossRef] [PubMed]
- Havlík, P.; Schneider, U.A.; Schmid, E.; Böttcher, H.; Fritz, S.; Skalský, R.; Aokia, K.; de Carae, S.; Kindermanna, G.; Kraxner, F.; et al. Global land-use implications of first and second generation biofuel targets. Energy Policy 2011, 39, 5690–5702. [Google Scholar] [CrossRef]
- Leck, H.; Conway, D.; Bradshaw, M.; Rees, J. Tracing the water-energy-food Nexus: Description, theory and practice. Geogr. Compass 2015, 9, 445–460. [Google Scholar] [CrossRef]
- World Economic Forum (WEF) Water Initiative. Water Security: The Water-Food-Energy-Climate Nexus; Island Press: Washington, DC, USA, 2010. [Google Scholar]
- Daher, B.T.; Mohtar, R.H. Water–energy–food (WEF) Nexus Tool 2.0: Guiding integrative resource planning and decision-making. Water Int. 2015, 40, 748–771. [Google Scholar] [CrossRef]
- Leese, M.; Meisch, S. Securitising sustainability? Questioning the ‘water, energy and food-security nexus’. Water Altern. 2015, 8, 695–709. [Google Scholar]
- Weitz, N.; Strambo, C.; Kemp-Benedict, E.; Nilsson, M. Closing the governance gaps in the water-energy-food nexus: Insights from integrative governance. Glob. Environ. Chang. 2017, 45, 165–173. [Google Scholar] [CrossRef]
- Vanham, D.; Leip, A.; Galli, A.; Kastner, T.; Bruckner, M.; Uwizeye, A.; Dijk, K.; Ercin, E.; Dalin, C.; Brandão, M.; et al. Environmental footprint family to address local to planetary sustainability and deliver on the SDGs. Sci. Total Environ. 2019, 693, 133642. [Google Scholar] [CrossRef] [PubMed]
- Campana, P.E.; Zhang, J.; Yao, T.; Andersson, S.; Landelius, T.; Melton, F.; Yan, J. Managing agricultural drought in Sweden using a novel spatially-explicit model from the perspective of water-food-energy nexus. J. Clean. Prod. 2018, 197, 1382–1393. [Google Scholar] [CrossRef]
- Damerau, K.; Patt, A.G.; van Vliet, O.P.R. Water saving potentials and possible trade-offs for future food and energy supply. Glob. Environ. Chang. 2016, 39, 15–25. [Google Scholar] [CrossRef]
- Kaddoura, S.; El Khatib, S. Review of water-energy-food Nexus tools to improve the Nexus modelling approach for integrated policy making. Environ. Sci. Policy 2017, 77, 114–121. [Google Scholar] [CrossRef]
- Karlberg, L.; Hoff, H.; Amsalu, T.; Andersson, K.; Binnington, T.; Flores-López, F.; de Bruin, A.; Gebrehiwot, S.G.; Gedif, B.; zur Heide, F.; et al. Tackling complexity: Understanding the food-energy-environment nexus in Ethiopia’s Lake tana sub-basin. Water Altern. 2015, 8, 710–734. [Google Scholar]
- Romero-Lankao, P.; McPhearson, T.; Davidson, D.J. The food-energy-water nexus and urban complexity. Nat. Clim. Chang. 2017, 7, 233. [Google Scholar] [CrossRef]
- Martinez-Hernandez, E.; Samsatli, S. Biorefineries and the food, energy, water nexus—Towards a whole systems approach to design and planning. Curr. Opin. Chem. Eng. 2017, 18, 16–22. [Google Scholar] [CrossRef]
- Mannschatz, T.; Wolf, T.; Hülsmann, S. Nexus Tools Platform: Web-based comparison of modelling tools for analysis of water-soil-waste nexus. Environ. Model. Softw. 2016, 76, 137–153. [Google Scholar] [CrossRef]
- Zhang, X.; Vesselinov, V.V. Integrated modeling approach for optimal management of water, energy and food security nexus. Adv. Water Resour. 2017, 101, 1–10. [Google Scholar] [CrossRef]
- Mannan, M.; Al-Ansari, T.; Mackey, H.R.; Al-Ghamdi, S.G. Quantifying the energy, water and food nexus: A review of the latest developments based on life-cycle assessment. J. Clean. Prod. 2018, 193, 300–314. [Google Scholar] [CrossRef]
- Tang, X.; Jin, Y.; Feng, C.; McLellan, B.C. Optimizing the energy and water conservation synergy in China: 2007–2012. J. Clean. Prod. 2018, 175, 8–17. [Google Scholar] [CrossRef]
- Qiu, J.; Carpenter, S.R.; Booth, E.G.; Motew, M.; Zipper, S.C.; Kucharik, C.J.; Chen, X.; Loheide, S.P., II; Seifert, J.; Turner, M.G. Scenarios reveal pathways to sustain future ecosystem services in an agricultural landscape. Ecol. Appl. 2018, 28, 119–134. [Google Scholar] [CrossRef] [PubMed]
- Miller-Robbie, L.; Ramaswami, A.; Amerasinghe, P. Wastewater treatment and reuse in urban agriculture: Exploring the food, energy, water, and health nexus in Hyderabad, India. Environ. Res. Lett. 2017, 12, 075005. [Google Scholar] [CrossRef]
- Hannibal, B.; Vedlitz, A. Throwing it out: Introducing a nexus perspective in examining citizen perceptions of organizational food waste in the US. Environ. Sci. Policy 2018, 88, 63–71. [Google Scholar] [CrossRef]
- Vanham, D.; Comero, S.; Gawlik, B.M.; Bidoglio, G. The water footprint of different diets within European sub-national geographical entities. Nat. Sustain. 2018, 1, 518–525. [Google Scholar] [CrossRef]
- Vanham, D.; Gawlik, B.M.; Bidoglio, G. Cities as hotspots of indirect water consumption: The case study of Hong Kong. J. Hydrol. 2017, 573, 1075–1086. [Google Scholar] [CrossRef] [PubMed]
- Wu, F.; Geng, Y.; Tian, X.; Zhong, S.; Wu, W.; Yu, S.; Xiao, S. Responding climate change: A bibliometric review on urban environmental governance. J. Clean. Prod. 2018, 204, 344–354. [Google Scholar] [CrossRef]
- Berardy, A.; Chester, M.V. Climate change vulnerability in the food, energy, and water nexus: Concerns for agricultural production in Arizona and its urban export supply. Environ. Res. Lett. 2017, 12, 035004. [Google Scholar] [CrossRef]
- Ozturk, I. The dynamic relationship between agricultural sustainability and food-energy-water poverty in a panel of selected Sub-Saharan African Countries. Energy Policy 2017, 107, 289–299. [Google Scholar] [CrossRef]
- National Bureau of Statistics (NBS). China City Statistical Book; China Statistics Press: Beijing, China, 2017.
- Water Resources Bureau of Shenzhen Municipality. Shenzhen Water Resources Bulletin; Shenzhen, China, 2018. Available online: http://www.sz.gov.cn/sswj/xxgk/zfxxgkml/szswgk/tjsj/szygb/201808/P020180925634551447544.pdf (accessed on 11 August 2019).
- Jalilov, S.M.; Keskinen, M.; Varis, O.; Amer, S.; Ward, F.A. Managing the water–energy–food nexus: Gains and losses from new water development in Amu Darya River Basin. J. Hydrol. 2016, 539, 648–661. [Google Scholar] [CrossRef]
- Sun, L.; Pan, B.; Gu, A.; Lu, H.; Wang, W. Energy–water nexus analysis in the Beijing–Tianjin–Hebei region: Case of electricity sector. Renew. Sustain. Energy Rev. 2018, 93, 27–34. [Google Scholar] [CrossRef]
- Ibarrola-Rivas, M.J.; Granados-Ramírez, R.; Nonhebel, S. Is the available cropland and water enough for food demand? A global perspective of the Land-Water-Food nexus. Adv. Water Resour. 2017, 110, 476–483. [Google Scholar] [CrossRef]
- Silalertruksa, T.; Gheewala, S.H. Land-water-energy nexus of sugarcane production in Thailand. J. Clean. Prod. 2018, 182, 521–528. [Google Scholar] [CrossRef]
- De Laurentiis, V.; Hunt, D.; Rogers, C. Overcoming food security challenges within an energy/water/food nexus (EWFN) approach. Sustainability 2016, 8, 95. [Google Scholar] [CrossRef] [Green Version]
- Salmoral, G.; Yan, X. Food-energy-water nexus: A life cycle analysis on virtual water and embodied energy in food consumption in the Tamar catchment, UK. Resour. Conserv. Recycl. 2018, 133, 320–330. [Google Scholar] [CrossRef]
- Gouma, P.I.; Simon, S.R.; Stanacevic, M. Nano-sensing and catalysis technologies for managing food-water-energy (FEW) resources in farming. Mater. Today 2016, 1, 40–45. [Google Scholar] [CrossRef]
- Cooke, S.J.; Allison, E.H.; Beard, T.D.; Arlinghaus, R.; Arthington, A.H.; Bartley, D.M.; Cowx, I.G.; Fuentevilla, C.; Leonard, N.J.; Lorenzen, K.; et al. On the sustainability of inland fisheries: Finding a future for the forgotten. Ambio 2016, 45, 753–764. [Google Scholar] [CrossRef] [PubMed] [Green Version]
- Pringle, A.M.; Handler, R.M.; Pearce, J.M. Aquavoltaics: Synergies for dual use of water area for solar photovoltaic electricity generation and aquaculture. Renew. Sustain. Energy Rev. 2017, 80, 572–584. [Google Scholar] [CrossRef] [Green Version]
- Lechón, Y.; De La Rúa, C.; Cabal, H. Impacts of Decarbonisation on the Water-Energy-Land (WEL) Nexus: A Case Study of the Spanish Electricity Sector. Energies 2018, 11, 1203. [Google Scholar] [CrossRef] [Green Version]
- Vilanova, M.R.N.; Balestieri, J.A.P. Exploring the water-energy nexus in Brazil: The electricity use for water supply. Energy 2015, 85, 415–432. [Google Scholar] [CrossRef]
- Compton, M.; Willis, S.; Rezaie, B.; Humes, K. Food processing industry energy and water consumption in the Pacific northwest. Innov. Food. Sci. Emerg. Technol. 2018, 47, 371–383. [Google Scholar] [CrossRef]
- Kibler, K.M.; Reinhart, D.; Hawkins, C.; Motlagh, A.M.; Wright, J. Food waste and the food-energy-water nexus: A review of food waste management alternatives. Waste Manag. 2018, 74, 52–62. [Google Scholar] [CrossRef] [PubMed]
- El Gafy, I.; Grigg, N.; Reagan, W. Dynamic behaviour of the water–food–energy Nexus: Focus on crop production and consumption. Irrig. Drain. 2017, 66, 19–33. [Google Scholar] [CrossRef]
- Vora, N.; Shah, A.; Bilec, M.M.; Khanna, V. Food–energy–water nexus: Quantifying embodied energy and GHG emissions from irrigation through virtual water transfers in food trade. ACS Sustain. Chem. Eng. 2017, 5, 2119–2128. [Google Scholar] [CrossRef]
- Dorny, C.N. A Vector Space Approach to Models and Optimization; Wiley: New York, NY, USA, 1975. [Google Scholar]
- Lee, D.L.; Chuang, H.; Seamons, K. Document ranking and the vector-space model. IEEE Softw. 1997, 14, 67–75. [Google Scholar] [CrossRef]
- Salje, E.; Devarajan, V. Phase transitions in systems with strain-induced coupling between two order parameters. Phase Transit. 1986, 6, 235–247. [Google Scholar] [CrossRef]
- Freeman, L.C. Centrality in social networks conceptual clarification. Soc. Netw. 1978, 1, 215–239. [Google Scholar] [CrossRef] [Green Version]
- Vanham, D.; Hoekstra, A.Y.; Wada, Y.; Bouraoui, F.; de Roo, A.; Mekonnen, M.M.; van de Bund, W.J.; Batelaan, O.; Pavelic, P.; Bastiaanssen, W.G.M.; et al. Physical water scarcity metrics for monitoring progress towards SDG target 6.4: An evaluation of indicator 6.4.2. “Level of water stress”. Sci. Total Environ. 2018, 613, 218–232. [Google Scholar] [CrossRef] [PubMed]
- Pittock, J.; Orr, S.; Stevens, L.; Aheeyar, M.; Smith, M. Tackling trade-offs in the nexus of water, energy and food. Aquat. Procedia 2014, 5, 58–68. [Google Scholar] [CrossRef]
- Karimi, P.; Qureshi, A.S.; Bahramloo, R.; Molden, D. Reducing carbon emissions through improved irrigation and groundwater management: A case study from Iran. Agric. Water Manag. 2012, 108, 52–60. [Google Scholar] [CrossRef]
- El Gafy, I.; Grigg, N.; Reagan, W. Water-food-energy nexus index to maximize the economic water and energy productivity in an optimal cropping pattern. Water Int. 2017, 42, 495–503. [Google Scholar] [CrossRef]
- Yang, Y.; Ng, S.T.; Zhou, S.; Xu, F.J.; Li, H. A physics-based framework for analyzing the resilience of interdependent civil infrastructure systems: A climate extreme event case in Hong Kong. Sustain. Cities Soc. 2019, 47, 101485. [Google Scholar] [CrossRef]
Figure 1.
Causal loop diagram within WEF-Nexus order parameters.

Figure 2.
The mean value of synergy degree of 23 order parameters in six periods.

Figure 3.
Evolution of synergetic networks in Shenzhen from 2010 to 2016.

Figure 4.
(a). Degree centrality of synergetic network from 2010 to 2016; (b). Betweenness centrality of synergetic network from 2010 to 2016; (c). Closeness centrality of synergetic network from 2010 to 2016.
Figure 4.
(a). Degree centrality of synergetic network from 2010 to 2016; (b). Betweenness centrality of synergetic network from 2010 to 2016; (c). Closeness centrality of synergetic network from 2010 to 2016.


Figure 5.
The causal path of order parameters and their synergy degree.


Table 1.
Water, energy, and food (WEF)-Nexus subsystems, attributes, and order parameters.
| Subsystems | Attributes | Order Parameters |
|---|---|---|
| Water-Subsystem | Supply | supply quantity, conservation quantity |
| Demand | total water demand, water for agricultural, dairy farming, fishery, and power generation | |
| Energy-Subsystem | Supply | allocation from outside, allocation over outside, energy stock, energy production |
| Demand | total energy demand, energy for energy related sectors, water related sectors, and food manufacture | |
| Food-Subsystem | Production | gross value of agriculture, total sown areas, cultured areas of aquatic |
| Demand | yield of major farm crops, total output of meat, eggs and milk output, aquatic products, food imports |
Table 2.
Causal paths of order parameters examined by literature.
| No. | Causal Paths | Relevant Literature |
|---|---|---|
| ① | water conservation→power generation→electricity (for food production as well) | [38,39] |
| ② | water conservation→total sown areas→yield of major farm crops (with energy embedded in) | [40,41] |
| ③ | water consumption→water for dairy farming→total output of meat (with energy embedded in) | [42,43] |
| ④ | water consumption→water for dairy farming→eggs and milk output (with energy embedded in) | [44] |
| ⑤ | water consumption→water for fishery→aquatic products (with energy embedded in) | [45] |
| ⑥ | water consumption→cultured areas of aquatic→aquatic products (with energy embedded in) | [46] |
| ⑦ | energy production→energy consumption→energy-related sectors (with water embedded in) | [27,47] |
| ⑧ | energy production→energy consumption→water-related sectors→water consumption | [48] |
| ⑨ | energy production→energy consumption →manufacture of food (with water embedded in) | [49,50] |
| ⑩ | energy-related industries→energy production (with water embedded in) | [23] |
| ⑪ | food imports→gross output of agriculture (with water and energy embedded in) | [51,52] |
Table 3.
The eigenvectors under WEF-Nexus order parameters.
| No. | Order Parameters | Eigenvectors |
|---|---|---|
| W1 | water supply quantity | volume of water diversion, surface water, groundwater, and other sources |
| W2 | water conservation quantity | volume of total water conservation; number of reservoirs, and water supply reservoirs |
| W3 | total water demand | volume of water consumption for whole city, residential sector, and industrial sector |
| W4 | water for agricultural | demand of paddy field, irrigated land, vegetable field, timber trees and fruit trees |
| W5 | water for dairy farming | demand of meadow, and livestock (consumption of water & water for consumption) |
| W6 | water for fishery | volume, average per mu and ratio of replenishment of fishponds |
| W7 | water for power generation | capacity, consumption rate and ratio of thermal power generation |
| E1 | energy allocation from outside | allocation from other provinces, and imports |
| E2 | energy allocation over outside | allocation over other provinces, and exports |
| E3 | energy stock | volume of energy stock at the beginning and end of the year, losses, and local consumption |
| E4 | energy production | output of primary energy, and electricity |
| E5 | total energy demand | volume of end-use, primary industry, and residential demand; total electricity demand |
| E6 | energy for food manufacture | volume of gasoline, diesel oil, and electricity |
| E7 | energy for energy related sectors | volume of gasoline, diesel oil, natural gas, and electricity |
| E8 | energy for water related sectors | volume of diesel oil, natural gas, and electricity |
| F1 | gross value of agriculture | value of planting, animal husbandry, fishery, and agricultural services |
| F2 | total sown areas | areas of grain crops, cash crops, other crops, and orchards |
| F3 | cultured areas of aquatic | areas of seawater, and freshwater |
| F4 | yield of major farm crops | yield of grain, peanuts, vegetable, and fruits |
| F5 | total output of meat | number of cattle, raised hogs, and raised poultry; output of meat sold |
| F6 | eggs and milk output | number of milk cows, output of milk, and fresh eggs |
| F7 | aquatic products | volume of seawater aquatic products, and freshwater aquatic products |
| F8 | food imports | value of imports of farm production, and food |
Table 4.
Centralities of synergetic networks in Shenzhen from 2010 to 2016.
| Degree Centrality | Betweenness Centrality | Closeness Centrality | ||||
|---|---|---|---|---|---|---|
| Mean | Std Dev | Mean | Std Dev | Mean | Std Dev | |
| 2010–2011 | 21.34 | 0.19 | 3.52 | 9.89 | 64.53 | 21.27 |
| 2011–2012 | 22.13 | 0.2 | 2.71 | 7.99 | 56.13 | 22.95 |
| 2012–2013 | 21.74 | 0.16 | 5.2 | 9.47 | 72.73 | 8.68 |
| 2013–2014 | 18.57 | 0.16 | 4.25 | 11.05 | 61.53 | 15.48 |
| 2014–2015 | 11.86 | 0.11 | 4.39 | 8.22 | 44.57 | 21.77 |
| 2015–2016 | 17.79 | 0.14 | 4.37 | 7.13 | 60.08 | 19.98 |
© 2019 by the authors. Licensee MDPI, Basel, Switzerland. This article is an open access article distributed under the terms and conditions of the Creative Commons Attribution (CC BY) license (http://creativecommons.org/licenses/by/4.0/).
Share and Cite
MDPI and ACS Style
Li, G.; Wang, Y.; Li, Y. Synergies within the Water-Energy-Food Nexus to Support the Integrated Urban Resources Governance. Water 2019, 11, 2365. https://doi.org/10.3390/w11112365
AMA Style
Li G, Wang Y, Li Y. Synergies within the Water-Energy-Food Nexus to Support the Integrated Urban Resources Governance. Water. 2019; 11(11):2365. https://doi.org/10.3390/w11112365
Chicago/Turabian StyleLi, Guijun, Yongsheng Wang, and Yulong Li. 2019. "Synergies within the Water-Energy-Food Nexus to Support the Integrated Urban Resources Governance" Water 11, no. 11: 2365. https://doi.org/10.3390/w11112365
Note that from the first issue of 2016, this journal uses article numbers instead of page numbers. See further details here.