Reduction of Potable Water Consumption and Sewage Generation on a City Scale: A Case Study in Brazil


Laboratory of Energy Efficiency in Buildings, Department of Civil Engineering, Federal University of Santa Catarina, Florianópolis 88040-900, SC, Brazil
*
Author to whom correspondence should be addressed.
Water 2019, 11(11), 2351; https://doi.org/10.3390/w11112351
Submission received: 27 September 2019
/
Revised: 31 October 2019
/
Accepted: 5 November 2019
/
Published: 8 November 2019
(This article belongs to the Section Water Use and Scarcity)
Abstract
:This article aims to estimate the reduction of potable water consumption and sewage generation in the city of Joinville, southern Brazil. Four strategies were considered to promote potable water savings: replacement of conventional toilets with dual-flush ones, greywater reuse, rainwater harvesting, and the combination of these three strategies. Residential, public, and commercial sectors were assessed. The potential for potable water savings ranged from 1.7% to 50.5%, and the potential for sewage generation reduction ranged from 2.1% to 52.1%. The single-family residential sector was the most representative for water savings and sewage generation reduction. The public sector would be the least contributor to such reductions. It was found that in the city of Joinville, for low non-potable water demands, greywater reuse was the most viable strategy to save water. When non-potable demand is high and there is a large catchment area, it is recommended to install rainwater harvesting systems. It was concluded that there is a high potential for potable water savings and reduction of sewage generation if measures were adopted in Joinville, but it is necessary to evaluate which strategy is the most appropriate for each building.
1. Introduction
Access to drinking water is a basic need for human development [1]. However, population increase and people concentration in certain regions, as well as changes in water consumption patterns, affect the quantity of available water, and this may hinder potable water supply in many parts of the world [2]. In addition, water supply systems must maintain the quality of water supplied to users. Failure to meet the required standards for potable water quality endangers the safety of users and reduces the reliability of public water supply systems [3].
In order to promote potable water savings in buildings, several studies about water-saving plumbing fixtures, greywater reuse, and rainwater harvesting have been carried out [2,4,5,6,7,8,9,10,11,12]. In these studies, the authors determined potable water savings in buildings due to the adoption of one or more of these strategies. In a dwelling, water savings could be 28.9% by replacing conventional plumbing fixtures with water-saving ones, 21.0% with greywater reuse, and 30.7% with rainwater harvesting [2]. The combination of greywater reuse and rainwater harvesting systems could reduce water consumption by up to 46.3% in a public school [6], 48% in a university campus [8], and 29% in a university dormitory [11]. The use of water-saving plumbing fixtures combined with rainwater harvesting systems reduced the water consumption by approximately 15% in residential buildings [12]. Savings could reach 78.9% in commercial buildings by combining the installation of water-saving plumbing fixtures, greywater reuse, and rainwater harvesting [7]. Some studies, in addition to assessing the potential for water savings, have also investigated the economic feasibility of installing these strategies [4,5,9,11], the sewage generation reduction [2,8] and the embodied energy [2,7] of implementing them, and the effects of climate change on the water savings provided by them [10].
However, few studies have evaluated the implementation of these strategies for water savings at larger scales. The adoption of these measures at larger scales can provide benefits beyond the building itself. For example, rainwater harvesting systems, if used on a large scale, could contribute to reducing the surface runoff [13] and floods in urban areas [14,15]. Also, water utilities would reduce their costs related to water withdrawal, treatment, and distribution if there was a significant reduction of potable water consumption in their operation area. Campisano et al. [16] researched the implementation of rainwater harvesting systems at a large scale in Lipari, an island located in southern Italy. They studied multi-family residential buildings and considered the use of rainwater for supplying non-potable water demand. The authors verified that in 94% of these buildings in Lipari, rainwater harvesting systems might reduce water consumption between 30% and 50%. Proença et al. [17] investigated potable water savings in the city of Florianópolis, southern Brazil. They concluded that the simultaneous adoption of water-saving plumbing fixtures, greywater reuse and rainwater harvesting in all residential, commercial, and public buildings of the city, could allow for water savings up to 10,153,835 m3/year (40.2% of total potable water consumption in the city).
In addition to water savings, the replacement of conventional plumbing-fixtures with water-saving ones and the greywater reuse also contribute to decreasing sewage generation in buildings [2]. Regarding water-saving plumbing fixtures, the water consumption reduction in a plumbing-fixture decreases the sewage generation. For greywater reuse, there is a decrease in sewage generation because some effluents are reused before being sent to the sewage treatment plant. In the research conducted by Proença et al. [17], the sewage generation reduction could reach 2,064,968 m3/year in Florianópolis with the implementation of water-saving plumbing fixtures and greywater reuse systems (17.7% of total sewage generation in the city).
In this context, this article aims to estimate the potential for reducing potable water consumption and sewage generation in the city of Joinville, southern Brazil, the most populous city in Santa Catarina state. Residential, public, and commercial sectors of the city were evaluated considering four strategies for water savings (replacement of conventional toilets with dual-flush ones, greywater reuse, rainwater harvesting, and the simultaneous adoption of these three strategies). Besides analysing different strategies and comparing them with each other, several scenarios of water end-uses in buildings were also considered. Therefore, a range of potable water savings was defined instead of an average figure, and this makes the results closer to the real in case of adopting one of these strategies on a city scale. The greater the reductions in water consumption and sewage generation, the lower the utility’s expenses, so the results presented could be useful for the local utility to investigate the financial savings related to the volume of water saved on a city scale. Therefore, this study could encourage utilities to support the installation of strategies to reduce potable water consumption in buildings, as it shows that the benefits can go beyond the building itself if these strategies are adopted on a large scale. The method presented in this paper could be applied to other cities.
2. Methods
In order to reach the objective of this article, water end-use scenarios were determined for each building sector. The potential for reducing potable water consumption and sewage generation was determined for all end-use scenarios. The scenarios that provided the minimum and maximum water savings in each building sector were identified, and for these cases, the corresponding potential for reducing sewage was determined. Based on these potentials, the possible ranges of reduction of potable water consumption and sewage generation were estimated.
2.1. Study Area
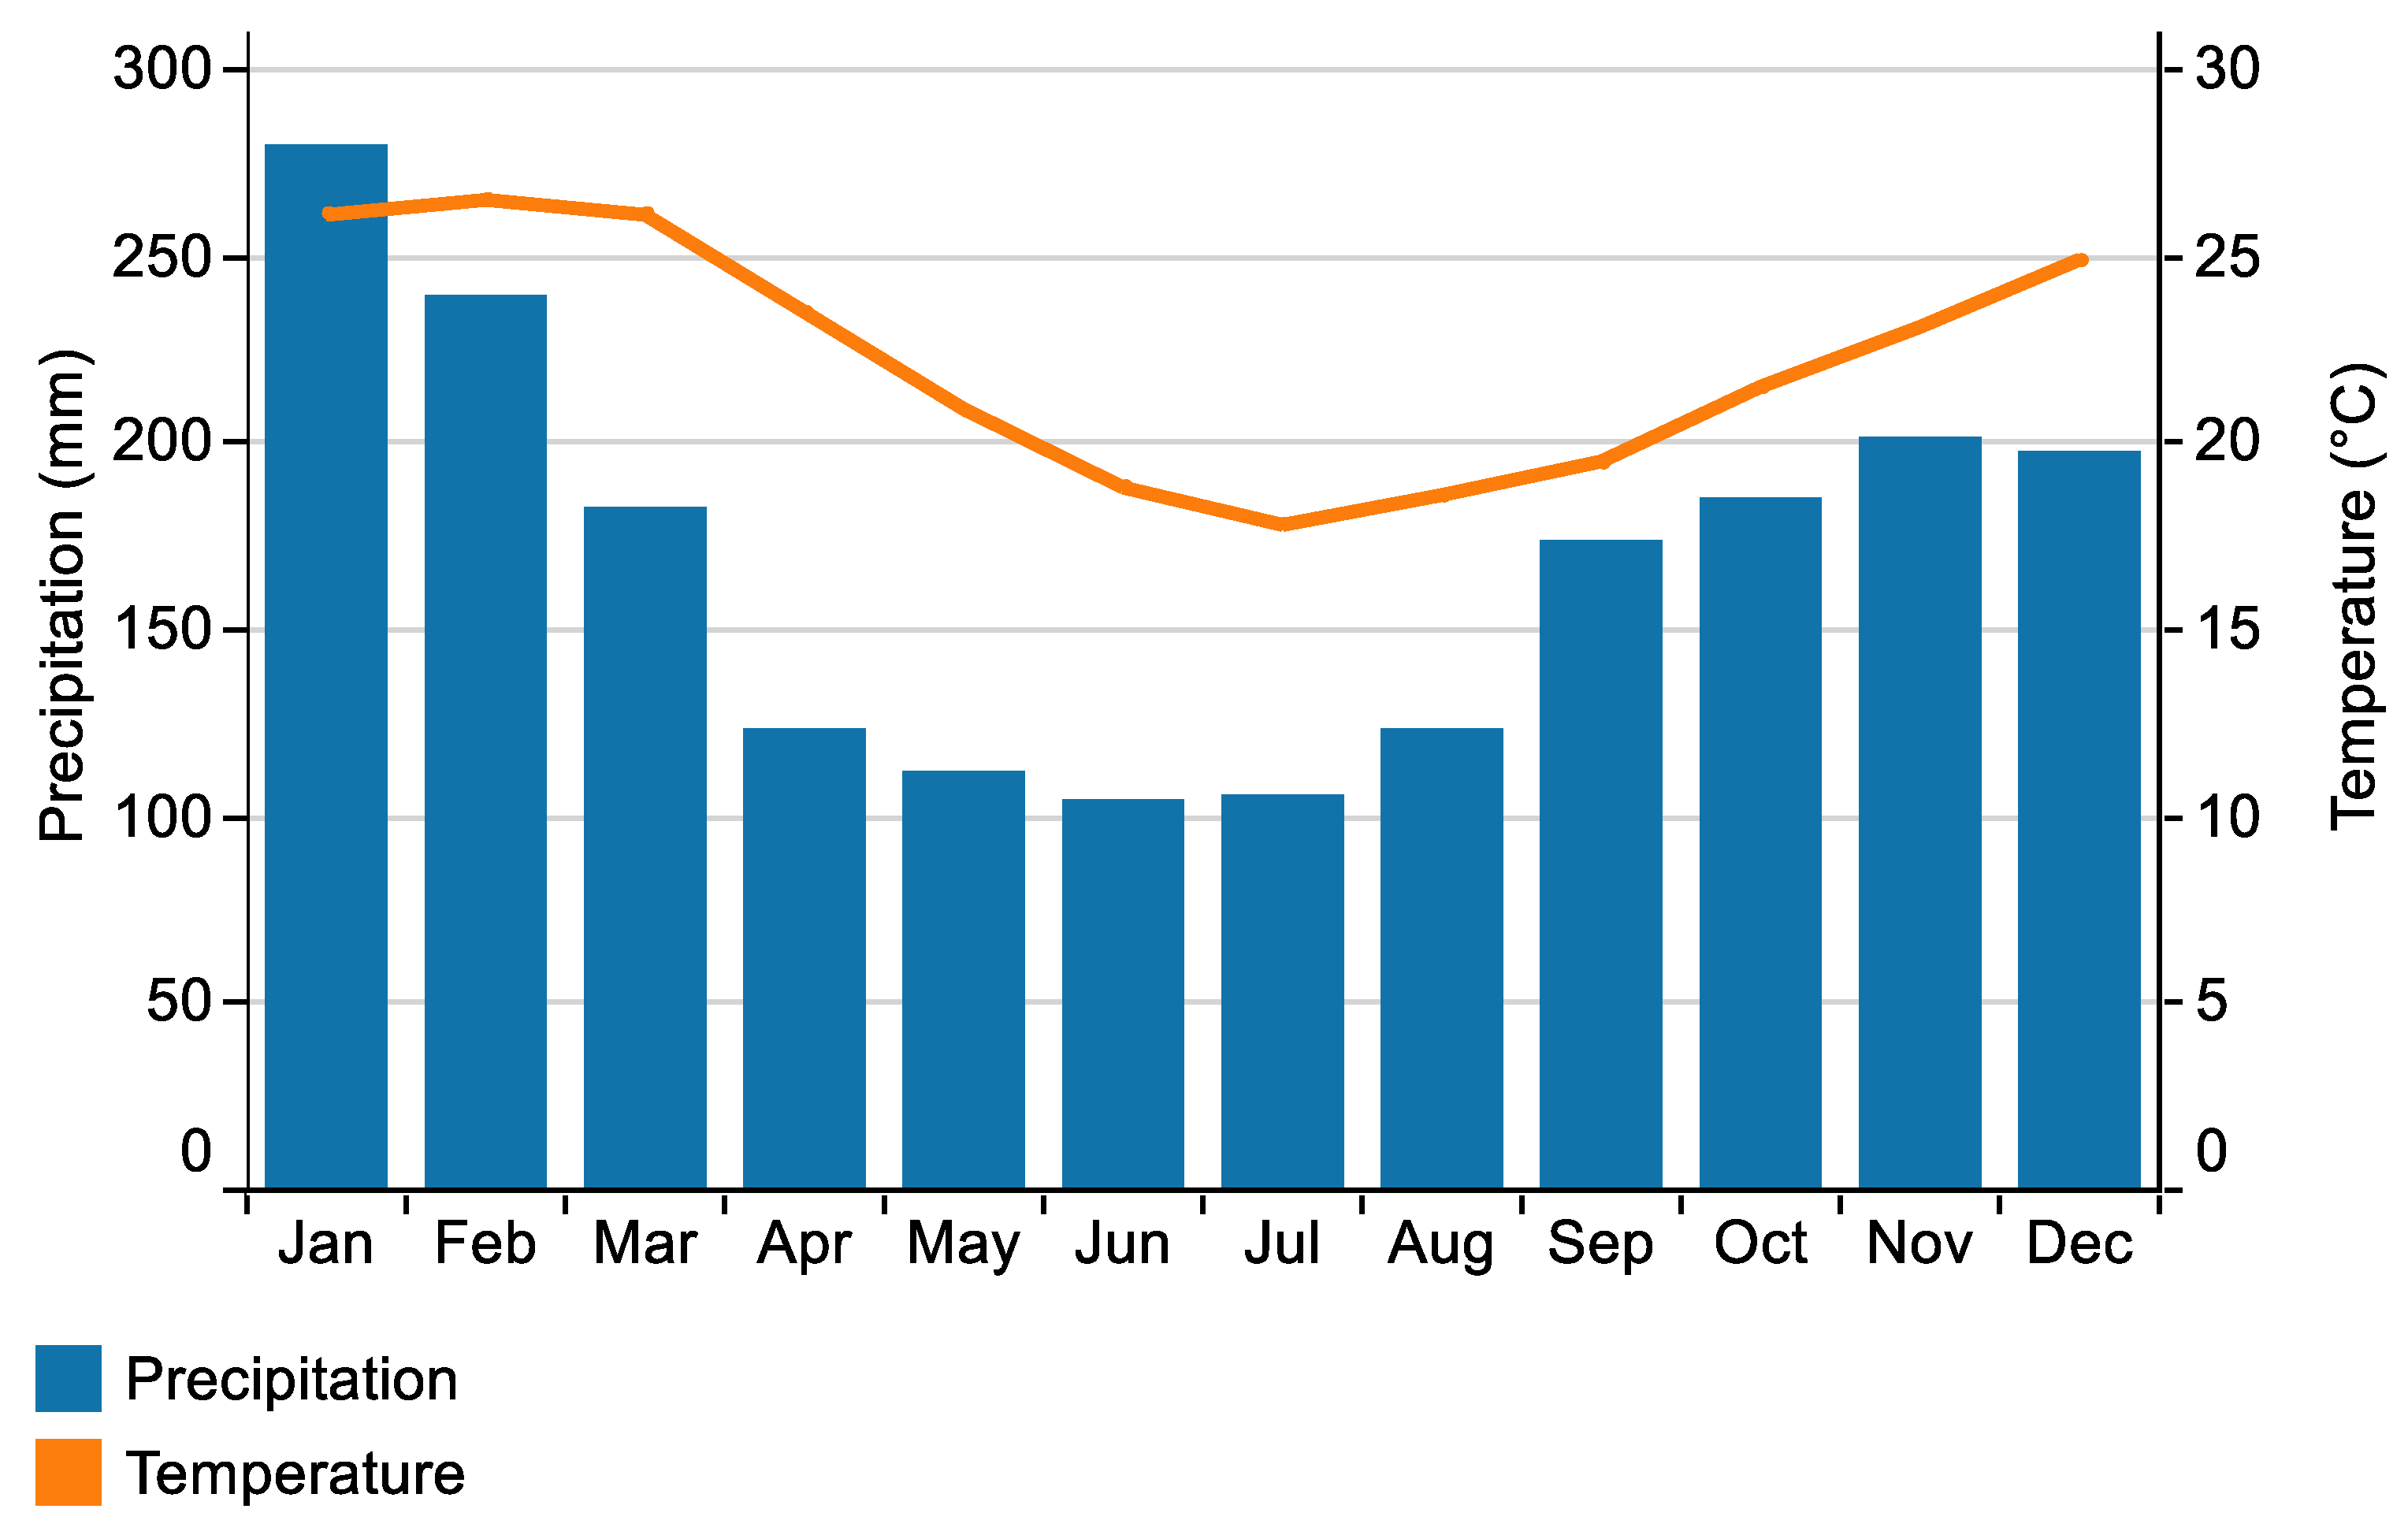
The city chosen for applying this study is Joinville, the most populous city in Santa Catarina State, in Southern Brazil. Joinville is geographically located at 26°18′05″ S and 48°50′38″ W [18]. The climate is classified as temperate rainy, moderately hot, humid in all seasons, with hot summers. The average annual temperature is 22.4 °C ± 0.73 °C. Summer (December to February) is the hottest season, followed by autumn, spring, and winter. The average annual precipitation is 1957 mm in Joinville, and it rains 178 days a year on average. Summer is the season with the highest precipitation, followed by spring, autumn, and winter [19]. Figure 1 shows the average monthly precipitation and temperature in Joinville, according to data presented by [19]. Average monthly precipitation was determined for a thirty-year period (1979 to 2008), and the average monthly temperature for a sixteen-year period (1996 to 2011).
2.2. Water End-Uses
Water end-uses depend on many factors, such as culture, climate, plumbing-fixtures efficiency, number of occupants in the building, and standard of living of users [20,21]. Since there is no research estimating water end-uses in buildings in Joinville, some scenarios were created for each building sector, varying the end-uses classified as greywater sources and non-potable water demand. Lavatory taps and showers were considered greywater sources. Toilets, urinals, and cleaning were classified as non-potable demand. In single-family residential and public buildings, garden irrigation was also adopted as a non-potable water demand. This is the only outdoor end-use considered in this study.
The definition of these scenarios was based on studies about water end-uses carried out in Brazilian buildings. For the residential sector, the references considered were [4,5,22,23,24,25]. This sector was subdivided into single-family and multi-family buildings. Regarding public buildings, the scenarios were determined from the results presented by [6,26]. For commercial buildings, water end-uses were determined based on the study performed by [20]. Table 1 presents the minimum and maximum values of water end-use of greywater sources, non-potable water demand, and toilets found in these studies (reference values) and the corresponding reference. The minimum and maximum values adopted were close to those presented in the references. For determining the scenarios, the values adopted were varied at intervals of 10% and combined among themselves. Cases in which the sum of greywater sources and non-potable water demand resulted in values higher than 100% and that the use of toilets was higher than non-potable water demand (since toilets were included in non-potable demand) were excluded. It resulted in 76 water end-use scenarios for the single-family residential sector, 15 for the multi-family residential, 92 for the public, and 29 for the commercial.
2.3. Potential for Potable Water Savings
Four strategies for reducing potable water consumption in buildings were considered: replacement of conventional toilets with dual-flush ones, greywater reuse for non-potable uses, rainwater harvesting for non-potable uses, and the simultaneous adoption of toilets replacement, greywater reuse, and rainwater harvesting. These strategies were assessed for each water end-use scenario.
2.3.1. Replacement of Toilets
It was considered the installation of dual-flush toilets with tank capacities of three and six litres. It is not known how many toilets in Joinville already have dual-flush devices nor their tank capacities, so different percentages of potable water savings due to this strategy were adopted. These percentages were defined from other researches carried out in Brazilian buildings [2,7,23,27]. The minimum reduction of water consumption in toilets due to this strategy was 16.6% [7], and the maximum was 74.3% [2]. The average water savings reported in these studies was 49.2%.
From this analysis, it was considered that replacing conventional toilets with dual-flush ones with tank capacities of three and six litres would save 15%, 50%, or 75% on water consumption of this plumbing fixture. These three savings were applied to the water used in toilets of each water end-use scenario. The reduction of sewage generated would be equal to the percentage of potable water consumption reduction in this fixture.
2.3.2. Greywater Reuse
The second strategy considered to reduce potable water consumption was the reuse for non-potable purposes, after treatment, of effluents generated in greywater sources. The water savings due to this strategy were estimated based on a comparison between greywater available for reuse and non-potable water demand of each scenario. In scenarios where greywater available for reuse was higher than non-potable water demand, the potential for water savings was equal to the non-potable demand. When greywater availability was lower than non-potable demand, the potential for water savings was equal to greywater available for reuse.
This strategy also contributes to reducing sewage generation because some effluents are reused for non-potable purposes before being sent to the treatment plant. The potential for reducing sewage generation due to greywater reuse is equal to the potential for potable water savings for this strategy.
2.3.3. Rainwater Harvesting
Rainwater was also considered as an alternative source to supply non-potable water demand. The potential for water savings due to rainwater harvesting was determined using the Netuno computer programme [28]. This software simulates a rainwater harvesting system using behavioural models, i.e., the simulation is based on a set of known variables informed by the user, such as daily rainfall data, catchment surface area, daily total water demand, rainwater demand, runoff coefficient, first flush, and upper and lower tank capacities. Simulations are performed on a daily basis. The simulation result is the potential for potable water savings for a given lower tank capacity. The user can choose to inform a set of lower tank capacities to be simulated, so Netuno could indicate the ideal tank capacity and the corresponding potential for potable water savings [29]. The programme algorithm was validated by [30].
Three catchment areas were defined for each sector: minimum, maximum, and the most common in Joinville (most likely occurrence). Simulations were performed for these three values for each water end-use scenario. In order to obtain these values, the catchment areas of all buildings in each building sector were considered. The anomalous values (outliers) were excluded. A value was considered an outlier if it was outside certain limits calculated from the interquartile range (IQR), that is, the difference between the upper and lower quartile of data. The upper limit was the upper quartile of the data plus 1.5 times the IQR; the lower limit was the lower quartile minus 1.5 times the IQR. If a value was beyond these limits, it was considered an outlier and excluded from the data set [31].
The minimum and maximum catchment areas were identified directly after exclusion of outliers. Then, the catchment areas were divided into classes. The catchment area for each building sector with the most likely occurrence was defined as the mode of the catchment areas, calculated using the Czuber method [32]. Catchment areas for single-family and multi-family residential buildings were obtained from [33]. For public and commercial sectors, data were measured in the Geographical Information System (SIMGeo) [34], a geographic information system developed for the city of Joinville. Custódio [33] assessed only residential buildings in one watershed in Joinville, where 49% of the Joinville population live [35], so the catchment areas of this watershed were considered as representative for the entire city. Therefore, for public and commercial sectors, only the areas of buildings in the same watershed analysed by Custódio [33] were measured.
As for the total daily water demand, minimum, maximum, and the most likely occurrence demands for each sector were also defined using the same procedure as the one for catchment areas. The same studies used for determining water end-use scenarios were used as references to define the daily water demand. The total daily water consumption of 22 single-family residential buildings [5,22,24,25], 26 multi-family residential buildings [4,23], 12 public buildings [6,26], and 10 commercial buildings [20] were taken into account. From the results presented in these studies, the three total daily water demand for each sector was determined. The total daily water demand was chosen instead of the per capita demand because it already includes the per capita demand and the number of occupants of the building.
The rainwater demand (percentage of the total daily water demand to be replaced with rainwater) was taken as equal to the non-potable water demand in the scenarios simulated. The runoff coefficient adopted was 0.8, as used in other studies [2,5,6,7,17,33]. A first flush equal to 2 mm was considered, as recommended by the Brazilian Standard NBR 15527 [36].
A daily rainfall time series of twenty-one years from Joinville was used (1996 to 2016). This data was provided by the Cubatão and Cachoeira River Basin Management Committee, an institution that collects daily rainfall data in a meteorological station located in Joinville.
The upper rainwater tank capacity was defined as equal to the average rainwater demand. The lower rainwater tank was simulated considering capacities ranging from 0 to 50,000 L, at intervals of 1000 L. The ideal tank capacity and the corresponding potential for potable water savings were obtained as output from Netuno. The ideal tank capacity was considered the one in which the potential for water savings increased 2% or less by increasing the tank capacity in 1000 L.
For each water end-use scenario, nine simulations were performed (three catchment areas and three total daily water consumptions) using the Netuno computer programme. For each simulation, Netuno indicated the ideal lower rainwater tank capacity and the corresponding potential for potable water savings.
2.3.4. Combination of Strategies
The reduction of water consumption if replacement of toilets, greywater reuse, and rainwater harvesting were adopted simultaneously in the buildings were also assessed. In this analysis, the replacement of toilets was prioritised because toilets are considered the most water-consuming plumbing fixtures in buildings [37], they contribute to decreasing sewage generation, and because this strategy needs less intervention to be implemented in existing buildings.
Greywater reuse was the second strategy prioritised in this combination, assuming that this alternative source would supply the remaining non-potable water demand after the replacement of toilets. This measure also contributes to reducing sewage generation. Besides, greywater is produced in the building itself, and its availability does not depend on climatic conditions, unlike rainwater [7].
In those scenarios where greywater available for reuse was not enough to supply all non-potable water demand, rainwater was also considered an alternative source to be used for such purposes. Analysis of rainwater harvesting was not done for the cases where greywater was enough to supply all non-potable water demand.
The potential for potable water savings was determined by summing the potentials for each strategy, which were defined in the same way as described in Section 2.3.1, Section 2.3.2 and Section 2.3.3. The potential for reduction of sewage generation due to the combination of strategies was equal to the potential for water savings due to toilets replacement plus the potential for water savings due to greywater reuse.
2.4. Reduction of Potable Water Consumption and Sewage Generation
Data for annual water consumption and annual sewage generation in Joinville from 2007 to 2016 were obtained in the National Information System on Sanitation [38]. The outliers of these data were identified and excluded, and the average annual potable water consumption and the average annual sewage generation in the city were calculated. The percentages of water consumption and sewage generation corresponding to each sector were determined based on data from the Municipal Agency for the Regulation of Water and Sewage Services of Joinville [39].
After estimating the potential for potable water savings for all the water end-use scenarios as described in Section 2.3.1, Section 2.3.2, Section 2.3.3 and Section 2.3.4, the scenarios that would guarantee the minimum and maximum potentials for water savings for each strategy were identified for each sector. The reduction of potable water consumption in each sector was estimated using Equation (1):
where V is the volume of potable water saved in the sector (m3/year); PE is the potential for potable water savings due to the strategy considered (%), calculated as described in Section 2.3.1, Section 2.3.2, Section 2.3.3 and Section 2.3.4; C is the average annual volume of water consumed in Joinville in the sector considered (m3/year).
Then, the reduction of sewage generation in these scenarios of minimum and maximum water savings was calculated for each sector through Equation (2). Rainwater harvesting was not considered in this case because this strategy does not influence sewage production. In cases where isolated strategies were analysed, the potential for reducing sewage generation was considered equal to the water savings due to toilet replacement or greywater reuse. For the combination of strategies, it was considered the sum of potentials for water savings due to these two strategies.
where V′ is the reduction of sewage volume generated in the sector (m3/year); PE′ is the potential for potable water savings due to the replacement of toilets, greywater reuse, or both (%), calculated as described in Section 2.3.1, Section 2.3.2, and Section 2.3.4; C′ is the average annual volume of sewage generated in Joinville in the sector considered (m3/year).
Equations (1) and (2) were applied only to the two water end-use scenarios of each sector that correspond to the minimum potential and the maximum potential for potable water savings and sewage generation reduction. In this way, the minimum and maximum volumes of water that could be saved were determined for each sector, as well as the minimum and maximum reductions of sewage generated, i.e., the possible range of water consumption reduction and sewage generation reduction for each sector were determined.
The total reduction of potable water consumption in Joinville, considering all the building sectors evaluated in this study, was calculated by summing the volumes determined for each sector using Equation (1). Similarly, the total reduction of the sewage generation in the city was determined by summing all the volumes calculated using Equation (2) for each sector. Thus, the minimum and maximum total reductions of potable water consumption and sewage generation in Joinville were determined, i.e., the possible range of reduction of potable water consumption and sewage generation in the city.
The determination of the possible ranges of reductions of water consumption and sewage generation was repeated four times: considering toilet replacement, greywater reuse, rainwater harvesting, and the simultaneous adoption of these three strategies.
3. Results and Discussion
3.1. Water End-Uses
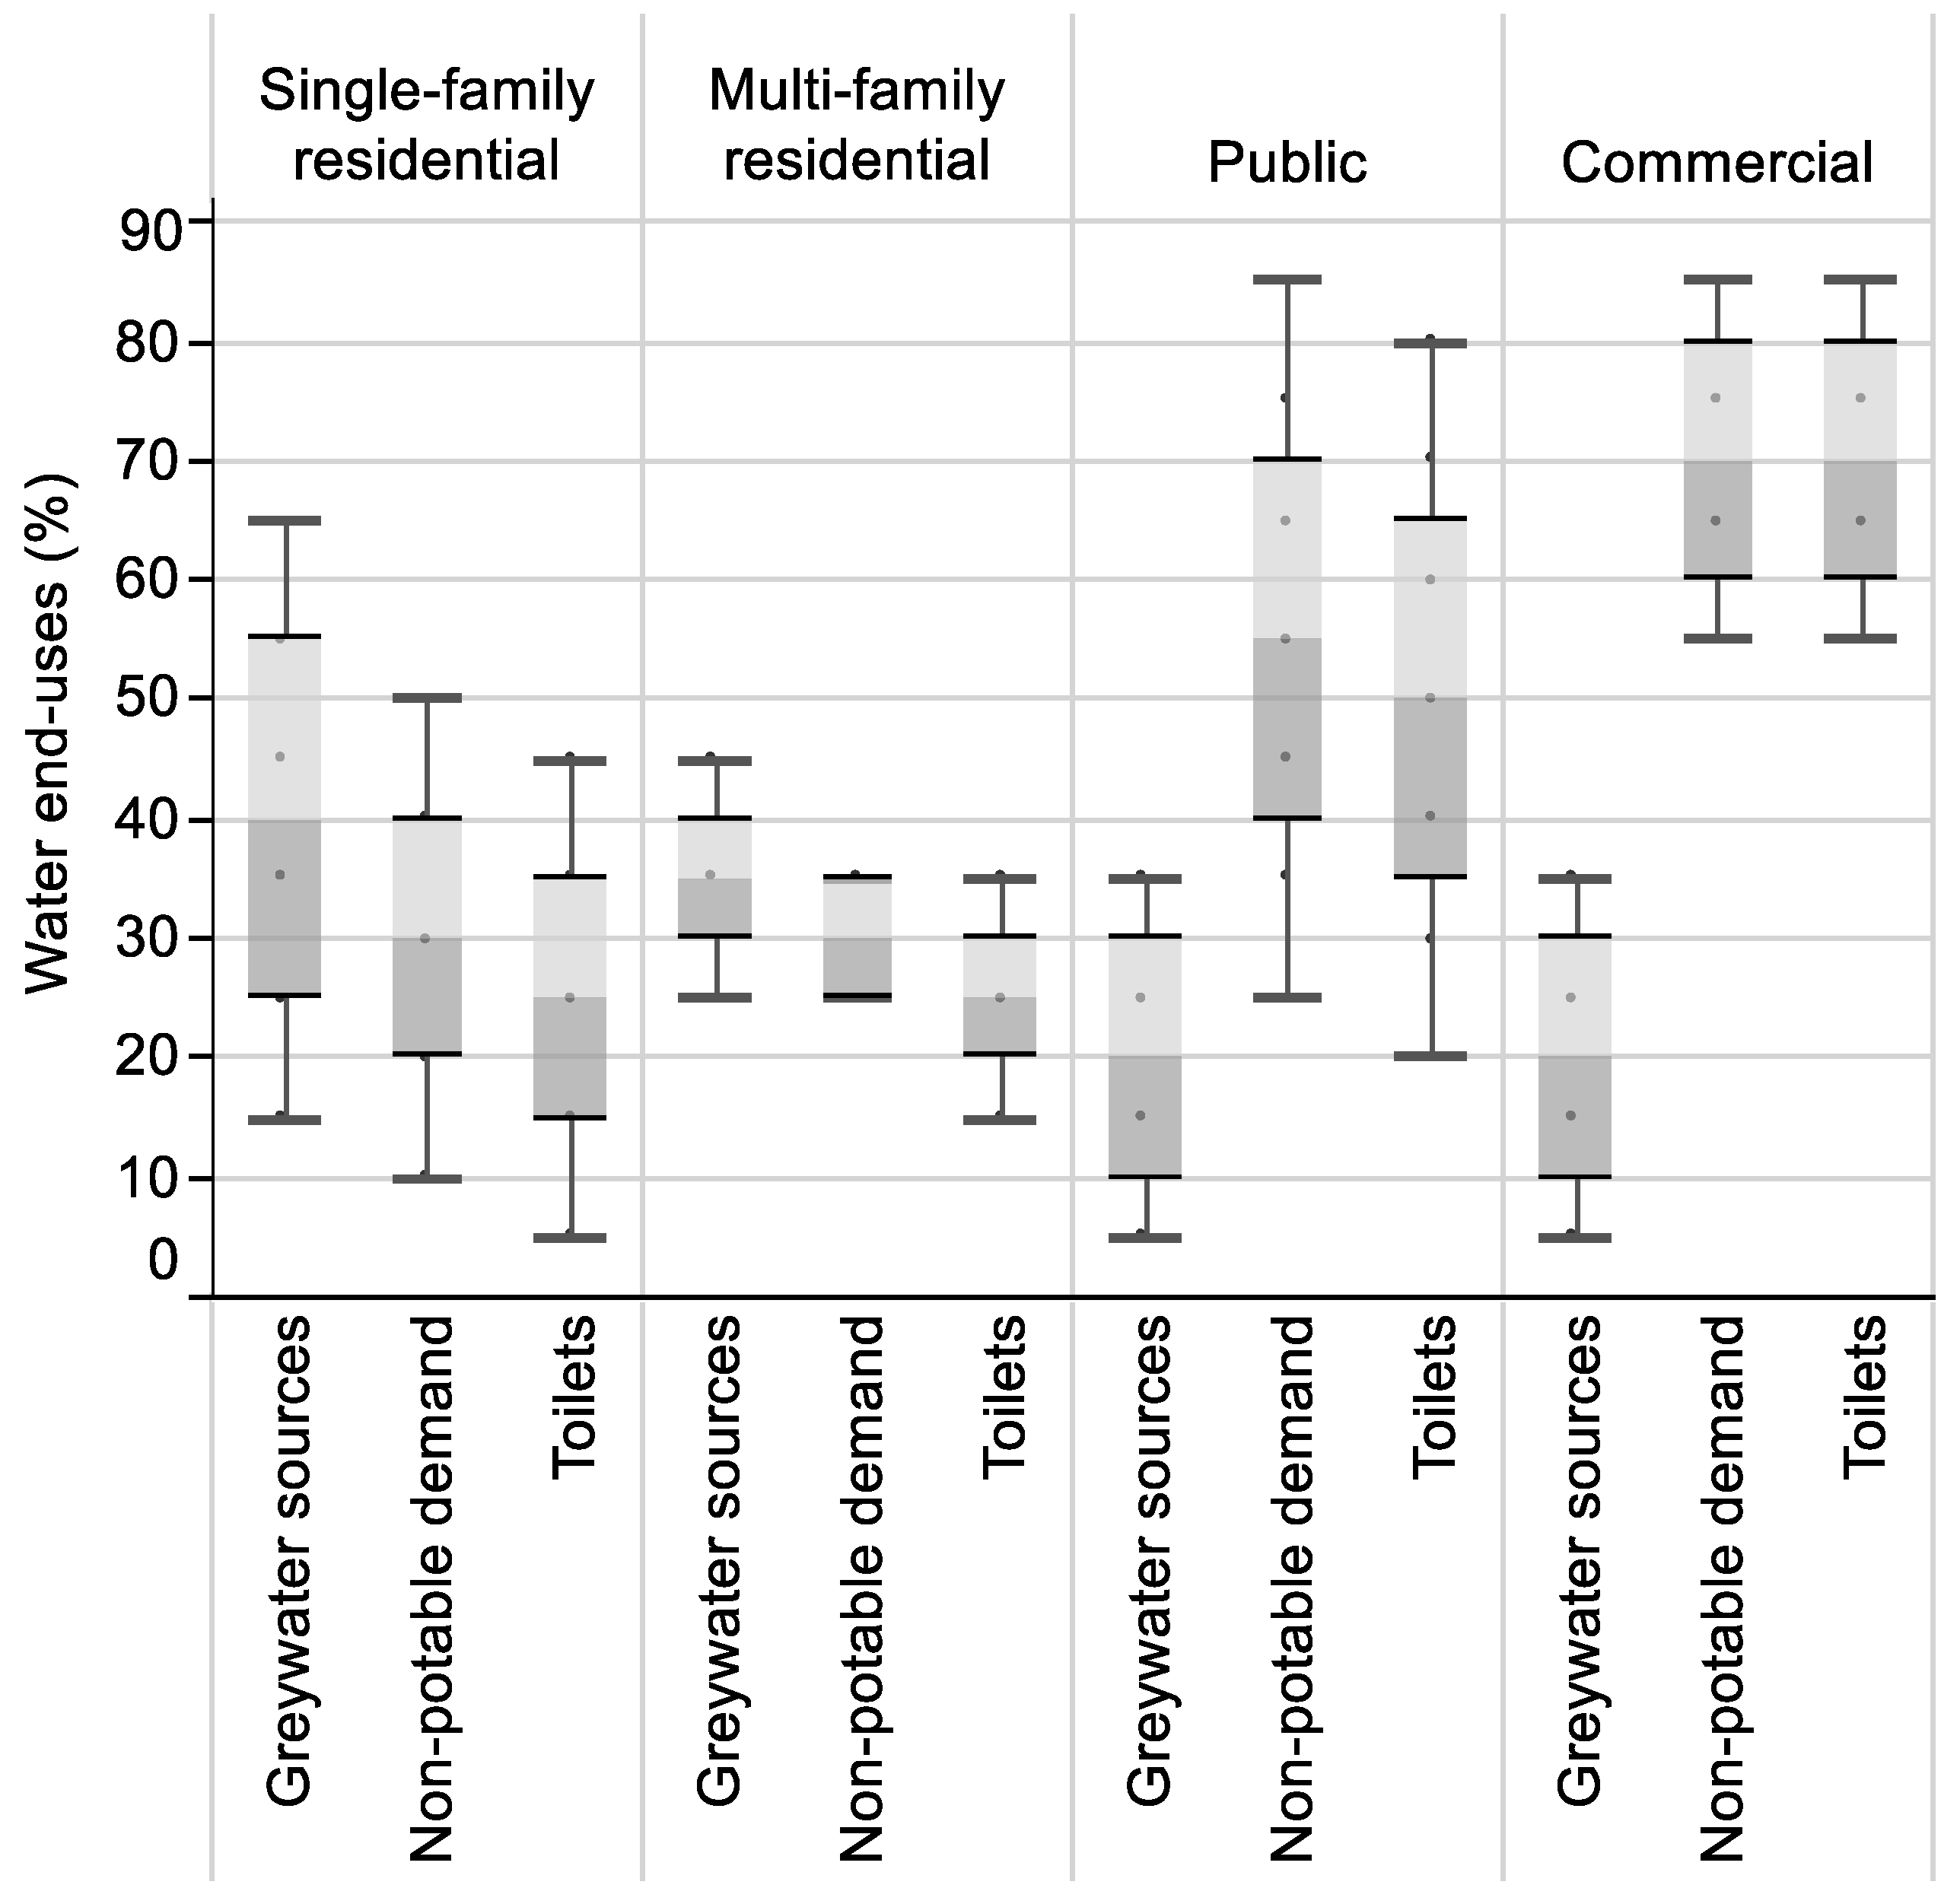
Figure 2 shows the range of water end-uses considered in this research for each building sector. The minimum and the maximum percentages of each box are close to the reference values presented in Table 1, and they were varied every 10%. In the single-family residential sector, greywater sources ranged from 15% to 65%, non-potable water demand ranged from 10% to 50%, and toilets water end-use ranged from 5% to 45%, in intervals of 10%. In the multi-family residential sector, greywater sources varied from 25% to 45%, non-potable water demand from 25% to 35%, and toilets water end-use from 15% to 35%, in intervals of 10%. In the public sector, the percentages ranged, in intervals of 10%, from 5% to 35% for greywater sources, from 25% to 85% for non-potable water demand, and from 20% to 80% for toilets water end-use. In the commercial sector, greywater sources ranged from 5% to 35%, and non-potable water demand and toilets water end-use ranged from 55% to 85%, in intervals of 10%.
3.2. Potential for Potable Water Savings
Table 2 shows the minimum and maximum potentials for potable water savings and reduction of sewage generation due to each strategy in all building sectors. For toilets replacement and greywater reuse, the potential for water savings and reduction of sewage generation is the same. Rainwater harvesting does not contribute to a decrease in effluent production. Therefore, the potential for sewage reduction is zero for this strategy, and it is different from the potential for water savings for the combination of strategies.
3.2.1. Replacement of Toilets
The potential for potable water savings due to this strategy ranged from 0.8% to 33.8% in the single-family residential sector, from 2.2% to 26.2% in the multi-family residential, from 3.0% to 60.0% in the public, and from 8.2% to 63.8% in the commercial sector.
The potential for water savings due to the replacement of toilets is directly related to the water use in toilets compared to the total water use in the building. In public and commercial buildings, this plumbing fixture usually corresponds to the most considerable part of the total water consumption [6,20,26], so savings due to this strategy in these sectors are higher than in others.
3.2.2. Greywater Reuse
The average potential for potable water savings in single-family residential, multi-family residential, public and commercial sectors was, respectively, 26.2%, 29.0%, 17.4%, and 15.7%. In public and commercial buildings, non-potable water demand is usually higher than greywater sources [6,20,26]. Thus, the potential for water savings due to greywater reuse in these sectors is usually lower.
In residential and commercial sectors, these results are in agreement with other similar researches carried out in Brazil [2,7]. However, Fasola et al. [6] concluded that water savings due to greywater reuse in two public schools would be 4.2% and 5.1%. These values are lower than the average potential for the public sector presented in this study. It should be noted that public buildings in Brazil have many types of occupations, such as administrative buildings, schools, and hospitals, which have quite different water end-uses. Therefore, in order to consider diverse occupations with different water consumption profiles, the public sector was the one with more end-use scenarios in this research. This justifies the disparity between the average potential for water savings presented in this study, which considers different occupations, and that found by Fasola et al. [6] who analysed only schools.
In only three out of the fifteen scenarios (20.0%) of the multi-family residential sector, greywater reuse was not enough to supply all non-potable water demand. For the single-family residential sector, this percentage increased to 52.6%. In public and commercial sectors, this strategy did not supply non-potable demand in 95.7% and 100.0% of the cases, respectively. The potential for water savings for this strategy depends directly on the water end-uses, both greywater sources and non-potable water demand. In public and commercial buildings, non-potable uses (toilets, urinals, cleaning, and garden irrigation) are usually higher than greywater available for reuse (lavatory taps and showers), so it is hard to fully meet the non-potable demand considering only this strategy.
3.2.3. Rainwater Harvesting
The potential for water savings due to rainwater harvesting was determined through simulations using the Netuno software [28]. Table 3 shows the values of total daily water demands and catchment areas used in the simulations.
The average potential for potable water savings of all scenarios simulated for single-family residential, multi-family residential, public, and commercial sectors was, respectively, 28.1%, 6.3%, 29.5%, and 25.4%. These values differ from those presented by other researches that analysed rainwater harvesting in buildings in Brazil [2,4,6,7]. This difference was expected because potable water savings resulting from rainwater harvesting depends on several factors, such as local rainfall, catchment area, potable water consumption, and rainwater demand. These characteristics are particular to each city and building. Hence, rainwater harvesting provides diverse water savings, even in buildings of the same sector. Therefore, besides water end-use scenarios, simulations for this strategy also considered more than one catchment area and total potable water demand in order to evaluate different sets of building features.
It has been found that for high potable water demand, a small increase in catchment area considerably increases the potential for water savings, i.e., as the total water demand increases, water savings are more sensitive to changes in the catchment area. This is because the catchment area is directly related to the volume of rainwater available for use. In this way, the higher the rainwater demand, the more area is needed to collect enough rainwater to supply the demand.
3.2.4. Combination of Strategies
Compared with the isolated measures, the simultaneous adoption of strategies resulted in more significant potential savings (Table 2). Other studies presented the same trend [2,7]. However, the strategy that provides the highest potable water savings sometimes is not economically feasible or the one that causes less environmental impact. Therefore, other indicators besides the potential for water savings should be evaluated, such as economic feasibility indicators, energy consumption, and embodied energy of the strategies [40].
3.3. Reduction of Potable Water Consumption and Sewage Generation
According to data from the National Information System on Sanitation [38], the average annual consumption of potable water in Joinville between 2007 and 2016 was 29,115,880 m3. The average annual sewage generation in the city during this period was 5,466,510 m3. Table 4 shows the percentage of volumes of water consumed and sewage generated in each building sector.
According to the Brazilian Institute of Geography and Statistics [41], 84.2% of households in Joinville are single-family dwellings, and 15.8% are located in multi-family buildings. Therefore, it was considered that regarding the volumes of water consumed and sewage generated in the residential sector (Table 4), 84.2% correspond to single-family dwellings and 15.8% to multi-family ones.
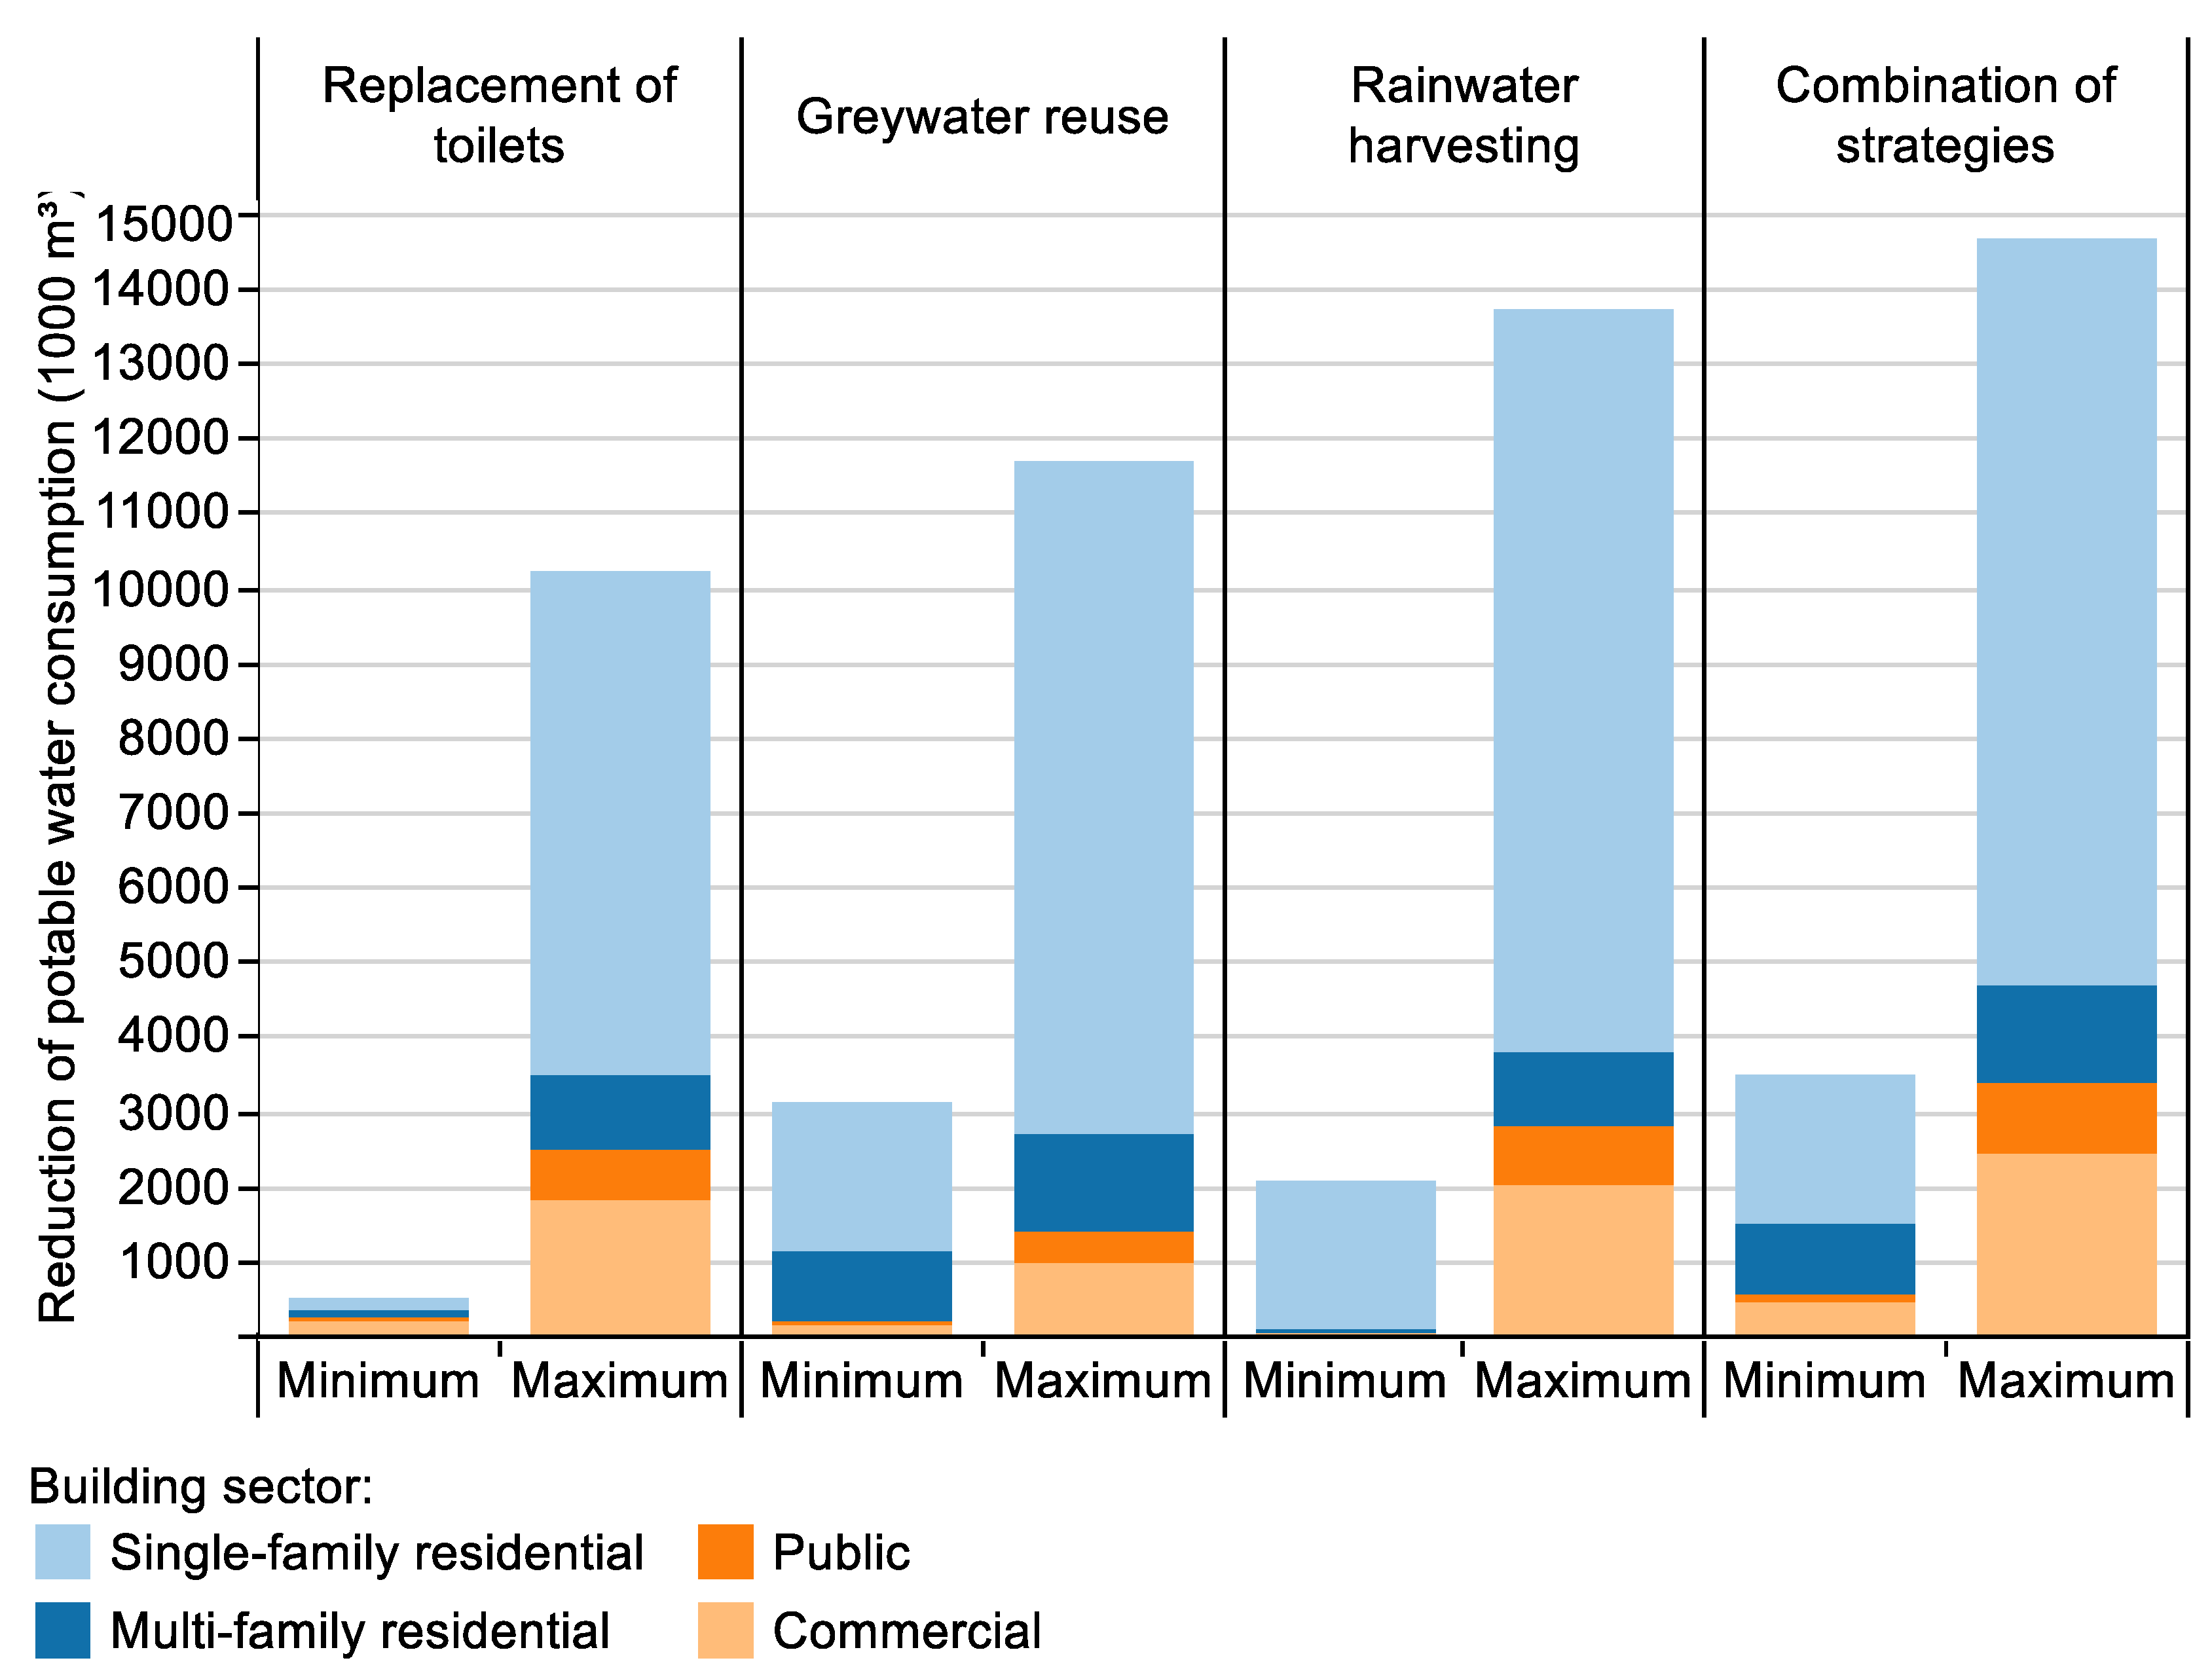
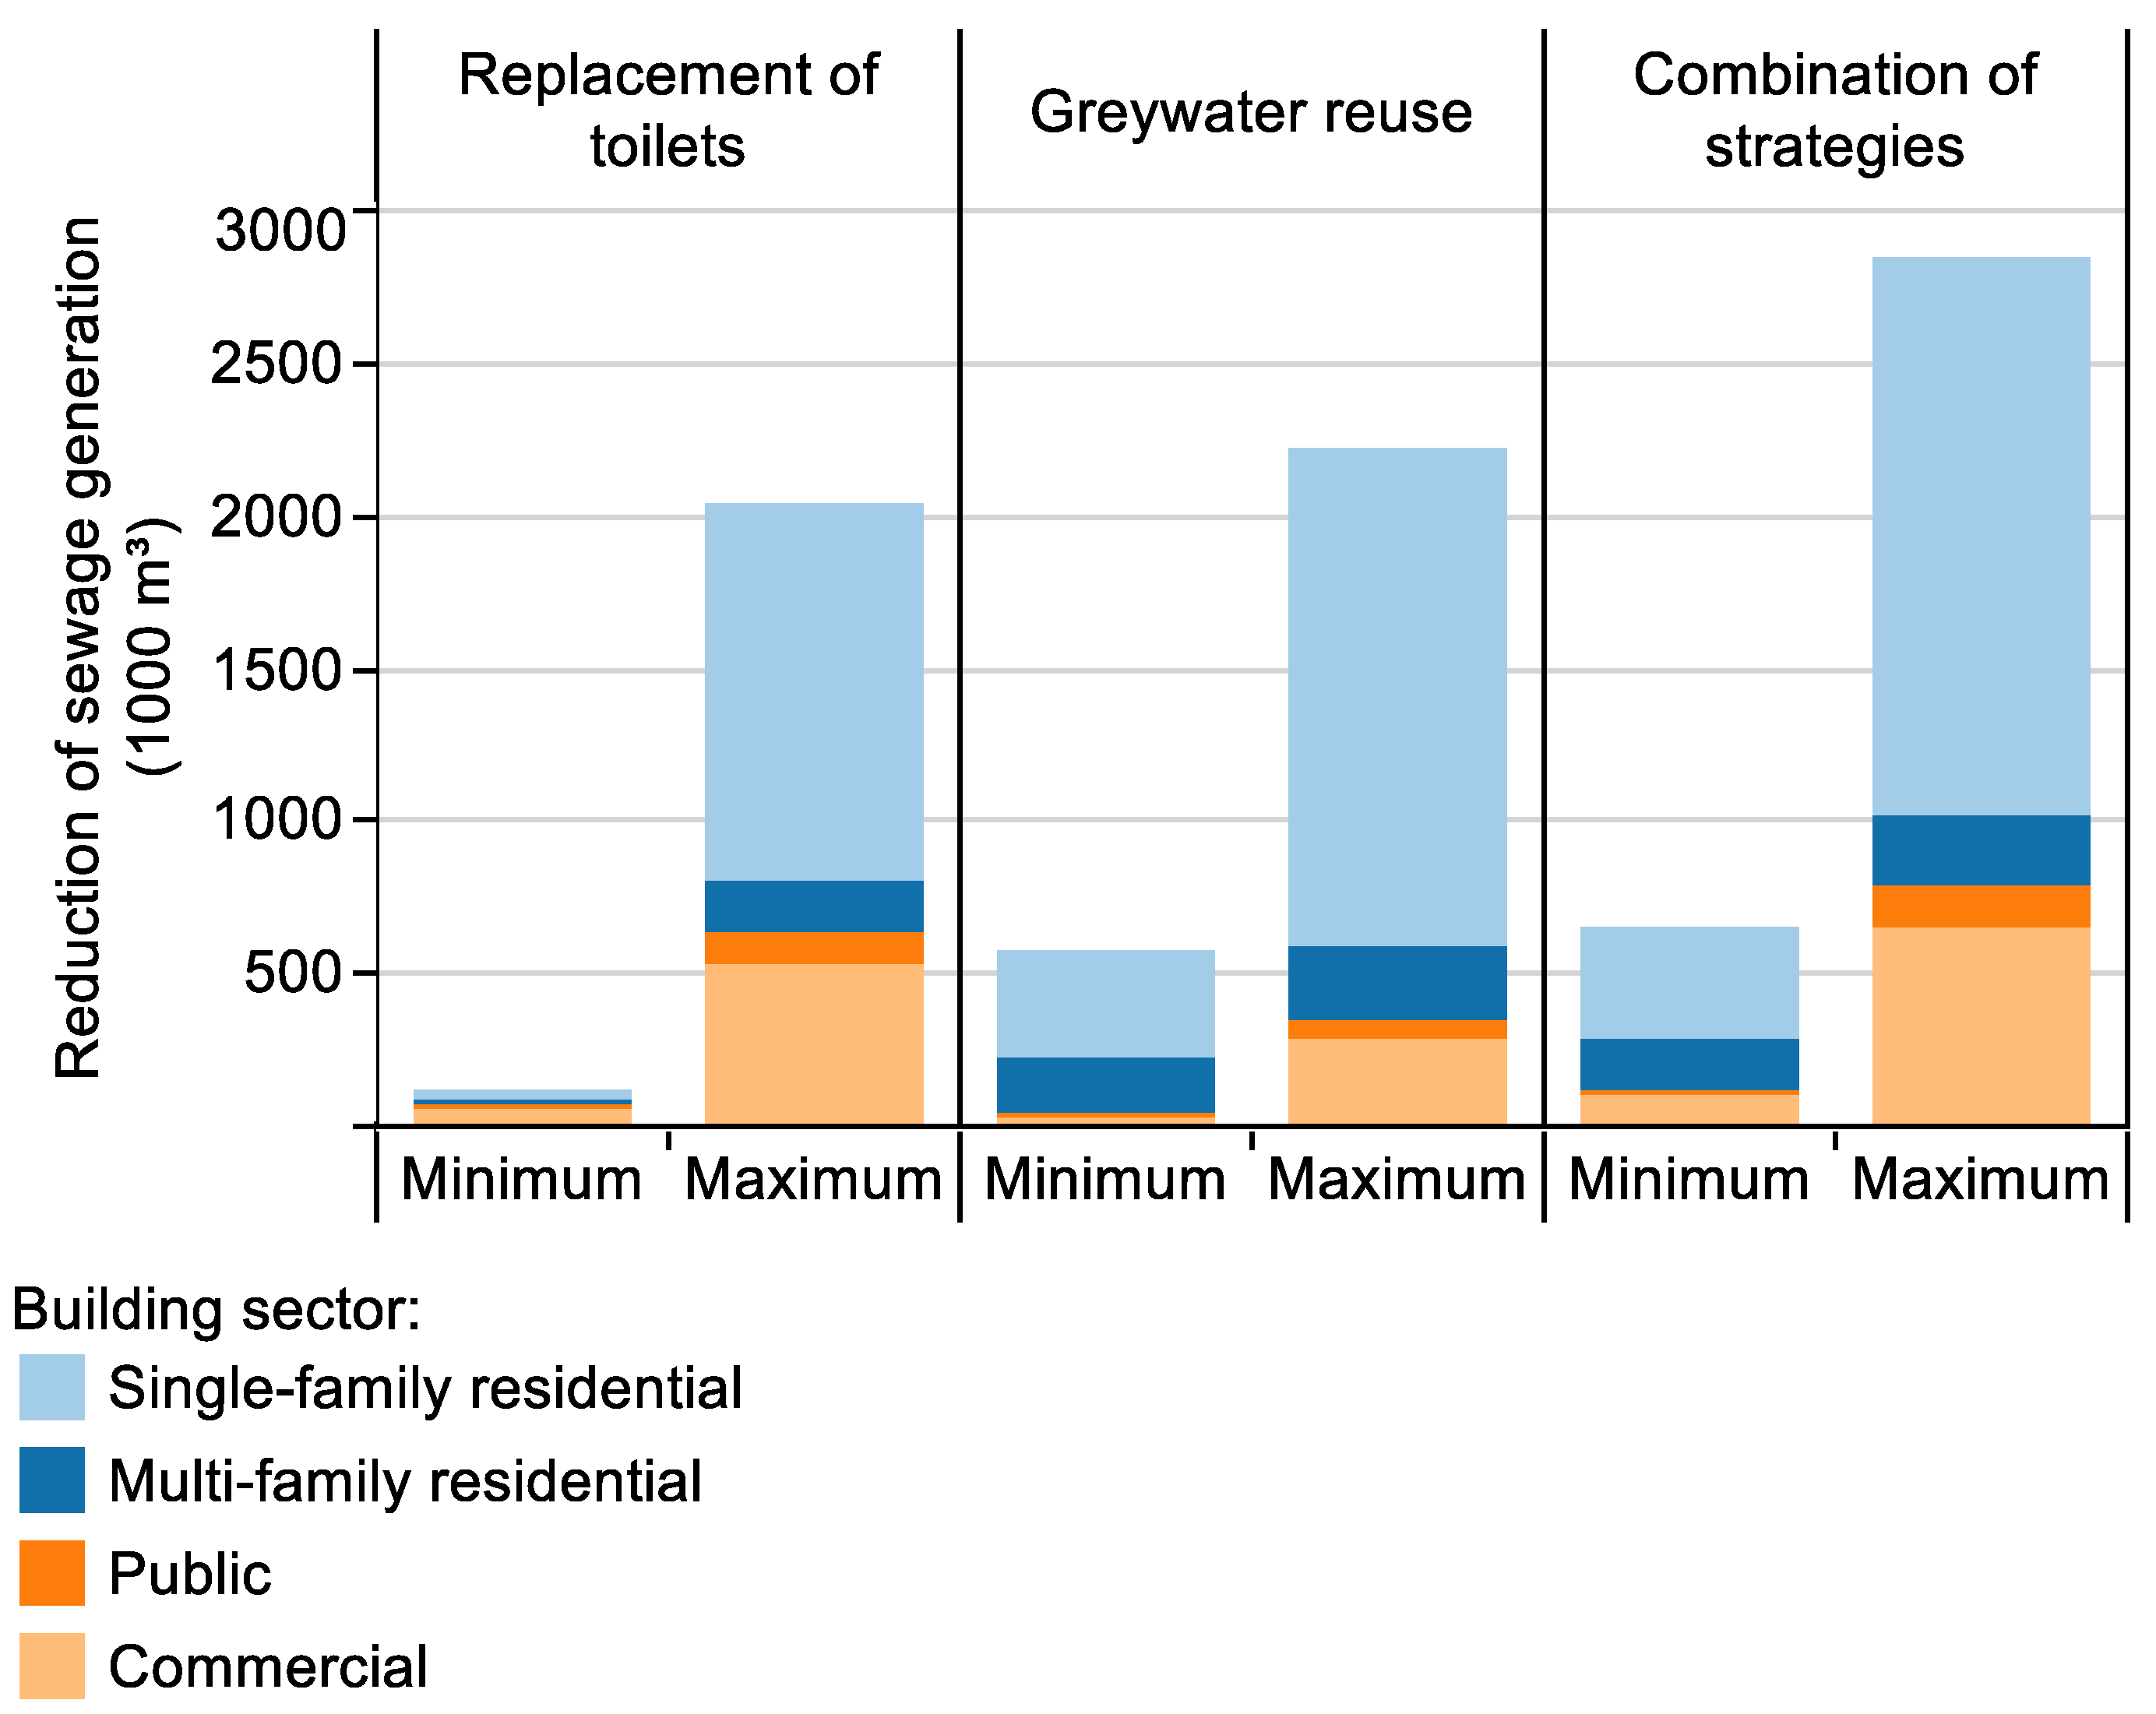
Table 5 shows the total potentials for water savings and reduction of sewage generation. These potentials were determined in relation to the average annual water consumption and the average annual volume of sewage collected and treated in Joinville between 2007 and 2016. Figure 3 and Figure 4 show, respectively, the minimum and the maximum total reductions in potable water consumption and sewage generation resulting from each strategy. There is no reduction in sewage generation due to rainwater harvesting because this strategy does not contribute to decreasing effluent production in buildings.
The combination of strategies provided the highest potential for potable water savings in all cases analysed. However, in the minimum scenario, the potential due to greywater reuse was only 1.4% lower, and in the maximum, the potential obtained for rainwater harvesting was only 3.3% lower.
For the minimum scenario of the single-family residential sector, greywater reuse and the combination of strategies resulted in the highest reductions of water consumed, but the difference in the reduction obtained by rainwater harvesting, in this case, would be only 1.1%. In the maximum scenario, the combination of strategies presented the best result, but rainwater harvesting would provide savings only 0.3% lower. In the multi-family residential sector, the most significant water savings were due to greywater reuse and the combination of strategies, in both minimum and maximum scenarios. Rainwater harvesting was not significant in this sector because the total potable water demand was high, and the catchment area was not large enough to collect the amount of rain needed to supply non-potable uses. In public and commercial sectors, the combination of strategies provided the highest reductions in water consumption.
Regarding sewage generation, in minimum and maximum scenarios, the combination of strategies resulted in the highest potentials for reduction. However, in the minimum scenario, the potential due to greywater reuse is only 1.4% lower. In the residential sector (single-family and multi-family), greywater reuse and the combination of strategies were the measures that provided the most significant reductions of sewage generation. In public and commercial buildings, the simultaneous adoption of three strategies was responsible for the greatest decreases.
The single-family residential sector was the most representative in both potable water savings and reduction of sewage generation in most situations assessed, that is, it corresponds to the largest portion of total reductions of water consumption and sewage production in the city. The least representative sector was the public, although public buildings have presented a high potential for water savings (Table 2). This is because this sector represents a small part of the total water consumption in Joinville (Table 4). As the single-family residential sector consumes the largest volume of water, strategies adopted in several buildings provide significant reductions in total water consumption in the city.
Regarding the replacement of toilets, the commercial sector also contributes significantly to reduce water consumption and sewage generation, especially in the minimum scenario. The use of toilets in these buildings is usually higher than in the residential sector, so this strategy provides significant water savings and sewage production decrease. Replacement of conventional toilets with dual-flush ones would be more simply adopted in existing buildings compared to the use of alternative sources (greywater or rainwater), so it is a suitable option to be applied in commercial buildings on a city scale.
It was identified that the scenarios that corresponded to the minimum potential for water savings had the lowest volumes of non-potable demand and greywater sources considered in this research, and those referring to the maximum potentials had the highest non-potable demands and the maximum catchment area adopted for the sector. Also, it was verified that in the minimum scenario, greywater reuse provided reductions of potable water consumption and sewage generation similar to those obtained for the combination of strategies. In the maximum scenario, water savings due to rainwater harvesting was also close to that obtained with the combination of strategies. Furthermore, the implementation of one strategy for the rational use of water is simpler and cheaper than the installation of several strategies. Therefore, it was concluded that when non-potable demand is low, greywater reuse is the most feasible alternative in order to reduce water consumption and sewage generation in Joinville. When non-potable demand is high, and there is a large catchment area, it is recommended to install rainwater harvesting systems, but this measure does not contribute to reducing effluents production.
4. Conclusions
This article aimed to estimate the reduction of potable water consumption and sewage generation in Joinville, southern Brazil. This analysis was performed on a city scale for the single-family and multi-family residential, public, and commercial sectors of the city.
The combination of toilet replacement, greywater reuse, and rainwater harvesting was the option that resulted in the highest potentials for potable water savings in all sectors. If the strategies were adopted simultaneously in the four sectors assessed, the total reduction of water consumption in Joinville would range from 12.1% to 50.5% (3,517,700.7 m3/year to 14,690,012.0 m3/year). However, other strategies presented similar results. For the minimum water-saving scenario, greywater reuse would provide a reduction of 10.7% in the total water consumption in the city (3,129,843.7 m3/year). For the maximum scenario, the decrease in water consumption due to rainwater harvesting would be 47.2% (13,732,355.4 m3/year). Regarding sewage generation, the combination of strategies was also the option that would provide the highest reductions, ranging from 12.1% to 52.1% (660,476.4 m3/year to 2,849,730.8 m3/year). However, for the minimum scenario, the decrease in sewage generation due to greywater reuse would be similar (10.7%).
It was concluded that when non-potable water demand is low, greywater reuse is the most feasible strategy to be implemented in buildings in Joinville because it results in similar water savings and reduction of sewage generation to those provided by the simultaneous adoption of strategies. When non-potable demand is high and there is a large catchment area, rainwater harvesting is the best alternative for water savings, but it does not contribute to reducing sewage generation.
The single-family residential sector was the most representative in reducing total potable water consumption and sewage generation, so it should be prioritised if some of these strategies were implemented in Joinville. The public sector had little relevance to total reductions in water consumption and sewage generation. However, the implementation of strategies for water savings in public buildings could encourage their adoption in other sectors.
It should be noted that potential for water savings due to each strategy depends on particular characteristics of the building, such as water end-uses, total water demand, and catchment area. Thus, it is essential to do a previous analysis of which would be the most appropriate strategy for each case.
Data used to define the water end-use scenarios and potable water consumption in Joinville were based on the results of other researches and information provided by the National Information System on Sanitation. Therefore, the main limitation of this study is related to the use of theoretical data. The definition of several water end-use scenarios and minimum, most common, and maximum total daily water consumption was made in order to minimise this limitation. On-site data collection is suggested to increase the accuracy of the results presented in this paper. Also, the use of other studies to define the water end-use scenarios and total daily water consumption per building did not allow the separation of consumption into indoor and outdoor uses. This division is important because in buildings where there are outdoor uses, per capita consumption is usually higher, and because of this limitation, this analysis cannot be done. However, the percentages of water end-uses refer to the total consumption of the building, so the outdoor use considered in this study (garden irrigation) was added to the non-potable demand.
The results of this study could encourage the local utility to support the adoption of these strategies in buildings in Joinville. Therefore, the estimation of the cost of installing these strategies and the verification of the economic feasibility of their adoption in each building sector should also be investigated. Although the results presented in this paper refer only to Joinville, this method can be applied elsewhere. Other utilities, seeing the significant results of applying water-saving strategies on a large scale, may apply this method in their coverage area.
Author Contributions
Conceptualization, R.J.C. and E.G.; methodology, R.J.C.; formal analysis, R.J.C.; investigation, R.J.C.; writing—original draft preparation, R.J.C.; writing—review and editing, E.G.; supervision, E.G.
Funding
This research was supported by the Brazilian government agency CNPq-Conselho Nacional de Desenvolvimento Científico e Tecnológico (grant number 133425/2017-7).
Conflicts of Interest
The authors declare no conflict of interest.
References
- Plappally, A.K.; Lienhard V, J.H. Energy requirements for water production, treatment, end use, reclamation, and disposal. Renew. Sustain. Energy. Rev. 2012, 16, 4818–4848. [Google Scholar] [CrossRef]
- Marinoski, A.K.; Rupp, R.F.; Ghisi, E. Environmental benefit analysis of strategies for potable water savings in residential buildings. J. Environ. Manag. 2018, 206, 28–39. [Google Scholar] [CrossRef] [PubMed]
- Rak, J.R.; Pietrucha-Urbanik, K. An Approach to Determine Risk Indices for Drinking Water–Study Investigation. Sustainability 2019, 11. [Google Scholar] [CrossRef]
- Ghisi, E.; Ferreira, D.F. Potential for potable water savings by using rainwater and greywater in a multi-storey residential building in southern Brazil. Build. Environ. 2007, 42, 2512–2522. [Google Scholar] [CrossRef]
- Ghisi, E.; de Oliveira, S.M. Potential for potable water savings by combining the use of rainwater and greywater in houses in southern Brazil. Build. Environ. 2007, 42, 1731–1742. [Google Scholar] [CrossRef]
- Fasola, G.B.; Ghisi, E.; Marinoski, A.K.; Borinelli, J.B. Potencial de economia de água em duas escolas em Florianópolis, SC (Potential for potable water savings in two schools in Florianópolis, SC). Ambient. Constr. 2011, 11, 65–78. (In Portuguese) [Google Scholar] [CrossRef]
- Proença, L.C.; Ghisi, E. Assessment of Potable Water Savings in Office Buildings Considering Embodied Energy. Water Resour. Manag. 2013, 27, 581–599. [Google Scholar] [CrossRef]
- Zavala, M.L.; Vega, R.C.; Miranda, R.L. Potential of Rainwater Harvesting and Greywater Reuse for Water Consumption Reduction and Wastewater Minimization. Water 2016, 8. [Google Scholar] [CrossRef]
- Domínguez, I.; Ward, S.; Mendoza, J.G.; Rincón, C.I.; Oviedo-Ocaña, E.R. End-User Cost-Benefit Prioritization for Selecting Rainwater Harvesting and Greywater Reuse in Social Housing. Water 2017, 9. [Google Scholar] [CrossRef]
- Kisakye, V.; Van der Bruggen, B. Effects of climate change on water savings and water security from rainwater harvesting systems. Resour. Conserv. Recycl. 2018, 138, 49–63. [Google Scholar] [CrossRef]
- Stec, A.; Zeleňáková, M. An Analysis of the Effectiveness of Two Rainwater Harvesting Systems Located in Central Eastern Europe. Water 2019, 11. [Google Scholar] [CrossRef]
- Manouseli, D.; Kayaga, S.M.; Kalawsky, R. Evaluating the Effectiveness of Residential Water Efficiency Initiatives in England: Influencing Factors and Policy Implications. Water Resour. Manag. 2019, 33, 2219–2238. [Google Scholar] [CrossRef] [Green Version]
- Teston, A.; Teixeira, C.A.; Ghisi, E.; Cardoso, E.B. Impact of Rainwater Harvesting on the Drainage System: Case Study of a Condominium of Houses in Curitiba, Southern Brazil. Water 2018, 10. [Google Scholar] [CrossRef]
- Sepehri, M.; Malekinezhad, H.; Ilderomi, A.R.; Talebi, A.; Hosseini, S.Z. Studying the effect of rain water harvesting from roof surfaces on runoff and household consumption reduction. Sustain. Cities Soc. 2018, 43, 317–324. [Google Scholar] [CrossRef]
- Freni, G.; Liuzzo, L. Effectiveness of Rainwater Harvesting Systems for Flood Reduction in Residential Urban Areas. Water 2019, 11. [Google Scholar] [CrossRef]
- Campisano, A.; D’Amico, G.; Modica, C. Water Saving and Cost Analysis of Large-Scale Implementation of Domestic Rain Water Harvesting in Minor Mediterranean Islands. Water 2017, 9. [Google Scholar] [CrossRef]
- Proença, L.C.; Ghisi, E.; da Fonseca Tavares, D.; Coelho, G.M. Potential for electricity savings by reducing potable water consumption in a city scale. Resour. Conserv. Recycl. 2011, 55, 960–965. [Google Scholar] [CrossRef]
- Secretaria de Planejamento Urbano e Desenvolvimento Sustentável (Department of Urban Planning and Sustainable Development). Joinville Cidade em Dados 2018: Características Gerais (Joinville City in Data 2018: General Features). Available online: https://www.joinville.sc.gov.br/wp-content/uploads/2018/09/Joinville-Cidade-em-Dados-2018-Caracter%C3%ADsticas-Gerais.pdf (accessed on 9 October 2019). (In Portuguese)
- Mello, Y.R.; Koehntopp, P.I. Características climáticas da Bacia Hidrográfica do Rio Cachoeira, Joinville (SC) (Climatic characteristics of Cachoeira River Basin, Joinville (SC)). Acta Biol. Catarin. 2017, 4, 18–28. (In Portuguese) [Google Scholar] [CrossRef]
- Proença, L.C.; Ghisi, E. Water end-uses in Brazilian office buildings. Resour. Conserv. Recycl. 2010, 54, 489–500. [Google Scholar] [CrossRef]
- Willis, R.M.; Stewart, R.A.; Giurco, D.P.; Talebpour, M.R.; Mousavinejad, A. End use water consumption in households: Impact of socio-demographic factors and efficient devices. J. Clean. Prod. 2013, 60, 107–115. [Google Scholar] [CrossRef]
- Barreto, D. Perfil do consumo residencial e usos finais da água (Residential water consumption pattern and internal uses of water). Ambiente Constr. 2008, 8, 23–40. (In Portuguese) [Google Scholar]
- Sant’ana, D. Domestic water end-uses and water conservation in multi-storey buildings in the federal district, Brazil. In Proceedings of the 28th PLEA International Conference, Lima, Peru, 7–9 November 2012; PLEA: Lima, Peru, 2012. [Google Scholar]
- Marinoski, A.K.; Vieira, A.S.; Silva, A.S.; Ghisi, E. Water End-Uses in Low-Income Houses in Southern Brazil. Water 2014, 6, 1985–1999. [Google Scholar] [CrossRef] [Green Version]
- Vieira, A.S.; Ghisi, E. Water-energy nexus in low-income houses in Brazil: The influence of integrated on-site water and sewage management strategies on the energy consumption of water and sewerage services. J. Clean. Prod. 2016, 133, 145–162. [Google Scholar] [CrossRef]
- Kammers, P.C.; Ghisi, E. Usos finais de água em edifícios públicos localizados em Florianópolis, SC (Water end-uses in public buildings located in Florianópolis-SC). Ambiente Constr. 2006, 6, 75–90. (In Portuguese) [Google Scholar]
- Fasola, G.B. Usos Finais de água potável em escolas de Florianópolis (Potable Water End-Uses in Schools in Florianópolis); Scientific Initiation Report; Federal University of Santa Catarina: Florianópolis, Brazil, 2009. (In Portuguese) [Google Scholar]
- Ghisi, E.; Cordova, M.M. Netuno 4. Programa Computacional (Netuno 4. Computer Programme); Federal University of Santa Catarina: Florianópolis, Brazil, 2014; Available online: https://www.labeee.ufsc.br (accessed on 21 June 2017). (In Portuguese)
- Ghisi, E.; Cordova, M.M. Netuno 4: Manual do Usuário (Netuno 4: User Manual). Available online: http://www.labeee.ufsc.br/sites/default/files/Manual-Netuno-4_Junho2014.pdf (accessed on 9 October 2019). (In Portuguese).
- Rocha, V.L. Validação do algoritmo do programa netuno para avaliação do potencial de economia de água potável e dimensionamento de reservatórios de sistemas de aproveitamento de água pluvial em edificações (Validation of The Netuno Computer Programme Algorithm for Assessment of Potable Water Saving Potential and Sizing of Rainwater Harvesting Systems Reservoirs in Buildings). Masther’s Thesis, Federal University of Santa Catarina, Florianópolis, Brazil, 2009. (In Portuguese). [Google Scholar]
- O’Leary, B.; Reiners, J.J.; Xu, X.; Lemke, L.D. Identification and influence of spatio-temporal outliers in urban air quality measurements. Sci. Total Environ. 2016, 573, 55–65. [Google Scholar] [CrossRef] [PubMed] [Green Version]
- Fávero, L.P.; Belfiore, P. Univariate Descriptive Statistics. In Data Science for Business and Decision Making; Academic Press: Cambridge, MA, USA, 2019; pp. 21–91. ISBN 978-0-12-811216-8. [Google Scholar] [CrossRef]
- Custódio, D. Influência do aproveitamento de água pluvial em edificações residenciais na drenagem urbana de Joinville/SC (Influence of Rainwater Harvesting on Residential Buildings in The Urban Drainage in Joinville/SC). Masther’s Thesis, Federal University of Santa Catarina, Florianópolis, Brazil, 2017. (In Portuguese). [Google Scholar]
- Joinville. Sistema de Informações Municipais Georreferenciadas—SIMGeo (Geographical Information System-SIMGeo). Available online: http://simgeo.joinville.sc.gov.br/ (accessed on 12 April 2018). (In Portuguese)
- Maia, B.G.O.; Klostermann, D.; Ribeiro, J.M.G.; Simm, M.; Oliveira, T.M.N.; Barros, V.G. Bacias Hidrográficas da Região de Joinville (Watersheds of Region of Joinville), 2nd ed.; Univille: Joinville, Brazil, 2013; pp. 30–52. (In Portuguese) [Google Scholar]
- Associação Brasileira de Normas Técnicas (Brazilian Association of Technical Standards). NBR 15527: Aproveitamento de água de chuva de coberturas para fins não potáveis—Requisitos (Rainwater Harvesting from Roofs for Non-Potables Uses—Requiriments); Associação Brasileira de Normas Técnicas (ABNT): Rio de Janeiro, Brazil, 2019. (In Portuguese) [Google Scholar]
- De Oliveira, L.H. As bacias sanitárias e as perdas de água nos edifícios (Toilets and water losses in buildings). Ambiente Constr. 2002, 2, 39–45. [Google Scholar]
- Sistema Nacional de Informações sobre Saneamento (National Information System on Sanitation). Série Histórica (Historic Serie). Available online: http://app3.cidades.gov.br/serieHistorica/ (accessed on 1 March 2018). (In Portuguese)
- Agência Municipal de Regulação dos Serviços de Água e Esgoto de Joinville (Municipal Agency for the Regulation of Water and Sewage Services of Joinville). Relatório de Análise Regulatória da Companhia Águas de Joinville: Janeiro a Dezembro 2016 (Regulatory Analysis Report of Águas de Joinville Company: January to December 2016); Technical Report; AMAE: Joinville, Brazil, 2017. (In Portuguese) [Google Scholar]
- Ghisi, E.; Rupp, R.F.; Triska, Y. Comparing indicators to rank strategies to save potable water in buildings. Resour. Conserv. Recycl. 2014, 87, 137–144. [Google Scholar] [CrossRef]
- Instituto Brasileiro de Geografia e Estatística (Brazilian Institute of Geography and Statistics). Joinville: Censo: Universo—Características da população e dos domicílios (Joinville: Census: Universe—Characteristics of Population and Households). Available online: https://cidades.ibge.gov.br/brasil/sc/joinville/pesquisa/23/24304?detalhes=true (accessed on 31 August 2018). (In Portuguese)
Figure 1.
Average monthly precipitation and temperature in Joinville.

Figure 2.
Range of water end-use scenarios for each building sector.

Figure 3.
Minimum and maximum reductions of potable water consumption due to each strategy.

Figure 4.
Minimum and maximum reductions of sewage generation due to each strategy.


Table 1.
Minimum and maximum water end-uses of greywater sources, non-potable water demand and toilets used for determining the water end-uses scenarios.
Table 1.
Minimum and maximum water end-uses of greywater sources, non-potable water demand and toilets used for determining the water end-uses scenarios.
| Type of Use | Water End-Uses (%) | ||||
|---|---|---|---|---|---|
| Single-Family Residential | Multi-Family Residential | Public | Commercial | ||
| Greywater source | Minimum | 15.0 [25] | 26.7 [4] | 3.1 [6] | 6.8 [20] |
| Maximum | 65.0 [25] | 46.6 [4] | 31.2 [26] | 38.4 [20] | |
| Non-potable water demand | Minimum | 9.0 [24] | 25.7 [23] | 26.1 [6] | 55.9 [20] |
| Maximum | 44.0 [25] | 37.2 [4] | 88.9 [26] | 86.2 [20] | |
| Toilets | Minimum | 5.5 [22] | 15.8 [23] | 19.6 [6] | 52.0 [20] |
| Maximum | 44.0 [25] | 35.1 [4] | 78.8 [26] | 84.6 [20] | |
Table 2.
Minimum and maximum potentials for potable water savings and reduction of sewage generation in each building sector.
Table 2.
Minimum and maximum potentials for potable water savings and reduction of sewage generation in each building sector.
| Strategy. | Building Sector | Potential for Potable Water Savings (%) | Potential for Reduction of Sewage Generation (%) | ||
|---|---|---|---|---|---|
| Minimum | Maximum | Minimum | Maximum | ||
| Replacement of toilets | Single-family residential | 0.8 | 33.8 | 0.8 | 33.8 |
| Multi-family residential | 2.2 | 26.2 | 2.2 | 26.2 | |
| Public | 3.0 | 60.0 | 3.0 | 60.0 | |
| Commercial | 8.2 | 63.8 | 8.2 | 63.8 | |
| Greywater reuse | Single-family residential | 10.0 | 45.0 | 10.0 | 45.0 |
| Multi-family residential | 25.0 | 35.0 | 25.0 | 35.0 | |
| Public | 5.0 | 35.0 | 5.0 | 35.0 | |
| Commercial | 5.0 | 35.0 | 5.0 | 35.0 | |
| Rainwater harvesting | Single-family residential | 9.9 | 49.8 | 0.0 | 0.0 |
| Multi-family residential | 0.2 | 25.8 | 0.0 | 0.0 | |
| Public | 3.5 | 72.1 | 0.0 | 0.0 | |
| Commercial | 2.6 | 69.9 | 0.0 | 0.0 | |
| Combination of strategies | Single-family residential | 10.0 | 50.0 | 10.0 | 50.0 |
| Multi-family residential | 25.0 | 35.0 | 25.0 | 35.0 | |
| Public | 11.5 | 84.9 | 8.0 | 75.0 | |
| Commercial | 15.9 | 85.0 | 13.2 | 78.8 | |
Table 3.
Total daily water demands and catchment areas for each sector.
| Building Sector | Total Water Demand (L/Building/Day) | Catchment Area (m2) | ||||
|---|---|---|---|---|---|---|
| Minimum | Most Likely Occurrence | Maximum | Minimum | Most Likely Occurrence | Maximum | |
| Single-family residential | 217 | 278 | 659 | 36.0 | 64.4 | 200.4 |
| Multi-family residential | 5271 | 35,962 | 110,500 | 97.8 | 273.8 | 657.8 |
| Public | 2982 | 4673 | 15,164 | 127.3 | 544.7 | 4115.3 |
| Commercial | 2652 | 6624 | 7948 | 30.7 | 231.6 | 964.2 |
Table 4.
Percentage of water consumption and sewage generation in each building sector in Joinville.
Table 4.
Percentage of water consumption and sewage generation in each building sector in Joinville.
| Building Sector | Water Consumption (%) | Sewage Generation (%) |
|---|---|---|
| Residential | 81 | 79 |
| Public | 4 | 3 |
| Commercial | 10 | 16 |
| Industrial | 5 | 2 |
Source: AMAE [39].
Table 5.
Total potentials for potable water savings and sewage generation due to each strategy.
| Strategy | Potential for Potable Water Saving (%) | Potential for Reduction of Sewage Generation (%) | ||
|---|---|---|---|---|
| Minimum | Maximum | Minimum | Maximum | |
| Replacement of toilets | 1.7 | 35.1 | 2.1 | 37.4 |
| Greywater reuse | 10.7 | 40.1 | 10.7 | 40.8 |
| Rainwater harvesting | 7.2 | 47.2 | 0.0 | 0.0 |
| Combination of strategies | 12.1 | 50.5 | 12.1 | 52.1 |
© 2019 by the authors. Licensee MDPI, Basel, Switzerland. This article is an open access article distributed under the terms and conditions of the Creative Commons Attribution (CC BY) license (http://creativecommons.org/licenses/by/4.0/).
Share and Cite
MDPI and ACS Style
Cureau, R.J.; Ghisi, E. Reduction of Potable Water Consumption and Sewage Generation on a City Scale: A Case Study in Brazil. Water 2019, 11, 2351. https://doi.org/10.3390/w11112351
AMA Style
Cureau RJ, Ghisi E. Reduction of Potable Water Consumption and Sewage Generation on a City Scale: A Case Study in Brazil. Water. 2019; 11(11):2351. https://doi.org/10.3390/w11112351
Chicago/Turabian StyleCureau, Roberta Jacoby, and Enedir Ghisi. 2019. "Reduction of Potable Water Consumption and Sewage Generation on a City Scale: A Case Study in Brazil" Water 11, no. 11: 2351. https://doi.org/10.3390/w11112351
Note that from the first issue of 2016, this journal uses article numbers instead of page numbers. See further details here.