Bed Shear Stress Influence on Local Scour Geometry Properties in Various Flume Development Conditions

Water Engineering Division, Department of Hydraulic Engineering, Warsaw University of Life Sciences—SGGW, 159 Nowoursynowska Street, 02-787 Warsaw, Poland
*
Author to whom correspondence should be addressed.
Water 2019, 11(11), 2346; https://doi.org/10.3390/w11112346
Submission received: 23 September 2019
/
Revised: 26 October 2019
/
Accepted: 6 November 2019
/
Published: 8 November 2019
(This article belongs to the Section Hydraulics and Hydrodynamics)
Abstract
:Numerous approaches in sediment mobility studies highlighted the key meaning of channel roughness, which results not only from bed material granulation but also from various bed forms presence, caused by continuous sediment transport. Those forms are strictly connected with the intensity of particle transport, and they eventuate from bed shear stress. The present paper comprised of local scours geometric dimensions research in three variants of lengthwise development of laboratory flume in various hydraulic properties, both in “clear-water” and “live-bed” conditions of sediment movement. Lots of measurements of the bed conformation were executed using the LiDAR device, marked by a very precise three-dimensional shape description. The influence of the bed shear stress downstream model on scours hole dimensions of water structure was investigated as one of the key factors that impact the sediment transport intensity. A significant database of 39 experimental series, lasting averagely 8 h, was a foundation for delineating functional correlations between bed shear stress-and-critical shear stress ratio and geometry properties of local scours in various flume development cases. In the scope of mutual influence of bed shear stress and water depth, high correlation coefficients were attained, indicating very good and good functional correlations. Also, the influence of bed shear stress and the total length of the scour demonstrated a high correlation coefficient.
1. Introduction
The local scouring process is an effect of river bed destabilization, arisen as a result of existing hydraulic parameters change, which took a significant role in water flow conditions and sediment transport regime formation. Those changes could be invoked both by natural (such as ice blockages or by wood rubble deposition) and by anthropogenic factors, connected with developing the channel by water structures, for example, in the region of bridge pillars, or lengthwise structures, such as weirs or dams [1,2,3,4].
Sediment accumulation in the upper stand of the water structure causes dynamic equilibrium disturbance between water flow and sediment transport process. These disturbances, together with stream energy increment, caused by holding back the water level upstream the obstruction, generate the local scour process below the structure.
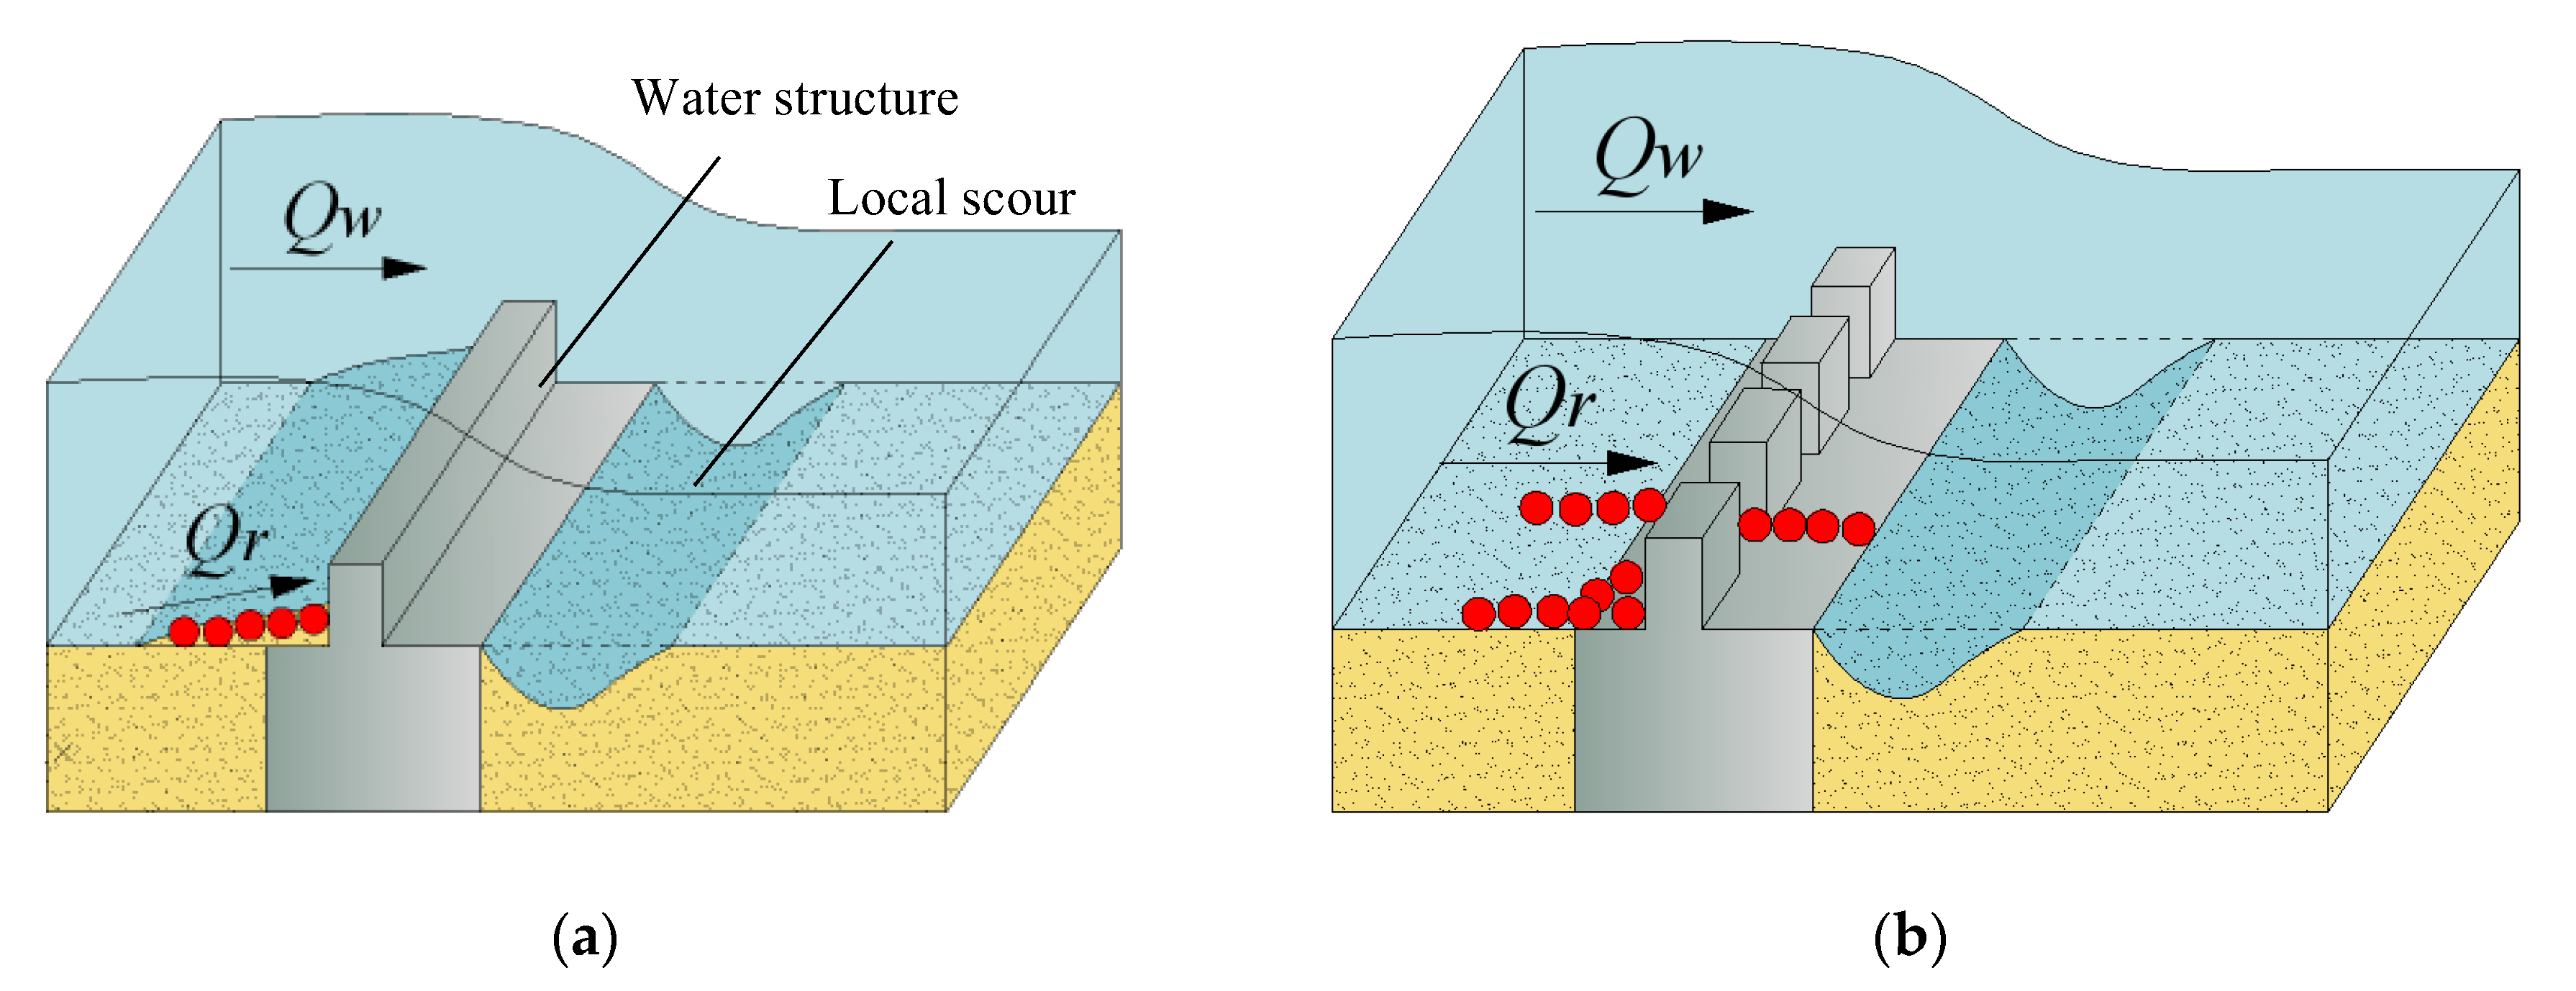
Water structure could interrupt the continuity of sediment transport, or this continuity could be also preserved, what took place when the soil particles movement is conducted through the structure (i.e., through bridge pillars, gabions, or natural structure formations, such as stones or rocks, that could be used as a weir). The first case is named “clear-water” conditions because flowing water, downstream the structure, is almost devoid of sediment; meanwhile, water flow containing the sediment load is named “live-bed” conditions [5,6,7,8,9] (Figure 1).
In the case of “clear-water”, bed building material stays quiescent and does not participate in sediment transport, i.e., approaching flow does not drag almost any bed material in the scour hole area. The material loosed and removed from the hole is not substituted by the sediment load transported from the upstream; therefore, shear stress in the local scour area is gradually diminished simultaneously with hole deepening. When the movement of bed material stops and the local scour ends to take shape when bed shear stress becomes lower than the critical value, then local scour dimensions, such as its medium and maximal depth or length, could be recognized as stable [9,10].
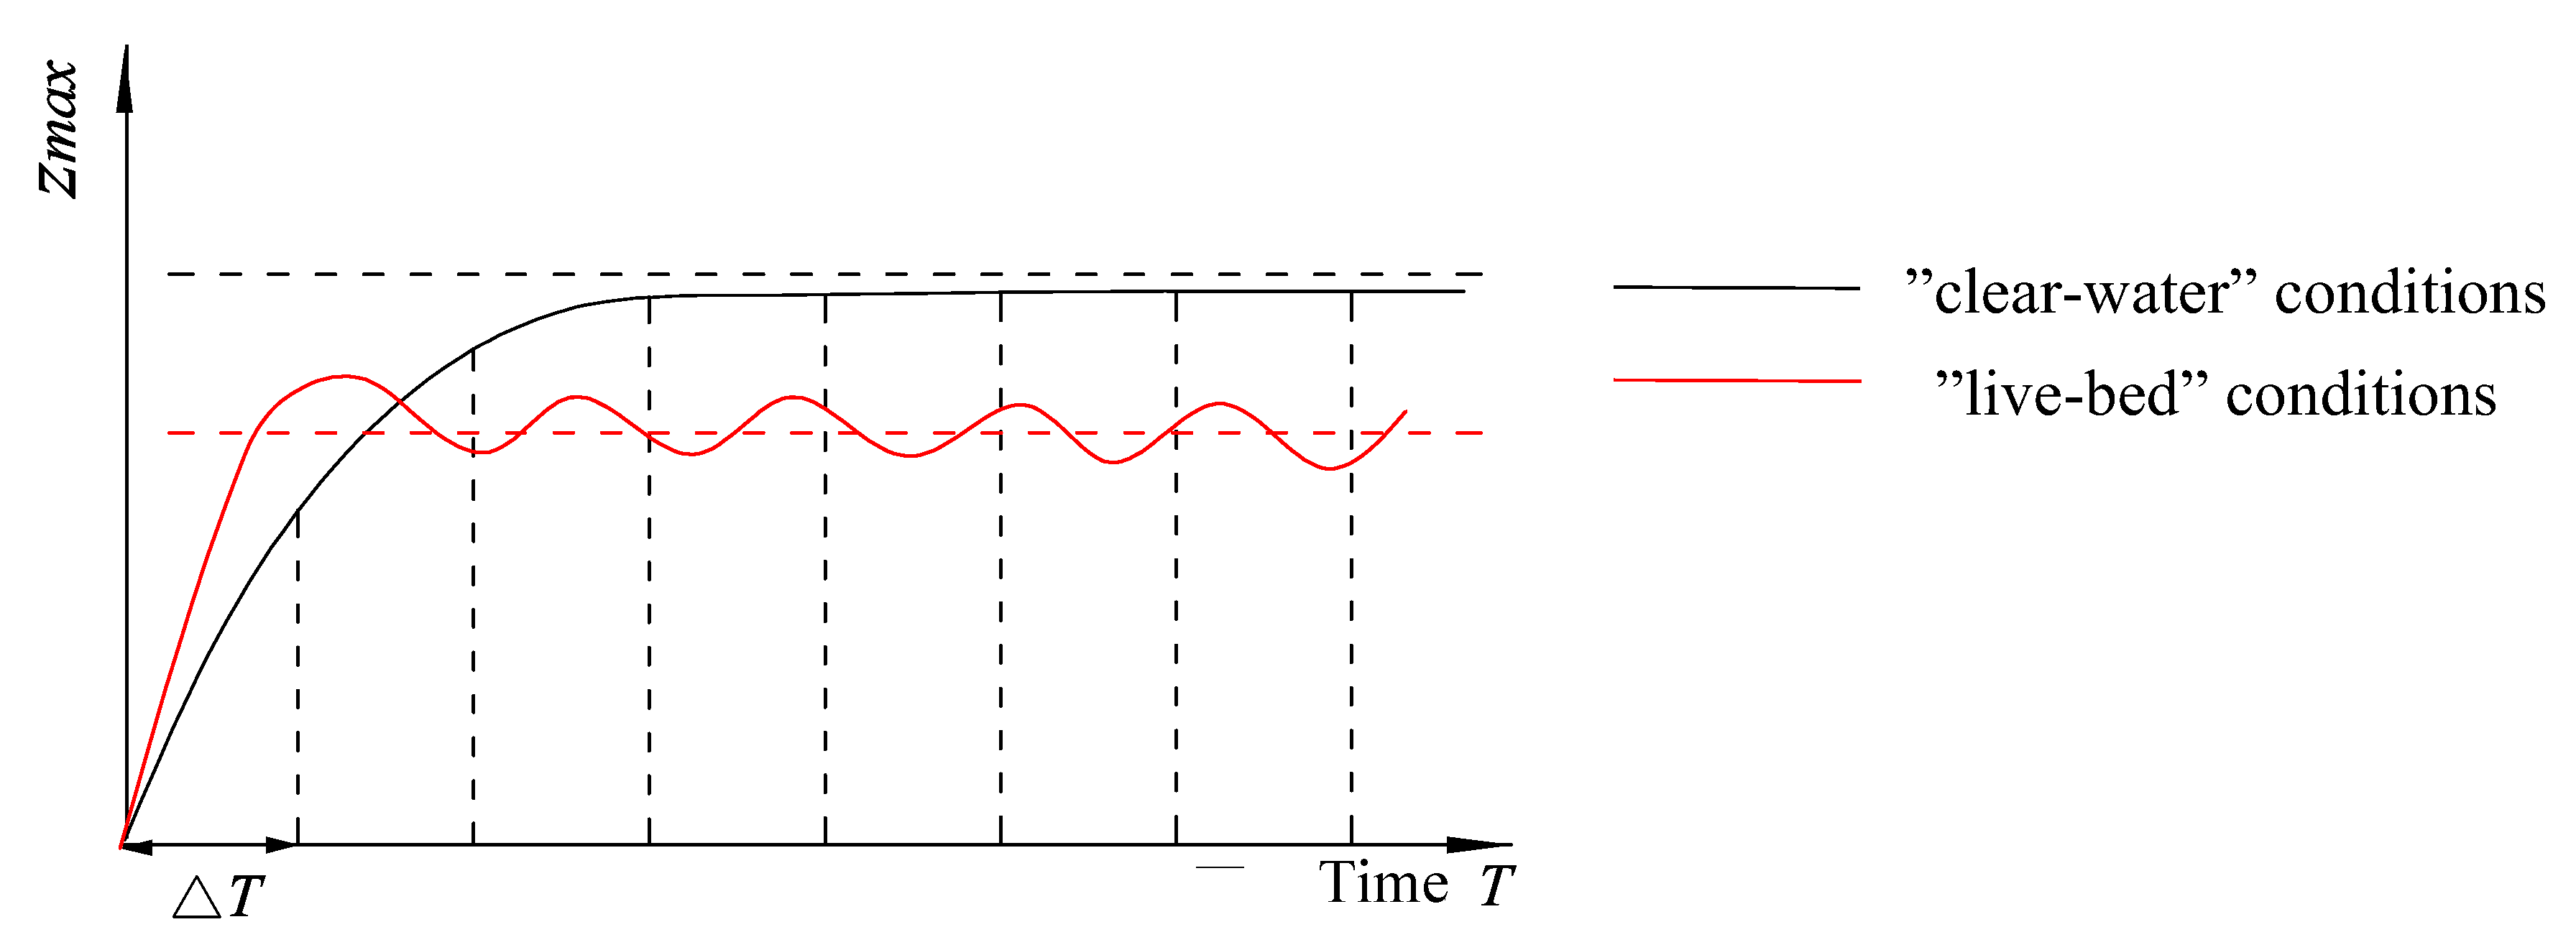
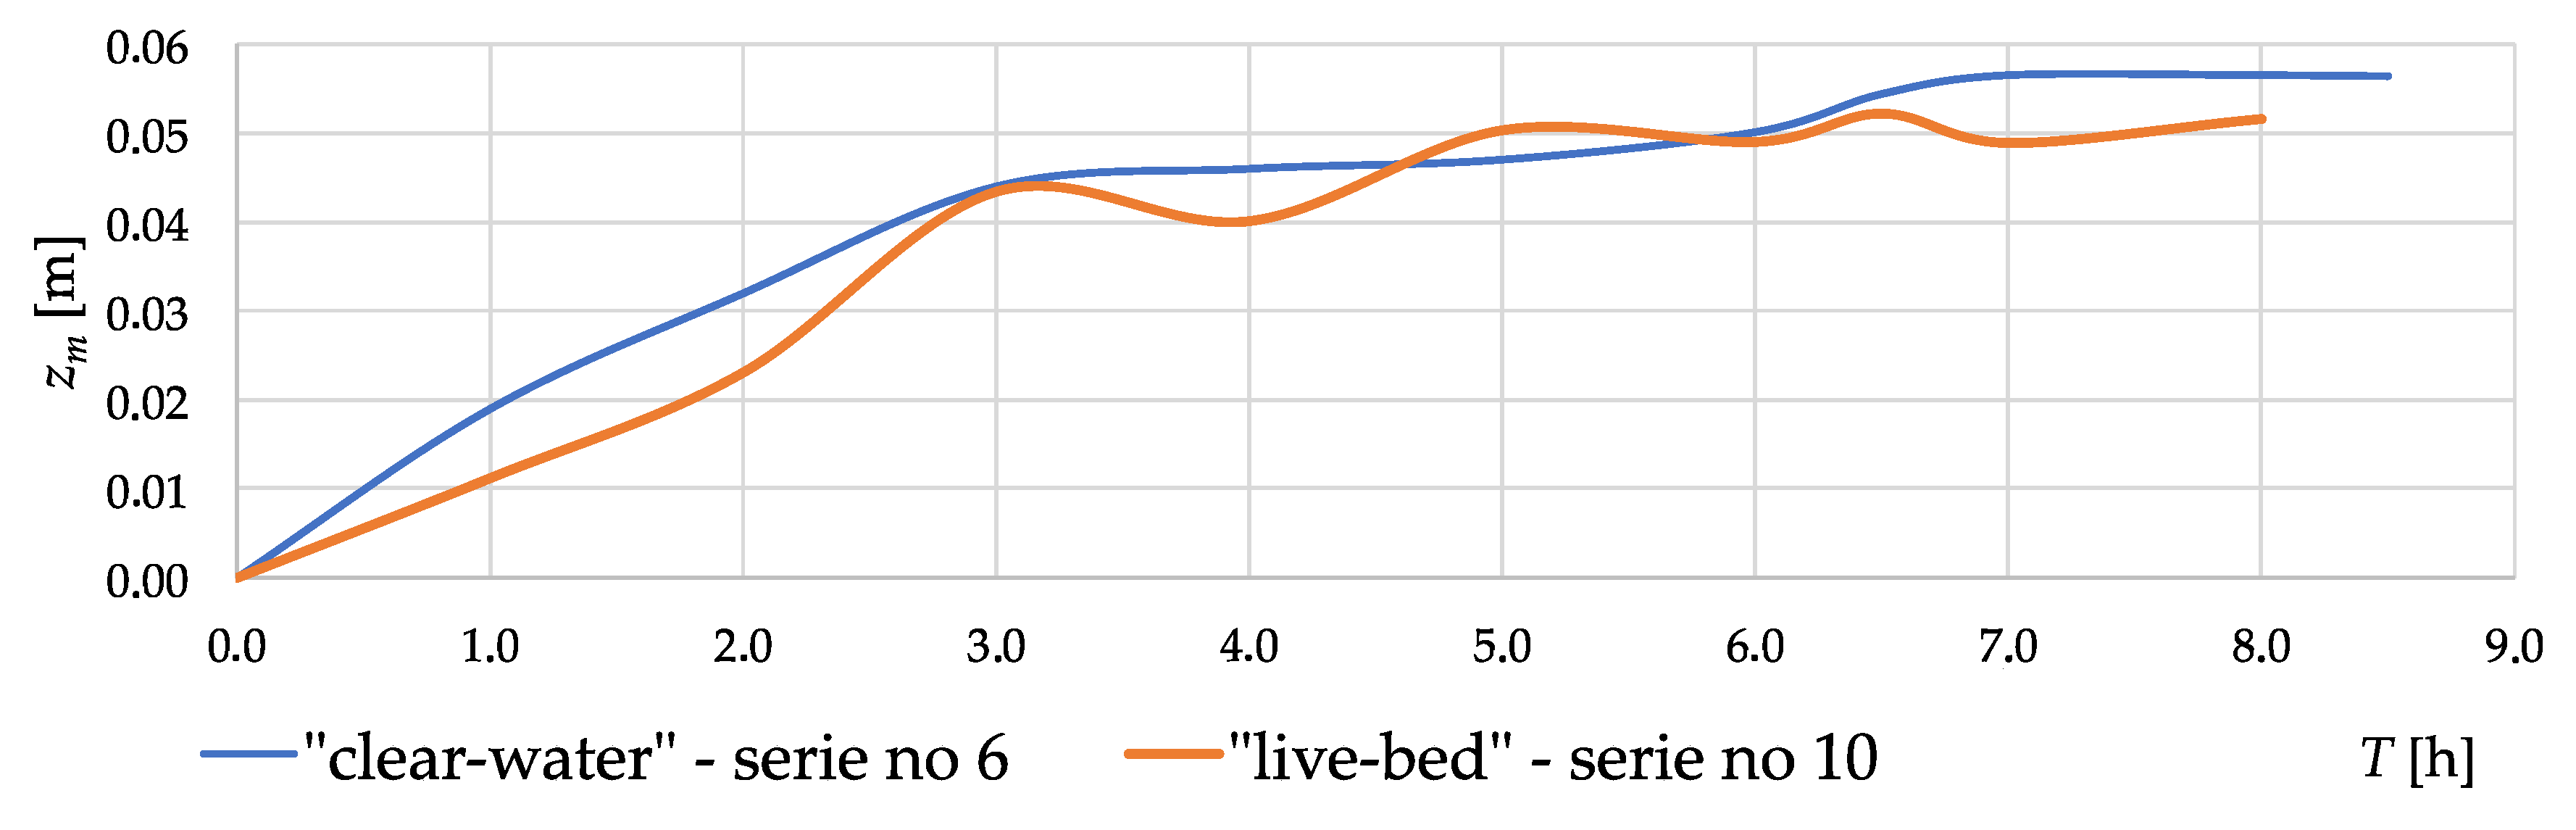
According to Chabert and Engeldinger [9], stable scour hole shape could be recognized through observation of maximal scour depth in time (Figure 2). Dynamic equilibrium in “clear-water” could be ascertained when maximal scour depth is stable in subsequent time steps. In “live-bed” conditions, when soil leaving the scour hole is substituted by approaching load from the upstream, determination of the one exact value of maximal scour depth is impossible; however, it fluctuates around the depth, which could be recognized as average [9].
Erosive processes, downstream of the structure, have an immutable character. In the case of the unfavorable geological structure of the alluvial bed, they could include further river reaches. Local scour could be deepened, depending on hydrodynamic conditions fluctuations, while forming a scour hole could begin to comprise a danger for water structure foundations stability, especially during catastrophic floods [11,12,13,14].
Despite wide analysis and empirical formulas variability, water structure designers have indefeasible difficulties with choosing those formulas, which give reliable computation results [15,16]. It is essential to describe forecasted scour dimensions at a planning stage, also its shape and exact location of the hole. Local scour properties calculation allows proper lower structure stand development, ensuring safety and stability [13]. Due to the high costs of bottom reinforcement, scouring forecasting should be an integral part of the hydrotechnical planning and designing stage; however, universal computational formula, useful in various hydraulic conditions, is still unknown [8,15,16,17,18,19,20,21,22,23,24,25,26].
Numerous approaches in sediment mobility studies highlighted the key meaning of channel roughness, which results not only from the bed material granulation but also from the presence of various forms of bed, caused by continuous sediment transport (for example, [10,23,27,28,29,30]). Those forms are strictly connected with the intensity of particle transport, and they eventuate from bed shear stress. Sediment particles on the bed may slide, roll, or jump downstream if the flow velocity exceeds some critical value [31]. The motion of bedload is diffusive, which contributes to this highly advanced and complex study field, already on a single grain level [32,33].
The aim of the study was to investigate the relationship between the geometry of local scour caused by the differentiation of flow resistance at flume length or by introduction of a damming obstacle (the model of cross-wise hydraulic structure) into the riverbed and the dynamics of sediment movement, described by stresses on the bottom and their relation to critical stresses. The innovative approach obtains simple formulas proposal, on the grounds of basic hydraulic parameters database, with a simultaneous high density of bottom shape measurement grid due to used very precise measurement device.
Present paper comprised of local scours geometric dimension research in three variants of laboratory flume development in various hydraulic properties, both in “clear-water” and “live-bed” conditions of sediment movement. The influence of bed shear stress downstream model on the scour hole dimensions of water structure was investigated as one of the key factors that impacts on sediment transport intensity.
2. Materials and Methods
2.1. Experimental Setup
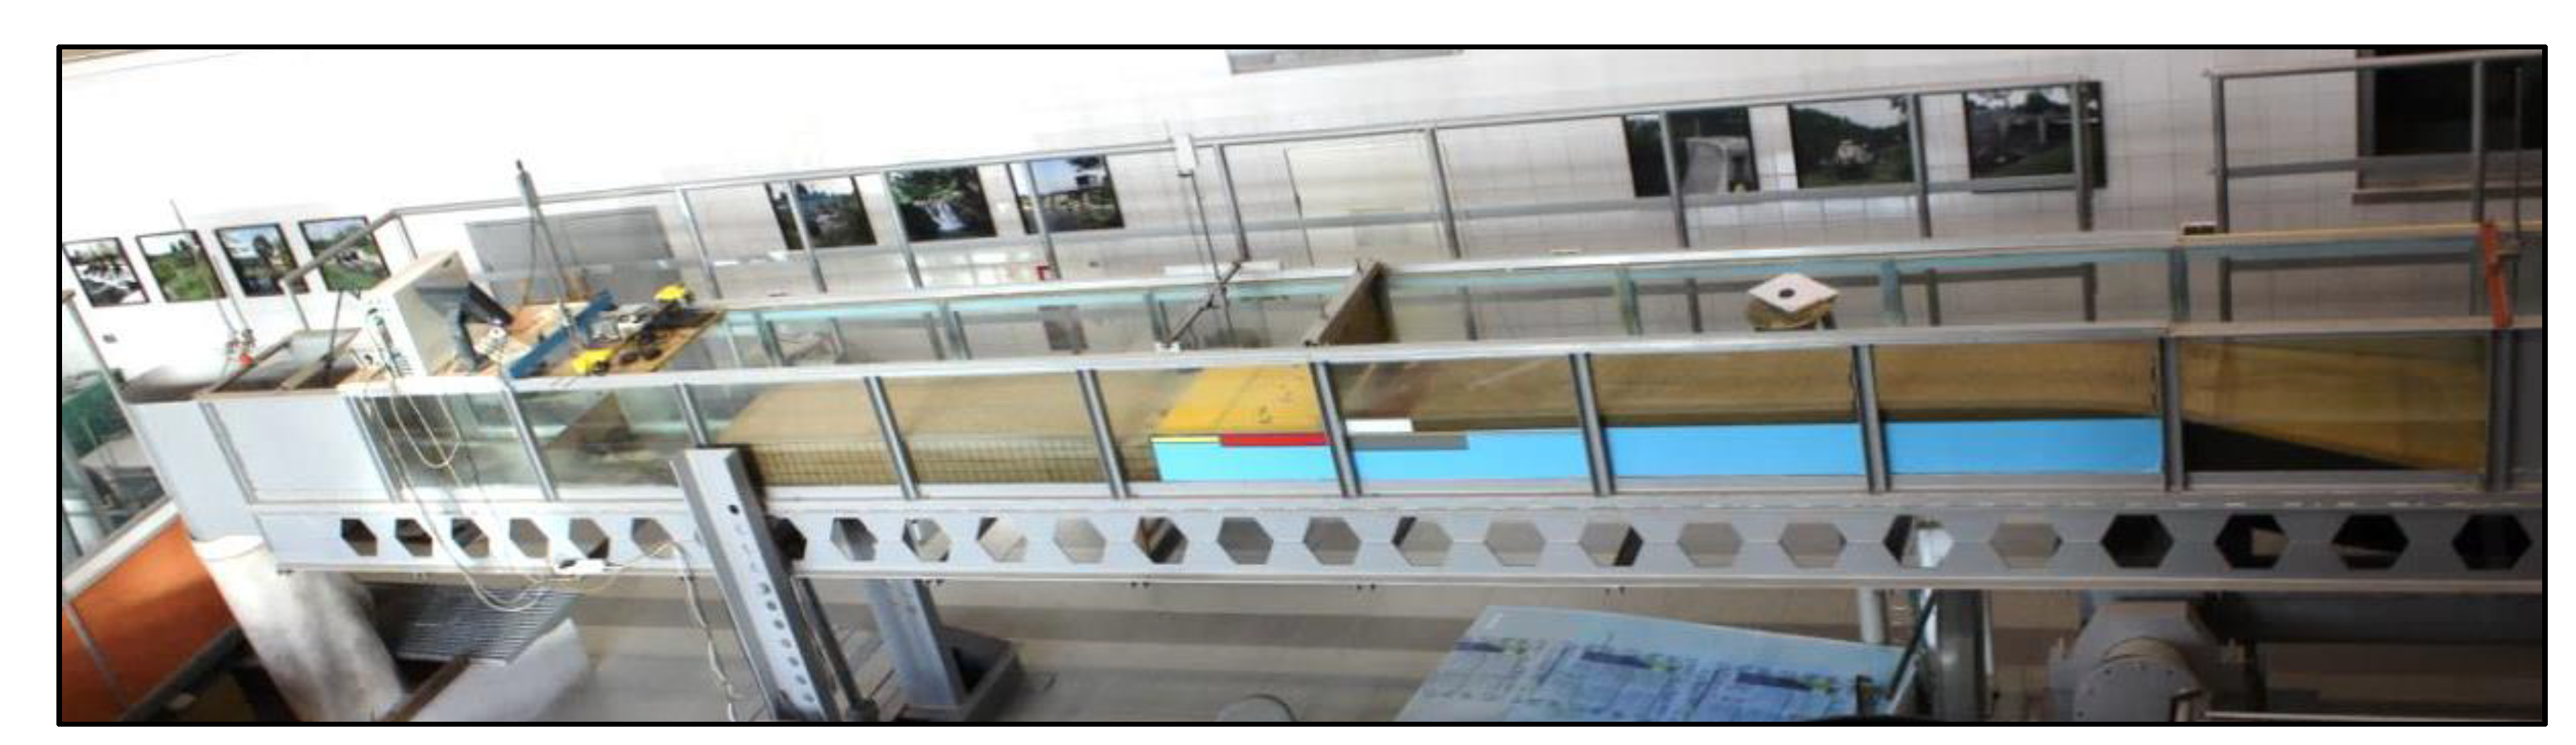
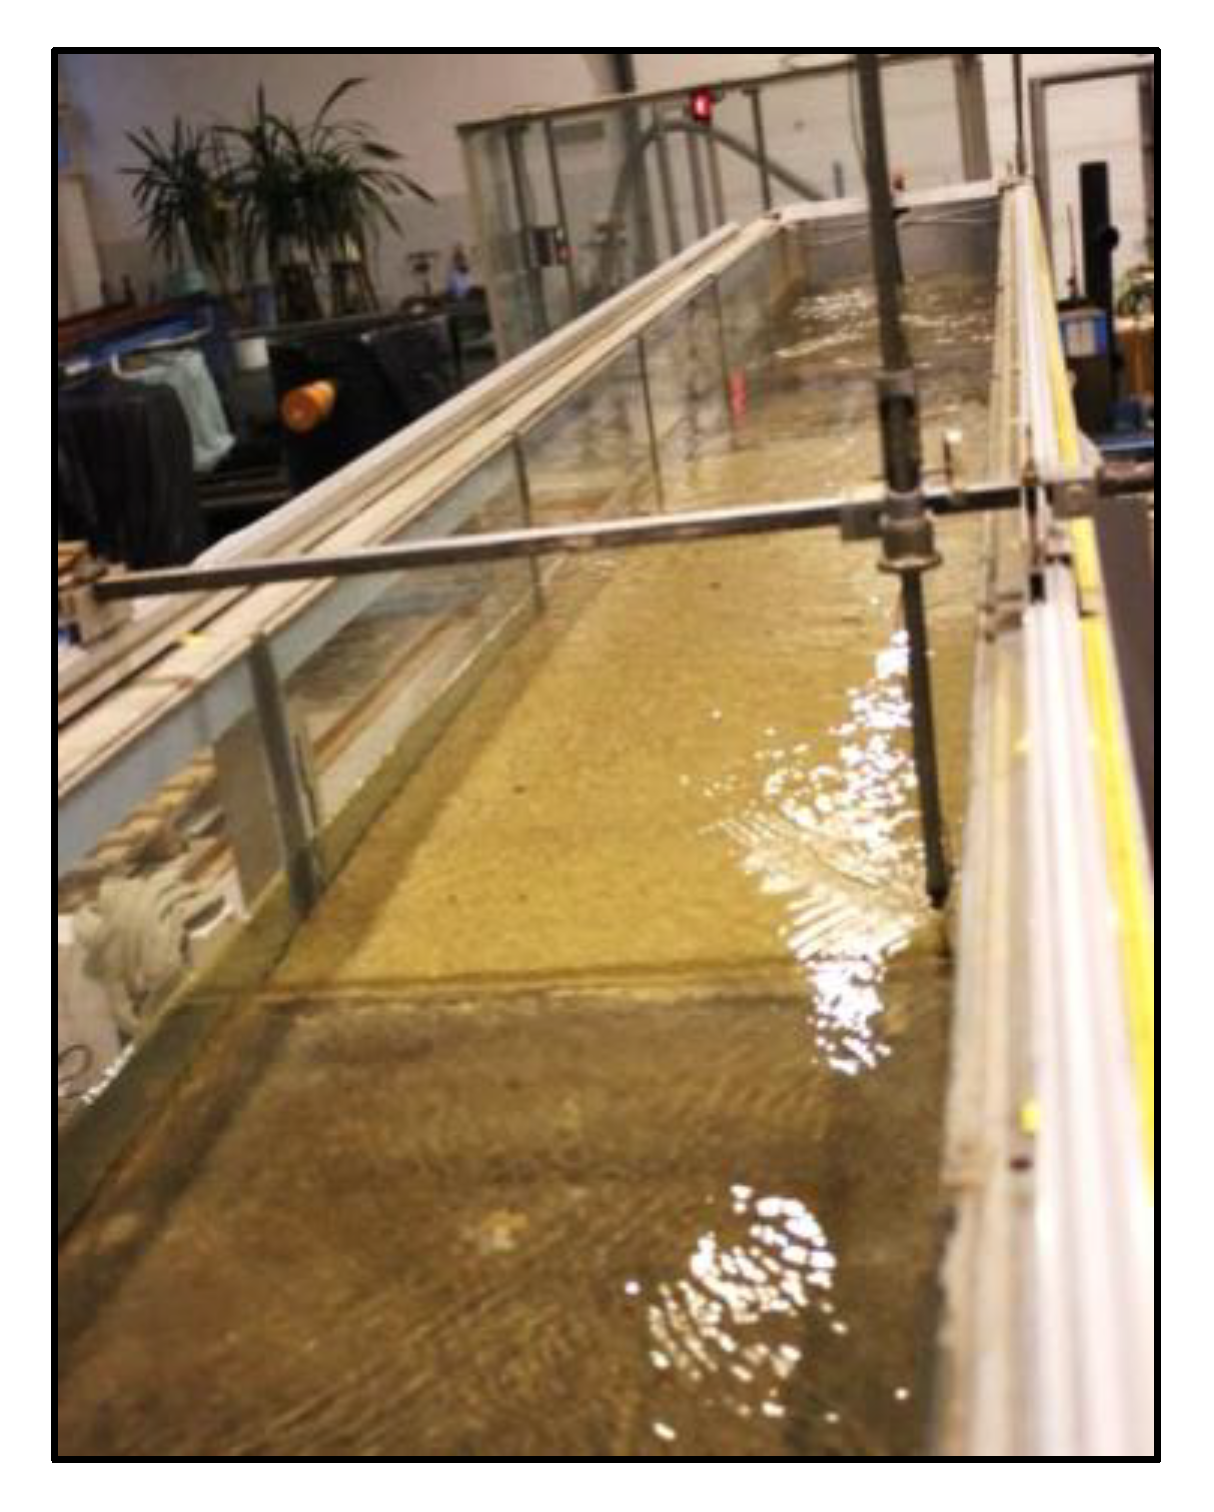
The research comprised of laboratory works, database analysis, and computational part of the investigation. Laboratory works were conducted in a physical model of the flume with a totally or partially scourable bed, with rectangular 0.58-m width cross-sections. The else main dimensions of the flume were: 11.00 m of total length Lc and 0.60 m of lateral border glass panels width H (Figure 3 and Figure 4).
A total of 39 laboratory measurement series were performed on three flume development variants, each lasting 4.0–14.5 h to ensure relatively stable scour shape. Local scours were formed as a result of hydraulic gradient alteration over a bed length due to various materials of the bottom, when solid bed precedes the sandy scourable part (Variant I of the flume development, 13 measurement series; Figure 5a and Figure 6), or as a result of dynamic equilibrium disturbance by removable modules introduced into flume, comprising of small-scale models of lengthwise water structures: stone weirs (Variant II and III—stone weirs, 13 measurement series both) (Figure 4b,c, Figure 7 and Figure 8).
The first model (I) (Figure 5a and Figure 6) had the following bottom construction: about 4-m long solid bottom transforms in the intake part into the sandy bed with medium particles’ diameter d50 = 0.00091 m, long for L = 2.18 m. The experimental conditions in this study might be compared to a case of the transport continuity being disrupted by the accumulation of the bedload material in the retention reservoir located in the upstream [34,35]. Due to flow resistance increment along the whole flume, resulting from varied roughness of solid and sandy bottom, the hydraulic gradient increased, causing the increment of shear stress at the bottom. After exceeding the critical shear stress, the motion of sediment grains started, followed by the gradual scouring of the bed.
In the second (II) and third models (III) (Figure 5b,c, Figure 7 and Figure 8), the water structure was introduced in the flume with a totally or partially sandy bed. The weir was made of stone with four slots (summary area of slots AsII = 0.018 m2 for Variant II of development and AsIII = 0.035 m2 for Variant III).
A pin water gauge was used in the intake part in order to measure the water surface elevation (F), regulated with a gate (D). In order to measure the ordinate of water surface level along the flume, a moving pin water gauge was used (E) and was placed on the trolley pushed on a guide along the channel. The level of the sandy bottom was measured with a laser scanner device and with a moving disc as a helping device. All experimental series were conducted long enough to achieve a relatively stable scour shape to ensure dynamic equilibrium. The bottom shape was investigated at all flume length.
The water flow discharge was examined with the use of electromagnetic flowmeter. Experiments were performed in the scope of water flow discharge Qw = 0.020–0.045 m3 s−1 and water depth downstream of the structure h = 0.05–0.10 m.
No sediment feeding system was adopted. “Clear-water” and “live-bed” conditions were attained by imparting or withholding sediment transport from the initial part of the flume by ensuring hydraulic conditions that could invoke or not the particle movement from upstream towards a lower stand of the structure.
2.2. LiDAR Scanning
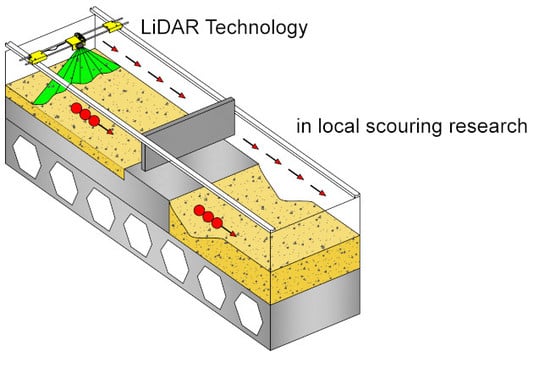
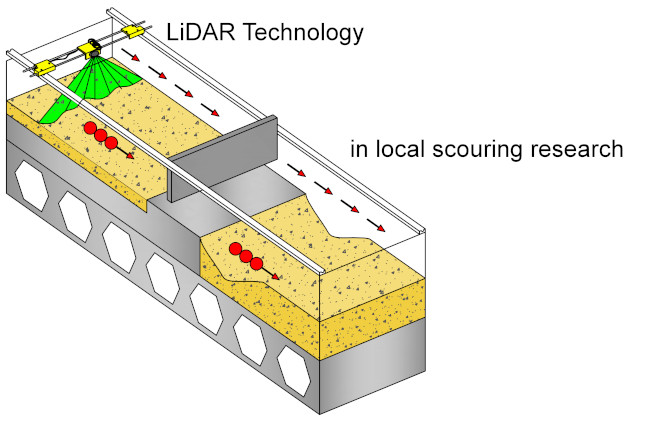
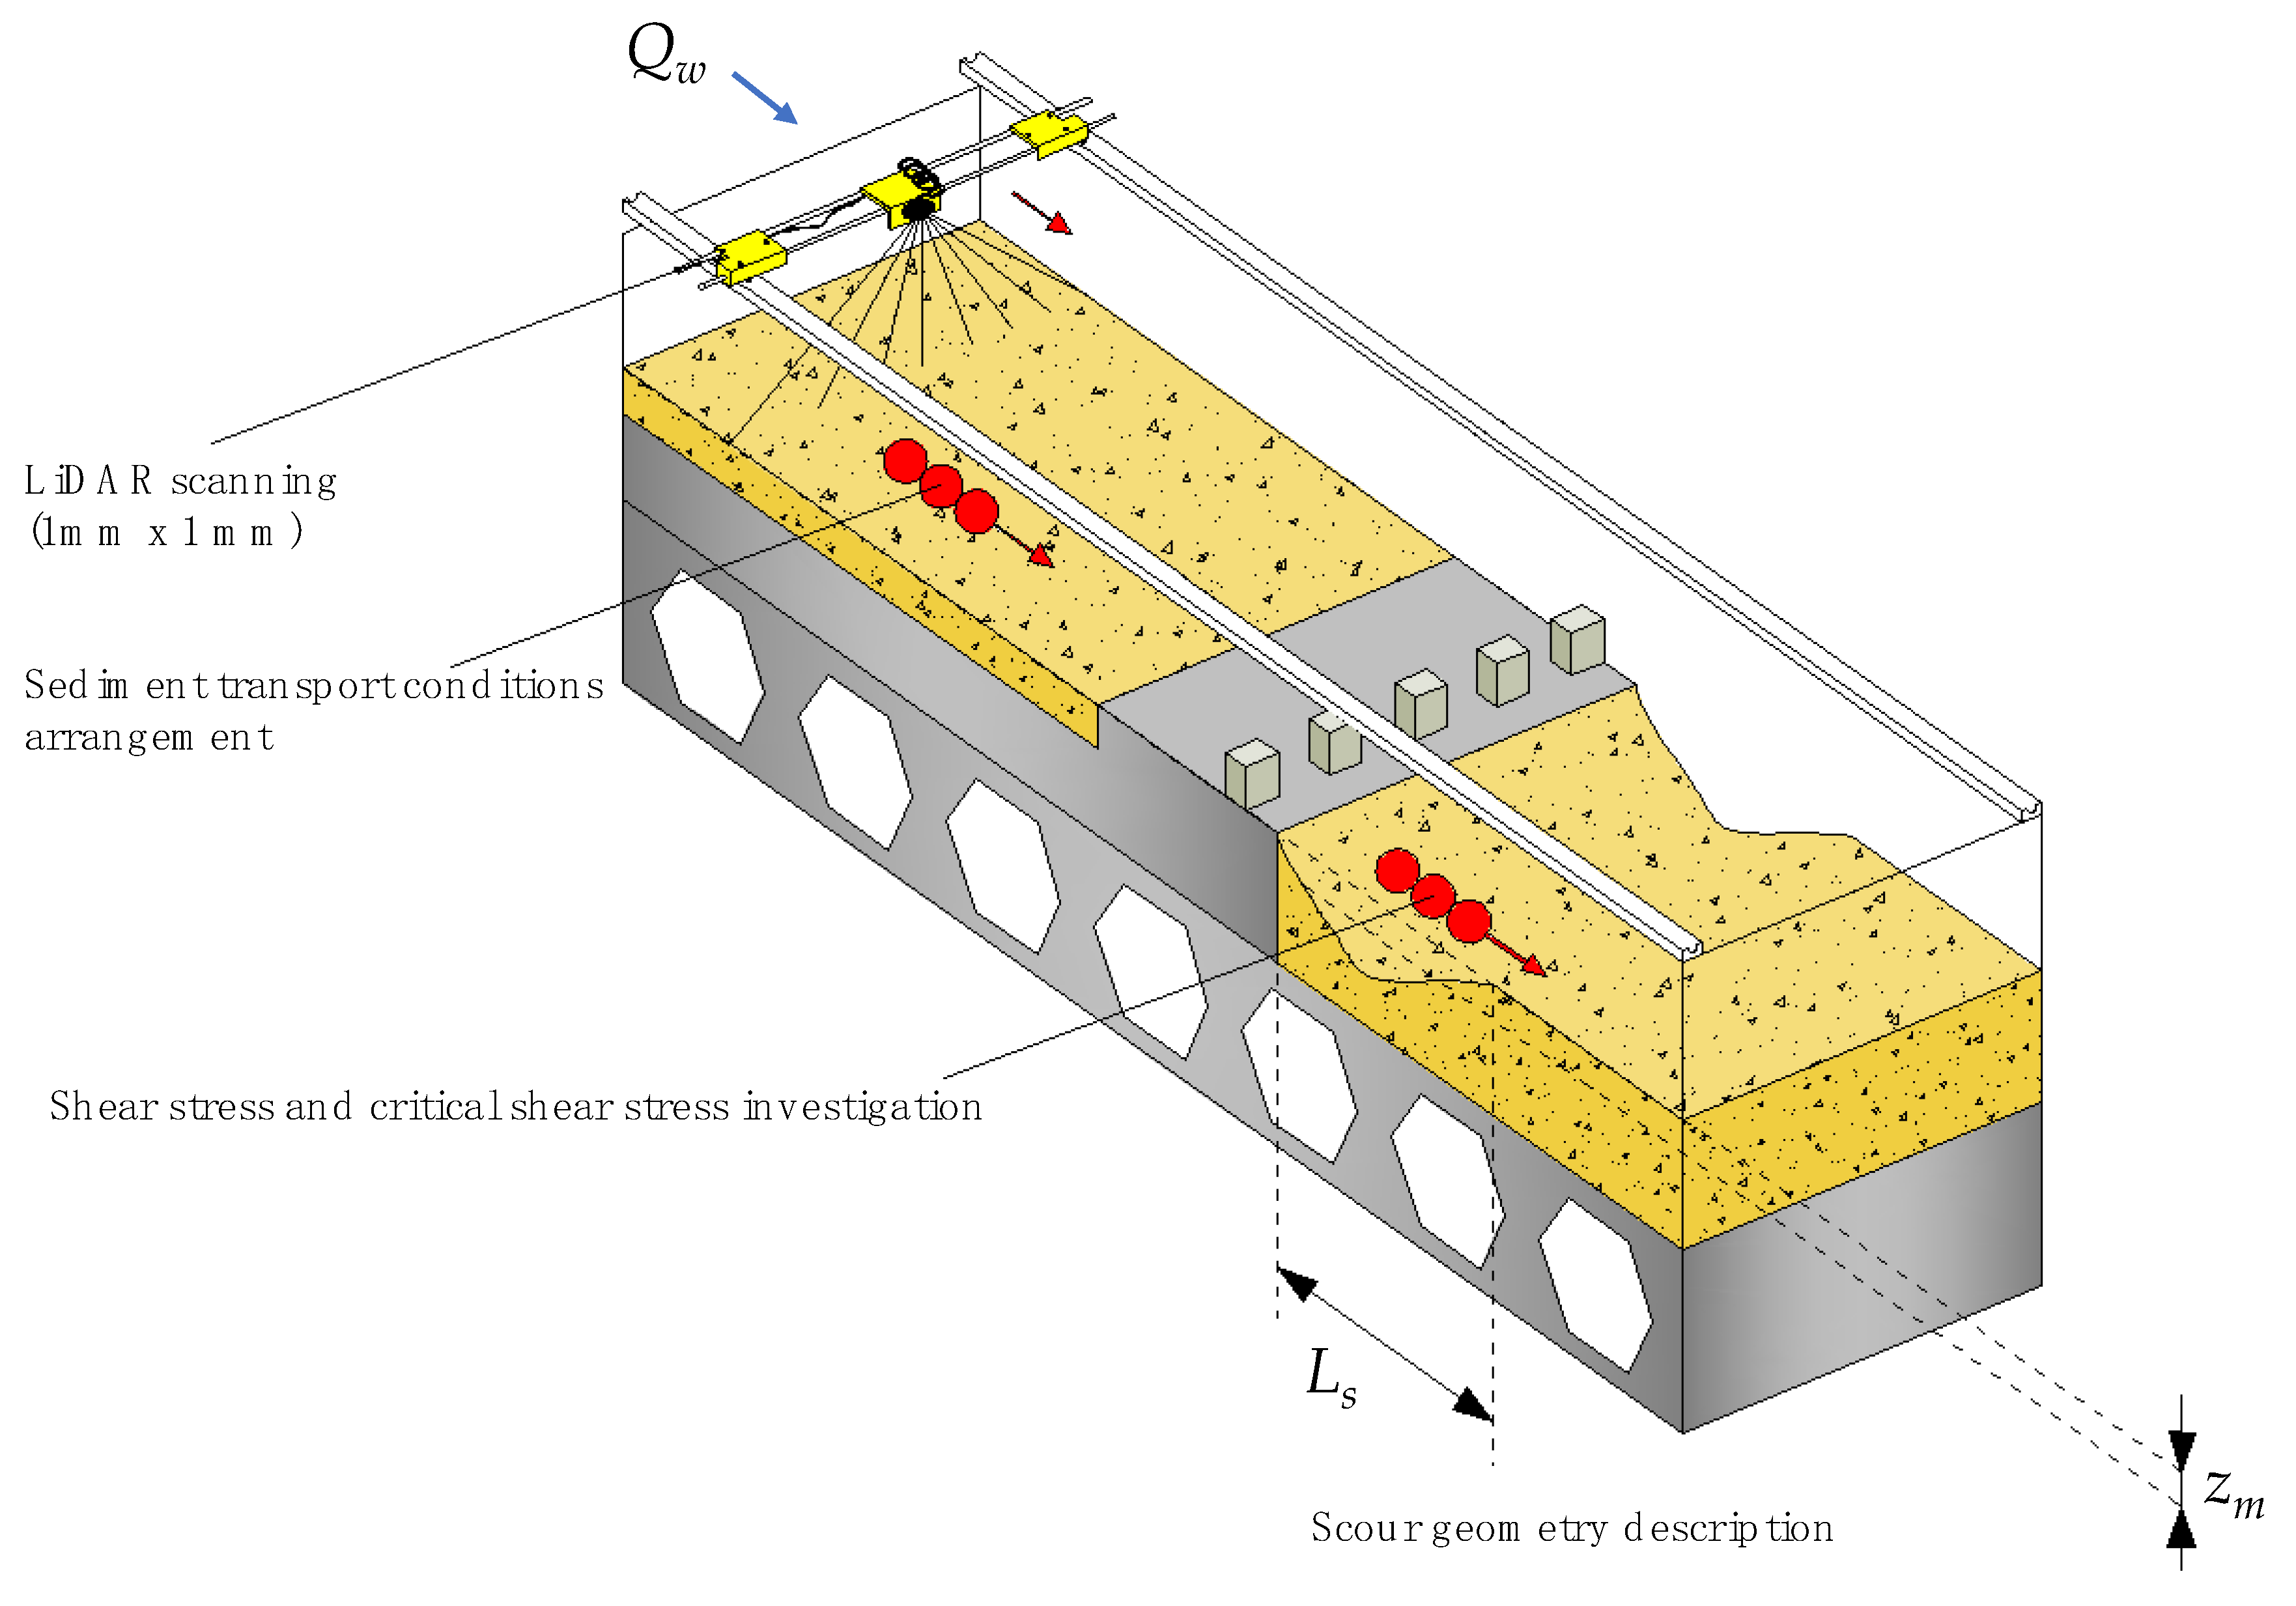
LiDAR (light detection and ranging), also known as laser scanning, is an active tele-detection method, which uses the electromagnetic waves sent by the emitter. The result is point cloud with coordinates (x, y, z). The applied device contains laser rangefinder, data transferring software, and automatic moving platform [36] (Figure 9 and Figure 10). The LiDAR device is set above the flume and could move in two axes with presumed step (1 mm in present experiment), triggered by stepper motors. LiDAR beam provides the information about the numeric data cloud, depicting bottom shape. The device is settled above the flume using brackets, made of biodegradable polymer printed using the 3D printer, and is designed in a manner that ensures fast development and portability. Using Raspberry Pi microcomputer allows simultaneous computations and data collection by the beam.
The device was fully automated, which was executed using a single board computer, dedicated software, and the set of stepper motors, resulting in measurement repeatability, constant accuracy on-demand, and fast execution of results. Obtained coordinates mesh was characterized by high resolution; therefore, the bottom shape was described very precisely, both in numerical form and also as a graphical tracing. Numerical clouds could be easily transformed into local scour basic geometrical scour dimensions, such as length or depth, which could be estimated (Figure 11).
In the aim of building up functional relationships between the effects of bottom measurements, downstream of the water structure, i.e., scour geometry parameters, represented by medium scour depth and scour length, and initial hydraulic conditions, downstream of the water structure, the following parameters were investigated: bed shear stress , critical shear stress (Shields parameter) , and their ratio (Figure 12).
Bed shear stress was calculated on the grounds of Hans Einstein’s hypothesis. Einstein’s [37] hypothesis assumes whole cross-section area division into fields, where flow resistance is explicitly diversified and related to various roughness of building material of bed and bank (or glass panel, in the flume). Therefore, Einstein proved that mean bed shear stress is dependent on hydraulic radius Rhb of the part of cross-section, in which stream velocity is connected with bottom flow resistance and could be calculated as:
where: —bed shear stress (Pa),—water density (kg m−3), —acceleration of gravity (m·s−2), —hydraulic radius of the part of cross-section, in which stream velocity is connected with bottom flow resistance (m); —hydraulic gradient, (-).
Dimensionless form of bed shear stress is represented by the following equation:
where: —density of bedload (kg m−3), —median grain diameter (m).
Critical shear stress is described as a function of dimensionless parameters, such as Reynolds number [38] or grain parameter [39,40].
Reynolds number could be calculated for dynamic velocity , absolute substitute roughness of sediment particles and kinematic viscosity parameter scheduled according to medium water temperature [41,42,43,44,45,46]:
In accordance with Zanke [35]:
In another approach, critical shear stress dependence on dimensionless grain parameter could be circumscribed as an exponential function [39,40]:
where a, b—exponential function coefficients, dependent on , as it follows (Table 1):
Dimensionless grain parameter could be calculated as [41]:
where —specific density of solid particles (-).
3. Results
Local scour shape forming process conditions (“clear-water” of “live-bed”) were described in three procedures:
- (1)
- Visually—on the grounds of observation of sediment motion
- (2)
- Basing on bottom shape measurements upstream the structure
- (3)
Also, scour length evolution was observed and investigated (Figure 14).
A total of 39 laboratory measurements comprised of the database to derive correlation relationships between the scour geometry properties and initial water depth ratio and computational parameters, such as bed shear stress and critical stress ratio (Appendix A: Table A1, Table A2 and Table A3, Figure 15 and Figure 16).
On the ground of gained database, the following sets of formulas were derived:
- Formulas including bed shear stress θ to critical shear stress ratio and medium scour depth zm to initial water depth h0:
- ○
- For “clear-water” conditions:
- ○
- For “live-bed” conditions:
- Formulas including bed shear stress θ to critical shear stress ratio and scour length Ls to initial water depth h0:
- ○
- For “clear-water” conditions:
- ○
- For “live-bed” conditions:
4. Discussion
A significant database of 39 experimental series, lasting averagely 8 h, was a foundation for delineating functional correlations between bed shear stress and critical shear stress ratio and geometry properties of local scours formed in alluvial bed in “clear-water” and “live-bed” conditions in various flume development cases. Structure models were selected with the aim to pile up water level upstream the structure and to obtain scouring of alluvial bed downstream.
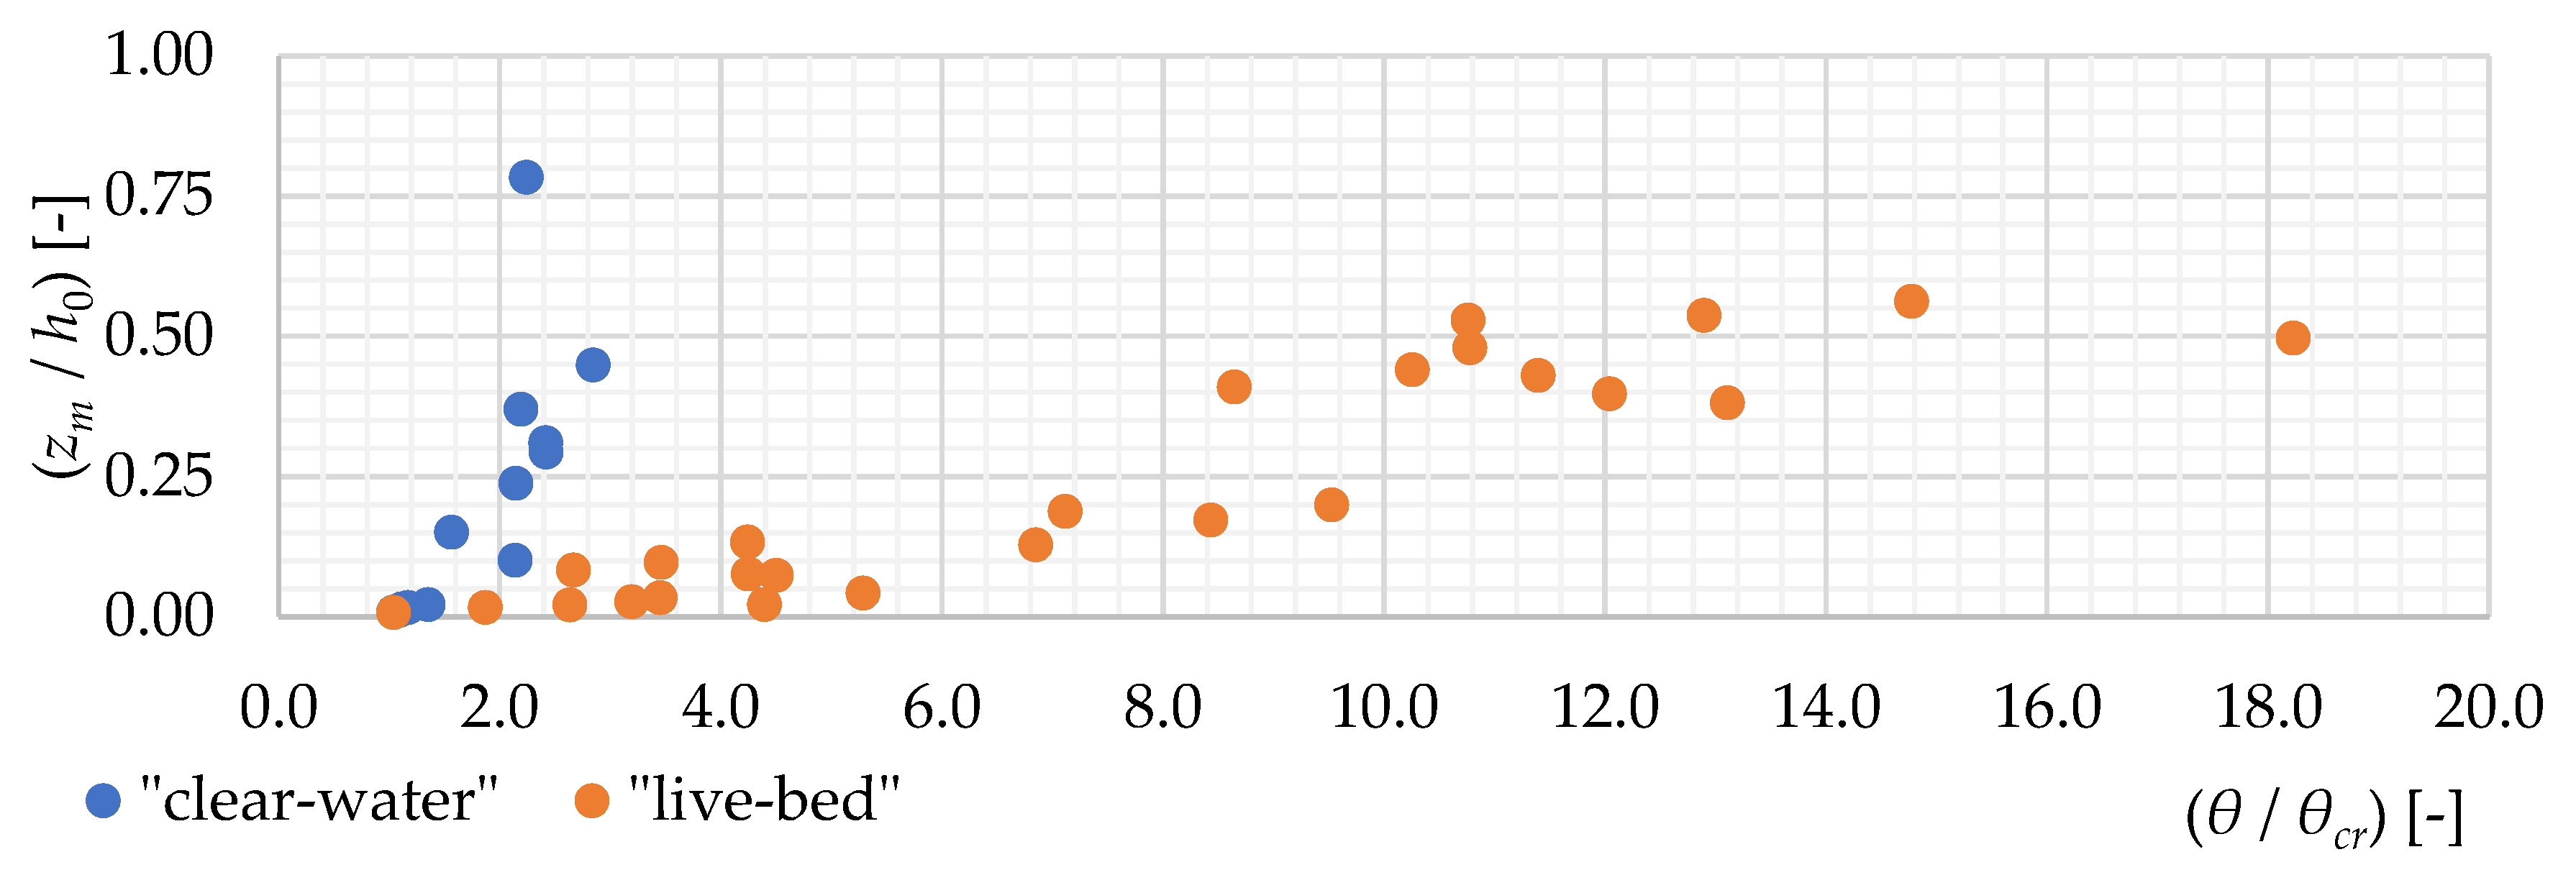
It was noticed that higher values of shear stresses were observed in the cases with pilling up structure input into flume (weirs in Variant II and III), which is strictly connected with the diminishing flow area in the structure’s region and water velocity increment at the initial cross-section of researched area. The database of simple hydraulic parameters was described using ascending exponential formulas, and the results of the present research were pointing that “clear-water” and “live-bed” conditions should be considered separately.
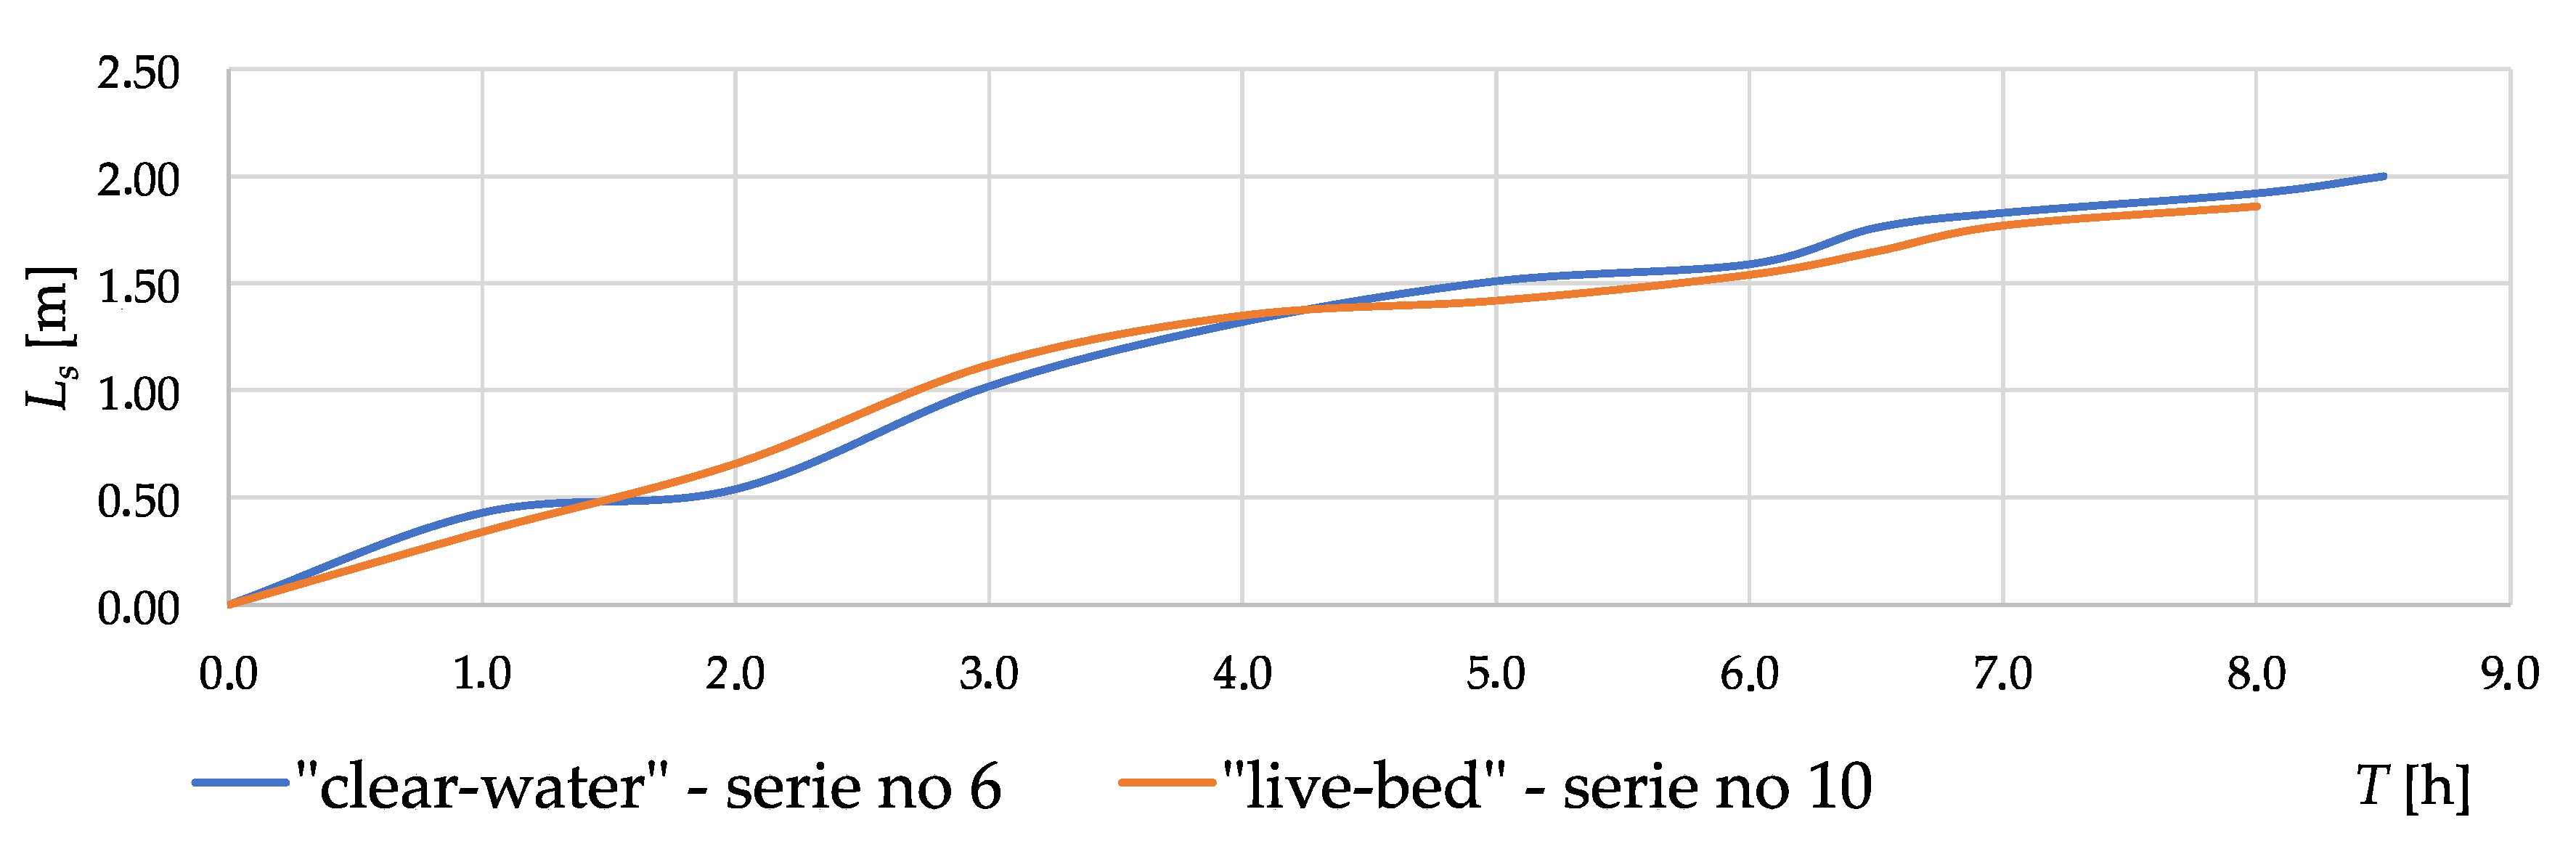
Almost in any measurement number, it was noticed that maximal scour hole depth was stabilized relatively faster than scour hole length, shown in Figure 7 and Figure 8, taking two measurement series cases as examples. The experiment confirmed the same observation as of Gaudio and Marion [22] that the length of the scour’s enlargement seems to be slower than depth evolution, and has a continuous character—stable scour depth does not mean simultaneous length stabilization. Gaudio and Marion pointed out two presumable reasons for this phenomenon: first, connected with pulsations observed during pump working, and another, connected with flow resistance, resulting from glass walls of the flume. What was significant, in the case of the present experiment, that the pump operation was ensured to work stable, so flow pulsations were eliminated; however, the common characteristic of test stands was glass panels constituting walls, affecting velocity structure.
Although formulas describe well model conditions, they have their limitations—the experiments dealt with not too high bed slope, uniform sediment, and no armoring. In addition, it does not concern single grain movement analyses. However, taking into consideration the type of verified structure, which is often used for pilling up the water for agricultural purposes, and basic hydraulic properties, on which formulas are built, it is possible to verify them in large scale, even for natural conditions, once data concerning the shape of the bottom before the erosion are available.
It has to be highlighted that a rich database, developed on three test stands, constructed in order to imitate the most frequently applied in practice crosswise water structures. Also, LiDAR technology application is meaningful, giving dense measurement mesh, allowing to map the bottom surface very accurately.
It is hardly disputed that in the light of the 3D approach to velocity description, the 2D model seems to be less accurate. Moreover, diffusion and the processes of sediment movement at different spatial and time scales have received increasing attention within the last decades. Bialik et al. [31,32] discussed the advantages of the 3D model of the saltation process of solid spherical particles on the bed of open channel flow, including the analysis of particle mobility factor, which depends on critical bed shear stress. The present paper comprised of streamwise, transverse, and vertical components of particle velocity investigation and, in this aspect, it represented the comprehensive particle trajectory description. It has been stated that the grain motion is diffusive, and the motion of bedload particles consists of three range of scales: local (single jump), intermediate (corresponding to longer times—many jumps), and global. Single-particle movement analyses and highlighting the diffusion in turbulent flows could be a base for more general studies, as, for example, the one set out in the present paper; however, the single grain particle’s velocity spatial distribution conditions demand other measuring devices that were applied in the present approach.
5. Conclusions
In the scope of mutual influence of medium scour depth and initial water depth ratio and shields parameter to critical shear stress, high correlation coefficients were attained, indicating very good in “live-bed” and good in ”clear water” functional correlations.
Also, the mutual influence of the scour’s total length and initial water depth ratio and shields parameter to critical shear stress demonstrated high correlation coefficient; however, it must be highlighted that scour hole length measured with the sound probe was denoted with relatively low accuracy (cross-sections in even 20 cm’ distances). However, the course of the evolution of hole length over time does not indicate certain completion of shape formation.
In conclusion, delineated functional relationships between geometrical scour hole parameters and shear stress served well to describe local scour formation on described test stands and could be applied both in “clear-water” and “live-bed” conditions. Although correlations were proved and irrefragable in researched cases, the general form of functions could be presented not only as an exponential equation. The initial approach of computations demonstrated that high correlation coefficients were computed for linear formulas likewise, despite the best data match provided by the exponential equation form.
Author Contributions
Conceptualization, M.K. and Z.P.; methodology, M.K. and Z.P.; software, M.K.; validation, M.K. and Z.P.; formal analysis, M.K. and Z.P.; writing—original draft preparation, M.K.; writing—review and editing, M.K. and Z.P.; visualization, M.K.; supervision, Z.P.
Funding
This research received no external funding.
Acknowledgments
This research was supported by the Department of Hydrotechnics and Technology and the Department of Water Engineering and Applied Geology, Warsaw University of Life Sciences, WULS, Poland. The applied device contained laser rangefinder, data transferring software, and the automatic moving platform and was engineered in 2016 by Marta Kiraga and Matvey Razumnik within the university grant for young researchers “The influence of small hydraulic structures on sediment transport condition”.
Conflicts of Interest
The authors declare no conflict of interest.
Appendix A

Table A1.
Summary table of calculation results—variant I of flume development; no water structure; “clear-water” conditions.
Table A1.
Summary table of calculation results—variant I of flume development; no water structure; “clear-water” conditions.
| No. | Qw | h0 | zm/h0 | Ls/h0 | |||||||
|---|---|---|---|---|---|---|---|---|---|---|---|
| (m3 s−1) | (m) | (-) | (-) | (-) | (-) | (-) | (-) | (-) | (-) | (-) | |
| 1 | 0.020 | 0.10 | 0.016 | 2.0 | 0.038 | 21.8 | 21.79 | 0.0311 | 0.0318 | 0.0348 | 1.17 |
| 2 | 0.025 | 0.10 | 0.150 | 22.0 | 0.051 | 25.1 | 21.68 | 0.0310 | 0.0317 | 0.0354 | 1.56 |
| 3 | 0.025 | 0.12 | 0.013 | 2.2 | 0.036 | 20.9 | 21.55 | 0.0310 | 0.0317 | 0.0346 | 1.12 |
| 4 | 0.030 | 0.10 | 0.293 | 23.5 | 0.080 | 31.4 | 21.68 | 0.0310 | 0.0317 | 0.0362 | 2.42 |
| 5 | 0.030 | 0.15 | 0.011 | 1.3 | 0.035 | 20.9 | 21.75 | 0.0311 | 0.0318 | 0.0346 | 1.09 |
| 6 | 0.035 | 0.12 | 0.310 | 18.3 | 0.080 | 31.2 | 21.62 | 0.0310 | 0.0317 | 0.0362 | 2.42 |
| 7 | 0.035 | 0.15 | 0.021 | 6.7 | 0.044 | 23.0 | 21.49 | 0.0310 | 0.0316 | 0.0350 | 1.36 |
| 8 | 0.040 | 0.10 | 0.783 | 23.5 | 0.074 | 29.8 | 21.51 | 0.0310 | 0.0317 | 0.0360 | 2.24 |
| 9 | 0.040 | 0.12 | 0.369 | 19.1 | 0.072 | 30.4 | 21.92 | 0.0311 | 0.0318 | 0.0361 | 2.20 |
| 10 | 0.040 | 0.15 | 0.100 | 3.7 | 0.071 | 29.8 | 21.85 | 0.0311 | 0.0318 | 0.0360 | 2.14 |
| 11 | 0.040 | 0.20 | 0.008 | 2.2 | 0.034 | 20.5 | 21.79 | 0.0311 | 0.0318 | 0.0346 | 1.04 |
| 12 | 0.043 | 0.12 | 0.448 | 18.3 | 0.094 | 34.1 | 21.72 | 0.0310 | 0.0317 | 0.0365 | 2.85 |
| 13 | 0.045 | 0.15 | 0.237 | 15.4 | 0.071 | 29.1 | 21.51 | 0.0310 | 0.0317 | 0.0360 | 2.15 |
Where: Qw—water discharge; h0—initial water depth; Tc—total time of experimental series; zm—medium scour depth; Ls—local scour length;—dimensionless form of bed shear stress; —dynamic velocity; —Reynolds number calculated for dynamic velocity; —grain parameter; —critical shear stress calculated using Van Rijn formula (Table 1); —critical shear stress calculated using Wu and Wang formula (Table 1); —critical shear stress calculated using Zanke (1982) formula; —medium critical shear stress.
Table A2.
Summary table of calculation results—variant II of flume development; stone weir; “live-bed” conditions.
Table A2.
Summary table of calculation results—variant II of flume development; stone weir; “live-bed” conditions.
| No. | Qw | h0 | zm/h0 | Ls/h0 | |||||||
|---|---|---|---|---|---|---|---|---|---|---|---|
| (m3 s−1) | (m) | (-) | (-) | (-) | (-) | (-) | (-) | (-) | (-) | (-) | |
| 1 | 0.020 | 0.10 | 0.016 | 7.8 | 0.061 | 27.6 | 21.75 | 0.0311 | 0.0318 | 0.0358 | 1.87 |
| 2 | 0.025 | 0.10 | 0.076 | 16.0 | 0.141 | 41.5 | 21.62 | 0.0310 | 0.0317 | 0.0371 | 4.25 |
| 3 | 0.025 | 0.12 | 0.021 | 10.0 | 0.087 | 32.3 | 21.49 | 0.0310 | 0.0316 | 0.0363 | 2.64 |
| 4 | 0.030 | 0.10 | 0.133 | 18.0 | 0.141 | 42.0 | 21.79 | 0.0311 | 0.0318 | 0.0371 | 4.24 |
| 5 | 0.030 | 0.15 | 0.083 | 11.3 | 0.088 | 33.0 | 21.72 | 0.0310 | 0.0317 | 0.0364 | 2.67 |
| 6 | 0.035 | 0.12 | 0.409 | 15.0 | 0.290 | 59.0 | 21.51 | 0.0310 | 0.0317 | 0.0379 | 8.65 |
| 7 | 0.035 | 0.15 | 0.027 | 9.3 | 0.106 | 35.9 | 21.62 | 0.0310 | 0.0317 | 0.0366 | 3.20 |
| 8 | 0.040 | 0.10 | 0.440 | 31.0 | 0.344 | 64.2 | 21.49 | 0.0310 | 0.0316 | 0.0380 | 10.3 |
| 9 | 0.040 | 0.12 | 0.537 | 22.5 | 0.435 | 73.7 | 21.79 | 0.0311 | 0.0318 | 0.0383 | 12.9 |
| 10 | 0.040 | 0.15 | 0.073 | 13.3 | 0.150 | 43.0 | 21.68 | 0.0310 | 0.0317 | 0.0371 | 4.50 |
| 11 | 0.040 | 0.20 | 0.021 | 5.0 | 0.146 | 42.8 | 21.79 | 0.0311 | 0.0318 | 0.0371 | 4.40 |
| 12 | 0.043 | 0.12 | 0.528 | 25.0 | 0.362 | 67.3 | 21.79 | 0.0311 | 0.0318 | 0.0381 | 10.8 |
| 13 | 0.045 | 0.15 | 0.042 | 12.7 | 0.176 | 46.6 | 21.68 | 0.0310 | 0.0317 | 0.0373 | 5.29 |
Table A3.
Summary table of calculation results—variant III of flume development; stone weir with reinforcement; “live-bed” conditions.
Table A3.
Summary table of calculation results—variant III of flume development; stone weir with reinforcement; “live-bed” conditions.
| No | Qw | h0 | zm/h0 | Ls/h0 | |||||||
|---|---|---|---|---|---|---|---|---|---|---|---|
| (m3 s−1) | (m) | (-) | (-) | (-) | (-) | (-) | (-) | (-) | (-) | (-) | |
| 1 | 0.020 | 0.10 | 0.199 | 13.5 | 0.320 | 62.0 | 21.51 | 0.0310 | 0.0317 | 0.0380 | 9.53 |
| 2 | 0.025 | 0.10 | 0.397 | 26.0 | 0.406 | 71.2 | 21.79 | 0.0311 | 0.0318 | 0.0382 | 12.0 |
| 3 | 0.025 | 0.12 | 0.172 | 9.3 | 0.283 | 58.3 | 21.51 | 0.0310 | 0.0317 | 0.0378 | 8.44 |
| 4 | 0.030 | 0.10 | 0.479 | 23.1 | 0.363 | 67.1 | 21.75 | 0.0311 | 0.0318 | 0.0381 | 10.8 |
| 5 | 0.030 | 0.15 | 0.033 | 3.5 | 0.115 | 37.9 | 21.79 | 0.0311 | 0.0318 | 0.0368 | 3.45 |
| 6 | 0.035 | 0.12 | 0.381 | 20.3 | 0.442 | 74.3 | 21.79 | 0.0311 | 0.0318 | 0.0383 | 13.1 |
| 7 | 0.035 | 0.15 | 0.128 | 11.2 | 0.229 | 53.3 | 21.72 | 0.0310 | 0.0317 | 0.0377 | 6.85 |
| 8 | 0.040 | 0.10 | 0.562 | 20.3 | 0.498 | 77.9 | 21.62 | 0.0310 | 0.0317 | 0.0384 | 14.8 |
| 9 | 0.040 | 0.12 | 0.430 | 19.1 | 0.384 | 69.6 | 21.85 | 0.0311 | 0.0318 | 0.0382 | 11.4 |
| 10 | 0.040 | 0.15 | 0.187 | 12.4 | 0.238 | 53.9 | 21.62 | 0.0310 | 0.0317 | 0.0377 | 7.12 |
| 11 | 0.040 | 0.20 | 0.007 | 1.4 | 0.034 | 20.5 | 21.79 | 0.0311 | 0.0318 | 0.0346 | 1.04 |
| 12 | 0.043 | 0.12 | 0.497 | 19.8 | 0.616 | 87.5 | 21.75 | 0.0311 | 0.0318 | 0.0385 | 18.2 |
| 13 | 0.045 | 0.15 | 0.096 | 12.0 | 0.115 | 37.2 | 21.55 | 0.0310 | 0.0317 | 0.0367 | 3.46 |
References
- Chow, V.T. Open-Channel Hydraulics; McGraw Hill Book Company Inc.: Tokyo, Japan, 1959; pp. 10–32. [Google Scholar]
- Richardson, E.V.; Richardson, J.R. Bridge Scour; Interagency Sedimentation Committee Bridge Scour Symposium, U.S. Department of Transportation: Washington, DC, USA, 1989. [Google Scholar]
- Copeland, R.R. Yellow Creek Sedimentation Study: Numerical Model Investigation; US Army Corps of Engineers: Vicksburg, MS, USA, 1993; pp. 5–10. [Google Scholar]
- Yang, Q. Numerical Investigations of Scale Effects on Local Scour Around A Bridge Pier. Master’s Thesis, Florida State University, Tallahassee, FL, USA, 2005. [Google Scholar]
- Raudkivi, A.J. Loose Boundary Hydraulics; CRC Press: Boca Raton, FL, USA, 1998; pp. 103–104. [Google Scholar]
- Błażejewski, R.; Pilarczyk, K.W.; Przedwojski, B. River Training Techniques: Fundamentals, Design and Applications; A.A. Balkema: Rotterdam, The Netherlands, 1995; pp. 103–104. [Google Scholar]
- Barbhuiya, A.K.; Dey, S. Local scour at abutments: A review. Sadhana 2004, 29, 449–476. [Google Scholar] [CrossRef]
- Brandimarte, L.; Paron, P.; Di Baldasarre, G. Bridge pier scour: A review of processes, measurements and estimates. Environ. Eng. Manag. J. 2012, 11, 975–989. [Google Scholar] [CrossRef]
- Chabert, J.; Engeldinger, P. Etude des Affouillements Autour des Piles des Ponts; Laboratoire d’Hydraulique: Chatou, France, 1956. [Google Scholar]
- Graf, W.H. Fluvial Hydraulics: Flow and Transport Processes in Channels of Simple Geometry; John Wiley & Sons, Inc: Hoboken, NJ, USA, 1998; pp. 351–371. [Google Scholar]
- Clarke, F.W. The Action of Submerged Jets on Moveable Material. Master’s Thesis, Imperial College, University of London, London, UK, 1962. [Google Scholar]
- Petts, G.E. Channel response to flow regulation: The case of the river Dervent, Derbyshire. In River Channel Changes; John Wiley & Sons, Inc: Hoboken, NJ, USA, 1977; pp. 145–164. [Google Scholar]
- Bajkowski, S.; Siwicki, P.; Urbański, J. Utilization of laboratory investigations of local scour below water structures to estimate their safety. Acta Sci. Pol. 2002, 1–2, 41–51. [Google Scholar]
- Lane, E.W. The importance of fluvial morphology in hydraulic engineering. In Proceedings of the American Society of Civil Engineers, New York, NY, USA, July 1955; pp. 1–17. Available online: https://semspub.epa.gov/work/01/554355.pdf (accessed on 13 June 2019).
- Breusers, H.C.; Raudkivi, A.J. Scouring: Hydraulic Structures Design Manual Series, 1st ed.; CRC Press: Boca Raton, FL, USA, 1991; Volume 2, p. 126. [Google Scholar]
- Dąbkowski, S.L.; Siwicki, P. Analysis of depth of scour on the dam models. Przegląd Nauk. Wydziału Inżynierii i Kształtowania Środowiska 2000, 19, 39–50. (In Polish) [Google Scholar]
- Guan, D.; Melville, B.; Friedrich, H. Local scour at submerged weirs in sand-bed channels. J. Hydraul. Res. 2016, 52, 172–184. [Google Scholar] [CrossRef]
- Błażejewski, R. Prognozowanie rozmyć miejscowych gruntów niespoistych poniżej budowli upustowych. Rocz. AR Rozpr. Nauk. 1989, 190, 64–69. (In Polish) [Google Scholar]
- Ibrahim, A.; Karim, A.; Günal, M. Simulation of local scour development downstream of broad-crested weir with inclined apron. Eur. J. Sci. Technol. 2017, 57–61. [Google Scholar]
- Gaudio, R.; Marion, A.; Bovolin, V. Morphological effects of bed sills in degrading rivers. J. Hydraul. Res. 2000, 38, 89–96. [Google Scholar] [CrossRef]
- Lenzi, M.A.; Marion, A.; Comiti, F.; Gaudio, R. Local scouring in low and high gradient streams at bed sills. J. Hydraul. Res. 2002, 40, 731–739. [Google Scholar] [CrossRef]
- Gaudio, R.; Marion, A. Time evolution of scouring downstream of bed sills. J. Hydraul. Res. 2003, 41, 271–284. [Google Scholar] [CrossRef]
- Ben Meftah, M.; Mossa, M. Scour holes downstream of bed sills in low-gradient channels. J. Hydraul. Res. 2006, 4, 497–509. [Google Scholar] [CrossRef]
- Dąbkowski, S.L.; Siwicki, P.; Urbański, J. Local scour on dam models with outflow over and above gate. Acta Sci. Pol. Archit. 2007, 6, 3–14. (In Polish) [Google Scholar]
- Urbański, J. Influence of turbulence of flow on sizes local scour on weir model. Acta Sci. Pol. Archit. 2008, 7, 3–12. (In Polish) [Google Scholar]
- Prendergast, L.J.; Gavin, K. A review of bridge scour monitoring techniques. J. Rock Mech. Geotech. Eng. 2014, 6, 138–149. [Google Scholar] [CrossRef]
- Matoušek, V. Flow roughness evaluation of mobile-bed streams. Infrastruct. Ecol. Rural Areas 2010, 11, 115–126. [Google Scholar]
- Meyer, Z. Bed roughness influence on sediment transport in Lower Odra River. In Proceedings of the 5th International Conference Transport and Sedimentation of Solid Particles, Wroclaw, Poland, September 2011; pp. 149–156. Available online: www.geotechnika.zut.edu.pl/o_nas/publikacje/pub_zm/Bed%20roughness%2011.pdf (accessed on 14 June 2019).
- Hoffmans, G.J.C.M.; Verheij, H.J. Scour Manual, 1st ed.; CRC Press: Boca Raton, FL, USA, 1991; p. 15. [Google Scholar]
- Local Scour Near Structures. By Leo, C. van Rijn. Available online: www.leovanrijn-sediment.com (accessed on 16 September 2019).
- Bialik, R.J.; Nikora, V.I.; Rowiński, P.M. 3D Langrangian modelling of saltating particles diffusion in turbulent water flow. Acta Geophys. 2012, 60, 1639–1660. [Google Scholar] [CrossRef]
- Bialik, R.J.; Nikora, V.I.; Karpiński, M.; Rowiński, P.M. Diffusion of bedload particles in open-channel flows: Distribution of travel times and second-order statistics of particle trajectories. Environ. Fluid Mech. 2015, 15, 1281–1292. [Google Scholar] [CrossRef]
- Campagnol, J.; Radice, A.; Ballio, F.; Nikora, V. Particle motion and diffusion at weak bed load: Accounting for unsteadiness effects of entrainment and disentrainment. J. Hydraul. Res. 2013, 53, 633–648. [Google Scholar] [CrossRef]
- Dust, D.; Wohl, E. Conceptual model for complex river responses using an expanded Lane’s relation. Geomorphology 2012, 139–140, 109–121. [Google Scholar] [CrossRef]
- Huang, H.Q.; Liu, X.; Nanson, G. Commentary on a Conceptual model for complex river responses using an expanded Lane’s diagram by David Dust and Ellen Wohl. Geomorphology 2014, 209, 140–142. [Google Scholar] [CrossRef]
- Kiraga, M.; Razumnik, M.; Popek, Z.; Chmielewski, L. Applying laser scanning technology to studying alluvial flume-bed topography in laboratory conditions. Acta Sci. Pol. Form. Circumiectus 2018, 17, 69–84. [Google Scholar] [CrossRef]
- Einstein, H.A. The bed load function for sediment transportation in open channels. Tech. Bull. 1950, 1026, 1–74. [Google Scholar]
- Zanke, U. Grundlagen der Sedimentbewegung; Springer: Berlin, Germany, 1982; pp. 104–112. [Google Scholar]
- Van Rijn, L.C. Principles of Sediment Transport in Rivers, Estuaries and Castal Seas; Aqua publications: Amsterdam, The Netherlands, 1993; pp. 10.1–10.29. [Google Scholar]
- Wu, W.; Wang, S. Movable bed roughness in alluvial rivers. J. Hydraul. Eng. 1999, 125, 1309–1312. [Google Scholar] [CrossRef]
- Shields, A. Anwendung der Aehnlichkeitsmechanik und der Turbulenzforschung auf die Geschiebebewegung; Mitteilungen der Preussischen Versuchsanstalt fur Wasserbau und Schiffbau: Berlin, Germany, 1936. [Google Scholar]
- Kuhnle, R. Incipient motion of sand-gravel sediment mixtures. J. Hydraul. Eng. 1993, 119, 1400–1415. [Google Scholar] [CrossRef]
- Buffington, J.M.; Montgomery, D.R. A systematic analysis of eight decades of incipient motion studies, with special reference to gravel-bedded rivers. Water Resour. Res. 1997, 33, 1993–2029. [Google Scholar] [CrossRef] [Green Version]
- Popek, Z.; Marisch, K. Critical shear stress in open channel with flat sandy bottom. Acta Sci. Pol. Archit. 2004, 3, 37–53. (In Polish) [Google Scholar]
- Pilotti, M.; Menduni, G. Beginning of the sediment transport of incoherent grains in shallow shear flows. J. Hydraul. Res. 2011, 39, 115–124. [Google Scholar] [CrossRef]
- Miedema, S.A. Constructing the Shields Curve PART B: Sensitivity analysis, exposure & protrusion levels, settling velocity, shear stress & friction velocity, erosion flux and laminar main flow. J. Dredg. Eng. 2012, 12, 50–92. [Google Scholar]
Figure 1.
Sediment transport in “clear-water” (a) and “live-bed” (b) conditions, where Qw—water discharge, Qr—sediment transport intensity.
Figure 1.
Sediment transport in “clear-water” (a) and “live-bed” (b) conditions, where Qw—water discharge, Qr—sediment transport intensity.

Figure 2.
Maximal scour depth evolution in time, in “clear-water” and “live-bed” conditions, where: zmax—maximal scour depth, ΔT—time step.
Figure 2.
Maximal scour depth evolution in time, in “clear-water” and “live-bed” conditions, where: zmax—maximal scour depth, ΔT—time step.

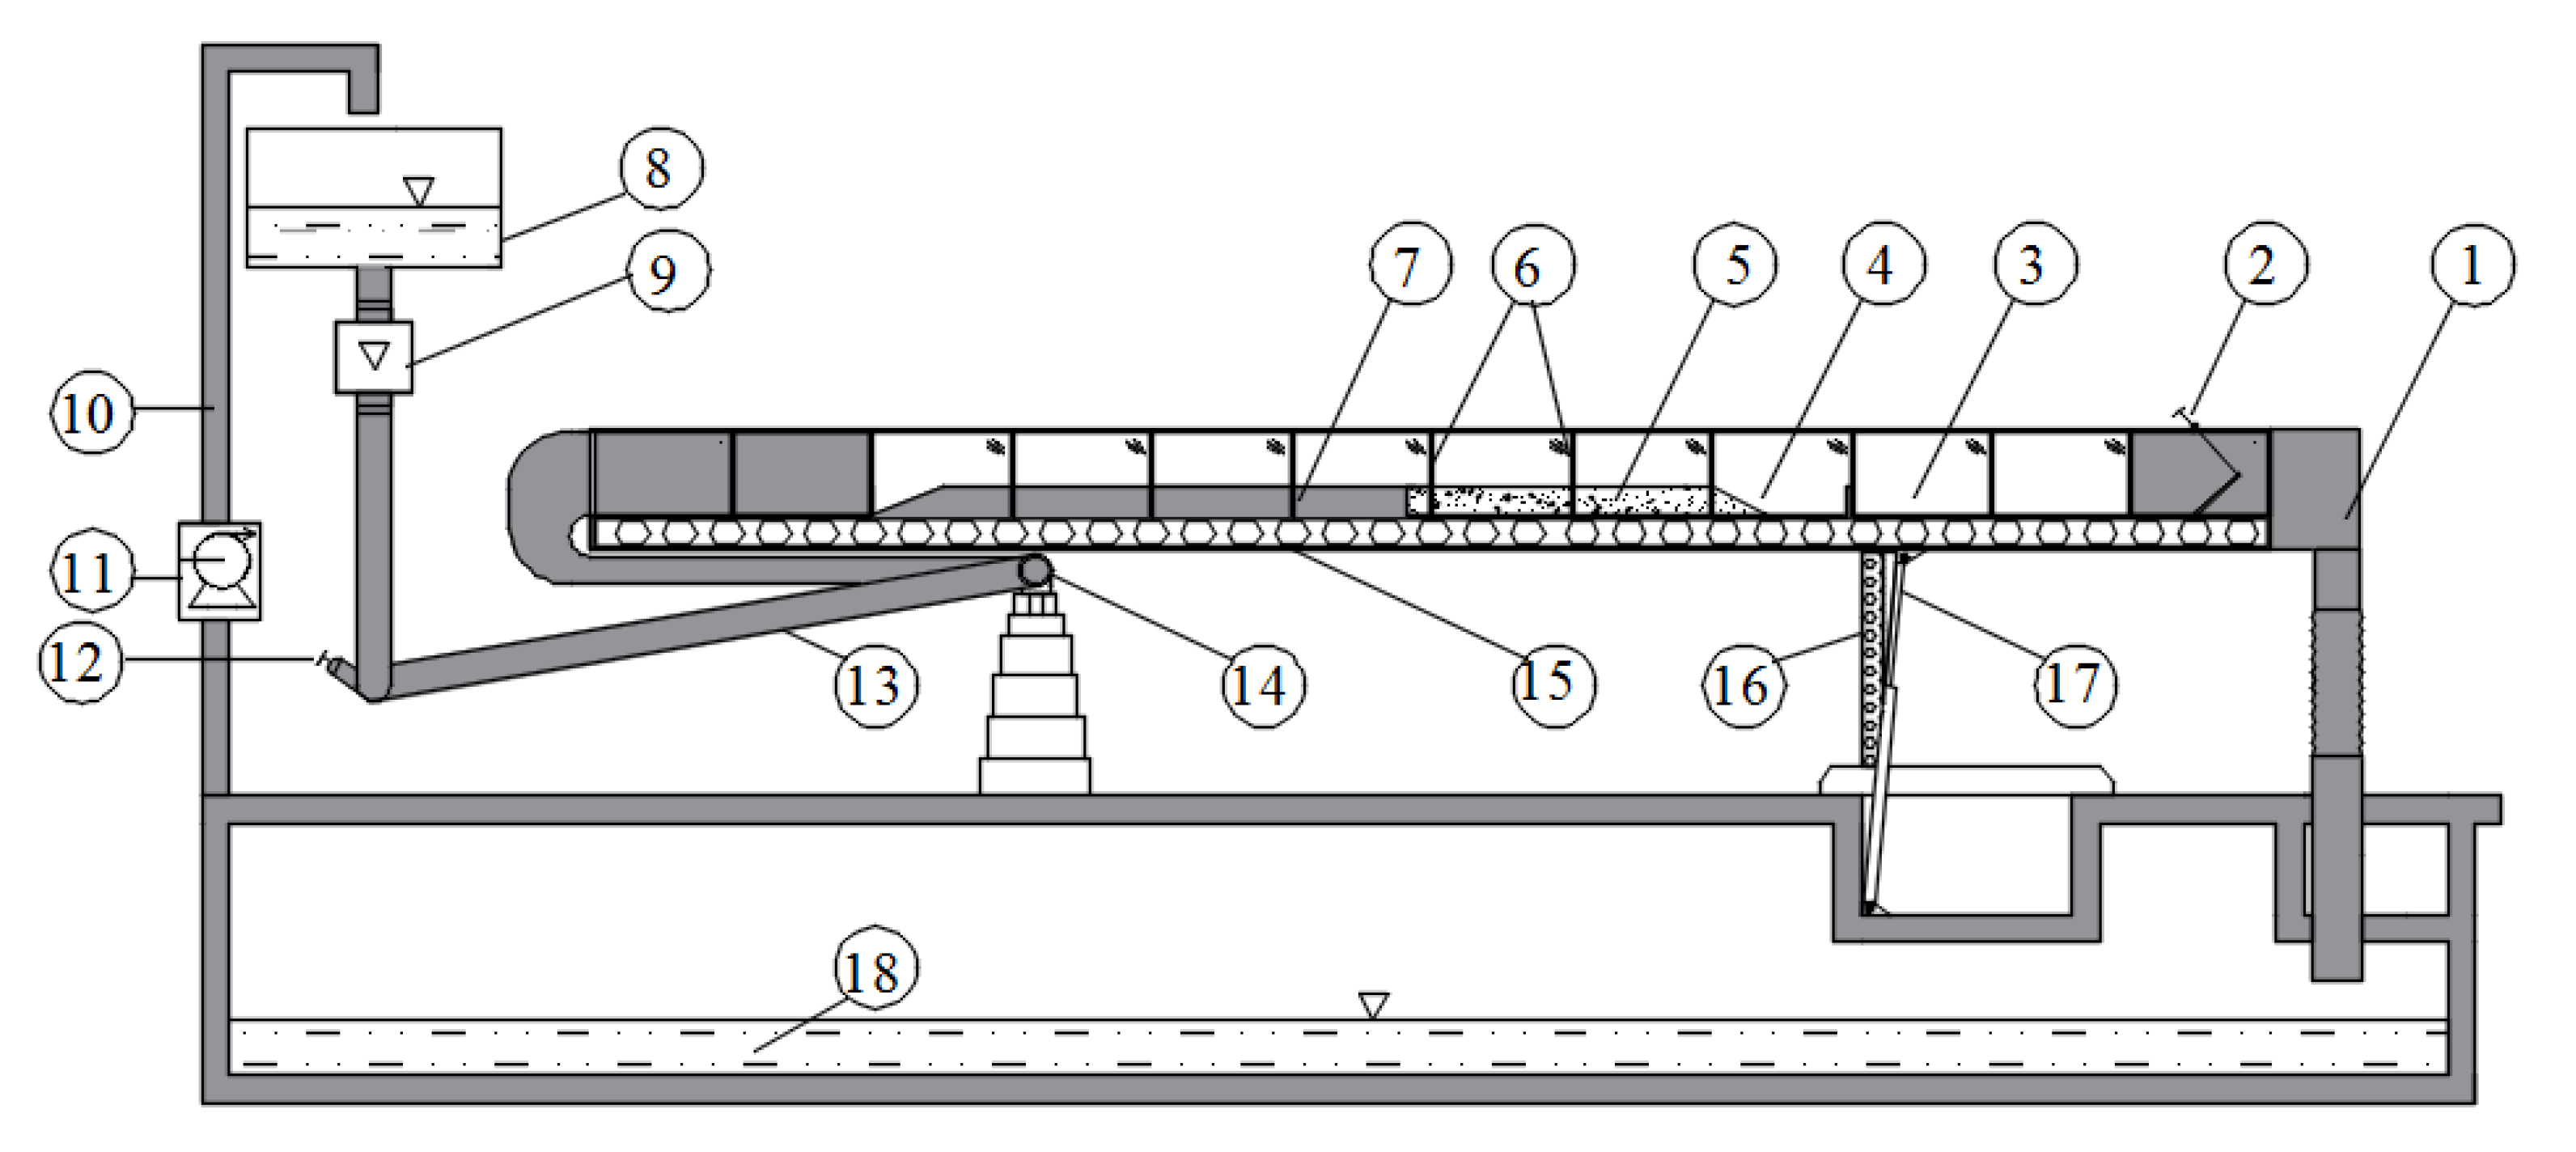
Figure 3.
Experimental channel scheme—side view. Where: 1—chute chamber; 2—the regulatory gate; 3—glass side wall; 4—collection chamber; 5—sandy bed; 6—supports for sidewalls; 7—solid bottom; 8—upper reservoir; 9—electromagnetic flowmeter; 10—a pipeline conducting water; 11— the pump; 12—the regulatory valve; 13—the feeding pipeline; 14—the support with joint; 15—the support plate of the channel; 16—the support with adjustable frame elevation; 17—the hydraulic cylinder; 18—the lower reservoir.

Figure 4.
Experimental channel scheme—side view.

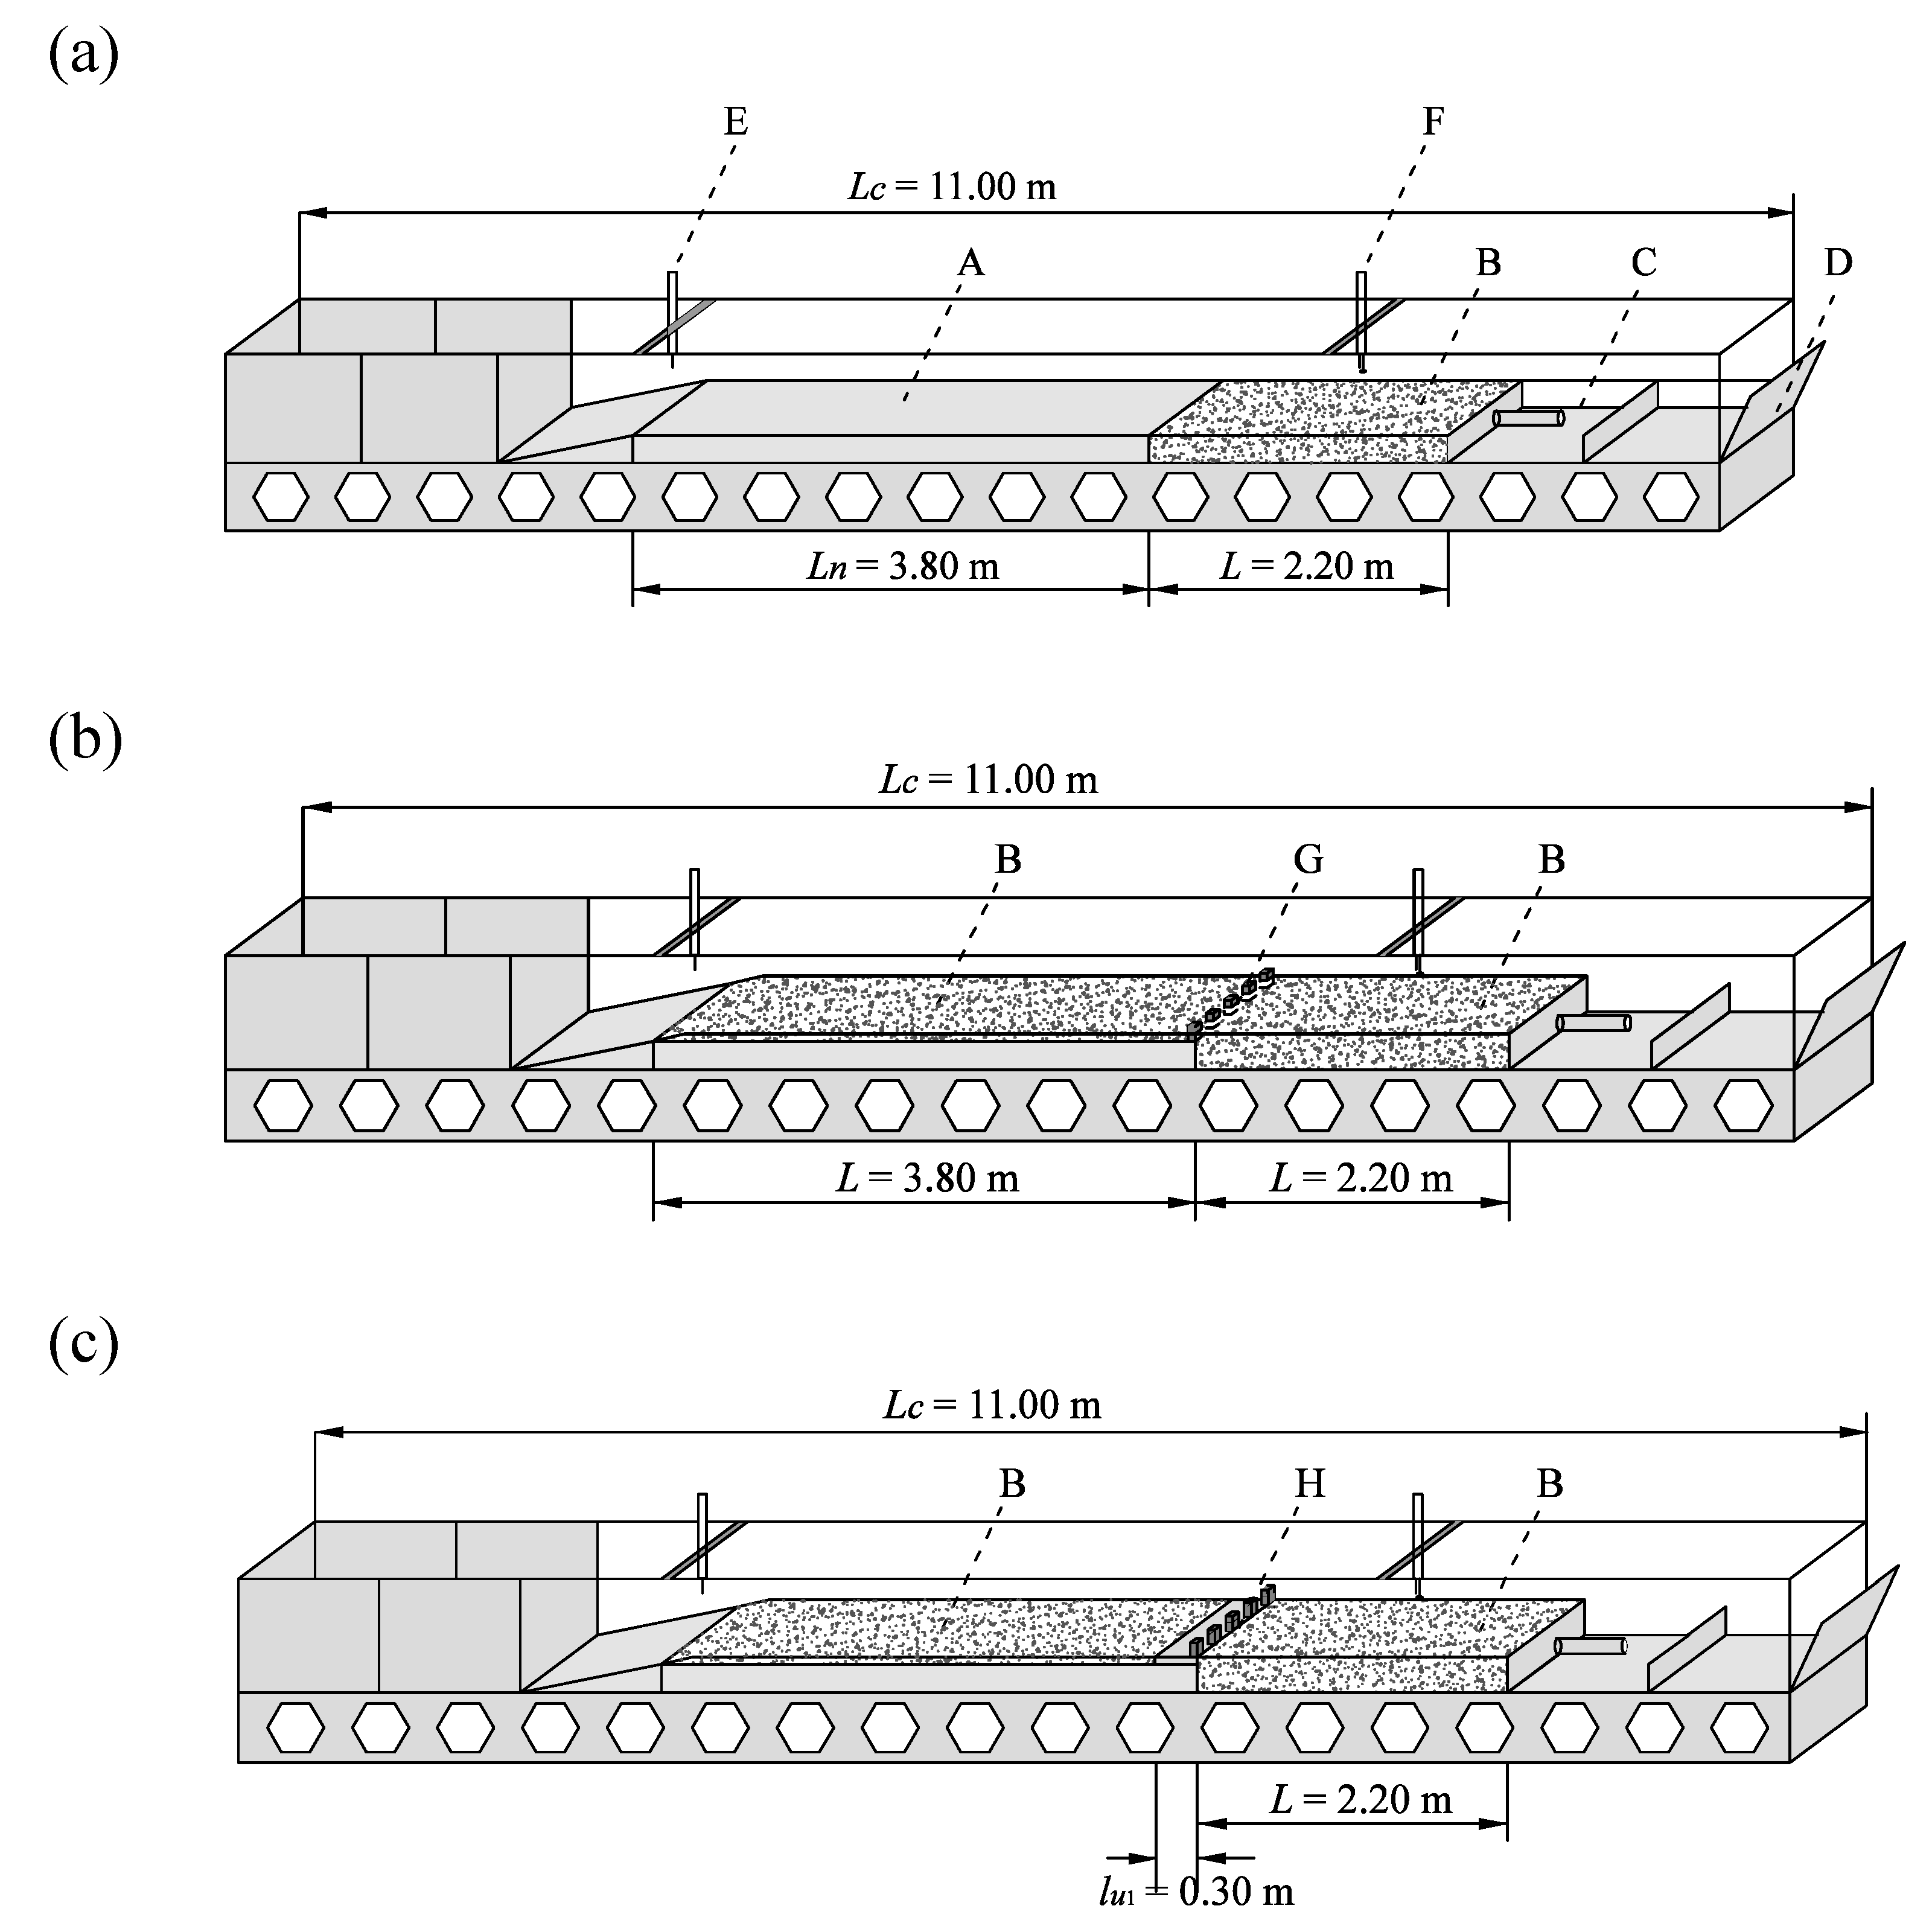
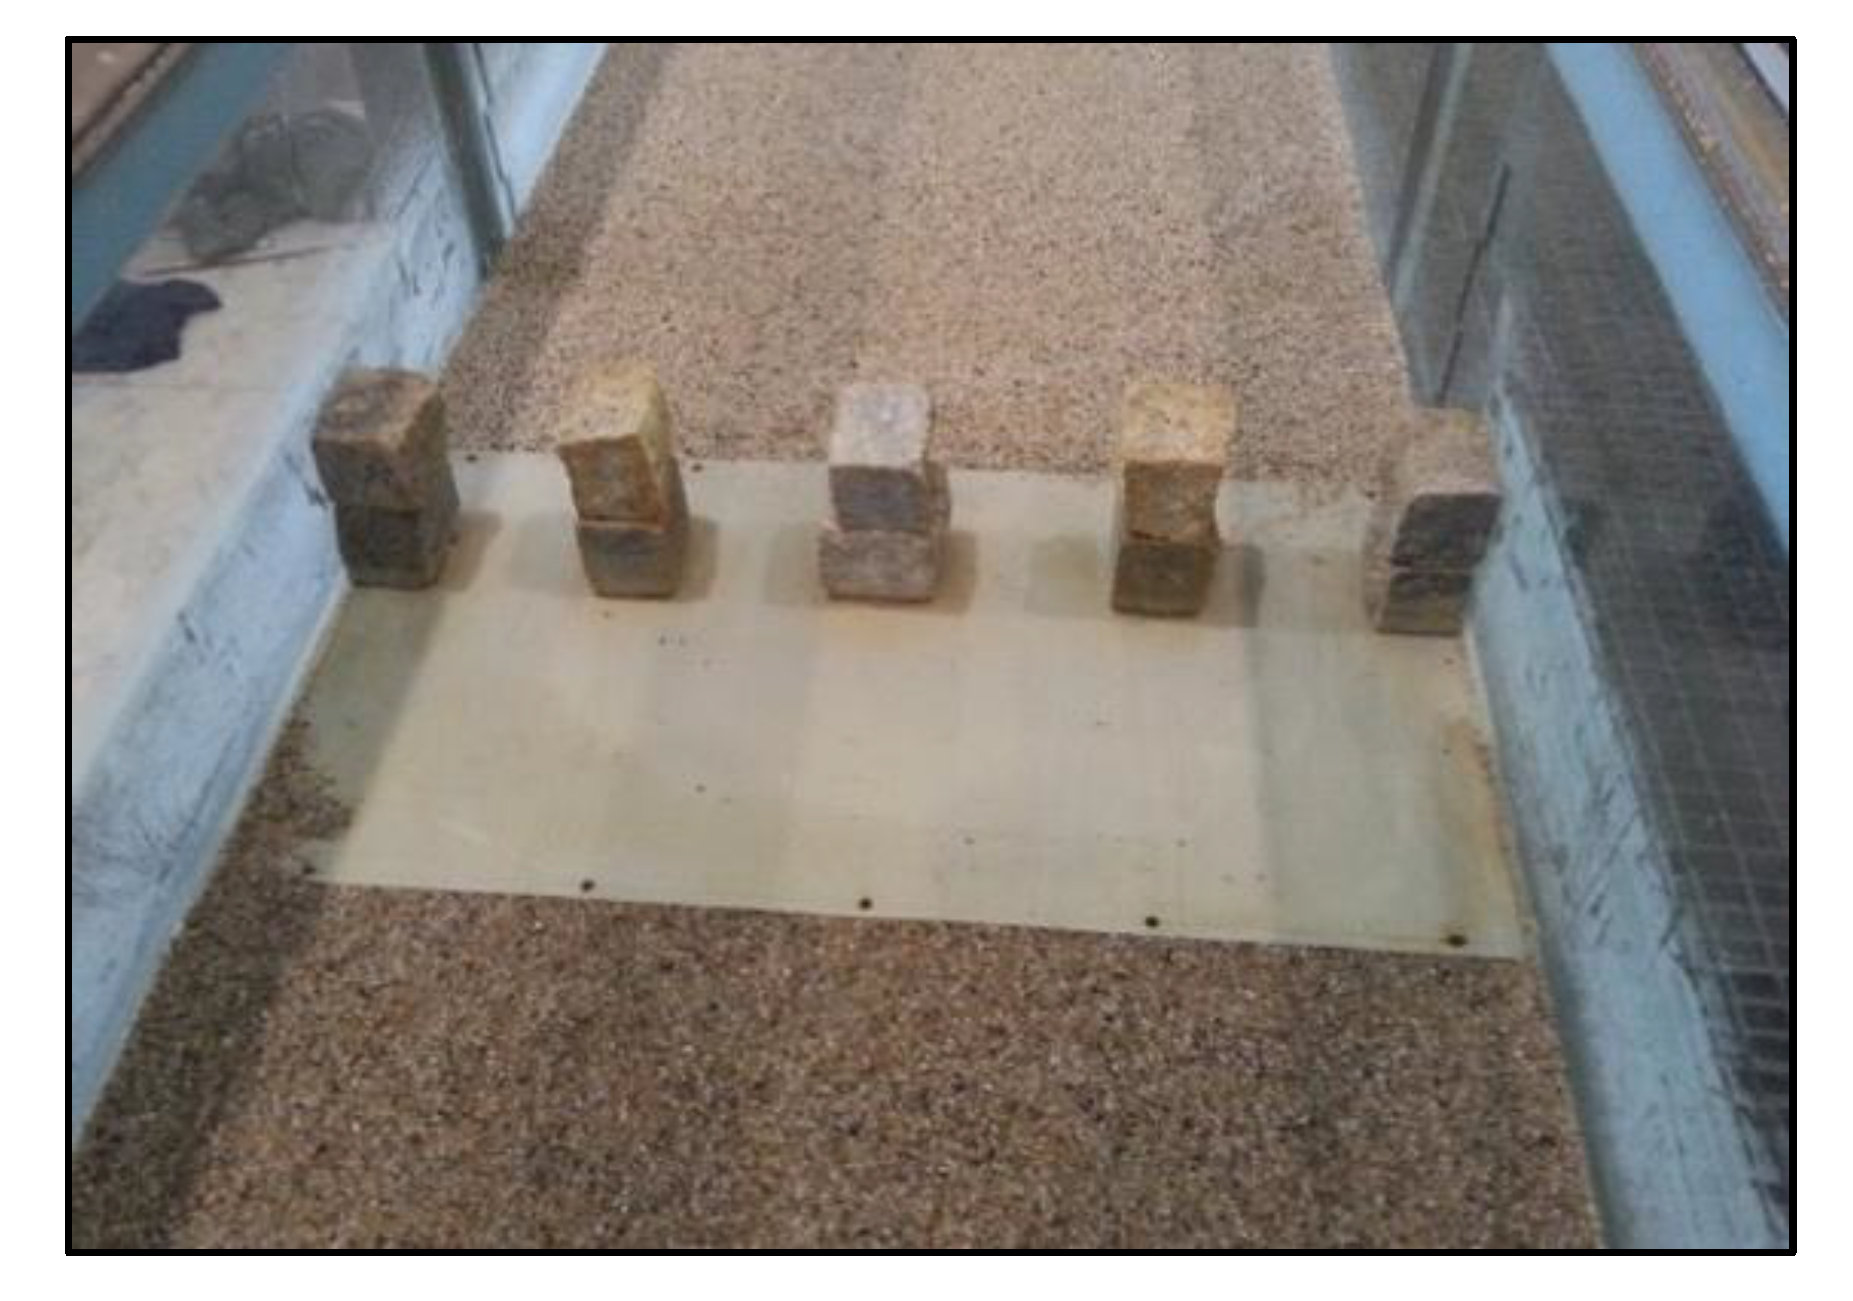
Figure 5.
Flume development schematics. Variants: (a) I, (b) II, (c) III, where: A—solid bottom, B—alluvial bed, C—collection chamber, D—regulatory gate, E—pin gauge, F—moving pin gauge equipped with disc probe, G—stone weir, H—stone weir with solid reinforcement, I—slide gate, J—rocky bottom; L—the length of the sandy bed below the structure; Lc—total length of the flume, Ln—the length of the solid bottom upstream of the structure, lu1—the length of the reinforcement upstream of the obstruction, lu2—the length of the reinforcement downstream of the obstruction.

Figure 6.
Variant I of the flume development.

Figure 7.
Variant II of the flume development.

Figure 8.
Variant III of the flume development.

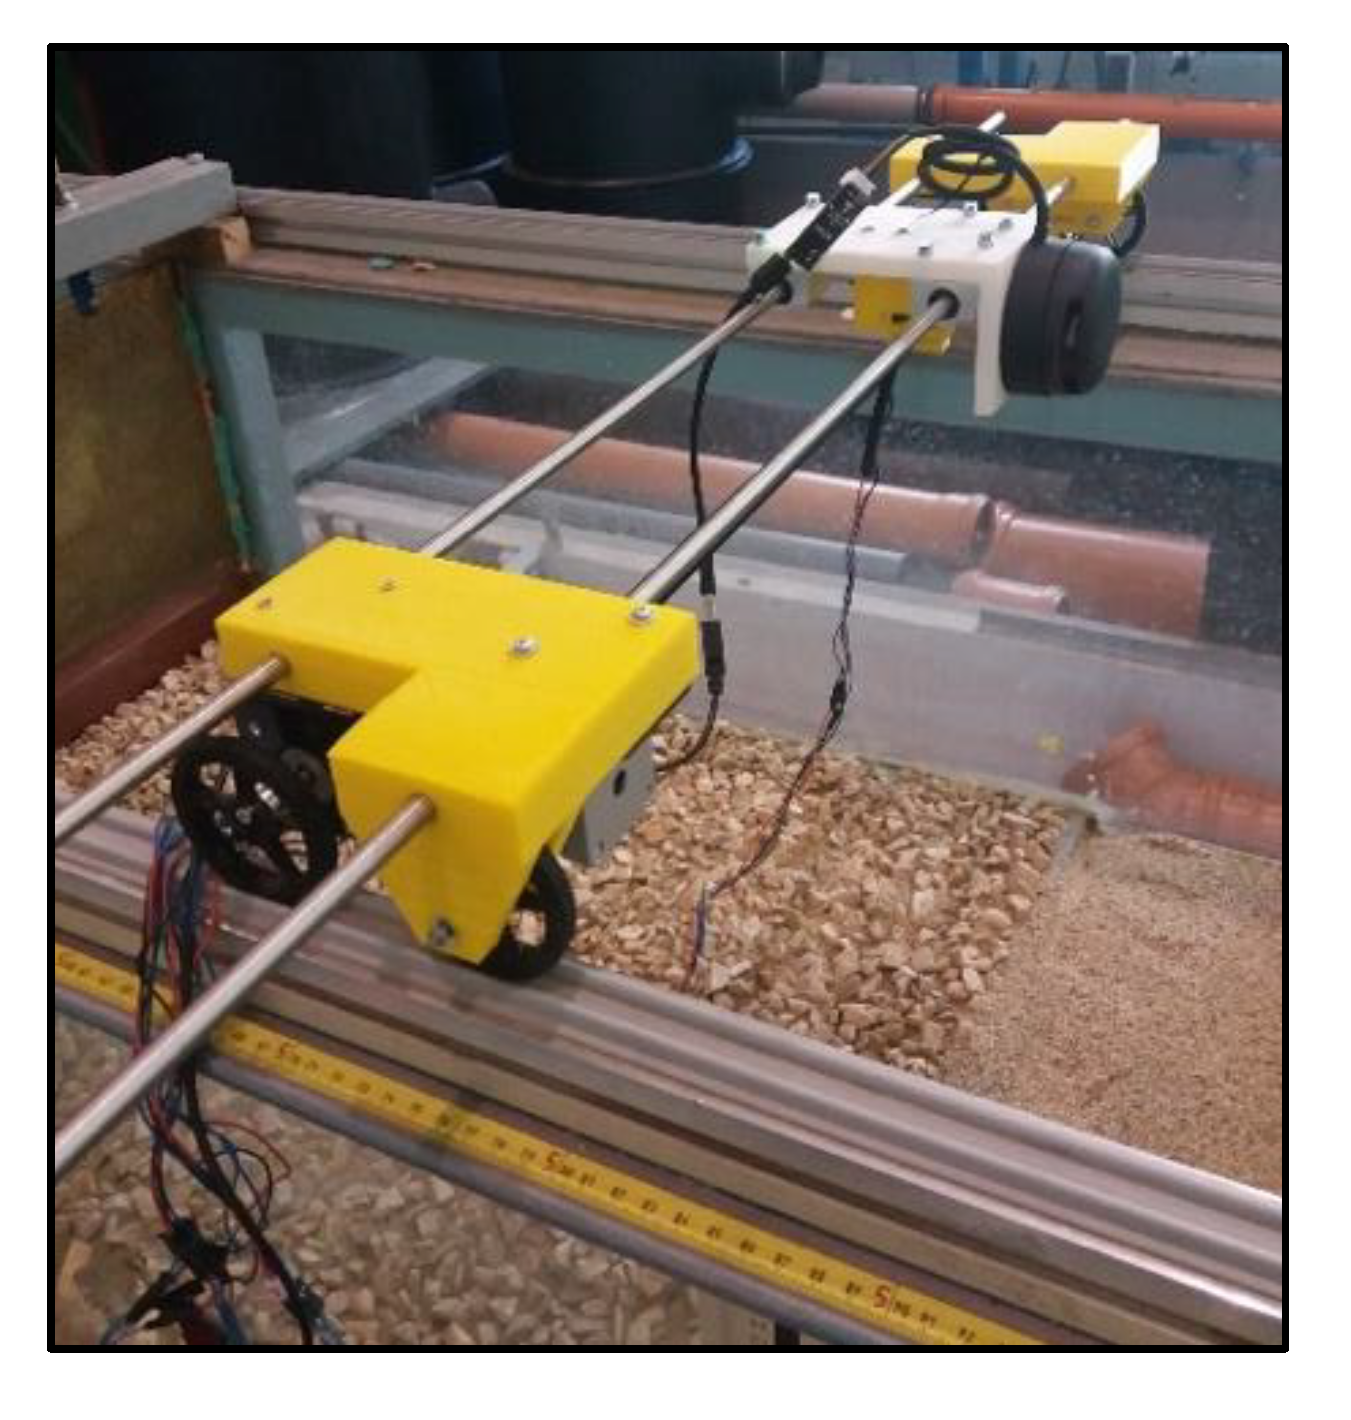
Figure 9.
Laser scanner device on the steering wheels—prototype A2.

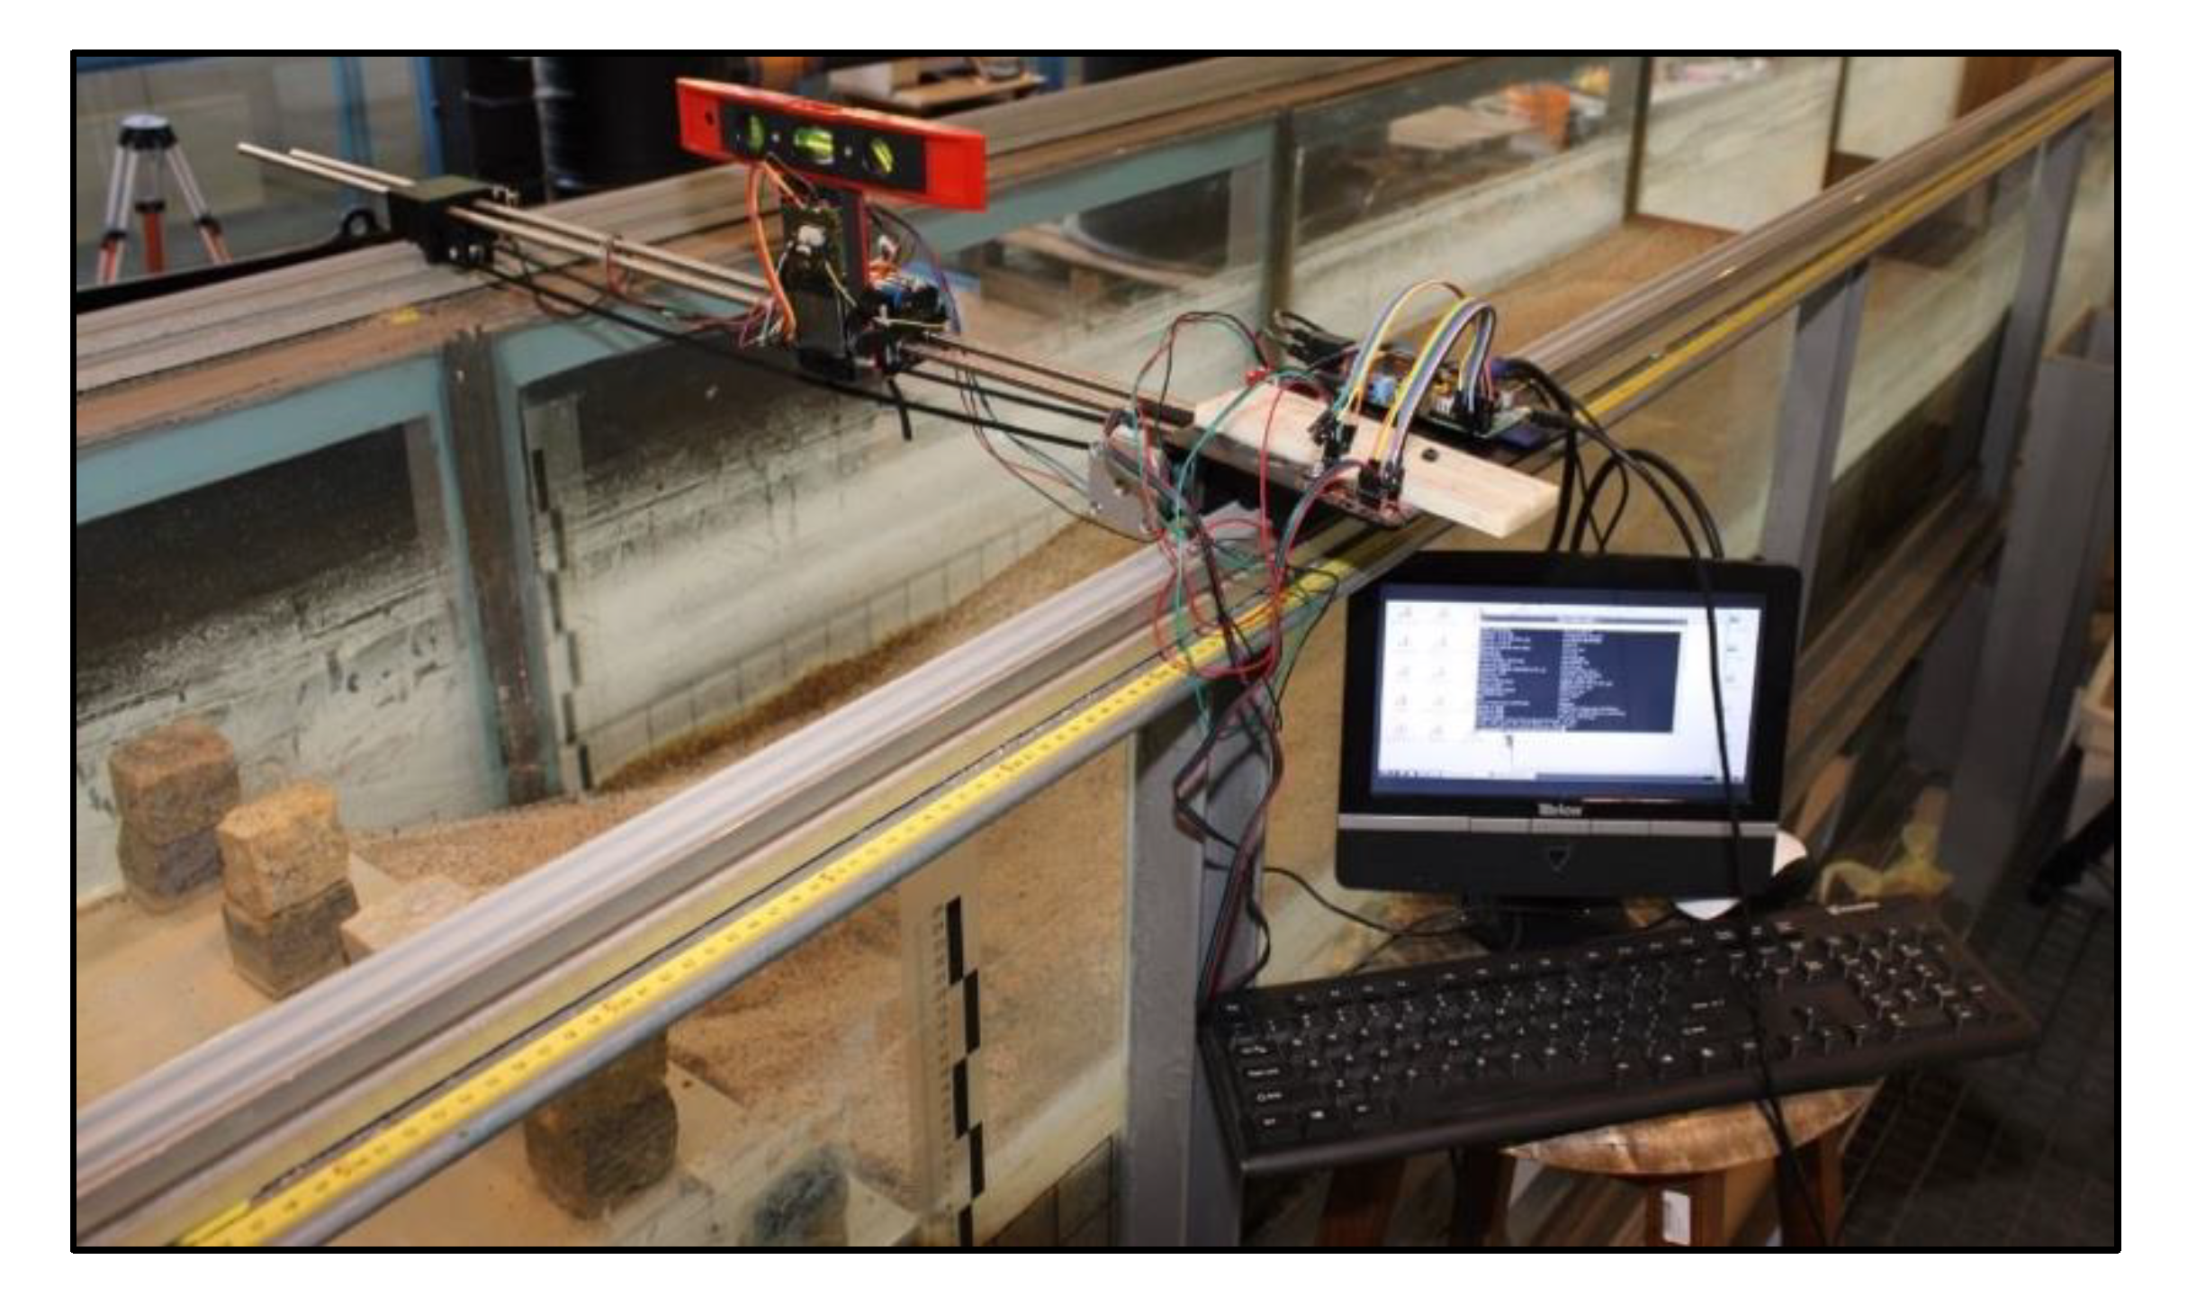
Figure 10.
Laser scanner device equipped with the level—initial prototype A1.

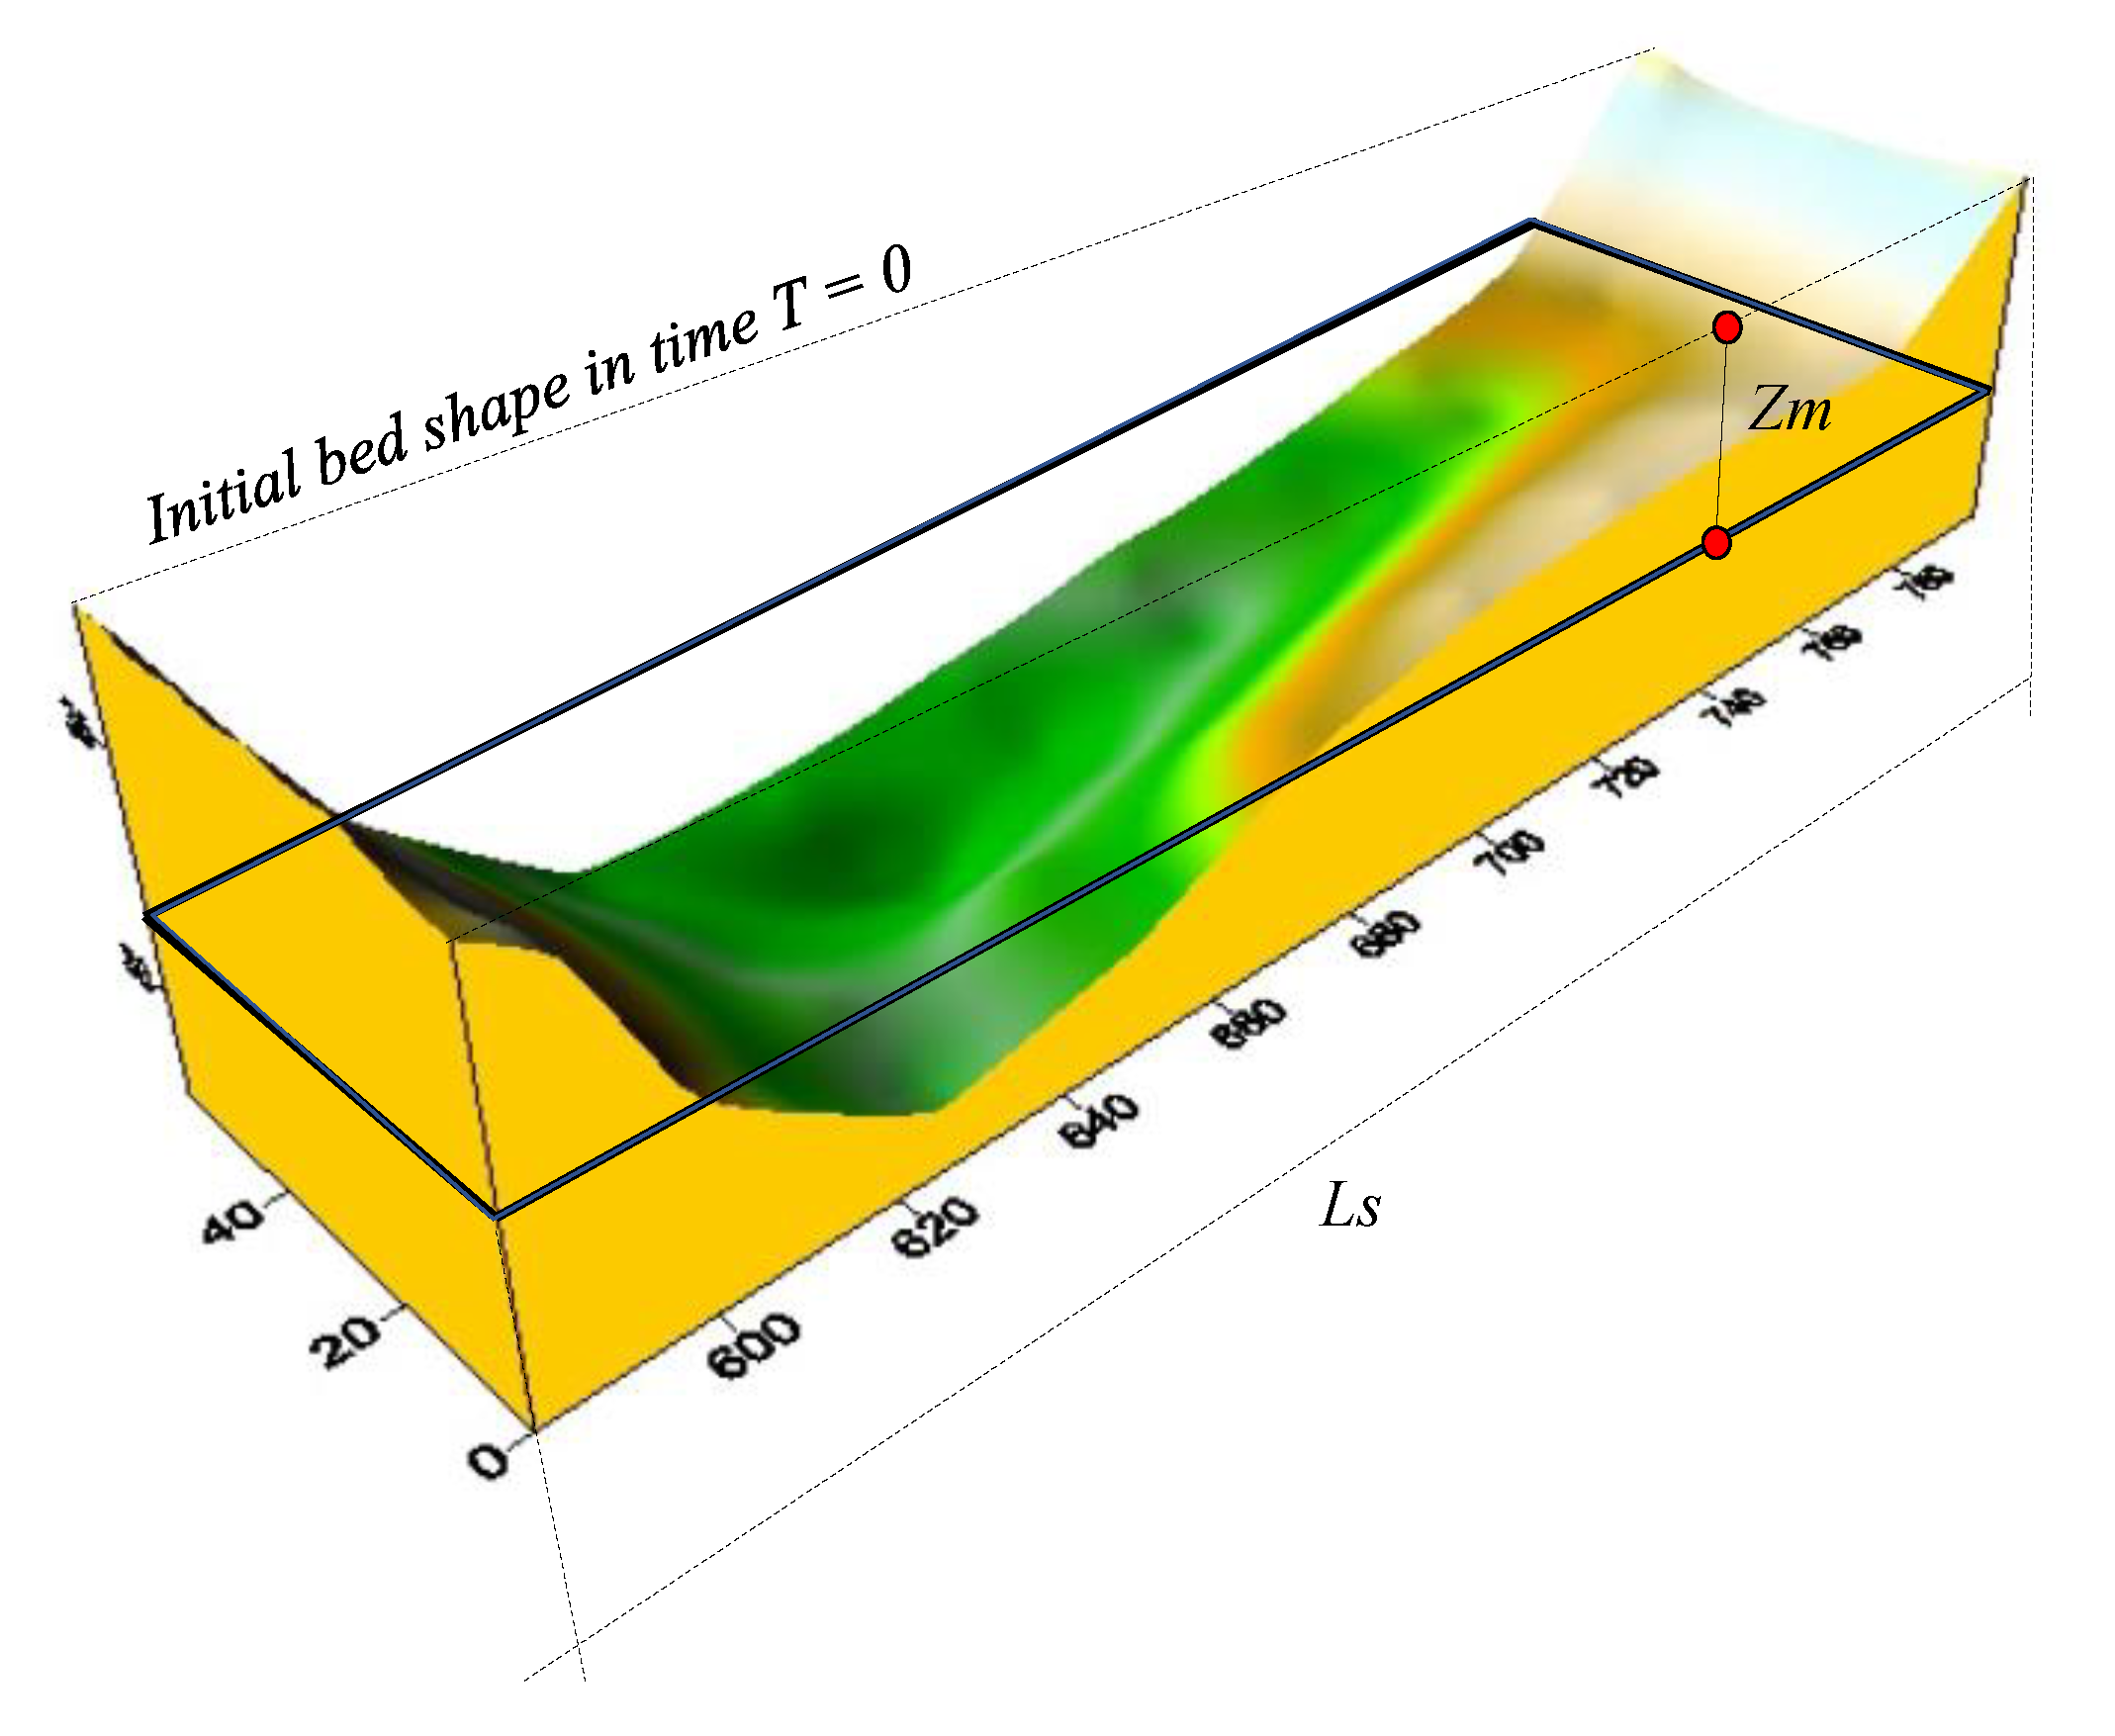
Figure 11.
Stabilized bed shape, downstream of the water structure, where: zm—medium scour depth; Ls—local scour length.
Figure 11.
Stabilized bed shape, downstream of the water structure, where: zm—medium scour depth; Ls—local scour length.

Figure 12.
Upstream and downstream conditions investigated during each experimental series, where: zm—medium scour depth; Ls—local scour length.
Figure 12.
Upstream and downstream conditions investigated during each experimental series, where: zm—medium scour depth; Ls—local scour length.

Figure 13.
Local scour medium depth evolution in time, where Qw—water flow discharge; T—time.

Figure 14.
Local scour length evolution in time.

Figure 15.
Bed shear stress to critical shear stress ratio, and medium scour depth zm to initial water depth h0 correlation.
Figure 15.
Bed shear stress to critical shear stress ratio, and medium scour depth zm to initial water depth h0 correlation.

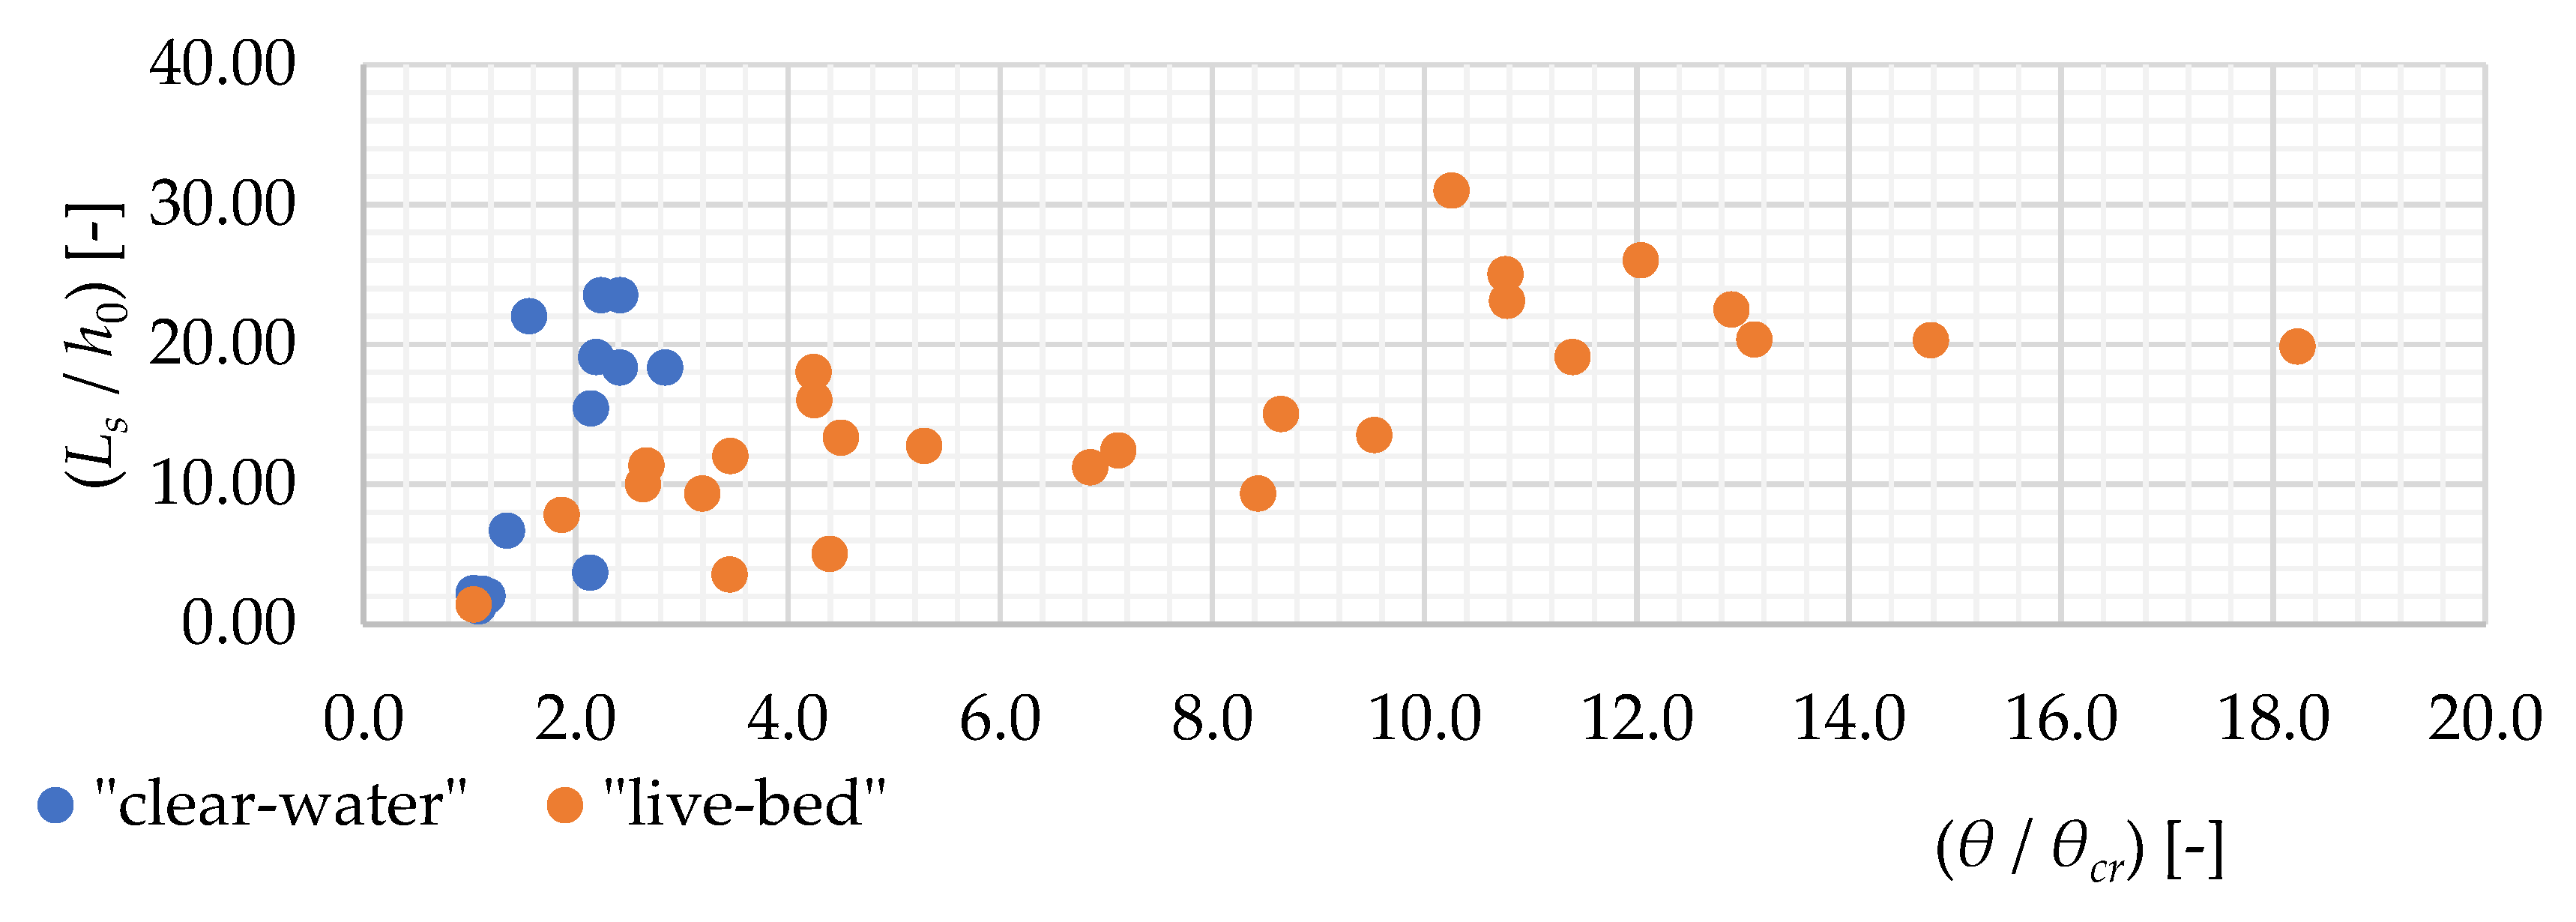
Figure 16.
Bed shear stress to critical shear stress ratio, and scour length Ls to initial water depth h0 correlation.
Figure 16.
Bed shear stress to critical shear stress ratio, and scour length Ls to initial water depth h0 correlation.

Table 1.
Critical bed shear stress values, depending on the grain size parameter.
| Van Rijn | Chien and Wu | ||
|---|---|---|---|
| Range | Range | ||
| 1 < ≤ 4 | 0.24 | < 1.5 | 0.126 |
| 4 < ≤ 10 | 0.14 | 1.5 ≤ < 10 | 0.131 |
| 10 < ≤ 20 | 0.04 | 10 ≤ < 20 | 0.10675 |
| 20 < ≤ 150 | 0.013 | 20 ≤ < 40 | 0.0173 |
| > 150 | 0.055 | 40 ≤ < 150 | 0.0115 |
| ≥ 150 | 0.052 | ||
© 2019 by the authors. Licensee MDPI, Basel, Switzerland. This article is an open access article distributed under the terms and conditions of the Creative Commons Attribution (CC BY) license (http://creativecommons.org/licenses/by/4.0/).
Share and Cite
MDPI and ACS Style
Kiraga, M.; Popek, Z. Bed Shear Stress Influence on Local Scour Geometry Properties in Various Flume Development Conditions. Water 2019, 11, 2346. https://doi.org/10.3390/w11112346
AMA Style
Kiraga M, Popek Z. Bed Shear Stress Influence on Local Scour Geometry Properties in Various Flume Development Conditions. Water. 2019; 11(11):2346. https://doi.org/10.3390/w11112346
Chicago/Turabian StyleKiraga, Marta, and Zbigniew Popek. 2019. "Bed Shear Stress Influence on Local Scour Geometry Properties in Various Flume Development Conditions" Water 11, no. 11: 2346. https://doi.org/10.3390/w11112346
Note that from the first issue of 2016, this journal uses article numbers instead of page numbers. See further details here.